Cortex XSIAM Documentation
Tree viewThis book on one page — search it with your browser’s find (Ctrl+F / ⌘F), or jump from the tree.
Cortex XSIAM Documentation
Learn about Cortex XSIAM
Navigate the Cortex XSIAM docs
Cortex XSIAM unifies detection, investigation, response, endpoint security, and cloud security in one platform.
Use this page to jump into the right docs area fast.
Use the table of contents when you know the exact page.
Use this page when you need a quick overview of the main Cortex XSIAM areas.
Learn the product
:circle-info: Product overview Learn about the basics and architecture. | get-started-cortex-xsiam |
:wand-magic-sparkles: Agentic AI Explore AI-powered investigation, response, and workflows. | agentic-ai-in-cortex-xsiam |
:id-card: Licensing Review plans, add-ons, and retention. | cortex-xsiam-product-licenses |
:desktop: Interface Navigate pages, filters, views, and exports. | use-the-interface |
Onboard Cortex XSIAM
:list-check: Plan and prepare Consider storage, region, XDR agent, and data sources requirements. | plan-and-prepare |
:clipboard-list: Deployment checklist Follow the key steps to deploy and onboard. | cortex-xsiam-onboarding-checklist |
:check-double: Post-deployment Validate your deployment and complete initial tasks. | post-deployment |
:plug: Cortex XSIAM Data Sources Connect data sources, including CSP, and Cloud Posture and Runtime Security data sources. | cortex-xsiam-data-sources |
:chart-line: Analytics Set up analytics and enable the analytics engine. | cortex-xsiam-analytics |
Configure Cortex XSIAM
:database: Data management Manage ingestion, retention, and data access. | data-management |
:robot: Configure the Cortex Agentic Assistant Set up assistant access and capabilities. | configure-the-cortex-agentic-assistant-1 |
:server: Cortex MCP server Connect external AI clients through the MCP server. | cortex-mcp-server |
:bolt: Automations Automate recurring security tasks and responses. | automations |
:folder-tree: Customize cases and issues Tailor case and issue workflows to your needs. | customize-cases-and-issues |
:building: Multi-Tenant Manage tenants and their security operations. | multi-tenant |
:handshake: Managed Services configuration in Cortex Configure services for managed security operations. | managed-services-configuration-in-cortex |
Protect your environment
:shield-halved: Endpoint security Prevent, detect, and respond to endpoint threats. | endpoint-security |
:lock: Endpoint DLP Protect sensitive data on managed endpoints. | endpoint-dlp |
Detect, investigate, and respond
:chart-line: Monitor dashboards and reports Track security operations, trends, and outcomes. | monitor-dashboards-and-reports |
:magnifying-glass: Investigation and response Investigate cases/issues and respond to threats. | investigation-and-response |
:comments: Agentic Assistant chat Use natural language to investigate security data. | agentic-assistant-chat |
:boxes-stacked: Asset management Inventory and monitor assets across your environment. | asset-management |
:crosshairs: Threats Prioritize and manage threats affecting your organization. | threat-management |
:globe: Attack Surface Management Discover and assess internet-facing attack surface risks. | attack-surface-management |
:bug: Vulnerability management Identify, prioritize, and remediate vulnerabilities. | vulnerability-management |
:radar: Exposure management Understand and reduce your overall cyber exposure. | exposure-management |
Cloud Security
:database: Data Security Discover and protect sensitive cloud data. | cortex-data-security |
:scale-balanced: Monitor and track compliance adherence Measure cloud compliance against supported standards. | monitor-and-track-compliance-adherence |
:shield: Cloud Security Rules and Policies Configure policies and rules for cloud protection. | cloud-security-rules-and-policies |
:tags: Cloud Data Classification Classify cloud data using sensitive data profiles. | cortex-cloud-data-classification |
:user-shield: Cloud Identity Security Secure cloud identities and their permissions. | cortex-cloud-identity-security |
:network-wired: Network exposure detection Identify cloud network paths that create exposure. | network-exposure-detection |
:brain: Cloud AI Security Secure AI services and workloads in the cloud. | cortex-cloud-ai-security |
:bolt: Serverless function posture security Assess configuration risks in serverless functions. | serverless-function-posture-security |
:code: Cloud Application Security Protect cloud-native applications across their lifecycle. | cortex-cloud-application-security |
:cloud: Cloud workload policies and rules Define controls for cloud workloads and resources. | cloud-workload-policies-and-rules |
:globe: Web and API Security (WAAS) Protect web applications and APIs from attacks. | overview |
:play: Serverless function runtime security Detect runtime threats in serverless functions. | overview-1 |
:envelope-open-text: Cortex Advanced Email Security Protect users from email-based threats. | cortex-advanced-email-security |
Reference and developer docs
:terminal: XQL Query and analyze security data with XQL. | cortex-agentix-xql |
:share-nodes: Graph Search Explore relationships between entities and events. | graph-search |
:terminal: Cortex CLI Manage Cortex XSIAM from the command line. | about-cortex-cli |
:user-lock: Role-Based Access Control Control access with roles and permissions. | role-based-access-control |
:code: API documentation Integrate Cortex XSIAM with its public APIs. | api-documentation |
Get started with Cortex XSIAM
What is Cortex XSIAM?
Cortex XSIAM (Extended Security Intelligence and Automation Management) is an AI-driven platform designed to power the autonomous Security Operations Center (SOC). It transforms security operations by consolidating best-in-class SOC capabilities, including SIEM, XDR, SOAR, ASM, and Threat Intelligence, along with native Cloud Security (subject to license) into a single, unified platform.
By harnessing the power of Agentic AI and a centralized data foundation, Cortex XSIAM simplifies operations, stops threats at scale across both enterprise and cloud environments, and accelerates incident remediation through autonomous decision-making.
Key features
Simplify security operations with a converged platform:
-
Unified Cloud and Enterprise Security
Cortex XSIAM combines SOC capabilities, such as XDR, SOAR, ASM, and SIEM, with Cloud Posture (CSPM) and Cloud Runtime Security into a unified platform, eliminating the need to switch between cloud and security consoles.
-
Broad integration
Enables easy onboarding of diverse data sources from endpoints and firewalls to cloud workloads without extensive engineering efforts.
-
Deep data stitching
Ensures continuous collection, stitching, and normalization of raw data (including cloud telemetry), going beyond simple alerts to deliver enriched, cross-domain insights.
Stop threats at scale with AI-driven outcomes:
-
Unified visibility
Leverage out-of-the-box AI models to connect events across endpoints, identities, networks, and cloud infrastructure, delivering a holistic view of cases.
-
Intelligent prioritization
Employs issue grouping and AI-driven scoring to prioritize cases based on overall risk, correlating cloud misconfigurations (posture) with active runtime threats.
-
Focus on critical threats
Transforms low-confidence events into high-confidence cases, allowing security teams to focus efficiently on confirmed threats.
Accelerate remediation with an Agentic AI workforce:
-
Cortex Agentic Assistant
Moves beyond static playbooks by deploying autonomous AI agents that can plan, reason, and investigate complex threats, such as cloud identity theft or container breaches, without human intervention.
-
Autonomous Resolution
Automates manual tasks and complex decision-making processes, reducing Mean Time to Resolution (MTTR) by independently verifying and fixing issues.
-
Pre-built Content
Offers hundreds of pre-built content packs from Cortex Marketplace to streamline operations immediately.
-
Continuous Learning
The platform learns from analyst actions and autonomous agent outcomes, continuously refining its detection and response logic.
Security challenges addressed by Cortex XSIAM
-
Data overload
Reduces noise from high volumes of security events by using AI to filter and prioritize actionable cases.
-
Fragmented security visibility
Eliminates blind spots by unifying endpoint, network, identity, and cloud (Code-to-Cloud) data into one comprehensive detection engine.
-
Slow case response
Accelerates investigations with agentic abilities, which autonomously performs root cause analysis and executes remediation plans.
-
Manual alert management
Shifts the workload from human analysts to AI agents that handle the enrichment and resolution of routine and complex issues alike.
-
Evolving threat landscape
Keeps defenses up-to-date with real-time threat intelligence and continuous ML model optimization.
- Operational inefficiencies: Delivers an out-of-the-box solution with built-in optimizations, eliminating the need for extensive customer-led tuning.
-
Analyst burnout
Alleviates alert fatigue by offloading repetitive investigation and response tasks to the AI workforce, allowing analysts to focus on strategic defense.
Cortex XSIAM architecture
Cortex XSIAM architecture overview
Cortex XSIAM unifies endpoint, network, cloud, identity, and third-party security data. Its architecture combines AI-driven detection, investigation, and response with centralized data ingestion, normalization, and automation.
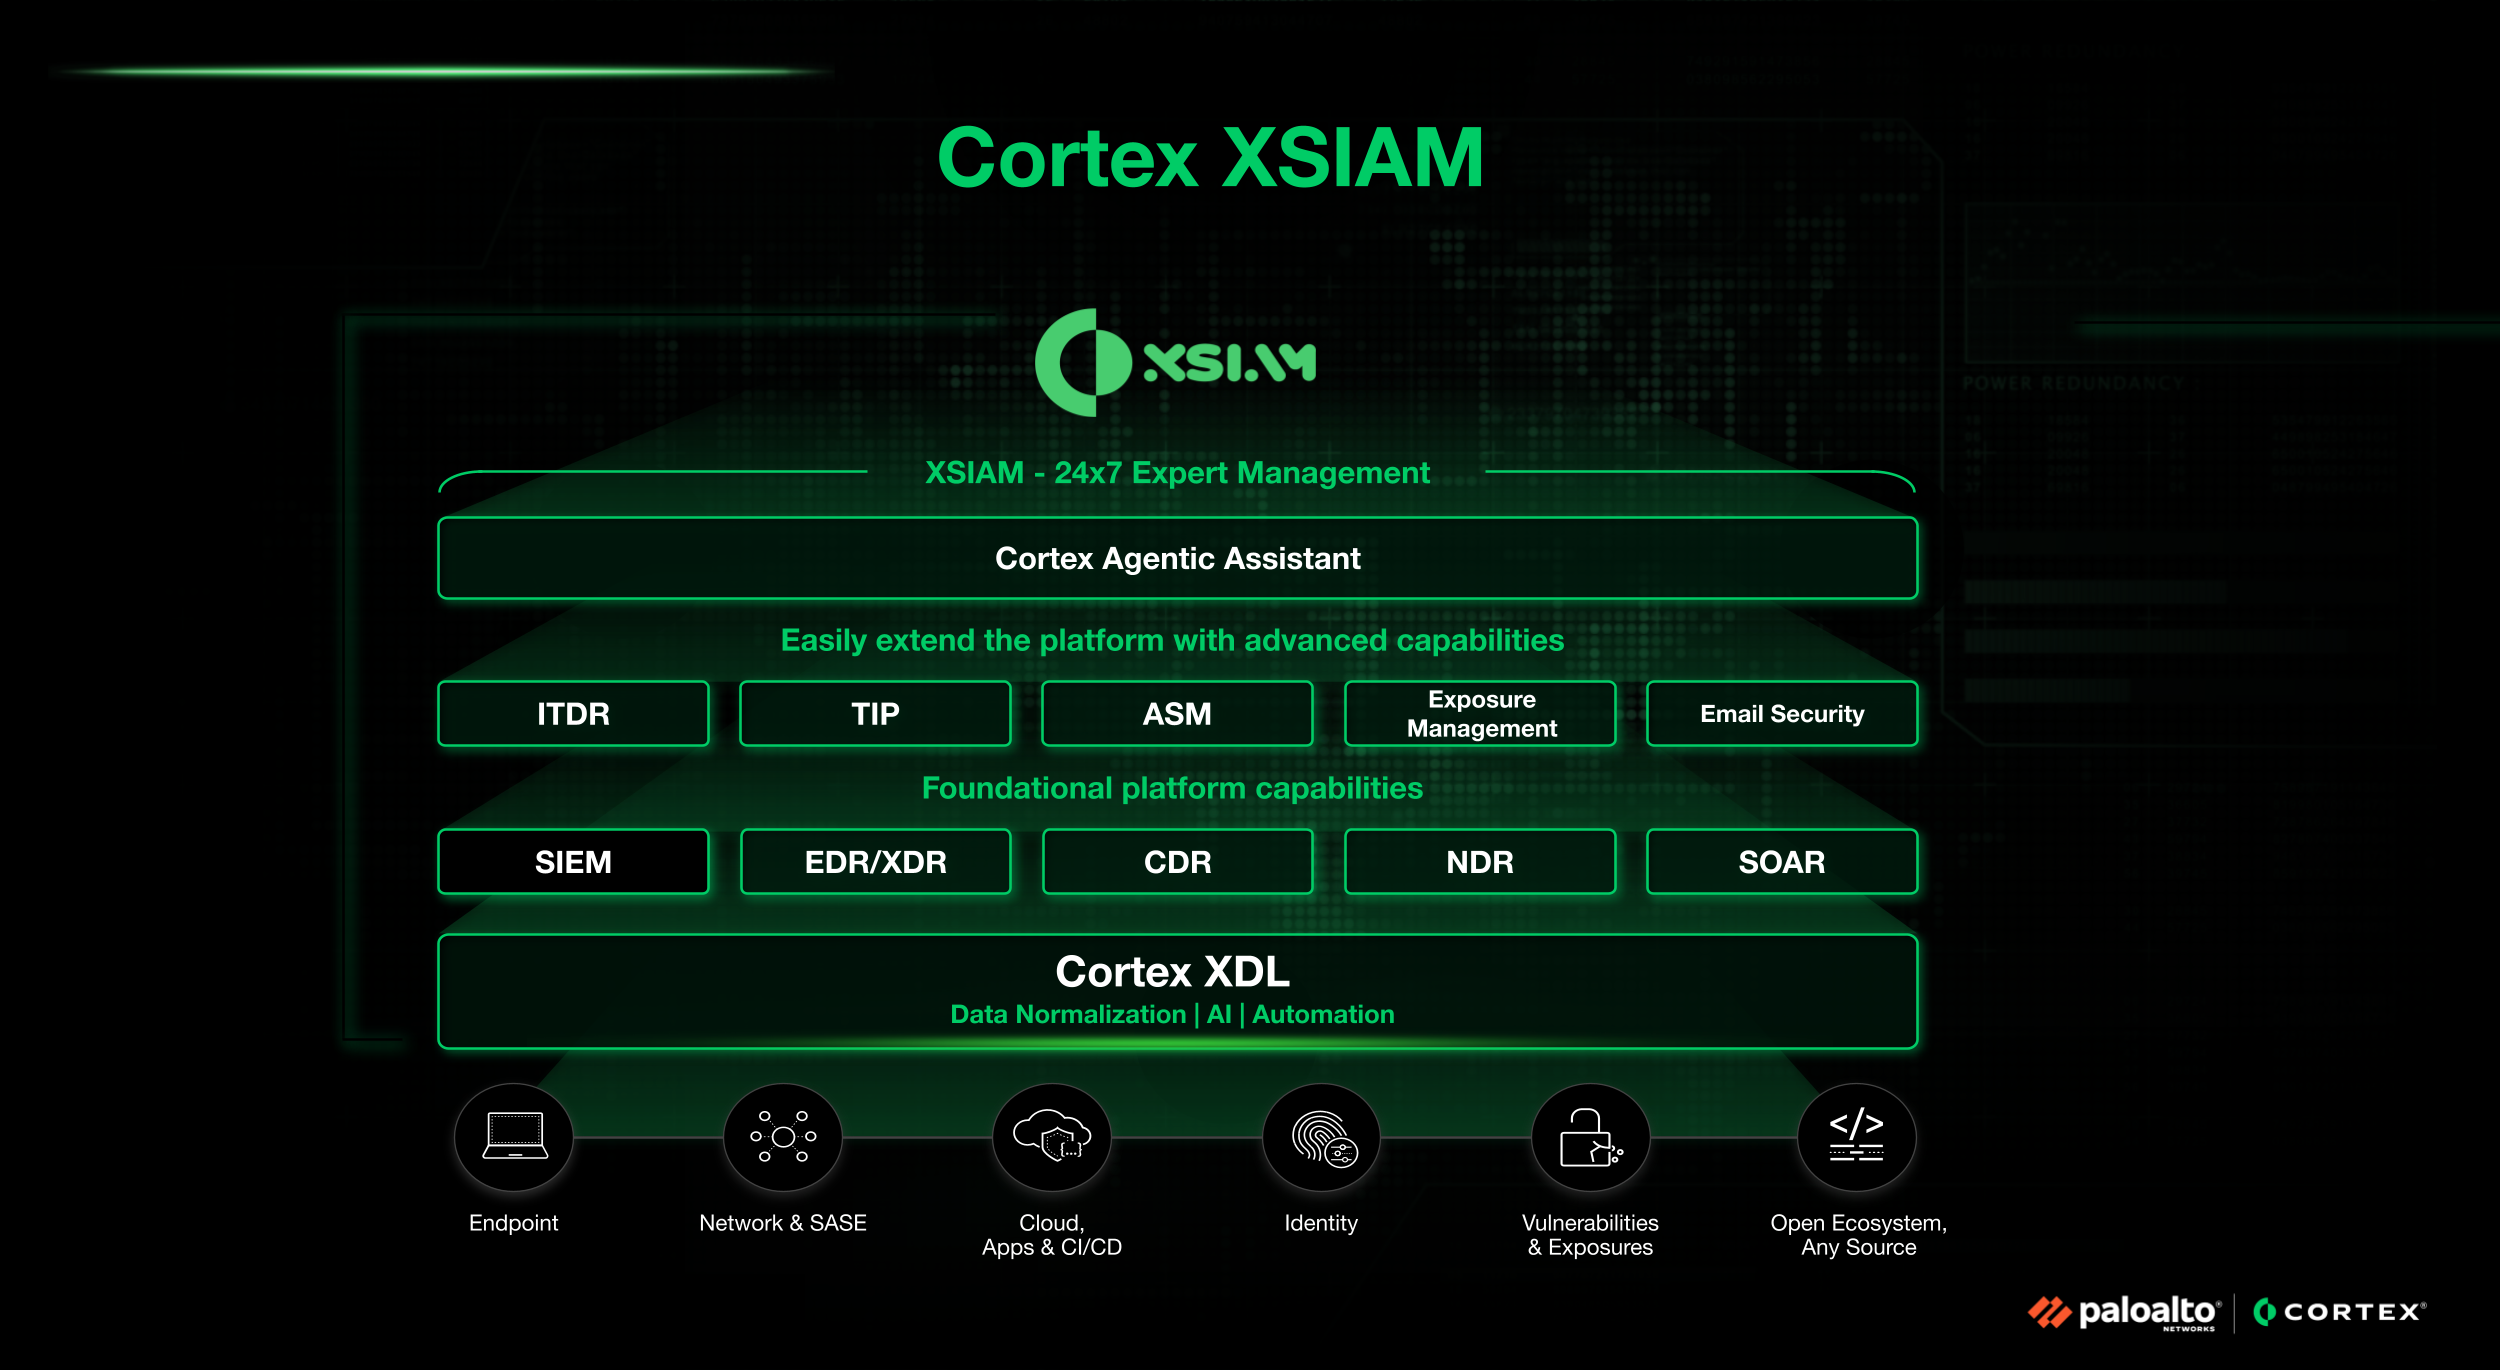
Core Cortex XSIAM capabilities
- Cortex XSIAM includes:
- SIEM (security information and event management)
- EDR/XDR (endpoint and extended detection and response)
- CDR (cloud detection and response), including Cloud Posture and Cloud Runtime Security
- NDR (network detection and response)
- SOAR (security orchestration, automation, and response)
Cortex Extended Data Lake (XDL)
-
Cortex Extended Data Lake (XDL) provides unified data normalization, AI, and automation. It centralizes security telemetry as a single, intelligent source of truth, including:
Feature Description Endpoint <p>Cortex XDR agents forward all data directly to Cortex XDL. This data is accessible for query and investigation within Cortex XSIAM.</p><p>When a Cortex XDR agent detects an unknown sample (an attempt to run a macro, DLL, or executable file), Cortex XSIAM can automatically forward the sample for WildFire analysis. WildFire Cloud Service identifies previously unknown malware and generates signatures that Palo Alto Networks firewalls and Cortex XSIAM can use to detect and block that malware.</p><p>Based on the properties, behaviors, and activities the sample displays when analyzed and executed in the WildFire sandbox, WildFire determines whether the sample is benign, grayware, phishing, or malicious. WildFire then generates signatures to recognize the newly discovered malware and makes the latest signatures globally available every five minutes.</p> Network & SASE <p>Centralizes logs from Palo Alto Networks sources. It utilizes the Strata Logging Service to ingest and normalize network logs from Next-Generation Firewalls (NGFW) and Prisma Access.</p><div data-gb-custom-block data-tag="hint" data-style="info" class="hint hint-info"><p>If you plan to stream data from a Strata Logging Service instance, it must reside in the same region as your Cortex XSIAM tenant.</p></div> Cloud, Apps & CI/CD Provides comprehensive visibility across your cloud infrastructure, version control systems (VCS), and delivery pipelines to detect risks, such as exposed secrets, Software Composition Analysis (SCA) vulnerabilities, and IaC misconfigurations. Identity <p>Consumes data from identity sources that connect to the Cloud Identity Engine, which provides the necessary Active Directory or Okta context for User/Entity Behavior Analytics (UEBA).</p><p>The Cloud Identity Engine (CIE) enables Palo Alto Networks cloud-based applications to use computer, user, and group attributes from your organization’s directories for security policies and endpoint management. This cloud-based service synchronizes attribute data from various sources, including On-prem directories like Active Directory and cloud-based directories such as Microsoft Entra ID, Okta, and Google Cloud Identity.</p><p>The Cortex XSIAM tenant and the CIE must be deployed in the same region.</p> Vulnerabilities and exposures ASM performs DNS lookups and scans hosts to identify security flaws before they can be exploited. The intelligence gathered from these lookups and scans is transformed into actionable data, such as vulnerabilities and exposures. Open ecosystem (any source) Facilitates the ingestion of third-party security and management vendor telemetry, custom logs, and external alerts from any environment. These sources are integrated into Cortex XDL using an HTTP Log Collector or through the Broker VM, which runs specialized applets for Syslog, Database, CSV, Kafka, and FTP collection
Extended Cortex XSIAM capabilities
You can extend Cortex XSIAM with capabilities such as:
- ITDR (Identity Threat Detection and Response) for domain controller protection
- Threat Intelligence Platform (TIP)
- Attack Surface Management (ASM)
- Email Advanced Security
- Exposure Management
Cortex Agentic Assistant
Cortex Agentic Assistant uses AI agents to plan, reason, and investigate complex threats. Examples include cloud identity theft and container breaches.
Cortex XSIAM ecosystem
This diagram shows Cortex XSIAM as a central security operations platform. It connects diverse data sources and proactive security functions.
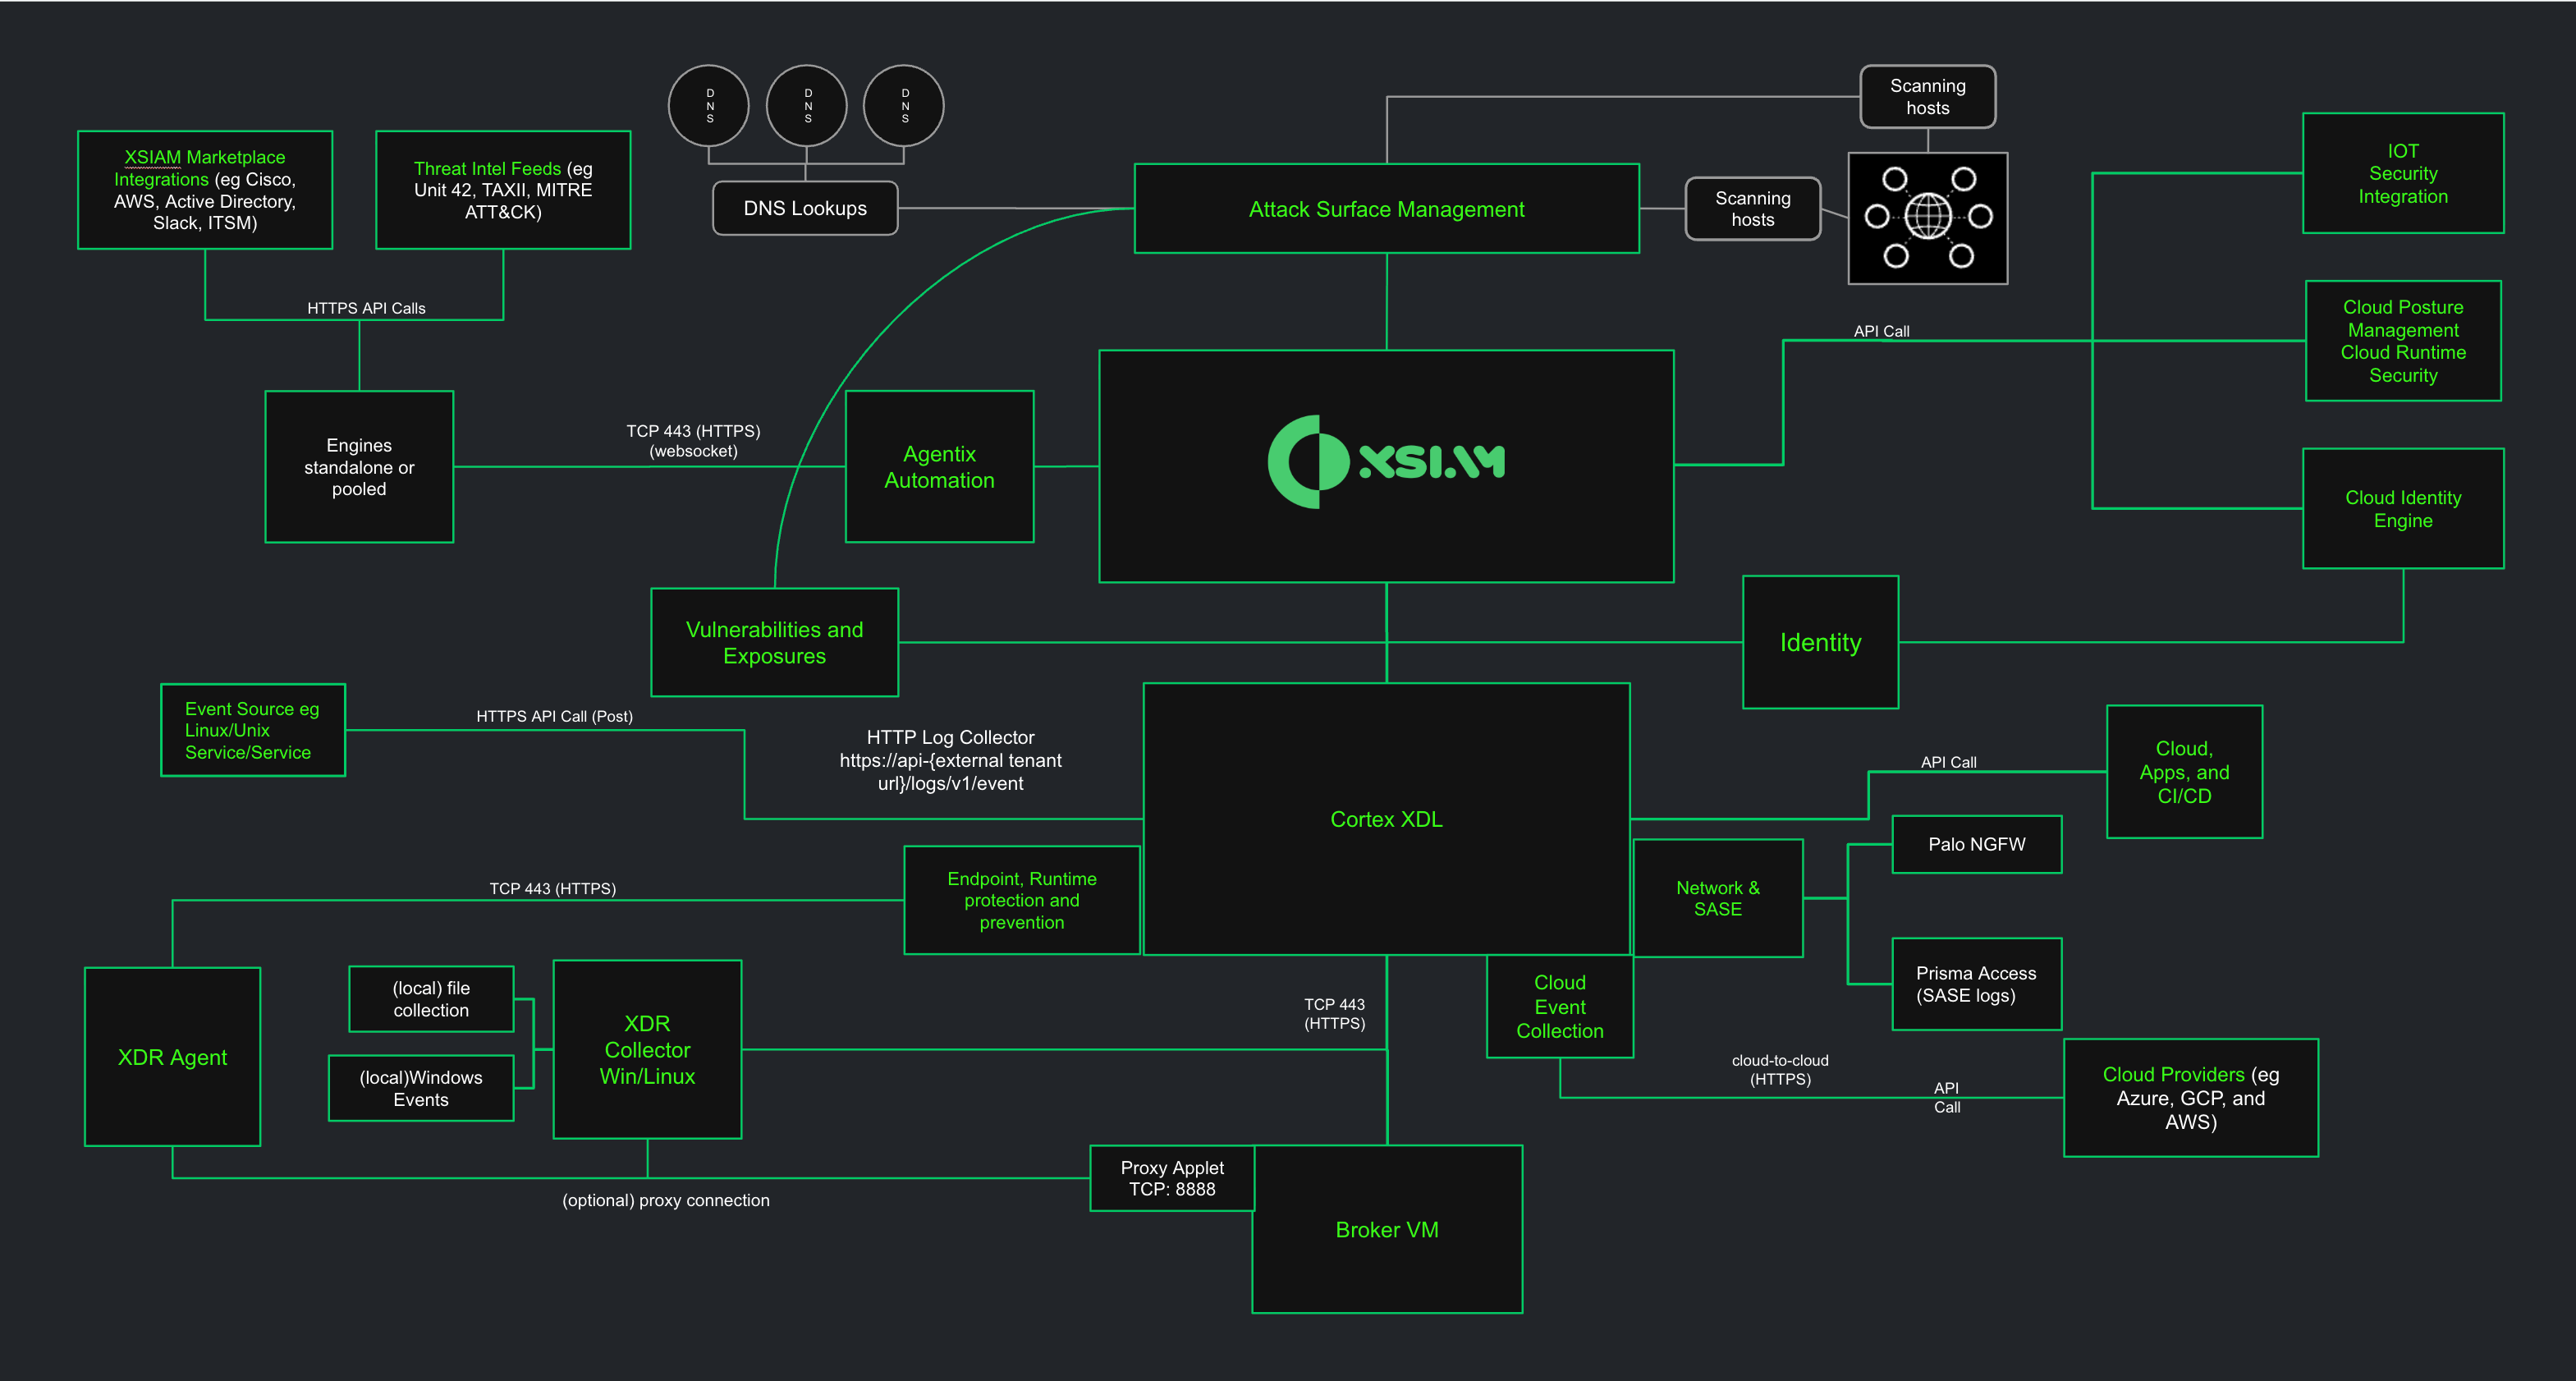
Cortex XSIAM ecosystem architecture.
Broker VM architecture and data collection
Broker VM is a secure on-premises gateway for Cortex XSIAM data ingestion. It centralizes collection from security devices that cannot send data directly to the cloud. It also provides a secure proxy for agents and collectors in restricted or air-gapped networks. Specialized applets collect different data types and ingest them into Cortex XDL.
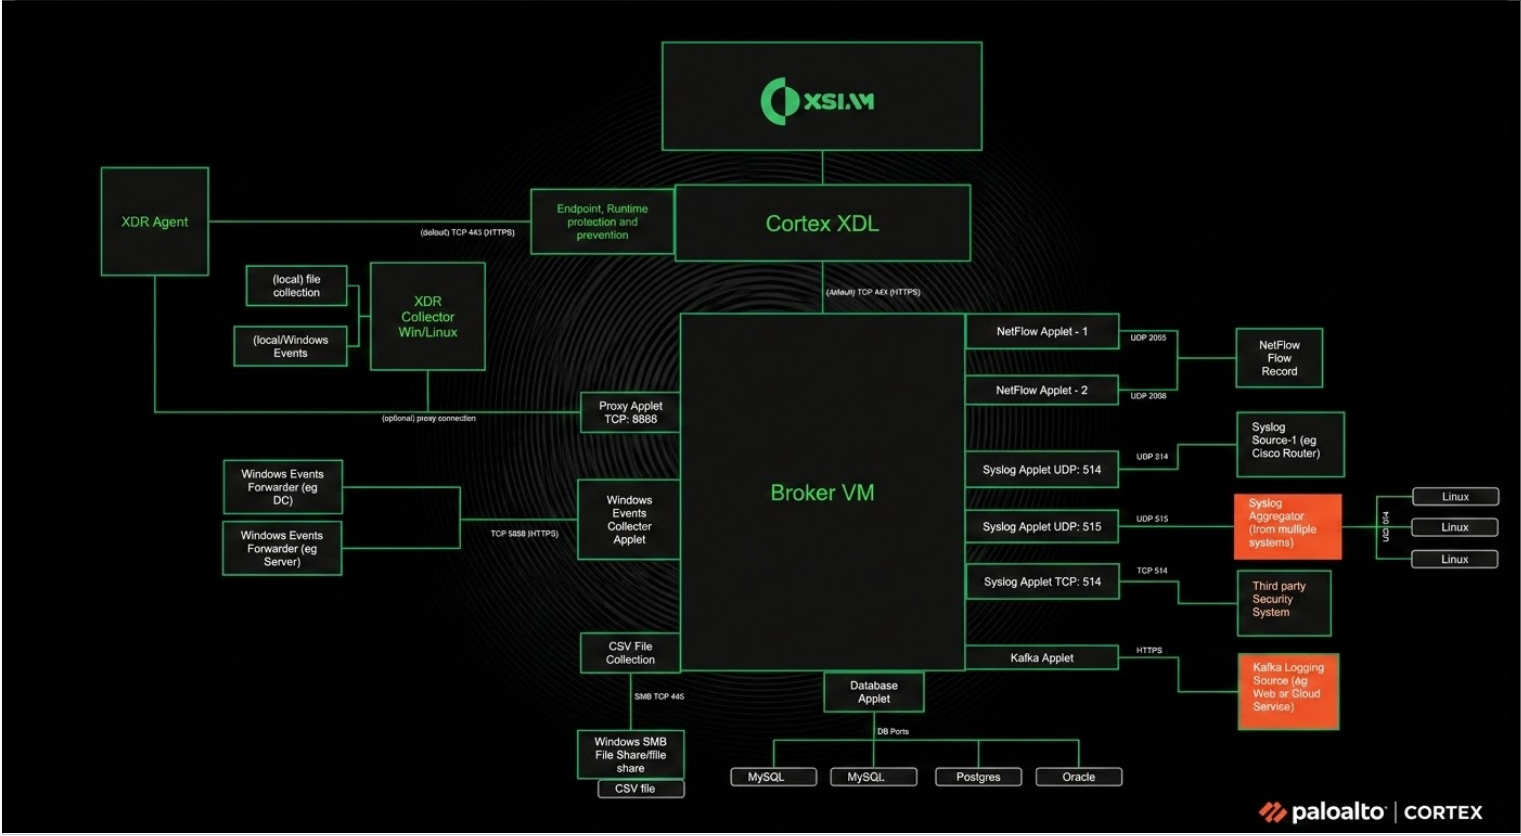
Broker VM data collection architecture.
Agentic AI in Cortex XSIAM
Cortex XSIAM integrates advanced artificial intelligence to streamline security operations. Through the Cortex Agentic Assistant, the platform provides a unified interface for interacting with both system-provided and custom AI agents capable of creating and executing multi-step plans. These agents leverage specific capabilities to perform actions across your infrastructure, facilitating deep case investigations and proactive threat hunting while allowing for the creation of tailored automation.
Key AI Capabilities
- Agentic Assistant Hub: A centralized hub for managing agents and actions. System agents can be enabled and disabled, and you can create custom agents tailored to your organizational needs, including the ability to execute custom scripts.
- Automation Engineer Agent: Provides a natural language interface to draft, refine, and deploy automation scripts.
- MCP Integration: Supports the configuration of integrations that communicate with external MCP servers, enabling agents to access third-party tools and data sources via a standardized protocol.
- Embedded AI Prompts: Facilitates the inclusion of generative AI tasks within playbooks. These prompts function as standalone workflow steps to analyze data or generate content without requiring a dedicated agent.
- AI-Generated Case Summaries: Automatically generate technical overviews of security incidents. These summaries consolidate complex telemetry and impact data into high-level reports to accelerate initial triage and stakeholder reporting.
Cortex Agentic Assistant
Cortex Agentic Assistant uses AI agents to investigate threats and execute multi-step security tasks in Cortex XSIAM. It utilizes AI agents that plan, reason, and investigate complex threats, such as cloud identity theft or container breaches. Cortex Agentic Assistant enables security operations teams to use natural language prompts to interact with AI agents. The agents have access to case context and can create plans and perform actions such as running commands, playbooks, and scripts, as well as visualizing data or investigations.
You can also interact directly from Slack with the Agentic Assistant. This enables you to trigger agents, investigate, and perform remote executions within your collaboration workflow without needing to log into Cortex XSIAM.
To enable the Cortex Agentic Assistant, go to Settings → Configurations → General → Server Settings → Agentic Assistant.
Note
By default, you have access to the Cortex Assistant, which includes a natural language interface for entity investigation and provides a list of recommended responses such as running a playbook, performing a scan, or collecting support files.
If you enable the Cortex Agentic Assistant, it replaces the Cortex Assistant interface entirely.
For more information, see Compare Agentic Assistant with Cortex Assistant.
Cortex Agentic Assistant is based on an ecosystem of agents and actions.
The Cortex Agentic Assistant includes mission-focused system agents and the ability to create custom agents. An analyst focused on threat hunting, for example, might communicate primarily with the system Threat Intel agent. In contrast, analysts focused on general investigations might build custom agents that include all the actions required to perform their daily tasks.
Each agent is assigned actions it can execute. System actions can be based on playbooks, scripts, commands, or AI prompts. You can also register custom actions, which are based on scripts, commands, or AI prompts.
Access to the Cortex Agentic Assistant and the ability to manage agents and actions is restricted by role-based access controls. Actions marked as sensitive require manual approval, and all actions an agent executes are logged.
Tip
The system Help Center agent delivers fast, context-aware assistance to answer your questions. You can ask natural language questions, such as "How do I create a dashboard?" or "Where can I review my data retention policies?" and the agent retrieves concise, relevant information from the documentation. If a question remains unresolved, the agent assists you in creating a support case.
Within the XSIAM Command Center dashboard, you can click Cortex Agentic Assistant to view how your organization utilizes the Agentic Assistant, including information on agent plans, user prompts, as well as open cases. For more information, see XSIAM Command Center.
Supported regions
The Cortex Agentic Assistant is currently available for tenants in the following regions:
- Australia (AU)
- Canada (CA)
- France (FA)
- Germany (DE)
- India (IN)
- Japan (JP)
- Netherlands (EU)
- Singapore (SG)
- South Korea (KR)
- United Kingdom (UK)
- United States (US)
Note
In multi-tenant/MSSP environments, agentic AI features are not available on the main tenant.
Frontier Models
EU and US Regions
Tenants in the EU and US regions can use the following frontier AI models:
| Name | Model |
|---|---|
| Flash | Gemini 3.5 Flash |
| Thinking | Claude Sonnet 4.6 |
| Pro | Claude Opus 4.8 |
Claude Sonnet 5 is available upon request in the US and EU regions.
NOTE
Only tenants in the EU and US regions have the model selector. Using the model selector, you can choose between different frontier models per chat, AI prompt, and AI prompt task.
SG, JP, IN, and UK regions
Tenants in the SG, JP, IN, and UK regions have Gemini 3.5 Flash.
Agentic Assistant use cases
Discover how Cortex XSIAM can streamline your security operations by exploring some key use cases.
Chat prompt examples
Using chat prompt conversation starters in the Agentic Assistant simplifies and speeds up your interactions by providing pre-defined, common queries that guide you to relevant actions and information.
For example, a SOC analyst may see the following conversation starters under the chat prompt:
- What are the top issues I should prioritize today?
- Show me all issues with an overdue SLA
- Which automations are waiting for my input?
- Clean up all expired indicators.
Additional examples of possible relevant prompts are:
- Read this Unit42 blog and get all the CVEs. For every critical CVE found, check if my assets are vulnerable and isolate them.
- List recent security issues with high severity and an affected hostname that includes 'server'.
- Summarize the latest security issues from the past 24 hours
- How do I make a loop inside a playbook?
- What is the riskiest unresolved issue affecting our critical infrastructure?
- Show recent SSO-related issues
- Investigate this phishing issue and determine the source of the email and block any malicious indicators.
- Create a pie chart of the top 10 targeted assets over the last 7 days.
- Show critical assets by region in a bar chart.
- Create an line chart to show the trend of critical security issues over the past month.
Slack interaction with the Agentic Assistant example
Slack chats with the Agentic Assistant bridge the gap between where your team collaborates and where security operations happen by enabling you to interact with agents directly within your daily communication workflow without needing to log in to Cortex XSIAM. For more information on interacting with an agent from Slack, see Chat with an Agentic Assistant agent.
The following is an example scenario describing how you can monitor shift priorities, track SLAs, and review pending automations in Cortex XSIAM directly from Slack.
Initiation
Check the daily queue by opening your team's Slack channel and tagging @Your bot name with the prompt, "What are the top issues I should prioritize today and show me all issues with an overdue SLA?".
Agent selection
The bot responds with a dropdown menu of available public agents, and you select the appropriate agent to handle the request.
Status update
The agent processes the request and replies in the thread, providing a summarized list of the highest-priority issues and any automations currently waiting for user input.
If a team member in the channel sees the summary and attempts to ask the agent, "Give me more details on the first SLA issue," the team member receives an access denied message because the active session is only available to you, the initiator.
Handoff
The session can remain open for up to two weeks, after which it automatically closes. To end a session, type @Your bot name so the rest of the team can engage.
Another team member can then tag @Your bot name to initiate a new session. Because the system pulls the last five messages in the thread, the agent understands the history of the conversation. The team member can simply prompt, "Assign the first overdue issue from that summary to me," and the agent will know which issue is being referenced.
Compare Agentic Assistant with Cortex Assistant
Cortex XSIAM offers two distinct forms of AI-driven assistance. Agentic Assistant is an advanced, optional capability that utilizes generative AI to autonomously plan and execute complex workflows. Cortex Assistant is a basic interface for streamlined navigation and entity investigation using natural language.
The following details the differences between Agentic Assistant and Cortex Assistant.
| Features | Agentic Assistant | Cortex Assistant |
|---|---|---|
| How it operates | Uses a Large Language Model (LLM) to analyze intent and dynamically generate a plan, a unique sequence of actions executed step-by-step to resolve a specific request. | Uses natural language processing to convert user questions into XQL queries and suggest a list of static, predefined responses (for example, "Run Playbook," "Scan Host"). |
| Scope of operation | Complex, ad-hoc scenarios. Agents function as virtual personas (for example, Threat Intel, IT) that can autonomously determine the necessary steps to achieve a broad objective. | Routine tasks such as single-entity investigations (host, hash, user) and navigation shortcuts. |
| Customization | Anyone with the relevant permissions can build custom agents with specific instructions, personas, and restricted sets of actions. Scripts and commands can be registered as new actions for agents to utilize. | Functionality is limited to out-of-the-box capabilities provided by the platform. You cannot modify Cortex Assistant's behavior. |
| Execution logic | Agents validate their own plans, clarify ambiguous prompts, and execute multiple steps in sequence or parallel based on the context of the investigation. | Relies on traditional rule-based automation. Actions are discrete and require manual selection from a recommended list. |
| Infrastructure | Leverages dedicated Google Cloud Platform (GCP) infrastructure for GenAI processing. | Processes queries within the standard tenant infrastructure. |
| Availability | Disabled by default. It requires enablement by an Administrator via Settings → Configurations → General → Server Settings → Agentic Assistant and is currently restricted to tenants in specific regions. For more information, see Cortex Agentic Assistant. | Available by default to all tenants not using Cortex Agentic Assistant. |
| Access Control (RBAC) | <p>Administrators use a dedicated CORTEX AGENTIC ASSISTANT permission category to configure specific permissions for:</p><ul><li>Interacting with agents using the chat interface.</li><li>Managing agents/actions: Viewing, creating, or editing custom agents and registering new actions in the Agentic Assistant Hub.</li></ul> | Permissions are determined by standard Cortex XSIAM user roles (for example, View/Edit access to specific modules). |
| Auditing | All agent activities are logged in a specific dataset (agentix_agents_actions) queryable via XQL. You can also view the specific plan generated by the AI within the chat interface to understand the logic behind an answer. |
Actions taken are logged as standard system activities. |
Agentic Assistant security
The Agentic Assistant is built on responsible AI principles to ensure its use is safe, fair, and trustworthy. We design our AI to be transparent about its actions, accountable for its decisions, and fair in its operations, avoiding biases.
The following describes how the Agentic Assistant protects sensitive data and gives you control and understanding over its automated actions.
Access control and permissions
User roles and RBAC options
Instance and Account admins control user access to Cortex Agentic Assistant. Cortex XSIAM uses role-based access control (RBAC) to govern chat access and permissions to view, create, edit, delete, enable, and disable agents and actions in the Agentic Assistant Hub.
Action Execution Scope
Agents can only use actions assigned to them, and execution is limited to the user's existing permissions in your Cortex XSIAM tenant. If a required integration is not active, its commands and any actions that wrap them will not work.
To perform actions in Slack, your Slack email must match your Cortex XSIAM user email. This ensures the system can strictly follow your assigned permissions (RBAC). If you do not have the required permissions to interact with agents, the system will block the action.
Data security and control
How sensitive data is protected
Data is hosted and encrypted by default on a dedicated Google Cloud Platform (GCP) project, and is isolated and protected by your specific IAM permissions. Google's multi-tenant architecture enforces strict data separation between customers.
User approval for sensitive actions
Actions marked as sensitive require explicit user approval before execution and are never run automatically. This gives you final control over critical or data-modifying steps.
Data user policy
Your prompts and outputs are processed only to generate the immediate response. They are not collected for model training or shared with third parties.
Data residency
All prompts and responses stay inside that region’s compute boundary, aligning with modern data-residency practices.
Transparency
You can see how the agent reaches its answer. Click the down arrow next to the Plan, to view how the user input was interpreted, the planned steps, and the actions used. You can view JSON artifacts created during plan execution, when data was retrieved, or when an object was created.
All actions an agent takes are saved in an audit dataset. You can see which agent ran which action, and which user invoked it.
In addition, all chat logs and actions initiated via Slack are stored in the Cortex XSIAM database and labelled with a specific Slack prefix or metadata tag.
Cortex XSIAM license tiers and product licenses
Cortex XSIAM product licenses are available in NG-SIEM, Enterprise, and Premium subscription tiers. Compare each Cortex XSIAM license tier, its included capabilities, and available security add-ons to select the subscription for your security use case.
You can upgrade your license by purchasing add-ons or moving to a different XSIAM license.
Compare Cortex XSIAM license tiers
- NG-SIEM provides analytics, data collection, detection, and security automation.
- Enterprise adds Cortex XDR agent coverage and extended endpoint visibility.
- Premium adds cloud posture security, cloud runtime security, and threat intelligence capabilities.
Cortex XSIAM NG-SIEM license
Cortex XSIAM NG-SIEM is an analytics subscription tier that includes data collection and full automation, suitable for users who want to enhance their security without immediately replacing their existing SIEM and endpoint solutions.
Key features include:
| Feature | Description |
|---|---|
| AI and Big Data | Integrates data analytics, AI/ML, and automation into a unified platform. |
| Comprehensive Data Collection | Offers extensive cloud data collection with out-of-the-box analytics, detection, and cloud asset discovery. |
| Advanced Analytics | Provides capabilities for threat hunting, analysis, response, and automation. |
| User and Entity Behavior Analytics (UEBA) | Uses machine learning to profile users and entities, alerting on anomalous behavior that could indicate a compromised account or insider threat |
Cortex XSIAM Enterprise license
Cortex XSIAM Enterprise includes all the features of Cortex XSIAM NG-SIEM and builds upon them by adding advanced endpoint visibility and data collection:
Key additions include:
| Feature | Description |
|---|---|
| Cortex XDR agent | Entitles you to one Cortex XDR agent per endpoint, which provides tailored endpoint data and third-party logs collection to optimize detection and investigation visibility. |
| Extended Detection and Response (XDR) | Incorporates extended data collection and ingestion of endpoint logs and alerts, firewalls, and third-party audit and flow logs through Host Insights and Extended Threat Hunting Data. |
Cortex XSIAM Premium license
Cortex XSIAM Premium is the most comprehensive tier, providing the highest level of security by combining all Enterprise features together with the following capabilities:
| Feature | Details |
|---|---|
| Cloud Posture Security | Delivers comprehensive visibility and continuous monitoring of cloud environments to ensure configurations meet security best practices, compliance standards, and vulnerability management. This bundle includes the following advanced modules:
|
| Cloud Runtime Security | Prevents attackers from exploiting risks present in your cloud environment. Provides real-time protection, detection, and response for cloud workloads, crucial for applications, containers, serverless functions, and APIs. Includes
Cortex XSIAM Premium users can install an XDR agent on endpoints and on any host or cloud workload, including Kubernetes hosts, based on the user's per-unit subscription parameters and workload demands. The XDR agent offers cloud-based endpoint protection and detection support, along with tailored endpoint and third-party log data collection. For more information about the license relationship between the XDR agent on endpoints and the XDR agent on host or cloud workloads, and how the licenses are allocated, see License allocation. |
| Extended Threat Intelligence (XTI) | Provides operationalized Threat Intelligence (TI) seamlessly integrated across the Cortex platform. |
| Threat Intel Management | Investigates indicators and files, applies indicator rules, generates reports, and integrates feed integrations. |
| Attack Surface Management | Provides internet-facing assets and ASM enrichment, external services, external IP ranges, attack surface rules and alerts, ASM widgets, and report capabilities. |
Existing users with a Cortex XSIAM Enterprise Plus license retain all Cortex XSIAM Enterprise features, including cloud agent features. You can deploy agents for runtime detection on cloud sources, such as Kubernetes nodes, OpenShift clusters, or cloud VMs, whether in the cloud or on-premises. If you want the full cloud posture security bundle (Cloud Posture Security or Cloud Runtime Security), you need to upgrade to Cortex XSIAM Premium.
Some add-ons, such as Advanced Email Security and Exposure Management, are available with Cortex XSIAM Premium, Enterprise, and NG-SIEM licenses.
License capabilities and add-ons
Cortex offers a modular set of license packages that work interchangeably, allowing them to serve as add-ons to subsequent products seamlessly. The table below shows the breakdown of each type of license package:
| Feature | Description | Cortex XSIAM NG SIEM | Cortex XSIAM Enterprise | Cortex XSIAM Premium |
|---|---|---|---|---|
| Core Analytics | Detects anomalies and threats using machine learning and behavioral models. | Included in license | Included in license | Included in license |
| Automation | Orchestrates and automates security workflows with prebuilt and customizable playbooks. | Included in license | Included in license | Included in license |
| Data Ingestion | Analytics tier: Collects and normalizes data, creating a unified foundation for analytics, investigation, and detection. GB/day-based, with a minimum of 100 GB/day. Cortex Data Lake tier: Provides cost-efficient ingestion and storage of security data at scale for use cases such as threat hunting, forensic investigations, and compliance audits. This tier is available as an optional add-on with a minimum of 50 GB/day, provided the mandatory 100 GB/day Analytics tier license is already met. For more information, see Configure Cortex Data Lake tier. | Included in license | Included in license | Included in license |
| Enterprise Runtime Security (XDR) | Comprehensive endpoint and server protection by combining AI-driven analytics, endpoint controls, next-generation antivirus, and automated investigation to detect and respond to threats across various environments. | Add-on | Included in license | Included in license |
| Cloud Posture Security | Agentless comprehensive visibility across your cloud environment. Includes:
For Cortex XSIAM Enterprise and NG SIEM, if purchasing Cloud Posture Security only, a minimum number of workloads is required. If you purchase Cloud Runtime Security or Cortex XSIAM Premium, this add-on is included with the subscription. | Add-on | Add-on | Included with Cloud Runtime Security |
| Cloud Runtime Security | Full cloud protection, detection, and response. In addition to Cloud Posture Security:
For all Cortex XSIAM licenses, a minimum number of workloads is required. | Add-on | Add-on | Included in license |
| Application Security | Comprehensive protection for your software development lifecycle (SDLC) from code-to-cloud, offering visibility, detection, contextual analysis, prioritization, prevention, and remediation. To access the Application Security module, you must have a Cloud Posture Security, Cloud Runtime Security, or Cortex XSIAM Premium license. These licenses include Application Security Posture Management (ASPM) and CI/CD Security. Add-on component: Code Security Code Security requires a separate Application Security add-on as well as a Cloud Posture Security, Cloud Runtime Security, or Cortex XSIAM Premium license. | Add-on | Add-on | Add-on |
| Extended Threat Intelligence (XTI) | Provides operationalized Threat Intelligence (TI) seamlessly integrated across the Cortex platform | Add-on | Add-on | Included in license |
| Threat Intelligence Management | Investigates indicators and files, uses indicator rules, reports, and feed integrations. | Add-on | Add-on | Included in license |
| Attack Surface Management | Provides internet-facing assets and ASM enrichment, external services, external IP ranges, attack surface rules and alerts, ASM widgets, and report capabilities. | Add-on | Add-on | Included in license |
| Identity Threat Detection & Response | Enables asset role configuration, advanced analytics alert layout, Risk Management dashboard, User/Host Risk view, designated analytics for compromised accounts, and insider threat coverage. This solution helps organizations proactively secure identities, accelerate threat response, and reduce the complexity of security operations. | Add-on | Add-on | Add-on |
| Forensics | Detect attacker activity by reviewing key artifacts such as event logs, registry keys, browser history, etc. Forensics simplifies investigations so you can trace every move an adversary made and swiftly contain threats from one place without needing to pivot between security tools. | Add-on | Add-on | Add-on |
| Host Insights | Host Insights combines Vulnerability Management, Host Inventory, and a powerful Search and Destroy feature to help you identify and contain threats. It offers a holistic approach to endpoint visibility and attack containment, helping reduce your exposure to threats so you can avoid future breaches. | Add-on | Included in license | Included in license |
| Extended Threat Hunting | Investigates everyday activities in real time and analyzes patterns to discover new threats, aiming to proactively minimize risk for an organization. | Add-on | Included in license | Included in license |
| Data Retention | Retention per dataset ensures extended access to data, strengthening threat investigation, compliance, and long-term visibility. | Add-on | Add-on | Add-on |
| Extended Compute Units | Additional computing resources beyond the annual allocation. You can purchase more units or enable dynamic allocation for flexible access. This ensures uninterrupted service, supports scaling during peak workloads, and optimizes resource management to maintain performance during high-demand periods. | Add-on | Add-on | Add-on |
| Endpoint Event Forwarding | Enables exporting the raw telemetry collected by XDR Agents and event data from cloud endpoints to external systems (if relevant). | Add-on | Add-on | Add-on |
| GB Event Forwarding | Enables exporting parsed logs to an external SIEM for storage, so you can keep data in your own storage in addition to the Cortex XSIAMdata layer, for compliance requirements and machine learning purposes. | Add-on | Add-on | Add-on |
| Advanced Email Security | Investigate and respond to threats within modern, distributed email infrastructures. The module is a scalable, API-based solution that passively analyzes cloud-hosted email environments to detect threats. It ingests data from messages, attachments, and user identities to identify early-stage threats and high-risk behaviors without requiring any changes to mail flow. | Add-on | Add-on | Add-on |
| Exposure Management | Gain comprehensive visibility, actionable prioritization, and automation-first remediation to help security teams proactively assess and respond to organizational exposures. | Add-on | Add-on | Add-on |
| DLP (Data Loss Prevention) | The Cortex Data Loss Prevention (DLP) module provides a unified and flexible solution to prevent sensitive data exfiltration. It continuously enforces policies on endpoints (even offline) across web, local, and USB channels, protecting both on-premise and cloud environments. | Add-on | Add-on | Add-on |
Tiers and key capabilities
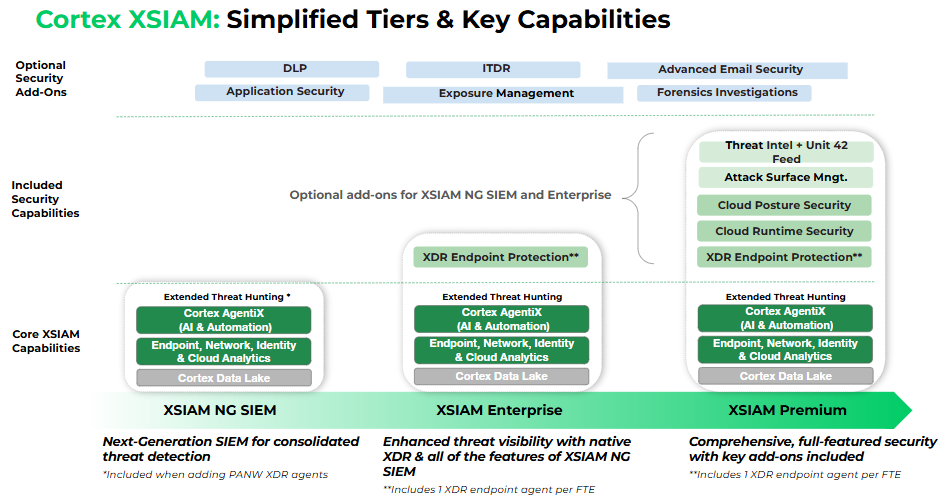
Data retention
After purchasing your license retention add-ons, you can view details about your Cortex XSIAM licenses and retention add-ons by selecting Settings → Cortex XSIAM License. For more information on your storage license details, see Dataset Management.
Default retention periods
The following table summarizes the default retention periods for Cortex XSIAM:
| Data Type | Default Retention Period |
|---|---|
| Ingested data | 31 days |
| Cases and Issues data | <p>186 days</p><div data-gb-custom-block data-tag="hint" data-style="info" class="hint hint-info"><p>Case data is retained according to the Last Updated date.</p><p>Issue data is retained according to the Observation Time. Data collected within these dates is kept and displayed for 186 days. To ensure the accuracy of issues, Cortex XSIAM provides a grace period of up to 31 days for issues displayed in the Issues View, Issues table, and Cases View.</p></div> |
| Agentic AI chats and artifacts | 186 days |
| Forensic data | <p>365 days</p><div data-gb-custom-block data-tag="hint" data-style="info" class="hint hint-info"><p>Requires the Forensics add-on.</p></div> |
| Audit logs | 365 days |
| Query data | 186 days |
Retention add-ons
Retention add-ons are provided for ingested data and Cases and Issues data. Minimum requirements are dependent on the license type. You can purchase one or more of the following add-ons:
| Feature | Description |
|---|---|
| Additional Cases and Issues Retention | <p>An additional 31-day hot storage of Case and Issue data apart from the default 186 days.</p><p>Available for purchase per month for each endpoint. This retention add-on also extends agentic AI chats and artifacts retention by 31 days.</p> |
| Period-Based Retention - Hot Storage (All datasets) | <p>Fully searchable storage for investigation and threat hunting of ingested data, and Cases and Issues data.</p><p>Requires purchasing a minimum of one month of the additional retention.</p> |
| Additional Hot Storage (Selected datasets) | <p>Flexible hot storage-based retention to help accommodate varying storage requirements for different retention periods and datasets. Fully searchable storage for investigation and threat hunting of ingested data.</p><p>Available for purchase with storage for a minimum of 1,000 GB.</p> |
| Period-Based Retention - Cold Storage | <p>Lower-cost storage of ingested data for long-term compliance needs with limited search options.</p><p>Requires purchasing a minimum of six months of additional retention.</p> |
Data storage lifecycle
Cortex XSIAM data storage is managed in the Cortex XSIAM Data Layer. You receive data storage based on the amount associated with your licenses, determined by factors such as daily ingestion needs and the number of users. All licenses provide default retention periods, which can be extended for hot and cold storage.
To determine your requirements, you must understand the differences between the available storage options. The following image shows examples of these differences:
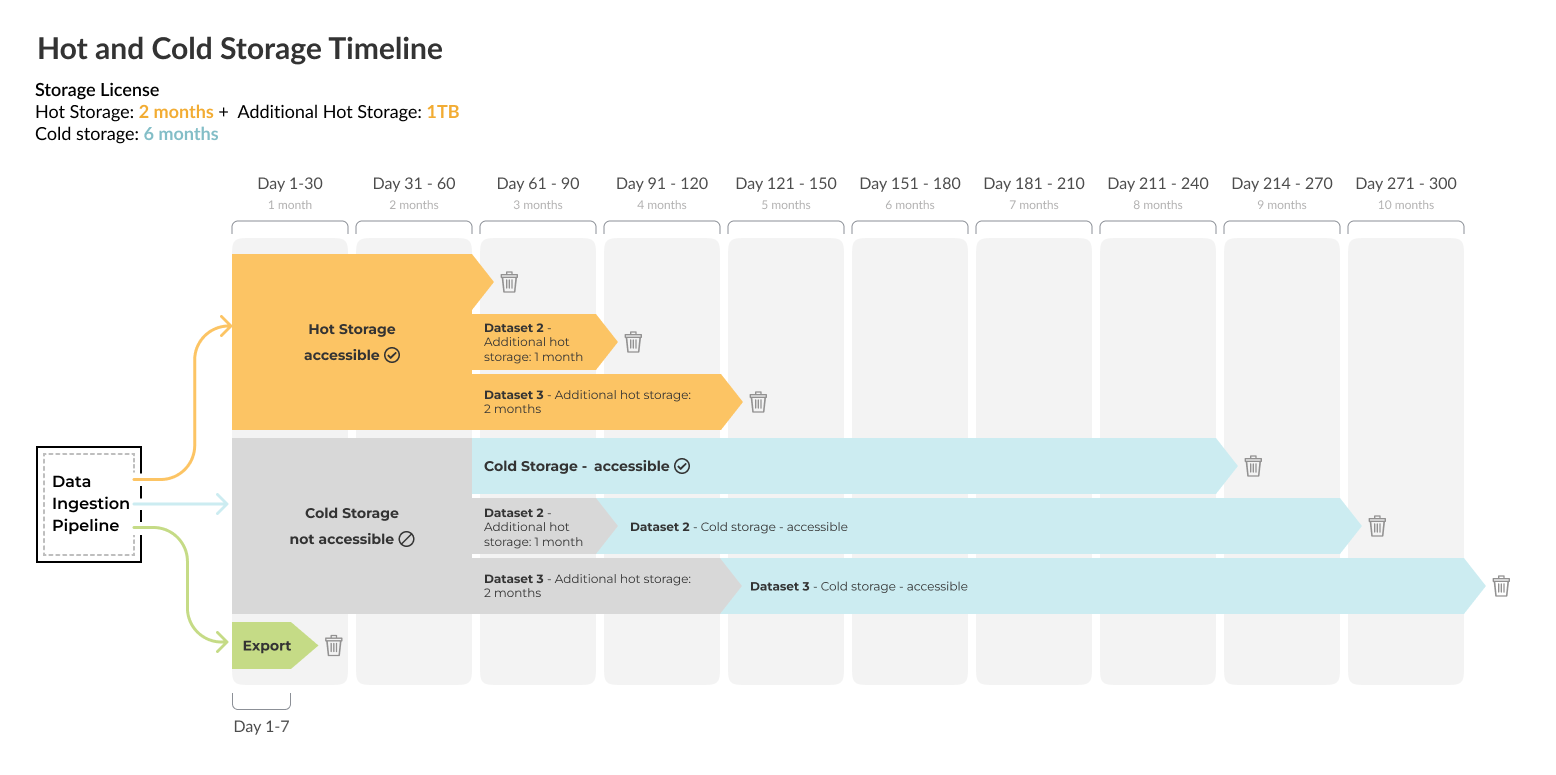
Data Ingestion Pipeline
Data enters via a data stream called the Data Ingestion Pipeline, where manipulation, such as normalization, enrichment, and analytics, occurs. Once ready, it is transferred to the following locations based on your licenses:
Hot storage
With a regular license, data is automatically sent to hot storage for the default retention period (typically one month).
- Extensions: You can add retention in monthly increments via Period-Based Retention (all data) or Additional Hot Storage (specific datasets).
- Retroactive application: If you purchase additional hot storage, the new retention time can be applied retroactively to any data still available in your hot datasets that hasn't been rolled out yet.
- Image example: In the image above, the regular Cortex XSIAM license and additional storage licenses ensure that all the data is accessible from hot storage for two months. After this, data begins purging except for Dataset 2 (accessible for one additional month) and Dataset 3 (accessible for two additional months) before being gradually purged.
Cold storage
A regular license provides no default cold storage.
-
Independence: There is no connection between hot and cold storage; you cannot move missing data from hot to cold storage later. Data must be sent to cold storage from the pipeline starting from the purchase date.
Tip
If you want your cold storage data to align with the hot storage data, you must ensure you purchase your cold storage license at the same time as your regular Cortex XSIAM license.
- Accessibility: Cold storage data is collected upon ingestion but is only accessible after the hot storage retention period has expired. The cold storage retention period only begins once the hot storage period ends.
- Retroactive application: If you purchase additional cold storage, the extra retention time may be applied retroactively to any data still residing in your cold datasets that hasn't been rolled out yet, provided the existing data is covered under the renewal/purchase.
-
Requirements: Requires a minimum of six months of retention and Compute Units (CU) to run cold storage queries. For more information on CU, see Manage compute units.
For information on the CU add-on license, see Understand the Cortex XSIAM license plan.
- Image example: Cold storage is aligned with hot storage. The pipeline sends data to both for the first two months, but it is not accessible in cold storage during the hot storage retention period. After two months, the data becomes accessible in cold storage for six months (except for Datasets 2 and 3, which are still in their extended hot storage periods). Once those datasets finish their hot retention, they also become accessible in cold storage for six months before purging.
Export
A regular license does not provide default export capabilities.
- Event Forwarding: Only after purchasing this add-on is data sent to an intermediate storage location from the pipeline.
- Retention: This data is accessible for seven days before being gradually purged.
-
Image example: Export data is aligned with hot and cold storage. The pipeline sends data to intermediate storage for Event Forwarding, which is accessible for seven days before purging.
For more information on Event Forwarding, see Manage Event Forwarding.
Recommendations
To optimize your data strategy and prevent data loss, consider the following best practices:
- Synchronize license purchases: For your cold storage data to align perfectly with your hot storage data, you must purchase your cold storage license at the same time as your regular Cortex XSIAM license. This ensures the Data Ingestion Pipeline begins feeding both streams simultaneously from day one.
- Manage retention proactively: To ensure no data is lost and that extensions can be retroactively applied to your hot and cold datasets, always make changes to your data retention licenses while the current license is still active. If a license expires or the data retention period passes, the data is purged and cannot be recovered or extended retroactively.
You can view details about your Cortex XSIAM licenses by selecting Settings → Cortex XSIAM License.
License allocation
Enforcement of licenses
Cortex XSIAM Enterprise and Premium licenses include Cortex XDR agents with Host Insights (HI) and Extended Threat Hunting (XTH) capabilities. When you buy additional agents, these capabilities are automatically extended to new agents. For Cortex XSIAM NG SIEM, this license does not include agents or HI/XTH capabilities by default. If you buy agents for this tier, you must also buy the HI and XTH add-ons for them.
In Cortex XSIAM, the Cortex XDR agent protects all your enterprise assets, from user devices to cloud servers. For licensing purposes, these assets are categorized as follows:
-
Endpoints
An endpoint is any physical or virtual device, such as a PC, laptop, or server, protected by an installed Cortex XDR agent. Licensing is calculated on a 1:1 basis, meaning one active device consumes one license.
-
Workloads
A workload represents a compute resource, such as a VM, container, or serverless function in a public cloud. These resources can be secured by agent-based protection (Cortex XDR agent) or agentless methods. Both Cloud Runtime Security and Cloud Posture Security are included in Cortex XSIAM Premium. License consumption is determined by the protection you deploy.
When all XDR endpoint and workload licenses are consumed, Cortex XSIAM maintains basic endpoint protection on affected assets. Advanced pro-level detection and response capabilities are not applied. If you exceed workloads or endpoints, XSIAM does not “borrow” from unused endpoints or workloads.
When you exceed the permitted number of Cortex XDR endpoints and workloads, Cortex XSIAM displays a notification in the notification area. Cortex XSIAM permits a small grace period over the permitted number, but begins enforcing the number of agents after 14 days. If additional Cortex XDR agents are required, increase your Cortex XDR endpoint/workload license capacity.
For Cortex XSIAM Enterprise Plus licenses, if an endpoint requires a Cortex XDR per Endpoint license, and you’ve exceeded the number of available Cortex XDR per Endpoint licenses, one of your surplus Cloud per Host licenses is automatically consumed as a Cortex XDR per Endpoint license for the endpoint. After utilizing all available XDR per Endpoint and Cloud per Host licenses, Cortex XSIAM maintains basic endpoint protection on affected assets. Advanced pro-level detection and response capabilities are not applied.
When the number of Cloud Posture Workloads exceeds the limit for Cortex XSIAM Premium or any Cortex XSIAM license with the Cloud Posture Security and Cloud Runtime Security add-ons, the excess posture workloads will use available credits from the Cloud Runtime Workloads quota until it is fully used. Spillover occurs only from posture to runtime workloads and does not occur in the reverse direction. Any excess workload usage is displayed as a notification in the notification area.
License revocation
Cortex XSIAM manages licensing for all assets, including user devices, servers, and cloud workloads, which are protected by the Cortex XDR Agent. Each time you install a new Cortex XDR Agent, it registers with Cortex XSIAM to obtain a license from the appropriate pool (either for user endpoints or workloads). For non-persistent VDI (virtual machines that are reset or destroyed after use), the agent registers as soon as a user logs in to the asset.
Cortex XSIAM issues licenses until you exhaust the number of licenses available, and enforces a cleanup policy that automatically returns unused licenses to the available pool. The time at which a license returns to the license pool depends on the type of endpoint (or workload):
| Asset Type | License Return | Agent Removal from Cortex XSIAM Tenant | Agent Removal from Cortex XSIAM Database |
|---|---|---|---|
| Standard endpoints, mobile devices, server/cloud workloads | After 30 days | After 180 days | After 180 days |
| (Non-Persistent) VDI and Temporary Session | <ul><li>VDI: Immediately after log-off</li><li>Other: After 90 minutes</li></ul> | After 6 hours | After 7 days |
After a license is revoked, if the agent connects to Cortex XSIAM, reconnection will succeed as long as the agent has not been deleted from the database; otherwise, the agent is registered as a new asset.
If an agent from a deleted asset tries to connect to Cortex XSIAM within the 180-day period (for standard endpoints and workloads), it can resume its connection and maintain its original agent ID. After 180 days, the agent ID and all associated data are permanently deleted from the database. To reconnect an agent after this period, you must use Cytool to reconnect or reinstall the agent on the asset, which will then be assigned a new agent ID and start fresh.
It can take up to an hour for Cortex XSIAM to display revived assets.
License expiration
Cortex XSIAM licenses are valid for the period of time associated with the license purchase. After your license expires, you have access to your tenant for an additional grace period of 48 hours. After the 48-hour grace period, you no longer have access and it is disabled until you renew the license.
For the first 31 days of your expired license, Cortex XSIAM continues to protect your endpoints and/or network and retains data in the Cortex Data Layer according to your data retention policy and licensing. After 31 days, the tenant is decommissioned and agent prevention capabilities cease.
Upgrade your tenant
When you purchase new entitlements, Cortex XSIAM automatically applies them to your tenant through a seamless upgrade process. If any downtime is required, you’ll receive advance notice and can choose a convenient time to proceed with the upgrade.
A banner notifies you that an upgrade is scheduled. To see details of the upgrade schedule, click view upgrade details. You can continue with the update schedule, or take one of the following actions:
- To upgrade immediately, click Upgrade now.
- To schedule an upgrade, select a start date and time from the calendar.
Keep in mind the following during the upgrade process:
- The gateway may experience up to two hours of downtime during the installation.
- The upgrade will occur automatically on the scheduled time and date unless you change it. The product will also display a banner 24-hours before the upgrade occurs.
- The development tenant associated with the upgraded production tenant will also be upgraded.
- Pairing Prisma Cloud Compute with Cortex XSIAM is not supported in XSIAM 3.X versions.
In-product support ticket creation
To simplify the process of creating a support ticket, you can open a support ticket directly in Cortex XSIAM. Opening the ticket in Cortex XSIAM allows all of the relevant context to be included, such as the option to record the console and upload relevant logs. When relevant, Cortex XSIAM will create and send the agent tech support file (TSF) for the endpoint you select. All relevant data about your tenant is logged and included in the support ticket, including license details. Using the Submit Support Ticket wizard makes it easier for you to include all of the necessary details and log files while first submitting your support ticket, thereby enabling the support team to solve it more quickly and easily.
If you have the Cortex Agentic Assistant enabled, when you click Help, you have two options: Documentation Portal and Initiate Support Request. If you select Initiate Support Request, the Help Center agent opens to assist with finding relevant documentation, troubleshooting, and creating a support ticket. After your first prompt to the Help Center agent, you can click Submit support ticket above the chat. If you click Submit Support Ticket, you are brought directly to the Submit Support Ticket wizard.
If you do not have the Cortex Agentic Assistant enabled, when you click Help, you have two options: Documentation Portal and Initiate Support Request. If you select Initiate Support Request, you are brought directly to the Submit Support Ticket wizard.
To use the embedded support ticket feature, you must have a user account in the Customer Support Portal, and your Cortex XSIAM user must be granted the Help permission in Cortex Gateway.
From Cortex XSIAM, select Help → Initiate Support Request.
In the Submit Support Ticket wizard, enter the requested ticket information. Be precise when indicating the impact of the issue. When an issue is critical, you will be asked to input the most critical information so that support can understand the issue and start addressing it immediately.
When opening a support ticket through the Customer Support Portal, you need to manually select Cortex XSIAM as the product. While there may be discrepancies between the categories in this wizard and the Customer Support Portal process, that's because this wizard is designed specifically to focus on options relevant to Cortex XSIAM.
When the issue you are opening a support ticket for is related to the agent, you can select the relevant endpoint. If you select the endpoint, Cortex XSIAM will create and send the TSF for the agent you selected, when possible.
Selecting an endpoint from the endpoint table and retrieving TSF requires full Retrieve Endpoint Data permissions under Endpoint Administration.
To provide more context for your support ticket, you can record the Cortex XSIAM console directly from the support ticket wizard. If you choose to record the console, you can also opt to have the HAR file generated and sent to further assist support in solving the ticket. To record the console, select Record Console. To submit your support ticket without recording the console, select Skip.
If you choose to record the console, your browser may prompt you for permission for Cortex XSIAM to see the contents of the tab. To allow recording, select Allow. You can now recreate the issue in your Cortex XSIAM environment, and all of your actions are recorded. The console recording and HAR file generation only take place within the context of the browser tab that Cortex XSIAM is running in. When you are ready to stop recording, select Stop Sharing.
If you wish to recreate the recording, you must first delete the existing console recording by clicking the x symbol next to the Console Recording. Then select Record Console.
Console recordings cannot exceed 10 minutes. The current recording time is displayed at the top of the window.
To submit the support ticket, click Submit Support Ticket.
While the ticket attachments are uploading, do not refresh or navigate away from Cortex XSIAM until you get a notification in the Notification Center that uploading is complete. In the meantime, you can close this wizard and continue working in Cortex XSIAM.
Once the support ticket is created successfully, the support ticket number is displayed, and you will receive an email notification from Palo Alto Networks Support. You can manage the support ticket and monitor its progress in the Customer Support Portal.
Supported web browsers
Cortex XSIAM supports the following web browsers:
| Browser | Version |
|---|---|
| Chrome | 95.x and later |
| Firefox | 93.x and later |
| Safari | 13.x and later |
| Microsoft Edge | Latest version |
| Prisma Browser | Latest version |
Use the Cortex XSIAM interface
The Cortex XSIAM interface provides a centralized security operations workspace. Use it to view and manage security data across your environment.
Use the navigation menu on the left to move between product areas in the tenant. For a quick overview of each area, see the Navigation cheat sheet below.
From the interface, you can:
- Navigate between product areas.
- Chat with an Agentic Assistant agent
- Filter table results to find relevant information.
- Create saved views with commonly used filter configurations.
- Export table data.
-
Access in-product help and documentation.
- Each SAML login session is valid for 8 hours.
- Some menu items only appear if you have the relevant license.
Filter Cortex XSIAM page results
To reduce the number of results, you can filter by any heading and value. When you apply a filter, Cortex XSIAM displays the filter criteria above the results table. You can also filter individual columns for specific values using the icon to the right of the column heading.
Some fields also support additional operators such as =, !=, Contains, not Contains, *, !*.Filters are persistent. When you navigate away from the page and return, any filter you added remains active.
To build a filter using one or more fields:
-
From a Cortex XSIAM page, select filter (
 ).
).Cortex XSIAM adds the filter criteria above the top of the table.
- For each field you would like to filter by:
- Select or search the field.
-
Select the operator that matches the criteria.
Use = to include results that match the value you specify, or != to exclude results that match the value.
-
Enter a value to complete the filter criteria.
CMD fields have a 128-character limit. Shorten longer query strings to 127 characters and add an asterisk (*).
Alternatively, you can select Include empty values to create a filter that excludes or includes results when the field has empty values.
- To add additional filters, click +AND, within the filter brackets to display results that must match all specified criteria, or +OR to display results that match any of the criteria.
- To see the results, click out of the filter area.
Save Cortex XSIAM views and filters
Cortex XSIAM allows you to save filter configurations so you can quickly return to commonly used data selections. Depending on the page you are working on, you can save either views or filters:
- Saved views store table configurations, including filters, so you can quickly switch between commonly used table perspectives.
- Saved filters store only the filter criteria, allowing you to quickly apply the same filtering logic again.
These options help you quickly focus on the data most relevant to your workflow.
Saved views
Saved views store filter configurations for table data, allowing you to quickly return to frequently used filters. You can filter table data by fields such as domain, context, or work queue, configure the columns you want to see, and save the configuration as a reusable view.
Saved views are available on most table-based pages, such as the Cases and Issues pages. The default view is All (for example, All Cases).
Select the arrow next to the view name to see all available views. If you modify filters in an existing view, you can update the view or save the configuration as a new view.
Save a view
- Apply one or more filters.
- Select Save.
- Enter a name for the view.
- Choose whether to share the view.
Manage views
- Use the three-dot Actions menu next to the view name to take the following actions:
- Set the view as the default.
- Share or unshare the view.
- Update the view after modifying filters.
- Delete the view.
- Deleting a shared view removes it for all users.
- You can delete your own saved views.
- To delete views created by other users, you must have the Account administrator or Instance administrator role.
Saved filters
Some pages allow you to save filters instead of views, such as the IOC and BIOC pages.
Saved filters store filter criteria, allowing you to quickly apply the same filters again. Saved filters help standardize filtering and allow users to quickly apply commonly used search conditions.
Apply a saved filter
- Open the three-dot Actions menu in the table filter row.
- Select Saved filters and choose a filter to apply.
- Click Apply.
Create a filter
- Remove all filters from the table.
- Click Add filter and define the filter values.
- Click Save and define a filter name.
Share or delete a saved filter
- Open the three-dot Actions menu in the table filter row.
- Select Saved filters.
- Click the Actions menu next to a filter name and select the relevant action.
- Deleting a shared filter removes it for all users.
- You can delete your own saved filters.
- To delete filters created by other users, you must have the Account administrator or Instance administrator role.
Export Cortex XSIAM results
You can export the page results for most pages in Cortex XSIAM to a tab-separated values (TSV) file.
- (Optional) Filter page results to reduce the number of results for export.
-
Select export to file (
 ).
).Cortex XSIAM exports any results matching your applied filters in TSV format. The TSV format requires a tab separator; automatic detection does not work in the case of multi-event exports.
Cortex XSIAM system tools and services
The following controls appear in the navigation bar and provide access to system tools, help resources, and tenant settings.
Cortex Agentic Assistant
Click  in the top-right corner to open the assistant.
The Cortex Agentic Assistant is the autonomous AI capability of Cortex XSIAM. It uses AI agents that plan, reason, and investigate complex threats, such as cloud identity theft or container breaches.
Notifications
The Notifications panel displays system alerts and updates generated by Cortex XSIAM.
Tenant Navigator
Use Tenant Navigator to view and switch between tenants you have access to. Tenants are organized by CSP account. You can also navigate directly to the Cortex Gateway.
Settings
From the Settings menu, you can:
- View license information
- Manage audit logs
- Manage exceptions configuration
- Configure data sources and system settings
Managed Services
The Managed Threat Hunting service provides 24/7 monitoring by Palo Alto Networks threat researchers and Unit 42 experts.
Help
Cortex XSIAM provides in-product help directly within the interface.
Click  to open the Help. There are two options:
- Documentation Portal
- Initiate Support Request
If you have the Cortex Agentic Assistant enabled, when you select Initiate Support Request, the Help Center agent opens to assist with finding relevant documentation, troubleshooting, and creating a support ticket. After your first prompt to the Help Center agent, you can click Submit Support Ticket above the chat. If you click Submit Support Ticket, you are brought directly to the Submit Support Ticket wizard.
If you do not have Cortex Agentic Assistant enabled, selecting Initiate Support Request brings you directly to the Submit Support Ticket wizard.
User menu
Click your username to access user and tenant options.
From the user menu, you can:
- View tenant information
- See What's New
- Switch between light and dark mode
- Log out
Cortex XSIAM navigation cheat sheet
Dashboards & Reports
| Component | Description |
|---|---|
| Dashboard | Select a dashboard/command center to view your tenant's activities, enabling you to effectively monitor your cases and overall activity in your environment |
| Reports | View all the reports that Cortex XSIAM have run. |
| Dashboard Manager | Manage dashboards, including adding dashboards with customized widgets to surface the statistics that matter to you most. |
| Report Templates | Build reports using pre-defined templates or customize a report. Reports can be generated on demand or scheduled. |
| Widget library | Search, view, edit, and create widgets based on predefined widgets and user-created custom widgets. |
Cases & Issues
| Component | Description |
|---|---|
| Cases | Investigate cases, manually create new cases, manage case severity and status, assign cases, and merge cases. |
| Issues | Investigate and manage individual issues. Run a playbook in the Work Plan for an individual issue or run the same playbook on multiple issues from the Issues table. Run commands in the War Room. Navigate to the Findings table. |
| Case Configuration | Add case scoring rules, view starred issues, and add featured hosts, users, and IP addresses. |
Investigation & Response
Search
| Component | Description |
|---|---|
| Query Builder | Build complex queries to investigate, identify connections, and expose the root cause of issues from your data sources. |
| Query Center | View and manage the results of all simple and complex queries created from the Query Builder. |
| Scheduled Queries | View and manage all scheduled and recurring queries created from the Query Builder. |
Automation
| Component | Description |
|---|---|
| Playbooks | Manage playbooks, including viewing, creating, and editing. |
| Scripts | Manage scripts. Use Script Helper to find relevant commands and scripts for your use case. |
| Jobs | Create and manage jobs to run a specific playbook, triggered either by time or a delta in a feed. |
| Playground | Safely develop and test scripts, commands, and more, in a non-production environment not connected to a specific issue or case. |
| Automation Rules | Automatically respond to events by defining trigger conditions and desired actions to perform once the condition is met. |
Response
| Component | Description |
|---|---|
| Action Center | Provides a central location from which you can track the progress of all investigation, response, and maintenance actions performed on your endpoints. |
| Live Terminal | Initiate a remote connection to an endpoint, enabling you to remotely manage, investigate, and perform response actions on the endpoint. |
| EDL | Add malicious domains and IP addresses to an external dynamic list enforceable on your Palo Alto Networks firewall. |
Forensics
| Component | Description |
|---|---|
| N/a | Streamline your case response, data collection, threat hunting, and analysis of your endpoint data to find the source and scope of an attack. Requires the Forensics add-on. |
Notebooks
| Component | Description |
|---|---|
| N/a | Use Jupyter tools to build machine learning models to visualize clusters, identify anomalies, and then feed your findings back into the Cortex XSIAM environment to generate security insights. You need a daily minimum of 1000 compute units. |
Threat Management
Detection Rules
| Component | Description |
|---|---|
| IOC | Identify specific hashes, IP addresses, domains, file names, and paths that indicate a threat. |
| BIOC | Identify a specific network, process, file, or registry activity that indicates a threat. |
| Correlations | Analyze correlations of multiple events from multiple sources. |
| Indicator Rules | Create rules based on filters that are applied as either SHA256 and MD5 prevention rules in specific Agent Prevention Profiles or as file, IP address, and domain detection rules. |
Threat Intelligence
| Component | Description |
|---|---|
| Threat Intelligence | Requires Cortex XSIAM Premium or any other XSIAM license with the TIM add-on |
| Indicators | Indicators database. Search, review, and interact with indicators including IPs, domains, URLs, hashes, and more. |
Posture Management
Requires Cortex XSIAM Premium or any other XSIAM license with the Cloud Runtime Security add-on.
| Component | Description |
|---|---|
| Vulnerability Management | View vulnerability issues, vulnerable assets, vulnerabilities, and vulnerability intelligence. |
| Compliance | Determine asset vulnerabilities and risk by checking whether assets adhere to industry standards or your organization's best practices for compliance. You can select compliance standards from the compliance catalog. |
| Rules & Policies | Create and edit rules and policies for cloud workload, cloud security, and vulnerability management. |
Inventory
Assets
| Component | Description |
|---|---|
| All Assets | Provides a central location from which you can view and investigate information relating to assets in your network. |
| Groups | Create and view groups of assets with shared attributes. |
| Network configuration | Define your internal IP address ranges and domain names to identify and track your network assets. |
Endpoints
| Component | Description |
|---|---|
| All Endpoints | View and manage endpoints that have registered with your Cortex XSIAM instance. |
| Groups | Create endpoint groups to which you can perform actions and assign the policy. |
| Installations | Create packages of the Cortex XSIAM agent software for deployment to your endpoints. |
| Host Insights | Access comprehensive insights into your system's components, including applications, services, users, and vulnerability assessments, to maintain visibility and security across your environment. |
| Policy Management | Configure your endpoint security profiles and assign them to your endpoints. |
| Host Firewall | Control communications on your endpoints by applying sets of rules that allow or block internal and external traffic. |
| Device Control Violations | Monitor all instances where end users attempted to connect restricted USB-connected devices and Cortex XSIAM blocked them on the endpoint. |
| Disk Encryption Visibility | View and manage endpoints that were encrypted using BitLocker. |
| File Integrity Monitoring | A security control designed to detect unauthorized or anomalous modifications to files and folders in the file system. Any change, such as, a new file being created or an existing file being modified, will trigger an event that is sent to the Cortex XSIAM tenant. |
Modules
| Component | Description |
|---|---|
| AI Security | <p>Comprehensive overview of the AI assets within an organization. Designed to ensure AI security by offering tools to review and prioritize AI risks effectively.</p><p>This feature is included with a Cloud Runtime Security, Cloud Posture Security, or Cortex XSIAM Premium license.</p> |
| Application Security | <p>Secures your applications by identifying and prioritizing them as a single, logical entity encompassing assets across the entire software development lifecycle (SDLC).</p><p>This feature is included with a Cloud Runtime Security, Cloud Posture Security, or Cortex XSIAM Premium license.</p> |
| Dats Security | <p>Agentless multi-cloud data security platform that discovers, classifies, protects, and governs sensitive data.</p><p>This feature is included with a Cloud Runtime Security, Cloud Posture Security, or Cortex XSIAM Premium license.</p> |
| Identity Security | <p>Runs a proprietary algorithm to calculate effective permissions and entitlements of the identities across your cloud service providers.</p><p>This feature is included with a Cloud Runtime Security, Cloud Posture Security, or Cortex XSIAM Premium license.</p> |
| Kubernetes Security | <p>Automatically discovers assets, enforces policies, and scans for vulnerabilities, malware, secrets, and misconfigurations across the environment.</p><p>This feature is included with a Cloud Runtime Security, Cloud Posture Security, or Cortex XSIAM Premium license.</p> |
| Attack Surface | ASM helps you discover and manage your public attack surface, providing visibility into all of your digital assets, including on-prem and cloud. Identify and remediate vulnerabilities, enforce compliance policies, and reduce the risk of cyberattacks. Included in Cortex XSIAM Premium or any other XSIAM license with the Attack Surface Management add-on. |
| Email Security | Provides a scalable detection, investigation, and response layer over cloud-hosted email environments. It connects directly to supported email platforms via secure API integrations to ingest rich message-level and identity-related telemetry. Requires the Email Security add-on. |
| Exposure Management | A collection of features, capabilities, integrations, and content designed to help defenders holistically assess, consolidate, prioritize, and proactively respond to exposures in their organization. Requires the Exposure Management add-on. |
Agentic Assistant Hub
This menu item appears if you have enabled the Cortex Agentic Assistant.
Manage agentic agents and actions in the Agentic Assistant Hub.
Manage API keys
API keys are used to manage and secure API interactions. An API key is essentially a unique string of alphanumeric characters that acts as a credential, allowing a specific user or application to access and interact with a particular API. When you request data or perform an action through an API call, you must include this API key in the header. Cortex XSIAM then verifies the key's authenticity and, if valid, grants the requested access.
How to create an API key
- Select Settings → Configurations → Integrations → API Keys → New Key.
- In the Role tab, perform the following:
- Under Security Level, select the type of API Key you want to generate: Advanced or Standard. The Advanced API key hashes the key using a nonce, a random string, and a timestamp to prevent replay attacks. cURL does not support this, but it is suitable for scripts.
-
Under Role, select the desired level of access for this key. You can select from predefined roles or custom roles. Roles are available according to what was defined in either the Cortex Gateway or Cortex XSIAM Access Management. You can view the configuration of the role selected by expanding the sections under Components. For more information, see Assign user roles and groups.
Ensure the selected role has the appropriate Credentials permission. If you select a role where Credentials is set to None, such as the predefined CLI Role, any API calls made using this key that attempt to fetch, list, create, or modify stored credentials will return a 403 Forbidden error.
- (Optional) Under Comment, provide a comment that describes the purpose of the API key.
- (Optional) If you want to define a time limit on the API key authentication, select Enable Expiration Date, and select the expiration date and time. You can track the expiration date of each API key in the API Keys page. In addition, Cortex XSIAM displays an API Key Expiration notification in the Notification Center one week and one day before the defined expiration date.
-
(Optional) To configure and manage granular scoping for Scope-Based Access Control (SBAC), click the Scope tab, and under Scope Definition, expand the scoping areas that you want to grant the user role access to for this API by clicking the chevron icon (>) beside the scoping area title. The following table explains the options available to configure:
Before configuring, ensure you review Understand scoping in the Manage user scope section.
Scoping Area Granular Scoping Configurations Assets Set the Scope by selecting one of the following:
- No assets: No asset is accessible.
- All assets: Defines access to all assets.
- Select asset groups: Defines access to the specific assets associated with the Asset Groups selected, and to view all their related cases, issues, and findings for these specific assets and Asset Groups. Under Select asset groups, define the specific asset groups that you want to grant access. Only Asset Groups relevant for scoping are listed, which are asset groups that are using only the asset attributes listed in Manage user scope (under Understand scoping → Scoping Areas → Assets).
The scoping of assets also affects the scoping of cases, issues, and findings.
Visibility of Security domain Issues that refer to assets with agents is controlled by the Endpoints scoping configuration.
Cases and Issues Set the Scope by selecting one of the following:
- No cases and issues: Defines access to no cases and issues.
- All cases and issues: Defines access to all cases and issues. Users can view cases or issues referencing assets within their scope. Use the Assets section to define which assets are in scope.
Select domains: Defines access to the domains selected to view their related cases and issues. Under Select domains, define the specific domains that you want to grant access.
Users can only view cases or issues referencing assets and endpoints within their scope. Use the Assets section to define which assets are in scope.
When selecting All cases and issues or Select domains, you can separately configure access to issues and cases that lack an asset reference or where the referenced asset is not in All Assets and All Endpoints inventories. To provide access, select the Allow access to cases and issues that are not referencing known assets or endpoints checkbox. Once selected, you can specifically control which users have access to issues and cases that lack Affected Assets (as seen in the issue’s panel) and Assets (as seen in the case's panel), or where the listed assets are not part of the Asset or Endpoint inventories. When the assets listed are not part of the inventories, the asset string is typically non-clickable. In some cases, such as for identity-related issues, assets may open a dedicated User Risk View, which differs from the standard inventories panels. In the Issues and Cases tables, such items can be identified by empty values in the following columns: Asset IDs, Target Agent Identifier, and Source Agent Identifier.
Endpoints Set the Scope by selecting one of the following:
- No endpoints: Defines access to no endpoints with no ability to view their related agent management and enterprise policies.
- All endpoints: Defines access to all endpoints with the ability to view their related agent management and enterprise policies. This configuration can impact the visibility of related Security domain Cases and Issues, but will not affect asset visibility.
- Select specific (at least one required): Defines specific access to all endpoint groups by selecting Endpoint Groups or all endpoint tags by selecting Endpoint Tags to view their related agent management and enterprise policies. This configuration can impact the visibility of related Security domain Cases and Issues, but will not affect asset visibility.
Datasets Rows Configure a
filterto define the specific subset of rows a user is allowed to access in each raw dataset. A raw dataset is every dataset where Palo Alto Networks data is ingested out-of-the-box or third-party data is ingested using a configured dedicated collector, also called a data source. This filter configuration does not impact the visibility of cases and issues.Follow these steps to configure a
filter:1. For datasets where no
filteris defined, determine how to set the When no filter is defined option as either:- No rows are accessible (default): Without a configured
filter, no rows are accessible. Users can query the datasets in Cortex Query Language (XQL) as they have access, but the results will be empty. - All rows are accessible: Without a configured
filter, all rows are accessible. Users can query the datasets in Cortex Query Language (XQL) as they have access, and view all results.
When defining a filter for row-level scoping on raw datasets, queries based on the Cortex Data Model (XDM) are not supported. XDM queries return specific rows only when All rows are accessible is selected, and no filter is defined in the Datasets Rows scoping area. Otherwise, no rows are returned.
2. Define any filters for the applicable datasets listed in the table:
- Scroll down the list of datasets to the dataset you want to apply a
filteron, and click the Edit Scope icon. In the Define what rows are accessible window, continue to write the query for the
filterin the query box (where the syntax is a limited subset of XQL) to limit the data rows for the selected dataset according to the access permissions you want the user to have. The beginning of the query is already defined before the query box, and there is no need to include this in your query.
ImportantFor optimal performance, we recommend using a single field in the
filterdefinition and simple comparison operators.Supported syntax:
Fields
You can define the rest of the
filterin the query box, where only the following system fields are supported:_broker_device_id,_broker_device_ip,_broker_device_name,_collector_id,_collector_ip,_collector_name,_collector_type,_device_id,_final_reporting_device_ip,_final_reporting_device_name,_log_type,_product,_scope,_reporting_device_ip,_reporting_device_name, and_vendor.For more information on these fields, see the table that describes all the fields in the
metrics_sourcedataset andmetrics_viewpreset in Overview of data ingestion metrics. For more information on the_scopefield (relevant when_scopeis defined in the Parsing Rule), see Scenario 3: Supported fields don't provide the necessary segmentation.Comparison operators
The following comparison operators are supported:
- Exact matches (
=,!=) - Comparing numerical values (
>,<,>=,<=) - Checking membership in lists (
in) - Querying arrays (
array_contains) - Partial matches (
contains,starts_with): Using this operator has additional performance overhead, and we recommend avoiding its use.
Example
If you only want a user to be able to access rows in the
pan_dds_rawdataset, when the_collector_nameisbu2_collector, you'd have to define thefilterin the query box as:_collector_name = “bu2_collector”
- Exact matches (
- (Optional) Set the Time frame for the query. The default is Last 1 day.
- (Optional) You can preview the query results displayed based on your defined query by clicking Preview. You can edit your query until you're satisfied with the output. By default, the query results are limited to 1000 records.
When you are finished, click Done.
The Scope field for the dataset that you added the filter on is updated with the query.
ExampleIn the above example, the Scope field displays
_collector_name = “bu2_collector”.
By default, Enable Scope Based Access Control is disabled in Settings → Configurations → General → Server Settings, and granular scoping is not enforced. Before enabling SBAC, we recommend that an administrator or a user with Access Management permissions first ensure that the users, user groups, and API Keys defined in Cortex XSIAM are granted the required access by assigning the relevant scopes. For more information, see Manage user scope.
- Click Generate to generate the API key.
-
Copy the generated API key and click Done.
You will not be able to view the API key again after you complete this step. Ensure that you copy the API key before closing the notification.
Actions available on API Keys
Below are some of the main pivot (right-click) options for actions available on each API key listed in the API Keys table. Only tasks that need further explanation are explained below.
| Action | Description |
|---|---|
| View Examples | Copies the Python 3 example, so you can edit it to set up your own API calls. |
| Copy text to clipboard / Copy entire row | Copies the value of an API setting, such as the ID, to the clipboard by right-clicking the setting and selecting Copy text to clipboard. You can copy all the settings of an API key by right-clicking and selecting Copy entire row. |
| Filter API keys | Filters the API keys by selecting one of the filter options, such as Show rows 30 days prior to.... You can then adjust the filter options to filter the API keys according to all the available fields. |
API enforcement for credentials
If an API key is assigned a role with Credentials set to None:
- Data access:
GETorListcalls to credential endpoints will fail. - Modification:
POST,PUT, orDELETEcalls to create or update credentials will fail. - Automation: Any scripts or external integrations using this API key to retrieve secrets from the credential store will return an unauthorized error.
Onboard Cortex XSIAM
How to onboard Cortex XSIAM
Onboarding aims to get you up and running as quickly as possible, driven by the need for rapid time-to-value (TTV), immediate risk reduction, and quick validation. Focus on the most essential components (such as core data sources and integrations), and install the XDR agent (subject to license) as the central sensor for visibility and prevention. This establishes the Cortex Extended Data Lake (XDL) as the central data repository, ensuring it is the single, intelligent source of truth powering all subsequent XQL queries, detection analytics, and automated case triage.
Plan and prepare
This stage includes how to plan and prepare the Cortex XSIAM environment.
Note
This topic does not include any specific Cloud Security requirements. If you have a Cortex XSIAM Premium license or another XSIAM license with Cloud Posture Security/Runtime addons, you should also plan and prepare Cloud Posture Security and Runtime during or after completing this stage. For more information about Cloud Security onboarding, see Cloud service provider onboarding.
Before you get started with Cortex XSIAM, consider the following:
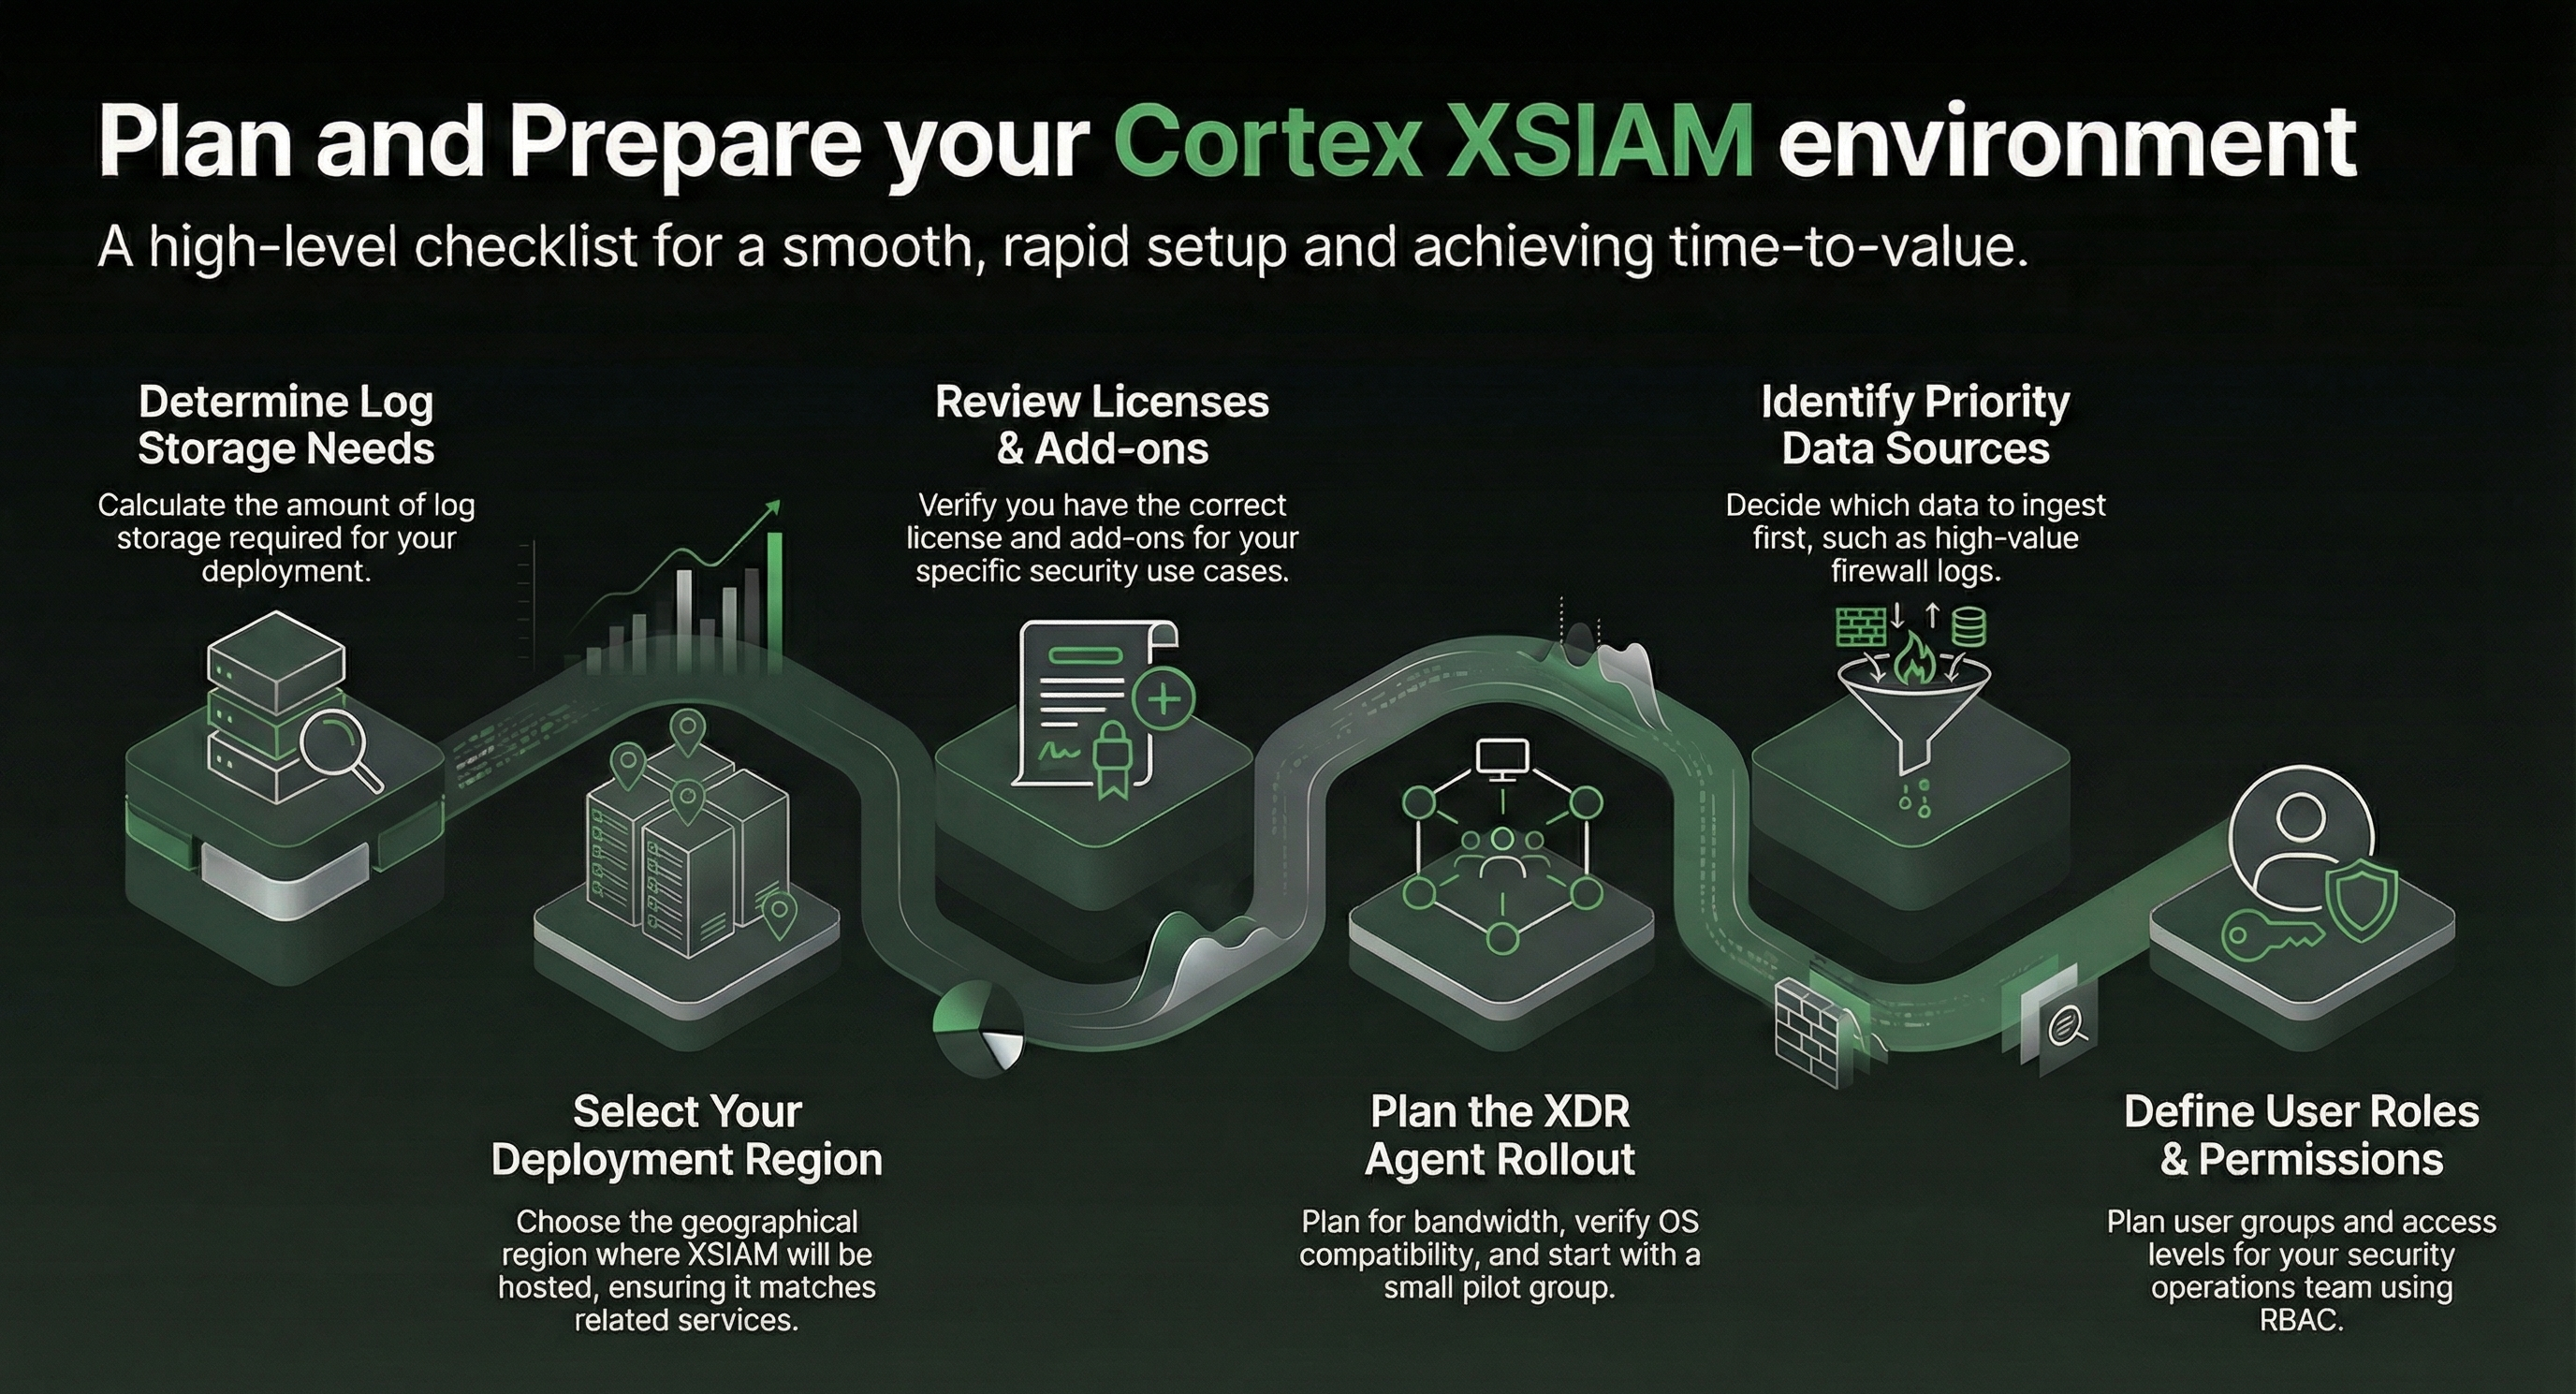
| Action | Details | See More |
|---|---|---|
| Determine the required Log storage | ✅ Determine the amount of log storage you need for your Cortex XSIAM deployment. Discuss with your partner or sales representative to determine whether to purchase additional storage within the Cortex XSIAM tenant. | Data storage lifecycle |
| Determine the deployment region | ✅ Determine the region you want to host Cortex XSIAM and any associated services, such as the Directory Sync Service. If you plan to stream data from a Strata Logging Service instance, it must be in the same region as Cortex XSIAM. | Cortex XSIAM supported regions |
| Review your license and add-ons | ✅ Review your Cortex XSIAM license and consider the addons for your use case, such as Advanced Email Security and Exposure management for complete security protection. | Cortex XSIAM product licenses |
| Plan the XDR Agent deployment | <p>✅ The XDR Agent is installed on endpoints for protection and extended detection and response (XDR). The data is collected into the Cortex XSIAM tenant.</p><div data-gb-custom-block data-tag="hint" data-style="info" class="hint hint-info"><p>The XDR agent is included with the Cortex XSIAM Premium and Enterprise licenses and any other XSIAM license with the Enterprise Runtime Security (XDR) add-on.</p></div><p>For Cortex XSIAM Premium or XSIAM licences with the Cloud Runtime Security add-on, the agent is also used to stop attacks running on workloads, including VMs, containers, Kubernetes, and serverless functions.</p><p>Consider the following:</p><p>✅ Determine the necessary bandwidth required to support the number of agents you plan to deploy.</p><p>✅ Verify endpoint operating systems and identify third-party security products to ensure they are compatible with Cortex XSIAM.</p><p>✅ Create a proof of concept (POC) that simulates your corporate production environment. After the successful completion of the initial POC, we recommend a phased rollout, which enables you to test the agent and its policies on a small scale before deploying them widely.</p> | <ul><li>Endpoint protection</li><li>Supported XDR Agent operating systems</li><li>Plan your agent deployment</li></ul> |
| Consider the data sources to use | <p>✅ Consider the data sources you want to initially ingest, such as Palo Alto Networks firewall/cloud logs, as they provide the most immediate security context and data for Cortex XSIAM's analytics.</p><p>In Cortex XSIAM, content is organized into content packs, which are either downloaded from the Data Sources catalog or from Marketplace. Start planning what content you require.</p><p>✅ Review the steps you need to take in your day-to-day SOC operations, and the required third-party tools/applications.</p> | What are Cortex XSIAM data sources? |
| Consider roles and permissions | ✅ Review and plan roles using Role-Based Access Control (RBAC) for your security operations team. Consider user groups and start with the default roles. | Set up users and roles |
Plan your agent deployment
You typically deploy Cortex XDR agent software to endpoints across a network after an initial proof of concept (POC), which simulates your corporate production environment. During the POC or deployment stage, you analyze security events to determine which are triggered by malicious activity and which are due to legitimate processes behaving in a risky or incorrect manner. You also simulate the number and types of endpoints, the user profiles, and the types of applications that run on the endpoints in your organization, and, according to these factors, you define, test, and adjust the security policy for your organization.
The goal of this multi-step process is to provide maximum protection to the organization without interfering with legitimate workflows.
After the successful completion of the initial POC, we recommend a multi-step implementation in the corporate production environment for the following reasons:
- The POC doesn't always reflect all the variables that exist in your production environment.
- There is a rare chance that the XDR agent will affect business applications, which can reveal vulnerabilities in the software as a prevented attack.
- During the POC, it is much easier to isolate issues that appear and provide a solution before full implementation in a large environment where issues could affect a large number of users.
A multi-step deployment approach ensures a smooth implementation and deployment of the Cortex XSIAM
Cortex XSIAM solution throughout your network. Use the following steps for better support and control over the added protection.
| Step | Duration | Plan |
|---|---|---|
| 1. Calculate the bandwidth required to support the number of agents you plan to deploy. | As needed | For every 100,000 agents, allocate 120 Mbps of bandwidth. The bandwidth requirement scales linearly. For example, to support 300,000 agents, plan to allocate 360 Mbps of bandwidth (three times the amount required for 100,000 agents). |
| 2. Set up Cortex XSIAM access services | 1 week | <p>If you have not done so already, set up the following:</p><ul><li>Firewall configuration: Enable access to Cortex XSIAM communication servers, storage buckets, and resources.</li><li>Required certificates to establish secure communication</li><li>Enable access for Windows CRL checks (Windows only)</li><li>Enable peer-to-peer content updates</li><li>Validate compatibility with third-party security products</li></ul> |
| 3. Install the Cortex XDR agent on a pilot group of endpoints | 1 week | <p>Install the Cortex XDR agent on a small number of endpoints (3 to 10).</p><p>Test the expected behavior of the Cortex XDR agents (collection and policy) and confirm that there is no change in the user experience.</p><p>Review Where can I install the cortex XDR agent for supported versions and operating systems.</p> |
| 4. Expand the Cortex XSIAM deployment. | 2 weeks | Gradually expand agent distribution to larger groups that have similar attributes (hardware, software, and users). At the end of two weeks, you can have Cortex XSIAM deployed on up to 100 endpoints. |
| 5. Complete the Cortex XSIAM installation. | 2 or more weeks | Broadly distribute the Cortex XDR agent throughout the organization until all endpoints are protected. |
| 6. Define corporate policy and protected processes. | Up to 1 week | Add protection rules for third-party or in-house applications and then test them. |
| 7. Refine corporate policy and protected processes. | Up to 1 week | Deploy security policy rules to a small number of endpoints that use the applications frequently. Fine-tune the policy as needed. |
| 8. Finalize corporate policy and protected processes. | A few minutes | Deploy protection rules globally. |
Deployment steps
While Cortex XSIAM is a unified platform, a successful deployment is rarely done all at once. Start with the essential, high-impact activities to get the core platform functional, endpoint protection up and running, and critical data sources feeding into the system quickly. Once you have completed these steps, set up the less critical but important features.
Cortex XSIAM onboarding checklist
Use this Cortex XSIAM onboarding checklist to plan, deploy, and configure your security operations environment. Complete activation, data source configuration, Cortex XDR agent deployment, and analytics setup.
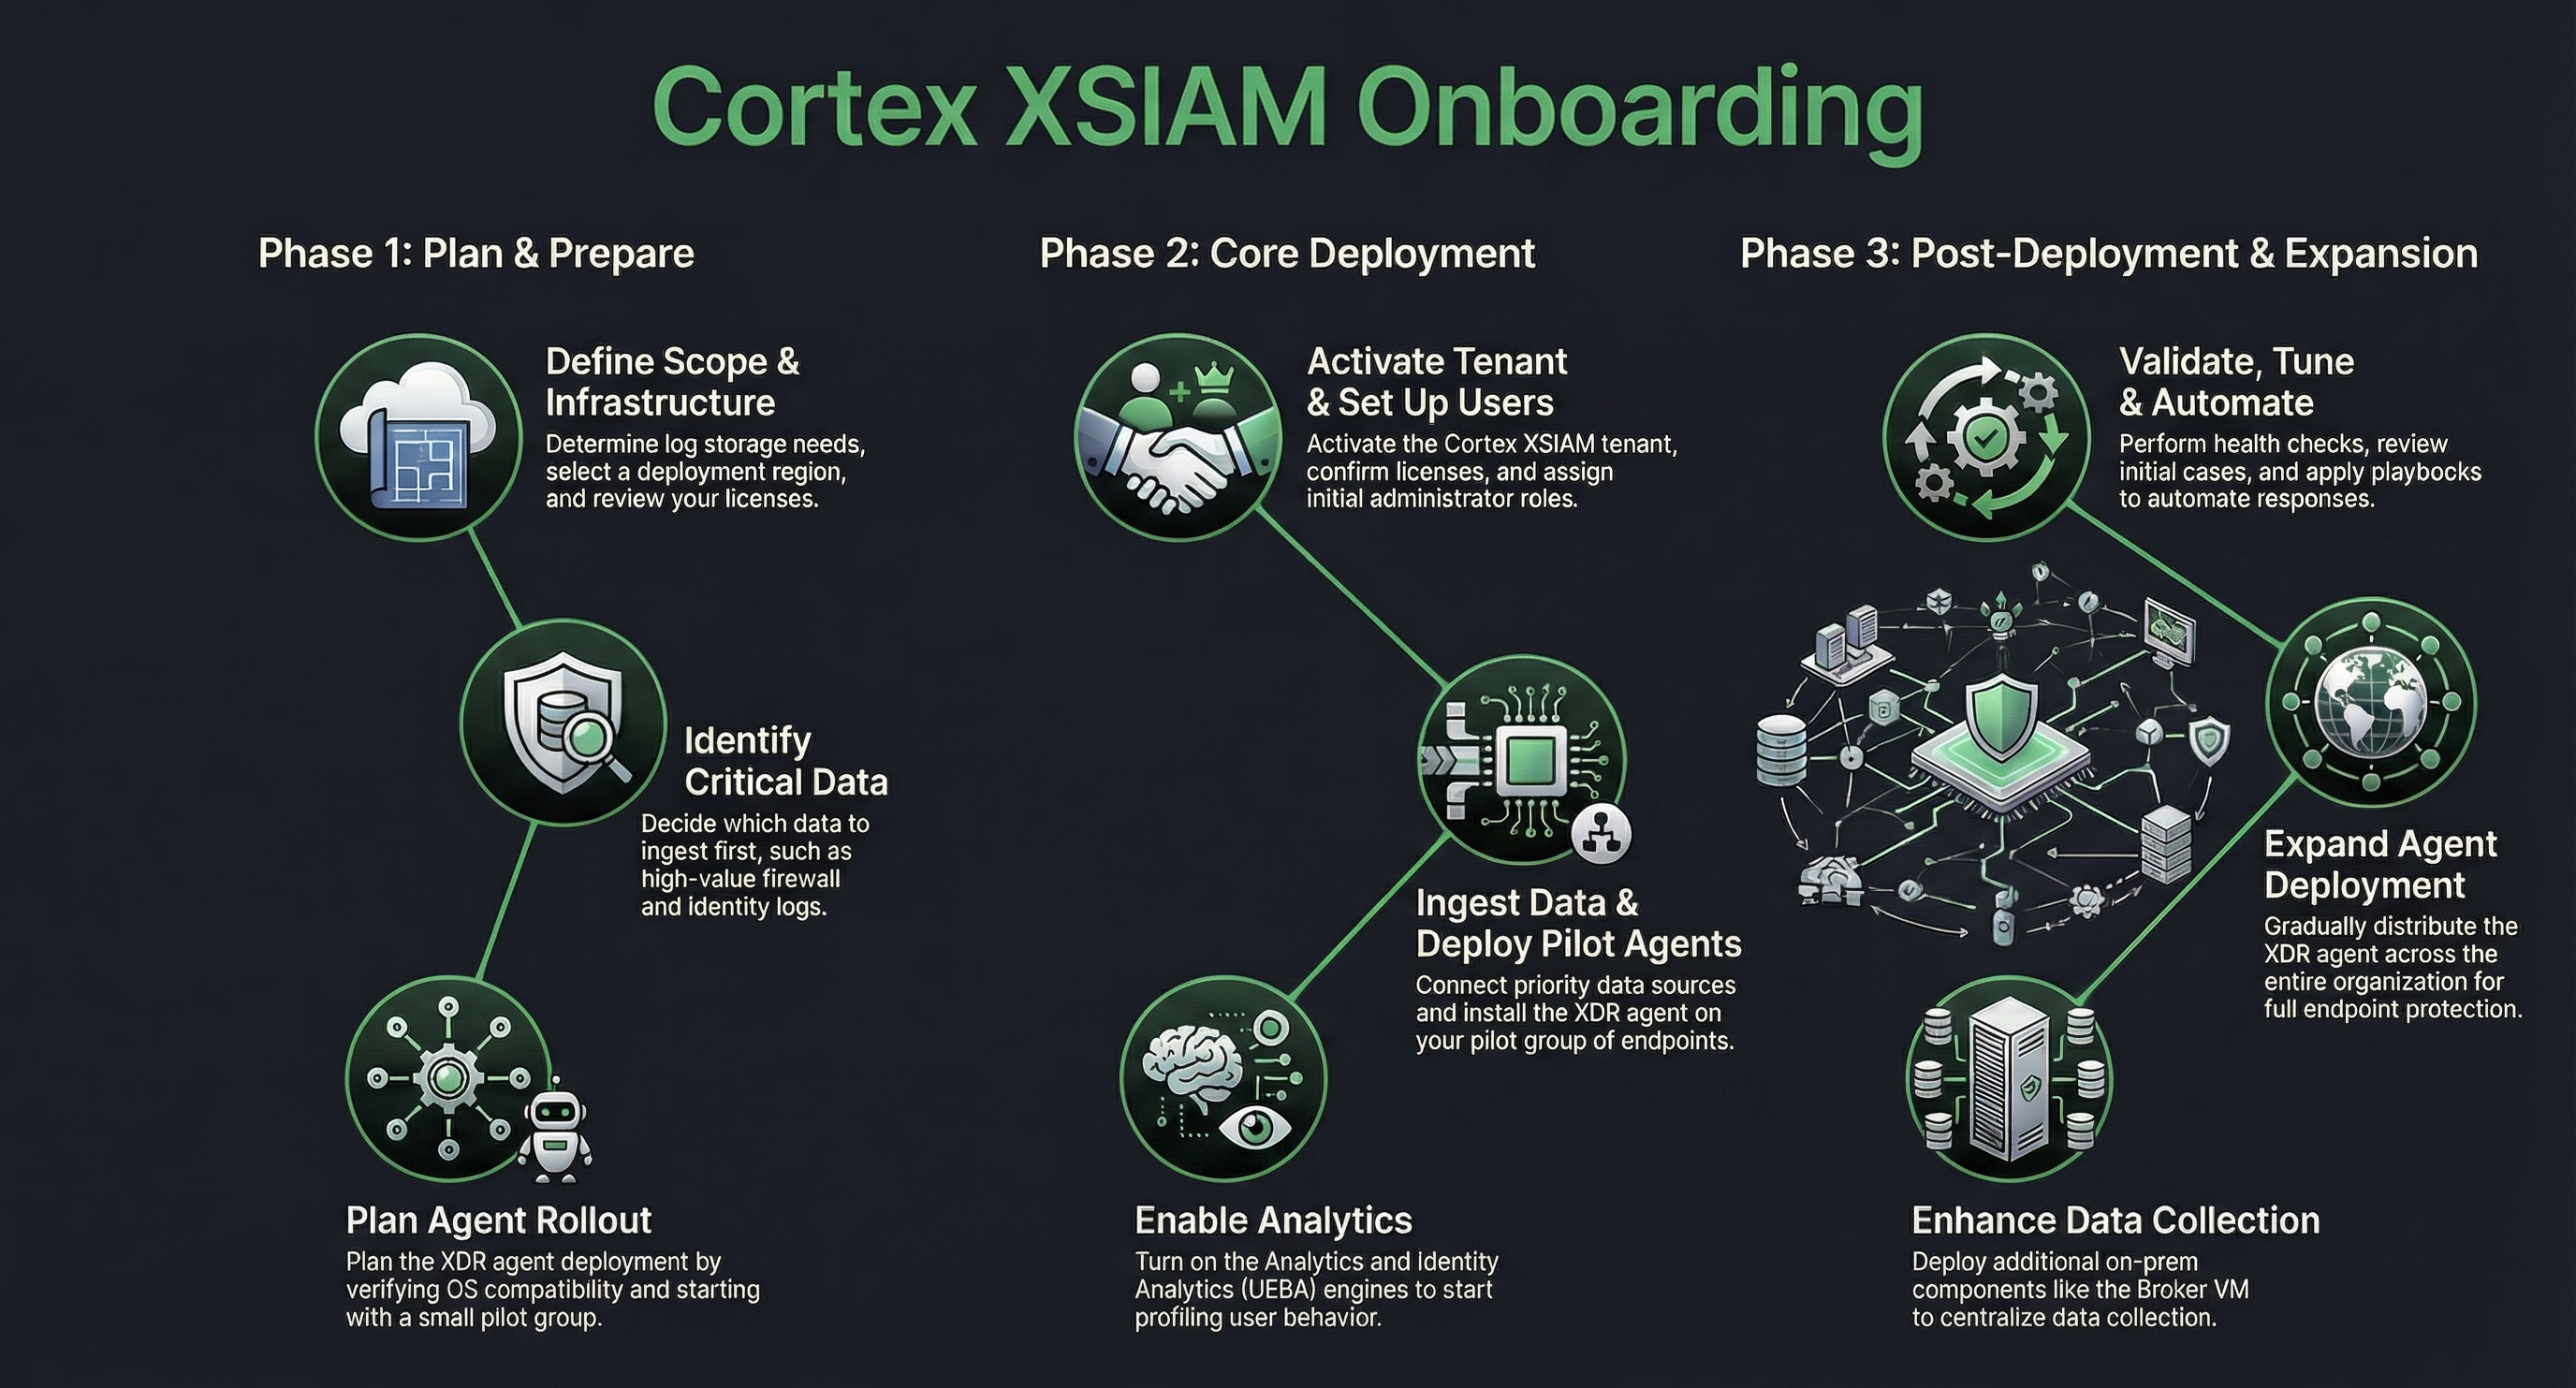
This checklist does not include any specific Cloud Security requirements. If you have a Cortex XSIAM Premium license or another XSIAM license with Cloud Posture Security/Runtime, you should also onboard Cloud Posture Security and Runtime during or after completing this stage. For more information about Cloud Security onboarding, see Cloud service provider (CSP) onboarding.
Cortex XSIAM deployment checklist
This deployment phase sets up Cortex XSIAM infrastructure, data pipelines, endpoint protection, and security analytics.
| Step | Details | See More |
|---|---|---|
| 1. Activation and initial setup | <p>✅ In the Cortex Gateway, activate Cortex XSIAM and confirm license status.</p><p>✅ Enable access to required PANW resources and set up encryption keys (BYOK), if required.</p><p>✅ Assign initial administrator and analyst-type user roles (Responder/Investigator), create user groups, and assign roles to those groups (recommended) to a limited number of users initially. You can update this later.</p><p>✅ Set up access through the Customer Support Portal or SAML single sign-on.</p> | <p>Activate Cortex XSIAM Enable access to required PANW resources Set up users and roles Set up authentication</p> |
| 2. Configure content | <p>Use the Data Sources Onboarding wizard to configure the following:</p><p>✅ Priority content:</p><ul><li>Configure network security data, such as Palo Alto Networks Next-Generation Firewalls, and network devices.</li><li>Configure identity and user data. Install the Cloud Identity Engine (optional and highly recommended), which provides the necessary Active Directory or Microsoft Entra ID/Okta context (user names, group membership, computer names) to map a raw event (for example, an IP address) to a user or asset.</li></ul><p>✅ Highly recommended content:</p><ul><li>Connect cloud audit logs for the most critical providers, such as AWS CloudTrail, Azure Activity Logs, and Google Cloud Audit Logs, directly to Cortex XSIAM.</li><li>Configure/enable a key Threat Intelligence feed, such as the Unit 42 Intelligence feed, to enrich incoming issues. This ensures that as soon as a log/alert hits the Data Lake, it has the latest malicious context.</li></ul> | <ul><li>What are Cortex XSIAM data sources?</li><li>Set up Cloud Identity Engine</li></ul> |
| 3. Deploy the XDR agent | <p>✅ Install the XDR agent by creating XDR Agent installation packages for a small, diverse pilot group of endpoints and deploy the agent to a pilot group (phased rollout). Start with small, low-risk endpoints and extend, as required. Gradually expand agent distribution to larger groups that have similar attributes (hardware, software, and users). At the end of two weeks, you can have Cortex XSIAM deployed on up to 100 endpoints.</p><p>✅ After testing expected agent behavior and performance, review and select default endpoint security profiles (Exploit, Malware, Restrictions, Agent Settings, Exceptions) to begin protecting your endpoints from threats immediately. Once endpoints are deployed and start collecting data, you can make any necessary adjustments to these rules and policies.</p><p>✅ Verify endpoint data collection (logs, alerts, events) is flowing from deployed agents to the XSIAM Data Lake. After deploying the agents to the pilot group, set up data collection to analyze the data.</p><p>This provides granular event data (process execution, file activity, registry changes, network connections) necessary for EDR/XDR detection and Behavioral Indicators of Compromise (BIOCs).</p> | <ul><li>Create an agent installation package</li><li>Set up endpoint profiles and exception rules</li><li>Set up agent settings profiles</li><li>Configure global agent settings</li></ul> |
| 4. Enable Analytics and Identity Analytics | <p>✅ Enable Cortex XSIAM Analytics engine (if not already enabled).</p><p>The analytics engine accesses your logs as they are streamed to Cortex XSIAM, including firewall data, and analyzes them as soon as they arrive.</p><div data-gb-custom-block data-tag="hint" data-style="info" class="hint hint-info"><p>You need EDR or network logs from at least 30 endpoints over a minimum of 2 weeks, or Cloud audit logs over a minimum of 2 weeks.</p></div><p>✅ Enable Identity Analytics, which focuses on user behavior that is critical since attackers primarily target credentials. It has two main functions:</p><ul><li>User/Entity Behavior Analytics (UEBA): Profiles users, hosts, and groups based on identity data and flags anomalies like a user logging in from a new country (Impossible Traveler), accessing an unusual database, or transferring a massive file volume outside of their norm.</li><li><p>Investigation context: When an issue fires, Identity Analytics ensures that the relevant user profile details, recent activities, and group membership are automatically aggregated and displayed with a user-based Analytics type issue and Analytics BIOC rule</p><div data-gb-custom-block data-tag="hint" data-style="info" class="hint hint-info"><p>The Cloud Identity Engine must be set up.</p></div></li></ul><p>✅ Enable the Identity Threat Detection and Response (ITDR) add-on (optional), which enhances the analytics baseline capabilities to include the Directory Infrastructure. This enables the detection of advanced attacks targeting Domain Controllers and other identity components.</p><p>In addition, the ITDR module integrates proactive capabilities by using attack surface management to identify and expose identity-related security flaws and vulnerabilities before they can be exploited.</p> | <ul><li>Enable the Analytics Engine and Identity Analytics</li><li>Identity Analytics</li><li>Identity Threat Detection and Response (ITDR)</li></ul> |
Your Cortex XSIAM is now operational and is collecting data.
Activate Cortex XSIAM
To activate a tenant, you need to log in to Cortex Gateway, a centralized portal for activating and managing tenants, users, roles, and user groups. After activating the tenant, you can then access the tenant. You must repeat this task for each tenant if you have multiple tenants. The activation process involves accessing Cortex Gateway, activating the tenant, and then accessing the tenant's resources.
Prerequisite
- The Cortex XSIAM activation email.
-
A Customer Support Portal (CSP) account.
You need to set up your CSP account. For more information, see How to Create Your CSP User Account.
When you create a CSP account, you can set up two-factor authentication (2FA) to log into the CSP by using an Email, Okta Verify, or Google Authenticator (non-FedRAMP accounts). For more information, see How to Enable a Third Party IdP.
-
You have one of the following roles assigned:
Role Description CSP role The Super User role is assigned to your CSP account. The user who creates the CSP account is granted the Super User role. Cortex role <p>You must have the Account Admin role.</p><p>If you are the first user to access Cortex Gateway with the CSP Super User role, you are automatically granted Account Admin permissions for the Cortex Gateway. You can also add Account Admin users as required.</p><p>In the Cortex Gateway, you can activate new tenants, access existing tenants, and create and manage role-based access control (RBAC) for all of your tenants.</p>
How to activate Cortex XSIAM
-
Log in to Cortex Gateway.
You can also access the link from the activation email.
-
Enter your username and password or multi-factor authentication (if set up) by using your Customer Support Portal account credentials to sign in.
After you sign in, you can view the following:
- If you are a CSP Account Admin, you can see tenants allocated to your CSP account and ready for activation. After activation, you cannot move your tenant to a different CSP account.
- Tenant details such as license type, number of endpoints, and purchase date.
- Tenants that were activated and are now available. If you have more than one Customer Support Portal account, the tenants are displayed according to the Customer Support Portal account name.
-
In the Available for Activation section, use the serial number to locate the tenant that needs activation, and then click Activate.
When you activate, a production tenant is activated first. After activation, you can set up a development tenant (subject to your license).
-
On the Tenant Activation page, define the following:
Parameter Description Tenant Name Enter the name of the tenant. Use a unique name across your company account up to 59 characters long. Region Geographic location where your tenant will be hosted. For more information about supported regions, see Cortex XSIAM supported regions. Tenant Subdomain <p>DNS record associated with your tenant. Enter a name that will be used to access the tenant directly using the full URL:</p><p> https://<subdomain>xdr.<region>.paloaltonetworks.com</p>Encryption Method <p>(Optional) If you want to bring your own keys for encrypting your data, under Advanced, select BYOK and follow the instructions of the wizard as detailed in Encryption Method.</p><ul><li><p>Default encryption (recommended)</p><p>All data stored by Cortex XSIAM is encrypted at rest using a dedicated key management system. Cortex XSIAM provides strict key access controls and auditing, and encrypts user data at rest according to AES-256 encryption standards. We recommend using this default system.</p></li><li><p>BYOK (Bring your own keys)</p><p>BYOK (Bring Your Own Keys) enables you to generate your own encryption keys and securely import and manage them via Cortex Gateway to retain greater control over your tenant data and encryption. This requires further setup.</p></li></ul> -
Review and agree to the terms and conditions of the Privacy policy, Terms of Use, and EULA , and then Activate your tenant.
Activation can take about an hour and does not require you to remain on the activation page. Cortex XSIAM sends a notification to your email when the process is complete.
- After activation, from the Cortex Gateway, in the Available Tenants, when hovering over the activated tenant, do the following:
- Ensure that you can successfully access the tenant by clicking the Cortex XSIAM tenant name (when the tenant is active).
-
In the dialog box, view the tenant status, region, serial number, and license details.
If you want to change your tenant's name, the subdomain, or activate a development tenant (subject to license), on the right-hand side, click the ellipsis.
You can only change the subdomain once, and it cannot be undone.
After deleting the subdomain, you can reuse it after 7 days.
- Enable and verify access to Cortex XSIAM communication servers, storage buckets, and various resources in your firewall configuration. For more information, see Enable access to required PANW resources.
Bring your own keys
What is Cortex BYOK?
Cortex self-managed BYOK (bring your own keys) offers a comprehensive data encryption solution, empowering enterprises to assert complete authority over their encryption key management, while ensuring platform reliability, availability, and responsiveness. It enables you to securely import and manage your own encryption keys via Cortex Gateway. This provides you with enhanced control over your tenant data encryption and accessibility, eliminates reliance on default CSP encryption or third-party key management, and enables you to comply with stringent regulatory requirements.
Unlike self-hosted solutions, Cortex BYOK minimizes exposure to external risks, such as downtime, breaches, or operational disruptions, by reducing dependency on external environments, ensuring availability and responsiveness of your Cortex products.
By default, Google Cloud encrypts customer data at rest using envelope encryption, where randomly generated Data Encryption Keys (DEKs) encrypt the data, and Google-managed Key Encryption Keys (KEKs) wrap the DEKs, all protected within Google's multi-layered key hierarchy. Cortex BYOK enhances this model by allowing customers to generate and supply their own KEK, which is securely imported into PANW's tenant-specific Key Management Service (KMS) environment on Google Cloud. The customer-provided KEK is used to encrypt the DEKs that protect tenant data, giving customers control over key management through the Cortex Gateway. While PANW securely manages encryption operations within its cloud environment, customers retain authority over the KEK, achieving greater control and auditability.
Cortex BYOK architecture
Cortex BYOK leverages a dedicated Key Management Service (KMS) deployed per tenant within PANW's GCP-based infrastructure. Each tenant has its own isolated KMS instance, ensuring complete separation of key material.
In multitenant environments, each tenant has its own isolated KMS instance and keys, and each one is managed independently.
Two separate keys are used for encrypting tenant data: one for the Data lake BigQuery and another for other services.
Security measures
Cortex BYOK ensures key material is wrapped for protection in transit, and access to the wrapping key is limited solely to the scope of the import job.
The key material is unwrapped solely within the tenant’s KMS using the import job's private key and is inserted as a new version of the target key on the target key ring through an atomic operation. This ensures that no key material is left exposed or in an untrusted state, keeping it secure and preventing potential vulnerabilities, while maintaining its integrity and consistency.
Cortex also provides detailed audit logs within the tenant on all key management operations.
Email notifications are sent for any key management operations, allowing tenant administrators to monitor and review all activities and detect and mitigate any unauthorized access attempts.
BYOK key management operations
BYOK supports the following key management operations. Cortex XSIAM provides detailed audit logs and email notifications on all key management operations.
Set up new tenant with BYOK
Generate your own encryption keys and import them via Cortex Gateway to retain greater control over your tenant data and encryption. This control enables you to implement customized security measures tailored to your organization’s needs and compliance requirements for encrypting your tenant data at rest.
Cortex BYOK uses two keys for encrypting your tenant data at rest: one for the Data lake BigQuery and another for all other tenant services. You can generate a single key for both or create two separate keys.
-
If you're doing the activation for the first time, in the Cortex Gateway, follow the Tenant Activation wizard. In Tenant Activation → Define Tenant Settings, under Advanced, select BYOK (Bring Your Own Keys) and click Create Tenant and Set Up Keys.
The tenant is now initialized, which may take a few minutes. You can set up your keys now, or return at a later stage and click Set Up Encryption Keys next to the tenant in the gateway to continue the process.
-
If you've already started the activation process and paused, locate your tenant in the Available Tenants list in the Cortex gateway, click Set Up Encryption Keys next to your tenant and set up your keys.
Rotate encryption keys
To rotate your encryption keys, in the Cortex gateway, open the More options menu next to the tenant, select Rotate Encryption Key, and follow the Bring your own keys (BYOK) setup.
To resume the process, in the main gateway, open the more options menu next to the tenant, select Continue Rotation, and follow the Bring your own keys (BYOK) setup.
As long as the rotation hasn't been completed, you can cancel the rotation process from the three-dot menu next to the tenant.
The new keys you import will serve as primary encryption keys for newly generated data.
For BYOK key rotation, you can select your preferred key import method, replacing the previously fixed default RSA_OAEP_3072_SHA256.
The new recommended default is RSA_OAEP_3072_SHA256_AES_256. To use the previous default method, select it manually.
Disable encryption keys
To disable your encryption keys, in the main gateway, open the three dot menu next to the tenant, select Disable All Keys & Deactivate Tenant.
PREREQUISITE:
To disable your encryption keys and deactivate a tenant, you must have an Account Admin role.
CAUTION:
Disabling all encryption keys and deactivating the tenant renders the tenant inaccessible and non-operational.
Disabling the keys affects communication with the agents, may prevent the agents from receiving updates to policies, configurations, and crucial information, and may result in loss of data.
To secure your tenant data and to prevent unauthorized access, re-enabling the keys and re-activating the tenant are strictly controlled and require manual intervention by the Cortex XSIAM Customer Success team.
To import a new encryption key, whether for initial tenant setup or key rotation, use the Bring your own keys (BYOK) setup.
Bring your own keys (BYOK) setup
Cortex BYOK uses two keys for encrypting your data at rest. One key is for the Data lake and the other is for all the other services within the tenant. You can generate a single key for both or create two separate keys for each service.
You can select your preferred key wrapping algorithm to meet regulatory or compliance requirements.
After completing the process, the imported keys become the primary keys used for encrypting any newly generated data stored within the tenant.
Import new keys for encrypting your tenant data at rest:
-
The Generate Key screen helps you generate an encryption key.
Generate a key that meets these requirements using your preferred method or use the provided OpenSSL command:
When your encryption key is ready, select I have a 32-byte symmetric encryption key ready and click Next.
-
In the Wrap & Upload screen, repeat the following procedure for both Data lake wrapping key and Services wrapping key.
-
Select your import method and download the wrapping key. You can only select your import method the first time you download your key.
Available import methods are:
- RSA_OAEP_3072_SHA256_AES_256 (default)
- RSA_OAEP_4096_SHA256_AES_256
- RSA_OAEP_3072_SHA256
- RSA_OAEP_4096_SHA256
The wrapping key is valid for up to three days. After three days, you need to download a new wrapping key.
- Use an OpenSSL editor to wrap your encryption key using the following procedure:
-
For RSA_OAEP_3072_SHA256 and RSA_OAEP_4096_SHA256:
Wrap the target key using the wrapping public key:
openssl pkeyutl \ -encrypt \ -pubin \ -inkey <full path to the public wrapping key file that ends with .pem> \ -in <full path to your target encryption key> \ -out <full path where you want to save the wrapped target key that is ready for import> \ -pkeyopt rsa_padding_mode:oaep \ -pkeyopt rsa_oaep_md:sha256 \ -pkeyopt rsa_mgf1_md:sha256
-
For RSA_OAEP_3072_SHA256_AES_256 and RSA_OAEP_4096_SHA256_AES_256:
- Patch and recompile OpenSSL. For more details, see Configuring Open SSL for manual key wrapping.
-
Generate a temporary random AES key:
openssl rand 32 > <full path where you want to save the temporary AES key>
-
Wrap the temporary AES key with the wrapping public key:
openssl pkeyutl \ -encrypt \ -pubin \ -inkey <full path to the public wrapping key file that ends with .pem> \ -in <full path to your temporary AES key> \ -out <full path where you want to save the wrapped key> \ -pkeyopt rsa_padding_mode:oaep \ -pkeyopt rsa_oaep_md:sha256 \ -pkeyopt rsa_mgf1_md:sha256
-
Wrap the target key with the temporary AES key and append it to the wrapped key:
"<full path to your patched and recompiled (OpenSSL) openssl.sh script>" enc \ -id-aes256-wrap-pad \ -iv A65959A6 \ -K $( hexdump -v -e '/1 "%02x"' < "<full path to your temporary AES key> " ) \ -in "<full path to your target encryption key>" >> " <full path to the wrapped key that is now ready for import>"
-
- Upload the wrapped key and click Complete Activation.
-
Cortex XSIAM supported regions and data residency
View the supported Cortex XSIAM hosting regions for tenant deployment and data residency. The following tables list regions for Cortex XSIAM and associated Cortex services.
Cortex XSIAM regions in the Americas
| Country | Description |
|---|---|
| US (United States) | All Cortex XSIAM logs and ingested data remain hosted within the boundaries of the United States. |
| Brazil (BR) | All Cortex XSIAM logs and ingested data remain hosted within the boundaries of Brazil. |
| Canada (CA) | <p>All Cortex XSIAM logs and ingested data remain hosted within the boundaries of Canada. However, if you have a WildFire Canada cloud subscription, consider the following:</p><ul><li>You cannot send file submissions for bare-metal analysis.</li><li>You will not be protected against macOS-borne zero-day threats. However, you will receive protection against other macOS malware in regular WildFire updates.</li></ul> |
Cortex XSIAM regions in EMEA
| Country | Description |
|---|---|
| Finland (FI) | All Cortex XSIAM logs and ingested data remain hosted within the boundaries of Finland. |
| France (FA) | All Cortex XSIAM logs and ingested data remain hosted within the boundaries of France. |
| Germany (DE) | All Cortex XSIAM logs and ingested data remain hosted within the boundaries of Germany. |
| Israel (IL) | All Cortex XSIAM logs and ingested data remain hosted within the boundaries of Israel. |
| Italy (IT) | All Cortex XSIAM logs and ingested data remain hosted within the boundaries of Italy. |
| Netherlands | All Cortex XSIAM logs and ingested data remain hosted within the boundaries of Netherlands. |
| Poland (PL) | All Cortex XSIAM logs and ingested data remain hosted within the boundaries of Poland. |
| Qatar (QT) | All Cortex XSIAM logs and ingested data remain hosted within the boundaries of Qatar. |
| Saudi Arabia (SA) | All Cortex XSIAM logs and ingested data remain hosted within the boundaries of Saudi Arabia. |
| South Africa (ZA) | All Cortex XSIAM logs and ingested data remain hosted within the boundaries of South Africa. |
| Spain (ES) | All Cortex XSIAM logs and ingested data remain hosted within the boundaries of Spain. |
| Switzerland (CH) | All Cortex XSIAM logs and ingested data remain hosted within the boundaries of Switzerland. |
| UK (United Kingdom) | All Cortex XSIAM logs and ingested data remain hosted within the boundaries of the United Kingdom. |
Cortex XSIAM regions in JPAC
| Country | Description |
|---|---|
| Australia (AU) | All Cortex XSIAM logs and ingested data remain hosted within the boundaries of Australia. |
| Delhi (DL) | All Cortex XSIAM logs and ingested data remain hosted within the boundaries of Delhi. |
| India (IN) | All Cortex XSIAM logs and ingested data remain hosted within the boundaries of India. |
| Indonesia (ID) | All Cortex XSIAM logs and ingested data remain hosted within the boundaries of Indonesia. |
| Japan (JP) | All Cortex XSIAM logs and ingested data remain hosted within the boundaries of Japan. |
| Singapore (SG) | All Cortex XSIAM logs and ingested data remain hosted within the boundaries of Singapore. |
| South Korea (KR) | All Cortex XSIAM logs and ingested data remain hosted within the boundaries of South Korea. |
| Taiwan (TW) | All Cortex XSIAM logs and ingested data remain hosted within the boundaries of Taiwan. |
Enable access to required PANW resources
After you receive your account details, enable and verify access to Cortex XSIAM communication servers, storage buckets, and other resources in your firewall configuration.
Some required IP addresses are registered in the United States. GeoIP databases might not identify their actual usage location. Customer data remains in your deployment region. Data transmission stays restricted to that region.
Before configuring your firewall, review these guidelines:
- Palo Alto Networks App-IDs (firewall policy): If you are using a Palo Alto Networks Firewall, you can simplify your configuration by using App-IDs. If you add the specific App-IDs (for example,
cortex-xdr,traps-management-service) to your firewall security policy, you do not need to allow specific IP addresses listed below manually - App-ID limitations: A dash (—) indicates there is no App-ID coverage for a specific resource. For these rows, you must configure your firewall to allow access based on the IP address and port.
- Rule direction: Enable access from the Cortex XDR Agent to the tenant (outbound); this traffic does not need to be bidirectional.
- Google Cloud Platform (GCP): For resources listing IP ranges in the GCP, go to the official JSON feeds for the specific IP addresses required for your deployment:
- Global subnets: https://www.gstatic.com/ipranges/goog.json
- Regional ranges: https://www.gstatic.com/ipranges/cloud.json
- SSL decryption: If you use SSL decryption and experience difficulty connecting the Cortex XDR agent to the server, we recommend that you add the FQDNs required for access to your SSL Decryption Exclusion list in Device → Certificate Management → SSL Decryption Exclusion.
<tenant-name> refers to the selected subdomain of your Cortex XSIAM tenant, and <region> is the region in which your tenant is deployed. For more information, see Cortex XSIAM supported regions.
The following tables list required FQDNs, IP addresses, ports, and App-ID coverage for your deployment.
| FQDN | IP Addresses and Port | App-ID Coverage |
|---|---|---|
Used to send data from external services and systems to the Cortex tenant. | IP address by region:
| cortex-xdr |
Used for the first request in registration flow where the agent passes the distribution id and obtains the |
| traps-management-service |
Used in live terminal flow. | IP address by region:
| cortex-xdr |
Used to download installers for upgrade actions from the server. This storage bucket is used for all regions. |
| cortex-xdr |
Used to download the executable for the live terminal for XDR agents earlier than version 7.1.0. This storage bucket is used for all regions. |
| cortex-xdr |
Used to download content updates. |
| cortex-xdr |
Used to download extended verdict request results in scanning. |
| cortex-xdr |
Used to download the Kubernetes image from the registry for Kubernetes agents installation. Refer to Regional Docker registry mapping for your specific tenant location and corresponding Docker registry URL. |
| |
| Regional Docker registry mapping | ||
| Tenant location | GCP region | Registry URL |
UK Netherlands (EU) United States (US) Canada (CA) South Korea (KR) Singapore (SG) Australia (AU) Japan (JP) India (IN) Germany (DE) France (FR) | europe-west2 europe-west4 us-central1 northamerica-northeast1 asia-northeast3 asia-southeast1 australia-southeast1 asia-northeast1 asia-south1 europe-west3 europe-west9 | europe-west2-docker.pkg.dev europe-west4-docker.pkg.dev us-central1-docker.pkg.dev northamerica-northeast1-docker.pkg.dev asia-northeast3-docker.pkg.dev asia-southeast1-docker.pkg.dev australia-southeast1-docker.pkg.dev asia-northeast1-docker.pkg.dev asia-south1-docker.pkg.dev europe-west3-docker.pkg.dev europe-west9-docker.pkg.dev |
Used for EDR data upload. | IP address by region:
| traps-management-service |
Used for all other requests between the agent and its tenant server, including heartbeat, uploads, action results, and scan reports. | IP address by region:
| traps-management-service |
Used for API requests and responses and to connect to an engine. | IP address by region:
| — |
Used for get-verdict requests. For agents on endpoints, you must allow the IP address for the closest region to ensure connectivity. Endpoints use latency-based routing. An agent that belongs to a US tenant, for example, but that is physically located in Singapore, routes to Singapore to get the verdict. | IP address by region:
| traps-management-service |
Used to download the IOC indicators from the tenant. | IP address by region:
| cortex-xdr |
Broker VM Resources Required for deployments that use Broker VM features | ||
xdr-ova-installers-prod-us.storage.googleapis.com Used to download Broker VM images from the server. This storage bucket is used for all regions. |
| cortex-xdr |
br-<tenant-name>.xdr.<region>.paloaltonetworks.com | IP address by region:
| — |
distributions.traps.paloaltonetworks.com |
| traps-management-service |
| UDP port: 123 | — |
| App Login and Authentication | ||
identity.paloaltonetworks.com (SSO) |
| — |
login.paloaltonetworks.com (SSO) |
| — |
| In-App Help Center and Notifications | ||
| data.pendo.io | Port: 443 | — |
| pendo-static-5664029141630976.storage.googleapis.com | Port: 443 | — |
| Email Notifications | ||
| — | IP address for all regions: 159.183.150.248 | — |
Ingress These IPs are used for communication between Cortex XSIAM and your resources. Use them when sending data out from your tenant. | ||
| cortex-xdr | |
| Egress IP addresses Used for traffic from the Cortex tenant to external services and systems. Add the relevant IP addresses from this list to your allow lists for your external services and systems. | ||
IP addresses by region
| — | |
| Collect third-party data from your SaaS and Cloud resources | ||
| — | IP address by region.
| cortex-xdr |
| Log Forwarding to a Syslog Receiver | ||
| See Integrate a syslog receiver. |
Cortex XSIAM regional egress resources
Use these Cortex XSIAM regional egress resources to configure firewall allowlists for your deployment region. They support agent-to-tenant communication for API access, heartbeats, Live Terminal, and EDR data uploads.
The following table describes the service definition, FQDNs, and App-ID coverage for your deployment. Unless specified, all ports are 443 (TCP). Select your region and allow outbound traffic to the corresponding FQDNs and IPs.
Cortex XSIAM egress service definitions
| Service Definition | FQDN | APP-ID |
|---|---|---|
Egress tenant Connects to the Cortex XSIAM tenant. | <tenant-name>.xdr.<region>.paloaltonetworks.com | cortex-xdr |
Live Terminal Used in live terminal flow for real-time shell sessions |
| cortex-xdr |
Endpoint Detection and Response (EDR) Used for EDR data upload. Includes telemetry logs, process executions, and security events that the Cortex XDR agent captures and sends to the cloud for analysis | dc-<tenant-name>.traps.paloaltonetworks.com | traps-management-service |
Heartbeat Used for all other requests between the XDR agent and the tenant, including heartbeat, uploads, action results, and scan reports. | ch-<tenant-name>.traps.paloaltonetworks.com | traps-management-service |
API Access Used for API requests and responses and to connect to an engine. | api-<tenant-name>.xdr.<region>.paloaltonetworks.com | N/a |
Indicator Used to download the IOC indicators from the tenant. Downloading lists of bad IPs, domains, or hashes to block locally. | xdr-<region>-<project ID>-tim-indicators.storage.googleapis.com | traps-management-service |
Verdict requests Used for get-verdict requests. For example, checking if a specific file hash is known to be malware. | cc-<tenant-name>.traps.paloaltonetworks.com | traps-management-service |
Broker VM Connection for the Broker VM | br-<tenant-name>.xdr.<region>.paloaltonetworks.com | N/a |
The following tables list the required resources by region. Unless specified, all ports are 443 (TCP).
Cortex XSIAM egress IP addresses in the Americas
| Region | Egress (tenant) | Live Terminal | EDR & Heartbeat | API Access | Indicator & Verdict requests | Broker VM |
|---|---|---|---|---|---|---|
| United States (US) | 35.244.250.18 | 35.190.88.43 | 34.98.77.231 | 35.222.81.194 | 35.224.140.142 | 104.155.131.72 |
| Brazil (BR) | 34.96.83.202 | 34.151.236.197 | 136.110.146.246 | 34.39.136.78 | 34.39.195.104 | 35.198.38.182 |
| Canada (CA) | 34.120.31.199 | 35.203.99.74 | 34.96.120.25 | 35.203.82.121 | 35.203.35.23 | 34.95.8.232 |
Cortex XSIAM egress IP addresses in EMEA
| Region | Egress (tenant) | Live Terminal | EDR & Heartbeat | API Access | Indicator & Verdict request | Broker VM |
|---|---|---|---|---|---|---|
| France (FA) | 34.111.134.57 | 34.163.57.57 | 34.36.155.211 | 34.155.222.152 | 34.155.110.169 | 34.155.90.61 |
| Germany (DE) | 34.98.68.183 | 34.107.61.141 | 34.107.161.143 | 34.107.57.23 | 35.242.201.199 | 35.198.112.13 |
| Israel (IL) | 34.111.129.144 | 34.165.43.106 | 34.128.157.130 | 34.165.156.139 | 34.165.2.110 | 34.165.24.222 |
| Italy (IT) | 34.8.224.70 | 34.154.154.5 | 34.8.234.58 | 34.154.195.120 | 34.154.230.76 | 34.154.168.139 |
| <p>Netherlands/</p><p>Europe (EU)</p> | 35.227.237.180 | 35.244.251.25 | 34.102.140.103 | 34.90.67.58 | 34.90.71.103 | 34.91.128.226 |
| Poland (PL) | 34.117.240.208 | 34.118.62.80 | 35.190.13.237 | 34.116.216.55 | 34.116.213.71 | 34.116.176.97 |
| Qatar (QT) | 35.190.0.180 | 34.18.34.73 | 34.107.129.254 | 34.18.46.240 | 34.18.53.229 | 34.18.37.73 |
| Saudi Arabia (SA) | 35.244.157.127 | 34.166.54.6 | 34.107.213.85 | 34.166.58.79 | 34.166.53.160 | 34.166.55.153 |
| South Africa (ZA) | 34.149.165.12 | 34.35.56.170 | 35.190.79.68 | 34.35.64.191 | 34.35.13.198 | 34.35.45.251 |
| Spain (ES) | 34.111.188.248 | 34.175.18.78 | 34.120.102.147 | 34.175.30.176 | 34.175.205.166 | 34.175.182.55 |
| Switzerland (CH) | 34.111.6.153 | 34.65.213.226 | 34.149.180.250 | 34.65.248.119 | 34.65.137.215 | 34.65.51.103 |
| United Kingdom (UK) | 34.120.87.77 | 35.242.159.176 | 35.244.133.254 | 34.89.56.78 | 34.89.42.214 | 35.197.219.110 |
| Finland (FI) | 34.160.63.63 | 34.88.31.230 | 136.110.165.34 | 35.228.73.215 | 35.228.118.177 |
Cortex XSIAM egress IP addresses in JPAC
| Region | Egress (tenant) | Live Terminal | EDR & Heartbeat | API Access | Indicator & Verdict Requests | Broker VM |
|---|---|---|---|---|---|---|
| Australia (AU) | 34.120.229.65 | 35.244.66.177 | 34.102.237.151 | 35.189.18.208 | 35.201.23.188 | 35.244.93.0 |
| Delhi (DL) | 34.8.67.192 | 34.131.116.135 | 136.110.132.208 | 34.131.165.103 | 34.131.47.126 | 34.131.131.141 |
| India (IN) | 35.186.207.80 | 35.200.146.253 | 34.120.213.187 | 35.200.158.164 | 35.244.57.196 | 35.200.234.99 |
| Indonesia (ID) | 34.111.58.152 | 34.101.214.157 | 34.128.156.84 | 34.128.115.238 | 34.101.155.198 | 34.101.101.170 |
| Japan (JP) | 35.241.28.254 | 34.84.201.32 | 34.95.66.187 | 34.84.125.129 | 34.84.225.105 | 34.85.74.43 |
| Singapore (SG) | 34.117.211.129 | 34.87.61.186 | 34.120.142.18 | 34.87.83.144 | 35.247.161.94 | 34.87.167.125 |
| South Korea (KR) | 34.54.5.247 | 34.22.66.91 | 34.54.155.245 | 34.64.54.175 | 34.64.228.117 | 34.64.46.249 |
| Taiwan (TW) | 34.160.28.41 | 34.80.34.30 | 34.149.248.76 | 35.234.8.249 | 35.229.186.216 | 34.80.230.166 |
Cortex XSIAM engine outbound IP addresses
Use these Cortex XSIAM engine outbound IP addresses to configure firewall allowlists by deployment region. Automation playbooks and scripts use these IPs to access on-premises resources, such as Active Directory or internal GitLab.
APP-ID: None
Cortex XSIAM engine IP addresses in the Americas
| Region | IP Addresses |
|---|---|
| United States (US) | 35.225.156.101, 34.69.88.119 |
| Canada (CA) | 35.203.57.162, 35.203.90.79 |
Cortex XSIAM engine IP addresses in EMEA
| Region | IP Addresses |
|---|---|
| France (FA) | 34.155.197.131, 34.155.5.100 |
| Germany (DE) | 34.107.83.197, 34.159.53.97 |
| Israel (IL) | 34.165.46.47, 34.165.17.246 |
| Italy (IT) | 34.154.173.134, 34.154.229.60 |
| <p>Netherlands/</p><p>Europe (EU)</p> | 34.147.67.188, 34.90.16.31 |
| Poland (PL) | 34.118.92.214, 34.116.223.119 |
| Qatar (QT) | 34.18.39.0, 34.18.32.96 |
| Saudi Arabia (SA) | 34.166.58.243, 34.166.54.238 |
| South Africa (ZA) | 34.35.70.193, 34.35.80.189 |
| Spain (ES) | 34.175.255.99, 34.175.230.35 |
| Switzerland (CH) | 34.65.222.25, 34.65.233.60 |
| United Kingdom (UK) | 34.142.3.42, 34.142.44.136 |
| Finland (FI) | 35.228.175.228, 35.228.44.44 |
Cortex XSIAM engine IP addresses in JPAC
| Region | IP Addresses |
|---|---|
| Australia (AU) | 35.244.73.76, 35.201.22.63 |
| India (IN) | 35.244.5.205, 34.93.118.113 |
| Indonesia (ID) | 34.101.125.66, 34.101.218.184 |
| Japan (JP) | 34.146.60.215, 34.84.93.160 |
| Singapore (SG) | 35.240.144.192, 35.240.255.15 |
| South Korea (KR) | 34.64.189.205, 34.64.45.118 |
| Taiwan (TW) | 104.199.223.229, 34.81.38.132 |
Cortex XSIAM inbound source IP addresses
Use these Cortex XSIAM inbound source IP addresses to configure firewall allowlists by deployment region. They support inbound communication with Broker VM and syslog resources, plus data collection from SaaS and cloud environments.
Configure your firewall (and relevant receivers) to allow inbound traffic from these Source IPs.
Cortex XSIAM inbound service definitions
- Infrastructure: Communication to your on-premise resources (for example, Broker VM, Syslog)
- Data collection: Traffic from Cortex XSIAM to your network to collect data.
- App-ID:
cortex-xdr
Cortex XSIAM inbound IP addresses in the Americas
| Region | Infrastructure IP Addresses (allow inbound) | Data Collection IP Addresses (allow inbound) |
|---|---|---|
| United States (US) | 34.132.108.184, 34.69.63.16 | 34.66.69.154, 35.202.21.123 |
| Canada (CA) | 35.203.108.13, 35.203.101.162 | 34.95.33.72, 34.95.62.136 |
Cortex XSIAM inbound IP addresses in EMEA
| Region | Infrastructure IP Addresses (allow inbound) | Data Collection IP Addresses (allow inbound) |
|---|---|---|
| France (FA) | 34.155.5.117, 34.155.41.247 | 34.163.125.167, 34.163.155.105 |
| Germany (DE) | 35.234.118.195, 34.89.183.45 | 34.89.197.46, 34.107.3.224 |
| Israel (IL) | 34.165.33.165, 34.165.27.131 | 34.165.131.171, 34.165.120.206 |
| Italy (IT) | 34.154.23.156, 34.154.186.12 | 34.154.208.247, 34.154.243.11 |
| <p>Netherlands/</p><p>Europe (EU)</p> | 34.147.107.51, 34.91.26.125 | 34.90.70.107, 35.204.129.196 |
| Poland (PL) | 34.118.48.171, 34.116.202.235 | 34.118.71.237, 34.118.124.130 |
| Qatar (QT) | 34.18.34.118, 34.18.39.155 | 34.18.44.71, 34.18.30.132 |
| Saudi Arabia (SA) | 34.166.61.81, 34.166.58.213 | 34.166.59.20, 34.166.53.242 |
| South Africa (ZA) | 34.35.42.196, 34.35.79.219 | 34.35.69.156, 34.35.60.86 |
| Spain (ES) | 34.175.46.46, 34.175.80.182 | 34.175.27.251, 34.175.198.50 |
| Switzerland (CH) | 34.65.108.153, 34.65.155.169 | 34.65.225.124, 34.65.89.6 |
| United Kingdom (UK) | 35.242.180.163, 34.105.173.229 | 34.105.227.146, 34.105.137.22 |
| Finland (F) | 34.88.97.182, 34.88.189.1 | 35.228.192.167, 34.88.193.126 |
Cortex XSIAM inbound IP addresses in JPAC
| Region | Infrastructure IP Addresses (allow inbound) | Data Collection IP Addresses (allow inbound) |
|---|---|---|
| Australia (AU) | 34.151.83.236, 34.116.67.90 | 35.197.181.108, 35.197.175.44 |
| India (IN) | 35.200.175.78, 34.93.9.198 | 34.93.3.196, 34.93.175.218 |
| Indonesia (ID) | 34.128.126.138, 34.128.82.158 | 34.101.158.32, 34.101.79.159 |
| Japan (JP) | 35.200.3.131, 34.146.181.233 | 34.85.68.167, 34.84.99.239 |
| Singapore (SG) | 35.240.243.57, 34.126.183.208 | 35.247.148.38, 35.247.173.40 |
| South Korea (KR) | 34.64.93.168, 34.64.237.45 | 34.64.107.163, 34.64.84.25 |
| Taiwan (TW) | 34.80.133.68, 35.234.18.10 | 35.201.142.86, 35.189.176.163 |
FedRAMP and US federal Cortex XSIAM required resources
Configure firewall access for FedRAMP and US federal government Cortex XSIAM deployments. The following tables list required FQDNs, IP addresses, ports, and App-ID coverage.
Cortex XSIAM egress and engine resources
All ports are 443 unless otherwise specified.
| Source | Compliance Level | IP Addresses |
|---|---|---|
| Egress | FedRAMP Moderate | 34.122.220.113, 35.223.83.172 |
| FedRAMP High | 34.136.155.252, 34.133.46.50 | |
| Outbound IPs for Engines | FedRAMP Moderate | 34.123.127.174:443, 34.71.135.18:443 |
| FedRAMP High | 34.123.153.175:443, 35.223.253.2:443 | |
Core Cortex XSIAM communication resources
These resources handle agent registration, heartbeats, data uploads, and API connections. All ports are 443 unless specified otherwise.
| Resource/Function | FQDN | IP Address & Port | App-ID |
|---|---|---|---|
Initial registrationUsed for the first request in registration flow where the agent passes the distribution ID and obtains the ch-<tenant-name>.traps.paloaltonetworks.com of its tenant |
distributions-prod-fed.traps.paloaltonetworks.com |
104.198.132.24 | traps-management-service |
| Agent heartbeat and data uploadUsed for all other requests between the agent and its tenant server, including heartbeat, uploads, action results, and scan reports. | ch-<tenant-name>.traps.paloaltonetworks.com |
130.211.195.231 | traps-management-service |
| EDR data uploadUsed for EDR data upload. | dc-<tenant-name>.traps.paloaltonetworks.com |
130.211.195.231 | traps-management-service |
| API gatewayUsed for API requests and responses. | api-<tenant-name>.xdr.federal.paloaltonetworks.com |
130.211.195.231 | N/a |
| Verdict requestsUsed for get-verdict requests. | cc-<tenant-name>.traps.paloaltonetworks.com |
35.222.50.74 | traps-management-service |
| Live terminalUsed in live terminal flow. | wss://lrc-fed.paloaltonetworks.com |
35.188.188.91 | cortex-xdr |
| App proxy | app-proxy.federal.paloaltonetworks.com |
35.186.217.42 | N/a |
Cortex XSIAM content updates and GCP storage
These resources are hosted on Google Cloud Platform. All ports are 443 unless otherwise specified.
| Resource/function | FQDN | IP Addresses | |
|---|---|---|---|
| <p> </p> |
FQDN | IP Addresses | App-ID |
| InstallersUsed to download installers for upgrade actions from the server. | panw-xdr-installers-prod-fr.storage.googleapis.com |
IP ranges in GCP | cortex-xdr |
| Legacy payloadsUsed to download the executable for the live terminal for Cortex XDR agents earlier than version 7.1.0. | panw-xdr-payloads-prod-fr.storage.googleapis.com |
IP ranges in GCP | cortex-xdr |
| Content updatesUsed to download content updates. | global-content-profiles-policy-prod-fr.storage.googleapis.com |
IP ranges in GCP | cortex-xdr |
| Scanning verdictsUsed to download extended verdict request results in scanning. | panw-xdr-evr-prod-fr.storage.googleapis.com |
IP ranges in GCP | cortex-xdr |
Cortex XSIAM Broker VM resources
Required only for deployments utilizing Broker VM features. All ports are 443, unless otherwise stated.
| Resource/Function | FQDN | IP Addresses | App-ID |
|---|---|---|---|
| Broker connection | br-<tenant-name>.xdr.federal.paloaltonetworks.com |
34.71.185.11 | N/a |
| <p>Registration</p><p>Used for the first request in the registration flow, for Broker VMs to obtain their specific connection URLs.</p> | distributions-prod-fed.traps.paloaltonetworks.com |
104.198.132.24 | traps-management-service |
| <p>XSIAM gateway</p><p>Broker VM 3.0 and above</p> | xsiam-gateway |
N/a | N/a |
| <p>Time sync (NTP)</p><p>Used by the Broker VM to ensure accurate timestamping for forwarded logs.</p> | N/a | UDP port 123 | N/a |
Cortex XSIAM authentication and SSO
Required for administrator login and Single Sign-On. All ports are 443 unless specified
| Resource | FQDN | IP Addresses and Port | App-ID |
|---|---|---|---|
| Identity service | identity.paloaltonetworks.com |
34.107.215.35 | N/a |
| Login service | login.paloaltonetworks.com |
34.107.190.184 | N/a |
Cortex XSIAM ingress for third-party data collection
Allow traffic from these IPs to your network when collecting data from SaaS and Cloud resources.
| IP Addresses | App-ID |
|---|---|
| <ul><li>34.68.217.16</li><li>34.69.175.202</li></ul> | cortex-xdr |
Cortex XSIAM log forwarding to a syslog receiver
If you want to send logs to a syslog receiver, you need to enable access to Cortex XSIAM IP addresses for your region in your firewall. For more information, see Integrate a syslog receiver.
Set up users, groups, and roles
Cortex XSIAM uses both Role-Based Access Control (RBAC) and Scope-Based Access Control (SBAC) to manage roles with specific permissions for controlling user access.
RBAC helps manage access to Cortex XSIAM components and Cortex Query Language (XQL) datasets, so that users, based on their roles, are granted minimal access required to accomplish their tasks.
SBAC refines the RBAC permissions by granting access only to the relevant data that the user requires for their designated role. Users with Access Management permission can apply scopes to limit the data and content that users can be granted access to in Cortex XSIAM, which are divided into different scoping areas. The scoping areas include Assets, Cases and Issues, Endpoints, and Datasets Rows, which can be applied as relevant to the enforcement area, entity, or dataset. For more information on user scopes, see Manage user scope.
Cortex Gateway and the tenant have different options and requirements.
| Location | Details |
|---|---|
| Cortex Gateway | <p>A centralized portal for managing roles, user groups, and users for all tenants. Any roles and user groups created in Cortex Gateway are available for all tenants.</p><p>In Cortex Gateway, on the Permissions page, you can manage users that have been added to your Customer Support Portal account or view users that have been created in the tenant using SSO (you cannot edit SSO users in Cortex Gateway). All users must have at least one role or belong to at least one user group to be saved in the Cortex Gateway. You can exclude different tenants or different Cortex products. For more information, see Cortex Gateway Administrator Guide.</p><div data-gb-custom-block data-tag="hint" data-style="info" class="hint hint-info"><p>Note</p><p>To make users visible in the Users list within the Cortex tenant, an administrator must first assign them the Cortex User role in the Customer Support Portal (CSP). For more information, see Manage user roles.</p></div><p>Only users with the Account Admin role can manage roles, tenants, and user groups in Cortex Gateway. </p> |
| Cortex XSIAM tenant | <p>(Recommended) All permissions and roles are specific to the tenant and exist only at the tenant level. Advanced settings, such as SBAC and Dataset access management, can be defined at the tenant level.</p><p>Managing users, roles, scopes, user groups, and authentication settings in Cortex XSIAM requires View/Edit RBAC permissions for Access Management (under Configurations). Account Admin and Instance Administrator roles are granted this permission by default.</p><p>For more information, see Manage user roles.</p> |
Predefined user roles
Cortex XSIAM utilizes Role-Based Access Control (RBAC) to manage user permissions across all tenants and services. This framework ensures a secure separation of duties by granting users only the specific access required for their functional or regional responsibilities. Key features include:
-
Predefined Roles: Cortex XSIAM provides default roles with set permissions. While these cannot be edited directly, they can be copied and customized to meet your organization's specific security requirements. To view the predefined permissions for each default role, go to Settings → Configurations → Access Management → Roles.
For more information about user role-based access permissions, see Role permissions by component
- Centralized Management: Roles can be configured globally within the Cortex Gateway or at the individual tenant level.
- Visibility logic: Users may not see a specific feature if the feature is not supported by the license type or if they do not have access based on their assigned role or scope.
To quickly see exactly which pages and actions a role allows, click on the role name, which opens a read-only view of all checked permissions.
Super user and administrative roles
| Role | Description | Recommended use |
|---|---|---|
| Account Admin | <p>A super user role that is assigned directly to the user in Cortex Gateway or a tenant and has full access to all Cortex products in your account, including all tenants added in the future. In Cortex Gateway, the Account Admin can assign roles to Cortex instances and activate product-specific Cortex tenants. This user has the same view/edit permissions in the tenant as the Instance Administrator.</p><div data-gb-custom-block data-tag="hint" data-style="info" class="hint hint-info"><p>The user who activated the Cortex product is assigned the Account Admin role. You cannot create additional Account Admin roles in the Cortex XSIAM tenant. If you do not want the user to have Account Admin permission, you must remove the Account Admin role in Cortex Gateway.</p></div> | Assign to the primary platform administrator, typically the security operations director, or designated platform owner. This role should be limited to a very small number of trusted users. |
| Instance Administrator | View and edit permissions for all components and access all pages in the Cortex XSIAM tenant. The Instance Administrator can also make other users an Instance Administrator for the tenant. If the tenant has predefined or custom roles, the Instance Administrator can assign those roles with scopes to other users. | <p>Assign to instance-level administrators who need full control over a specific tenant, but should not automatically gain access to other instances in the account.</p><p>Common scenarios include multi-tenant deployments, MSSP environments, and delegated admins (for example, a team lead gets full admin on their team's instance without access to other teams' instances).</p> |
| Deployment Admin | <p>Manage and control endpoints, installations, and configure Broker VMs.</p><p>The Deployment Admin is a focused infrastructure role for teams responsible for rolling out and maintaining Cortex XDR Agents. It provides full control over agent installations, endpoint groups, and broker configuration, but excludes security operations capabilities like issue triage, case response, and detection rule management.</p> | Assign to IT operations staff who need to deploy agents across the organization, manage agent groups and installations, configure broker VMs, and set up integrations. |
| IT Admin | <p>Manage and control endpoints and installations, configure Broker VMs, view endpoint profiles and policies, and view issues.</p><p>The IT Admin extends the Deployment Admin with cases and issue visibility, host insights, and general configuration access.</p> | Assign to IT administrators who need security awareness but without security authority. They need to see issues and policies (troubleshooting, understanding endpoint behavior), but cannot configure or respond to cases. |
| Privileged IT Admin | <p>Manage and control endpoints and installations, configure Broker VMs, create profiles and policies, view issues, and initiate Live Terminal.</p><p>This permission is significantly more extensive than the standard IT Admin. It includes response actions, script execution, detection rule editing, cloud security policies, compliance management, and Live Terminal access. This role is closer to a Security Admin than a typical IT Admin.</p> | Assign to senior IT administrators or IT security leads who need full endpoint management capabilities plus the ability to respond to cases, edit detection rules, manage policies/profiles, and access cloud security features. |
| Scoped Agent Admin | <p>Can only access product areas that support endpoint Scoped-Based Access Control (SBAC) - Agent Administration, Action Center, Response, Dashboards, and Reports.</p><p>Scoped Agent Admin is designed for SBAC. All permissions are limited to the endpoint scope assigned to the user. The role focuses on response actions and agent management within that scope, with no access to investigation, detections, settings, or cloud security features.</p> | Assign to regional IT admins, site-specific endpoint managers, or MSSP analysts who should only manage and respond to endpoints within a specific scope (for example, a geographic region, business unit, or customer). SBAC ensures they cannot see or act on endpoints outside their assigned scope. |
Security and investigation roles
| Role | Description | Recommended use |
|---|---|---|
| Investigator | The base investigation role. Provides case/issue triage (edit) with investigation tools (such as query center and Query Library (edit), but no response actions and no detection rule management, host insights, or configuration access. | Assign to SOC Tier-1 analysts who triage incoming issues, update case status, and escalate to senior analysts. They can investigate using queries and view forensics data, but cannot isolate endpoints, run scripts, or modify detection rules. |
| Privileged Investigator | <p>Extends Investigator role with rules visibility, threat intel, and action center. Can view and triage issues, cases, and rules, and view profiles and policies, with Analytics management. No response actions, detection rule editing, endpoint, or configuration access.</p><p>While a standard Investigator focuses on viewing and triaging issues, the Privileged Investigator is granted deeper View/Edit access to the investigation logic itself.</p> | Assign to senior SOC analysts or threat hunters who need to understand detection rules, edit threat intel indicators, manage playbooks/scripts, and have visibility into endpoint policies, but who do not need to perform response actions like isolating endpoints or running Live Terminal. |
| Responder | Adds response actions to the Investigator base. Can view and triage issues, and access all response capabilities (isolate, terminate, quarantine), but no Live Terminal, rule editing, or configuration access. | Assign to SOC Tier-2 analysts who need to take immediate containment actions (isolate, terminate, quarantine) when responding to confirmed threats, plus the ability to edit detection rules and manage threat intel. |
| Privileged Responder | <p>Can view and triage cases and issues, and combines full response (including Live Terminal), rule editing, endpoint policy management, and playbook/script editing. No access management, alert notifications, broker management, or data sources management.</p><p>A Privileged Responder is primarily about advanced remediation and administrative control.</p> | Assign to SOC Tier-3 analysts or senior case responders who handle complex cases end-to-end, from deep investigation through containment, remediation, and rule tuning. They need Live Terminal for hands-on endpoint investigation, script execution for custom response actions, and the ability to update detection rules based on findings. |
| Investigation Admin | View and triage issues and cases, configure rules, view endpoint profiles and policies, and manage analytics. A senior investigation role focused on rule configuration, full investigation, response actions (action center, device control, host firewall), but no Live Terminal and no agent management. | Assign to detection engineers, SOC leads, or threat intelligence managers who focus on tuning detection rules, managing playbooks, and overseeing investigation workflows, but who delegate hands-on response actions to Responder roles. This role is about building and maintaining the detection and investigation infrastructure rather than performing case response. |
| Security Admin | <p>Can triage and investigate issues and cases, respond (excluding Live Terminal), and edit profiles and policies. A comprehensive security role with response actions (excluding Live Terminal), rule editing, policy/profile editing, agent management, and configuration access.</p><p>A Security Admin maintains integrations, log flow, and system health.</p> | Assign to security engineers or SOC managers who need to manage the security posture end-to-end, configuring detection/prevention rules, managing endpoint policies and profiles, setting up data sources and integrations, and responding to incidents with basic containment actions. |
| Privileged Security Admin | Triage and investigate issues and cases, and respond to and edit profiles and policies. The most powerful security role. Everything Security Admin has, plus Live Terminal, file operations, script execution, playbook editing, device control editing, host firewall editing, audit, alert notifications, broker management, etc. | Assign to senior security administrators or CISO-designated security leads who need unrestricted security operations capabilities. They handle the most critical incidents requiring Live Terminal access, manage the full detection and response stack, configure broker infrastructure, and oversee audit trails. The only capabilities reserved above this role are user/role management (Access Management) and application hub management, which require Account/Instance Administrator. |
| Viewer | Provides broad read-only access across almost all areas, such as dashboards, policies, endpoints, configurations, and audit, but has no edit permissions, including edit, respond, or configure. | Assign to stakeholders, managers, auditors, or compliance officers who need visibility into the security posture and operations but should never modify anything. Also useful for new SOC team members during onboarding who need to observe before being granted active permissions. |
Specialized domain roles
For all Cloud features, Cortex XSIAM requires a Cloud Posture Security, Cloud Runtime Security, or Cortex XSIAM Premium license. For Application Security scans, you also need the Application Security add-on.
| Role | Description | Recommended use |
|---|---|---|
| Developer | <p>Read-only Cloud Application Security role designed for developers who need to see scan results and security findings but not modify security policies or rules.</p><p>Users can view AppSec detection rules, policies, issues, and all scan types (periodic, CI/CD, PR scans), as well as cloud security dashboards and policies. They also have view access to dashboards, reports, issues, asset management, compliance, and edit access for the CLI tool.</p> | Developers need to see the security issues found in their code, scan results, detection rule details, and policy violations, so they can fix them. This gives developers the visibility to remediate issues while keeping security governance in the hands of the AppSec Admin. |
| AppSec Admin | <p>Full permissions for all Cloud Application Security-related activities. Create and modify detection rules within the Code/Build domain, track progress, and adjust enforcement as needed. Additionally, triage and investigate findings, issues, and cases spanning from code to cloud. The role also includes complete visibility into all cloud assets.</p><p>However, there are no response actions, no agent management, and no general configuration.</p> | Assign to an application security team lead or AppSec engineer who manages the entire AppSec program. They configure what gets scanned, define detection rules for code vulnerabilities, set enforcement policies, triage AppSec findings, and manage the integration pipeline between code repositories and the security platform. |
| DevSecOps | <p>Provides complete visibility on all Cloud Application Security assets, findings, issues, and scans, plus edit permissions on Scan management pages.</p><p>It sits between the Developer (view-only) and AppSec Admin (full edit) roles. DevSecOps users can view all AppSec data like the Developer, but additionally can track, investigate code scans, and rescan failed scans. They cannot modify detection rules, enforcement policies, or issue status.</p> | <p>Assign to DevSecOps engineers within development teams who need to actively manage the scanning pipeline, monitor scan progress, investigate scan failures, and trigger rescans, while leaving policy and rule management to the AppSec Admin.</p><p>This role bridges development and security by giving DevSecOps practitioners hands-on scan management without the ability to weaken security policies.</p> |
| Compliance Administrator | <p>View/Edit access to Compliance Catalog Assessment Profiles and Compliance Reports. Broad view access across the tenant, including cases/issues, forensics, host insights, detection rules, endpoints, configurations, and audit.</p><p>No edit permissions on anything except compliance features. For more information about compliance permissions, see Compliance - Cloud permissions.</p> | Assign to compliance officers or audit managers who need to manage the organization's compliance posture. Having read-only visibility into the broader security operations helps to understand context. |
| AI Security Viewer | <p>Provides read-only access to the AI Security module plus broad view access to related security areas.</p><p>The role can view AI security findings, issues, and the AI security inventory. It also has view access to dashboards, cloud security dashboards, reports (with edit), issues, query center, compliance (view), cloud security rules/policies, CWP policies, asset management, and asset groups.</p> | <p>Assign to stakeholders, analysts, or team members who need to monitor AI security posture. See what AI models, applications, and data pipelines exist in the organization and what security issues have been identified, without the ability to modify AI security configurations.</p><p>Useful for AI/ML team leads who want visibility into how their AI assets are being secured, or for SOC analysts who need to see AI-related findings during investigations.</p> |
| AI Security Administrator | <p>View/Edit access to the AI Security module plus extensive capabilities, including issue triage, full response actions, playbook/script editing, compliance management, cloud security rule/policy editing, CWP policy editing, asset management, and data sources management.</p><p>It is a powerful role that combines AI security management with broad security operations capabilities.</p> | <p>Assign to the AI security program owner or AI Security engineer who manages the organization's AI security posture end-to-end. They configure AI security policies, manage AI asset inventory, respond to AI-related security incidents, and ensure compliance of AI systems.</p><p>The extensive response and investigation capabilities allow them to handle AI security cases directly, from detection through containment and remediation, without needing a separate security operations role.</p> |
| Data Security Viewer | <p>Read-only access to the Cloud Data Security for monitoring the organization's cloud data security posture. It can view data security findings, data objects, data patterns, and classification results.</p><p>It also has view access to dashboards (including cloud security dashboards), reports (edit), issues, query center, compliance, cloud security rules/policies, CWP policies, asset management, and DLP-related features, such as data-in-motion rules and endpoint applications.</p> | Assign to Data privacy officers, DLP analysts, compliance team members, or data governance stakeholders who need to monitor the organization's data security posture, without the ability to modify any Data Security configurations, data classification policies, or DLP settings. |
| Data Security Administrator | View/Edit access to the Data Security module plus extensive capabilities including issue triage, full response actions, playbook/script editing, compliance management, cloud security rule/policy editing, CWP policy editing, DLP management, and asset management editing. | Assign to the data security program owner or the Data Security engineer who manages the organization's data security posture. They configure data classification policies, manage data security findings, respond to data-related security cases, and ensure compliance with data handling practices. |
| Identity Security Runtime Viewer | <p>Read-only access to the baseline Identity Analytics and Identity Runtime Detection Rules. Users with this role can view identity-based analytics alerts, user and host risk scores, behavioral analytics profiles, and raw directory data queries. They cannot modify detection rules, analytics configurations, or any system settings.</p><div data-gb-custom-block data-tag="hint" data-style="info" class="hint hint-info"><p>Note</p><p>Relevant for Behavioral Analytics & Identity Threat Detection and Response (ITDR).</p></div> | SOC Tier-1 analysts, Tier-1 responders, or auditors who need to investigate identity-related analytics alerts and review user/host risk profiles without the ability to change detection rules or system configurations. This role provides sufficient access for issue triage, initial investigation, and escalation workflows. |
| Identity Security Runtime Administrator | <p>Full administrative (View/Edit) access to the baseline Identity Analytics and Identity Runtime Detection Rules. Users can view, create, modify, and manage identity-based analytics detection rules, configure the Identity Analytics module, and take response actions on identity-related findings. They have full control over the runtime identity analytics pipeline.</p><div data-gb-custom-block data-tag="hint" data-style="info" class="hint hint-info"><p>Note</p><p>Relevant for Behavioral Analytics & Identity Threat Detection and Response (ITDR).</p></div> | Senior SOC analysts (Tier-2/3), detection engineers, or security architects responsible for deploying, tuning, and maintaining identity-based analytics detection rules. This role is appropriate for team members who build and optimize the identity analytics detection pipeline, manage automated response playbooks, and need to take direct action on identity-related findings. |
| Identity Security Viewer | <p>Read-only access to the full Identity Security module, including both the baseline Identity Analytics capabilities and the advanced Identity Threat Detection and Response (ITDR) features.</p><p>Users can view the Identity Security dashboards (Identity Overview, Risk Overview), browse the complete identity asset inventory across cloud, SaaS, and on-premises environments, review identity posture and threat issues, view detection rules, and monitor conditional access policies and audit logs. They cannot modify any configurations, rules, or policies.</p><div data-gb-custom-block data-tag="hint" data-style="info" class="hint hint-info"><p>Note</p><p>Relevant for Identity Posture & Cloud Infrastructure Entitlements (CIEM).</p></div><p>These features require the ITDR add-on, a Cloud Posture Security, Cloud Runtime Security, or Cortex XSIAM Premium license.</p> | Risk analysts, compliance officers, or SOC analysts (Tier-1/2) who need deep, comprehensive visibility into the organization's overall identity risk posture, spanning cloud entitlements, behavioral analytics, user/host risk profiles, and high-value asset exposure. This role is ideal for personnel who need to investigate identity-related findings across all data sources, generate reports for stakeholders, and monitor the effectiveness of identity security controls without the ability to modify them. |
| Identity Security Administrator | <p>Full administrative (View/Edit) access to the complete Identity Security module, including both the baseline Identity Analytics capabilities and all advanced Identity Threat Detection and Response (ITDR) features.</p><p>Users have unrestricted control over the entire identity security posture. They can manage identity asset inventories, create and tune posture and threat detection rules, configure conditional access policies, manage data source connections, configure asset role classifications for risk scoring, and execute the full range of response actions.</p><div data-gb-custom-block data-tag="hint" data-style="info" class="hint hint-info"><p>Note</p><p>Relevant for Identity Posture & Cloud Infrastructure Entitlements (CIEM).</p></div><p>These features require the ITDR add-on, a Cloud Posture Security, Cloud Runtime Security, or Cortex XSIAM Premium license.</p> | <p>Identity security engineers, IAM administrators, or risk managers who are actively responsible for the organization's identity security posture. This role is appropriate for personnel who configure behavioral analytics, build and tune detection rules across both posture and threat domains, manage conditional access policies, configure identity data source integrations, tune asset role classifications for risk scoring, and oversee the overall identity risk management program.</p><p>This is the most privileged identity security role and should be assigned sparingly, following the principle of least privilege.</p> |
| Exposure Management Administrator | <p>Full access to security controls and effectiveness rules features within the Exposure Management module. It limits view access to most features, with View/Edit access specifically for Vulnerability Management and Exposure Management.</p><p>This role is focused on managing the organization's attack surface exposure and vulnerability remediation priorities.</p> | Assign to vulnerability management engineers, exposure management analysts, or attack surface management leads who need to configure and manage security controls, effectiveness rules, vulnerability management data, and exposure management settings. |
Service account roles
Predefined roles designed for non-human, machine-to-machine authentication within the tenant.
| Role | Description | Recommended Use |
|---|---|---|
| Generic Collector | <p>Generic Collector is a machine-only service account role with the minimum permissions required by the 3rd-party scanners. Its sole purpose is to authenticate API calls from external AppSec scanners (for example, Snyk, SonarQube, Checkmarx) that send their findings to the collector endpoint</p><p>It is not intended for users. It follows the principle of least privilege; the API key can only ingest scan data.</p> | Admins can see what role is assigned to collector API keys and understand the permission scope. |
| App Service Account | <p>A service account role for Application instances (Jupyter notebooks, Observability apps). It provides a broad set of permissions that apps typically need to interact with the tenant programmatically to view and triage issues, cases, and rules, and support public APIs.</p><div data-gb-custom-block data-tag="hint" data-style="info" class="hint hint-info"><p>Note</p><p>This role automatically assigns API keys generated for App instances. When an Application instance is created, the system automatically generates an API key with this role, allowing the app instance to interact with the tenant, reading issues, creating cases, querying data, and updating threat intel.</p></div> | Admins can see what role is assigned to auto-generated API keys and understand their permission scope. This role is not intended for users. |
| CLI Role | A service account role with the specific permissions required for the Command Line Interface (CLI) tool to perform security operations. For more information, see Cortex CLI usage. | Assign to API keys used by the CLI tool for automated security operations and scripting. |
| CLI Read Only Role | A read-only service account role for the CLI tool. It provides visibility into security data without allowing modifications. For more information, see Cortex CLI usage. | Assign to API keys used by the CLI tool for data extraction, reporting, or monitoring where modifications are not required. |
Manage Cortex XSIAM user groups
Manage Cortex XSIAM user groups to assign roles, permissions, and access controls. Users receive access through direct role assignments or membership in one or more user groups.
A user group can only be assigned to a single role, but users can be added to multiple groups if they require multiple roles. You can also nest groups to achieve the same effect.
Users who have multiple roles through either method will receive the highest level of access based on the combination of their roles. The same principle for users with multiple roles is followed for both the Role-Based Access Control (RBAC) access permissions and the Scope-Based Access Control (SBAC) granular scoping, so that users receive the highest level of access by combining their roles.
Example
Joe has an Analyst role and is a member of the Tier-1 Analyst user group, which is assigned the Triage role. Joe has the permissions of the Analyst role and the Triage role. Joe is assigned 2 roles and has the highest permission based on the combination of both roles.
- John is a member of two user groups - Tier-1 Analyst and Tier-2 Analyst. One group is configured to use the Triage role and the other group is configured to use the Incident Response role. John is assigned both roles and has the highest permissions based on the combination of all roles.
- Jack is a member of the Tier-2 user group, which has an Incident response role. This user group is included in a Tier-3 user group (Threat Hunter role), added as a nested group. Jack is assigned both roles and has the highest permissions based on the combination of all roles.
On the User Groups page, you can create a new user group for several different system users or groups.
You can see information including the details of all user groups, the roles, nested groups, IdP groups (SAML), and when the group was created/updated.
You can also right-click in the table to edit, save as a new group, remove (delete) a group, and copy text to the clipboard.
Non-administrator users with Access Management permissions cannot create or modify user groups to include the Instance Administrator role. Additionally, the Edit and Delete options are hidden for any user group that holds the Instance Administrator role, whether assigned directly or indirectly (through parent group assignments).
You can create user groups in the tenant or Cortex Gateway.
User groups created in Cortex Gateway do not support SAML group mapping and are shared across all your tenants. We recommend managing user groups directly in the Cortex tenant, because only tenant-based groups support scoping and SAML group mapping.
Managing groups directly in the tenant allows you to maintain different user groups for different environments, such as dev/prod. It also allows you to apply granular scoping to a user group by granting access only to the relevant data that the group members require.
To use scope-based access control (SBAC), you must enable it in the Server Settings page. For more information, see Manage user scope. Before configuring SBAC, ensure that you review Understand scoping in the Manage user scope section.
Cortex XSIAM identity and group provisioning strategies
To govern user-to-group lifecycle relationships within individual tenant workloads, administrators must utilize one of three core provisioning strategies to ingest or evaluate directory identities:
Strategy A: Native local custom groups (default method)
This default method allows you to associate users with groups created and managed within Cortex XDR.
- Methodology: System administrators manually build structural custom groups directly in the tenant console or the Cortex Gateway, explicitly assigning individual accounts into the member list.
- Prerequisites for allocation: The user identity must first exist in the Customer Support Portal (CSP) or have finished a first Single Sign-On (SSO) authentication sequence. For CSP users, the account must also be assigned the specific Cortex User role within the support portal configuration. If this role is not assigned, the user will be unable to log in through the CSP and will only be able to log in through SSO (if configured). For more information, see Set up users, groups, and roles.
Strategy B: SAML dynamic group mapping (IdP is the source of truth)
This approach establishes your corporate Identity Provider (IdP) as the absolute source of truth, allowing group assignments defined in your enterprise directory to be seamlessly reused inside Cortex XDR.
- Methodology: Administrators create user group shells inside Cortex XDR and associate them with the user groups defined in the IdP. This allows you to reuse your existing organizational hierarchy, access permissions, and team structures directly into the security operations console without introducing operational fragmentation or duplicative group-association overhead.
- Note on role requirements: Users who authenticate only through Single Sign-On (SSO) do not require the Cortex User role in the CSP. Their access and permissions are managed via the SAML group mappings and the default role configured in your SSO settings.
- Configuration steps:
- For Okta environments: For step-by-step instructions, see Set up Okta as the Identity Provider Using SAML 2.0. Pay close attention to configuring the group attribute statement to pass the user's groups in the SAML assertion token.
- For Microsoft Entra ID (Active Directory) environments: For step-by-step instructions, see Set up Microsoft Entra ID as the Identity Provider Using SAML 2.0. You must configure Entra ID to emit user group claims in the token.
- Critical capitalization requirement: String evaluation across authentication mappings, attribute configurations, and group designations enforces absolute case mapping rules. Strict attention to exact character capitalization must be maintained across all configurations. If the group name string in the IdP does not match the string in Cortex XDR with identical uppercase and lowercase letters, the mapping will fail, and users will not inherit their permissions.
- Active session mechanics: This flow operates dynamically during user login and does not alter or update the permanent group mappings listed within the Cortex XDR console. The session flow works as follows:
- The user logs in via SSO.
- Based on the SAML assertions coming from the Identity Provider (IdP), the list of IdP groups associated with that user is extracted.
- These extracted groups are used to associate the user with the local Cortex Groups based on the SAML Group Mapping field configured within the Cortex group settings.
- These mapped groups are associated with the user for the length of the current authenticated session.
- Consequently, these groups do not appear in the persistent list of Cortex groups associated with this user inside the Cortex XDR console.
Strategy C: Cloud Identity Engine (CIE) directory sync
This process utilizes the CIE directory to manage and arrange organizational group mappings in advance.
- Methodology: The Cloud Identity Engine (CIE) uses the System for Cross-domain Identity Management (SCIM) protocol to automatically synchronize groups from your Identity Provider (IdP) directly into CIE. Then, Cortex XDR synchronizes the CIE groups that were selected using Import AD Group into its local list of groups.
- Configuration steps: To configure and connect the underlying identity engine pipeline to your enterprise directory infrastructure before mapping groups locally, see the step-by-step onboarding instructions in Set up Cloud Identity Engine.
- Synchronization processing delay: Because the directory sync between CIE and the Cortex tenant runs on a periodic background schedule, a delay of a few hours may occur after the list of groups changes in your IdP, or when a mapping between groups and users changes in CIE.
Important
The Cloud Identity Engine (CIE) is used exclusively for directory group management; it is not utilized for individual user account management, provisioning, or authentication workflows. Consequently, disabling, suspending, or removing user objects directly within CIE does not automatically disable, restrict, or delete those corresponding users inside Cortex XDR. If you use Single Sign-On (SSO) for Cortex XDR authentication, see the User De-provisioning and Restrictions section in Authenticate users using SSO for complete instructions on handling directory lifecycle cleanups and managing stale accounts.
Create a Cortex XSIAM user group
- Go to Settings → Configurations → Access Management → User Groups.
-
To create a new user group for several different system users or groups, click New Group, and add the following parameters:
Parameter Description Name Name of the user group. Description Description of the user group. Group for product (Cortex Gateway only) If you have multiple products, select the relevant Cortex product. Role <p>Select the group role associated with this user group. You can only have a single role designated per group.</p><p>In Cortex Gateway, you can only select either Instance Administrator or a custom role created in the Gateway.</p><div data-gb-custom-block data-tag="hint" data-style="info" class="hint hint-info"><p>Note</p><p>For non-administrator users, the Instance Administrator role is unavailable from the dropdown menu.</p></div> Users <p>Select the users you want to belong to this user group.</p><div data-gb-custom-block data-tag="hint" data-style="info" class="hint hint-info"><p>Note</p><p>If users have been created in the CSP, but you want them to access the tenant through SSO only, skip this field and add only SAML group mapping after SSO is set up, otherwise, users can access the tenant through both the CSP and SSO.</p><p>If you have not yet created any users, skip this field and add them later. See Set up authentication .</p></div> Nested Groups <p>Lists any nested groups associated with this user group. If you have an existing group, you can add a nested group.</p><p>User groups can include multiple users and nested groups, which inherit the permissions of parent user groups. The user group will have the highest level of permission.</p><p>For example:</p><ul><li>Group A has Tier-1 Analyst permissions</li><li>Group B has Tier-2 Analyst permissions</li></ul><p>If you add Group A as a nested group in Group B, Group A inherits Group B's permissions (Tier-1 and Tier-2 permissions).</p><p>In Cortex Gateway, you can only add user groups that are created in Cortex Gateway.</p> SAML Group Mapping <p>(Relevant when creating a user group in the Cortex tenant only.)</p><p>Maps the SAML group membership to this user group. For example, you have defined a Cortex Adminsgroup. You need to name this group exactly how it appears in Okta.</p><p>You can add multiple groups by pressing enter after each name to build a list.</p><div data-gb-custom-block data-tag="hint" data-style="info" class="hint hint-info"><p>Note</p><ul><li>Capitalization is vital. String evaluation enforces absolute case mapping rules. The name must match your IdP's string configuration exactly.</li><li>When using Microsoft Entra ID for SSO, the SAML group mapping needs to be provided using the group object ID (GUID) and not the group name.</li><li>Relevant strategy: For functional context and the session mechanics of this configuration, see Strategy B: SAML dynamic group mapping (IdP is the source of truth).</li></ul></div><p>If you have not set up SSO in your tenant, skip this field and add it later. After you have added it, follow the procedure relevant to your IdP. For example, see Set up authentication.</p> -
(Optional) When creating the user group in the tenant, configure granular scoping for the user group.
If creating the user group in the Cortex Gateway, you can skip this step, as scoping is only supported in the tenant.
- Click the Scope tab.
- Expand the scoping areas that you want to grant the user role access to in the tenant by clicking the chevron icon (>) beside the scoping area title, and make any changes required. The following table explains the options available to configure:
Scoping Area Granular Scoping Configurations Assets <p>Set the Scope by selecting one of the following:</p><ul><li>No assets: No asset is accessible.</li><li>All assets: Defines access to all assets.</li><li>Select asset groups: Defines access to the specific assets associated with the Asset Groups selected, and to view all their related cases, issues, and findings for these specific assets and Asset Groups. Under Select asset groups, define the specific asset groups that you want to grant access. Only Asset Groups relevant for scoping are listed, which are asset groups that are using only the asset attributes listed in Manage user scope (under Understand scoping → Scoping Areas → Assets).</li></ul><p>The scoping of assets also affects the scoping of cases, issues, and findings.</p><div data-gb-custom-block data-tag="hint" data-style="info" class="hint hint-info"><p>Note</p><p>Visibility of Security domain Issues that refer to assets with agents is controlled by the Endpoints scoping configuration.</p></div> Cases and Issues <p>Set the Scope by selecting one of the following:</p><ul><li>No cases and issues: Defines access to no cases and issues.</li><li>All cases and issues: Defines access to all cases and issues. Users can view cases or issues referencing assets within their scope. Use the Assets section to define which assets are in scope.</li><li><p>Select domains: Defines access to the domains selected to view their related cases and issues. Under Select domains, define the specific domains that you want to grant access.</p><p>Users can only view cases or issues referencing assets and endpoints within their scope. Use the Assets section to define which assets are in scope.</p></li></ul><p>When selecting All cases and issues or Select domains, you can separately configure access to issues and cases that lack an asset reference or where the referenced asset is not in All Assets and All Endpoints inventories. To provide access, select the Allow access to cases and issues that are not referencing known assets or endpoints checkbox. Once selected, you can specifically control which users have access to issues and cases that lack Affected Assets (as seen in the issue’s panel) and Assets (as seen in the case's panel), or where the listed assets are not part of the Asset or Endpoint inventories. When the assets listed are not part of the inventories, the asset string is typically non-clickable. In some cases, such as for identity-related issues, assets may open a dedicated User Risk View, which differs from the standard inventories panels. In the Issues and Cases tables, such items can be identified by empty values in the following columns: Asset IDs, Target Agent Identifier, and Source Agent Identifier.</p> Endpoints <p>Set the Scope by selecting one of the following:</p><ul><li>No endpoints: Defines access to no endpoints with no ability to view their related agent management and enterprise policies.</li><li>All endpoints: Defines access to all endpoints with the ability to view their related agent management and enterprise policies. This configuration can impact the visibility of related Security domain Cases and Issues, but will not affect asset visibility.</li><li>Select specific (at least one required): Defines specific access to all endpoint groups by selecting Endpoint Groups or all endpoint tags by selecting Endpoint Tags to view their related agent management and enterprise policies. This configuration can impact the visibility of related Security domain Cases and Issues, but will not affect asset visibility.</li></ul>
Important
By default, Enable Scope-Based Access Control is disabled in Settings → Configurations → General → Server Settings, and granular scoping is not enforced. Before enabling SBAC, we recommend that an administrator or a user with Access Management permissions first ensures that the users, user groups, and API Keys defined in Cortex XSIAM are granted the required access by assigning the relevant scopes. For more information, see Manage user scope.
- Click Create to create the user group.
Import an Active Directory group into Cortex XSIAM
To automatically synchronize group membership with your organization's Active Directory, you can import an AD group. When someone joins or leaves a team in AD, their Cortex permissions update automatically.
The Import AD Group feature is only enabled when the Cloud Identity Engine (CIE) is connected and configured.
- Select Settings → Configurations → Access Management → User Groups.
- Click Import AD Group.
-
In the Role tab, define the following parameters:
Parameter Description Import AD Group <p>Type to search the CIE in real time, and choose a group or Organizational Unit (OU) to import from Active Directory.</p><div data-gb-custom-block data-tag="hint" data-style="info" class="hint hint-info"><p>Only CSP and SSO users already existing in Cortex will be imported.</p></div> Description Description of the imported user group. Role Select the group role associated with this user group. You can only have a single role designated per group. SAML Group Mapping <p>Maps the SAML group membership to this user group. For example, you have defined a Cortex Adminsgroup. You need to name this group exactly how it appears in Okta.</p><p>You can add multiple groups by pressing enter after each name to build a list.</p><div data-gb-custom-block data-tag="hint" data-style="info" class="hint hint-info"><p>Note</p><p>When using Microsoft Entra ID for SSO, the SAML group mapping needs to be provided using the group object ID (GUID) and not the group name.</p></div><p>If you have not set up SSO in your tenant, skip this field and add it later. After you have added it, follow the procedure relevant to your IdP.</p> - Click the Scope tab to configure granular scoping for the imported group. You can limit the data and content that users can access by configuring the Assets, Cases and Issues, Endpoints, and Datasets Rows options the same as detailed in the custom user group instructions.
- Click Import.
-
Cortex creates a new User Group of type AD Group and immediately fetches the current members in the background. An update appears in Notifications when the import is complete. Following the import, Cortex XSIAM automatically runs periodic background syncs with the CIE to ensure the group's membership stays up to date.
If an imported group is later deleted from your Active Directory, Cortex XSIAM automatically deletes the corresponding user group at the next sync cycle.
Assign user roles and groups
Assign roles directly to users or create user groups and assign roles to those groups. We recommend creating user groups (with a user role), and assigning users to those user groups rather than creating direct roles for each user.
If an existing user in the Cortex Gateway no longer has a role or a user group assigned, the user is revoked. Any roles, user groups, or egress configurations created by that user are shown as created by Revoked user instead of the user’s email address.
Assign a user/user group to a role
Cortex XSIAM provides predefined built-in user roles that provide specific access rights that cannot be modified. You can also create custom, editable user roles. If a user does not have any Cortex XSIAM access permissions that are assigned specifically to them, the field displays No-Role.
Select Settings → Configurations → Access Management → Users.
Right-click the relevant user and select Edit User Permissions.
To apply the same settings to multiple users, select them, and then right-click and select Edit Users Permissions.
Ensure the Role tab is selected.
Under Role, select the default or custom role.
(Optional) Under User Groups, add the user to a group.
(Optional) Under Show Accumulated Permissions:
- Do one of the following:
- Select all to view the combined permissions for every role and user group assigned to the user.
- Select a specific role assigned to the user to view the available permissions for that role.
- Under Components, expand each list to view the permissions.
Setting Cortex Query Language (XQL) dataset access permissions for a user role can only be performed from Cortex XSIAM Access Management. For more information, see Manage user roles.
(Optional) You can configure and manage granular scoping:
- Click the Scope tab.
- Under Scope Definition, expand the scoping areas that you want to grant the user role access to in the tenant by clicking the chevron icon (>) beside the scoping area title, and make any changes required. The following sections explain the options available to configure:
Before configuring, ensure you review Understand scoping in the Manage user scope section.
Assets
Set the Scope by selecting one of the following:
- No assets: No asset is accessible.
- All assets: Defines access to all assets.
- Select asset groups: Defines access to the specific assets associated with the Asset Groups selected, and to view all their related cases, issues, and findings for these specific assets and Asset Groups. Under Select asset groups, define the specific asset groups that you want to grant access. Only Asset Groups relevant for scoping are listed, which are asset groups that are using only the asset attributes listed in Manage user scope (under Understand scoping → Scoping Areas → Assets).
The scoping of assets also affects the scoping of cases, issues, and findings.
Visibility of Security domain Issues that refer to assets with agents is controlled by the Endpoints scoping configuration.
Cases and Issues
Set the Scope by selecting one of the following:
- No cases and issues: Defines access to no cases and issues.
- All cases and issues: Defines access to all cases and issues. Users can view cases or issues referencing assets within their scope. Use the Assets section to define which assets are in scope.
-
Select domains: Defines access to the domains selected to view their related cases and issues. Under Select domains, define the specific domains that you want to grant access.
Users can only view cases or issues referencing assets and endpoints within their scope. Use the Assets section to define which assets are in scope.
When selecting All cases and issues or Select domains, you can separately configure access to issues and cases that lack an asset reference or where the referenced asset is not in All Assets and All Endpoints inventories. To provide access, select the Allow access to cases and issues that are not referencing known assets or endpoints checkbox. Once selected, you can specifically control which users have access to issues and cases that lack Affected Assets (as seen in the issue’s panel) and Assets (as seen in the case's panel), or where the listed assets are not part of the Asset or Endpoint inventories. When the assets listed are not part of the inventories, the asset string is typically non-clickable. In some cases, such as for identity-related issues, assets may open a dedicated User Risk View, which differs from the standard inventories panels. In the Issues and Cases tables, such items can be identified by empty values in the following columns: Asset IDs, Target Agent Identifier, and Source Agent Identifier.
Endpoints
Set the Scope by selecting one of the following:
- No endpoints: Defines access to no endpoints, with no ability to view their related agent management and enterprise policies.
- All endpoints: Defines access to all endpoints with the ability to view their related agent management and enterprise policies. This configuration can impact the visibility of related Security domain Cases and Issues, but will not affect asset visibility.
- Select specific (at least one required): Defines specific access to all endpoint groups by selecting Endpoint Groups or all endpoint tags by selecting Endpoint Tags to view their related agent management and enterprise policies. This configuration can impact the visibility of related Security domain Cases and Issues, but will not affect asset visibility.
Datasets Rows
Configure a filter to define the specific subset of rows a user is allowed to access in each raw dataset. A raw dataset is every dataset where Palo Alto Networks data is ingested out-of-the-box or third-party data is ingested using a configured dedicated collector, also called a data source. This filter configuration does not impact the visibility of cases and issues.
Follow these steps to configure a filter.
-
For datasets where no
filteris defined, determine how to set the When no filter is defined option as either:- No rows are accessible (default): Without a configured
filter, no rows are accessible. Users can query the datasets in Cortex Query Language (XQL) as they have access, but the results will be empty. - All rows are accessible: Without a configured
filter, all rows are accessible. Users can query the datasets in Cortex Query Language (XQL) as they have access, and view all results.
When defining a filter for row-level scoping on raw datasets, queries based on the Cortex Data Model (XDM) are not supported. XDM queries return specific rows only when All rows are accessible is selected and no filter is defined in the Datasets Rows scoping area. Otherwise, no rows are returned.
- No rows are accessible (default): Without a configured
-
Define any filters for the applicable datasets listed in the table:
- Scroll down the list of datasets to the dataset you want to apply a
filteron, and click the Edit Scope icon. -
In the Define what rows are accessible window, continue to write the query for the
filterin the query box (where the syntax is a limited subset of XQL) to limit the data rows for the selected dataset according to the access permissions you want the user to have. The beginning of the query is already defined before the query box, and there is no need to include this in your query.For optimal performance, we recommend using a single field in the
filterdefinition and simple comparison operators.Supported syntax
Fields
You can define the rest of the
filterin the query box, where only the following system fields are supported:_broker_device_id,_broker_device_ip,_broker_device_name,_collector_id,_collector_ip,_collector_name,_collector_type,_device_id,_final_reporting_device_ip,_final_reporting_device_name,_log_type,_product,_scope,_reporting_device_ip,_reporting_device_name, and_vendor.For more information on these fields, see the table that describes all the fields in the
metrics_sourcedataset andmetrics_viewpreset in Overview of data ingestion metrics. For more information on the_scopefield (relevant when_scopeis defined in the Parsing Rule), see [Scenario 3: Supported fields don't provide the necessary segmentation] in Scenarios related to Datasets Rows scoping.Comparison operators
The following comparison operators are supported:
- Exact matches (
=,!=) - Comparing numerical values (
>,<,>=,<=) - Checking membership in lists (
in) - Querying arrays (
array_contains) - Partial matches (
contains,starts_with): Using this operator has additional performance overhead, and we recommend avoiding its use.
If you only want a user to be able to access rows in the
pan_dds_rawdataset, when the_collector_nameisbu2_collector, you'd have to define thefilterin the query box as:_collector_name = “bu2_collector”
- Exact matches (
- (Optional) Set the Time frame for the query. The default is Last 1 day.
- (Optional) You can preview the query results displayed based on your defined query by clicking Preview. You can edit your query until you're satisfied with the output. By default, the query results are limited to 1000 records.
-
When you are finished, click Done.
The Scope field for the dataset that you added the filter on is updated with the query.
In the above example, the Scope field displays
_collector_name = “bu2_collector”.
- Scroll down the list of datasets to the dataset you want to apply a
By default, Enable Scope Based Access Control is disabled in Settings → Configurations → General → Server Settings, and granular scoping is not enforced. Before enabling SBAC, we recommend that an administrator or a user with Access Management permissions first ensures that the users, user groups, and API Keys defined in Cortex XSIAM are granted the required access by assigning the relevant scopes. For more information, see Manage user scope.
Save the user group.
Perform additional tasks
For more information about additional tasks such as creating a custom role, modifying a user's role, or removing a user's role, see Manage user access.
Set up authentication
You can create users in the Customer Support Portal or by using SAML Single Sign-On (SSO) in the tenant. Users authenticate by doing the following:
-
Authenticate through the Customer Support Portal
When users log into Cortex Gateway or the tenant (provided they are assigned a role) they are prompted to sign into the Customer Support Portal using their username and password or 2FA (if set up). This is the default method of authentication.
Use the Customer Support Portal (CSP) if you want to locally manage your users, or if you want them to be able to open support tickets. Conversely, use SAML Single Sign-On (SSO) if you want your organization's external Identity Provider (IdP) to manage user authentication according to your corporate standards.
-
Authenticate using SAML single sign-on in the Cortex XSIAM tenant
Users can be authenticated using your IdP provider such as Okta, Ping, or Microsoft Entra ID. You can use any IdP that supports SAML 2.0. After you configure the SSO integration you need to map group SAML group membership to user groups in Cortex XSIAM. Use SAML Single Sign-On (SSO) configurations when you require Cortex XSIAM users to authenticate according to your organization's precise corporate compliance and access standards as implemented inside your enterprise Identity Provider (IdP). This is critical for enforcing corporate Multi-Factor Authentication (MFA) mandates, complex identity validation, handling automatic de-provisioning (for example, when a user leaves the company), or specific conditional network access policies before granting portal admission.
SSO authentication provides several administrative advantages:
- Removes the administrative burden of requiring separate accounts to be configured through the Customer Support Portal.
- Enforces multi-factor authentication (MFA) and any conditional access policies on the user login at the IdP before granting a user access to Cortex XSIAM.
- Maps SAML group memberships to user groups and roles, allowing you to manage role-based access control.
Customer Support Portal authentication, by contrast, is useful if you have users who need the same permissions across multiple tenants. If you use SSO for multiple tenants, you must set up the SSO configuration separately for each tenant, both in the IdP and in Cortex XSIAM.
To restrict a user to SSO login only, ensure they are not assigned the Cortex User role in the Cortex Gateway. For more information, see Manage users in Cortex Gateway in the Cortex Gateway Administrator Guide. While the CSP login option remains available, the user will be unable to successfully authenticate and must use the SSO login method instead.
For more information, see Assign user roles and groups.
You should have at least one user in the Customer Support Portal for backup, in case of any authentication issues with your IdP provider.
Authenticate users through the Customer Support Portal
When you add users to your Customer Support Portal account, users are sent an invitation to join. After they accept, users can access Cortex Gateway and tenants, but they cannot view any tenants in the Gateway and cannot view any data in the tenant unless they are assigned a direct role or user group role. Only Account Admins can make any changes in Cortex Gateway.
Keep in mind the following:
- You must be assigned the Super User role in the Customer Support Portal to add users in the Customer Support Portal.
- The first Super User who logs into Cortex Gateway is automatically assigned the Account Admin role and has access to the tenant. The user who activates the Cortex XSIAM tenant will also be assigned the Account Admin role (if there is no current Account Admin role) or Instance Admin (if there is an existing Account Admin role) and will have access to the tenant. Any additional users including Super Users need to be assigned access to the tenant.
- To log in to Cortex XSIAM through the Customer Support Portal (CSP), users must be assigned the Cortex User role in CSP. If this role is not assigned, the user will be unable to log in via the CSP and must use the Single Sign-On (SSO) login method instead.
When users log into Cortex Gateway or the tenant they are prompted to sign into the Customer Support Portal using their username and password. This is the default method of authentication.
After users are added to the Customer Support Portal and they accept the invitation, you can manage them in Cortex Gateway or the Cortex XSIAM tenant.
How to authenticate users through the Customer Support Portal
Add the user to your Customer Support Portal.
Sign in to the Customer Support Portal and do one of the following:
- Create a user
- Select Members → Create New User.
-
Add the member details and click Submit.
The user must accept the email invitation within seven days.
For invitation help, see How a Super User Creates a New Customer Support Portal User Account.
- Send an account registration link
- Select Account Management → Account Details → User Access.
- In Account Registration, click Create.
-
Copy and send the link to the user.
The user submits their registration details through the link. The Super User receives a creation notification.
For link management, see How to Use the Account Registration Link.
Wait for the user to accept
The user accepts the invitation. They can then sign in to Cortex Gateway.
Assign tenant access
In Cortex Gateway or the Cortex XSIAM tenant, assign a role directly. Alternatively, add the user to a user group with a role.
Authenticate users using SSO
Cortex XSIAM enables you to authenticate system users securely across enterprise-wide applications and websites with one set of credentials using single sign-on (SSO) with SAML 2.0. System users can authenticate using your organization's Identity Provider (IdP), such as Okta or PingOne. You can integrate with any IdP that is supported by SAML 2.0.
Use SAML SSO when you want your platform users to be authenticated according to your organization's precise security standards as implemented within your enterprise IdP. This is critical for enforcing corporate Multi-Factor Authentication (MFA) mandates, identity verification policies, handling automatic de-provisioning (for example, when a user leaves the company), or specific conditional network access rules before granting portal access.
Configuring SSO with SAML 2.0 is dependent on your organization’s IdP. Some of the parameter values need to be supplied from your organization’s IdP and some need to be added to your organization’s IdP. You must have sufficient knowledge about IdPs, how to access your organization’s IdP, which values to add to Cortex XSIAM, and which values to add to your IdP fields.
- To set up SSO authentication in the tenant, you must be assigned an Instance Administrator or Account Admin role.
- SAML 2.0 users must log in to Cortex XSIAM using the FQDN (full URL) of the tenant. To allow login directly from the IdP to the tenant, you must set the relay state on the IdP to the FQDN of the tenant.
- If you have multiple tenants, you must set up the SSO configuration separately for each tenant, both in the IdP and in Cortex XSIAM.
- If you are using AWS SSO, the
Application ACS URLrefers to theSingle Sign-On URLand theApplication SAML Audiencerefers to theAudience URL (SP Entity ID). Both values can be copied from the Authentication Settings in Cortex XSIAM. - Unlike users who authenticate through the Customer Support Portal (CSP), users who log in via SSO do not require the Cortex User role to be assigned in the CSP. Their access and permissions are governed by the SAML Group Mapping configured in Cortex XSIAM.
Identity provisioning and de-provisioning lifecycle
Just-In-Time (JIT) account creation
When an enterprise user authenticates through your configured Identity Provider (IdP) for the very first time, an explicit user account entry is dynamically generated inside the platform via Just-In-Time (JIT) provisioning. Once provisioned, this newly formed user identity appears within the primary Users Table console.
Following initial JIT creation, administrators can open the account entry to assign targeted Access Management controls, defining precise Roles and granular data Scopes. You can choose to select an optional global Default Role parameter within the general SSO configuration menu to automatically apply baseline permissions to newly provisioned users.
To maintain a secure posture, it is critical that this Default Role is configured with the least-privileged permissions possible (such as read-only or a basic viewer role) to ensure users without explicit role or group assignments inherit minimal access by default.
Security minimization best practice
If a Default Role is utilized for JIT automation, it is strongly recommended to restrict this role to the most minimal, low-privilege read-only permissions possible. This ensures that if a platform administrator forgets to manually apply an explicit target role or scope assignment to a newly synced user, that account remains structurally isolated from sensitive security controls or data views.
Once account objects successfully register via JIT login, administrators can manually pair those known identities directly with local Custom Cortex User Groups within the console.
Deprovisioning and account disabling actions
- Identity Provider (IdP) account suspensions: If a user account is deleted, suspended, or disabled directly within your organization's external Identity Provider (IdP), that target user is blocked from executing any further single sign-on validation attempts into Cortex XSIAM if you set SSO as the authentication method, taking effect upon their next login sequence. For continuity tracking purposes, the historical record for that user will continue to populate inside the internal console Users table until an inactivity threshold triggers a backend purge. For more information, see the [Inactivity removal cycles] policy explained directly below.
- Inactivity removal cycles: For accounts bound to both single sign-on (SSO) pipelines and native Customer Support Portal (CSP) infrastructure, identity profiles and group mappings are automatically purged and removed from the platform console following a specified period of prolonged system inactivity. This inactivity threshold is explicitly configured by navigating to Settings → Configurations → General → Security Settings and selecting Enabled from the Deactivate Inactive User drop-down menu. Selecting this option exposes the Deactivation period field, which is set to 30 days by default, allowing administrators to specify the exact number of inactive days required to trigger user deactivation.
- Cloud Identity Engine (CIE) separation boundary: Disabling, removing, or changing user records directly inside the Cloud Identity Engine interface does not disable, modify, or block corresponding user accounts inside Cortex XSIAM. User lifecycle connectivity is governed purely by active IdP authentication responses or CSP invitation status.
If you are configuring Okta or Microsoft Entra ID, follow the procedure in Okta or Microsoft Entra ID. You can also adapt these instructions for use with any similar SAML 2.0 IdP.
- In Cortex XSIAM, go to Settings → Configurations → Access Management → Authentication Settings.
-
In the Login Options tab, toggle SSO Disabled to on.
You can see the SSO settings, so you can configure them according to your organization’s IdP.
-
If you want to add another SSO connection to enable managing user groups with different roles and different IdPs, click Add SSO Connection.
Different SSO parameters for an SSO are displayed to configure according to your organization’s additional IdP.
- The first SSO cannot be deleted; it can only be deactivated by toggling SSO Enabled to off.
The Domain parameter is predefined for the first SSO.
If you add additional SSO providers, you must provide the email Domain in the SSO Integration settings for all providers except the first. Cortex XSIAM uses this domain to determine to which identity provider to send the user for authentication.
- When mapping IdP user groups to Cortex XSIAM user groups, you must include the group attribute for each IdP you want to use. For example, if you are using Microsoft Entra ID and Okta, your Cortex XSIAM user group SAML Group Mapping field must include the IdP groups for each provider. Each group name is separated by a comma.
- Set the following parameters using your organization’s IdP, where the field parameters are explained in the tables below.
- General parameters
- IdP Attribute Mapping
- Advanced Settings (optional)
-
Save your changes.
Whenever an SSO user logs in to Cortex XSIAM, the following login options are available.
-
Sign-in with SSO
If you have enabled more than one SSO provider, an optional email field appears. If the user does not enter an email address or if the email address does not match an existing domain, the user is automatically directed to the default IdP provider (the first in the list of SSO providers in the Authentication Settings). If the user enters an email address and it matches a domain listed in the Domain field in the SSO Integration settings for one of your IdPs, Sign-In with SSO sends the user to the IdP associated with that email domain.
Programmatic constraint:
There is no public API endpoint available to provision or de-provision users programmatically within Cortex XSIAM. All target accounts must be initialized or explicitly managed using the native interactive Single Sign-On (SSO) or Customer Support Portal (CSP) interface workflows defined in this guide. To review the list of supported programmatic actions and ingestion endpoints, see the Cortex XSIAM API Reference guide.
-
General parameters
| Parameter | Description |
|---|---|
| IdP SSO or Metadata URL | <p>Select the option that meets your organization's requirements.</p><p>Indicates your SSO URL, which is a fixed, read-only value based on your tenant's URL using the format https://<name of tenant>.crtx.paloaltonetworks.com/idp/saml. For example, https://tenant1.crtx.paloaltonetworks.com/idp/saml</p><p>You need this value when configuring your IdP.</p> |
| IdP SSO URL | Specify your organization’s SSO URL, which is copied from your organization’s IdP. |
| Metadata URL | |
| Audience URI (SP Entity ID) | <p>Indicates your Service Provider Entity ID, also known as the ACS URL. It is a fixed, read-only value using the format, https://<name of tenant>.paloaltonetworks.com. For example https://tenant1.crtx.paloaltonetworks.com.</p><p>You need this value when configuring your organization’s IdP.</p> |
| Default Role | (Optional) Select the default role that you want any user to automatically receive when they are granted access to Cortex XSIAM through SSO. This is an inherited role and is not the same as a direct role assigned to the user. |
| IdP Issuer ID | Specify your organization’s IdP Issuer ID, which is copied from your organization’s IdP. |
| X.509 Certificate | Specify your X.509 digital certificate, which is copied from your organization’s IdP. |
| Domain | Relevant only for multiple SSOs. For one SSO, this is a fixed, read-only value. Associate this IdP with a specific email domain (user@<domain>). When logging in, users are redirected to the IdP associated with their email domain or to the default IdP if no association exists. |
IdP attribute mapping
These IdP attribute mappings are dependent on your organization’s IdP.
| Parameter | Description |
|---|---|
| Specify the email mapping according to your organization’s IdP. | |
| Group Membership | <p>Specify the group membership mapping according to your organization’s IdP.</p><div data-gb-custom-block data-tag="hint" data-style="info" class="hint hint-info"><p>Note</p><p>Cortex XSIAM requires the IdP to send the group membership as part of the SAML token. Some IdPs send values in a format that include a comma, which is not compatible with Cortex XSIAM. In that case, you must configure your IdP to send a single value without a comma for each group membership. For example, if your IdP sends the Group DN (a comma-separated list), by default, you must configure IdP to send the Group CN (Common Name) instead.</p></div> |
| First Name | Specify the first name mapping according to your organization’s IdP. |
| Last Name | Specify the last name mapping according to your organization’s IdP. |
Advanced settings
The following advanced settings are optional to configure and some are specific for a particular IdP.
| Parameter | Description |
|---|---|
| Relay State | (Optional) Specify the URL for a specific page that you want users to be directed to after they’ve been authenticated by your organization’s IdP and log in to Cortex XSIAM. |
| IdP Single logout URL | (Optional) Specify your IdP single logout URL provided by your organization’s IdP to ensure that when a user initiates a logout from Cortex XSIAM, the identity provider logs the user out of all applications in the current identity provider login session. |
| SP Logout URL | (Optional) Indicates the Service Provider logout URL that you need to provide when configuring a single logout from your organization’s IdP to ensure that when a user initiates a logout from Cortex XSIAM, the identity provider logs the user out of all applications in the current identity provider login session. This field is read-only and uses the following format https://<name of tenant>.crtx.paloaltonetworks.com/idp/logout, such as https://tenant1.crtx.paloaltonetworks.com/idp/logout. |
| Service Provider Public Certificate | (Optional) Specify your organization’s IdP service provider public certificate. |
| Service Provider Private Key (Pem Format) | (Optional) Specify your organization’s IdP service provider private key in Pem Format. |
| Remove SAML RequestedAuthnContext | <p>(Optional) Requires users to log in to Cortex XSIAM using additional authentication methods, such as biometric authentication.</p><p>Selecting this removes the error generated when the authentication method used for previous authentication is different from the one currently being requested. See here for more details about the RequestedAuthnContext authentication mismatch error.</p> |
| Force Authentication | (Optional) Requires users to reauthenticate to access the Cortex XSIAM tenant if requested by the idP, even if they already authenticated to access other applications. |
Troubleshoot SSO issues
The following list describes the common errors and issues when using SAML 2.0 authentication.
- Errors in your IdP could mean the Service Provider Entity ID and/or Service Identifier are not properly configured in the IdP or in the Cortex XSIAM settings.
- SAML attributes from the IdP are not properly mapped in Cortex XSIAM. The attributes are case sensitive and must exactly match in your IdP and in the Cortex XSIAM IdP Attributes Mapping.
- Group memberships from the IdP have not been properly mapped to Cortex XSIAM user groups. Verify the values your identity provider is sending, to properly map the groups in Cortex XSIAM.
- The identity provider is not configured to sign both the SAML response and the assertion on the login token. Your IdP must be configured to sign both to ensure a secure login.
- If you require further troubleshooting, we recommend using your browser's built-in developer tools or additional browser plugins to capture the login request and SAML token.
Set up Okta as the Identity Provider Using SAML 2.0
This topic provides specific instructions for using Okta to authenticate your Cortex XSIAM users. As Okta is a third-party software, specific procedures, and screenshots may change without notice. We encourage you to also review the Okta documentation for app integrations.
To configure SAML SSO in Cortex XSIAM, you must be a user who can access the Cortex XSIAM tenant and have either the Account Admin or Instance Administrator role assigned.
Task 1. Configure Okta Groups
Within Okta, assign users to groups that match the user groups they will belong to in Cortex XSIAM. Users can be assigned to multiple Okta groups and receive permissions associated with multiple user groups in Cortex XSIAM. Use an identifying word or phrase, such as Cortex XSIAM, within the group names. For example, Cortex XSIAM Analysts. This allows you to send only relevant group information to Cortex XSIAM, based on a filter you will set in the group attribute statement.
Create a list of the Okta groups and their corresponding Cortex XSIAM user groups (or the Cortex XSIAM user groups you intend to create) and save this list for later use when configuring user groups in Cortex XSIAM.
Task 2. Copy Single SSO and Audience URI Values from Cortex XSIAM
- In Cortex XSIAM, go to Settings → Configurations → Access Management → Authentication Settings.
- In the Login Options tab, toggle SSO Disabled to on.
- Expand the SSO Integration settings.
-
Copy and save the values for Single Sign-On URL and Audience URI (SP Entity ID).
Both values are needed to configure your IdP settings.
You cannot save the enabled SSO Integration at this time, as it requires values from your IdP.
Task 3. Configure Cortex XSIAM Application in Okta
- In Okta, create a Cortex XSIAM application and Edit the SAML Settings.
- Paste the Single sign-on URL and the Audience URI (SP Entity ID) that you copied from the Cortex XSIAM SSO settings. The Audience URI should also be pasted in the Default RelayState field, which allows users to log in to Cortex XSIAM directly from the Okta dashboard.
- Click Show Advanced Settings, verify that Okta is configured to sign both the response and the assertion signature for the SAML token, and then click Hide Advanced Settings.
-
Cortex XSIAM requires the IdP to send four attributes in the SAML token for the authenticating user.
- Email address
- Group membership
- First Name
- Last Name
Configure Okta to send group memberships of the users using the
memberOfattribute. Use the word or phrase you selected when configuring Okta groups (such as Cortex XSIAM) to create a filter for the relevant groups. - Copy the exact names of the attribute statements from Okta and save them, as they are required to configure the Cortex XSIAM SSO integration. In the example above, the names are FirstName, LastName, Email, and memberOf. The attribute names are case-sensitive.
Task 4. Copy IdP SSO URL, Identity Provider Issuer, and X.509 Certificate Values
- In Okta, from your Cortex XSIAM application page, click View SAML setup instructions. If you do not see this button, verify you are on the Sign On tab of the application.
- Copy and save the values for Identity Provider Single Sign-On URL, Identity Provider Insurer, and the X.509 Certificate. These values are needed to configure your Cortex XSIAM SSO Integration.
Task 5. Configure the Cortex XSIAM SSO Integration
- In Cortex XSIAM go to Settings → Configurations → Access Management → Authentication Settings.
- In the Login Options tab, toggle SSO Disabled to on.
- Expand the SSO Integration settings.
-
Use the following table to complete the SSO Integration settings, based on the values you saved from Okta.
Okta Cortex XSIAM Field Identity Provider Single Sign-On URL IdP SSO URL Identity Provider Issuer IdP Issuer ID X.509 Certificate X.509 Certificate - In the IdP Attributes Mapping section, enter the attribute names from Okta. The names are case-sensitive and must match exactly.
- Save your settings.
Task 6. Map SAML Group Memberships to Cortex XSIAM User Groups
- Select Settings → Configurations → Access Management → User Groups.
- Right-click a user group and select Edit Group.
- In the SAML Group Mapping field add the Okta group(s) that should be associated with this user group. Multiple groups should be separated with a comma. The Okta group name must match the exact value sent in the token.
- Save your settings.
- Repeat for each user group.
Task 7. Test SSO Login
-
Go to the Cortex XSIAM tenant URL and Sign-In with SSO.
Note
When using SAML 2.0, users are required to authenticate by logging in directly at the tenant URL. They cannot log in via Cortex Gateway.
- After authentication to Okta, you are redirected again to the Cortex XSIAM tenant.
-
When logged in, validate that you have been assigned the proper roles.
To view your role and any role assigned to a user group you are a member of, click your name in the bottom left-hand corner, and click About.
Set up Microsoft Entra ID as the Identity Provider Using SAML 2.0
This topic provides specific instructions for using Microsoft Entra ID (formerly Azure AD) to authenticate your Cortex XSIAM users. As Microsoft Entra ID is a third-party software, specific procedures, and screenshots may change without notice. We encourage you to also review the Microsoft Entra ID documentation.
To configure SAML SSO in Cortex XSIAM, you must be a user who can access the Cortex XSIAM tenant and have either the Account Admin or Instance Administrator role assigned.
The following video is a step-by-step guide configuring SSO for Microsoft Entra ID: Microsoft Entra ID SSO.
Task 1. Configure Microsoft Entra ID Security Groups
Within Microsoft Entra ID, assign users to security groups that match the user groups they will belong to in Cortex XSIAM. Users can be assigned to multiple Microsoft Entra ID groups and receive permissions associated with multiple user groups in Cortex XSIAM. Use an identifying word or phrase, such as Cortex XSIAM, within the group names. For example, Cortex XSIAM Analysts. This allows you to send only relevant group information to Cortex XSIAM, based on a filter you will set in the group attribute statement.
Task 2. Copy Single SSO and Audience URI Values from Cortex XSIAM
- In Cortex XSIAM go to Settings → Configurations → Access Management → Authentication Settings.
-
In the Login Options tab, toggle SSO Disabled to on.
By default, SSO is disabled in Cortex XSIAM.
- Expand the SSO Integration settings.
-
Copy and save the values for Single Sign-On URL and Audience URI (SP Entity ID).
Both values are needed to configure your IdP settings.
Important
When copying the Single Sign-On URL value, remove
idp/samland leave the trailing/.For example, if the Single Sign-On URL is
https://clientname.panproduct.region.paloaltonetworks.com/idp/saml, just copyhttps://clientname.panproduct.region.paloaltonetworks.com/. - You cannot save the enabled SSO Integration at this time, as it requires values from your IdP.
Task 3. Configure Cortex XSIAM Application in Microsoft Entra ID
-
From within Microsoft Entra ID, create a Cortex XSIAM application and Edit the Basic SAML Configuration.
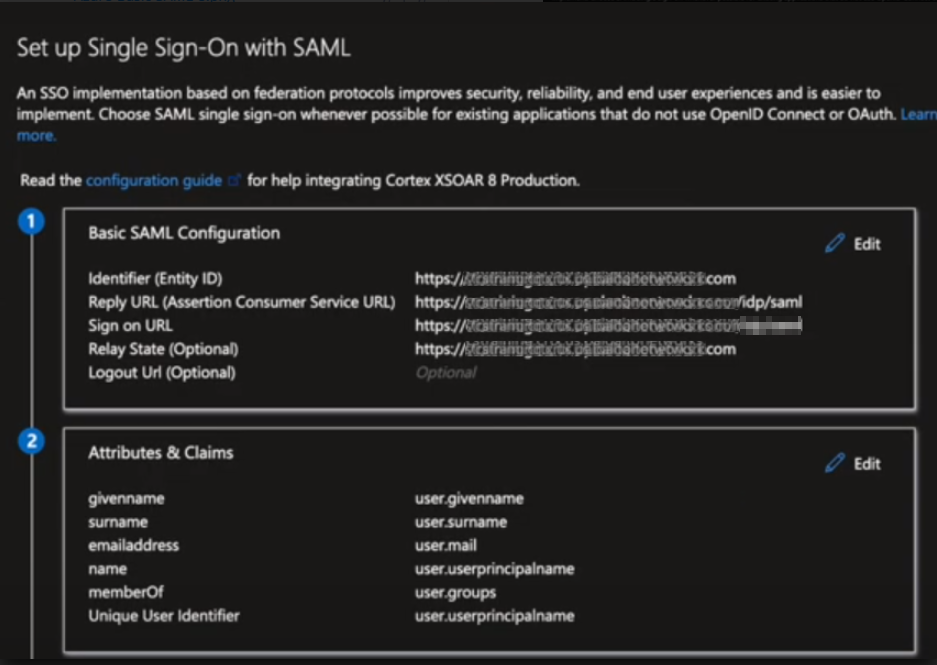
-
Paste the Single sign-on URL and the Audience URI (SP Entity ID) that you copied from the Cortex XSIAM SSO settings. The Single sign-on URL from Cortex XSIAM should be pasted in the Reply URL and the Sign on URL fields. The Audience URI (SP Entity ID) value from Cortex XSIAM should be pasted in the Identifier (Entity ID) and Relay State fields. This allows users to log in to Cortex XSIAM directly from Microsoft Entra ID.
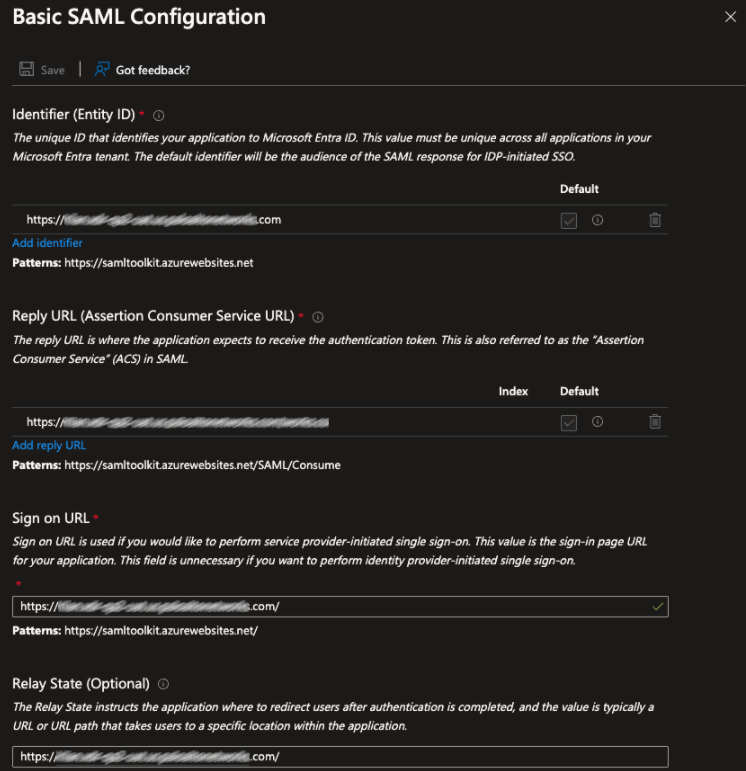
-
In the SAML Certificates section, click Edit and verify that Microsoft Entra ID is configured to sign both the response and the assertion.
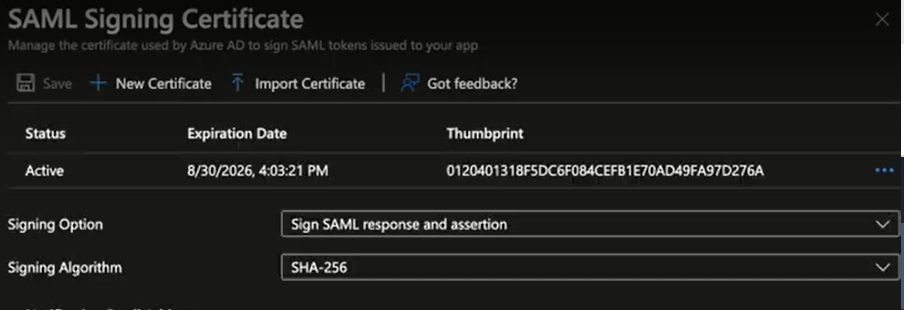
-
To have Microsoft Entra ID send group membership for the user in the SAML token, you must + Add a group claim in the Attributes & Claims section. Send the Security groups, using the source attribute Group ID. Use the word or phrase you selected when configuring Microsoft Entra ID security groups (such as Cortex XSIAM) to create a filter. Customize the name of the group claim as memberOf.
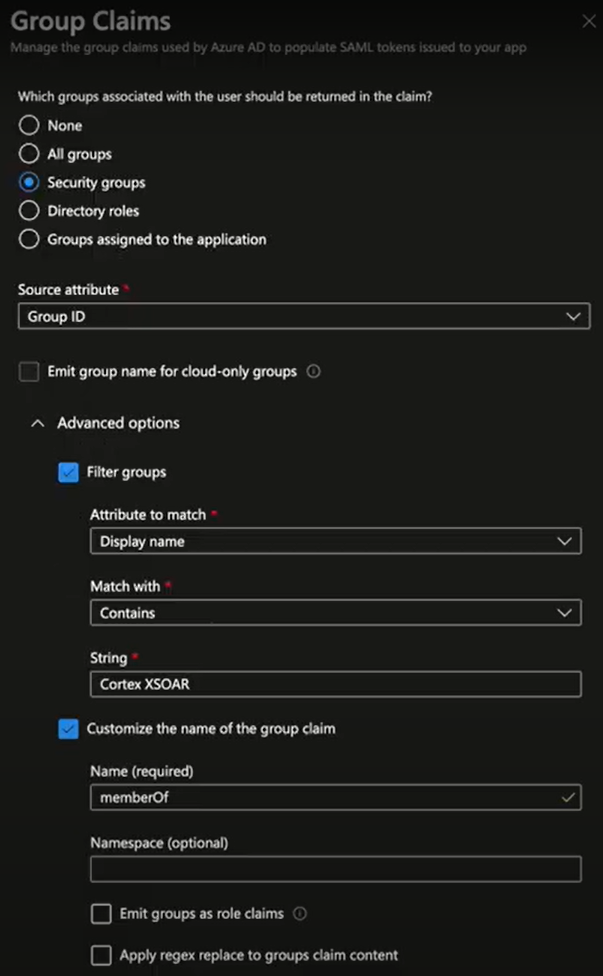
-
In addition to group membership, verify that there are also claims for:
- Email address
- First Name
- Last Name
Task 4. Copy Login URL, Microsoft Entra ID Identifier, and Attribute Claims
-
In Microsoft Entra ID, from the Single sign-on page, in the Set up Cortex XSIAM Production section, copy the values for the Login URL and Microsoft Entra ID Identifier. You need these values to configure the SSO Integration in Cortex XSIAM.
-
Edit Attributes & Claims and copy the values in the Claim name column. The claim name is case sensitive. You need these values to configure the SSO Integration in Cortex XSIAM.
Note
The default attributes shown on the main single sign-on page in Microsoft Entra ID are not the values you need. You must click Edit next to Attributes and Claims to view and copy the actual values.
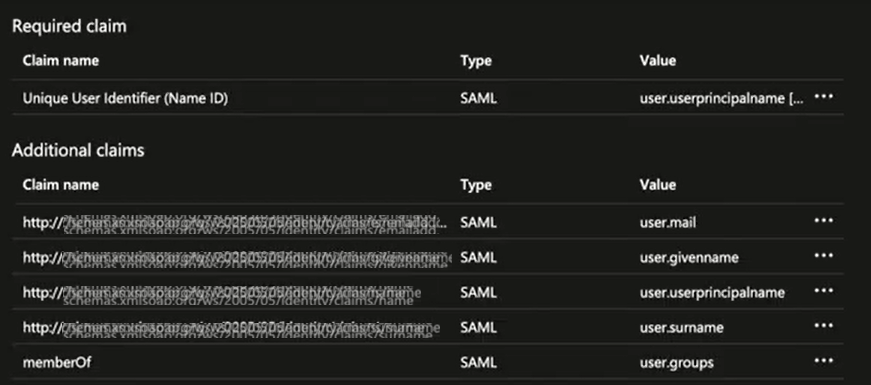
Task 5. Download the Certificate
From the SAML Certificates section in Microsoft Entra ID, Download the Certificate (Base64). You need the contents of this file to configure the Cortex XSIAM SSO Integration.
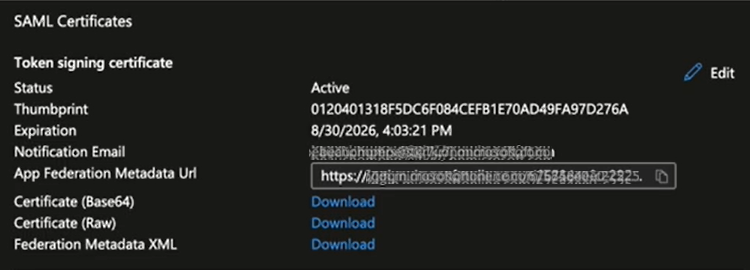
Task 6. Copy the Source IDs for Microsoft Entra ID Security Groups
The claim for the membership attribute that is sent to Cortex XSIAM uses the Object Id of the group. The Object Id is different from the Microsoft Entra ID security group name. You can find the Object Id for each of your Microsoft Entra ID security groups by navigating to Users and groups in Microsoft Entra ID, clicking on the group name, and viewing the Object id. Create a list of the group names and corresponding Object Ids for every Microsoft Entra ID security group you want to map to a Cortex XSIAM user group.
Task 7. Configure the Cortex XSIAM SSO Integration
- In Cortex XSIAM go to Settings → Configurations → Access Management → Authentication Settings.
-
In the Login Options tab, toggle SSO Disabled to on.
By default, SSO is disabled in Cortex XSIAM.
- Expand the SSO Integration settings.
-
Use the following table to complete the SSO Integration settings, based on the values you saved from Microsoft Entra ID.
Microsoft Entra ID Cortex XSIAM Field Login URL IdP SSO URL Microsoft Entra ID Identifier IdP Issuer ID Contents of the downloaded certificate file. X.509 Certificate -
In the IdP Attributes Mapping section, enter the attribute claim names from Microsoft Entra ID. The names are case sensitive and must match exactly.
Note
The attribute claim name must exactly match the value sent by your IdP. In some cases, this may be the full attribute name/namespace, depending on the configuration of our IdP
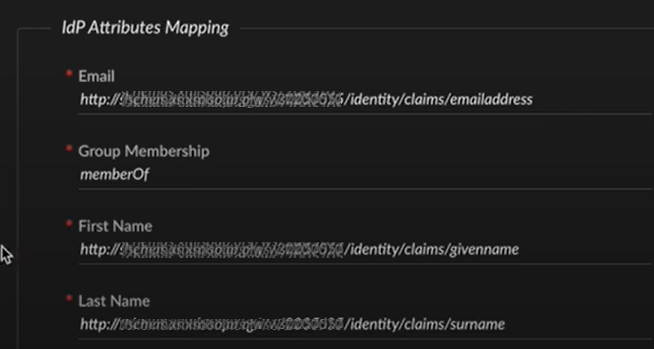
- (Optional) Under Advanced Settings, select the checkboxes for ADFS and Compress encode URL (ADFS). In some circumstances, these fields may be required by your Microsoft Entra ID configuration.
- Save your settings.
Task 8. Map SAML Group Memberships to Cortex XSIAM User Groups
- Select Settings → Configurations → Access Management → User Groups.
- Right-click a user group and select Edit Group.
- In the SAML Group Mapping field add the Microsoft Entra ID group(s) Object Ids that should be associated with this user group. Multiple Object Ids should be separated with a comma. The Microsoft Entra ID group Object Id must match the exact value sent in the token.
- Save your settings.
- Repeat for each user group.
Task 9. Test SSO Login
-
Go to the Cortex XSIAM tenant URL and Sign-In with SSO.
Note
When using SAML 2.0, users are required to authenticate by logging in directly at the tenant URL. They cannot log in via Cortex Gateway.
- After authentication to Microsoft Entra ID, you are redirected again to the Cortex XSIAM tenant.
-
When logged in, validate that you have been assigned the proper roles.
To view your role and any role assigned to a user group you are a member of, click your name in the bottom left-hand corner, and click About.
Configure content
Cortex XSIAM enables you to collect data across a vast and varied enterprise landscape. This necessitates distinct data source types designed for different environments and needs:
- Standard data collectors (API/Built-in): These are built-in functionalities primarily focused on ingesting raw logs and security events for core security analysis, parsing, and normalization. They often involve direct API connections, such as Okta and CrowdStrike, or file collection tools, such as Amazon S3.
- Broker VM data collector applets: These are modular applications installed on a local Broker VM virtual appliance, designed for on-premise data collection needs like the Syslog Collector or Database Collector.
- XDR Collectors (XDRC): These are lightweight agents dedicated to on-premise log collection on Windows and Linux host machines, typically gathering logs and events using tools such as Filebeat or Winlogbeat.
- Cloud Service Provider (CSP) Onboarding: These are specialized wizards for integrating cloud environments, including AWS, Azure, GCP, and OCI, enabling streamlined setup for asset discovery, posture/runtime security, and log collection.
- Marketplace content packs: These packages offer specialized security functionality by bundling both a collection integration (for data ingestion) and automation components, such as playbooks and correlation rules. Note that not all data collectors have a corresponding Marketplace content pack.
Cortex XSIAM enables you to ingest data from a wide range of third-party vendors and security services. For many popular vendors, we offer a choice between distinct types of data sources to fit your needs:
- Standard data sources (also called data collectors)
- Cloud Service Provider (CSP) onboarding data sources
- Content pack integrations
| Data Source Type | Primary Use | Configuration Method | Cortex XSIAM Features | Recommendation |
|---|---|---|---|---|
| Standard data source (also called data collectors) | Ingesting raw logs and events. | Configured in the Data Sources & Integrations page using the Data Source Onboarder. | Limited to data ingestion, parsing, and normalization. | Choose this if you only need raw data ingestion. |
| Cloud Service Provider (CSP) onboarding data source | Ingest cloud assets | Configured in the Data Sources & Integrations page using the cloud service provider (CSP) onboarding wizard. | Designed to facilitate the seamless setup of CSP data into Cortex XSIAM. Requires minimal user input; simply define the scope of your CSP accounts and specify the scan mode. For full control of the CSP setup, you can use the advanced settings. Based on the onboarding settings, Cortex XSIAM generates an authentication template to establish trust to the CSP and grant permissions to Cortex XSIAM. | |
| Content pack integration | Ingesting data and enabling rich security functionality. | <p>Configured via a content pack downloaded from Marketplace by either:</p><ul><li>Using the Data Source Onboarder on the Data Sources & Integrations page (if available)</li><li>Installing the content pack from Settings → Configurations → Marketplace, and then configuring the integration instance on the Data Sources & Integrations page.</li></ul> | Includes: Data ingestion, parsing, normalization, plus built-in commands and automations, such as playbooks, scripts, correlation rules, and data model rules. | <p>Choose this option for any of the following reasons:</p><ul><li>You need to define automations.</li><li>You need to collect data that is not covered by a standard collector.</li><li>You need to install rules or automations relevant to integrations or data sources.</li></ul> |
To add a new data source, see Add a new data source or instance.
To add a content pack from Marketplace, see Install content packs.
Set up Cloud Identity Engine
The Cloud Identity Engine provides both user identification and user authentication for a centralized cloud-based solution in on-premise, cloud-based, or hybrid network environments. The Cloud Identity Engine allows you to write security policy based on users and groups, not IP addresses, and helps secure your assets by enforcing behavior-based security actions. It also provides the flexibility to adapt to changing security needs and users by making it simpler to configure an identity source or provider in a single unified source of user identity, allowing scalability as needs change. By continually syncing the information from your directories, whether they are on-premise, cloud-based, or hybrid, ensures that your user information is accurate and up to date and policy enforcement continues based on the mappings even if the cloud identity provider is temporarily unavailable.
To provide user, group, and computer information for policy or event context, Palo Alto Networks cloud-based applications and services need access to your directory information. The Cloud Identity Engine, a secure cloud-based infrastructure, provides Palo Alto Networks apps and services with read-only access to your directory information for user visibility and policy enforcement. The components of the Cloud Identity Engine deployment vary based on whether the Cloud Identity Engine is accessing an on-premises directory (such as Active Directory) or a cloud-based directory (such as Microsoft Entra ID).
The authentication component of the Cloud Identity Engine allows you to configure a profile for a SAML 2.0-based identity provider (IdP) that authenticates users by redirecting their access requests through the IdP before granting access. You can also configure a client certificate for user authentication. When you configure an Authentication policy and the Authentication Portal on the Palo Alto Networks firewall, users must log in with their credentials before they can access the resource.
Guidelines for using Cloud Identity Engine with Cortex XSIAM
Keep in mind the following guidelines:
- Cloud Identity Engine is an optional service.
- Cloud Identity Engine must be activated in the same region as Cortex XSIAM.
- You can use Active Directory information in policy configuration and endpoint management.
- Cortex XSIAM supports on-premises Active Directory and Microsoft Entra.
- You can use XQL Query to query the data using the
pan_dss_rawdataset.
Activate Cloud Identity Engine
Activating a Cloud Identity Engine instance on your Cortex XSIAM account will allow you to pair your Cortex XSIAM tenant with the Active Directory information collected by the Cloud Identity Engine instance.
Configure Cortex XSIAM with Cloud Identity Engine
After you complete the activation steps, wait about ten minutes and do the following:
- Log in to Cortex XSIAM.
- Select Settings → Configuration → Integrations → Cloud Identity Engine.
- In the Add Cloud Identity Engine dialog box, select the instance name and click Save.
Risk sharing between Cortex XSIAM and the Cloud Identity Engine
Integrate Cortex XSIAM with the Cloud Identity Engine (CIE) to enable dynamic user grouping and access control based on real-time risk assessments. This integration leverages historical events and alerts from Cortex XSIAM to continuously evaluate user and host risk, synchronizing the insights with CIE to support adaptive policy enforcement. When an Okta tenant with an Identity Threat Protection (ITP) license is available, CIE can be connected to Okta to create and apply adaptive policies directly within the Okta environment, based on Cortex Risky users sharing, ensuring responsive and risk-based identity management.
Before you activate the integration, you must complete the onboarding in the Cloud Identity Engine.
- Configure Cortex XSIAM with Cloud Identity Engine.
- In the Cloud Identity Engine, onboard the relevant directories, Active Directory, Entra ID, or Okta.
-
In Cortex XSIAM, go to Settings → Configuration → Integrations → Cloud Identity Engine and select Activate risk signal sharing to CIE.
Note
The Activate risk signal sharing to CIE checkbox is available only after the second step is completed.
Install Cortex XDR agents
The Cortex XDR agent monitors endpoint activity and collects endpoint data that Cortex XSIAM uses to generate issues. Before you can begin collecting endpoint data, you must create an agent installation package and then install the Cortex XDR agent.
Create an agent installation package
To install the Cortex XDR agent on the endpoint for the first time, create an agent installation package. Review Where can I install the Cortex XDR agent for supported versions and operating systems.
To install the Cortex XDR agent software, you must use a valid installation package that exists in your Cortex XSIAM management console. If you delete an installation package, new agents installed from this package are not able to register with Cortex XSIAM; however, existing agents may re-register using the Agent ID generated by the installation package.
- From Cortex XSIAM, select Inventory → Endpoints → Agent Installations.
- Click Create to create a new installer.
-
Enter a unique name and an optional description to identify the installation package.
The package name can contain letters, numbers, hyphens, underscores, commas, and spaces, and should not exceed 100 characters.
- Select the Package Type:
- Standalone Installer: Use for fresh installations and to upgrade agents on a registered endpoint that is connected to Cortex XSIAM.
- Upgrade from ESM: Use this package to upgrade Traps agents which connect to the on-premises Traps Endpoint Security Manager to Cortex XSIAM. For more information, see Migrate from Traps Endpoint Security Manager.
- (Linux only) Kubernetes Installer: Use for fresh installations and upgrades of Cortex XDR agents running on Kubernetes clusters.
- CaaS: Create the Cortex XDR container-embedded agent Dockerfile.
- Helm Installer: Use this package for fresh installations and upgrades of Cortex XDR agents running on Kubernetes clusters.
- Serverless Installer: Create an installation package for a serverless function to deploy to your runtime platform.
Guidelines for Kubernetes installer
- Settings for the Kubernetes installer cannot be changed after you create the installation package.
-
For Version, select the desired Cortex XDR agent version.
If the option Always deploy the latest agent version is displayed, do not select it.
- For the Agent Daemonset Namespace, it is recommended to use the default cortex-xdr namespace.
- For a more granular deployment, enter any labels or selectors in the Node Selector. The Cortex XDR agent will be deployed only on these nodes.
- To configure the Cortex XDR agent to communicate through a proxy, enter either the IP address and port number or the FQDN and port number. When you enter the FQDN, you can use both lowercase and uppercase letters. Avoid using special characters or spaces. Use commas to separate multiple addresses.
Guidelines for CaaS container-embedded installer
How to create an agent package for CaaS Workloads:
Before you deploy the container-embedded agent, verify the following:
Requires the Cortex Cloud Runtime Security or Cortex XSIAM Premium license. Every 10 container-embedded agents will consume a single Cortex Runtime Security license.
Prerequisites
| Supported Environments | <p>The following managed container services are supported:</p><ul><li>AWS ECS Fargate; containers using x86_64 and AArch64 architecture</li></ul> |
|---|---|
| Requirements | <p>Cortex XDR agent version 9.2.0 or later</p><p>Required resources per container:</p><ul><li>Disk space: 1.5 GB</li><li>1 CPU</li><li>Memory: 512 MB</li></ul><p>Dockerfile requirements:</p><ul><li>SYS_PTRACE must be enabled</li></ul><p>Assets discovery: Onboard the relevant AWS environments</p><p>Drift detection: Container registry image scanning</p> |
| Limitations | Alpine Linux and other musl-based distributions are not supported for container-embedded deployments. |
Create the container-embedded agent Dockerfile via API:
See the API reference guide: Create Distributions
Create the container-embedded agent Dockerfile via user interface:
- Go to Inventory → Endpoints → Installations, click Create.
- Select CaaS Deployment as the Package Type and Container Embedded as the Deployment Type.
- Select the installer details to define the configuration settings for version and proxy (optional).
- Upload your Dockerfile. Cortex XSIAM validates your Dockerfile against the technical prerequisites.
- A new Agent Installation instance will be created. Right-click it and download the newly generated Dockerfile.
Embed the Agent container-embedded agent Dockerfile into your container image:
- Select the newly generated Dockerfile.
- Re-build your container image using the newly generated Dockerfile.
- During the build process, the agent binary will be fetched from the Cortex repository and baked into the image.
- Once the build process is successfully finished, you are ready to use the new container image in your CaaS environments, based on the prerequisites above.
Guidelines for serverless installer
How to create an agent package for a serverless function:
- Go to Inventory+Endpoints+Installations and click Create.
- Add a name and description, and add any endpoint tags that will be added to the agent as part of the installation process.
- For Package Type, select Serverless Function.
- Configure the following settings for Serverless Function:
- For Version, select the required Cortex agent version.
- For Cloud Provider, AWS is configured for this release.
- For Runtime, select one of the environments:
- node.js
- python
- For Deployment Type, select the type:
- Embedded
- AWS Layers
- If node.js and the deployment type AWS Layers are selected, select one of the Modules:
- ECMAScript
- CommonJS
- For Embed Default Profile From, select from the profile rules configured for serverless functions.
NOTE:
The profile will be applied if the security policy cannot be retrieved in real-time.
The package is created and ready to be deployed.
How to deploy the package to your runtime environment:
- From Cortex XSIAM, go to Inventory+Endpoints+Installations and from the Agent Installations page, right click and select View Installation Instructions.
- Depending on the runtime environment, the instructions are slightly different.
- Agent installation package for embedded python:
- Download the serverless agent bundle.
- Log in to your AWS Management Console.
- Navigate to the AWS Lambda service, and unzip the serverless agent bundle in the main folder.
- Add the serverless agent to the function by importing the Cortex library and wrapping the function’s handler.\
The Cortex serverless library must be imported after other libraries to activate the hooks that enable auditing.
- Agent installation package for embedded node.js:
- Download the serverless agent bundle.
- Log in to your AWS Management Console.
- Navigate to the AWS Lambda service, and unzip the serverless agent bundle in the main folder.
- Add the serverless agent to the function by importing the Cortex library and wrapping the function’s handler.
- Agent installation package for node.js using AWS Layers in ECMAScript (JavaScript) runtime/Agent installation package for node.js in AWS Lambda using AWS Layers with CommonJS module format:
- Download the serverless agent bundle.
- Log in to your AWS Management Console.
- Navigate to the AWS Lambda service, and upload the layer and add it to the function’s configuration.
- Save the current Lamba handler setting in the ORIGINAL_HANDLER environment variable.
- Change the Lambda handler setting to cortex.handler.
- Agent installation package for python using AWS Layers in python runtime/Agent installation package for python in AWS Lambda using AWS Layers with python module format:
- Download the serverless agent bundle.
- Log in to your AWS Management Console.
- Create a new AWS layer with the downloaded bundle, copy the new layer ARN value, and add the new layer using the copied ARN.
- Save the current Lamba handler setting in the ORIGINAL_HANDLER environment variable.
- Change the Lambda handler setting to cortex.handler.
- Agent installation package for embedded python:
- Select the platform and relevant settings, and then click Create.\
Cortex XSIAM prepares your installation package and displays it on the Agent Installations page. -
Download your installation package.\
When the status of the package showsCompleted, right-click the package, and click Download. -
Select the platform and relevant settings, and then click Create.
Cortex XSIAM prepares your installation package and displays it on the Agent Installations page.
-
Download your installation package.
When the status of the package shows
Completed, right-click the package, and click Download.
Deploy installation packages
After you create and download an installation package, you can then install it directly on an endpoint or you can use a software deployment tool, such as JAMF or GPO, to distribute the software to multiple endpoints.
- For Windows endpoints, select the architecture type. You can download the installer msi file only or a distribution package that includes both the installer msi file and the latest content zip. The distribution package is recommended to reduce the network load and time typically required for the initial roll-out or major upgrades of the Cortex XDR agent. To understand the benefits, workflow, and requirements to support this type of deployment, refer to the Cortex XDR Agent Administrator Guide.
- For macOS endpoints, download the ZIP installation folder and upload it to the endpoint. To deploy the Cortex XDR agent using JAMF, upload the ZIP folder to JAMF. Alternatively, to install the agent manually on the endpoint, unzip the ZIP folder and double-click the pkg file.
- For Linux endpoints, you can download .rpm or .deb installers (according to the endpoint Linux distribution), and deploy the installers on the endpoints using the Linux package manager. Alternatively, you can download a Shell installer and deploy it manually on the endpoint.
- For Kubernetes clusters on Linux endpoints, download the YAML file. We strongly recommend that you do not edit this file.
- For Android endpoints, Cortex XDR creates a tenant-specific download link that you can distribute to Android endpoints. When a newer agent version is available, Cortex XDR identifies older package versions as [Outdated].
Related information
Endpoint data collection
When the Cortex XDR agent generates an issue on endpoint activity, a minimum set of metadata about the endpoint is sent to the server.
When you enable behavioral threat protection or EDR data collection in your endpoint security policy, the Cortex XDR agent can also continuously monitor endpoint activity for malicious event chains identified by Palo Alto Networks. The endpoint data that the Cortex XDR agent collects when you enable these capabilities varies by platform type.
Metadata collected for Cortex XDR agent issues
When the Cortex XDR agent generates an issue on endpoint activity, the following metadata is sent to the server:
| Field | Description |
|---|---|
| Absolute timestamp | Kernel system time |
| Relative timestamp | Uptime since the computer started |
| Thread ID | ID of the originating thread |
| Process ID | ID of the originating process |
| Process creation time | Part of the process unique ID per boot session (PID + creation time) |
| Sequence ID | Unique integer per boot session |
| Primary user SID | Unique identifier of the user |
| Impersonating user SID | Unique identifier of the impersonating user, if applicable |
EDR data collected for Windows endpoints
| Category | Events | Attributes |
|---|---|---|
| Mount a device (volume and hardware) | <ul><li>Mount</li><li>Unmount</li></ul> | <ul><li>Storage device name</li><li>Storage device class GUID</li><li>Storage device class name</li><li>Storage device bus type</li><li>Storage device volume GUID</li><li>Storage device mount point</li><li>Storage device drive type</li><li>Storage device vendor ID</li><li>Storage device product ID</li><li>Storage device serial number</li><li>Storage device virtual volume image</li></ul> |
| Executable metadata | Process start | <ul><li>File size</li><li>File access time</li></ul> |
| Files | <ul><li>Create</li><li>Write</li><li>Delete</li><li>Rename</li><li>Move</li><li>Modification</li><li>Symbolic links</li><li>Read</li></ul> | <ul><li>Full path of the modified file before and after modification</li><li>SHA256 and MD5 hash for the file after modification</li><li>SetInformationFile for timestamps</li><li>File set security (DACL) information</li><li>Resolve hostnames on local network</li><li>Symbolic-link/hard-link and reparse point creation</li><li>File device type (regular file or Named Pipe)</li></ul> |
| Image (DLL) | Load | <ul><li>Full path</li><li>Base address</li><li>Target process-id/thread-id</li><li>Image size</li><li>Signature</li><li>SHA256 and MD5 hash for the DLL</li><li>File size</li><li>File access time</li></ul> |
| Process | <ul><li>Create</li><li>Terminate</li></ul> | <ul><li>Process ID (PID) of the parent process</li><li>PID of the process</li><li>Full path</li><li>Command line arguments</li><li>Integrity level to determine if the process is running with elevated privileges</li><li>Hash (SHA256 and MD5)</li><li>Signature or signing certificate details</li></ul> |
| Thread | Injection | <ul><li>Thread ID of the parent thread</li><li>Thread ID of the new or terminating thread</li><li>Process that initiated the thread if from another process</li></ul> |
| Network | <ul><li>Accept</li><li>Connect</li><li>Create</li><li>Listen</li><li>Close</li><li>Bind</li></ul> | <ul><li>Source IP address and port</li><li>Destination IP address and port</li><li>Failed connection</li><li>Protocol (TCP/UDP)</li><li>Resolve hostnames on local network</li></ul> |
| Network protocols | <ul><li>DNS request and UDP response</li><li>HTTP connect</li><li>HTTP disconnect</li><li>HTTP proxy parsing</li></ul> | <ul><li>Origin country</li><li>Remote IP address and port</li><li>Local IP address and port</li><li>Destination IP address and port if proxy connection</li><li>Network connection ID</li><li>IPv6 connection status (true/false)</li><li>External hostname</li></ul> |
| Network statistics | <ul><li>On-close statistics</li><li>Periodic statistics</li></ul> | <ul><li>Upload volume on TCP link</li><li>Download volume on TCP link</li></ul><p>Traps sends statistics both when a connection is closed, and at periodic intervals while the connection remains open.</p> |
| Registry | <ul><li><p>Registry value:</p><ul><li>Deletion</li><li>Set</li></ul></li><li><p>Registry key:</p><ul><li>Creation</li><li>Deletion</li><li>Rename</li><li>Addition</li><li>Modification (set information)</li><li>Restore</li><li>Save</li></ul></li></ul><p>Registry key is collected as a real key name, and not as a symbolic link.</p><p>Instead of HKEY_LOCAL_MACHINE\System\CurrentControlSet, which is a symbolic link, KEY_LOCAL_MACHINE\System\ControlSet001 will be collected.</p><p></p><p>Instead of HKEY_CURRENT_USER, HKEY_USERS<SID> will be collected, where SID is a SID of the current user.</p><p></p> |
<ul><li>Registry path of the modified value or key</li><li>Name of the modified value or key</li><li>Data of the modified value</li></ul> |
| Session | <ul><li>Log on</li><li>Log off</li><li>Connect</li><li>Disconnect</li></ul> | <ul><li>Interactive log-on (log-on at a computer console using credentials such as a username and password)</li><li>Session ID</li><li>Session State (equivalent to the event type)</li><li>Local (physically on the computer) or remote (connected using a terminal services session)</li></ul> |
| Host status | <ul><li>Boot</li><li>Suspend</li><li>Resume</li></ul> | <ul><li>Host name</li><li>OS Version</li><li>Domain</li><li>Previous and current state</li></ul> |
| Agent status | Agent start | |
| User presence | User Detection | Detection when a user is present or idle per active user session on the computer. |
| RPC calls | <ul><li>RpcCall</li><li>RpcPreCall</li></ul> | <ul><li>action_rpc_interface_uuid</li><li>action_rpc_interface_version_major</li><li>action_rpc_interface_version_minor</li><li>action_rpc_func_opnum</li><li>action_rpc_func_str_call_fields (optional)</li><li>action_rpc_func_int_call_fields (optional)</li><li>action_rpc_interface_name</li><li>action_rpc_func_name</li></ul> |
| System calls | Syscall types change frequently, and can be observed in each event's data. | <ul><li>action_syscall_string_params</li><li>action_syscall_int_params</li><li>action_syscall_target_instance_id</li><li>action_syscall_target_image_path</li><li>action_syscall_target_image_name</li><li>action_syscall_target_os_pid</li><li>action_syscall_target_thread_id</li><li>address_mapping</li></ul> |
| Event log | See the table below for the list of Windows Event Logs that can be sent to the server. | |
| .Net events | <ul><li>.NET DLL Loaded</li><li>.NET DLL Loaded From Buffer</li><li>Amsi Bypass Attempt</li><li>Suspicious .NET To Win32 Calls</li><li>.NET To Native Shellcode Execution Attempt</li><li>Malicious C# Compilation and Execution Attempt</li><li>Powershell Script Execution</li><li>Obfuscated Powershell Execution Attempt</li><li>Deserialization Exploit Attempt</li><li>Webshell Execution Attempt</li><li>Suspicious ASPX execution</li><li>Exchange Vulnerability Attempt</li><li>SharePoint JWT Vulnerability Attempt</li></ul> | <ul><li>DotNetCommon_DotnetCallstack</li><li>DotNetCommon_CLRVersion</li><li>DotNetCommon_ContentVersion</li><li>DotNetCommon_EdrAssemblyVersion</li><li>DotNetCommon_AppDomainId</li><li>Other attributes may be added, depending on the event type and context.</li></ul> |
Windows event logs collected for Windows endpoints
Cortex XDR agents can send the following Windows Event Logs to the tenant.
Cortex XSIAM saves the Windows event logs both in xdr_data and in the microsoft_windows_raw dataset.
For more information on how to set up Windows event logs collection, see Microsoft Windows security auditing setup.
| Path | Provider | Event IDs and Description |
|---|---|---|
| Application | EMET | |
| Application | Windows Error Reporting | Only for Windows Error Reporting (WER) events when an application stops unexpectedly |
| Application | Microsoft-Windows-User Profiles Service | <ul><li>1511: A user logged on with a temporary profile because Windows could not find the user's local profile.</li><li>1518: A profile could not be created using a temporary profile</li></ul> |
| Application | Application Error | 1000: Application unexpected stop/hang events, similar to WER/1001. These events include the full path to the EXE file, or to the module with the fault. |
| Application | Application Hang | 1002: Application unexpected stop/hang events, similar to WER/1001. These events include the full path to the EXE file, or to the module with the fault. |
| Microsoft-Windows-LDAP-client | 30: Windows Event Collector (WEC) recommended event | |
| Microsoft-Windows-CAPI2/Operational | <p>Windows CAPI2 logging events:</p><ul><li>11: Build Chain</li><li>70: A Private Key was accessed</li><li>90: X509 object</li></ul> | |
| Microsoft-Windows-DNS-Client/Operational | 3008: A DNS query was completed without local machine name resolution events, and without empty name resolution events. | |
| Microsoft-Windows-DriverFrameworks-UserMode/Operational | 2004: Detection of User-Mode drivers loading, for potential BadUSB detection | |
| Microsoft-Windows-PowerShell/Operational | <ul><li>4103: Block an activity</li><li>4104: Remote command</li><li>4105: Start command</li><li>4106: Stop command</li></ul> | |
| Microsoft-Windows-PrintService | Microsoft-Windows-PrintService | |
| Microsoft-Windows-TaskScheduler/Operational | Microsoft-Windows-TaskScheduler | 106, 129, 141, 142, 200, 201 |
| Microsoft-Windows-TerminalServices-RDPClient/Operational | 1024: A terminal service (TS) attempted to connect to a remote server | |
| Microsoft-Windows-Windows Defender/Operational | <ul><li>1006: Microsoft Defender Antivirus detected suspicious behavior</li><li>1009: Microsoft Defender Antivirus restored an item from quarantine</li></ul> | |
| Microsoft-Antimalware-Scan-Interface | 1101: Anti-Malware Scan Interface (AMSI) content scan event | |
| Microsoft-Windows-Windows Defender/Operational | <ul><li>1116: Microsoft Defender Antivirus detected malware or other potentially unwanted software</li><li>1119: Microsoft Defender Antivirus encountered a critical error when taking action on malware or other potentially unwanted software</li></ul> | |
| Microsoft-Windows-Windows Firewall With Advanced Security/Firewall | Microsoft-Windows-Windows Firewall With Advanced Security | 2004, 2005, 2006, 2009, 2033: Windows Firewall With Advanced Security Local Modifications (Levels 0, 2, 4) |
| Security | 1102: The Security log cleared events | |
| Security | Microsoft-Windows-Eventlog | Event log service events specific to the Security channel |
| Security | <ul><li>4880: Certificate Authority Service stopped</li><li>4881: Certificate Authority Service started</li><li>4896: Certificate Authority database rows were deleted</li><li>4898: A Certificate Authority template was loaded</li></ul> | |
| Security | <p>Routing and Remote Access Service (RRAS) events (these are only generated on Microsoft IAS server)</p><ul><li>6272: User access was granted.</li><li>6280: User account unlocked</li></ul> | |
| Security | Microsoft-Windows-Security-Auditing | <ul><li>4624: Successful logon</li><li>4625: Failed logon</li><li>4634: Logoff</li><li>4647: User initiated logoff</li><li>4648: Logon attempted, explicit credentials</li><li>4649: Replay attack</li><li>4672: Special privileges attempted login</li><li>4768: Kerberos TGT request</li><li>4769: Kerberos service ticket requested</li><li>4770: Kerberos service ticket renewal</li><li>4771: Kerberos pre-authentication failed</li><li>4776: Domain controller validation attempt</li><li>4778: Session was reconnected to a Windows station</li><li>4800: Workstation locked</li><li>4801: Workstation unlocked</li><li>4802: Screensaver was invoked</li><li>4803: Screensaver was dismissed</li></ul> |
| Security | Microsoft-Windows-Security-Auditing | <ul><li>4720: A user account was created</li><li>4722: A user account was enabled</li><li>4723: An attempt was made to change an account's password</li><li>4724: An attempt was made to reset an account’s password</li><li>4725: A user account was disabled</li><li>4726: A user account was deleted</li><li>4727, 4731, 4754: Creation of Groups</li><li>4728, 4732, 4756: Group member additions</li><li>4729, 4733, 4757: Group member removals</li><li>4735, 4737, 4755, 4764: Group changes</li><li>4738: A user account was changed</li><li>4740: A user account was locked out</li><li>4741: A computer account was created</li><li>4742: A computer account was changed</li><li>4743: A computer account was deleted</li><li>4765, 4766: SID history</li><li>4767: A user account was unlocked</li><li>4780: ACL set on accounts</li><li>4781: The name of an account was changed</li><li>4799: Group membership enumeration</li></ul> |
| Security | Microsoft-Windows-Security-Auditing | <ul><li>4616: System time was changed</li><li>4821: Kerberos service ticket was denied</li><li>4822, 4823: New Technology LAN Manager (NTLM) authentication failed</li><li>4824: Kerberos pre-authentication failed</li><li>4825: A user was denied access to Remote Desktop</li><li>5058: Key file operation</li><li>5059: Key migration operation</li></ul> |
| Security | Microsoft-Windows-Security-Auditing | <ul><li>4698: A scheduled task was created</li><li>4702: A scheduled task was updated</li><li>4886: Certificate Services received a certificate request</li><li>4887: Certificate Services approved a certificate request</li><li>4899: A Certificate Services template was updated</li><li>4900: Certificate Services template security was updated</li><li>5140: A network share object was accessed</li></ul> |
| Security | Microsoft-Windows-Security-Auditing | 4713: Kerberos policy was changed on a domain controller |
| Security | Microsoft-Windows-Security-Auditing | 4662: An operation was performed on an Active Directory object |
EDR data collected for Mac endpoints
| Category | Events | Attributes |
|---|---|---|
| Files | <ul><li>Create</li><li>Write</li><li>Delete</li><li>Rename</li><li>Move</li><li>Open</li></ul> | <ul><li>Full path of the modified file before and after modification</li><li>SHA256 and MD5 hash for the file after modification</li></ul> |
| Process | <ul><li>Start</li><li>Stop</li></ul> | <ul><li>Process ID (PID) of the parent process</li><li>PID of the process</li><li>Full path</li><li>Command line arguments</li><li>Integrity level to determine if the process is running with elevated privileges</li><li>Hash (SHA256 and MD5)</li><li>Signature or signing certificate details</li></ul> |
| Network | <ul><li>Accept</li><li>Connect</li><li>Connect Failure</li><li>Disconnect</li><li>Listen</li><li>Statistics</li></ul> | <ul><li>Source IP address and port</li><li>Destination IP address and port</li><li>Failed connection</li><li>Protocol (TCP/UDP)</li><li>Aggregated send/receive statistics for the connection</li></ul> |
| Event log | <ul><li>Authentication</li></ul> | <ul><li>Provider Name</li><li>Data fields</li><li>Message</li></ul> |
EDR data collected for Linux endpoints
| Category | Events | Attributes |
|---|---|---|
| Files | <ul><li>Create</li><li>Open</li><li>Write</li><li>Delete</li></ul> | <ul><li>Full path of the file</li><li>Hash of the file</li></ul><p>For specific files only and only if the file was written.</p> |
| Files | <ul><li>Copy</li><li>Move (rename)</li></ul> | <ul><li>Full paths of both the original and the modified files</li></ul> |
| Files | <ul><li>Change owner (chown)</li><li>Change mode (chmod)</li></ul> | <ul><li>Full path of the file</li><li>Newly set owner/attributes</li></ul> |
| Network | <ul><li>Listen</li><li>Accept</li><li>Connect</li><li>Connect failure</li><li>Disconnect</li></ul> | <ul><li>Source IP address and port for explicit binds</li><li>Destination IP address and port</li><li>Failed TCP connections</li><li>Protocol (TCP/UDP)</li></ul> |
| Process | <ul><li>Start</li></ul> | <ul><li>PID of the child process</li><li>PID of the parent process</li><li>Full image path of the process</li><li>Command line of the process</li><li>Hash of the image (SHA256 & MD5)</li></ul> |
| Process | <ul><li>Stop</li></ul> | <ul><li>PID of the stopped process</li></ul> |
| Event log | <ul><li>Authentication</li></ul> | <ul><li>Provider Name</li><li>Data fields</li><li>Message</li></ul> |
IT performance metrics
| Field | Description |
|---|---|
| Time | <ul><li>Generated time</li><li>Timestamp</li></ul> |
| Agent information | <ul><li>Agent ID</li><li>Agent hostname</li><li>Agent OS type</li><li>Agent host boot time</li><li>Agent session start time</li><li>Agent request time</li></ul> |
| Event information | <ul><li>Event ID</li><li>Event type</li><li>Event subtype</li><li>Event version</li><li>Event timestamp</li></ul> |
| Actor information | Actor process instance ID |
| OS actor information | <ul><li>OS actor process instance ID</li><li>OS actor process OS PID</li><li>OS actor process OS name</li></ul> |
| Sample information | <ul><li>Sample start</li><li>Sample end</li></ul> |
| CPU usage information | <ul><li>CPU max</li><li>CPU average</li><li>CPU 90th percentile</li></ul> |
| Memory usage information | <ul><li>Memory max</li><li>Memory average</li><li>Memory 90th percentile</li></ul> |
| Vendor | Vendor name |
| Product | Product name |
| ZIP | ZIP ID |
| Server information | Server request time |
Configure global agent settings
In addition to the customizable Agent Settings Profiles for each Operating System and different endpoint targets, you can configure global Agent Configurations that apply to all the endpoints in your network.
- From Cortex XSIAM, select Settings → Configurations → General → Agent Configurations.
-
Set global uninstall password.
The uninstall password is required to remove a Cortex XDR agent and to grant access to the agent security component on the endpoint. You can use the default uninstall
Password1defined in Cortex XSIAM or set a new one and Save. This global uninstall password applies to all the endpoints (excluding mobile) in your network. If you change the password later on, the new default password applies to all new and existing profiles to which it applied before. If you want to use a different password to uninstall specific agents, you can override the default global uninstall password by setting a different password for those agents in the Agent Settings profile. The selected password must satisfy the requirements enforced by Password Strength indicator.A new password must satisfy the following Password Strength indicator requirements:
- It must be 8 to 32 characters.
- It must contain at least one upper-case, at least one lower-case letter, at least one number, and at least one of the following characters:
!@#%.
- Manage the content updates bandwidth and frequency in your network.
- Enable bandwidth control: Palo Alto Networks enables you to control your Cortex XDR agent network consumption by adjusting the bandwidth it is allocated. Based on the number of agents you want to update with content and upgrade packages, active or future agents, the Cortex XSIAM calculator configures the recommended amount of Mbps (Megabits per second) required for a connected agent to retrieve a content update over a 24 hour period or a week. Cortex XSIAM supports between 20 - 10000 Mbps, you can enter one of the recommended values or enter one of your own. For optimized performance and reduced bandwidth consumption, we recommend that you install and update new agents with the latest version, and include the content package built in using SCCM.
- Enable minor content version updates: The Cortex XSIAM research team releases more frequent content updates in-between major content versions to ensure your network is constantly protected against the latest and newest threats in the wild. Enabled by default, the Cortex XDR agent receives minor content updates, starting with the next content releases. To learn more about the minor content numbering format, refer to the About content updates topic.
-
Configure content bandwidth allocated for all endpoints.
To control the amount of bandwidth allocated in your network to Cortex XSIAM content updates, assign a Content bandwidth management value between 20-10,000 Mbps. To help you with this calculation, Cortex XSIAM recommends the optimal value of Mbps based on the number of active agents in your network, and including overhead considerations for large content updates. Cortex XSIAM verifies that agents attempting to download the content update are within the allocated bandwidth before beginning the distribution. If the bandwidth has reached its cap, the download will be refused and the agents will attempt again at a later time. After you set the bandwidth, Save the configuration.
-
Configure the Cortex XDR agent number of parallel upgrades.
If Agent auto upgrades are enabled for your Cortex XDR agents, you can control the automatic upgrade process in your network. To better control the rollout of a new Cortex XDR agent release in your organization, during the first week only a single batch of agents is upgraded. After that, auto-upgrades continue to be deployed across your network with number of parallel upgrades as configured.
- Amount of Parallel Upgrades: Set the number of parallel agent upgrades, where the maximum is 2000 agents. When you configure this, keep in mind your organization's bandwidth usage and resource consumption.
-
Configure automated Advanced Analysis of Cortex XDR Agent alerts raised by exploit protection modules.
Advanced Analysis is an additional verification method you can use to validate the verdict issued by the Cortex XDR agent. In addition, Advanced Analysis also helps Palo Alto Networks researchers tune exploit protection modules for accuracy.
To initiate additional analysis you must retrieve data about the alert from the endpoint. You can do this manually on an alert-by-alert basis or you can enable Cortex XSIAM to automatically retrieve the files.
After Cortex XSIAM receives the data, it automatically analyzes the memory contents and renders a verdict. When the analysis is complete, Cortex XSIAM displays the results in the Advanced Analysis field of the Additional data view for the data retrieval action on the Action Center. If the Advanced Analysis verdict is benign, you can avoid subsequent blocked files for users that encounter the same behavior by enabling Cortex XSIAM to automatically create and distribute exceptions based on the Advanced Analysis results.
- Configure the desired options:
- Enable Cortex XSIAM to automatically upload defined alert data files for advanced analysis. Advanced Analysis increases the Cortex XSIAM exploit protection module accuracy.
- Automatically apply Advanced Analysis exceptions to your Global Exceptions list. This will apply all Advanced Analysis exceptions suggested by Cortex XSIAM, regardless of the alert data file source.
- Save the Advanced Analysis configuration.
- Configure the desired options:
-
Configure the Cortex XDR Agent license revocation and deletion period.
This configuration applies to standard endpoints only and does not impact the license status of agents for VDIs or Temporary Sessions.
- Configure the desired options:
- Connection Lost (Days): Configure the number of days after which the license should be returned when an agent loses the connection to Cortex XSIAM. Default is 30 days; Range is 2 to 60 days. Day one is counted as the first 24 hours with no connection.
- Agent Deletion (Days): Configure the number of days after which the agent and related data is removed from the Cortex XSIAM management console and database. Default is 180 days; Range is 3 to 360 days and must exceed the Connection Lost value. Day one is the first 24 hours of lost connection.
- Click Save to save the Agent Status configuration.
- Configure the desired options:
-
Enable WildFire analysis scoring for files with Benign verdicts.
The WildFire analysis score for files with a Benign verdict is used to indicate the level of confidence WildFire has in the Benign verdict. For example, a file by a trusted signer or a file that was tested manually gets a high confidence Benign score, whereas a file that did not display any suspicious behavior at the time of testing gets a lower confidence Benign score. To add an additional verification method to such files, enable this setting. After this, when Cortex XSIAM receives a Benign Low Confidence verdict, the agent enforces the Malware Security profile settings you currently have in place (Run local analysis to determine the file verdict, Allow, or Block).
\
Disabling this capability takes immediate effect on new hashes, fresh agent installations, and existing security policies. It could take up to a week to take effect on existing agents in your environment pending agent caching. -
Enable Informative BTP Alerts.
Behavioral threat protection (BTP) alerts have been given unique and informative names and descriptions, to provide immediate clarity into the events without having to drill down into each alert. Enable to display of the informative BTP rule alert names and descriptions. After you update the settings, new alerts include the changes while already existing alerts remain unaffected.
\
If you have any Cortex XSIAM filters, starring policies, exclusion policies, scoring rules, log forwarding queries, or automation rules configured for XSOAR/3rd party SIEM, we advise you to update those to support the changes before activating the feature. For example, change the query to include the previous description that is still available in the new description, instead of searching for an exact match. -
Configure settings for periodic cleanup of duplicate entities in the endpoint administration table.
When enabled, Periodic duplicate cleanup removes all duplicate entries of an endpoint from the endpoint table based on the defined parameters, leaving only the last occurrence of the endpoint reporting to the server. This enables you to streamline and improve the management of your endpoints. For example, when an endpoint reconnects after a hardware change, it may be re-registered, leading to confusion in the endpoint administration table regarding the real status of the endpoint. The cleanup leaves only the latest record of the endpoint in the table.
- Define whether to clean up according to Host Name, Host IP Address, MAC Address, or any combination of them. If not selected, the default is Host Name. When you select more than one parameter, duplicate entries are removed only if they include all the selected parameters.
- Configure the frequency of the cleanup: every 6 hours, 12 hours, 1 day, or 7 days. You can also select to perform an immediate One-time cleanup.
Data for a deleted endpoint is retained for 90 days since the endpoint’s last connection to the system. If a deleted endpoint reconnects, Cortex XSIAM recovers its existing data.
Define endpoint groups
You can define an endpoint group and then apply policy rules and manage specific endpoints. If you set up Cloud Identity Engine, you can also leverage your Active Directory user, group, and computer details to define endpoint groups.
Do one of the following:
- Create a dynamic group by enabling Cortex XSIAM to populate your endpoint group dynamically using endpoint characteristics, such as an endpoint tag, partial hostname or alias, full or partial domain or workgroup name, IP address, range or subnets, installation type (VDI, temporary session or standard endpoint), agent version, endpoint type (workstation, server, mobile), user or operating system version.
- Create a static group by selecting a list of specific endpoints.
Configuration based on user granular policy is optimized for VDI and session-persistent environments; it is not recommended for decentralized or traditional endpoint architectures.
After you define an endpoint group, you can then use it to target policy and actions to specific recipients. The Endpoint Groups page displays all endpoint groups along with the number of endpoints and policy rules linked to the endpoint group.
How to define an endpoint group
- Select Inventory → Endpoints → Groups → +Add Group.
- Select one of the following:
- Create New to create an endpoint group from scratch
- Upload From File using plain text files with a new line separator, to populate a static endpoint group from a file containing IP addresses, hostnames, or aliases.
- Enter a Group Name and optional description to identify the endpoint group. The name you assign to the group will be visible when you assign endpoint security profiles to endpoints.
-
Determine the endpoint properties for creating an endpoint group:
- Dynamic: Use the filters to define the criteria you want to use to dynamically populate an endpoint group. Dynamic groups support multiple criteria selections and can use AND or OR operators. For endpoint names and aliases, and domains and workgroups, you can use
*to match any string of characters. As you apply filters, Cortex XSIAM displays any registered endpoint matches to help you validate your filter criteria. -
Static: Select specific registered endpoints that you want to include in the endpoint group. Use the filters, as needed, to reduce the number of results.
When you create a static endpoint group from a file, the IP address, hostname, or alias of the endpoint must match an existing agent that has registered with Cortex XSIAM. You can select up to 250 endpoints.
Disconnecting Cloud Identity Engine in your Cortex XSIAM deployment can affect existing endpoint groups and policy rules based on Active Directory properties.
- Dynamic: Use the filters to define the criteria you want to use to dynamically populate an endpoint group. Dynamic groups support multiple criteria selections and can use AND or OR operators. For endpoint names and aliases, and domains and workgroups, you can use
-
Create the endpoint group.
After you save your endpoint group, it is ready for use to assign security profiles to endpoints and in other places where you can use endpoint groups.
At any time, you can return to the Groups page to view and manage your endpoint groups. To manage a group, right-click the group and select the desired action:
- Edit: View the endpoints that match the group definition, and optionally refine the membership criteria using filters.
- Delete: Remove the endpoint group.
- Save as new: Duplicate the endpoint group and save it as a new group.
- Export group: Export the list of endpoints that match the endpoint group criteria to a tab separated values (TSV) file.
- View endpoints: Pivot from an endpoint group to a filtered list of endpoints on the All Endpoints page where you can quickly view and initiate actions on the endpoints within the group.
Manage endpoint profiles
Cortex XSIAM provides default security profiles that you can use out of the box to immediately begin protecting your endpoints from threats. These profiles are applied to endpoints by mapping them to policies and then mapping the policies to endpoints.
While security rules enable you to block or allow files to run on your endpoints, security profiles help you customize and reuse settings across different groups of endpoints. When the Cortex XDR agent detects behavior that matches a rule defined in your security policy, it applies the security profile that is attached to the rule for further inspection.
Guidelines for keeping Cortex XDR agents and content updated
This topic covers a recommended strategy and best practices for managing agent and content updates to help reduce the risk of downtime in a production environment, while helping ensure timely delivery of security content and capabilities.
Keeping Cortex XDR agents up-to-date is essential for protecting against evolving threats and vulnerabilities. Regular updates ensure the latest security features for malware and exploit prevention, and compatibility with the latest software environments, which helps reduce the risk of attacks. This can also help organizations meet regulatory standards while maintaining strong overall protection.
Content updates, such as new threat intelligence or detection logic, are critical for defending against newly discovered cyber threats and malware and are designed to ensure that systems remain protected against the latest attacks. Content updates, released on a weekly basis, address compatibility issues as well, helping to achieve smooth operations alongside the Cortex XDR agent. Without regular content updates, security solutions may fail to detect new or evolving threats, leaving systems vulnerable to attacks.
The Cortex XDR agent can retrieve content updates immediately as they become available, or after a pre-configured delay period of up to 30 days. In addition, to expedite testing and evaluation, the staging content provides a preview of the content update a week before its published GA.
When planning Cortex XDR agent upgrades and content updates, consult with the appropriate stakeholders and teams and follow the change management strategy in your organization.
Cortex XSIAM can be configured to manage the deployment of agent and content updates by adjusting the following settings:
Agent upgrade settings
Agent settings per endpoint:
- Agent Auto-Upgrade is disabled by default. Before enabling agent auto-upgrade for Cortex XDR agents, make sure to consult with all relevant stakeholders in your organization. Enabling this option allows you to define the scope of the automatic updates, such as upgrading to the latest agent release, one release prior, only maintenance releases, or maintenance releases within a specific version.
- Upgrade Rollout includes two options: Immediate, where the Cortex XDR agent automatically receives new releases, including maintenance updates and features, and Delayed, which lets you set a delay of 7 to 45 days after a version is released before upgrading endpoints.
- Agent Upgrade Scheduler allows the upgrade task to be scheduled for specific days of the week and a specific time range.
Global agent settings: Configure the number of parallel upgrades to apply to all endpoints in your organization.
Content update settings
Content updates per endpoint:
- Content Auto-Update is enabled by default and automatically retrieves the latest content before deploying it on the endpoint. If you disable content updates, the agent will stop fetching updates from the Cortex XSIAM tenant and will continue to operate with the existing content on the endpoint.
- Content Rollout: The Cortex XDR agent can retrieve content updates immediately as they become available, after a pre-configured delay period of up to 30 days. Utilize the staging content for early evaluation on test environments before the content is released to production.
Global content updates: Configure the content update cadence and bandwidth allocation within your organization. To enforce immediate protection against the latest threats, enable minor content updates. Otherwise, the content updates in your network occur only on major releases.
Guidelines for planning Cortex XDR agent upgrades
Use a phased rollout plan by creating batches for deploying updates. The specifics may vary based on your organization and its structure. Start with a control group, then deploy to 10% of your organization. Subsequently, allocate the remaining upgrades in batches that best suit your organization until achieving a full 100% rollout.
Example
The following is an example of a rollout plan for deploying a Cortex XDR agent upgrade:
Phase 1: Control group rollout: Start by selecting a control group of endpoints as early adopters. This group should consist of a diverse range of operating systems, devices, applications, and servers, with a focus on low-risk endpoints. After a defined testing period, such as one week, assess for any issues. If no problems are found, move to the next phase.
Phase 2: 10% rollout: Expand the rollout to 10% of the organization’s endpoints. This group should maintain the same variety as the control group but include low- to medium-risk endpoints. Monitor performance during the set period. If the rollout is successful with no issues, proceed to the next phase.
Phase 3: 40% rollout: After confirming the success of the 10% rollout, extend the deployment to 40% of the organization. Continue including a variety of endpoints while gradually incorporating some medium-risk endpoints. Ensure thorough testing during this phase before moving forward.
Phase 4: 80% rollout: Extend the deployment to 80% of the organization's endpoints. This batch should include a wide variety of endpoints, incorporating both medium and high-risk systems. After a careful monitoring period and confirmation that everything is stable, move to the final phase.
Phase 5: Full rollout: Complete the rollout by updating the remaining 20% of the organization’s endpoints. By this point, the majority of systems should have been thoroughly tested, reducing the risk of issues in the final stage. Once complete, 100% of the organization will be updated.

Guidelines for planning content updates
Content updates consist of detection rules and operational logic, and are typically released on a weekly basis. Staging content provides a preview of the content update a week before the published GA.
Use a phased rollout plan by creating batches for deploying updates. Start with a control group, then deploy to 10% of your organization. Subsequently, allocate the remaining upgrades in batches that best suit your organization until achieving a full 100% rollout.
For early evaluation, select a small test group or a lab environment for enabling the staging content preview.
Example
The following is an example of a rollout plan over a period of one week for deploying content updates:
Phase 1: Control group rollout: Keep the default configuration set to deploy content updates immediately.
Phase 2: 10% rollout: Content is automatically deployed on day 2 following a delay period defined in the profile.
Phase 3: 60% rollout: Content is automatically deployed on day 3 following a delay period defined in the profile.
Phase 4: Full rollout: Increase the deployment to include medium and high-risk systems, until the entire organization is updated.
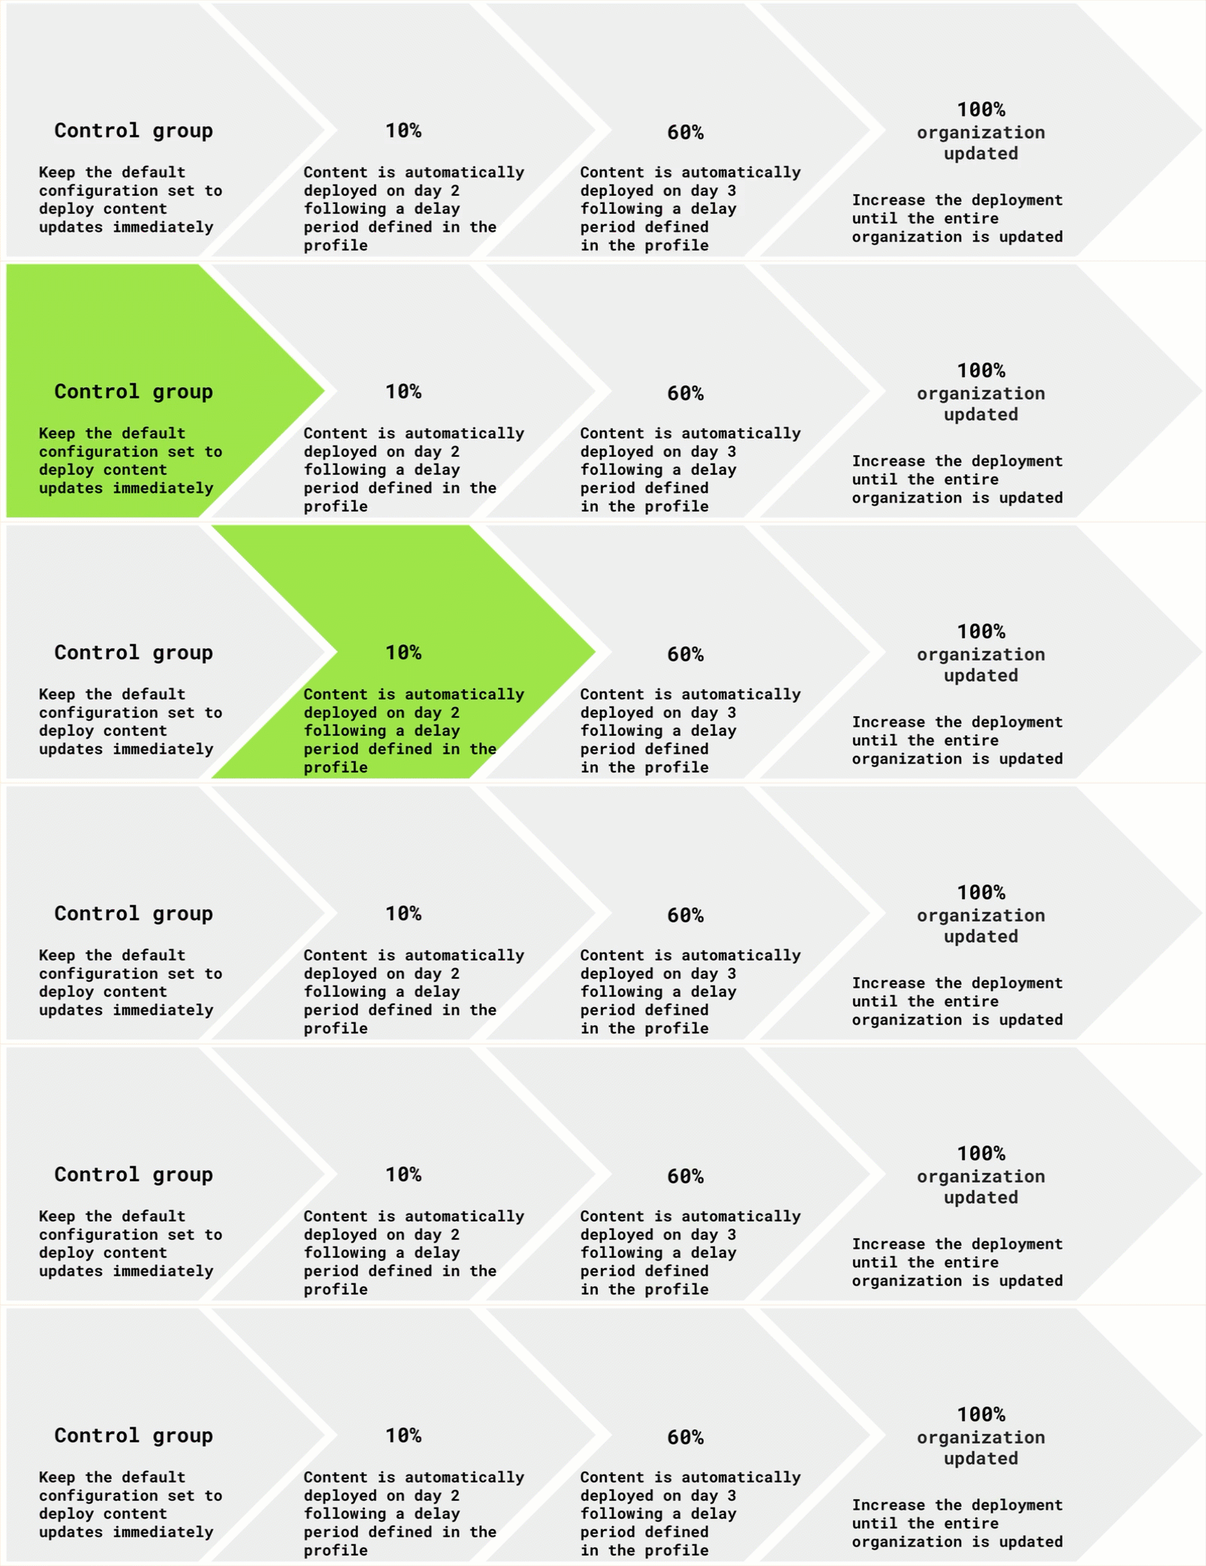
How to configure agent and content update settings
The following information will help you select and configure the update settings.
Cortex XDR agent upgrades
Configure one or more of the following settings to keep your Cortex XDR agents up-to-date.
Distribute agent upgrades to selected endpoints
-
Create an agent installation package for each operating system version for which you want to upgrade the Cortex XDR agent.
Note the installation package names.
-
Select Inventory → Endpoints → All Endpoints.
If needed, filter the list of endpoints. To reduce the number of results, use the endpoint name search and filters at the top of the page.
-
Select the endpoints you want to upgrade.
You can also select endpoints running different operating systems to upgrade the agents at the same time.
-
Right-click your selection and select Endpoint Control → Upgrade Agent Version.
For each platform, select the name of the installation package you want to push to the selected endpoints.
You can install the Cortex XDR agent on Linux endpoints using a package manager. If you do not want to use the package manager, clear the option Upgrade to installation by package manager.
When you upgrade an agent on a Linux endpoint that is not using a package manager, Cortex XSIAM upgrades the installation process by default according to the endpoint Linux distribution.
The Cortex XDR agent keeps the name of the original installation package after every upgrade.
-
Upgrade.
Cortex XSIAM distributes the installation package to the selected endpoints at the next heartbeat communication with the agent. To monitor the status of the upgrades, go to Investigation and Response → Response → Action Center.
From the Action Center you can also view additional information about the upgrade (right-click the action and select Additional data) or cancel the upgrade (right-click the action and select Cancel Agent Upgrade).
- Custom dashboards that include upgrade status widgets, and the All Endpoints page display upgrade status.
- During the upgrade process, the endpoint operating system might request a reboot. However, you do not have to perform the reboot for the Cortex XDR agent upgrade process to complete it successfully.
- After you upgrade on an endpoint with Cortex XSIAM Device Control rules, you need to reboot the endpoint for the rules to take effect.
Agent settings per endpoint
These profiles can be configured on one or more endpoints, static/dynamic groups, tags, IP ranges, endpoint names, or other parameters that allow the creation of logical endpoint groups. See how to define endpoint group.
- Go to Inventory → Endpoints → Policy Management → Profiles, and then edit an existing profile, add a new profile, or import from a file.
-
If you're adding a new profile, select the operating system and Agent Settings. Then click Next.
If you want to edit an existing profile, hover over Agent Settings for the operating system and click View Profile.
-
Select Agent Upgrade. By default, this option is disabled.
Before enabling Auto-Update for Cortex XDR agents, make sure to consult with all relevant stakeholders in your organization.
The following table describes the available Agent Auto-Upgrade options:
| Item | Options | Description |
|---|---|---|
| Automatic Upgrade Scope | <ul><li>Latest agent release (Default)</li><li>One release before the latest one</li><li>Only maintenance releases</li><li>Only maintenance releases in a specific version</li></ul> | <p>For One release before the latest one, Cortex XSIAM upgrades the agent to the previous release before the latest, including maintenance releases. Major releases are numbered X.X, such as release 8.0, or 8.2. Maintenance releases are numbered X.X.X, such as release 8.2.2.</p><p>For Only maintenance releases in a specific version, select the required release version.</p> |
| Upgrade Rollout | <ul><li>Immediate (Default)</li><li>Delayed</li></ul> | <p>The Cortex XDR agent automatically fetches any new agent release, maintenance and new features.</p><p>For Delayed, set the delay period (number of days) to wait after the version release before upgrading endpoints. Choose a value between 7 and 45.</p> |
| Scheduling | <ul><li>Hours</li><li>Days of the week</li></ul> | Schedule the upgrade task for specific time and days of the week. |
Global agent settings
Configure the Cortex XDR agent upgrade scheduler and the number of parallel upgrades to apply to all endpoints in your organization.
- Go to Settings → Configurations → Agent Configurations, and scroll to Agent upgrade.
-
Configure the Cortex XDR agent upgrade scheduler and the number of parallel upgrades.
Item Description Amount of parallel upgrades <p>During the first week of a new Cortex XDR agent release rollout, only a single batch of agents is upgraded. After that, auto-upgrades continue to be deployed across your network with the number of parallel upgrades as configured.</p><p>Set the number of parallel agent upgrades, where the maximum is 500 agents.</p>
Content updates
When a new content update is available, Cortex XSIAM notifies the Cortex XDR agent. The Cortex XDR agent then randomly chooses a time within a six-hour window during which it will retrieve the content update from Cortex XSIAM. By staggering the distribution of content updates, Cortex XSIAM reduces the bandwidth load and prevents bandwidth saturation due to the high volume and size of the content updates across many endpoints. You can view the distribution of endpoints by content update version from the dashboard.
You can configure whether to update content per endpoint or use the global settings.
| |
| ------------------------------------------------------------------------------------------------------------------------------------------------------------------------------------------------------------------------------------------------------------------------------------------------------------------------------------------------------------------------- |
Content update settings per endpoint
Configure content update options for agents within the organization to ensure it is always protected with the latest security measures.
These profiles can be configured on one or more endpoints, static/dynamic groups, tags, IP ranges, endpoint names, or other parameters that allow the creation of logical endpoint groups.
The following table describes the available Content Configuration options:
- Go to Inventory → Endpoints → Policy Management → Profiles, and then edit an existing profile, add a new profile, or import from a file.
-
If you're adding a new profile, select the operating system and Agent Settings. Then click Next.
If you want to edit an existing profile, hover over Agent Settings for the operating system and click View Profile.
- Select Content Configuration. By default, this option is Enabled.
| Item | Options | More details |
|---|---|---|
| Content Auto-Update | <ul><li>Enabled (Default)</li><li>Disabled</li></ul> | <p>When Content Auto-Update is enabled, the Cortex XDR agent retrieves the most updated content and deploys it on the endpoint.</p><p>If you disable content updates, the agent stops retrieving them from the Cortex XSIAM tenant, and keeps working with the current content on the endpoint.</p> |
| Staging Content | <ul><li>Enabled</li><li>Disabled (Default)</li></ul> | Enable users to deploy agent staging content on selected test environments. Staging content is released before production content, allowing for early evaluation of the latest content update. |
| Content Rollout | <ul><li>Immediate (Default)</li><li>Delayed</li><li>Specific</li></ul> | <p>The Cortex XDR agent can retrieve content updates immediately as they are available, after a pre-configured delay period of up to 30 days, or you can select a specific version.</p><p>When you delay content updates, the Cortex XDR agent will retrieve the content according to the configured delay. For example, if you configure a delay period of two days, the agent will not use any content released in the last 48 hours.</p> |
Global content update settings
- Go to Settings → Configurations → Agent Configurations, and scroll to Content Management.
-
Configure the content update cadence and bandwidth allocation within your organization.
Item Description Enable bandwidth control Based on the number of agents you want to update with content and upgrade packages, active or future agents, the Cortex XSIAM calculator configures the recommended amount of Mbps (Megabits per second) required for a connected agent to retrieve a content update over a 24 hour period or a week. Cortex XSIAM supports between 20 - 10000 Mbps, you can enter one of the recommended values or enter one of your own. For optimized performance and reduced bandwidth consumption, it is recommended that you install and update new agents with Cortex XDR agents 7.3 and later include the content package built in using SCCM. XDR Calculator for Recommended Bandwidth <p>Based on the number of agents you want to update with content and upgrade packages, active or future agents, the Cortex XSIAM calculator configures the recommended amount of Mbps (Megabits per second) required for a connected agent to retrieve a content update over 24 hours or a week. This calculation is based on connected agents and includes an overhead for large content update.</p><p>Cortex XSIAM supports between 20 - 10000 Mbps.</p><p>It is recommended to allocate a minimum of 20 Mbps, or you can enter a value.</p> Enable minor content version updates To enforce immediate protection against the latest threats, enable minor content updates. Otherwise, the content updates in your network occur only on major releases.
Cortex XSIAM - Analytics
The Cortex XSIAM Analytics engine enables Cortex XSIAM to analyze data from a variety of sensors and develop a baseline to raise analytics alerts when anomalies and malicious behaviors are detected.
Prerequisite
Before Cortex XSIAM - Analytics can start to analyze your endpoint data, perform the following steps:
- Configure Cortex XSIAM network parameters to monitor your internal networks.
- Enable the Analytics Engine.
- Make sure Cloud Identity Engine is set up.
- Enable Identity Analytics.
Configure Cortex XSIAM network parameters
Define your internal IP address ranges and domain names to enable Cortex XSIAM to identify, track, and analyze network assets.
Define internal IP address ranges
The IP Address Ranges page displays the address ranges that Cortex XSIAM Analytics monitors. Addresses are pre-populated with the default IPv4 and IPv6 address spaces. The names you define appear when investigating the network-related events in Cortex XSIAM.
You can add a new IP address range manually or upload IP address ranges from a CSV file.
How to define internal IP address ranges
- Select Inventory → Assets → Network Configuration → Internal IP Address Ranges.
-
Do one of the following:
To Do this Add a new IP address manually <p>1. Click Add New Range → Create New, and then enter the IP address name and IP address range or CIDR values.</p><p>By default, Cortex XSIAM creates Private Network ranges that specify reserved industry-approved ranges. Private Network ranges are marked with a  icon and you can only edit the name.</p><div data-gb-custom-block data-tag="hint" data-style="info" class="hint hint-info"><p>You can add a range that is fully contained in an existing range; however, you cannot add a new range that partially intersects with another range.</p></div><p>2. Click Save.</p>
Upload IP address ranges from a CSV file <p>1. Select Inventory+Assets → Network Configuration → IP Address Ranges.</p><p>2. Click Add New Range → Upload from File.</p><p>3. Locate the CSV file you want to upload, and then click Add.</p>
Define internal domain names
- Select Inventory → Assets → Network Configuration → Internal Domain Suffixes.
- Type the domain suffix you want to include as part of your internal network, for example,
acme.com. - Select
 to add the suffix to the Domains List.
Enable the Analytics Engine and Identity Analytics
Cortex XSIAM - Analytics includes the following:
- Cortex XSIAM Analytics Engine: Analyzes your endpoint data to develop a baseline and raise Analytics and Analytics BIOC alerts when anomalies and malicious behaviors are detected.
- Identity Analytics: Allows the Cortex XSIAM Analytics engine to aggregate and display user profile details, activities, and alerts related to a user-based Analytics type alert and Analytics BIOC rule during an investigation.
Prerequisite
Analytics Engine
To create a baseline for enabling analytics, Cortex XSIAM requires a minimum of one of the following data sets:
- EDR or Network logs from at least 30 endpoints over a minimum of 2 weeks
- Cloud audit logs over a minimum of 5 days
Identity Analytics
- Cortex XSIAM - Analytics must be activated.
- Cloud Identity Engine must be set up. For more information, see Cloud Identity Engine.
How to enable analytics
- Select Settings → Configurations → Cortex XSIAM - Analytics.
-
Click Enable. Creating a baseline can take up to three hours.
Adding Windows DHCP logs can enhance the Analytics Engine. For more information, see Ingest Windows DHCP Logs with an XDR Collector Profile.
- Activate Identity Analytics by turning on the toggle.
FedRAMP overview
The Federal Risk and Authorization Management Program (FedRAMP) provides a standardized approach to security assessment, authorization, and continuous monitoring for cloud products and services used by the U.S. government. This program ensures that federal information remains secure while allowing agencies to adopt cloud solutions efficiently.
Cortex XSIAM FedRAMP compliance for federal agencies
Cortex XSIAM is FedRAMP High- and Moderate-authorized for U.S. federal agencies and regulated industries. FedRAMP-authorized Cortex XSIAM tenants provide isolated government cloud environments, U.S. data residency, and secure federal network access.
FedRAMP security and infrastructure architecture
FedRAMP Cortex XSIAM environments use the following compliance safeguards:
- Isolation: Dedicated single-tenant instances that are physically and logically isolated from the commercial user base.
- Data sovereignty: All logs and ingested data remain strictly within the United States.
- Infrastructure: Usage of government-specific infrastructure, such as AWS GovCloud or Azure Government.
- Secure egress: Implementation of federal FQDNs, such as
p-proxy.federal.paloaltonetworks.com, to secure all egress traffic paths. - Scanning rights: FedRAMP instances are authorized to scan both secure government and standard commercial cloud accounts, whereas commercial instances are strictly prohibited from accessing government-authorized environments.
Software Composition Analysis (SCA) in FedRAMP
Application Security Software Composition Analysis (SCA) is available in FedRAMP and Government (Gov) tenant environments. Organizations operating under FedRAMP or public-sector compliance requirements can scan open-source dependencies for known vulnerabilities (CVEs), license miscompliance, and package operational risks using the same SCA scanner available in commercial environments.
SCA in FedRAMP/Gov tenants uses the same enablement and prerequisites as commercial tenants:
- The Application Security module is active on the tenant
- At least one VCS integration is onboarded
- The SCA scanner is enabled for the target repositories
- At least one periodic or PR scan has completed
No FedRAMP-specific configuration is required.
For more information on SCA, refer to Software Composition Analysis (SCA ).
Onboard and configure government cloud environments
Use the following steps to onboard and configure a government-authorized cloud environment in Cortex XSIAM. These settings support federal security requirements for Government CSP environments.
Government cloud onboarding and configuration
- Onboarding: Use the cloud onboarding wizard to connect a Government Cloud Service Provider (CSP) environment to Cortex XSIAM.
- Environment selection: During configuration, select the Government option in the Environment menu to ensure the tenant adheres to federal security standards.
-
Scan mode: You can select Cloud Scan or Scan with Outpost.
If you choose an outpost scan, you must select an outpost that has the environment type defined as Government to maintain compliance and connectivity.
FedRAMP limitations and supported government cloud regions
Cortex XSIAM FedRAMP Government deployments support specific cloud services and regions. Review these service limitations before onboarding federal cloud environments.
FedRAMP service limitations
- Unsupported features: FedRAMP Government instances do not currently support these DSPM services:
- AWS: RDS/Aurora scanning
- DBaaS: Snowflake, Databricks
- Microsoft 365
- Azure: All services (this is not supported for both DSPM and AISPM services)
- Environmental restrictions: Multi-tenant or MSSP environments are not currently supported by FedRAMP.
- Permitted capabilities: Other capabilities, such as registry scanning, serverless scanning, and agentless disk scanning, are allowed.
Supported AWS GovCloud and Azure Government regions
Supported regions are limited to AWS GovCloud regions and Microsoft Azure government regions.
| Provider | Supported regions |
|---|---|
| AWS GovCloud | <ul><li>AWS GovCloud (US-East) - us-gov-east-1</li><li>AWS GovCloud (US-West) - us-gov-west-1</li></ul> |
| Azure Government | <ul><li>US Gov Arizona - usgovarizona</li><li>US Gov Texas - usgovtexas</li><li>US Gov Virginia - usgovvirginia</li></ul> |
Post-deployment
Once your Cortex XSIAM is operational, start post-deployment, such as performing health checks, configuring automations, and reviewing cases and issues.
Key post-deployment topics include:
Cortex XSIAM post-deployment checklist
Use this Cortex XSIAM post-deployment checklist after onboarding. Start with health checks and case triage. Then configure integrations, expand the Cortex XDR agent rollout, and deploy on-premises components.
This checklist includes post-deployment for the Cortex XSIAM environment, but does not include any specific Cloud Security requirements. For more information about Cloud Security onboarding, see Cloud service provider (CSP) onboarding.
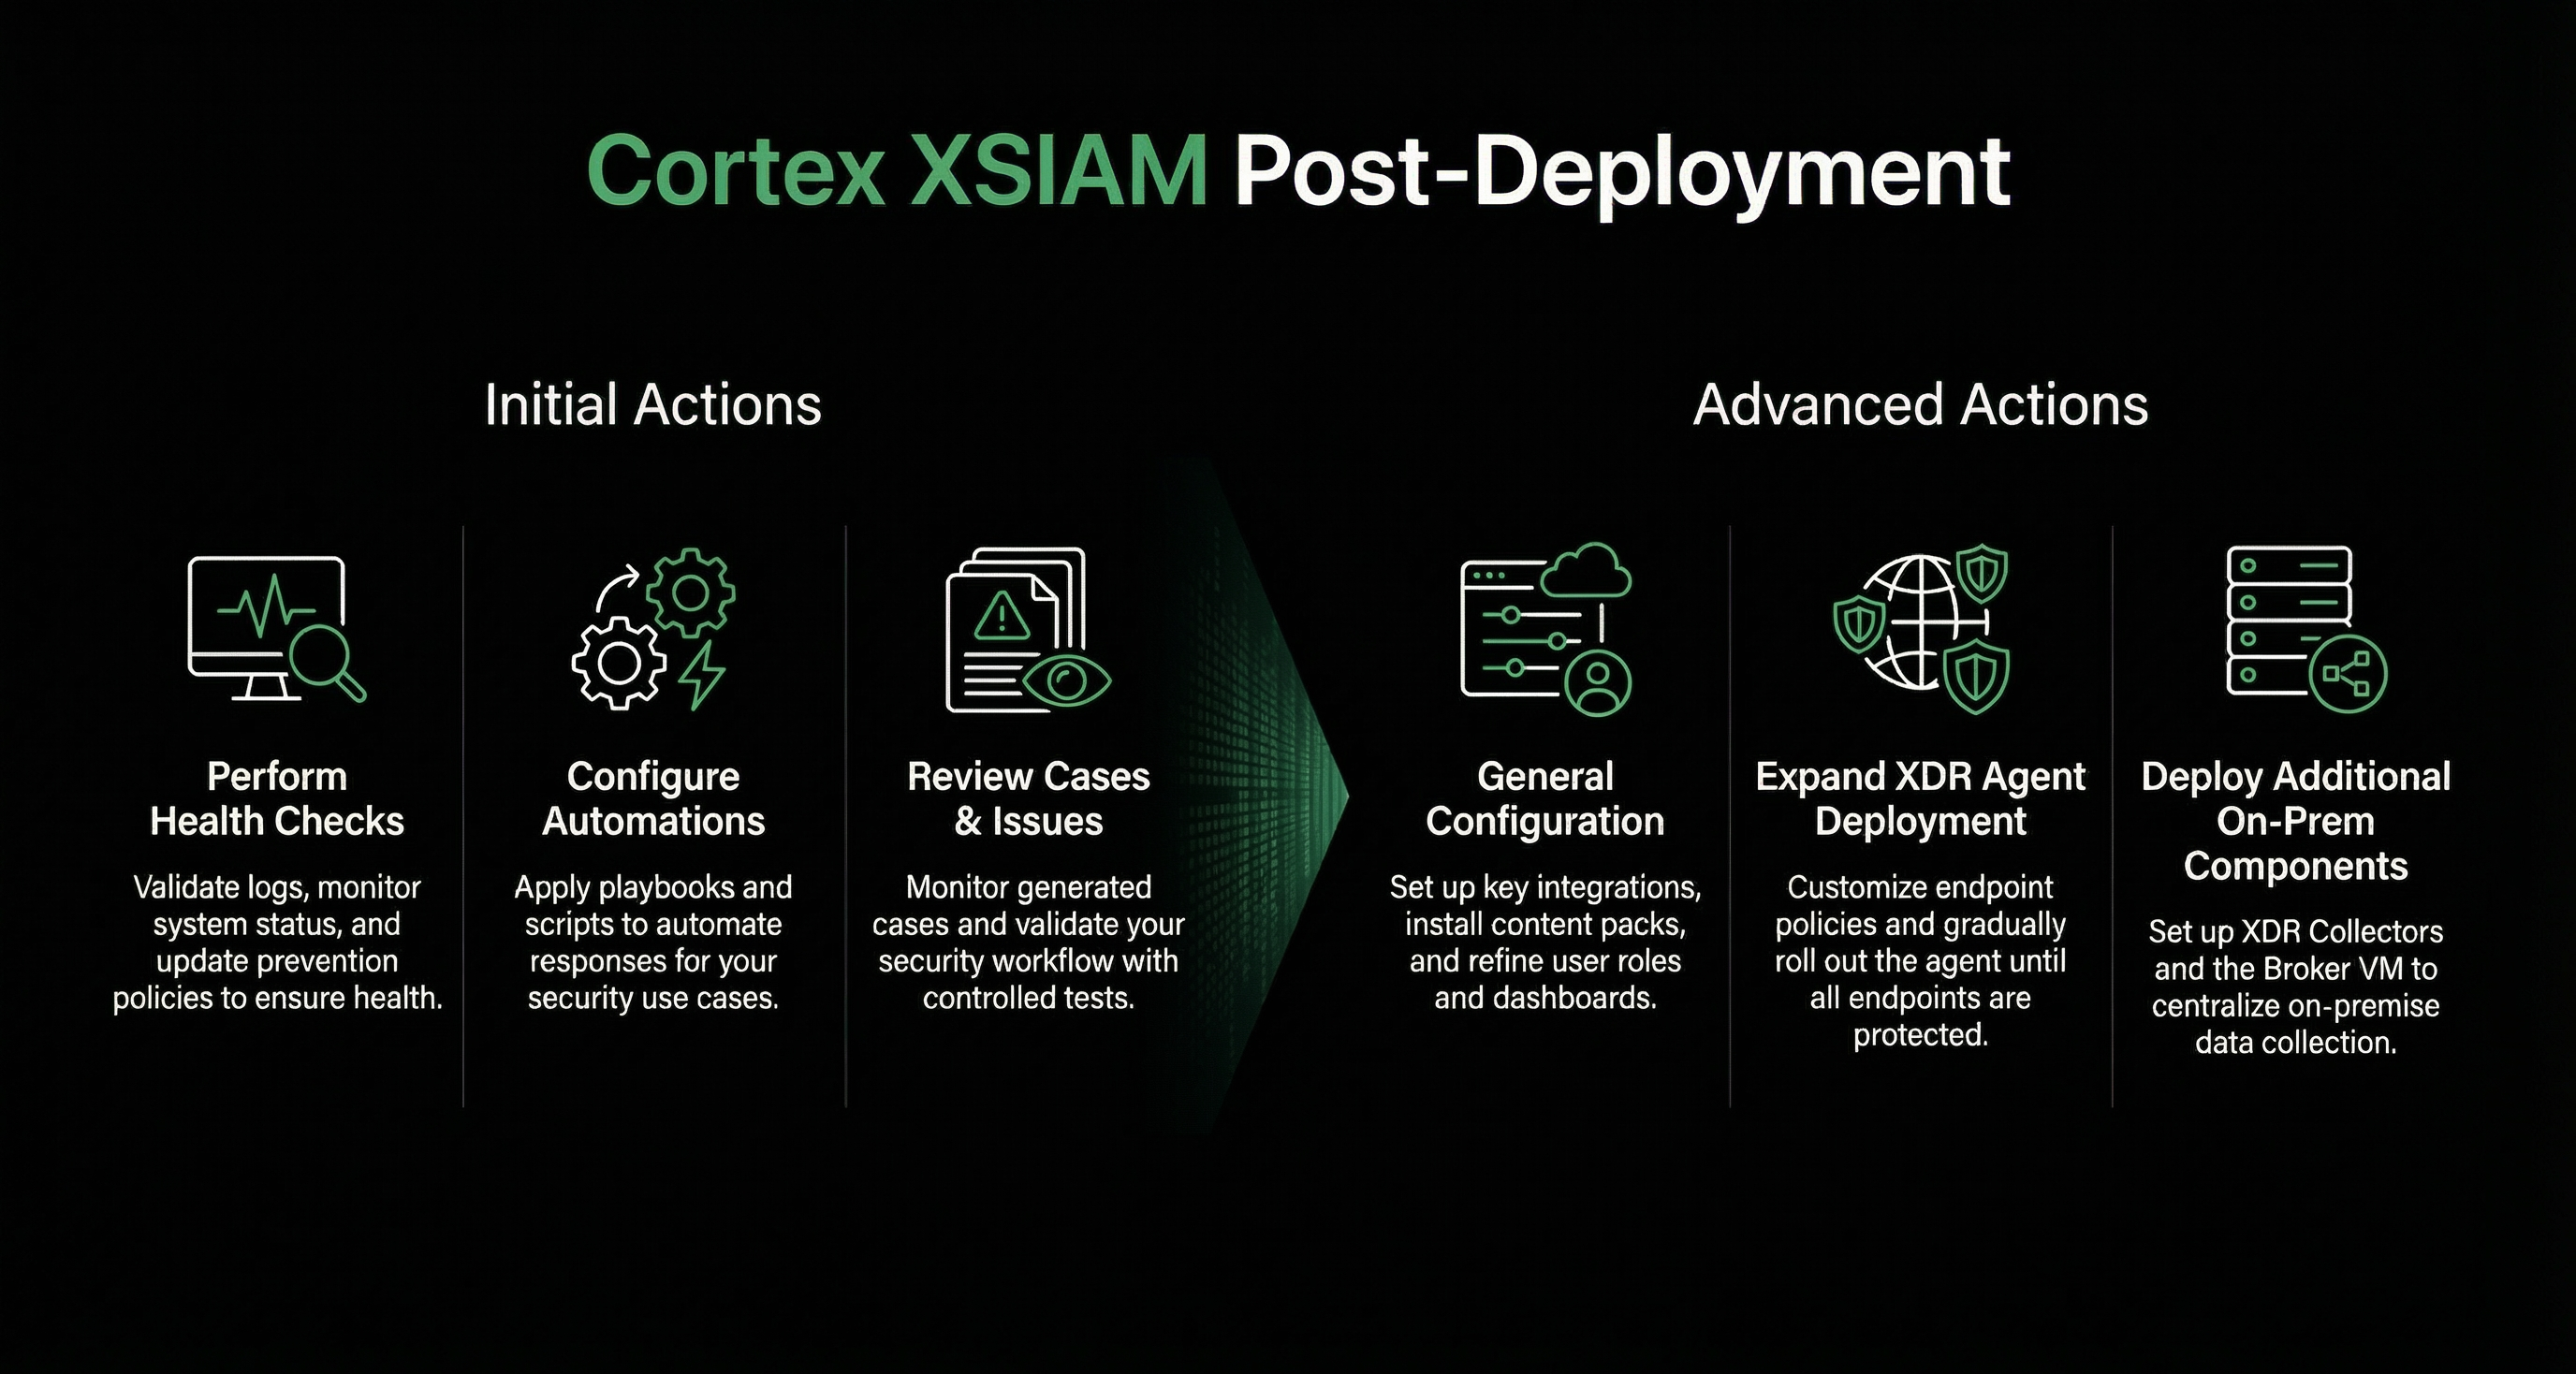
Initial Cortex XSIAM post-deployment actions
The following table describes the post-deployment steps for the most critical areas to get you up and running quickly.
| Action | Details | See More |
|---|---|---|
| Perform health checks | ✅ Validate logs, detectors, and update prevention policies. It is recommended to perform health checks, including updating prevention policies, monitoring operational status, and validating detectors for any issues or cases. | Perform health checks |
| Configure automations | ✅ Review the different types of automations (playbooks and scripts) and apply automation rules to your use case. | Create an automation rule |
| Review cases and issues | <p>✅ Monitor the Cases page for new, generated cases (grouped issues) and begin basic triage exercises with the analyst team. Look for cases or issues that were generated.</p><p>✅ Check that your automation rules are working as expected and reflect the cases for your use case. Check whether your playbooks are responding to alerts and incidents as expected.</p><p>✅ Validate your workflow. Start with Widfire testing to confirm the security controls and sandbox integration are functional and working as expected. For example, acquire a safe, benign sample unknown to Wildfire, attempt to execute it, and confirm that the XDR agent’s malware prevention file intercepts the execution. Confirm that a case/issue was generated and the file verdict is populated.</p><p>✅ Review and test the default Behavioral Indicators of Compromise (BIOC). Review severity levels and exceptions on pre-built BIOCs to minimize false positives, especially for legitimate administrative tools and scripts.</p><p>✅ Review and test the default Indicator of Compromise (IOC) rules. Ensure all known bad indicators from historical incidents or key threat intelligence feeds are loaded, enabled, and prioritized.</p> | <p>Analyze and resolve cases</p><p>What's a BIOC?</p><p>What's an IOC?</p> |
Advanced Cortex XSIAM post-deployment actions
General
This section includes general post-deployment steps, such as server and security settings, configuring dashboards, and refining RBAC roles.
| Action | Details | See More |
|---|---|---|
| Set up relevant integrations | <p>✅ Install essential content packs (for example, common security use cases or SOAR playbook) and configure relevant integrations, from the Data Sources catalog.</p><p>If your use case is not in the Data Sources catalog, you can install content from Marketplace. For example, if you require content packs such as Phishing and Malware, you need to download the pack from Marketplace and configure the integration. The Data Sources catalog includes the most used data sources to help you onboard.</p> | What are Cortex XSIAM data sources? |
| Update users and roles | ✅ Review and configure users, roles, and user groups as required. Each role extends specific privileges to users. The way you configure administrative access depends on your organization's security requirements. Use roles to assign specific access privileges to administrative user accounts. | Manage user roles and access management |
| Dashboards | ✅ Review and configure dashboards and ensure you can visualize activity from your active log sources (for example, VPN logins, Firewall blocks). | Overview of dashboards and reports |
| Server and security settings | <p>✅ Customize and configure Cortex XSIAM for a more personalized user experience:</p><ul><li>Server settings, such as the timezone, the timestamp format, password protection, and custom logos for communication task emails.</li><li>Security settings, such as allowed domains, allowed sessions, and user expiration.</li></ul> | <ul><li>Configure server settings</li><li>Configure security settings</li></ul> |
| Log forwarding | ✅ Set up sending logs to an external service, such as a Slack channel or an email distribution list. | Forward logs and data from Cortex XSIAM to external services |
Expand the XDR Agent deployment
This stage involves customizing policies and gradually rolling out the XDR Agent to all users.
| Action | Details | See More |
|---|---|---|
| Customize endpoint security profiles and policies | <p>✅ Review your policy rules and the security profiles assigned to these rules and make any necessary adjustments. After the pilot group has been running for about a week, analyze the cases and issues that were generated. You may find issues with benign activity, such as in-house applications or custom scripts. Do the following:</p><ul><li>Create exceptions to prevent false positives</li><li>Start building your primary prevention policies to suit your use case as necessary</li></ul> | Set up endpoint profiles and exception rules |
| Expand the agent deployment | ✅ Expand the Agent deployment to larger groups for initial data collection. | |
| Define endpoint groups | <p>✅ (Optional, can be performed post-deployment) Define an endpoint group to apply policy rules and manage specific endpoints.</p><p>Instead of managing security policies and configurations for each device, you can manage them for the entire group. For example, create a High-Security Prevention Profile and apply it to an entire group, Critical Financial Servers.</p><div data-gb-custom-block data-tag="hint" data-style="info" class="hint hint-info"><p>Note</p><p>If you set up Cloud Identity Engine, you can also leverage your Active Directory user, group, and computer details in endpoint groups.</p></div> | Define endpoint groups |
| Complete the XDR agent deployment | ✅ Gradually distribute the Cortex XDR agent throughout the organization until all endpoints are protected. You can do this at any time during post-deployment. |
Deploy additional On-prem components
Deploy additional on-prem components for data ingestion, collection, and automation for complete protection. Although these components are optional, XDR Collectors and the Broker VM are critical for this next deployment phase. The Broker VM is often highly recommended early on because it can solve immediate connectivity and log collection challenges for on-prem identity sources.
| Action | Details | |
|---|---|---|
| Set up XDR Collectors for specific Windows/Linux logs (optional) | <p>✅ Set up XDR Collectors (XDRCs), which are installed directly on a Windows or Linux machine to collect log files from that machine's local file system. They are crucial for ingesting detailed Windows and Linux event logs from systems where the full Cortex XDR Agent may not be deployed, or to collect specific log types, complementing agent data.</p><p>✅ After installing XDRCs, create/configure a profile and apply it to a policy. The XDRC then starts collecting and forwarding the logs to Cortex XSIAM.</p> | XDR Collectors |
| Set up and configure Broker VM (optional but highly recommended) | <p>✅ Set up the Broker VM, which functions as a secure on-prem gateway for Cortex XSIAM. It centralizes on-prem data collection by running applets to ingest logs from on-prem security devices and services that can’t send data directly to the cloud. It also allows secure agent proxy and communication located in restricted or air-gapped networks to communicate securely with the Cortex XSIAM tenant.</p><div data-gb-custom-block data-tag="hint" data-style="info" class="hint hint-info"><p>Note</p><p>You can also use the Broker VM for high availability.</p></div> | Set up and configure Broker VM |
| Set up and deploy an engine (optional) | <p>✅ Deploy an engine if you have specific automation and feed integrations, scripts, or playbooks that execute actions or fetch data directly from resources within your internal network (for example, querying an on-prem Active Directory, isolating a machine via a local tool).</p><p>An engine is a proxy server application that is installed on a remote machine, enabling communication between the remote machine and the Cortex XSIAM tenant. You can run playbooks, scripts, commands, and integrations on the remote machine, and the results are returned to the tenant.</p> | What is an engine? |
After completing the post-deployment steps, you can now start configuring Cortex XSIAM.
Perform health checks
As part of the onboarding process, it is recommended to perform the following health checks:
- Update prevention policies: Update policies and profiles, and ensure that all action modes are set to Block. For more information, seeset-up-endpoint-protection.
- Monitor operational status: Verify that Cortex XDR agents are protecting endpoints according to predefined security policies and profiles. For more information, see Monitor agent operational status in Cortex XSIAM.
- Test sample malware: Use a malware PE, MacOSX, or APK test file, to test end-to-end WildFire sample processing. For more information, see Get a Malware Test File.
- Validate detectors for issues and cases: Check issues and their associated sources. Validate that all the configurations on the policy level and on the agent deployment level meet the requirements to generate alerts and cases on Cortex XSIAM. For example, check the following:
- Cortex XDR agent generates WildFire malware issues.
- NFGW issues are listed by PAN NGFW.
- Validate log ingestion from external integrations: Verify what datasets are being created. The Dataset Management page enables you to manage your datasets and understand your overall data storage duration for different retention periods and datasets based on your Hot and Cold Storage licenses and retention add-ons to extend your storage. For more information, see Data storage lifecycle.
Monitor agent operational status in Cortex XSIAM
Cortex XSIAM provides information about the XDR agent operational status on an endpoint. It indicates whether the agent provides protection according to its predefined security policies and profiles. This information can help you identify technical issues or misconfigurations that interfere with the agent’s protection capabilities or interactions with Cortex XSIAM and other applications.
The XDR agent reports the operational status as follows:
- Protected: Indicates that the XDR agent is running as configured and did not report any exceptions to Cortex XSIAM.
- Partially protected: Indicates that the XDR agent reported one or more exceptions to Cortex XSIAM.
- Unprotected: Indicates the XDR agent is not enforcing protection on the endpoint.
- Local Resource Impact: Indicates that available endpoint resources are insufficient for the XDR agent to operate smoothly.
You can monitor the Cortex XDR agent Operational Status in Endpoints → All Endpoints.
The reported operational status varies according to exceptions reported by the XDR agent.
| Status | Description |
|---|---|
| Protected | (Windows, Mac, and Linux) Indicates all protection modules are running as configured on the endpoint. |
| Partially protected | <p>Windows</p><ul><li>XDR data collection is not running, or not set</li><li>Behavioral threat protection is not running</li><li>Malware protection is not running</li><li>Exploit protection is not running</li></ul><p>Mac</p><ul><li>Operating system adaptive mode*</li><li>XDR Data Collection is not running, or not set</li><li>Behavioral threat protection is not running</li><li>Malware protection is not running</li><li>Exploit protection is not running</li></ul><p>Linux</p><ul><li>Kernel module not loaded</li><li>Kernel module compatible but not loaded</li><li>Kernel version not compatible**</li><li>XDR Data Collection is not running, or not set</li><li>Behavioral threat protection is not running</li><li>Anti-malware flow is asynchronous</li><li>Malware protection is not running</li><li><p>Exploit protection is not running</p><div data-gb-custom-block data-tag="hint" data-style="info" class="hint hint-info"><p>Any of the listed items could lead to a partially protected state. Refer to the Cortex XSIAM management console for specific reasons for the state.</p></div></li></ul> |
| Unprotected | <p>Windows, Mac, and Linux:</p><ul><li>Behavioral threat protection and Malware protection are not running</li><li>Exploit protection and malware protection are not running</li><li>The content is unavailable.</li></ul> |
| Local Resource Impact | <p>Windows, Mac, Linux</p><ul><li>Machine CPU impact on the agent operation</li><li>Machine memory impact on the agent operation</li></ul><p>In addition to the status, either one of the following sub-statuses appear:</p><ul><li>Low local available memory</li><li>No local available memory</li></ul> |
A status can have the following implications for the endpoint:
- *(
Status): The exploit protection module is not running. - **(
Status):- XDR data collection is not running
- Behavioral threat protection is not running
- Anti-malware flow is asynchronous
- Local privilege escalation protection is asynchronous
Cortex Marketplace
Content in Marketplace is organized into content packs to support specific security orchestration use cases. Content packs are created by Palo Alto Networks, technology partners, contributors, and customers.
In Marketplace, content includes the following:
| Content | Description |
|---|---|
| Actions | Actions wrap diverse capabilities (such as playbooks, scripts, and commands) to make them accessible and executable by an agent. |
| Classifiers | Classification determines the type of issue/indicator that is created for events ingested from a specific integration. You create a classifier and define that classifier in an integration. Mappers map the fields from your third-party integration to the fields in your issue/indicator layouts. |
| Correlation Rules | Analyzes the correlation of multiple events from multiple sources by using the Cortex XSIAM XQL-based engine for creating these correlation (scheduled) rules. Issues can then be triggered based on these rules with a defined time frame and schedule. |
| Dashboards | Dashboards consist of visualized data powered by fully customizable widgets, which enable you to analyze data from inside or outside Cortex XSIAM, in different formats such as line charts, tables, text, etc. |
| Data Model Rules | <p>Data Model rules enable you to normalize logs for out-of-the-box analytics and data enrichment. This allows you to do the following:</p><ul><li>Map 3rd-party data to a consolidated schema with predefined data types.</li><li>Enjoy auto-complete and mapping suggestions.</li><li>Map multiple datasets to one Data Model.</li></ul><p>Some content packs contain out-of-the-box default Data Model Rules.</p> |
| Indicator types and fields | Indicators are categorized by indicator type, which determines the indicator layout and fields that are displayed and which scripts are run on indicators of that type. |
| Integrations | <p>You can define the following integrations:</p><ul><li>(SOAR) Automation: Add your 3rd-party security and alert management vendors, which can then trigger events from these integrations that become issues in Cortex XSIAM. Once the issues are created, you can run playbooks on these issues to enrich them with information from other products in your system, which helps you complete the picture.</li><li>Collection (SIEM): Add integrations that collect raw events, such as logs. These integrations are separate from automation integrations so that you can add a collection integration that requires read permissions without having to add automation (read and write permissions).</li></ul> |
| Issue types and fields | <p>All issues that are ingested into Cortex XSIAM are assigned an issue type when they are classified. After you classify the issue, you can then map the relevant fields to the issue.</p><p>Issue types contain fields that are relevant to the issue type.</p> |
| Layouts and layout rules | <p>Enables you to add rules, which define the layout of issues and notifications,</p><p>When installed, the layout rules are enabled and added as Default Rules. When deleted, all related layout rules (including all Rule sections) are removed from the Default Rules tab.</p> |
| Parsing rules | <p>Enables you to add rules, which remove non-required data for analytics, hunting, or regulation, reduce data storage costs, pre-process all incoming data, etc.</p><p>When installed, the parsing rules are enabled and added as Default Rules. When deleted, all related parsing rules (including all Rule sections) are removed from the Default Rules tab.</p> |
| Playbooks | You can automate many security processes, including handling investigations and managing tickets and security responses that were previously handled manually. When an issue is ingested, the playbook runs and an issue is created. |
| Reports | Reports contain statistical data in the form of widgets (from a dashboard), which enable you to analyze data from inside or outside Cortex XSIAM, in different formats such as line charts, tables, text from information, etc. |
| Scripts | Perform specific actions and are comprised of commands, which are used in playbook tasks and when running commands in the issue War Room. |
Cortex XSIAM supports free content packs, which are either Cortex XSIAM or partner-supported content packs. You can restrict a user role from managing content packs in Marketplace when defining/editing user roles.
In Marketplace, you can browse all content packs (including installed content) or view only installed content packs.
You can search for content packs by entering text in the search bar and selecting the relevant content pack from the search results.
You can sort content packs by latest update, best match, recommended, number of downloads, and filter according to the following criteria:
- Use cases: Filter according to high-level use cases, such as Phishing, Malware, Ransomware, and Access.
- Integrations: Filter according to the integration included in the content pack.
- Categories: Filter according to content pack categories, such as Messaging, and Forensics & Malware Analysis
- Published: Filter according to whether published by Cortex XSIAM or by Cortex XSIAM technology partners.
- Content Pack Includes: Filter according to the content of the content pack, such as scripts, integrations, playbooks, and actions.
- Tags: Filter according to tags, such as Issues, Actions, Network, and Security.
- Types: Filter according to Collection or TIM.
When clicking a content pack you can view detailed information including content that it installs (such as scripts, playbooks, and integrations), dependencies (what content packs are required or optional) and version history (including whether you want to roll back to earlier versions).
You can view Marketplace content packs from within Cortex XSIAM (go to Settings → Configurations → Marketplace) or at Cortex Developer Docs Marketplace.
Content packs
Cortex Marketplace content packs bundle integrations, scripts, playbooks, widgets, and other components for security automation workflows. Palo Alto Networks, technology partners, consulting companies, MSSPs, customers, and contributors create content packs. Content packs are free for all customers.
You can view Marketplace content packs from within Cortex XSIAM (go to Settings → Configurations → Marketplace) or at Cortex Developer Docs Marketplace.
Pre-installed Cortex Marketplace content packs
Cortex XSIAM includes pre-installed content packs for common security use cases. These content packs include, but are not limited to:
-
Common Scripts, Common Widgets, Common Playbooks, Common Types, Common Reports, Common Dashboards
These content packs provide important tools and building blocks you can use to customize your playbooks and workflows in Cortex XSIAM. The Common Scripts content pack, for example, includes scripts that convert file formats, fetch indicators from a file, export context data, send emails, and more.
-
Provides integration with the popular VirusTotal service to analyze suspicious files, domains, IPs, and URLs to detect malware and other security breaches.
Recommended Cortex Marketplace content packs
In addition, we recommend reviewing if you require the following popular content packs:
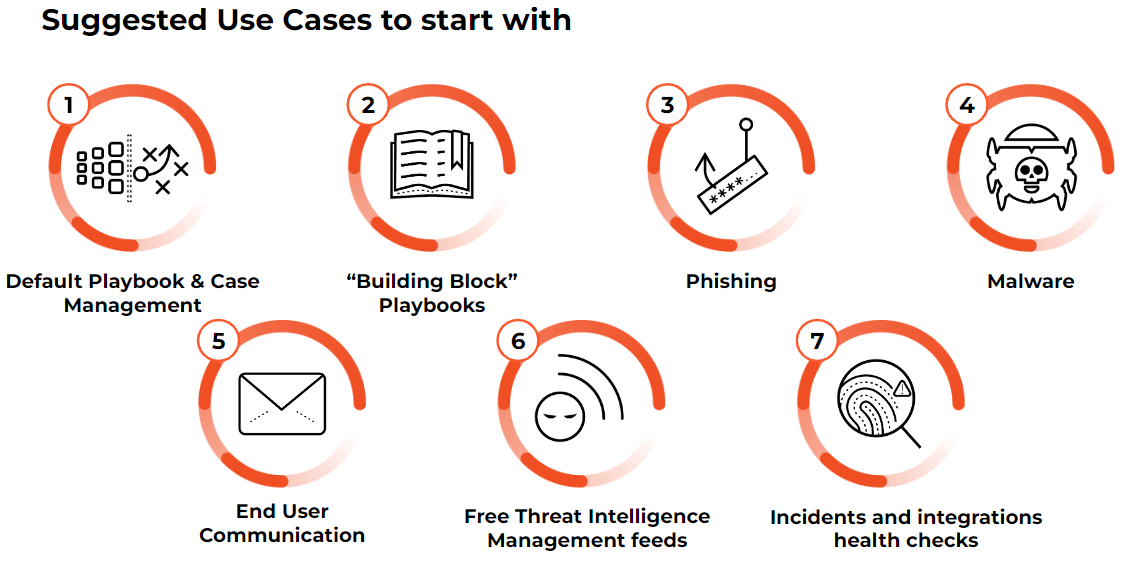
-
Create and respond to phishing issues based on user reports.
-
Cortex XDR by Palo Alto Networks
Automate Cortex XDR incident response. Includes custom Cortex XDR incident views and layouts to aid analyst investigations.
-
Manage Jira tickets directly from Cortex XSIAM, enrich them with Cortex XSIAM data, and mirror information between Jira tickets and Cortex issues.
-
Manage ServiceNow tickets directly from Cortex XSIAM, enrich them with Cortex XSIAM data, and mirror information between ServiceNow tickets and Cortex issues.
-
Manage Palo Alto Networks Firewall and Panorama from Cortex XSIAM.
-
A collaboration integration, such as Microsoft Teams or Slack, to send messages and notifications to your team.
Cortex XSIAM includes a built-in default mail sender. You also have the option of installing a different mail sender content pack, such as Microsoft Exchange Online.
Install content packs
You can only install one content pack at a time. Cortex XSIAM automatically adds any content that is required to install the content pack. You can also add any optional content packs that use the content pack you want to install.
If you receive an error message when you try to install a content pack, you need to fix the error before installing. If a warning message is issued, you can still download the content pack, but you should fix the problem; otherwise, the content may not work correctly.
Before you install a content pack, you should review the content pack to see what it includes and what the various dependencies are. The following is the information you can view:
- Details: General information about the content pack such as installation, content, version, author, and status.
- Content: The content to be installed, such as scripts or integrations.
- Dependencies: Details of any required content packs and optional content packs that may need to be installed with your content pack.
- Version History: View the currently installed version, earlier versions, available updates, and revert if required.
If you want to install data sources, you can do one of the following:
- Go to the Data Sources & Integrations page and add a data source. Once configured, it automatically installs the required content packs and recommends additional beneficial content such as playbooks and dashboards that are relevant for this specific data source.
- In Marketplace, select either Data Onboarder (which takes you to the integration configuration in the Data Sources & Integrations page) or install the content pack directly from Marketplace. If installing the content pack from Marketplace, you will then have to configure the integration in the Data Source & Integrations page.
Currently, not all content packs are supported in the Data Sources & Integrations page. For example, content packs with several integrations are not yet supported.
How to install a content pack in Marketplace
- Go to Settings → Configurations → Marketplace → Browse and locate the content pack you want to install.
- Click the required content pack and review the contents.
- Click Install to add the content pack to the Cart.
-
(Optional) If the content pack includes optional content, select the content packs you want to add.
The Cart displays the number of items you are installing, including any required content packs. You can log in and out, but the content packs remain in the Cart until you click either Empty cart or Install.
- Click Install.
-
After installation, click Refresh content.
You can now start configuring your content. If you have installed an integration, configure the integration, including setting up an integration instance.
Content packs are also automatically installed when you adopt playbooks and configure tasks.
Manage user roles and access management
Prerequisite
Managing users, roles, scopes, user groups, and authentication settings in Cortex XSIAM Access Management requires View/Edit RBAC permissions for Access Management (under Configurations). Account Admin and Instance Administrator roles are granted this permission by default. For more information, see Predefined user roles in Set up users and roles.
Access management enables you to control who can access the different parts of your organization's resources. It ensures only authorized users can interact with sensitive data.
Cortex XSIAM uses a combination of Role-Based Access Control (RBAC) and Scope-Based Access Control (SBAC) to ensure scalability and granular control.
What is the difference between RBAC and SBAC?
RBAC assigns permissions based on a user's organizational role, such as Investigator or Responder, establishing a clear hierarchy and set of capabilities for each role and simplifying management by linking access to job functions. RBAC does this by helping to manage access to Cortex XSIAM components and Cortex Query Language (XQL) datasets, so that users, based on their roles, are granted the minimal access required to accomplish their tasks.
SBAC refines RBAC by granting access only to the relevant data that the user requires for their designated role. Users with Access Management permission apply scopes to limit the data and content that users can be granted access to in Cortex XSIAM, which are divided into different scoping areas. The scoping areas include Assets, Cases and Issues, Endpoints, and Dataset Rows, which can be applied as relevant to the enforcement area, entity, or dataset.
For example, an Investigator role might have access to asset information based on the RBAC permissions, but SBAC granular scoping could limit that investigator's view and control to only assets within a particular scoping area. This hybrid approach ensures scalability and granular control, significantly strengthening system security.
Understanding more about access management concepts
You can manage access for users and create and assign user roles and user groups for a specific tenant. When Single Sign-On (SSO) is enabled, you can manage SSO for users.
Users
You can manage access permissions and activities for users allocated to a specific Customer Support Portal account and tenant. All users must belong to a user group or have an assigned role.
To remove users added to your CSP account, you must do so in the CSP, not in Cortex Gateway.
User roles
User roles enable you to define the type of access and actions a user can perform. User roles are assigned to users, user groups, or API keys.
For more information on assigning user roles when generating an API key, see Manage API keys.
Predefined user roles
Cortex XSIAM provides predefined built-in user roles that provide specific access rights that cannot be modified. You can also create custom, editable user roles. To view the predefined permissions for each default role, go to Settings → Configurations → Access Management → Roles.
Dataset access permissions
You can also set dataset access permissions using user roles or set specific permissions using role-based access control (RBAC). Configuring administrative access depends on the security requirements of your organization. Dataset permissions control dataset access for all components, while RBAC controls access to a specific component. By default, dataset access management is disabled, and users have access to all datasets. If you enable dataset access management, you must configure access permissions for each dataset type and for each user role. When a dataset component is enabled for a particular role, the Issues and Cases pages include information about datasets. For more information on how to set dataset access permissions, see Manage user roles.
Be aware that even with scoped access to dataset rows applied, users can still indirectly access unauthorized dataset rows through dataset views and correlation rules. You can prevent this by ensuring that users don't have access to these dataset views and are unable to write correlation rules based on these datasets by enabling dataset access management for the relevant user roles, and limiting access to the applicable datasets. You may also want to consider not allowing these dataset-scoped users to write correlation rules, which we recommend as a best practice. For more information on how to set dataset access permissions, see Manage user roles. For more information on row-level scoping, see Manage user scope.
Some features are license-dependent. Accordingly, users may not see a specific feature if the feature is not supported by the license type or if they do not have access based on their assigned role or scope.
User groups and scoping areas
You can use user groups to streamline configuration activities by grouping together users whose access permission requirements are similar. Import user groups from Active Directory, or create them from scratch in Cortex XSIAM.
Users with Access Management permission can further restrict access of these user groups, specifically for the designated role and list of users configured in the user group by granting access only to the relevant data that the user requires for their designated role. This is performed by applying scopes to limit the data and content that users can be granted access to in Cortex XSIAM, which are divided into different scoping areas. The scoping areas include Assets, Cases and Issues, Endpoints, and Dataset Rows, which can be applied as relevant to the enforcement area, entity, or dataset. This enables you to adhere to your company's security policies of limiting user access by specifying, for example, which groups of assets users can access and what actions they can perform.
For features where scoping is not applicable, Role-Based Access Control (RBAC) is used and can be configured when managing user roles. For more information, see Manage user roles.
Single Sign-On
Manage your SSO integration with the Security Assertion Markup Language (SAML) 2.0 standard to securely authenticate system users across enterprise-wide applications and websites, with one set of credentials. This configuration allows system users to authenticate using your organization's Identity Provider (IdP), such as Okta or PingOne. You can integrate any IdP with Cortex XSIAM supported by SAML 2.0.
SSO with SAML 2.0 configuration activities are dependent on your organization’s IdP. Some of the field values need to be obtained from your organization’s IdP, and some values need to be added to your organization’s IdP. It is your responsibility to understand how to access your organization’s IdP to provide these fields and to add any fields from Cortex XSIAM to your IdP.
After SSO configuration is complete, when you sign in as an SSO user, the Cortex XSIAM permissions granted to you after logging in, either from the group mapping or from the default role configuration, are effective throughout the entire session for the defined maximum session length. The maximum session length is defined in your Cortex XSIAM Session Security Settings. This applies even if the default role configuration is updated or the group membership settings are changed.
Manage user roles
Prerequisite
Managing user roles in Cortex XSIAM Access Management requires View/Edit RBAC permissions for Access Management (under Configurations). Account Admin and Instance Administrator roles are granted this permission by default. For more information, see Predefined user roles in Set up users and roles.
Review the following topics:
- Set up users and roles
- User group management
- Assign user roles and groups
- Manage user roles and access management
Manage user roles that are assigned to Cortex XSIAM users, user groups, or API keys. User roles enable you to define the type of access and actions a user can perform.
You can only set dataset access permissions from a user role in Cortex XSIAM Access Management for the tenant. When creating user roles from the Cortex Gateway, these settings are disabled. By default, dataset access management is disabled, and users have access to all datasets. If you enable dataset access management, you must configure access permissions for each dataset type and for each user role. When a dataset component is enabled for a particular role, the Issues and Cases pages include information about datasets.
Be aware that even with scoped access to dataset rows applied, users can still indirectly access unauthorized dataset rows through dataset views and correlation rules. You can prevent this by ensuring that users don't have access to these dataset views and are unable to write correlation rules based on these datasets by enabling dataset access management for the relevant user roles and limiting access to the applicable datasets. You may also want to consider not allowing these dataset-scoped users to write correlation rules, which we recommend as a best practice. For more information on row-level scoping, see Manage user scope.
Create a user role
- Select Settings → Configurations → Access Management → Roles.
- Click New Role.
- Under Role Name, enter a name for the user role.
- (Optional) Under Description, enter a description for the user role.
- Under Components, expand each list and select the permissions for each of the components.
- Under Datasets (Disabled), you have two options for setting the Cortex Query Language (XQL) dataset access permissions for the user role:
- Set the user role with access to all XQL datasets by leaving the dataset access management as disabled (default).
- Set the user role with limited access to certain XQL datasets by selecting the Enable dataset access management toggle and selecting the datasets under the different dataset category headings.
- Click Save.
Edit a user role
- Select Settings → Configurations → Access Management → Roles.
- Right-click the relevant user role, and select Edit Role.
- (Optional) Under Role Name, modify the name for the user role.
- (Optional) Under Description, enter a description for the user role or modify the current description.
- Under Components, expand each list and select the permissions for each of the components.
- Under Datasets, you have two options for setting the Cortex Query Language (XQL) dataset access permissions for the user role:
- Set the user role with access to all XQL datasets by disabling the Enable dataset access management toggle.
- Set the user role with limited access to certain XQL datasets by selecting the Enable dataset access management toggle and selecting the datasets under the different dataset category headings.
- Click Save.
Create new role based on an existing role
- Select Settings → Configurations → Access Management → Roles.
- Right-click the relevant user role, and select Save As New Role.
- (Optional) Under Role Name, modify the name for the user role.
- (Optional) Under Description, enter a description for the user role or modify the current description.
- Under Components, expand each list and select the permissions for each of the components.
- Under Datasets, you have two options for setting the Cortex Query Language (XQL) dataset access permissions for the user role:
- Set the user role with access to all XQL datasets by disabling the Enable dataset access management toggle.
- Set the user role with limited access to certain XQL datasets by selecting the Enable dataset access management toggle and selecting the datasets under the different dataset category headings.
- Click Save.
Manage user access
Prerequisite
- Managing users, roles, scopes, user groups, authentication settings in Cortex XSIAM Access Management requires View/Edit RBAC permissions for Access Management (under Configurations). Account Admin and Instance Administrator roles are granted this permission by default. For more information, see Predefined user roles in Set up users and roles.
- To make users visible in the Users list within the Cortex tenant, an administrator must first assign them the Cortex User role on the Edit User screen in the Manage User Console of the Customer Support Portal (CSP). This role assignment in the CSP controls both the user's visibility in the tenant and their ability to authenticate via the CSP. For more information, see Cortex Gateway Administrator Guide.
Role and permission management
While the CSP controls initial visibility and access, you must update the specific permissions associated with each role within the tenant itself or via the Roles tab in the Cortex Gateway.
The following applies to user access and retention:
- SSO-only access: To allow a user to appear in the tenant while restricting them to SSO login only, assign them the Cortex User role in the CSP, but do not assign them a direct role or a default role in the Cortex Gateway or the tenant.
- Access revocation: If no role is assigned to a user (either directly or through a user group) in the Cortex Gateway or the tenant, the user cannot access the tenant. The user is subsequently revoked in the Cortex Gateway, and their information is no longer saved.
Manage users in the Cortex XSIAM tenant
Once users are visible in the tenant, perform the following tasks in Cortex XSIAM to edit permissions, import multiple users, view permissions, or manage user status.
Edit user permissions
Update a user's role and scope, add a user to a user group, and view permissions based on the role, scope, and user groups assigned to the user.
You can configure granular scoping for Scope-Based Access Control (SBAC) by granting access only to the relevant data that the user requires for their designated role. Administrators apply scopes to limit the data and content that users can be granted access to in Cortex XSIAM, which are divided into different scoping areas. The scoping areas include Assets, Cases and Issues, Endpoints, and Datasets Rows, which can be applied as relevant to the enforcement area, entity, or dataset. For more information, see Manage user scope.
Note
- You can only reduce the permissions of an Account Admin user via Cortex Gateway.
- Non-administrator users with Access Management permissions are restricted from granting, modifying, or removing the Instance Administrator role for any user, user group, or API key. Additionally, the Edit and Remove buttons are hidden for users who already hold an effective Instance Administrator role.
- Select Settings → Configurations → Access Management → Users.
-
Right-click the relevant user, and select Edit User Permissions.
Tip
To apply the same settings to multiple users, select them, and then right-click and select Edit User Permissions.
- In the Role tab, under Role, select the default or custom role.
- (Optional) Under User Groups, add the user to a group.
-
(Optional) Under Show Accumulated Permissions:
- Do one of the following:
- Select all to view the combined permissions for every role and user group assigned to the user.
- Select a specific role assigned to the user to view the available permissions for that role.
- Under Components, expand each list to view the permissions to the various Cortex XSIAM components.
- Under Datasets, there are two possibilities for viewing a user's dataset access permissions:
- When dataset access management is enabled and the user has access to certain Cortex Query Language (XQL) datasets, the datasets are listed.
- When dataset access management is disabled and users have access to all XQL datasets, the text No dataset has been selected is displayed.
Note
User permissions for components and datasets are based on the access permissions set in the user role. For more information on editing these user role permissions, see Manage user roles.
- Do one of the following:
-
(Optional) You can configure granular scoping:
- Click the Scope tab.
-
Under Scope Definition, expand the scoping areas that you want to grant the user role access to in the tenant by clicking the chevron icon (>) beside the scoping area title, and make any changes required. The following table explains the options available to configure:
Important
Before configuring, ensure that you review Understand scoping in the Manage user scope section.
Scoping Area Granular Scoping Configurations Assets <p>Set the Scope by selecting one of the following:</p><ul><li>No assets: No asset is accessible.</li><li>All assets: Defines access to all assets.</li><li>Select asset groups: Defines access to the specific assets associated with the Asset Groups selected, and to view all their related cases, issues, and findings for these specific assets and Asset Groups. Under Select asset groups, define the specific asset groups that you want to grant access. Only Asset Groups relevant for scoping are listed, which are asset groups that are using only the asset attributes listed in Manage user scope (under Understand scoping → Scoping Areas → Assets).</li></ul><p>The scoping of assets also affects the scoping of cases, issues, and findings.</p><div data-gb-custom-block data-tag="hint" data-style="info" class="hint hint-info"><p>Note</p><p>Visibility of Security domain Issues that refer to assets with agents is controlled by the Endpoints scoping configuration.</p></div> Cases and Issues <p>Set the Scope by selecting one of the following:</p><ul><li>No cases and issues: Defines access to no cases and issues.</li><li>All cases and issues: Defines access to all cases and issues. Users can view cases or issues referencing assets within their scope. Use the Assets section to define which assets are in scope.</li><li><p>Select domains: Defines access to the domains selected to view their related cases and issues. Under Select domains, define the specific domains that you want to grant access.</p><p>Users can only view cases or issues referencing assets and endpoints within their scope. Use the Assets section to define which assets are in scope.</p></li></ul><p>When selecting All cases and issues or Select domains, you can separately configure access to issues and cases that lack an asset reference or where the referenced asset is not in All Assets and All Endpoints inventories. To provide access, select the Allow access to cases and issues that are not referencing known assets or endpoints checkbox. Once selected, you can specifically control which users have access to issues and cases that lack Affected Assets (as seen in the issue’s panel) and Assets (as seen in the case's panel), or where the listed assets are not part of the Asset or Endpoint inventories. When the assets listed are not part of the inventories, the asset string is typically non-clickable. In some cases, such as for identity-related issues, assets may open a dedicated User Risk View, which differs from the standard inventories panels. In the Issues and Cases tables, such items can be identified by empty values in the following columns: Asset IDs, Target Agent Identifier, and Source Agent Identifier.</p> Endpoints <p>Set the Scope by selecting one of the following:</p><ul><li>No endpoints: Defines access to no endpoints with no ability to view their related agent management and enterprise policies.</li><li>All endpoints: Defines access to all endpoints with the ability to view their related agent management and enterprise policies. This configuration can impact the visibility of related Security domain Cases and Issues, but will not affect asset visibility.</li><li>Select specific (at least one required): Defines specific access to all endpoint groups by selecting Endpoint Groups or all endpoint tags by selecting Endpoint Tags to view their related agent management and enterprise policies. This configuration can impact the visibility of related Security domain Cases and Issues, but will not affect asset visibility.</li></ul> Datasets Rows <p>Configure a filterto define the specific subset of rows a user is allowed to access in each raw dataset. A raw dataset is every dataset where Palo Alto Networks data is ingested out-of-the-box or third-party data is ingested using a configured dedicated collector, also called a data source. This filter configuration does not impact the visibility of cases and issues.</p><p>Follow these steps to configure afilter:</p><p>1. For datasets where nofilteris defined, determine how to set the When no filter is defined option as either:</p><ul><li>No rows are accessible (default): Without a configuredfilter, no rows are accessible. Users can query the datasets in Cortex Query Language (XQL) as they have access, but the results will be empty.</li><li>All rows are accessible: Without a configuredfilter, all rows are accessible. Users can query the datasets in Cortex Query Language (XQL) as they have access, and view all results.</li></ul><div data-gb-custom-block data-tag="hint" data-style="info" class="hint hint-info"><p>Note</p><p>When defining a filter for row-level scoping on raw datasets, queries based on the Cortex Data Model (XDM) are not supported. XDM queries return specific rows only when All rows are accessible is selected and no filter is defined in the Datasets Rows scoping area. Otherwise, no rows are returned.</p></div><p>2. Define any filters for the applicable datasets listed in the table:</p><p>1. Scroll down the list of datasets to the dataset you want to apply afilteron, and click the Edit Scope icon.</p><p>2. In the Define what rows are accessible window, continue to write the query for thefilterin the query box (where the syntax is a limited subset of XQL) to limit the data rows for the selected dataset according to the access permissions you want the user to have. The beginning of the query is already defined before the query box, and there is no need to include this in your query.</p><div data-gb-custom-block data-tag="hint" data-style="info" class="hint hint-info"><p>Important</p><p>For optimal performance, we recommend using a single field in thefilterdefinition and simple comparison operators.</p></div><p>FIXME_ACCORDION_PLACEHOLDER</p><p>3. (Optional) Set the Time frame for the query. The default is Last 1 day.</p><p>4. (Optional) You can preview the query results displayed based on your defined query by clicking Preview. You can edit your query until you're satisfied with the output. By default, the query results are limited to 1000 records.</p><p>5. When you are finished, click Done.</p><p>The Scope field for the dataset that you added the filter on is updated with the query.</p><p>Example 13. **null
</p><p>3. Scroll down the list of datasets to the dataset you want to apply afilteron, and click the Edit Scope icon.</p><p>4. In the Define what rows are accessible window, continue to write the query for thefilterin the query box (where the syntax is a limited subset of XQL) to limit the data rows for the selected dataset according to the access permissions you want the user to have. The beginning of the query is already defined before the query box, and there is no need to include this in your query.</p><div data-gb-custom-block data-tag="hint" data-style="info" class="hint hint-info"><p>Important For optimal performance, we recommend using a single field in thefilterdefinition and simple comparison operators.</p></div><p>FIXME_ACCORDION_PLACEHOLDER</p><p>5. (Optional) Set the Time frame for the query. The default is Last 1 day.</p><p>6. (Optional) You can preview the query results displayed based on your defined query by clicking Preview. You can edit your query until you're satisfied with the output. By default, the query results are limited to 1000 records.</p><p>7. When you are finished, click Done.The Scope field for the dataset that you added the filter on is updated with the query.Example 13. **null
</p>
Important
By default, Enable Scope Based Access Control is disabled in Settings → Configurations → General → Server Settings, and granular scoping is not enforced. Before enabling SBAC, we recommend that an administrator or a user with Access Management permissions first ensure that the users, user groups, and API Keys defined in Cortex XSIAM are granted the required access by assigning the relevant scopes. For more information, see Manage user scope.
- Click Save.
Import multiple users
Use a CSV file to import users who belong to a Customer Support Portal account, and assign them roles that are defined in Cortex XSIAM. You can use the CSV template provided in Cortex XSIAM, or prepare a CSV file from scratch.
- Select Settings → Configurations → Access Management → Users.
- Click Import Multiple User Roles.
- Do one of the following:
- To use the CSV template, click Download example file, and replace the example values with your values.
- Prepare a CSV file from scratch. Make sure the file includes these columns:
- User email: Email address of the user belonging to a Customer Support Portal account, for example, john.smith1@exampleCompany.com.
- Role name: Name of the role that you want to assign to this user, for example, Privileged Responder. The role must already exist in Cortex XSIAM.
- Is an account role: A boolean value that defines whether the user is designated with an Account Admin role in Cortex Gateway. Set the value to TRUE; otherwise, the value is set to FALSE (default).
- Locate the file and drag it to the dialog box.
- Click Import.
View user permissions
View all of the permissions currently assigned to a user.
- Select Settings → Configurations → Access Management → Users.
-
Right-click the relevant user, and select Edit User Permissions.
Tip
To apply the same settings to multiple users, select them, and then right-click and select Edit User Permissions.
- In the Role tab, under Show Accumulated Permissions, do one of the following:
- Select all to view the combined permissions for every role and user group assigned to the user.
- Select a specific role assigned to the user to view the available permissions for that role.
- Under Components, expand each list to view the permissions to the various Cortex XSIAM components.
- Under Datasets, there are two possibilities for viewing a user's dataset access permissions:
- When dataset access management is enabled and the user has access to certain Cortex Query Language (XQL) datasets, the datasets are listed.
- When dataset access management is disabled and users have access to all XQL datasets, the text No dataset has been selected is displayed.
- To view the granular scoping configurations granted to the user role, click the Scope tab, and under Scope Definition, expand the scoping areas to view the settings by clicking the chevron icon (>) beside the scoping area title. The scoping areas include Assets, Cases and Issues, Endpoints, and Datasets Rows.
Hide user
There might be instances where you want to hide a user from the list of users, for example, a user that has a Customer Support Portal Super User role but isn't active on your Cortex XSIAM tenant. After you hide a user, they will no longer be displayed in the list of users when Show User Subset is selected on the Users page. Non-administrator users with Access Management permissions can hide any user, including those assigned the Instance Administrator role.
- Select Settings → Configurations → Access Management → Users.
- Right-click the relevant user, and select Hide User.
Add user to a user group
- Select Settings → Configurations → Access Management → Users.
-
Right-click the relevant user, and select Edit User Permissions.
Tip
To apply the same settings to multiple users, select them, and then right-click and select Edit User Permissions.
- Under User Groups, add the user to a group.
- Click Save.
Deactivate user
You cannot deactivate a user who has an Account Admin role.
- Select Settings → Configurations → Access Management → Users.
- Right-click the relevant user, and select Deactivate User.
- Click Deactivate.
Remove role assigned to user
You cannot remove a user who has an Account Admin role.
- Select Settings → Configurations → Access Management → Users.
- Right-click the relevant user, and select Remove User Role.
- Click Remove.
User access reference information
The following is a list of common fields on the Users page:
| Field | Description |
|---|---|
| Show User Subset | Displays all users except for hidden users. |
| User Type | Indicates whether a user was defined in Cortex XSIAM using the Customer Support Portal, SSO (single sign-on) using your organization’s IdP, or both Customer Support Portal/SSO. |
| Direct XDR Role | Name of the role specifically assigned to a user. When a user does not have any Cortex XSIAM access permissions assigned specifically to them, the field displays No-Role. |
| Groups | <p>Lists the groups to which a user belongs. Any group that was imported from Active Directory displays AD beside the group name.</p><p>If a user group has scoping permissions, the users in the group are granted permissions according to the user group settings, even if the user does not have configured scope settings.</p> |
| Group Roles | Lists the group roles based on the groups to which a user belongs. Hovering over the group role displays the group associated with this role. |
| Scope | Lists a summary of the granular scoping configured for the user. |
| Groups Scope | Lists a summary of the granular scoping configured in the user groups that the user belongs to |
Manage user scope
Prerequisite
- Configuring user scopes in Cortex XSIAM Access Management requires View/Edit RBAC permissions for Access Management (under Configurations). Account Admin and Instance Administrator roles are granted this permission by default. For more information, see Predefined user roles in Set up users and roles.
- By default, Enable Scope Based Access Control is disabled in Settings → Configurations → General → Server Settings, and granular scoping is not enforced. Before enabling SBAC, we recommend that you first ensure that the users, user groups, and API Keys defined in Cortex XSIAM are granted the required access by assigning the relevant scopes.
Review the following topics:
- Set up users and roles
- User group management
- Assign user roles and groups
- Manage user roles and access management
What is SBAC?
Cortex XSIAM enables you to use Scope-Based Access Control (SBAC) in combination with Role-Based Access Control (RBAC) to define precise access controls according to your organization's security policies. While RBAC defines what a role can access and the actions that can be performed, SBAC determines the specific data and content displayed when accessing these areas and performing those actions.
Users with Access Management permission apply scopes to limit the data and content that users can be granted access to in Cortex XSIAM, which are divided into different scoping areas. The scoping areas include Assets, Cases and Issues, Endpoints, and Datasets Rows, which can be applied as relevant to the enforcement area, entity, or dataset. For example, an Investigator role might have access to asset information based on the RBAC permissions, but the SBAC granular scoping configuration could limit that investigator's view and control to only assets within a particular scoping area. This hybrid approach ensures scalability and granular control, significantly strengthening system security by ensuring only authorized users are granted access to the relevant data that the user requires for their designated role.
Granular scoping for all scoping areas is configured in users, user groups, or API Keys according to the designated user role. Users are granted granular scoping access based on the user role assigned to them, either in a user group or directly.
Things to consider before configuring SBAC
Before you begin setting up Scope-Based Access Control (SBAC) granular scoping, consider the following information:
- SBAC is disabled by default, which means that users have access to all content and data in the areas they have access to according to the RBAC permissions defined in their role.
- To best address Cases that span across all scopes, we recommend that there always be designated users with full access to all cases, issues, assets, and findings.
- Some areas and features in Cortex XSIAM do not comply with SBAC. In these cases, use RBAC permissions to restrict access. For more information, see Functional areas that respect and don't respect SBAC.
- Respecting SBAC has some performance overhead in the following areas:
- When opening the Cases, Issues, Findings, and Assets tables, which can take more time.
- When defining a filter for access row-level scoping on raw datasets, the more complex the filter is, the greater the performance overhead. For optimal performance, we recommend using a single field in the scope definition and simple comparison operators.
- In Reports, SBAC applies when a report is manually generated. Scheduled reports run in the scope of the user who created or last updated the report template. Be aware that once a report is generated, it can be shared with others; exercise caution when distributing reports, as recipients might not be authorized to view the data they contain.
- Be aware that even with scoped access to dataset rows applied, users can still indirectly access unauthorized dataset rows through dataset views and correlation rules. You can prevent this by ensuring that users don't have access to these dataset views and are unable to write correlation rules based on these datasets by enabling dataset access management for the relevant user roles and limiting access to the applicable datasets. You may also want to consider not allowing these dataset-scoped users to write correlation rules, which we recommend as a best practice. For more information on how to set dataset access permissions, see Manage user roles.
Understand scoping
Scoping areas
User Groups, Users, and API Keys can be scoped according to the following scoping areas:
-
Assets: Provides access to the assets associated with asset groups, and enables you to access their related cases, issues, and findings. When using asset groups, you can limit access based only on this list of attributes: Asset Class, Category, Provider, Region, Organization, Account Name, Realm, Business Application Names, Kubernetes Cluster, Kubernetes Namespace, Code Repository, and Asset Tags.
Note
Use the existing Realm attribute whenever you need to scope based on the Account ID.
- When you create or edit an Asset Group, the changes are applied immediately to new assets and to existing assets that have been updated. Yet, it can take a few hours for the changes to appear on existing assets that have not been updated.
- Cases and Issues: Provides access to domains to view their related cases and issues.
-
Endpoints: Applies scoping on an endpoint as an entity and provides access to Endpoint Groups and Endpoint Tags to view their related agent management and enterprise policies.
Note
This configuration can impact the visibility of the related Security domain in the Cases and Issues scope area, but will not affect asset visibility.
- Datasets Rows: Enables row-level scoping on raw datasets. This granular control directly affects product areas accessing these rows, such as Cortex Query Language (XQL) dataset queries and custom dashboard widgets. The datasets listed are a subset of datasets, determined by your assigned role, where you can configure row-level access for users. To grant access to specific dataset rows, you must configure a filter to explicitly define the allowable rows. When configuring this filter, you can encounter different scenarios. For more information, see Scenarios related to Datasets Rows scoping.
Note
Access to the asset_groups dataset is managed through Dataset Access Management permissions within the user role.
Scoping Behaviors
- When applicable, all conditions must be met to apply the scope configuration. For example, an issue with an affected asset is accessible only if the asset is in scope and the issue's domain is in scope. Similarly, a Case with multiple issues, where some have affected assets and others have affected endpoints, will be inaccessible if the Endpoint condition is set to 'No Endpoints,' even if the affected assets satisfy the Assets condition.
- If only a subset of affected assets, endpoints, or issue domains are within a user's scope, the user can still view the full list of all items within a Case they have access to. While items outside of their scope remain visible in the list, the user cannot access further details or open the specific cards for those out-of-scope assets, endpoints, or issues.
- Cases and Issues of deleted assets do not have affected assets and so are not affected by asset-led SBAC or Endpoints.
- The behavior of cases and issues with affected endpoints depends on the Endpoint Scoping mode.
- XQL queries that use the
casesandissuesdatasets respect both Assets and Cases and Issues scoping configurations. - Scoping of Datasets Rows is performed in addition to user permissions to access the dataset.
- Row-level scoping is only supported on raw datasets. This granular scoping directly affects product areas accessing these rows, including XQL dataset queries and custom dashboard widgets.
-
When a user's SBAC permissions change for a given dataset by updating the filter, queries executed before the change will retain and display their original results in the Query Center.
Note
Whenever a user's SBAC permissions are changed, Cortex XSIAM logs this event in the audit logs (Settings → Management Audit Logs). These monitored activity events are found on the Management Audit Logs table by filtering the Type column by Permissions and Subtype column by Scope Edit.
- While users with row-level dataset scoping can view other users' queries in the Query Center, they are prevented from viewing the corresponding query results.
Functional areas that respect and don't respect SBAC
It is important to review both the functional areas and features in Cortex XSIAM that are respected and not fully respected so you can decide what actions to take in your tenant.
Functional areas respected
Scope-Based Access Control (SBAC) applies to the following functional areas in Cortex XSIAM:
Important
Some areas and features in Cortex XSIAM do not respect SBAC. In these cases, use RBAC permissions to restrict access.
| Functional Area | Description | Related scoping area |
|---|---|---|
| Cases, Issues, Findings, and Assets tables | View and manage cases, issues, findings, and assets, and take actions in these tables. | <ul><li>Assets</li><li>Cases and Issues</li><li>Endpoints</li></ul> |
| Dashboard and Reports | <p>Scoping takes place only on the following:</p><ul><li>XQL-related widgets based on XQL queries that use the cases, issues, findings, and asset_inventory datasets, and respect only the Assets scoping area configurations.</li><li>Agent-related widgets.</li></ul><div data-gb-custom-block data-tag="hint" data-style="info" class="hint hint-info"><p>Note</p><p>XQL-based dashboard widgets may require a few hours to initially reflect changes to the list or definitions of asset groups used for scoping. To view the most current data immediately, refresh the dashboard or its XQL widgets.</p></div> |
<ul><li>Assets</li><li>Cases and Issues</li><li>Endpoints</li></ul> |
| Public APIs | Public APIs that access Cases, Issues, Findings, and Assets information respect Scope-Based Access Control (SBAC). | <ul><li>Assets</li><li>Cases and Issues</li></ul> |
| Cortex Query Language (XQL) | <p>When using XQL with cases, issues, findings, and asset_inventory datasets, keep in the mind the following:</p><ul><li>XQL respects asset-led SBAC and the Cases and Issues scoping configuration.</li><li>These scoping controls are enforced across all XQL-based features, including XQL queries and dashboard widgets.</li><li><div data-gb-custom-block data-tag="hint" data-style="info" class="hint hint-info"><p>Note</p><p>XQL queries for cases and issues do not respect the Endpoints scoping area configurations.</p></div></li></ul> |
Assets |
| Endpoint Administration table | View endpoints and take actions on endpoints. | Endpoints |
| Policy Management | Create and edit Prevention policies and profiles, Extension policies and profiles, and global and device Exceptions that are within the scope of the user. | Endpoints |
| Action Center | View and take actions only on endpoints that are within the scope of the user. | Endpoints |
| Identity Security | View and manage identity assets, permissions, and issues that are within the scope of the user. | <ul><li>Assets</li><li>Cases and Issues</li></ul> |
| Cloud Workload Policies | View Cloud Workload Policies when user access is scoped to any of the available options: All assets, No assets, or Select asset groups. When no SBAC restriction is applied, the user’s access is determined solely by their RBAC permissions. For more information, see Cloud Workload Policies and Rules. | Assets |
| Graph Search | Safely explore your environment in Graph Search with precise permission management. Assign users to User Groups and Asset Groups, ensuring they only see authorized graph nodes and relationships. | Assets |
| Access to datasets | Row-level scoping is only supported on raw datasets. This granular scoping directly affects product areas accessing these rows, including XQL dataset queries and custom dashboard widgets. | Datasets Rows |
SBAC not fully respected functional areas
Ensure that you review the points below that explain the main functional areas with limitations with respecting SBAC, so you can decide how to handle this in your tenant. A suggested action is provided when applicable.
- Access to datasets:
- Access to the
alertsandincidentsdatasets does not support SBAC. As a result, consider limiting users from accessing these datasets by excluding access to the datasets mentioned above using Dataset Views, and only enable access tocasesandissuesdatasets that respect SBAC. - Access to the endpoints dataset via XQL does not respect endpoint-led SBAC. In this case, use RBAC permissions to restrict access to the endpoints dataset and permit access only to users who can see information for all agents.
- Row-level scoping is only supported on raw datasets and no other dataset types, including in XQL queries and custom dashboard widgets. For these datasets that are not in the scope, all rows are available.
- When defining the
filterfor row-level scoping on raw datasets, queries based on the Cortex Data Model (XDM) aren't supported. XDM queries return specific rows only when All rows are accessible is selected when nofilteris defined in the Datasets Rows scoping area. Otherwise, no rows are returned.
- Access to the
- Dataset Views: Be aware that even with scoped access to dataset rows applied, users can still indirectly access unauthorized dataset rows through dataset views. You can prevent this by ensuring that users don't have access to these dataset views by enabling dataset access management for the relevant user roles and limiting access to the applicable datasets. For more information on how to set dataset access permissions, see Manage user roles.
- Correlation Rules: Be aware that even with scoped access to dataset rows applied, users can still indirectly access unauthorized dataset rows through correlation rules. You can prevent this by ensuring that users are unable to write correlation rules based on these datasets by enabling dataset access management for the relevant user roles, and limiting access to the applicable datasets. You may also want to consider not allowing these dataset-scoped users to write correlation rules, which we recommend as a best practice. For more information on how to set dataset access permissions, see Manage user roles.
- Automation Rules: Automation rules are executed using the full system scope. Users authorized to edit or run automation rules can configure the system to run scripts or playbooks that can interact with data across the entire system. It is recommended to allow users with full access to all assets to create and edit automation rules.
- Command Centers: Aggregate numbers in Command Centers can also sum up data that is not in the user scope. When pivoting from Command Centers to the Cases, Issues, Findings, and Assets tables, these tables do respect SBAC. We recommend limiting the users who access Command Centers, and these users should be granted a broader scope. For all other users, disable access in RBAC settings (Dashboards & Reports → Command Center Dashboards).
-
Host Inventory
We recommend disabling access in RBAC settings (Investigation & Response → Search → Host Insights).
-
Timeline widget
As a workaround, you can disable access through RBAC permissions by disabling Dashboards (Dashboards & Reports → Dashboards).
- Notification Center
- Agent Installation widget: This widget is not available for scoped users.
- Drop-downs of cases and issues domains: Drop-downs of these domains display all domains.
- Asset Group visibility in filters: Similar to domains, all Asset Groups are available for selection in filters across Cortex XSIAM, regardless of which specific Asset Groups are used for scoping a user. While SBAC limits the data (assets) a user can view, it does not restrict the visibility of the names of the Asset Groups themselves in filter drop-down menus.
-
KSPM dashboard: Users can access all information on the dashboard when their user access is scoped to view All assets or assigned to the Instance Administrator role. Otherwise, users with granular scoping set to No assets or Select asset groups will have limited access to the dashboard.
Note
This feature is included with a Cortex XSIAM Premium, Enterprise, and NG-SIEM licenses.
- Cloud Workload Policies: Users with SBAC granular scoping (in addition to the RBAC permissions required for Cloud Workload Policies) can only view Cloud Workload Policies when their access is scoped to any of the available options: All assets, No assets, or Select asset groups. When no SBAC restriction is applied, the user’s access is determined solely by their RBAC permissions. As a result, if you want users to be able to edit and modify Cloud Workload Policies, use the RBAC permissions. For more information on Cloud Workload Policies, see Cloud Workload Policies and Rules.
Scenarios related to Datasets Rows scoping
When configuring row-level scoping on raw datasets, you can encounter different scenarios. It's important to understand how best to handle these scenarios and what are the recommended best practices.
Scenario 1: Data sources with multiple instances
When integrating data from multiple sources, as a best practice, name each data source instance using a descriptive and consistent convention. This naming should clearly reflect the teams/groups that require access to the data through that specific instance, and the same naming value should be maintained across different sources when applicable. For example, use names like business_unit_x or subsidiary_y. Adopting this convention across all data sources simplifies the process of writing filters for each _raw dataset using the _collector_name field.
Scenario 2: Dataset schemas without _collector_name
When data is ingested from a source like a Broker VM or agent, the dataset schema may not include the _collector_name field. In this scenario, use the other fields that are supported to define your filter. For more information on the fields supported, see Supported syntax in Step 3 of How to configure granular scoping of the table for Datasets Rows.
Scenario 3: Supported fields don't provide the necessary segmentation
Sometimes, when trying to configure a filter to define the specific subset of rows a user is allowed to access in each raw dataset, the supported fields don't provide the necessary segmentation that you are looking for. In this case, define a _scope field in an [INGEST] section of the Parsing Rules for the applicable dataset ingesting data. The _scope field is added to the dataset columns, so that each row is imprinted during ingestion or parsing time with the _scope value. You can then use this _scope field in the filter. For more information on the fields supported, see Supported syntax in Step 3 of How to configure granular scoping of the table for Datasets Rows.
Scenario 4: Only a few datasets need to be segmented
When only a few datasets need to be segmented, as you want users to have full access to the other datasets, configure the datasets to grant access to all rows by default when no filter is defined. This is set in the Datasets Rows scoping area by configuring the When no filter is defined option to All rows are accessible. You can then define filters only for the few datasets that need scoping.
Scenario 5: Scoped users with Access Management permission
Consider this scenario for scoped users with Access Management permission:
When a user (non-administrator) with Access Management permission (User A) attempts to define row-level scoping for another user (User B), an issue can arise. User A can only see and configure SBAC filters for datasets that both User A and User B currently have access permissions (RBAC) to. Any datasets that User B can access, but User A cannot, will not appear for User A when defining access for User B.
To avoid these possible scenarios, we recommend that users with access management permissions be granted full RBAC permissions to the complete superset of datasets for the other users to whom they're meant to apply row-level scoping. This ensures that users setting row-level scoping see the complete list of datasets they are authorized to scope.
How to configure granular scoping
Granular scoping is configured in users, user groups, or API keys, and applied to the user roles assigned. Users are then granted granular scoping access according to the user roles assigned to them in a user group or directly. The instructions below explain how to configure granular scoping according to Palo Alto Networks best practices.
Granular scoping is disabled and not enforced in Cortex XSIAM by default. Before enabling SBAC, we recommend that an administrator or a user with Access Management permissions first ensure that the users, user groups, and API Keys defined in Cortex XSIAM are granted the required access by assigning the relevant scopes. This user can then assign a scoping area to a Cortex XSIAM user (non-administrator), so the non-administrator user can manage only the specific scoping areas that are predefined within that scope.
Any changes made to the granular scoping of a user, user group, or API key are recorded on the Management Audit Logs page (Settings → Management Audit Logs). These events are categorized with the Type set to Permissions and the Subtype set to Scope Edit.
Note
Make sure to assign the required default granular scoping for users. This depends on the structure and divisions within your organization and the particular purpose of each organizational unit to which scoped users belong.
- Ensure that you have the necessary administrator-level permissions.
- Verify that the users, user groups, and API keys defined in Cortex XSIAM are assigned the relevant scopes.
- To verify the granular scoping of a user, select Settings → Configurations → Access Management → Users, right-click the user name, and select Edit User Permissions.
- To verify the granular scoping of a user group, select Settings → Configurations → Access Management → User Groups, right-click the user group, and select Edit Group.
- To verify the granular scoping of an API key, select Settings → Configurations → Integrations → API Keys, right-click the API key, and select Edit.
-
In the Scope tab, expand the scoping areas to review the current granular scoping definitions by clicking the chevron icon (>) beside the scoping area title, and make any changes required. The following table explains the options available to configure:
Important
Before configuring, ensure that you review the Understand scoping section.
Assets
Set the Scope by selecting one of the following:
- No assets: No asset is accessible.
- All assets: Defines access to all assets.
- Select asset groups: Defines access to the specific assets associated with the Asset Groups selected, and to view all their related cases, issues, and findings for these specific assets and Asset Groups. Under Select asset groups, define the specific asset groups that you want to grant access. Only Asset Groups relevant for scoping are listed, which are asset groups that are using only the asset attributes listed in Manage user scope (under Understand scoping → Scoping Areas → Assets).
The scoping of assets also affects the scoping of cases, issues, and findings.
Note
Visibility of Security domain Issues that refer to assets with agents is controlled by the Endpoints scoping configuration.
Cases and Issues
Set the Scope by selecting one of the following:
- No cases and issues: Defines access to no cases and issues.
- All cases and issues: Defines access to all cases and issues. Users can view cases or issues referencing assets within their scope. Use the Assets section to define which assets are in scope.
-
Select domains: Defines access to the domains selected to view their related cases and issues. Under Select domains, define the specific domains that you want to grant access.
Users can only view cases or issues referencing assets and endpoints within their scope. Use the Assets section to define which assets are in scope.
When selecting All cases and issues or Select domains, you can separately configure access to issues and cases that lack an asset reference or where the referenced asset is not in All Assets and All Endpoints inventories. To provide access, select the Allow access to cases and issues that are not referencing known assets or endpoints checkbox. Once selected, you can specifically control which users have access to issues and cases that lack Affected Assets (as seen in the issue’s panel) and Assets (as seen in the case's panel), or where the listed assets are not part of the Asset or Endpoint inventories. When the assets listed are not part of the inventories, the asset string is typically non-clickable. In some cases, such as for identity-related issues, assets may open a dedicated User Risk View, which differs from the standard inventories panels. In the Issues and Cases tables, such items can be identified by empty values in the following columns: Asset IDs, Target Agent Identifier, and Source Agent Identifier.
Endpoints
Set the Scope by selecting one of the following:
- No endpoints: Defines access to no endpoints with no ability to view their related agent management and enterprise policies.
- All endpoints: Defines access to all endpoints with the ability to view their related agent management and enterprise policies. This configuration can impact the visibility of related Security domain Cases and Issues, but will not affect asset visibility.
- Select specific (at least one required): Defines specific access to all endpoint groups by selecting Endpoint Groups or all endpoint tags by selecting Endpoint Tags to view their related agent management and enterprise policies. This configuration can impact the visibility of related Security domain Cases and Issues, but will not affect asset visibility.
Dataset rows
Follow these steps to configure a
filter:Configure a
filterto define the specific subset of rows a user is allowed to access in each raw dataset. A raw dataset is every dataset where Palo Alto Networks data is ingested out-of-the-box or third-party data is ingested using a configured dedicated collector, also called a data source. This filter configuration does not impact the visibility of cases and issues.-
For datasets where no
filteris defined, determine how to set the When no filter is defined option as either:- No rows are accessible (default): Without a configured
filter, no rows are accessible. Users can query the datasets in Cortex Query Language (XQL) as they have access, but the results will be empty. - All rows are accessible: Without a configured
filter, all rows are accessible. Users can query the datasets in Cortex Query Language (XQL) as they have access, and view all results.
Note: When defining a filter for row-level scoping on raw datasets, queries based on the Cortex Data Model (XDM) are not supported. XDM queries return specific rows only when All rows are accessible is selected and no filter is defined in the Datasets Rows scoping area. Otherwise, no rows are returned.
- No rows are accessible (default): Without a configured
-
Define any filters for the applicable datasets listed in the table:
- Scroll down the list of datasets to the dataset you want to apply a
filteron, and click the Edit Scope icon. -
In the Define what rows are accessible window, continue to write the query for the
filterin the query box (where the syntax is a limited subset of XQL) to limit the data rows for the selected dataset according to the access permissions you want the user to have. The beginning of the query is already defined before the query box, and there is no need to include this in your query.For optimal performance, we recommend using a single field in the
filterdefinition and simple comparison operators.Supported syntax
Fields
You can define the rest of the
filterin the query box, where only the following system fields are supported:_broker_device_id,_broker_device_ip,_broker_device_name,_collector_id,_collector_ip,_collector_name,_collector_type,_device_id,_final_reporting_device_ip,_final_reporting_device_name,_log_type,_product,_scope,_reporting_device_ip,_reporting_device_name, and_vendor.For more information on these fields, see the table that describes all the fields in the
metrics_sourcedataset andmetrics_viewpreset in Overview of data ingestion metrics. For more information on the_scopefield (relevant when_scopeis defined in the Parsing Rule), see Scenario 3: Supported fields don't provide the necessary segmentation.Comparison operators
The following comparison operators are supported:
- Exact matches (
=,!=) - Comparing numerical values (
>,<,>=,<=) - Checking membership in lists (
in) - Querying arrays (
array_contains) - Partial matches (
contains,starts_with): Using this operator has additional performance overhead, and we recommend avoiding its use.
If you only want a user to be able to access rows in the
pan_dds_rawdataset, when the_collector_nameisbu2_collector, you'd have to define thefilterin the query box as:_collector_name = “bu2_collector”
- Exact matches (
- Optional) Set the Time frame for the query. The default is Last 1 day.
- (Optional) You can preview the query results displayed based on your defined query by clicking Preview. You can edit your query until you're satisfied with the output. By default, the query results are limited to 1000 records.
-
When you are finished, click Done.
The Scope field for the dataset that you added the filter on is updated with the query.
In the above example, the Scope field displays
_collector_name = “bu2_collector”.
- Scroll down the list of datasets to the dataset you want to apply a
- Click Save.
- Repeat steps 2 to 4 until you have configured all users, user groups, and API keys with the correct granular scoping access.
-
Enable granular scoping in Cortex XSIAM.
- Select Settings → Configurations → General → Server Settings, and select the Enable Scope-Based Access Control toggle.
- (Optional) You can select the Endpoint Scoping Mode, which is defined per tenant:
- Permissive: Enables users with at least one scope tag to access the relevant entity with that same tag.
- Restrictive: Users must have all the scoped tags that are tagged within the relevant entity of the system.
- Click Save.
When you are finished, all the users in Cortex XSIAM are now able to use Cortex XSIAM only within the granular scoping granted according to their assigned user roles.
Manage access to objects
Cortex XSIAM enforces least-privileged access by allowing you to manage access for individual instances of custom (user-defined) objects. Access management for these items is handled through a common experience for per-object access, which allows you to treat these tools as distinct objects with their own access settings.
What are Objects?
Objects are the tools used to visualize, analyze, and interact with information within Cortex XSIAM. By managing access at the object level, you can isolate sensitive information between teams (such as SOC vs. Internal Threat) or departments (such as CloudOps vs. SecOps).
In Cortex XSIAM, objects are functional components or configurations. There are two primary categories of objects:
Custom objects
User-defined objects created, imported, or duplicated by users. These are the primary focus of per-object access management.
Supported custom objects include:
- Dashboards and widgets
- Report Templates
- Playbooks and Scripts
- Saved Cortex Query Language (XQL) queries (located in the Query Library)
System objects
Out-of-the-box objects provided by Palo Alto Networks. These are Public by default and are read-only; they cannot be edited or deleted, and their ownership cannot be changed. Yet, they can often be duplicated to create a custom version. System objects are available to any user who has the corresponding component (such as Dashboards & Reports → Dashboards or Investigation & Response → Automations → Playbooks) enabled in their role.
Access examples
Granular per-object access supports various organizational security requirements:
- Use only by SOC team: A "flat" structure where all analysts can see all objects. This is the default setting for the tenant. By default, newly created custom objects, such as a specific investigation dashboard or a complex XQL saved query, are Restricted and visible only to the creator; the owner can then make them Public to allow the entire team to view or edit them based on their role permissions.
- Both SOC team and Internal threat: Specific objects, such as sensitive dashboards and saved queries, are created by a member of the Internal Threat team and made accessible only to the Internal Threat user group. Members of the Internal Threat team create these objects and share them only with their peers or their specific user group. Members of the SOC team do not have access to these objects, as they are not visible or accessible to any users who have not been explicitly granted access.
- Both SOC team and Cloud team: Provides department isolation. Each team only accesses its own custom objects, such as playbooks and scripts; the SOC team cannot see Cloud team objects, and vice versa.
Key concepts
Before configuring access, it is important to understand the different states and roles that define an object's security access.
General access states
The General access setting determines the baseline visibility for an object:
- Restricted (default): To ensure least privileged access, all newly created custom objects are Restricted by default. The object is visible only to the Owner and those specifically shared with.
- Public: The object is visible to all users who have that component enabled in their role permissions. Users with the additional Edit Public [Object] role permissions can also modify these custom objects.
Per-object roles
-
Owner: The person who created the object. Every object has an assigned Owner responsible for managing its lifecycle and access. Owners have full control, including the ability to edit content, delete the object, and, depending on tenant-level settings, share the object with other principals (users, user groups, or API keys) as an Editor or Viewer. For more information, on tenant-level settings, see Step 1: Configure tenant-level access settings.
Note
Only the Owner or an Administrator can delete a custom object.
- Editor: Can view and modify the object. They can also manage access for others if permitted by tenant settings.
- Viewer: Can see the definition of the object and its results, such as see the underlying logic of a script or view a dashboard, but cannot make any changes to the configuration or access settings.
-
Administrative access: Account and Instance Administrators have inherent visibility into all objects (including Restricted ones) regardless of whether they have been explicitly shared with them. They can also Change Owner for any object.
Important
While Per-object access controls the visibility of the object (such as a dashboard or saved query), the underlying data remains governed by Scope-Based Access Control (SBAC). A user must have the appropriate SBAC permissions to view the data available through an object.
API enforcement
Public APIs for functional objects strictly enforce these object-level permissions. To interact with a Restricted object via the API (such as using GET, INSERT, or DELETE methods), the API Key must be explicitly added to that specific object’s access list with the required Viewer or Editor role.
Sharing icons
The following icons indicate the sharing status and origin of an object in management tables:
 : A Restricted object you created that is not shared with anyone else.
 : An object you created that is currently shared with other users, groups, or API keys.
 : An object created by another user that has been shared with you.
 : A Palo Alto Networks object provided out-of-the-box. These are Public, read-only, cannot be deleted, and ownership cannot be transferred.
How to change an object owner
To ensure continuity when personnel changes occur or to hand off management of an object, the ownership of an object can be changed.
- Administrative privilege: Only Account Admins and Instance Administrators can change the owner of an object. Other users who are Owners and Editors cannot perform this action.
- Change Owner: Using the Change Owner action in the management table of the specific object, administrators can select a new user to take over full control. Once changed, the new user assumes all Owner-level rights, including the ability to edit, delete, and share with other principals (users, user groups, and API keys).
How to configure access to objects?
Configuring access follows a top-down workflow:
- Tenant-level settings: Establish the "rules of engagement" for the entire instance.
- Role permissions: Enable specific components and define additional capabilities for those roles.
- Per-object access: Manage visibility and access levels for specific dashboards and queries and queries.
- Scope-Based Access Control (SBAC): Ensure the user has the required permissions to view the underlying data available through the object.
Step 1: Configure tenant-level access settings
Administrators first establish the "rules of engagement" for all objects. These settings are located under Settings → Configurations → Access Management → Objects:
- Owners can Share objects they created: Allows the creator (Owner) of an object to share it with users, user groups, or API keys. When enabled, the Share option is available in object menus. When disabled, this is replaced with the Manage Access option.
- Editors can also Share objects with others: Allows users with Editor access to further share the object with additional principals (users, user groups, and API keys).
- Owners and editors can change the general access (default): Allows the object owner and any user with Editor access to modify the object's General access settings (Restricted or Public) using the drop-down menu in the object's sharing settings. When disabled, only an administrator can change this state.
Step 2: Set role permissions
Once tenant-level policies are established, configure individual roles to allow users to interact with specific components. Role permissions for objects have transitioned from the legacy "None/View/View-Edit" model to a granular "Disabled/Enabled" model. To configure these:
- Select Settings → Configurations → Access Management → Roles.
- Right-click the relevant user role, and select Edit Role.
- Under Components, expand each list, set the applicable component (such as Dashboards & Reports → Dashboards) to one of the following:
- Disabled: The component is hidden from the user's navigation menu. The user cannot access any objects associated with this component, even if they were previously shared with them.
- Enabled: The component is visible in the user's navigation menu. The user can view Public objects and any Restricted objects shared with them.
-
Define additional capabilities.
If enabled, refine capabilities using the following checkboxes:
- Create [Object]: Allows the user to create new instances; the user is automatically designated as the Owner of the newly created object, which grants the inherent right to edit, delete, and manage sharing for that specific object.
- Edit Public [Object]: Allows the user to modify custom objects that have been set to Public General access, even if they are not the owner.
- Save the changes.
Once a component is enabled using role permissions, sharing is managed at the individual object level. Owners and authorized editors can share with other principals (users, user groups, or API keys) directly on the object.
Step 3. Configuring per-object access
For more information on managing visibility and access levels for specific custom objects, see the following topics:
- Manage access to dashboards
- Manage access to report templates
- Manage access to playbooks and scripts
- Manage access to saved queries
Step 4. Configure SBAC permissions
For more information on managing user scope so users have the permissions necessary to view the data available through the object, see Manage user scope.
Manage access to custom dashboards
Review the following:
The Dashboard Manager serves as the central repository for your visualizations. By using object-level access, you can ensure that custom (user-defined) dashboards, such as those used for sensitive executive reporting or specialized department views, are only accessible to authorized users and user groups. The permissions assigned to your role, combined with the ownership of specific objects, directly determine the content available to you; you can only access dashboards where you are the Owner, dashboards that have been explicitly shared with you (or your user group), or dashboards marked as Public.
Prerequisite
-
Configure tenant-level settings: An administrator must first establish the sharing framework under Settings → Configurations → Access Management → Objects.
The configuration of these settings defines the authorized sharing workflows for for all custom objects, including dashboards:
- Enable "Owners can Share objects they created": Grants owners the ability to share dashboards with specific users and user groups. In the Dashboard Manager, this enables the Share option.
- Disable "Owners can Share objects they created": Restricts owners to managing only General access (Public vs. Restricted). In the Dashboard Manager, this replaces the Share option with the Manage Access option.
For more information on configuring tenant-level settings, see Manage access to objects.
-
Define Scope-Based Access Control (SBAC): While object-level sharing grants access to the dashboard's layout and configuration, users must also have the appropriate SBAC permissions to view the actual data populated within the widgets. If a user has access to a shared dashboard but lacks the required data scope for the underlying datasets, the dashboard will load, but the widgets may appear empty or display an error. For more information on defining SBAC, see Manage user scope.
Understanding dashboard behavior
Because dashboards are composed of multiple visualization elements, it is important to understand how access is applied:
- Dashboard vs. Widget access: Access to a dashboard is managed through the Dashboard Manager. When you share a dashboard, you can also manage access for any Custom Widgets contained within it.
- System Widgets: Standard system widgets provided by Cortex XSIAM remain Public and accessible to all users by default; their access cannot be restricted.
Understanding widget behavior
Because dashboards are composed of multiple widgets, it is important to understand how access is applied to these individual components:
- Widgets are not objects: Unlike dashboards, individual widgets are not treated as independent objects. They do not have their own "Share" dialog and cannot be shared independently. Within the Widget Library, a widget is set to either Restricted (visible only to the creator) or Public (visible to all with Widget Library access).
- Inherited access: Any user who has been granted access to a custom dashboard (as a Viewer or Editor) can see all the widgets contained within that dashboard, including those marked as Restricted. This means you may see a widget on a shared dashboard that you cannot see in the Widget Library even if you have access to it.
- Dashboard Editors: Can edit the dashboard layout, but the widget is only available in their Widget Library for editing when the widget is Public.
- Dashboard Viewers: Can't make any changes to dashboards or widgets that are Restricted.
Change owner of a dashboard
To ensure continuity when personnel changes occur or to hand off management of a resource, only administrators can change the ownership of a custom dashboard.
Note
Only Account Admins and Instance Administrators have the authority to change the owner of an object.
- Select Dashboards & Reports → Dashboard Manager.
- Right-click the custom dashboard in the table and select Change owner.
- Select the new owner from the list of users, and click Change.
How to configure access to custom dashboards
Step 1: Set role-level permissions
Role permissions define the functional capabilities for dashboards and the Widget Library, and determine what actions a user can take.
- Select Settings → Configurations → Access Management → Roles.
- Right-click the relevant user role, and select Edit Role.
- Under Components, expand Dashboards & Reports, and locate Dashboards.
- Configure access state:
- Disabled: Users cannot navigate to Dashboards & Reports → Dashboard Manager or Dashboards & Reports → Widget Library. Dashboards cannot be shared with this role. If the user previously owned or had access to shared dashboards, they are no longer available.
- Enabled: Allows dashboards to be accessed and managed according to defined sub-permissions. Grants access to the Widget Library as explained below in Manage the Widget Library.
- If Enabled, assign specific capabilities to control the UI:
- Create Dashboards: Enables the New Dashboard button on the Dashboard Manager page, allowing the user to create new custom dashboard objects. The user who performs this action becomes the Owner of the object and is granted the inherent right to edit, delete, and manage sharing for that specific object..
- Edit Public Dashboards: Allows the user to modify custom dashboards set to Public, even if they are not the owner.
- Click Save.
Step 2: Manage the widget library
The Widget Library is the central repository for predefined and custom widgets and is intended for browsing and selecting widgets to add to a dashboard. Access to and visibility within the Widget Library is determined by role-level permissions and your specific access level to the dashboards where those widgets reside:
- Access to the Widget Library: To access the Widget Library, your role must have the Create Dashboards or Edit Public Dashboards capability. Users who only have "View" permissions for dashboards cannot access the Widget Library.
-
Widget Library visibility: Visibility within the Widget library depends on ownership and inherited dashboard and widget permissions:
- Public and personal widgets: You can always see widgets you created (Restricted) and widgets marked as Public.
- Inherited access via dashboards: If a Restricted widget was created by another user but is part of a dashboard shared with you, you won't see it in the Widget Library and it can't be edited (unless you are an administrator).
Note
If you're designated as an Editor, you can always duplicate the widget and make your changes on the copy.
Step 3: Manage sharing for a custom dashboard
Once a custom dashboard exists in the Dashboard Manager, the Owner (or an authorized Editor) defines who can see or edit it.
- Select Dashboards & Reports → Dashboard Manager.
- Locate the custom dashboard that you want to share in the table.
- Right-click the custom dashboard and select the available access option. The menu option you see depends on your tenant-level settings:
- Share: Use this if your admin enabled sharing. It allows you to grant access to specific users/groups and change the General access (Public/Restricted).
- Manage Access: Use this if sharing is disabled. It is a restricted view that only allows you to toggle the General access between Public and Restricted. You cannot grant access to specific individuals.
- (If sharing is enabled) Search for the User or User Group, and assign the access level: Viewer (read-only) or Editor (can modify and share).
- Set the General access state:
- Restricted: Private to the Owner and the others granted access.
- Public: Visible to all users with the Dashboard component enabled in their role.
- Click Save.
Sharing icons in the Dashboard Manager
The following icons help you identify the security access of your custom dashboards:
- : A Restricted custom dashboard you created that is not shared with anyone else.
- : A custom dashboard you created that is currently shared with other users or user groups.
- : A custom dashboard created by another user that has been shared with you.
- : A standard system dashboard provided by Palo Alto Networks. These are always Public and cannot be deleted or edited, and their ownership cannot be transferred. Yet, you can Duplicate a system dashboard to create a custom version that you can then modify and share.
Manage access to report templates
Review the following:
The Report Templates page serves as the central repository where you can view, create, and modify report templates for your reports. By using object-level access, you can ensure that custom (user-defined) report templates, such as those used for specialized department metrics or sensitive internal audits, are only accessible to authorized users and user groups. Your access is determined by your role permissions combined with report template ownership; you can only interact with report templates where you are the Owner, report templates explicitly shared with you (or your user group), or report templates marked as Public.
Prerequisite
-
Configure tenant-level settings: An administrator must first establish the sharing framework under Settings → Configurations → Access Management → Objects.
The configuration of these settings defines the authorized sharing workflows for all custom objects, including report templates:
- Enable "Owners can Share objects they created": Grants owners the ability to share report templates with specific users, user groups, and API keys. This enables the Share option in the right-click menu for any report template listed on the Report Templates page.
- Disable "Owners can Share objects they created": Restricts owners to managing only General access (Public vs. Restricted). In this case, the Share option is removed from the report template menu on the Report Templates page and is replaced with the Manage Access option.
-
Define Scope-Based Access Control (SBAC): While per-object access controls the visibility of the report template itself, the underlying data in generated reports remains governed by SBAC. The scope of a generated report is based on the scope of the user who last saved the report template. Ensure the report template creator or last editor has the appropriate data permissions to provide intended results for all report recipients. For more information on defining SBAC, see Manage user scope.
Understanding report behavior
Because report templates are used to generate static report instances, it is important to understand how access is applied:
- Generated reports is the same as report template access: A user can access specific report instances generated from a report template to which they have at least Viewer access. Access to report instances is the same as the access to the report template used to generate them; if a user is granted access to a report template, they gain access also to all reports previously generated from it. Conversely, if access to the report template is removed, the user immediately loses access to those reports.
- Data scoping: Data in reports is generated based on the scope of the user who last saved the template. If an Owner leaves the organization, an Administrator must Change Owner to ensure reports continue to generate data correctly based on an active user's scope.
- Inherited widget access: Reports can include both Public and Restricted widgets. When a widget is added to a report template, the resulting generated report will display the data from that widget to all authorized report recipients, even if they cannot see that specific widget in their own Widget Library.
Change owner of a report template
To ensure continuity when personnel changes occur or to hand off management of a resource, administrators can change the ownership of custom report template objects.
Note
Only Account Admins and Instance Administrators have the authority to change the owner of an object.
When changing ownership, keep the following in mind:
- Principals: Ownership can only be transferred to an individual User. You cannot assign a User Group or an API Key as the Owner of a report template.
- Schedules: When ownership is transferred, any existing report schedules associated with the report template are automatically removed. The administrator performing the transfer will see a confirmation message, and the new Owner will receive a notification in the Notification Center. The new Owner must manually redefine the schedule to resume automated report generation.
- Select Dashboards & Reports → Report Templates.
- Right-click the custom report template in the table and select Change owner.
- Select the new owner from the list of users, and click Change.
How to configure access to report templates
Step 1: Set role-level permissions
Role permissions define the functional capabilities for report templates and determine what actions a user can take.
- Select Settings → Configurations → Access Management → Roles.
- Right-click the relevant user role, and select Edit Role.
- Under Components, expand Dashboards & Reports, and locate Reports.
- Configure access state:
- Disabled: Users cannot navigate to the Report Templates or Reports pages. Report templates cannot be shared with this role.
- Enabled: Allows report templates to be accessed and managed according to defined sub-permissions.
- If Enabled, assign specific capabilities:
- Create Reports: Enables the New Template button, allowing the user to create new custom report templates. The user who creates the report template is designated as the Owner.
- Edit Public Reports: Allows the user to modify custom report templates set to Public, even if they are not the Owner.
- Click Save.
Step 2: Manage sharing for a report template
Once a custom report template exists, the Owner (or an authorized Editor) defines its visibility.
- Select Dashboards & Reports → Report Templates.
- Locate the custom report template you want to share in the table.
- Right-click the custom report template and select the available access option. The menu option you see depends on your tenant-level settings:
- Share: Use this if your admin enabled sharing. It allows you to grant access to specific users/groups and change the General access (Public/Restricted).
- Manage Access: Use this if sharing is disabled. It is a restricted view that only allows you to toggle the General access between Public and Restricted. You cannot grant access to specific individuals.
- (If sharing is enabled) Search for the User, User Group, or API Key and assign the access level: Viewer (read-only) or Editor (can modify and share).
- Set the General access state:
- Restricted (default): Private to the Owner and specifically invited principals.
- Public: Visible to all users who have the Reports component enabled in their role.
- Click Save.
Sharing icons for report templates
The following icons help you identify the security access of report templates in the table on the Report Templates page:
- : A Restricted report template you created that is not shared with anyone else.
- : A report template you created that is currently shared with other users, user groups, or API keys.
- : A report template created by another user that has been shared with you.
- : A standard system report template provided by Palo Alto Networks. These are always Public, read-only, and cannot be deleted or edited, and their ownership cannot be transferred. Yet, you can Duplicate a system report template to create a custom version that you can then modify and share.
Import and export report templates
You can move report templates between different Cortex XSIAM tenants using the import and export functionality. Access and ownership are handled as follows during this process:
- Export: To export a report template, you must have at least Viewer access to that report template. The exported file contains the configuration of the report template but does not include the original access list or ownership data.
- Import: When you import a report template into a tenant:
- New report template: If the report template does not already exist in the tenant, you are automatically designated as the Owner.
- Default access: The report template is created with Restricted General access by default, regardless of its setting in the original tenant.
- Existing report template: If the report template already exists in the system, the imported template will be updated (overwriting the template definition), but the current Owner and access configuration remain unchanged.
- New report template: If the report template does not already exist in the tenant, you are automatically designated as the Owner.
Manage access to playbooks and scripts
Review the following:
The Playbooks and Scripts pages serve as the central repositories where you can view, create, and modify automation logic for your environment. By using object-level access, you can ensure that custom (user-defined) playbooks and scripts, such as those used for sensitive remediation or specialized third-party integrations, are only accessible to authorized users and user groups. Your access is determined by your role permissions combined with object ownership; you can only interact with playbooks and scripts where you are the Owner, those explicitly shared with you (or your user group), or those marked as Public.
Prerequisite
-
Configure tenant-level settings: An administrator must first establish the sharing framework under Settings → Configurations → Access Management → Objects.
The configuration of these settings defines the authorized sharing workflows for all custom objects, including report templates:
- Enable "Owners can Share objects they created": Grants owners the ability to share playbooks and scripts with specific users, user groups, and API keys. This enables the Share option in the right-click menu for any playbook listed on the on the Playbooks page or any script listed on the Scripts page.
- Disable "Owners can Share objects they created": Restricts owners to managing only General access (Public vs. Restricted). In this case, the Share option is removed from the playbook menu on the Playbooks page or from the script menu on the Scripts page, and replaced with the Manage Access option.
For more information on configuring tenant-level settings, see Manage access to objects.
-
Define Scope-Based Access Control (SBAC): While per-object access controls the visibility of the playbook or script itself, the actions performed during execution depend on the trigger method:
- Manual execution: Actions are governed by the permissions and scope of the user who explicitly runs the playbook or script, as well as the defined scope of the involved integrations.
- Automated execution: Actions performed by automation rules or jobs are executed as "system" and are governed by the defined scope and permissions of the involved integrations, regardless of the configured access of the user who created or modified the rule or job. As such, they should be carefully crafted such that they will affect only the intended data.
For more information on defining SBAC, see Manage user scope.
Automation objects
Automation objects in Cortex XSIAM are categorized by their origin, which dictates how access is managed:
- Custom objects: Any playbook or script created by a user, whether through a new build, duplicating an existing object, or importing a file, is a custom object. Ownership and granular "access" described in this section apply only to these custom objects.
- Out-of-the-box (OOTB) objects: These are playbooks and scripts are either included by default in Cortex XSIAM, installed via Marketplace, or added using the
cortex-sdk. OOTB playbooks and scripts are Public and Read-Only to all users with appropriate role permissions. In the context of the broader object management framework, OOTB objects are referred to as system objects.
Understanding access to playbooks and scripts
As playbooks and scripts are utilized across various platform interfaces, it is important to understand how access permissions are applied:
- Playbook Editor: You can only open and modify the logic of playbooks or scripts where you are the Owner or have been granted Editor access. For all other shared playbooks, you have a read-only view.
- Task Library visibility: The Task Library displays tasks that call playbooks or scripts you have access to. If you do not have at least Viewer access to a playbook or script, the tasks that reference them will not appear in your library.
- Access to sub-playbooks: Sharing a parent playbook does not grant access to the sub-playbooks or scripts used within it. While the automation logic remains intact and will execute successfully regardless of a user's permissions, collaborators must be granted explicit access to the individual sub-playbooks or scripts to view or edit their underlying definitions.
- Detaching Marketplace content: When a user detaches a system playbook or script, it becomes a custom object. The user become its Owner, and the object is Restricted.
-
Selecting and running automations: Across all the places in Cortex XSIAM where you can select a playbook or script, the list of available automations is filtered. You can only select playbooks or scripts to which you have the required per-object access.
Note
Any playbook can still be triggered and executed via the CLI, even if the user does not have explicit access to it, using the following methods:
- Invoking the playbook in the Automation Playground utilizing the
!command. - Utilizing the
setPlaybookcommand within the War Room by manually entering the exact playbook name as a string.
- Invoking the playbook in the Automation Playground utilizing the
- Automation rules management: All automation rules are visible to users with the appropriate role permissions. Yet, managing these rules (creating or editing them) is restricted: you can only select or configure a rule to use a playbook if you have at least Viewer access to that specific playbook.
- Job scheduling: When a user creates a job, they can select any playbook to which they have at least Viewer access. Yet, once a job is executed, the playbook runs as "system" governed by the defined scope and permissions of the involved integrations, regardless of the configured scope or object-level access of the user who created or modified the job.
- Export bundles (JSON/ZIP): To export a custom content bundle, the user role must have Integrations (under Configurations → Data Collection) set to View. Additionally, Scripts and Playbooks (under Investigation & Response → Automations) set to Enabled. A user can only export the playbooks and scripts to which they have access.
- Import bundles (JSON/ZIP): To import a bundle, the user role must have Integrations (under Configurations → Data Collection) set to View/Edit. Additionally, Scripts and Playbooks (under Investigation & Response → Automations) set to Enabled (with the Edit Public sub-permission selected for both).
- Importing new objects: When a playbook or script is imported that does not already exist in the environment, the user performing the import is designated as the new Owner, and the playbook or script state defaults to Restricted.
- Importing existing objects: If the playbook or script already exists in the environment, only content the user is authorized to access will be updated. The import preserves existing ownership. Only the playbooks and scripts the user has access to are imported.
- Credential dependencies in Automation: The ability to execute a playbook or script is independent of the ability to access the secrets it uses. If a playbook or script relies on the user's context to fetch a credential, such as for authenticating against a third-party tool like Jira or Active Directory, the execution will fail if the user's role has the Credentials permission set to None. In this state, users are prohibited from passing secrets to scripts or external vaults.
Change owner of a playbook or script
To ensure continuity when personnel changes occur, administrators can change the ownership of custom playbooks and scripts, or assign an Owner if the playbook or script doesn't have one.
- Select Investigation & Response → Automation → Playbooks or Investigation & Response → Automation → Scripts.
- Right-click the custom playbook or script in the table and select Change owner.
- Select the new owner from the list of users, and click Change.
Remote Repositories (Push/Pull)
When utilizing remote repositories for content management, access to synchronization actions is governed by a combination of role-level capabilities and object-level visibility:
- Push: Initiating a push synchronizes all custom content (user-defined playbooks and scripts) in the tenant to the remote repository, regardless of the object-level access permissions of the user who initiated the action.
-
Pull: When pulling content from a remote repository, Cortex XSIAM handles ownership differently depending on whether the content is new or already exists in the environment:
- Existing playbooks and scripts: If an object already exists in the target environment, the content is updated, but the current ownership and access configuration remain unchanged.
- New content owner: For playbooks and scripts that do not yet exist in the environment, the assignment of the Owner depends on the settings in the Remote Repository Settings.
- Keep the original owner: Select this when the user managing access is the same in both tenants. This user is designated as the Owner in the production tenant. Recommended option when the same users exist in both the pushing tenant and the pulling one.
- Owner is the user pulling content into the production tenant (default): Select this when users pulling content should also manage their access. The user who manually triggers the pull action is designated as the Owner.
- Assign new content to this user: Select this when a specific user is responsible for managing access to new content. An administrator specifies a specific user as the Owner of all playbooks and scripts included in the pull.
Note
In a production (pull) tenant, be aware of the following:
- Users cannot be granted Editor permissions.
- Any existing Editor permissions (set before the tenant was configured for remote repository synchronization) are effectively treated as Viewer access.
Automation execution and response
The ability to view the execution of a playbook is independent to the access of playbooks and scripts being called during execution. All playbook tasks, including those of sub-playbooks and scripts to which the user does not have access, will be visible to the user in both the War Room and the Issue Work Plan.
How to configure access to playbooks and scripts
Task 1. Set role-level permissions
Role permissions define the functional capabilities for automations and determine what actions a user can take.
- Select Settings → Configurations → Access Management → Roles.
- Right-click the relevant user role, and select Edit Role.
- Under Components, expand Investigation & Response, and under Automations, locate Playbooks or Scripts.
-
Configure the access state:
- Disabled: Users cannot navigate to the Playbooks or Scripts pages. Playbooks or scripts cannot be shared with this role.
- Enabled: Allows automations to be accessed and managed according to defined sub-permissions.
Note
Playbooks can only be Enabled when Scripts are Enabled first.
-
If Enabled, assign specific capabilities:
- For playbooks:
- Create Playbooks: Enables all methods for adding playbooks to Cortex XSIAM. This includes the Build New Playbook button, as well as the ability to Duplicate or Detach playbooks. The user who performs these actions is automatically designated as the Owner.
- Edit Public Playbooks: Allows the user to modify custom playbooks set to Public, even if they are not the Owner. Additionally, this permission is required to Detach a system playbook and is necessary for users to set or to modify the settings, such as input and output parameters, for tasks that point to system playbooks.
- For scripts:
- Create Scripts: Enables all methods for adding scripts to Cortex XSIAM. This includes the New Script button, as well as the ability to Duplicate or Detach scripts. The user who performs these actions is automatically designated as the Owner.
- Edit Public Scripts: Allows the user to modify custom scripts set to Public, even if they are not the Owner.
Note
- To detach a playbook or script, a user must have both the Create and the Edit Public sub-permissions assigned to their role.
- Reattaching an existing automation to a Marketplace content pack can be performed by the playbook or script Owner or an Administrator.
- For playbooks:
- Click Save.
Task 2. Manage sharing for a playbook or script
Once a custom playbook or script exists, the Owner (or an authorized Editor) defines its visibility.
- Select Investigation & Response → Automation → Playbooks or Investigation & Response → Automation → Scripts.
- Locate the custom playbook or script you want to share in the table.
- Right-click the custom playbook or script and select the available access option. The menu option you see depends on your tenant-level settings:
- Share: Use this if your admin enabled sharing. It allows you to grant access to specific users/groups and change the General access (Public/Restricted).
- Manage Access: Use this if sharing is disabled. It is a restricted view that only allows you to toggle the General access between Public and Restricted. You cannot grant access to specific individuals.
- (If sharing is enabled) Search for the User, User Group, or API Key and assign the access level: Viewer (read-only) or Editor (can modify and share).
- Set the General access state:
- Restricted (default): Private to the Owner and specifically invited principals.
- Public: Visible to all users who have the Playbooks or Scripts component enabled in their role.
- Click Save.
Manage access to saved queries
Review the following:
The Query Library serves as the central repository for your team's investigation logic. By using object-level access, you can ensure that specific Cortex Query Language (XQL) queries, such as those used for sensitive internal investigations or executive reporting, are only accessible to authorized users, user groups, and API keys.
Prerequisite
Configure tenant-level settings: An administrator must first establish the sharing framework under Settings → Configurations → Access Management → Objects.
The configuration of these settings defines the authorized sharing workflows for saved queries in the Query Library, including the options that appear to users when clicking the three dot, vertical ellipsis (⋮) for a query in the Query Library:
- Enable "Owners can Share objects they created": Grants owners the ability to share saved queries with specific users, user groups, and API keys to the query's access list. In the Query Library, this enables the Share option.
- Disable "Owners can Share objects they created": Restricts owners to managing only General access (Public vs. Restricted). In the Query Library, this replaces the Share option with the Manage Access option.
For more information on these tenant-level configurations, see Manage access to objects.
How access impacts the Query Builder
The permissions assigned to your role, combined with the ownership of specific objects, directly change the tools available to you while working in the Query Builder:
- Restricted versus Public visibility: Your Query Library view is personalized. You will only see queries where you are the Owner, queries that have been explicitly shared with you (or your user group or API key), or queries marked as Public.
- Context-sensitive functionality: The permissions assigned to your role, combined with the ownership of specific objects, directly change the tools available to you while working in the Query Builder and the Query Library. UI elements like the Save as menu or the Share action only appear if you have the required functional capabilities.
How to configure access to saved queries
Setting up access involves a two-part process: enabling the user interface (UI) elements in the role settings, and then defining the audience for individual saved query objects.
Step 1: Define role capabilities
Role-level permissions act as the "master switch" for Query Builder functionality and determine what actions a user can take.
- Select Settings → Configurations → Access Management → Roles.
- Right-click the relevant user role, and select Edit Role.
- Under Components, expand Investigation & Response.
- Ensure Query Library is set to Enabled.
-
Define functional capabilities to control the UI:
- Create Queries: Selecting this enables the Save as drop-down menu in the Query Builder. This allows users to select Save as → Query to Library or Save as → Widget to Library. The user who performs this action becomes the Owner of the object and is granted the inherent right to edit, delete, and manage sharing for that specific object..
-
Edit Public Queries: This allows a user to modify queries marked as Public by others.
Note
If the role of a user is set to Edit Public Queries but not Create Queries, they can update existing public queries, but the Save as drop-down menu will be hidden, preventing them from creating new Query Library entries.
Keep in mind the following:
- If a custom query does not have an assigned Owner, an Administrator can use the Change Owner action to assign one.
Step 2: Manage sharing for a specific query
Once a query exists in the Query Library, the Owner (or an authorized Editor) can define who has permission to view (and run) or edit it.
- Select Investigation & Response → Search → Query Builder → XQL.
- Under the Query Library tab, locate the query that you want to share in the table.
- Click the three dot, vertical ellipsis (⋮) and select the available action:
- Share: This option appears when Owners can Share objects they created is enabled in tenant-level settings. It allows you to manage both General access and specific principals (users, user groups, and API keys).
- Manage Access: This option appears when Owners can Share objects they created is disabled. It only allows you to change the General access state.
- (If sharing is enabled) To share with specific entities (for Restricted queries):
- Search for the User, User Group, or API Key.
- Assign the access level: Viewer (can run/view) or Editor (can modify and, if permitted by tenant-level settings, share).
-
Set the General access drop-down menu (if authorized by tenant-level settings):
- Restricted: The query is private. It is only visible to the Owner and the specific principals added to the list.
- Public: The query is visible to every user who has the Query Library enabled in their role.
Note
When the tenant-level setting Owners and editors can change the general access is unselected, the drop-down is disabled and only an administrator can configure this option.
- Click Save.
Sharing icons in the Query Library
The following icons in the Query Library table help you identify the security access of your queries:
- : A Restricted query you created that is not shared with anyone else.
- : A query you created that is currently shared with other users, user groups, or API keys.
- : A query created by another user that has been shared with you.
- : A standard system query provided by Palo Alto Networks. These are always Public and can't be deleted, or have their ownership transferred.
Dashboards and reports
Dashboards consist of visualized data powered by fully customizable widgets, which enable you to analyze data from inside or outside Cortex XSIAM, in different formats such as graphs, pie charts, or text. Cortex XSIAM displays the predefined dashboards when you log in. You can also create custom dashboards that are based on the predefined dashboards, or built to your specifications, and you can save any of your dashboards as reports.
Cortex XSIAM also provides Command Center dashboards that display interactive overviews of your system activity, with drilldowns to additional dashboards and associated pages.
From the Dashboard & Reports menu, you can view and manage your dashboards and reports from the dashboard and incidents table, and view alert exclusions.
- Dashboard: Provides dashboards that you can use to view high-level statistics about your agents and incidents.
- Reports: View all the reports that Cortex XSIAM administrators have run.
- Customize: Create and manage a new dashboard and reports.
- Dashboards Manager: Add new dashboards with customized widgets to surface the statistics that matter to you most.
- Reports Templates: Build reports using pre-defined templates, or customize a report. Reports can be generated on-demand scheduled.
- Widget Library: Search, view, edit, and create widgets based on predefined widgets and user-created custom widgets.
Configure server settings
You can configure server settings such as keyboard shortcuts, timezone, timestamp format, and custom logos for communications task emails to create a more personalized user experience in Cortex XSIAM. Go to Settings → Configurations → General → Server Settings.
Note
Keyboard shortcuts, timezone, and timestamp format are not set universally and only apply to the user who sets them.
| Server Setting | Description |
|---|---|
| Keyboard Shortcuts | Enables you to change the default shortcut settings. The shortcut value must be a keyboard letter, A through Z, and cannot be the same for both shortcuts. |
| Timezone | Select a specific timezone. The timezone affects the timestamps displayed in Cortex XSIAM, auditing logs and when exporting files. |
| Timestamp Format | <p>The format in which to display Cortex XSIAM data. The format affects the timestamps displayed in Cortex XSIAM, auditing logs and when exporting files. This setting is configured per user and not per tenant.</p> |
| Email Contacts | A list of email addresses Cortex XSIAM can be used as a distribution list. The defined email addresses are used to send product maintenance, updates, and new version notifications. These addresses are in addition to the email addresses registered with your Customer Support Portal account. |
| Custom Logo | <p>By default, the Cortex XSIAM logo displays on communication task emails. You can replace the default logo with a custom logo to match your organization's branding. Supported file formats are PNG, JPEG, SVG, and GIF. The minimum recommended image dimensions are 50px height and 50px width. The recommended maximum file size is 100 KB.</p> |
| AI Configuration | <ul><li>Enable or disable the Cortex Agentic Assistant (Agents & LLM Experience).</li><li>Enable or disable AI case summarization capabilities.</li></ul><p>Note:</p><ul><li>The Cortex Agentic Assistant and AI case summarization are currently available for users in limited regions. For more information, see Agentic AI in Cortex XSIAM.</li><li>For multi-tenant/MSSP environments, the Cortex Agentic Assistant and AI case summarization are not available in the main tenant.</li></ul> |
| Password Protection (for downloaded files) | <p>Enable password protection when downloading retrieved files from an endpoint. This prevents users from opening potentially malicious files. Administrator permissions required.</p><p>Note: If the Password Protection (for downloaded files) setting under Settings → Configuration → General → Server Settings is enabled, enter the password 'suspicious' to download the file.</p> |
| Google Maps Key | Enter the Google Maps API key to display the physical location of an entity on a Google map. |
| Scope-Based Access Control (SBAC) | <p>Enforces granular scoping on users with a scoping configuration. A user can inherit scoping configurations from a user group, or have the scoping configuration applied directly on top of the role assigned from either a user group or a generated API Key. By default, Enable Scope Based Access Control is disabled and granular scoping is not enforced. Before enabling SBAC, we recommend that an administrator or a user with Access Management permissions first ensure that the users, user groups, and API Keys defined in Cortex XSIAM are granted the required access by assigning the relevant scopes. For more information, see Manage user scope. (Optional) If enabled, you can select the Endpoint Scoping Mode, which is defined per tenant:</p><ul><li>Permissive: Enables users with at least one scope tag to access the relevant entity with that same tag.</li><li>Restrictive: Users must have all the scoped tags that are tagged within the relevant entity of the system.</li></ul> |
| Ingestion Evaluation Mode | Estimates your data sizing requirements for licensing purposes. When enabled, the system accepts, processes, and parses all your data to calculate ingestion metrics and populate the Ingestion and NGFW Ingestion Dashboards. |
| Data Ingestion Monitoring (Beta) | <p>Data ingestion health monitors the availability and overall health of data collection. When enabled, Cortex XSIAM creates the following types of alerts:</p><ul><li>Ingestion health alerts: Based on the data ingestion metrics and indicate disruptions in data collection</li><li>Collection health alerts: Based on error statuses in collection integrations and indicate that a collector is not connected</li></ul><p>If you disable data ingestion monitoring, Cortex XSIAM continues to collect metrics, but alerts are not created. Related information</p><ul><li>Use data ingestion health metrics in Cortex Query Language queries and to create correlation rules with your data ingestion logic. For more information, see Monitor data ingestion health.</li><li>View all health alerts on the Health Alerts page. For more information, see About health issues.</li></ul> |
| XQL Configuration | <p>Enables setting case sensitivity across Cortex XSIAM. By default, this setting is set to false and field values are evaluated as case insensitive.This setting overwrites any other default configuration except for BIOCs, which will remain case-insensitive no matter what this configuration is set to.</p> |
| Define the cases target MTTR per issue severity | <p>Determines within how many days and hours you want issues resolved according to the issue severity Critical, High, Medium, and Low. The defined MTTR is used to display the Resolved Issue MTTR dashboard widgets.</p> |
| Impersonation Role | <p>The type of role permissions granted to the Palo Alto Networks Support team when opening support tickets. We recommend that role permissions be granted only for a specific time frame, and full administrative permissions be granted only when specifically requested by the Support team. Role permissions include:</p><ul><li>Read-only: Default setting; grants read-only access to your tenant.</li><li>Support-related actions: Grants permissions to tech support file collection, dump file collection, investigation query, correlation rule, BIOC and IOC rule editing, alert starring, exclusion, and exception editing</li><li>Full role permissions: No limitations are applied; grants full permissions to all actions and content on your tenant</li></ul><p>Permission Reset Timeframe: Determines how long role permissions are valid.</p> |
| Custom Content | <ul><li>Export all custom content: Exports custom content, such as playbooks and scripts as a content bundle, which you can import to another Cortex XSIAM tenant.</li><li>Upload custom content: Imports custom content created from another Cortex XSIAM tenant.</li></ul> |
| Case display modes | Allow users the access the Cases page in legacy mode. |
| Caching | <p>Improve performance on the Cases and Issues pages by enabling a temporary data cache.</p><p>Note: In MSSP environments, this option is not available on the parent tenant.</p> |
| Issues | Create timer fields that display in the issues table and issue layouts. For more information, see Configure issue timer fields. |
| Indicators | <p>Note: Requires the TIM add-on.</p><p>By default, system-wide automatic indicator extraction and enrichment is disabled. However, if you migrated from Cortex XSIAM 2.x to Cortex XSIAM 3.x, system-wide automatic indicator extraction and enrichment is enabled.</p><p>If you have the TIM add-on, you can enable or disable system-wide automatic indicator extraction and enrichment from issues.</p> |
| Unified Case View | <p>Note: Requires an MSSP License and RBAC permissions to Cases & Issues and Investigation & Response → Automation. This setting is available for the parent tenant only.</p><p>Enable the Unified Case View to see a consolidated view of all cases across your distributed environment and perform actions on child tenants.</p><p>If this setting is disabled, the Cases page displays a single tenant at a time with a drop down list to move between tenants in read-only mode.</p><p>For more information, see Unified case view.</p> |
Configure security settings
You can configure security settings such as how long users can be logged in Cortex XSIAM, and from which domains and IP ranges users can log in.
Go to Settings → Configurations → General → Security Settings.
| Settings | Options | Description |
|---|---|---|
| Session Expiration | User Login Expiration | The number of hours (between 1 and 24) after which the user's login session expires. You can also choose to automatically log users out after a specified period of inactivity. |
| Dashboard Expiration | <p>Whether the Dashboard page expires at the same time as the user login session or after seven days. This is useful when you view a dashboard on a separate screen.</p><p>For example, if you select seven days for dashboards and eight hours for login expiration, and you are currently viewing the Dashboard page, the dashboard expiration takes priority (seven days). This ensures that the Dashboard page continues to display the widgets for an extended period.</p> | |
| Allowed Sessions | Approved Domains | The domains from which you want to allow user access (login) to Cortex XSIAM. You can add or remove domains as necessary. |
| Approved IP Ranges | The IP ranges from which you want to allow user access (login) to Cortex XSIAM. You can also choose to limit API access from specific IP addresses. | |
| User Expiration | Deactivate Inactive User | Deactivate an inactive user, and also set the user deactivation trigger period. By default, user expiration is disabled. When enabled, enter the number of days after which inactive users should be deactivated. |
| Same-Site Cookie Policy | <ul><li>Strict</li><li>Lax</li></ul> | <p>Configure your Cortex tenant's SameSite cookie security policy by selecting between two settings to control how users log in from external links:</p><ul><li>Strict (Recommended): Requires users to reauthenticate when clicking a link from another site, even if they are already signed in.</li><li>Lax: Offers a more seamless experience by allowing users to access the tenant directly from external links without needing to log in again. Yet, we advise against this setting for security reasons.</li></ul> |
| Allowed Domains | Domain Name | The domain names that can be used in your distribution lists for reports. For example, when generating a report, ensure the reports are not sent to email addresses outside your organization. |
Data and log forwarding
To stay informed about important alerts and events, you can configure your notifications and specify the type of data and logs you want to forward. You can forward logs and data to an email account, a Slack channel, or a syslog receiver. In addition, cases and issues can be forwarded to third-party systems including Splunk, Amazon SQS, Amazon S3, and Webhook.
Forward logs and data from Cortex XSIAM to external services
You can forward logs, cases, and issues from Cortex XSIAM to an external service. By forwarding logs and data, you can manage alerts and investigations in external systems and meet data retention requirements. Available services include the following:
- Slack channel and/or syslog receiver: Configure the external application with Cortex XSIAM. After the application is configured, configure notification forwarding, specifying the data/log type you want to forward.
- Email distribution list: Configure notification forwarding, specifying the data/log type you want to forward.
- Splunk, Amazon SQS, Amazon S3, and Webhook: Only cases and issues can be forwarded to these services. The external application must be configured in Cortex XSIAM and egress configured in the Cortex Gateway before forwarding to these services.
The following table shows the log types supported for each notification type:
| Data/log type | Slack | Syslog | Splunk, Amazon SQS, Amazon S3, Webhook | |
|---|---|---|---|---|
| Issues | ✓ | ✓ | ✓ | ✓ |
| Cases | ✓ | ✓ | — | ✓ |
| <p>Agent Audit Logs</p><p>Note: Requires an XDR Agent</p> |
✓ | — | ✓ | — |
| Management Audit Logs | ✓ | — | ✓ | — |
| Health Issues (Deprecated) | ✓ | ✓ | ✓ | — |
Configure external applications for forwarding
Cases, issues, and logs can be forwarded to third-party external services. The external service must be configured in Cortex XSIAM before you set up notification forwarding.
Only cases and issues can be forwarded to Slack, Amazon S3, Amazon SQS, Splunk, and Webhook. Before forwarding cases or issues to Splunk, Amazon S3, Amazon SQS, or Webhook, you need to configure egress in the Cortex Gateway.
You do not need to configure egress for email, Slack, or syslog forwarding. No prior configuration is required to send data or logs to an email distribution list.
Note
You can configure external applications using either of these methods:
- Pre-configuration: Navigate to Settings → Configurations → Integrations → External Applications and follow the setup guide for your specific service:
- In-workflow configuration: Navigate to Settings → Configurations → General → Notifications → Add Forwarding Notifications. Define the configuration and notification scope, then click Add Application and complete the setup steps for your chosen service.
Forward notifications to Amazon SQS
Create the SQS queue
Log in to your AWS Management Console and create a new Standard SQS queue.
NOTE: Use the default AWS SQS message queue depth (256KB) or higher when creating or editing a standard SQS queue.
Configure egress in Cortex Gateway
Before forwarding cases or issues to Amazon SQS, you need to configure egress. Only a user with Account Admin or Instance Admin permissions can configure egress.
To configure egress, to enter the queue name. For example, if the full URL is https://sqs.region.amazonaws.com/account-id/queue-name, enter only queue-name.
- In the Cortex Gateway, go to Permission Management → Egress Configurations → Path.
- Select the account name and tenant.
- In the Flow field, select External storage: AWS SQS.
- Enter the exact <queue_name>. For example,
my-example-queue. Note that the path does not include HTTP or HTTPS. - Add the configuration.
Generate the authorized party ID
- In Cortex XSIAM, go to Settings → Configurations → Integrations → External Applications → Add Application and select Amazon SQS.
- Enter the queue URL from Amazon SQS. Use the URL format rather than the ARN for this specific field.
- Click Verify. If egress has not been configured in the Cortex Gateway, verification will fail and a message will display that the endpoint does not match any approved routes.
- After verification is successful, an authorized party ID is generated. Copy this ID for your AWS configuration.
- Leave this page open to complete the application configuration.
Configure the IAM role and permissions in AWS
Cortex XSIAM needs permission to assume a role in your account.
You can authenticate using either an IAM role or IAM access keys.
- IAM role:
-
In AWS, go to IAM → Roles → Create role, select Custom trust policy, and enter the Trusted Entity JSON, replacing the sub condition with your Authorized party ID. The following is an example:
{ "Version": "2012-10-17", "Statement": [ { "Effect": "Allow", "Principal": { "Federated": "accounts.google.com" }, "Action": "sts:AssumeRoleWithWebIdentity", "Condition": { "StringEquals": { "accounts.google.com:sub": "<Your_Authorized_Party_ID>" } } } ] }
-
Create and attach a policy granting permissions to access your queue ARN. The policy must allow
sqs:ListQueuesandsqs:SendMessage. Verify your resource matches your exact queue ARN. For example:{ "Version": "2012-10-17", "Statement": [ { "Sid": "AllowLogsToSQS", "Effect": "Allow", "Action": [ "sqs:GetQueueAttributes", "sqs:ListQueues", "sqs:SendMessage" ], "Resource": [ "arn:aws:sqs:<region>:<account_id>:<queue_name>" ] } ] }
-
- IAM access keys: Verify the user associated with the access key and secret key has related permissions to accept the data.
Complete external application configuration in Cortex XSIAM
- Go back to Cortex XSIAM and enter the instance name and an optional description.
- Select either IAM Role or IAM Access Keys.
- For IAM role, paste the role ARN (Amazon Resource Name) from the role you created.
- For IAM access keys, enter the access key and secret key.
- Click Test to verify Cortex XSIAM can write a test object, then click Connect.
Configure notification forwarding
Follow the instructions for Configure notification forwarding.
Forward notifications to Amazon S3
Create the S3 Bucket
- Log in to your AWS Management Console.
- Navigate to S3 and click Create bucket.
- Enter a unique bucket name and select the AWS Region. Note the region, as you will need it later.
- Verify Block all public access is turned on for security.
Configure egress in Cortex Gateway
Before forwarding cases or issues to Amazon S3, you need to configure egress. Only a user with Account Admin or Instance Admin permissions can configure egress.
To configure egress, you must enter the bucket name. For example, if the full path is s3://parent-bucket-name/child-bucket/, enter parent-bucket-name.
- In the Cortex Gateway, go to Permission Management → Egress Configurations → Path.
- Select the account name and tenant.
- In the Flow field, select External Storage: AWS S3.
- Enter the exact
<bucket_name>. For example,my-example-bucket. Do not include subfolders. - Add the configuration.
Generate the authorized party ID
- In Cortex XSIAM, go to Settings → Configurations → Integrations → External Applications → Add Application and select Amazon S3.
- Enter the S3 URI.
- Click Verify. If egress has not been configured in the Cortex Gateway, verification will fail, and a message will display that the endpoint does not match any approved routes.
- After verification is successful, an authorized party ID is generated. Copy this ID for your AWS configuration.
- Leave this page open to complete the application configuration after configuring the IAM role and permissions in AWS.
Configure the IAM Role and permissions in AWS
Cortex XSIAM needs permission to assume a role in your account.
-
In AWS, go to IAM → Roles → Create role, select Custom trust policy, and enter the Trusted Entity JSON, replacing the sub condition with your Authorized party ID. The following is an example:
{ "Version": "2012-10-17", "Statement": [ { "Effect": "Allow", "Principal": { "Federated": "accounts.google.com" }, "Action": "sts:AssumeRoleWithWebIdentity", "Condition": { "StringEquals": { "accounts.google.com:sub": "<Your_Authorized_Party_ID>" } } } ] }
-
Create and attach a policy granting permissions.
The policy must allow
s3:PutObjectands3:ListBuckets. Verify the resource matches your exact bucket name, formatted asarn:aws:s3:::your-bucket-name/*. The following is an example:{ "Version": "2012-10-17", "Statement": [ { "Sid": "Statement1", "Effect": "Allow", "Action": [ "s3:PutObject", "s3:ListBuckets" ], "Resource": [ "arn:aws:s3:::<your-bucket-name>/*" ] } ] }
Complete external application configuration in Cortex XSIAM
- Go back to Cortex XSIAM and enter the instance name and an optional description.
- Select IAM Role as the connection method and paste the Role ARN (Amazon Resource Name) from the role you created.
- Enter the AWS region. The region you select must exactly match the bucket's region in AWS.
-
Select the file rollup time to collect data (cases or issues) before sending. The default is one hour. This is the maximum duration the system collects data before writing to a new file in Amazon S3.
Note
The first message is always sent immediately, and the selected rollup time applies to all subsequent data
- Click Test to verify Cortex XSIAM can write a test object, then click Connect.
Configure notification forwarding
Follow the instructions for Configure notification forwarding.
Forward notifications to Splunk
Configure access in your firewall
Add the IP addresses for your tenant region to your firewall. For more information, refer to the list of ingress IPs in Enable access to required PANW resources.
Configure egress in Cortex Gateway
Before forwarding cases or issues to Splunk, you need to configure egress. Only a user with Account Admin or Instance Admin permissions can configure egress.
To configure egress, enter the FQDN (fully qualified domain name), without including the port or the path. For example, if the full URL is https://splunk..mycompany.com:8088/services/collector, you would enter splunk.mycompany.com.
- In the Cortex Gateway, go to Permission Management → Egress Configurations → Path.
- Select the account name and tenant.
- In the Flow field, select Splunk.
- Enter the FQDN (full qualified domain name) of the Splunk instance. For example,
splunk.mycompany.com. Note that the path does not include HTTP or HTTPS. - Add the configuration.
Complete external application configuration in Cortex XSIAM
- Go to Settings → Configurations → Integrations → External Applications → Add Application and select Splunk.
- Enter the Splunk HTTP event collector URL. The URL can include a port, but the connection must be HTTPS.
- Click Verify. If egress has not been configured in the Cortex Gateway, verification will fail.
- After verification is successful, enter the instance name and optional description.
- Enter the authentication token for secure access to your Splunk instance.
- Click Test to verify the connection, then click Connect.
Configure notification forwarding
Follow the instructions for Configure notification forwarding.
Forward notifications to webhook
You can forward issues and cases to a webhook.
Cortex sends webhook notifications using its own predefined payload format. If your webhook endpoint requires the payload to be structured in a specific way — for example, the format expected by Google Chat or another third-party service — the notification will not be delivered successfully. Only endpoints that accept arbitrary JSON payloads are supported.
Configure access in your firewall
Add the IP addresses for your tenant region to your firewall. For more information, refer to the list of ingress IPs in Enable access to required PANW resources.
Configure egress in Cortex Gateway
Before forwarding cases or issues to Splunk, you need to configure egress. Only a user with Account Admin or Instance Admin permissions can configure egress.
To configure egress, enter the FQDN (fully qualified domain name), without including the port or the path. For example, if the full URL is https://webhook..mycompany.com/target_resource, you would enter webhook.mycompany.com.
- In the Cortex Gateway, go to Permission Management → Egress Configurations → Path.
- Select the account name and tenant.
- In the Flow field, select Webhook.
- Enter the FQDN (fully qualified domain name) of the webhook endpoint. For example,
webhook.mycompany.com. Note that the path does not include HTTP or HTTPS. - Add the configuration.
Complete external application configuration in Cortex XSIAM
- Go to Settings → Configurations → Integrations → External Applications → Add Application and select Webhook.
- Enter the webhook URL. The URL can include a port, but the connection must be HTTPS.
- Click Verify. If egress has not been configured in the Cortex Gateway, verification will fail.
- After verification is successful, enter the instance name and optional description.
- Show advanced settings to add HTTPS headers if required.
- Enter the authentication token for secure access to your Splunk instance.
- Click Test to verify the connection, then click Connect.
Configure notification forwarding
Follow the instructions for Configure notification forwarding.
Integrate a syslog receiver
A syslog receiver can be a physical or virtual server, a SaaS solution, or any service that accepts syslog messages.
To send Cortex XSIAM notifications to your syslog receiver, you first need to define the settings for the syslog receiver. After this is complete, you can configure notification forwarding.
Enable access
Before you begin, enable access to the following Cortex XSIAM IP addresses for your region in your firewall.
| Region | Log Forwarding address |
|---|---|
| United States - Americas (US) | 35.232.87.9, 35.224.66.220 |
| United States - Government | 104.198.222.185, 35.239.59.210 |
| Brazil (BR) | 35.247.234.13, 34.39.178.116 |
| Canada (CA) | 35.203.54.204, 35.203.52.255 |
| Region | Log Forwarding IP Addresses |
|---|---|
| Finland (FI) | 34.88.235.28, 34.88.248.229 |
| France (FA) | 34.163.100.253, 34.155.72.149 |
| Germany (DE) | 35.234.95.96, 35.246.192.146 |
| Israel (IL) | 34.165.194.4, 34.165.101.105 |
| Italy (IT) | 34.154.0.173, 34.154.71.94 |
| Netherlands - Europe (EU) | 34.90.202.186, 34.90.105.250 |
| Poland (PL) | 34.118.45.145, 34.118.126.170 |
| Qatar (QT) | 34.18.48.182, 34.18.43.40 |
| Saudi Arabia (SA) | 34.166.50.215, 34.166.55.72 |
| South Africa (ZA) | 34.35.70.253, 34.35.10.167 |
| Spain (ES) | 34.175.83.90, 34.175.230.150 |
| Switzerland (CH) | 34.65.228.95, 34.65.74.83 |
| United Kingdom (UK) | 34.105.227.105, 34.105.149.197 |
| Region | Log Forwarding IP Addresses |
|---|---|
| Australia (AU) | 35.189.38.167, 34.87.219.39 |
| Delhi (DL) | 34.126.223.198, 34.131.110.15 |
| India (IN) | 34.93.247.41, 34.93.183.131 |
| Indonesia (ID) | 34.101.248.99, 34.101.176.232 |
| Japan (JP) | 34.84.88.183, 35.243.76.189 |
| Singapore (SG) | 35.240.192.37, 34.87.125.227 |
| South Korea (KR) | 34.64.198.58, 34.47.86.20 |
| Taiwan (TW) | 35.234.2.208, 35.185.171.91 |
How to send issues or logs to a syslog receiver
- Go to Settings → Configurations → Integrations → External Applications → Add Application and select Syslog.
-
Define the following parameters:
Parameter Description Name Unique name for the server profile. Destination IP address or fully qualified domain name (FQDN) of the syslog receiver. Port Port number to send syslog messages. Facility Select one of the syslog standard values. The value maps to how your syslog server uses the facility field to manage messages. For details on the facility field, see RFC 5424. Protocol <p>Method of communication with the syslog receiver:</p><ul><li>TCP: No validation is made on the connection with the syslog receiver. However, if an error occurred with the domain used to make the connection, the Test connection will fail.</li><li>UDP: No error checking, error correction, or acknowledgment. No validation is done for the connection or when sending data.</li><li>TCP + SSL: Cortex XSIAM validates the syslog receiver certificate and uses the certificate signature and public key to encrypt the data sent over the connection.</li></ul> Certificate <p>The communication between Cortex XSIAM and the syslog destination can use TLS. In this case, upon connection, Cortex XSIAM validates that the syslog receiver has a certificate signed by either a trusted root CA or a self-signed certificate. You may need to merge the Root and Intermediate certificate if you receive a certificate error when using a public certificate.</p><p>If your syslog receiver uses a self-signed CA, upload your self-signed syslog receiver CA. If you only use a trusted root CA leave the certificate field empty.</p><div data-gb-custom-block data-tag="hint" data-style="info" class="hint hint-info"><ul><li>Up to TLS 1.3 is supported.</li><li>Verify the self-signed CA includes your public key.</li></ul></div><p>You can ignore certificate errors. For security reasons, this is not recommended. If you choose this option, data and logs will be forwarded even if the certificate contains errors.</p> -
Test the parameters to ensure a valid connection, and click Connect when ready.
You can define up to five syslog receivers. Upon success, the table displays the syslog servers and their status.
After you integrate with your syslog receiver, configure your forwarding settings. For more information, see Configure notification forwarding.
Syslog receiver test message errors
When configuring a syslog message, Cortex XSIAM sends a test message. If a test message cannot be sent, Cortex XSIAM displays an error message to help you troubleshoot.
The following table includes descriptions and suggested solutions for the error messages:
| Error Message | Description | Suggested Solution |
|---|---|---|
| Host Resolving Failed | The IP address or hostname you provided doesn't exist, or can't be resolved. | Ensure you have the correct IP address or the hostname. |
| Configured Local Address | The IP address or hostname you provided is internal and can't be used. | Ensure you have the correct IP address or the hostname. |
| Wrong Certificate Format | The certificate you uploaded is in an unexpected format and can't be used. The certificate must be an ASCII string or a bytes-like object. | <p>Re-create the certificate in the correct format, for example:</p><p>-----BEGIN CERTIFICATE-----MIIDHTCCAgWgAwIBAgIQSwieRyGdh6BNRQyp406bnTANBgkqhkiG9w0BAQsFADAhMR8wHQYDVQQDExZTVVJTLUNoYXJsaWVBbHBoYS1Sb290MB4XDTIwMDQzMDE4MjEzNFoXDTMwMDQzMDE4MzEzNFowITEfMB0GA1UEAxMWU1VSUy1DaGFybGllQWxwaGEtUm9vdDCCASIwDQYJKoZIhvcNAQEBBQADggEPADCCAQoCggEBAJHH2HR/CzVzm9lOIu6rrtF9opYeIJdtgJR2Le7w4M56lFKIoziAfZD9qR0DqXpAV+42PZC8Oe4ueweD44OKTnaofbOxQvygelvHkFyAj+oz0VppzhmeUXh1Eux96QKB+Q+vSm8FbNlBL2SI8RhceYsWtZe5vBm/zDdV2alO5LJ3rEj9ycG1a7re1wSDQ67NaSrny+C/7IL5utlVspcgjslEiGM7D30uKszpq3CCeV9f7aPHCVZbbFRBxe4cbgZjGvE7Mm1OBbsypMT3z8jmSj7Kz5ui6R8mlqtll5MkIGtvmc1aypJHKrobwcs2ozEmLiVR0F1oJrl+PIZy5MXhBUcCAwEAAaNRME8wCwYDVR0PBAQDAgGGMA8GA1UdEwEB/wQFMAMBAf8wHQYDVR0OBBYEFIJ1ZhG0dkgwF8OOB/eT4u/9yowaMBAGCSsGAQQBgjcVAQQDAgEAMA0GCSqGSIb3DQEBCwUAA4IBAQBvDQ4Epr0zxQHuyziDtlauddVsrLpckljHc+dCIhBvGMzGEj47Cb0c/eNt6tHrPThyzRxOHd9GBMX4AxLccPNuCZdWIRTgb4SYzDspGEYDK7v/N5+FvpYdWRgB4msUXhHt36ivH450XuY8Slt+qbQWNVU2+xIkMSSA3mUwnK+hz1GwO/Zc2JYOaVZUrW39EuzNePJ+O6BlgMRMRPNGzgT+xSxt316r/QnVA2sk4IXshdGGMG0VcuzBCyeuiCRP5/2QeFthas5EoXbdlB5eK3VzqLtiKyua/kS/hPuKahN9mI8FZ4TNB+nd6+eRQs2nsnbVOFmmOYu5KkGnDOjTzRh4-----END CERTIFICATE-----</p> |
| Connection Timed Out | Cortex XSIAM didn’t connect to the syslog receiver in the expected time. This could be because your firewall blocked the connection or because the configuration of the syslog server caused it to drop the connection. | Check the firewall logs and the connection using Wireshark. |
| Connection Refused | The syslog receiver refused the connection. This could be because your firewall blocked the connection or because the configuration of the syslog server caused it to drop the connection. | Check the firewall logs and the connection using Wireshark. |
| Connection Reset | The connection was reset by the syslog receiver. This could be because your firewall blocked the connection or because the configuration of the syslog receiver caused it to drop the connection. | Check the firewall logs and the connection using Wireshark. |
| Certificate Verification Failed | <p>The uploaded certificate couldn’t be verified for one of the following reasons.</p><ul><li>The certificate doesn't correspond to the certificate on the syslog receiver and cannot be validated.</li><li>The certificate doesn’t have the correct hostname.</li><li>You are using a certificate chain and didn’t merge the certificates into one certificate.</li></ul> | <ul><li><p>Incorrect certificate: to check that the certificate you are uploading corresponds to the server syslog certificate, use the following openssl command.</p><p>openssl verify -verbose -CAfile cortex_upload_certificate syslog_certificate</p><p>If the certificate is correct, the result is syslog_certificate: OK.</p></li><li>Incorrect hostname: make sure that the hostname/ip in the certificate matches the syslog server.</li><li><p>Certificate chain: If you are using a list of certificates, merge the chain into one certificate. You can concatenate the certificates using the following cat command in Linux or macOS.</p><p>cat intermediate_cert root_cert > merged_syslog.crt</p><p>If the concatenated certificate doesn’t work, change the order of the root and intermediate certificates, and try again.</p><p>To verify that the chain certificate was saved correctly, use the following OpenSSL command.</p><p>openssl verify -verbose -CAfile cortex_upload_certificate syslog_certificate</p><p>If the certificate is correct, the result is syslog_certificate: OK.</p></li></ul> |
| Connection Terminated Abruptly | The firewall or the syslog receiver dropped the connection unexpectedly. This could be because the firewall on the customer side limits the number of connections, the configuration on the syslog receiver drops the connection, or the network is unstable. | Check the firewall logs and the connection using Wireshark. |
| Host Unreachable | The network configuration is faulty, and the connection can't reach the syslog receiver. | Check the network configuration to make sure everything is configured correctly, like a firewall or a load balancer which may be accidentally directing the connection to a dead server. |
| SSL Error | Unknown SSL error. | To investigate the issue, contact support. |
| Connection Unavailable | General error. | To investigate the issue, contact support. |
Integrate Slack for outbound notifications
Integrate Cortex XSIAM with your Slack workspace to manage and highlight your issues and reports. Creating a Cortex XSIAM Slack channel ensures that defined issues are exposed on laptop and mobile devices using the Slack interface. Unlike email notifications, Slack channels provide dedicated spaces where you can contact specific members regarding your issues.
How to integrate Slack with Cortex XSIAM
- Go to Settings → Configurations → Integrations → External Applications → Add Application and click Slack.
-
Click Ok to go to an external Slack page to install Cortex XSIAM on your Slack workspace.
Note
You are directed to the Slack browser to install Cortex XSIAM. You can only use this link to install Cortex XSIAM on Slack. Attempting to install from Slack Marketplace will redirect you to Cortex XSIAM documentation.
-
Click Submit.
Upon successful installation, Cortex XSIAM displays the workspace to which you connected.
What to do next
After you integrate with your Slack workspace, configure your forwarding settings. For more information, see Configure notification forwarding. To send notifications about failed reports to Slack, see Run or schedule reports.
Configure notification forwarding
After you integrate with an external service such as Slack, a syslog server, Amazon S3, Amazon SQS, Webhook, or Splunk, create a forwarding configuration that specifies the data or log type you want to forward. You can configure notifications for issues, cases, and logs. To send reports to email or Slack, see Run or schedule reports.
Prerequisite
Before you can select an external service for notification forwarding, you must integrate the external service with Cortex XSIAM. For more information, see Configure external applications for forwarding. No prior configuration is required to send data to an email distribution list.
How to configure notifications
- Select Settings → Configurations → General → Notifications → Add Forwarding Configuration.
- Enter a name for the configuration.
-
Select the data or log type you want to forward:
-
Issues: Send notifications for specific issue types.
Note
- Forwarding destinations: Only issues and cases can be forwarded to Slack, Splunk, Amazon SQS, Amazon S3, or Webhook.
- Notification forwarding by domain: To configure notification forwarding for issues by domain, select Issues and filter the Issues table by Issue Domain.
Alert vs. issue format: By default, new configurations use the issue format, but you can select the alert format if needed when forwarding to email, Slack, or a syslog server. You cannot forward issues in the alert format to Splunk, Amazon SQS, Amazon S3, or Webhook.
Existing legacy configurations are not automatically updated and continue to send notifications in the alert format. To use the issue format, edit the existing configuration.
- Agent Audit Logs: Send notifications for audit logs reported by your Cortex XDR agents.
- Management Audit Logs: Send notifications for audit logs about events related to your Cortex XSIAM tenant.
- Cases: Send notifications for specific cases.
Not all data and log types can be sent to all external services. For more information, see Forward logs and data from Cortex XSIAM to external services.
-
- (Optional) Enter a description of the forwarding configuration.
-
Click Next, and under Scope, filter which issues, cases, or logs you want included in a notification.
For example, for a filter set to
Severity = Medium, Category = Configuration, Cortex XSIAM sends the issues or events matching this filter as a notification. - Click Next.
- Select email or the external service you want to forward to.
Email (Issues, cases, logs)
- Enable the email option and click Email to expand the form.
- Enter the email address for your Distribution List.
- For issue forwarding, you can define the Grouping Timeframe, which is the time frame, in minutes, to specify how often Cortex XSIAM sends notifications. Every 20 issues aggregated within this time frame are sent together in one notification, sorted according to severity. To send a notification when one issue is generated, set the time frame to
0. The grouping time frame for case and management audit log is 10 minutes and cannot be modified. - (Optional) Define your email configuration:
- In the Distribution List, add the email addresses to which you want to send email notifications.
- Choose whether you want Cortex XSIAM to provide an auto-generated subject.
- Choose the format you want to send the email. If you choose Alert, you can choose the Standard or Legacy format. For more information about the legacy format, see Log format for IOC and BIOC issues.
- Choose whether you want Cortex XSIAM to provide an auto-generated subject or enter your own subject.
- By default, data is sent in the issue format. You can also choose Alert format, Standard or Legacy. For more information about the legacy format, see Log format for IOC and BIOC issues.
The Grouping Timeframe defines the time frame, in minutes, of how often Cortex XSIAM sends notifications. Every 20 issues or 20 events aggregated within this time frame are sent together in one notification, sorted according to severity. To send a notification when one issue or event is generated, set the time frame to 0.
Syslog server (Issues, logs)
- Enable the Syslog option and click Syslog to expand the form.
- Select a syslog receiver. Cortex XSIAM displays the list of receivers integrated with your Cortex XSIAM tenant.
- Choose the format you want to send the syslog. If you choose Alert, you can choose the Standard or Legacy format. For more information about the legacy format, see Log format for IOC and BIOC issues.
Slack (Issues, cases)
- Enable the Slack option and click Slack to expand the form.
- Enter the Slack channel name and select from the list of available channels. Slack channels are managed independently of Cortex XSIAM in your Slack workspace. After integrating your Slack account with your Cortex XSIAM tenant, Cortex XSIAM displays a list of specific Slack channels associated with the integrated Slack workspace.
- Choose the format you want to send the syslog. If you choose Alert, you can choose the Standard or Legacy format. For more information about the legacy format, see Log format for IOC and BIOC issues.
Amazon S3, Amazon SQS, Splunk, or Webhook (Issues, cases)
- Enable the Amazon S3, Amazon SQS, Splunk, or Webhook option and click to expand the form.
-
Select the instance name.
- Click Next.
- Review the forwarding configuration and click Create.
Set up email notifications for tenant updates
Your Cortex tenant generates Management Audit Logs throughout the tenant update lifecycle. This includes version upgrades and hotfixes, covering both the pending (before) and completed (after) phases of a scheduled update.
Using log forwarding, you can automatically receive an email whenever one of these events occurs, ensuring your team is notified the moment a change is scheduled or completed on your tenant.
Prerequisites
Ensure you have the following:
- Admin privileges on the tenant.
- The email distribution list that will receive the notifications.
- Your tenant name (for example., acme-corp.us) to include in the email subject for easy identification.
How audit events are structured
Every forwarding rule is built by matching key fields from the Management Audit Log:
| Field | What it tells you | Values to filter on |
|---|---|---|
| Type | The domain that produced the event. | Tenant Management |
| Subtype | The exact phase of the lifecycle. | Upgrade Pending, Upgrade Completed, Hotfix Pending, Hotfix Completed |
| Description | Human-readable summary of the event. | Contains the word downtime when downtime is involved. This enables you to build targeted rules that run only when downtime is expected. |
How to set up email notifications for tenant updates
- Go to Settings → Configurations → General → Notifications → + Add Forwarding Configuration.
- In the Define step, set the forwarding configuration details.
- Enter a name for the configuration.
- For Log Type, select Management Audit Logs.
- (Optional) Enter a description of the forwarding configuration.
- Click Next.
- In the Scope step, filter which issues, cases, or logs you want included in a notification and then click Next.\
For example, for a filter set to Severity = Medium, Category = Configuration, Cortex XSIAM sends the issues or events matching this filter as a notification. - In the Forward Destination step, define the destination details.
- Select the Notification Timezone.
- Under the Add Application dropdown, enable one or more integrations.
- Enable Email.
- Enter the recipients in the Email distribution list field.
- Set the Grouping timeframe to 1 minute.\
A one minute timeframe ensures pre-upgrade and pre-hotfix warnings arrive in time to be actionable without unnecessary delays. - Clear the Use Auto Generated Subject checkbox.\
Writing a custom subject that includes your tenant name and the event type (for example, <tenant_name> tenant - Pre-upgrade warning) enables recipients to instantly identify the affected tenant. - Enter your custom subject and add the Filter / Conditions for your specific use case from the use case configurations table below.
- Click Create.
Use case configurations
The following table provides subject lines and filter conditions for your notification needs. For all rules below, the Entity condition must be set to Tenant Management.
| Use case | When the email is sent | Email recipients | Custom email subject | Additional filter conditions |
|---|---|---|---|---|
| All upgrade and hotfix events | Any upgrade/hotfix event occurs. | Compliance and audit teams needing a complete record. This is the simplest approach. | <tenant_name> tenant - Upgrade/Hotfix audit log | (None) |
| Pre-upgrade warning | An upgrade is about to begin (~10-min warning). | Operations teams needing to prepare. | <tenant_name> tenant - Pre-upgrade warning | Subtype contains Upgrade Pending |
| Post-upgrade completion | An upgrade has successfully completed. | Anyone tracking version changes. | <tenant_name> tenant - Upgrade completed | Subtype contains Upgrade Completed |
| Pre-hotfix warning | A hotfix is about to be deployed (~10-min warning). | Operations teams needing to prepare. | <tenant_name> tenant - Pre-hotfix warning | Subtype contains Hotfix Pending |
| Post-hotfix completion | A hotfix has been successfully deployed. | Anyone tracking deployments. | <tenant_name> tenant - Hotfix completed | Subtype contains Hotfix Completed |
| Any event with downtime | An upgrade or hotfix requires downtime. | On-call and SRE teams tracking service interruptions. | <tenant_name> tenant - Upgrade/Hotfix with downtime | <p>Description contains downtime</p><p>Example configurations:</p><ul><li>description contains downtime</li><li>type = Tenant Management</li><li>subtype contains upgrade</li></ul><p>OR</p><ul><li>description contains downtime</li><li>type = Tenant Manage</li></ul> |
Manage and test your rules
- View all rules: Go to Settings → Configurations → General → Notifications. Each forwarding configuration is listed with its log type, destination, and status.
- Edit or pause notifications: Open any rule to change recipients, adjust filters, or toggle it on/off.
- Verify the notification is sent: The next time an upgrade or hotfix occurs, confirm the expected email arrives. You can also check the event in Settings → Management Audit Logs.
- Audit log retention: All audit events are retained for 365 days, enabling you to review historical events in the Management Audit Logs table even if you miss an email.
Frequently asked questions
Should I create one general rule or several specific ones?
If you need a complete record, the use case for all upgrade and hotfix events is the simplest approach. Create individual pre-event and post-event rules only if you need to route specific phases to different teams (for example, warnings to on-call engineers or completions to compliance).
Can I forward these logs to other destinations?
Yes. You can route Management Audit Logs to a Syslog receiver by changing the destination to Syslog during setup. The filter configurations remain exactly the same.
Why does the time in the email differ from the tenant UI?
The tenant UI displays times based on your tenant timezone server setting. Forwarded emails use UTC to provide an unambiguous timestamp for all recipients.
Monitor administrative activity
From Settings → Management Audit Logs, you can track the status of all administrative and investigative actions. Cortex XSIAM stores audit logs for 365 days (instead of 180 days, which was the retention period in the past). Use the page filters to narrow the results or manage tables to add or remove fields as needed.
To ensure you and your colleagues stay informed about administrative activity, you can configure notification forwarding to forward your Management Audit log to an email distribution list, Syslog server, or Slack channel.
The following table describes the default and optional fields that you can view in alphabetical order.
| Field | Description |
|---|---|
| Email address of the administrative user | |
| Description | Descriptive summary of the administrative action. Hover over this field to view more detailed information in a popup tooltip. This enables you to know exactly what has changed, and, if necessary, roll back the change. |
| Host Name | Name of any relevant affected hosts |
| ID | Unique ID of the action |
| Result | Result of the administrative action: Success, Partial, or Fail. |
| Subtype | Subcategory of action |
| Timestamp | Time and date of the action |
| Type | <p>Type of activity logged, one of the following:</p><ul><li>Agent Configuration: Configuration of a particular Cortex XDR agent on a particular endpoint.</li><li>Agent Installation: Installation of the Cortex XDR agent on a particular endpoint.</li><li>Issue Exclusions: Suppression of particular issues from Cortex XSIAM .</li><li>Issue Fields: Modification of issue fields.</li><li>Issue Layouts: Modification of issue layouts.</li><li>Issue Layout Rules: Modification of issue layout rules.</li><li>Issue Notifications: Modification of the format or timing of issues.</li><li>Issue Rules: Modification of issue rules.</li><li>API Key: Modification of the Cortex XSIAM API key.</li><li>Authentication: User sessions started, along with the user name that started the session.</li><li>Broker API: Operation related to the Broker application programming interface (API).</li><li>Broker VM: Operation related to the Broker virtual machine (VM).</li><li>Dashboards: Use of particular dashboards.</li><li>Device Control Permanent Exceptions: Modification of permanent device control exceptions.</li><li>Device Control Profile: Modification of a device control profile.</li><li>Device Control Temporary Exceptions: Modification of temporary device control exceptions.</li><li>Disk Encryption Profile: Modification of a disk encryption profile.</li><li>Endpoint Administration: Management of endpoints.</li><li>Endpoint Groups: Management of endpoint groups.</li><li>Extensions Policy: Modification of extension policy settings, including host firewall and disk encryption.</li><li>Extensions Profiles: Modification of extension profile settings.</li><li>Global Exceptions: Management of global exceptions.</li><li>Host Firewall Profile: Modification of a host firewall profile.</li><li>Host Insights: Initiation of Host Insights data collection scan (Host Inventory and Vulnerability Assessment).</li><li>Case Management: Actions taken on cases and on the assets, issues, and artifacts in cases.</li><li>Ingest Data: Import of data for immediate use or storage in a database.</li><li>Integrations: Integration operations, such as integrating Slack for outbound notifications.</li><li>Licensing: Any licensing-related operation.</li><li>Live Terminal: Remote terminal sessions created and actions taken in the file manager or task manager, a complete history of commands issued, their success, and the response.</li><li>Managed Threat Hunting: Activity relating to managed threat hunting.</li><li>MSSP: Management of security services providers.</li><li>Policy & Profiles: Activity related to managing policies and profiles.</li><li>Prevention Policy Rules: Modification of prevention policy rules.</li><li>Protection Policy: Modification of the protection policy.</li><li>Protection Profile: Modification of the protection profile.</li><li>Public API: Authentication activity using an associated Cortex XSIAM API key.</li><li>Query Center: Operations in the Query Center.</li><li>Remediation: Remediation operations.</li><li>Reporting: Any reporting activity.</li><li>Response: Remedial actions taken. For example: Isolate a host, undo host isolation, add a file hash signature to the block list, or undo the addition to the block list.</li><li>Rules: Modification of rules.</li><li>Rules Exceptions: Creation, editing, or deletion under Rules exceptions.</li><li>SaaS Collection: Any collected SaaS data.</li><li>Script Execution: Any script execution.</li><li>Starred Cases: Modification of starred cases.</li><li>Vulnerability Assessment: Any vulnerability assessment activity.</li></ul> |
| User Name | The user who performed the action. |
Data and log notification formats
When Cortex XSIAM cases, issues, and logs are forwarded to email or a third-party system, notifications are sent in a specific format.
Issues can be forwarded to email, syslog servers, and Slack in the alert format, if you prefer. The alert format can be selected when you configure your forwarding notification.
Management audit log messages
Cortex XSIAM management audit log messages are sent based on the various log types, for example, Action Center, Issue Rules, or Authentication.
List of log types
- Action Center
- Agent Configuration
- Agent Exception Rules
- Issue Exclusion
- Issue Management
- Issue Notifications
- Issue Rules
- Issue Exclusions
- Allowed Domains
- API Key
- Apps
- Asset Inventory
- Asset Roles
- Asset Tag Rules
- Asset Uploads
- Authentication
- Automation Rules
- Automation Settings
- Broker API
- Broker VMs
- Business Unit Change
- SaaS Collection
- Custom Fields
- Dashboards
- Datasets
- Dataset Views
- Data Retention
- Device Control Custom Device
- Device Control Permanent Exceptions
- Extensions Policy Rules
- Device Control Profile
- Device Control Temporary Exceptions
- Agent Installation
- EDL Management
- Effective IP Ranges
- Endpoint Groups
- Endpoint Administration
- Event Forwarding
- Device Control Violations
- Device Permanent Exceptions
- Device Temp Exceptions
- Disk Encryption Visibility
- Featured Alert Fields
- Forensics
- Global Exceptions
- Host Insights
- Disk Encryption Profile
- Host Firewall
- Host Firewall Profile
- Case Domains
- Case Layout Rules
- Case Management
- Case Properties
- Case Timeline Event
- Indicator rules
- Ingest Data
- Integrations
- Layout Rules
- Licensing
- Live Terminal
- Lookups
- Managed Detection & Response
- Managed Threat Hunting
- MSSP
- Permissions
- Playbook Triggers
- Policy & Profiles
- Prevention Policy Rules
- Prisma Integration
- Extensions Profile
- Public API
- Query Center
- Query Library
- Remediation
- Remediation Path Rules
- Reporting
- Response
- Rules
- Rules Exceptions
- Scoring Rules
- XDR Collector Configuration
- XDR Collectors Groups
- XDR Collectors Policy
- XDR Collectors Profile
- Script Execution
- Security Settings
- Server Settings
- Starred Incidents
- Support
- System
- Tenant Takeover
- Vulnerability Assessment
- Vulnerability Tests
- XCloud Integration
- XDM Config
- XQL Parsing Rules
- Public API
- Cortex Automation
- Sub Type—Command - War Room
- Status—Success
- Severity—Informational
- Details—
IncidentID:({ID}), IncidentType:({type}), IncidentName:({name}), Command:({command}), Arguments:({arg1})="arg1val" ({arg2})="arg2val" ({argn})="argnval", ID: ({num})
- Sub Type—Command - Playground
- Status—Success
- Severity—Informational
- Sub Type—Command - War Room
- XSOAR Migration
Cortex XSIAM issue notification format
Understand Cortex XSIAM issue notification formats and payloads for each supported forwarding destination.
Issue notification destinations
Issues can be forwarded to the following:
- Email distribution list
- Syslog server
- Slack
- Splunk, Amazon SQS, Amazon S3, or Webhook
For issues with relevant assets, issue notifications sent to Amazon S3, Amazon SQS, Webhook, Splunk, and email provide asset and remediation information including the asset name, cloud resource name, asset tags, account name, region, and evidence.
Email account
Cortex XSIAM sends issues to email accounts based on the settings you configure. Email messages also include an issue code snippet of the fields according to the columns in the Issue table.
The notification format is as follows:
- If only one issue exists in the queue, a single-issue email format is sent.
- If more than one issue was grouped in the time frame, all the issues in the queue are forwarded together in a grouped email format.
Example: Single-issue email message
Email Subject: Issue: <issue_name> Email Body: Issue Name: Suspicious Process Creation Severity: High Source: Correlation Category: Malware Action: Detected Host: <host name> Username:<user name> Excluded: No Starred: Yes Issue: <link to the tenant issue view> Case: <link to the tenant case view>
Example: Single-issue email message with asset
Email Subject: Issue: <issue_name>
Email Body:
Issue Name: Suspicious Process Creation
Severity: High
Remediation: N/A
Initial Evidence: N/A
Asset 1:
Asset ID: e2c48011383e2d606d66e564d7ca523e638422f90c1dc09ae33af9015d8afd17
Asset Name: holodeck_agent-d40088a128624a
Asset Account: Other
Asset External Provider ID: N/A
Asset Tags: N/A
Source: Correlation
Category: Malware
Action: Detected
Host: <host name>
Username:<user name>
Excluded: No
Starred: Yes
Issue: <link to the tenant issue view>
Case: <link to the tenant case view>
Example: Grouped issue email message
Email Subject: Issues: <first_highest_severity_issue> + x others
Email Body:
Issue Name: Suspicious Process Creation
Severity: High
Source: Correlation
Category: MalwareAction: Detected
Host: <host name>
Username:<user name>
Excluded:No
Starred: Yes
Issue: <link to the tenant issue view>
Case: <link to the tenant case view>
Issue Name: Behavioral Threat Protection
Issue ID: 2412
Description: A really cool detection
Severity: Medium
Source: Correlation
Category: Exploit
Action: Prevented
Host: <host name>
Starred: Yes
Case: <link to the tenant issue view>
Issue: <link to the tenant case view>
Notification Name: “My notification policy 2 ”
Notification Description: “Starred issues with medium severity”
Example: Email attachment
{ "original_issue_json":{ "uuid":"<UUID Value>", "recordType":"threat", "customerId":"<Customer ID>", "severity":4, "...", "is_pcap":null, "contains_featured_host":[ "NO" ], "contains_featured_user":[ "YES" ], "contains_featured_ip":[ "YES" ], "events_length":1, "is_excluded":false }
Example: Email attachment with asset
{ "agent_id": null, "category": "POSTURE", "observation_time": 1776826363623, "is_excluded": false, "mitre_tactics": null, "mitre_techniques": null, "owner": "AISPM", "detection.rule_id": "90bed230-210a-42ec-880a-86edb934ec0f", "detection.method": "AISPM_RULE_ENGINE", "is_starred": false, "original_issue_json": { "xdm.issue.detection.method": "AISPM_RULE_ENGINE", "issues": [ { "xdm.issue.detection.rule_id": "90bed230-210a-42ec-880a-86edb934ec0f", "xdm.issue.detection.method": "AISPM_RULE_ENGINE", "xdm.issue.platform_status.progress": "NEW", "xdm.issue.external_id": "90bed230-210a-42ec-880a-86edb934ec0f:342799b2aaf50ae1e3efb9beb5efc12f22ea197817a2a4e586402d79ef7f2e23", "xdm.issue.name": "DP - custom AI 04/21", "xdm.issue.description": "DP - custom AI 04/21", "xdm.issue.platform_severity": "CRITICAL", "xdm.issue.asset_ids": [ "342799b2aaf50ae1e3efb9beb5efc12f22ea197817a2a4e586402d79ef7f2e23" ], "xdm.issue.auto_resolve_findings": false, "xdm.issue.auto_resolve_assets": false, "xdm.issue.extended_fields": {} }, { "xdm.issue.detection.rule_id": "90bed230-210a-42ec-880a-86edb934ec0f", "xdm.issue.detection.method": "AISPM_RULE_ENGINE", "xdm.issue.platform_status.progress": "NEW", "xdm.issue.external_id": "90bed230-210a-42ec-880a-86edb934ec0f:4f4e4635688677ac8d03457f2e310d77e67510fc52d797f963d69c21a5055e86", "xdm.issue.name": "DP - custom AI 04/21", "xdm.issue.description": "DP - custom AI 04/21", "xdm.issue.platform_severity": "CRITICAL", "xdm.issue.asset_ids": [ "4f4e4635688677ac8d03457f2e310d77e67510fc52d797f963d69c21a5055e86" ], "xdm.issue.auto_resolve_findings": false, "xdm.issue.auto_resolve_assets": false, "xdm.issue.extended_fields": {} } /* ... 18 additional issue objects omitted for brevity ... */ ], "__group_during_create": false, "__action": "upsert", "xdm.issue.observation_time": 1776826363623, "xdm.issue.category": "POSTURE", "xdm.issue.domain": "POSTURE" }, "id": 17276, "issue_domain": "DOMAIN_POSTURE", "external_id": "90bed230-210a-42ec-880a-86edb934ec0f:34afc3ebd42363afbbb0269642f909696fda8658f21465f9002c7130dd62154b", "severity": "SEV_050_CRITICAL", "platform_severity": "SEV_050_CRITICAL", "matching_status": "UNMATCHABLE", "_insert_time": 1776828440454, "name": "DP - custom AI 04/21", "description": "DP - custom AI 04/21", "dispatch_state": "DISPATCHABLE", "issue_type": "Unclassified", "resolution_status": "STATUS_010_NEW", "tags": [ { "tag_id": "DOM:5", "tag_name": "DOM:Posture" }, { "tag_id": "DS:PANW/AI Security Posture", "tag_name": "DS:PANW/AI Security Posture" } ], "platform_status.progress": "STATUS_010_NEW", "status.progress": "STATUS_010_NEW", "legacy_fields": { "alert_action_status": "SCANNED", "contains_featured_host": [ "NO" ], "contains_featured_ip": [ "NO" ], "contains_featured_user": [ "NO" ], "emailsentsuccessfully": false, "exported": false, "feedBased": false, "hasRole": false, "passwordresetsuccessfully": false, "retained": false, "is_xsoar_alert": false, "is_pcap": false, "is_rule_triggering": false }, "assets": [ { "asset_name": "Nova 2 Lite", "asset_region": "us-east-2", "asset_account": "850876390271", "asset_id": "34afc3ebd42363afbbb0269642f909696fda8658f21465f9002c7130dd62154b", "asset_external_provider_id": "arn:aws:bedrock:us-east-2::foundation-model/amazon.nova-2-lite-v1:0" } ] }
Slack channel, Splunk, Amazon S3, Amazon SQS, Webhook
You can send issue notifications to a single Slack contact or a Slack channel, or to Splunk, Amazon S3, Amazon SQS, or Webhook. Notifications are similar to the email format.
Syslog receiver
Issue notifications forwarded to a syslog receiver are sent in a CEF format RF 5425.
| Section | Description |
|---|---|
| Syslog header | <9>: PRI (considered a priority field)1: version number2020-03-22T07:55:07.964311Z: timestamp of when alert/log was sentcortexxdr: host name |
| CEF header | HEADER/Vendor="Palo Alto Networks" (as a constant string)HEADER/Device Product="Cortex XDR" (as a constant string)HEADER/Product Version= Cortex XDR version (2.0/2.1....)HEADER/Severity=(integer/0 - Unknown, 6 - Low, 8 - Medium, 9 - High)HEADER/Device Event Class ID=alert sourceHEADER/name =alert name |
| CEF body | end=timestamp shost=endpoint_name deviceFacility=facility cat=category externalId=external_id request=request cs1=initiated_by_process cs1Label=Initiated by (constant string) cs2=initiator_commande cs2Label=Initiator CMD (constant string) cs3=signature cs3Label=Signature (constant string) cs4=cgo_name cs4Label=CGO name (constant string) cs5=cgo_command cs5Label=CGO CMD (constant string) cs6=cgo_signature cs6Label=CGO Signature (constant string) dst=destination_ip dpt=destination_port src=source_ip spt=source_port fileHash=file_hash filePath=file_path targetprocesssignature=target_process_signature tenantname=tenant_name tenantCDLid=tenant_id CSPaccountname=account_name initiatorSha256=initiator_hash initiatorPath=initiator_path osParentName=parent_name osParentCmd=parent_command osParentSha256=parent_hash osParentSignature=parent_signature osParentSigner=parent_signer incident=incident_id act=action suser=actor_effective_username |
Example
end=timestamp shost=endpoint_name deviceFacility=facility cat=category externalId=external_id request=request cs1=initiated_by_process cs1Label=Initiated by (constant string) cs2=initiator_commande cs2Label=Initiator CMD (constant string) cs3=signature cs3Label=Signature (constant string) cs4=cgo_name cs4Label=CGO name (constant string) cs5=cgo_command cs5Label=CGO CMD (constant string) cs6=cgo_signature cs6Label=CGO Signature (constant string) dst=destination_ip dpt=destination_port src=source_ip spt=source_port fileHash=file_hash filePath=file_path targetprocesssignature=target_process_signature tenantname=tenant_name tenantCDLid=tenant_id CSPaccountname=account_name initiatorSha256=initiator_hash initiatorPath=initiator_path osParentName=parent_name osParentCmd=parent_command osParentSha256=parent_hash osParentSignature=parent_signature osParentSigner=parent_signer incident=incident_id act=action suser=actor_effective_username
Agent Audit log notification format
Cortex XSIAM forwards the Agent Audit log to these external data resources:
- Email account: Sent according to the settings you configured
-
Syslog receiver: Sent in a CEF format RFC 5425 according to the following mapping:
Section Description Syslog header <9>: PRI (considered a prioirty field)1: version number2020-03-22T07:55:07.964311Z: timestamp of when issue/log was sentcortexxdr: host nameCEF hHeader HEADER/Vendor="Palo Alto Networks" (as a constant string)HEADER/Device Product="Cortex XDR Agent" (as a constant string)HEADER/Device Version= Cortex XDR Agent version (7.0/7.1....)HEADER/Severity=(integer/0 - Unknown, 6 - Low, 8 - Medium, 9 - High)HEADER/Device Event Class ID="Agent Audit Logs" (as a constant string)HEADER/name = typeCEF body dvchost=domain shost=endpoint_name cat=category end=timestamp rt=received_time cs1Label=agentversion (constant string) cs1=agent_version cs2Label=subtype (constant string) cs2=subtype cs3Label=result (constant string) cs3=result cs4Label=reason (constant string) cs4=reason msg=event_description tenantname=tenant_name tenantCDLid=tenant_id CSPaccountname=csp_id
Example
<182>1 2020-10-04T10:41:14.608731Z cortexxdr - - - - CEF:0|Palo Alto Networks|Cortex XDR Agent|Cortex XDR Agent 7.2.0.63060|Agent Audit Logs|Agent Service|9|dvchost=WORKGROUP shost=Test-Agent cat=Monitoring end=1601808073102 rt=1601808074596 cs1Label=agentversion cs1=7.2.0.63060 cs2Label=subtype cs2=Stop cs3Label=result cs3=N\/A cs4Label=reason cs4=None msg=XDR service cyserver was stopped on Test-Agent tenantname=Test tenantCDLid=123456 CSPaccountname=1234
Management Audit log notification format
Cortex XSIAM forwards the Management Audit log to these external data sources:
- Email account: Sent according to the settings you configured. For more information, see Configure notification forwarding.
-
Syslog receiver: Sent in a CEF format RFC 5425 according to the following mapping:
Section Description Syslog header <9>: PRI (considered a prioirty field)1: version number2020-03-22T07:55:07.964311Z: timestamp of when issue /log was sentcortexxdr: host nameCEF header HEADER/Vendor="Palo Alto Networks" (as a constant string)HEADER/Device Product="Cortex XDR" (as a constant string)HEADER/Device Version= Cortex XDR version (2.0/2.1....)HEADER/HEADER/Severity=(integer/0 - Unknown, 6 - Low, 8 - Medium, 9 - High)HEADER/Device Event Class ID="Management Audit Logs" (as a constant string)HEADER/name = typeCEF body suser=user end=timestamp externalId=external_id cs1Label=email (constant string) cs1=user_mail cs2Label=subtype (constant string) cs2=subtype cs3Label=result (constant string) cs3=result cs4Label=reason (constant string) cs4=reason msg=event_description tenantname=tenant_name tenantCDLid=tenant_id CSPaccountname=csp_id
Example
3/18/2012:05:17.567 PM<14>1 2020-03-18T12:05:17.567590Z cortexxdr - - - CEF:0|Palo Alto Networks|Cortex XDR|Cortex XDR x.x |Management Audit Logs|REPORTING|6|suser=test end=1584533117501 externalId=5820 cs1Label=email cs1=test@paloaltonetworks.com cs2Label=subtype cs2=Slack Report cs3Label=result cs3=SUCCESS cs4Label=reason cs4=None msg=Slack report 'scheduled_1584533112442' ID 00 to ['CUXM741BK', 'C01022YU00L', 'CV51Y1E2X', 'CRK3VASN9'] tenantname=test tenantCDLid=11111 CSPaccountname=00000
Log format for IOC and BIOC issues
Cortex XSIAM logs IOC and BIOC issues. If you configure Cortex XSIAM to forward logs in the legacy format, when issue logs are forwarded from Cortex XSIAM, each log record has the following format:
-
Email account: Each field is labeled, one line per field.
edrData/action_country: edrData/action_download: edrData/action_external_hostname: edrData/action_external_port: edrData/action_file_extension: pdf edrData/action_file_md5: null edrData/action_file_name: XORXOR2614081980.pdf ... xdr_sub_type: BIOC - Credential Access bioc_category_enum_key: null alert_action_status: null agent_data_collection_status: null attempt_counter: null case_id: null global_content_version_id: global_rule_id: is_whitelisted: false
-
Syslog format
"/edrData/action_country","/edrData/action_download","/edrData/action_external_hostname","/edrData/action_external_port","/edrData/action_file_extension","/edrData/action_file_md5","/edrData/action_file_name","/edrData/action_file_path","/edrData/action_file_previous_file_extension","/edrData/action_file_previous_file_name","/edrData/action_file_previous_file_path","/edrData/action_file_sha256","/edrData/action_file_size","/edrData/action_file_remote_ip","/edrData/action_file_remote_port","/edrData/action_is_injected_thread","/edrData/action_local_ip","/edrData/action_local_port","/edrData/action_module_base_address","/edrData/action_module_image_size","/edrData/action_module_is_remote","/edrData/action_module_is_replay","/edrData/action_module_path","/edrData/action_module_process_causality_id","/edrData/action_module_process_image_command_line","/edrData/action_module_process_image_extension","/edrData/action_module_process_image_md5","/edrData/action_module_process_image_name","/edrData/action_module_process_image_path","/edrData/action_module_process_image_sha256","/edrData/action_module_process_instance_id","/edrData/action_module_process_is_causality_root","/edrData/action_module_process_os_pid","/edrData/action_module_process_signature_product","/edrData/action_module_process_signature_status","/edrData/action_module_process_signature_vendor","/edrData/action_network_connection_id","/edrData/action_network_creation_time","/edrData/action_network_is_ipv6","/edrData/action_process_causality_id","/edrData/action_process_image_command_line","/edrData/action_process_image_extension","/edrData/action_process_image_md5","/edrData/action_process_image_name","/edrData/action_process_image_path","/edrData/action_process_image_sha256","/edrData/action_process_instance_id","/edrData/action_process_integrity_level","/edrData/action_process_is_causality_root","/edrData/action_process_is_replay","/edrData/action_process_is_special","/edrData/action_process_os_pid","/edrData/action_process_signature_product","/edrData/action_process_signature_status","/edrData/action_process_signature_vendor","/edrData/action_proxy","/edrData/action_registry_data","/edrData/action_registry_file_path","/edrData/action_registry_key_name","/edrData/action_registry_value_name","/edrData/action_registry_value_type","/edrData/action_remote_ip","/edrData/action_remote_port","/edrData/action_remote_process_causality_id","/edrData/action_remote_process_image_command_line","/edrData/action_remote_process_image_extension","/edrData/action_remote_process_image_md5","/edrData/action_remote_process_image_name","/edrData/action_remote_process_image_path","/edrData/action_remote_process_image_sha256","/edrData/action_remote_process_is_causality_root","/edrData/action_remote_process_os_pid","/edrData/action_remote_process_signature_product","/edrData/action_remote_process_signature_status","/edrData/action_remote_process_signature_vendor","/edrData/action_remote_process_thread_id","/edrData/action_remote_process_thread_start_address","/edrData/action_thread_thread_id","/edrData/action_total_download","/edrData/action_total_upload","/edrData/action_upload","/edrData/action_user_status","/edrData/action_username","/edrData/actor_causality_id","/edrData/actor_effective_user_sid","/edrData/actor_effective_username","/edrData/actor_is_injected_thread","/edrData/actor_primary_user_sid","/edrData/actor_primary_username","/edrData/actor_process_causality_id","/edrData/actor_process_command_line","/edrData/actor_process_execution_time","/edrData/actor_process_image_command_line","/edrData/actor_process_image_extension","/edrData/actor_process_image_md5","/edrData/actor_process_image_name","/edrData/actor_process_image_path","/edrData/actor_process_image_sha256","/edrData/actor_process_instance_id","/edrData/actor_process_integrity_level","/edrData/actor_process_is_special","/edrData/actor_process_os_pid","/edrData/actor_process_signature_product","/edrData/actor_process_signature_status","/edrData/actor_process_signature_vendor","/edrData/actor_thread_thread_id","/edrData/agent_content_version","/edrData/agent_host_boot_time","/edrData/agent_hostname","/edrData/agent_id","/edrData/agent_ip_addresses","/edrData/agent_is_vdi","/edrData/agent_os_sub_type","/edrData/agent_os_type","/edrData/agent_session_start_time","/edrData/agent_version","/edrData/causality_actor_causality_id","/edrData/causality_actor_effective_user_sid","/edrData/causality_actor_effective_username","/edrData/causality_actor_primary_user_sid","/edrData/causality_actor_primary_username","/edrData/causality_actor_process_causality_id","/edrData/causality_actor_process_command_line","/edrData/causality_actor_process_execution_time","/edrData/causality_actor_process_image_command_line","/edrData/causality_actor_process_image_extension","/edrData/causality_actor_process_image_md5","/edrData/causality_actor_process_image_name","/edrData/causality_actor_process_image_path","/edrData/causality_actor_process_image_sha256","/edrData/causality_actor_process_instance_id","/edrData/causality_actor_process_integrity_level","/edrData/causality_actor_process_is_special","/edrData/causality_actor_process_os_pid","/edrData/causality_actor_process_signature_product","/edrData/causality_actor_process_signature_status","/edrData/causality_actor_process_signature_vendor","/edrData/event_id","/edrData/event_is_simulated","/edrData/event_sub_type","/edrData/event_timestamp","/edrData/event_type","/edrData/event_utc_diff_minutes","/edrData/event_version","/edrData/host_metadata_hostname","/edrData/missing_action_remote_process_instance_id","/facility","/generatedTime","/recordType","/recsize","/trapsId","/uuid","/xdr_unique_id","/meta_internal_id","/external_id","/is_visible","/is_secdo_event","/severity","/alert_source","/internal_id","/matching_status","/local_insert_ts","/source_insert_ts","/alert_name","/alert_category","/alert_description","/bioc_indicator","/matching_service_rule_id","/external_url","/xdr_sub_type","/bioc_category_enum_key","/alert_action_status","/agent_data_collection_status","/attempt_counter","/case_id","/global_content_version_id","/global_rule_id","/is_whitelisted"
Field prefixes for BIOC and IOC issue logs
| Field Name | Description |
|---|---|
| /edrData/action_file* | Fields that begin with this prefix describe attributes of a file for which Traps reported activity. |
| edrData/action_module* | Fields that begin with this prefix describe attributes of a module for which Traps reported module loading activity. |
| edrData/action_module_process* | Fields that begin with this prefix describe attributes and activity related to processes reported by Traps that load modules such as DLLs on the endpoint. |
| edrData/action_process_image* | Fields that begin with this prefix describe attributes of a process image for which Traps reported activity. |
| edrData/action_registry* | Fields that begin with this prefix describe registry activity and attributes such as key name, data, and previous value for which Traps reported activity. |
| edrData/action_network | Fields that begin with this prefix describe network attributes for which Traps reported activity. |
| edrData/action_remote_process* | Fields that begin with this prefix describe attributes of remote processes for which Traps reported activity. |
| edrData/actor* | Fields that begin with this prefix describe attributes about the acting user that initiated the activity on the endpoint. |
| edrData/agent* | Fields that begin with this prefix describe attributes about the Traps agent deployed on the endpoint. |
| edrData/causality_actor* | Fields that begin with this prefix describe attributes about the causality group owner. |
Additional fields for BIOC and IOC issue logs
| Field Name | Description |
|---|---|
| /severity | Severity assigned to the issue:
|
| /alert_source | Source of the issue: BIOC or IOC |
| /local_insert_ts | Date and time when Cortex XSIAM – Investigation and Response ingested the app. |
| /source_insert_ts | Date and time the issue was reported by the issue source. |
| /alert_name | If the issue was generated by Cortex XSIAM – Investigation and Response, the issue name will be the specific Cortex XSIAM rule that created the issue (BIOC or IOC rule name). If from an external system, it will carry the name assigned to it by Cortex XSIAM . |
| /alert_category | Issue category based on the issue source.
|
| /alert_description | Text summary of the event including the issue source, issue name, severity, and file path. For alerts generated by BIOC and IOC rules, Cortex XSIAM displays detailed information about the rule. |
| /bioc_indicator | A JSON representation of the rule characteristics. For example: [{""pretty_name"":""File"",""data_type"":null,
""render_type"":""entity"",""entity_map"":null},
{""pretty_name"":""action type"",
""data_type"":null,""render_type"":""attribute"",
""entity_map"":null},{""pretty_name"":""="",
""data_type"":null,""render_type"":""operator"",
""entity_map"":null},{""pretty_name"":""all"",
""data_type"":null,""render_type"":""value"",
""entity_map"":null},{""pretty_name"":""AND"",
""data_type"":null,""render_type"":""connector"",
""entity_map"":null},{""pretty_name"":""name"",
""data_type"":""TEXT"",
""render_type"":""attribute"",
""entity_map"":""attributes""},
{""pretty_name"":""="",""data_type"":null,
""render_type"":""operator"",
""entity_map"":""attributes""},
{""pretty_name"":""*.pdf"",""data_type"":null,
""render_type"":""value"",
""entity_map"":""attributes""}]"
|
| /bioc_category_enum_key | Issue category based on the issue source. An example of a BIOC issue category is Evasion. An example of a Traps issue category is Exploit Modules. |
| /alert_action_status | Action taken by the issue sensor with action status displayed in parenthesis:
|
| /case_id | Unique identifier for the incident. |
| /global_content_version_id | Unique identifier for the content version in which a Palo Alto Networks global BIOC rule was released. |
| /global_rule_id | Unique identifier for an issue generated by a Palo Alto Networks global BIOC rule. |
| /is_whitelisted | Boolean indicating whether the issue is excluded or not. |
Analytics log format
Cortex XSIAM Analytics logs issues as analytics issue logs. If you configure Cortex XSIAM to forward logs in the legacy format, each log record has the following format:
-
Syslog format:
sub_type,time_generated,id,version_info/document_version,version_info/magnifier_version,version_info/detection_version,alert/url,alert/category,alert/type,alert/name,alert/description/html,alert/description/text,alert/severity,alert/state,alert/is_whitelisted,alert/ports,alert/internal_destinations/single_destinations,alert/internal_destinations/ip_ranges,alert/external_destinations,alert/app_id,alert/schedule/activity_first_seen_at,alert/schedule/activity_last_seen_at,alert/schedule/first_detected_at,alert/schedule/last_detected_at,user/user_name,user/url,user/display_name,user/org_unit,device/id,device/url,device/mac,device/hostname,device/ip,device/ip_ranges,device/owner,device/org_unit,files
-
Email account: Each field is labeled, one line per field.
sub_type: Update time_generated: 1547717480 id: 4 version_info/document_version: 1 version_info/magnifier_version: 1.8 version_info/detection_version: 2019.2.0rc1 alert/url: https:\/\/ddc1... alert/category: Recon alert/type: Port Scan alert/name: Port Scan alert/description/html: \t<ul>\n\t\t<li>The device.... alert/description/text: The device ... ... device/id: 2-85e40edd-b2d1-1f25-2c1e-a3dd576c8a7e device/url: https:\/\/ddc1 ... device/mac: 00-50-56-a5-db-b2 device/hostname: DC1ENV3APC42 device/ip: 10.201.102.17 device/ip_ranges: "[{""max_ip"":""..."",""name"":""..."",""min_ip"":""..."",""asset"":""""}]" device/owner: device/org_unit: files: []
Fields for analytics issue logs
| Field Name | Definition |
|---|---|
| sub_type | <p>Issue log subtype. Values are:</p><ul><li>New: First log record for the issue with this record id.</li><li>Update: Log record identifies an update to a previously logged issue.</li><li>StateOnlyUpdate: Issue state is updated. For internal use only.</li></ul> |
| time_generated | Time the log record was sent to the Cortex XSIAM tenant. Value is a Unix Epoch timestamp. |
| id | <p>Unique identifier for the issue. Any given issue can generate multiple log records—one when the issue is initially generated, and then additional records every time the issue status changes. This ID remains constant for all such issue records.</p><p>You can obtain the current status of the issue by looking for log records with this id and the most recent alert/schedule/last_detected_at timestamp.</p> |
| version_info/document_version | Identifies the log schema version number used for this log record. |
| version_info/magnifier_version | The version number of the Cortex XSIAM – Analytics instance that wrote this log record. |
| version_info/detection_version | Identifies the version of the Cortex XSIAM – Analytics detection software used to generate the issue. |
| alert/url | Provides the full URL to the issue page in the Cortex XSIAM – Analytics user interface. |
| alert/category | <p>Identifies the issue category, which is a reflection of the anomalous network activity location in the attack life cycle. Possible categories are:</p><ul><li>C&C: The network activity is possibly the result of malware attempting to connect to its Command & Control server.</li><li>Exfiltration: A large amount of data is being transferred to an endpoint that is external to the network.</li><li>Lateral: The network activity is indicative of an attacker who is attempting to move from one endpoint to another on the network.</li><li>Malware: A file has been discovered on an endpoint that is probably malware or riskware. Malware issues can also be generated based on network activity that is indicative of automated malicious traffic generation.</li><li>Recon: The network activity is indicative an attacker that is exploring the network for endpoints and other resources to attack.</li></ul> |
| alert/type | Identifies the categorization to which the issue belongs. For example Tunneling Process, Sandbox Detection, Malware, and so forth. |
| alert/name | The issue name as it appears in the Cortex XSIAM – Analytics user interface. |
| alert/description/html | The issue textual description in HTML formatting. |
| alert/description/text | The issue textual description in plain text. |
| alert/severity | <p>Identifies the issue severity. These severities indicate the likelihood that the anomalous network activity is a real attack.</p><ul><li>High: The issue is confirmed to be a network attack.</li><li>Medium: The issue is suspicious enough to require additional investigation.</li><li>Low: The issue is unverified. Whether the issue is indicative of a network attack is unknown.</li></ul> |
| alert/state | <p>Identifies the issue state.</p><ul><li>Open: The issue is currently active and should be undergoing triage or investigation by the network security analysts.</li><li>Reopened: The issue was previously resolved or dismissed, but new network activity has caused Cortex XSIAM – Analytics to reopen the issue.</li><li>Archived: No action was taken on the issue in the Cortex XSIAM – Analytics user interface, and no further network activity has occurred that caused it to remain active.</li><li>Resolved: Network personnel have taken enough action to end the attack.</li><li>Dismissed: The anomaly has been examined and deemed to be normal, sanctioned, network activity.</li></ul> |
| alert/is_whitelisted | Indicates whether the issue is whitelisted. Whitelisting indicates that anomalous-appearing network activity is legitimate. If an issue is whitelisted, then it is not visible in the Cortex XSIAM – Analytics user interface. Issues can be dismissed or archived and still have a whitelist rule. |
| alert/ports | List of ports accessed by the network entity during its anomalous behavior. |
| alert/internal_destinations/single_destinations | <p>Network destinations that the entity reached, or tried to reach, during the course of the network activity that caused Cortex XSIAM – Analytics to generate the issue. This field contains a sequence of JSON objects, each of which contains the following fields:</p><ul><li>ip: The destination IP address.</li><li>name: The destination name (for example, a host name).</li></ul> |
| alert/internal_destinations/ip_ranges | <p>IP address range subnets that the entity reached, or tried to reach, during the course of the network activity that caused Cortex XSIAM – Analytics to generate the issue. This field contains a sequence of JSON objects, each of which contains the following fields:</p><ul><li>max_ip: Last IP address in the subnet.</li><li>min_ip: First IP address in the subnet.</li><li>name: Subnet name.</li></ul> |
| alert/external_destinations | Provides a list of destinations external to the monitored network that the entity tried to reach, or actually reached, during the activity that generated this issue. This list can contain IP addresses or fully qualified domain names. |
| alert/app_id | The App-ID associated with this issue. |
| alert/schedule/activity_first_seen_at | Time when Cortex XSIAM – Analytics first detected the network activity that caused it to generate the issue. Be aware that there is frequently a delay between this timestamp, and the time when Cortex XSIAM – Analytics generates an issue (see the alert/schedule/first_detected_at field). |
| alert/schedule/activity_last_seen_at | Time when Cortex XSIAM – Analytics last detected the network activity that caused it to generate the issue. |
| alert/schedule/first_detected_at | Time when Cortex XSIAM – Analytics first alerted on the network activity. |
| alert/schedule/last_detected_at | Time when Cortex XSIAM – Analytics last alerted on the network activity. |
| user/user_name | The name of the user associated with this issue. This name is obtained from Active Directory. |
| user/url | Provides the full URL to the user page in the Cortex XSIAM – Analytics user interface for the user who is associated with the issue. |
| user/display_name | The user name as retrieved from Active Directory. This is the user name displayed within the Cortex XSIAM – Analytics user interface for the user who is associated with this issue. |
| user/org_unit | The organizational unit of the user associated with this issue, as identified using Active Directory. |
| device/id | A unique ID assigned by Cortex XSIAM – Analytics to the device. All issues generated due to activity occurring on this endpoint will share this ID. |
| device/url | Provides the full URL to the device page in the Cortex XSIAM – Analytics user interface. |
| device/mac | The MAC address of the network card in use on the device. |
| device/hostname | The device host name. |
| device/ip | The device IP address. |
| device/ip_ranges | <p>Identifies the subnet or subnets that the device is on. This sequence can contain multiple inclusive subnets. Each element in this sequence is a JSON object with the following fields:</p><ul><li>asset: The asset name assigned to the device from within the Cortex XSIAM – Analytics user interface.</li><li>max_ip: Last IP address in the subnet.</li><li>min_ip: First IP address in the subnet.</li><li>name: Subnet name.</li></ul> |
| device/owner | The user name of the person who owns the device. |
| device/org_unit | The organizational unit that owns the device, as identified by Active Directory. |
| files | <p>Identifies the files associated with the issue. Each element in this sequence is a JSON object with the following fields:</p><ul><li>full_path: The file full path (including the file name).</li><li>md5: The file MD5 hash.</li></ul> |
Configure Cortex XSIAM
Learn how to configure Cortex XSIAM
As soon as you have completed onboarding with Cortex XSIAM, start configuring the tenant to match your use case, such as the content required, whether you need to set up an MCP Server, and configure the Cortex Agentic Assistant.
Data management
Optimize data management in Cortex XSIAM
The Cortex Data Lake tier is only available with an active Cortex XSIAM NG SIEM, Cortex XSIAM Enterprise, or Cortex XSIAM Premium license.
Federated Search is not enabled by default. To enable it in your tenant, contact your Customer Support Team.
In modern security operations, balancing the need for comprehensive visibility with the reality of high data volumes and ingestion costs is a constant challenge. Cortex XSIAM addresses this by offering flexible data management solutions designed to align with the specific security value, ingestion requirements, and compliance needs of different log types.
By categorizing data into Analytics or Data Lake tiers, organizations can ensure that high-value logs receive real-time AI/ML processing and detection while supplementary logs are stored cost-effectively. Furthermore, Cortex XSIAM provides Federated Search, a query mechanism designed to provide unified access to distributed data sources without requiring pre-ingestion or centralization. This capability enables you to query data in place, significantly reducing the complexity and operational costs associated with the ingestion process and long-term data retention.
Comparison of data management solutions
The following table breaks down the differences between the internal ingestion tiers and the federated query mechanism to help you determine the best approach for your data.
| Point of Comparison | Analytics Tier (Regular cost ingestion) | Data Lake Tier (Cost-Optimized ingestion) | Federated Search (Query mechanism with no ingestion) |
|---|---|---|---|
| Primary Goal | Detection and Response | Compliance, Investigation, and Threat Hunting | Compliance and Historical Search |
| Best For | High-value security logs needed for real-time AI/ML detection. | High data volume, but low value in terms of real-time security, needed for compliance or as investigation supporting data | Massive historical archives or data you want to manage in your own cloud storage (AWS/GCP/Azure) |
| Data Location | Ingested and stored in Cortex XSIAM | Ingested and stored in Cortex XSIAM | Not Ingested. Stays in your Azure Blob/S3/GCS buckets. |
| AI/ML Analytics | Full AI/ML analytics support | None | None |
| Correlation Rules | Full support | Full Support (consumes Compute Units) | None (Search only) |
| Usage Model | Usage included (subject to limits) | Consumes Compute Units | Consumes Compute Units |
| Key Restriction | None | <ul><li>Cannot store PANW Firewall logs in Data Lake Tier</li><li>No Cortex Data Model (XDM) data modeling</li><li>No OOTB Analytics</li></ul> | <ul><li>Queries take longer to return results as dependent on external cloud</li><li>Supports specific formats and structure</li><li>Search only</li></ul> |
| Decision Criteria | <p>1. Real time AI/ML detection</p><p>2. Heavy query and access usage</p> | <p>1. High data volume, but low value in terms of real-time security; you rarely find threats solely in these, but you need them for context.</p><p>2. Data is required primarily for compliance or hunting. You need to keep it for 12 months for auditors, but you only search it occasionally</p><p>3. Supports correlation rules. You can write XQL rules to trigger alerts on this data, even though it doesn't get the full AI/ML treatment.</p> | <p>1. No ingestion required, data remains in its original location</p><p>2. Strict data sovereignty or ownership</p><p>3. This tier is Search Only. You cannot run, for example, correlation rules, scheduled queries, widgets, and dashboards, on Federated Search data. It is strictly for ad-hoc investigations via the XQL query builder.</p> |
| Examples | Any of the primary data sources like Firewall, Identity, Endpoint, Cloud audit log, and network logs (such as, Cloud Flow, WAF, Load Balancer, and NetFlow) for critical or sensitive environments. | <p>Non-critical Application logs and high-volume Network logs (Cloud Flow, WAF, Load Balancer, raw NetFlow) from non-critical environments.</p><div data-gb-custom-block data-tag="hint" data-style="info" class="hint hint-info"><p>Note</p><p>If a data source is heavily used for real-time Detection and Response (whether out-of-the-box Cortex XSIAM detections or user-defined rules), we recommend ingesting it via the Analytics tier, which includes all real-time detection capabilities.</p></div> | <p>Given they follow the supported formats (CSV, Parquet, JSONL) and Hive structure:</p><p>1. Raw application logs</p><p>2. CDN Logs, such as Akamai and Cloudflare: High-volume edge traffic logs stored in S3/Blob storage.</p><p>3. Database Audit Logs, such as RDS and SQL Audit: Compliance-heavy logs that prove "who accessed what table" years ago.</p><p>4. Any structured data you export from other systems, such as HR data dumps and old SIEM archives, into a "Hive" folder structure, such as ds=2024-01-01/, in your cloud bucket. Cortex XSIAM can query these directly.</p> |
Configure Cortex Data Lake tier
The Cortex Data Lake tier is an optional add-on available only with an active Cortex XSIAM NG SIEM, Cortex XSIAM Enterprise, or Cortex XSIAM Premium license.
Prerequisite
- Permissions: Requires View/Edit RBAC permissions for Data Management (under Configurations → Data Management), the same permissions used for Dataset Management, parsing rules, data model rules, and event forwarding.
- Minimum Ingestion: Requires a minimum of 50 GB/day for the Data Lake tier, provided the mandatory 100 GB/day Analytics tier minimum is met.
The Cortex Data Lake tier provides a cost-effective alternative for ingesting high-volume data that isn't required for real time security detection. While the Analytics tier is intended for real-time security and detection, the Cortex Data Lake tier allows you to maintain full visibility and searchability using Cortex Query Language (XQL) at a significantly lower cost.
Unified monitoring
Once data is collected into the Cortex Data Lake tier, it is automatically available on the Data Ingestion dashboard. To provide a unified view of your ingestion health, the dashboard displays a Data Lake Daily Consumption section positioned directly beside the Analytics Daily Consumption section. This allows you to monitor and compare ingestion rates across both ingestion tiers in real time.
Key capabilities and billing
The following capabilities are in-scope for the Cortex Data Lake tier. Pay attention to the ones that are billed using Compute Units (CU). Several capabilities that were previously free-of-charge now consume CU.
Note
Any "mixed tier" query (a query involving at least one Data Lake dataset) results in a full CU charge.
| Capability | Consumption Model | Charging Status |
|---|---|---|
| Dashboards & Reports | CU | Charged now |
| Playbooks and Automations | CU | Charged now |
| Public API (PAPI) | CU | Charged now |
| Queries & scheduled queries | CU | Charged now |
| Correlation rules & scheduled correlation rules | CU | Charging in the future |
| BIOCs | CU | Charging in the future |
| Retention (hot & cold) | <p>Calculated based on the standard Analytics tier retention rates.</p><p>Retention costs for Cortex Data Lake datasets follow the same pricing and licensing model as your existing Analytics tier data ingestion.</p> | Standard license |
| Egress (Event forwarding) | <p>Calculated based on the standard Analytics tier retention rates.</p><p>Event forwarding costs for Cortex Data Lake datasets follow the same pricing and licensing model as Analytics tier datasets.</p> | Standard license |
Tier comparison table
The following table highlights the differences in functionality between the Analytics Tier and the Cortex Data Lake Tier:
| Feature | Analytics Tier | Cortex Data Lake Tier |
|---|---|---|
| Pricing model | Standard | Significantly cheaper |
| Licensing requirement | Mandatory. A minimum Analytics license is required for all Cortex XSIAM tenants. | Optional add-on. Can be added to any tenant that meets the mandatory Analytics minimum. |
| Minimum ingestion | 100 GB / day | 50 GB / day |
| XDM normalization | Out-of-the-box and user-defined | X |
| XQL queries and scheduled queries | ✓ | ✓ |
| Correlation rules and scheduled correlation rules | ✓ | ✓ |
| Dashboards and reports | ✓ | ✓ |
| Retention (Hot/Cold) | ✓ | ✓ |
| Detections (Analytics) | ✓ | X* |
| Stitching and enrichments | ✓ | X* |
*Note: Currently, specific data sources ingested into the Cortex Data Lake tier are normalized into "stories" and receive analytics-like capabilities, including detections, stitching, and enrichments. Be aware that this is a temporary configuration and these capabilities are planned for removal from the Cortex Data Lake tier in a future update.
Important considerations
Keep the following in mind regarding data visibility, exclusions, and limitations:
- Excluded datasets: Fundamental datasets, such as Cortex Agent and Palo Alto Networks NGFW, are currently optimized for the Analytics tier and are excluded from the Cortex Data Lake tier.
- Dataset identification: For customers who have purchased the Data Lake SKU, a Tier column is added to the Dataset Management table to identify datasets as Analytics or Data lake.
-
Detection and stitching: Real-time Analytics (detections), stitching, and certain enrichments are currently out of scope for data in the Cortex Data Lake tier.
Note
Currently, specific data sources receive these capabilities temporarily; yet, be aware that these will be completely removed from the Cortex Data Lake tier in a future update.
- Reversibility: You can switch between tiers at any time. However, the configuration applies only to data ingested after the parsing rule is saved. Moving existing data from the Analytics tier to the Data Lake tier (or vice versa) is not supported.
- Configuration path: Currently, the Cortex Data Lake tier is configured exclusively using parsing rules.
License visibility
You can view details about your Cortex XSIAM licenses and retention add-ons in the user interface by selecting Settings → Cortex XSIAM License.
The Data Collection section is where you can view the specific daily GB ingestion limits allocated for both the Analytics and Data Lake tiers.
- Consolidated view: Displayed directly above the Data Collection text, the top-level GB count shows the sum of all GB types (Analytics and Data Lake).
- Data Collection breakdown: Located under the Data Collection text, you can select License Details to expand the view. This displays a row for each specific GB type, such as "100 GB Analytics" and "50 GB Data Lake".
How to configure a dataset for the Cortex Data Lake tier
You configure the Cortex Data Lake tier for ingestion by modifying the parsing rule for your target dataset. You achieve this by disabling the [INGEST] section that defines the dataset currently using the Analytics tier and enabling a new [INGEST] section to route that same data into a different dataset for the Cortex Data Lake tier. This process is managed through a pivot (right-click) option within the Parsing Rules editor that automatically generates the necessary rule logic.
-
Navigate to the parsing rules editor.
Select Settings → Configurations → Data Management → Parsing Rules, and open the Both tab.
-
Change tier to data lake.
Under Default rules, right-click the
[INGEST]rule for your target dataset, and select Change Tier to Data Lake.- Cortex XSIAM automatically generates the necessary rule logic by disabling the default rule and creating a new Data Lake rule in the User defined rules section.
- The parameter
tier=lakeis added. - An
_lake_rawsuffix is added to the target dataset name, such asmsft_azure_lake_raw.
The rule before selecting Change Tier to Data Lake:
[INGEST:vendor="Amazon", product="AWS", target_dataset="amazon_aws_raw", no_hit=drop]
The rule after selecting Change Tier to Data Lake:
[INGEST:vendor="Amazon", product="AWS", target_dataset="amazon_aws_lake_raw", no_hit=drop, tier=lake]
Note
You can always revert the rule back to use the Analytics tier by right-clicking the rule under Default rules and selecting Change Tier to Analytics. When you do this, the Data Lake rule is deleted from the User defined rules section and the default rule is enabled in the Default rules section.
-
Save your changes. Configurations are applied immediately to new data (processing may take several minutes). Existing data is not retroactively moved between tiers.
Broker VM
Set up a Broker VM to establish a secure connection in which you can route your endpoints, and collect and forward logs and files for analysis.
Set up and configure the Broker VM to create a secure connection for routing endpoints, collecting logs, and forwarding logs and files for analysis. Learn how to manage the Broker VM, and implement it within a high availability (HA) cluster setup.
What is the Broker VM?
The Palo Alto Networks Broker VM is a secured virtual machine, integrated with Cortex XSIAM, that bridges your network and Cortex XSIAM. By setting up the Broker VM, you establish a secure connection in which you can route your endpoints, collect logs, and forward logs and files for analysis.
Cortex XSIAM can leverage the Broker VM to run different services separately using the same Palo Alto Networks authentication. After you complete the initial setup, the Broker VM automatically receives updates and enhancements from Cortex XSIAM, providing you with new capabilities without having to install a new VM or manually update the existing VM.
Note
The Broker VM is a closed, hardened appliance. To maintain its security integrity and performance standards, third-party agents cannot be installed on the Broker VM.
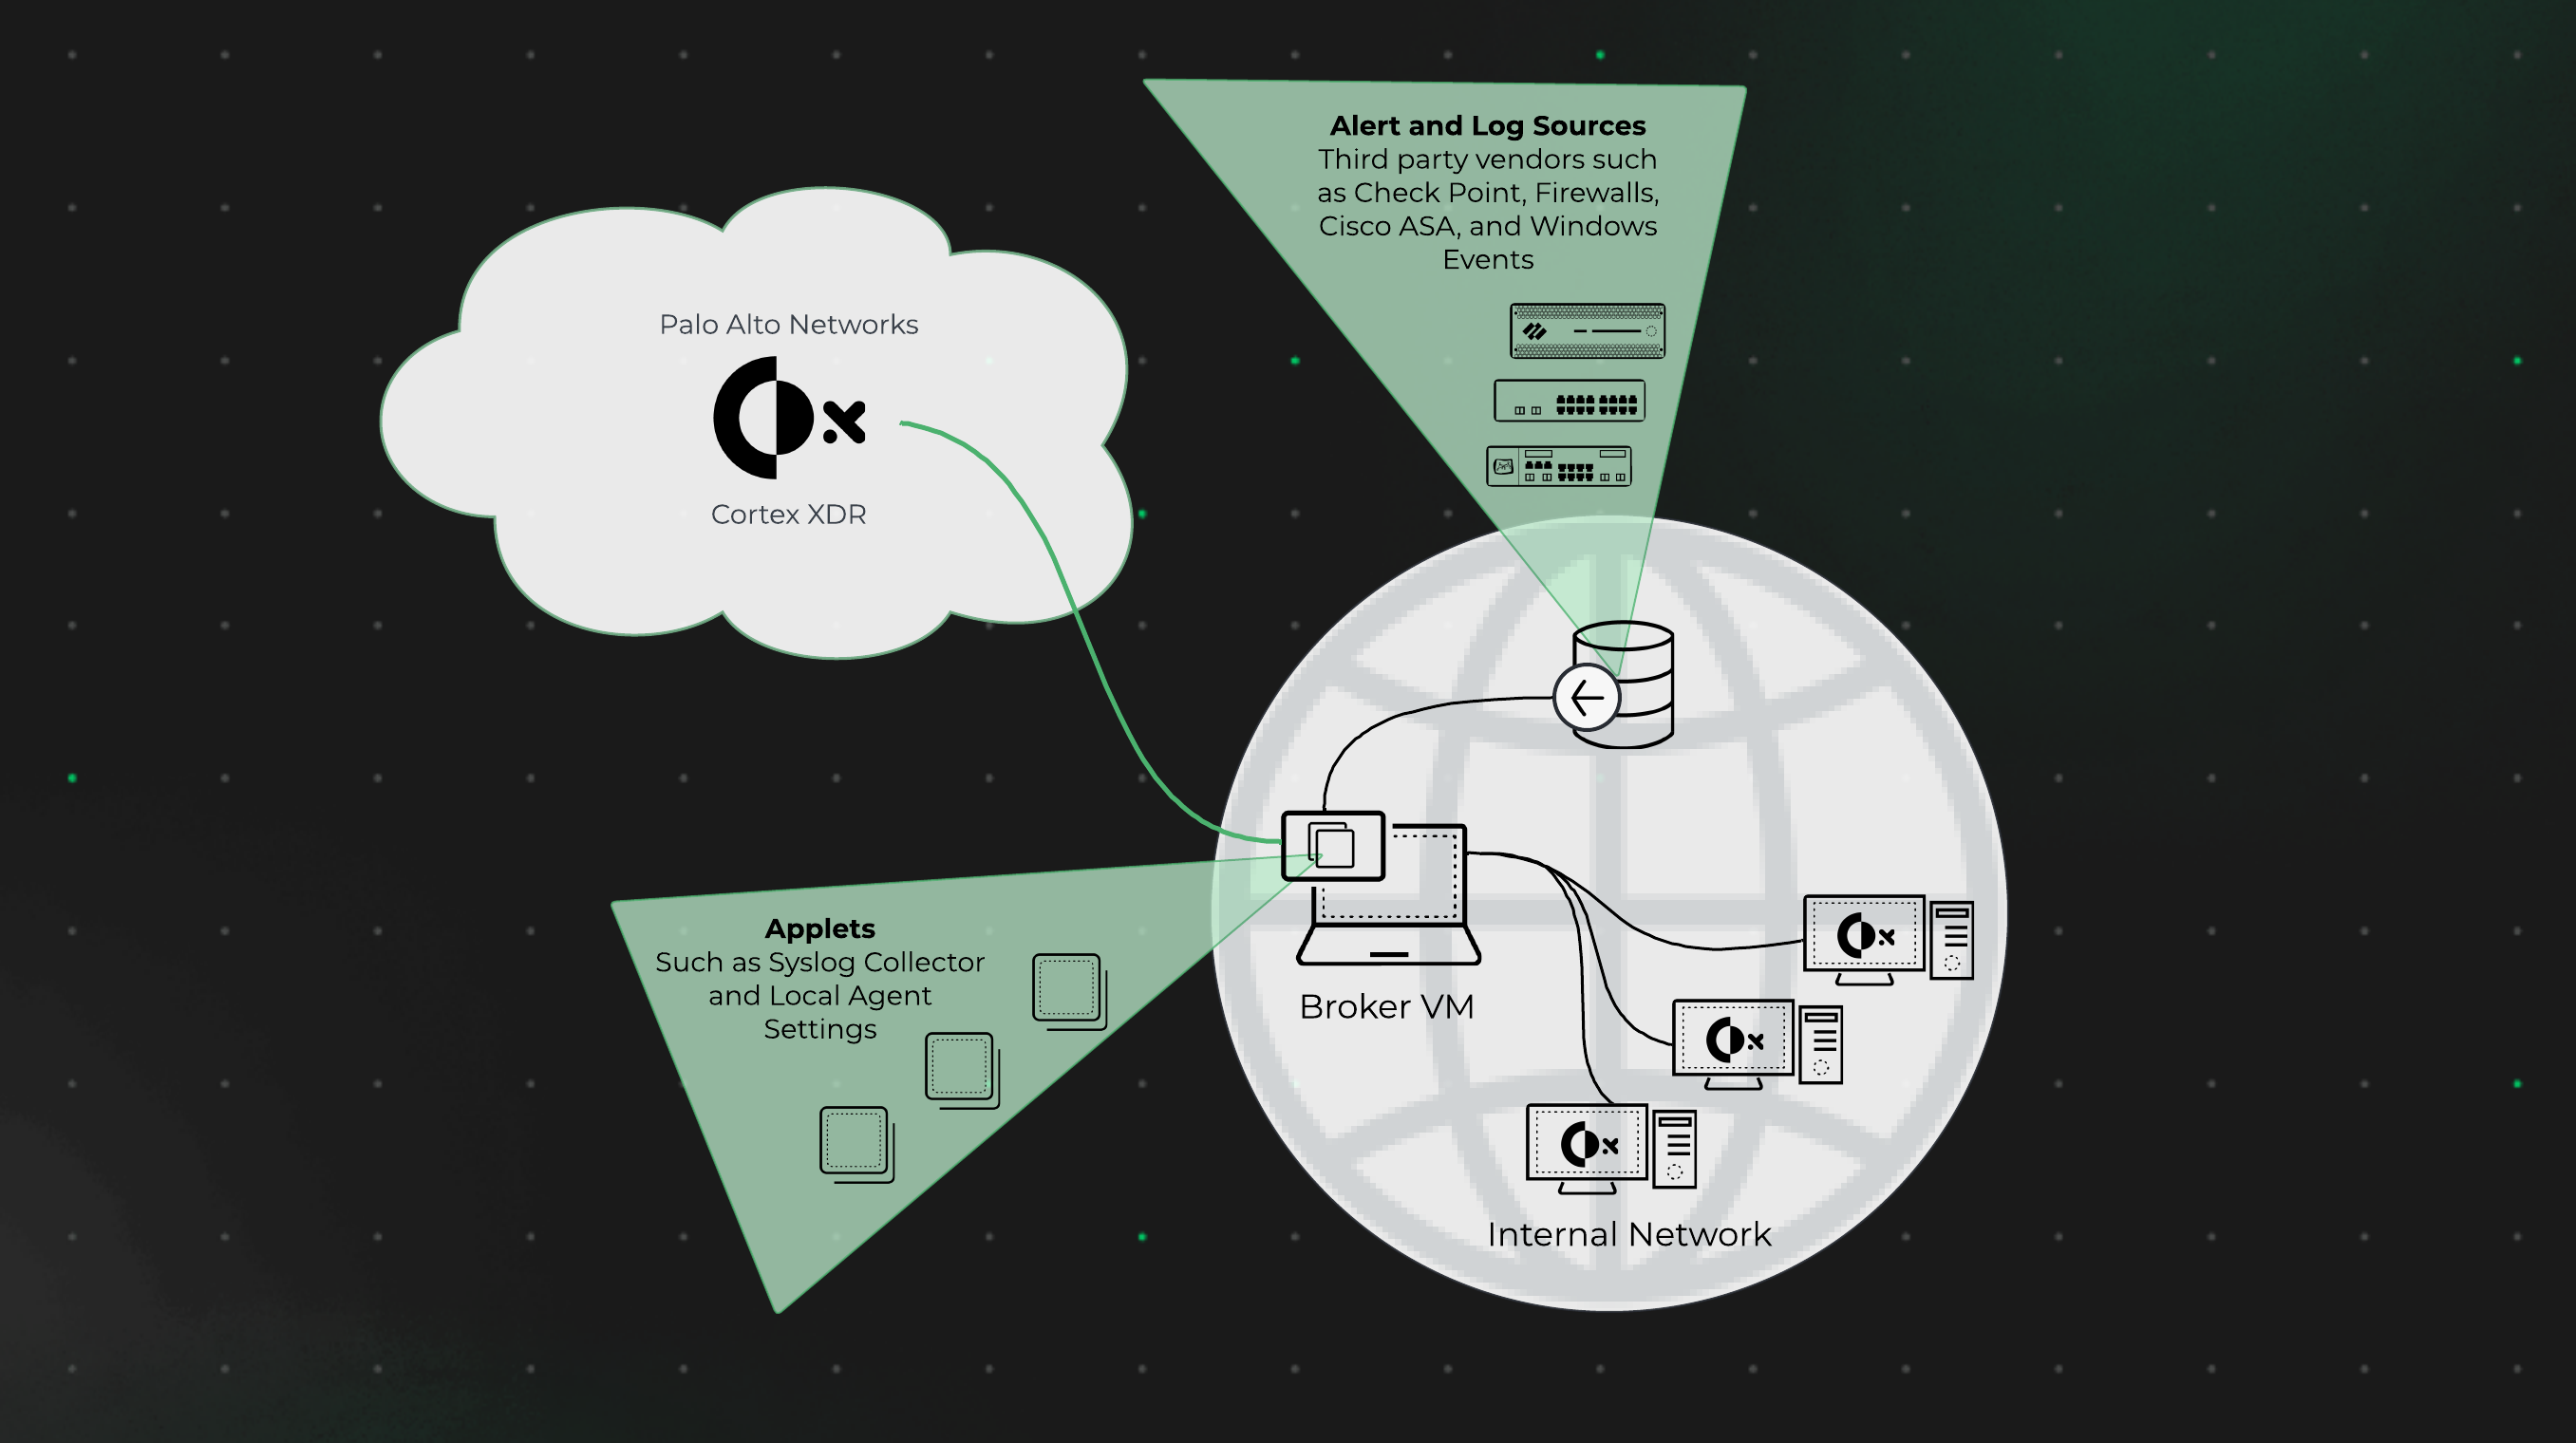
According to your Cortex XSIAM license, the following figure illustrates the different Broker VM features that could be available on your organization side:
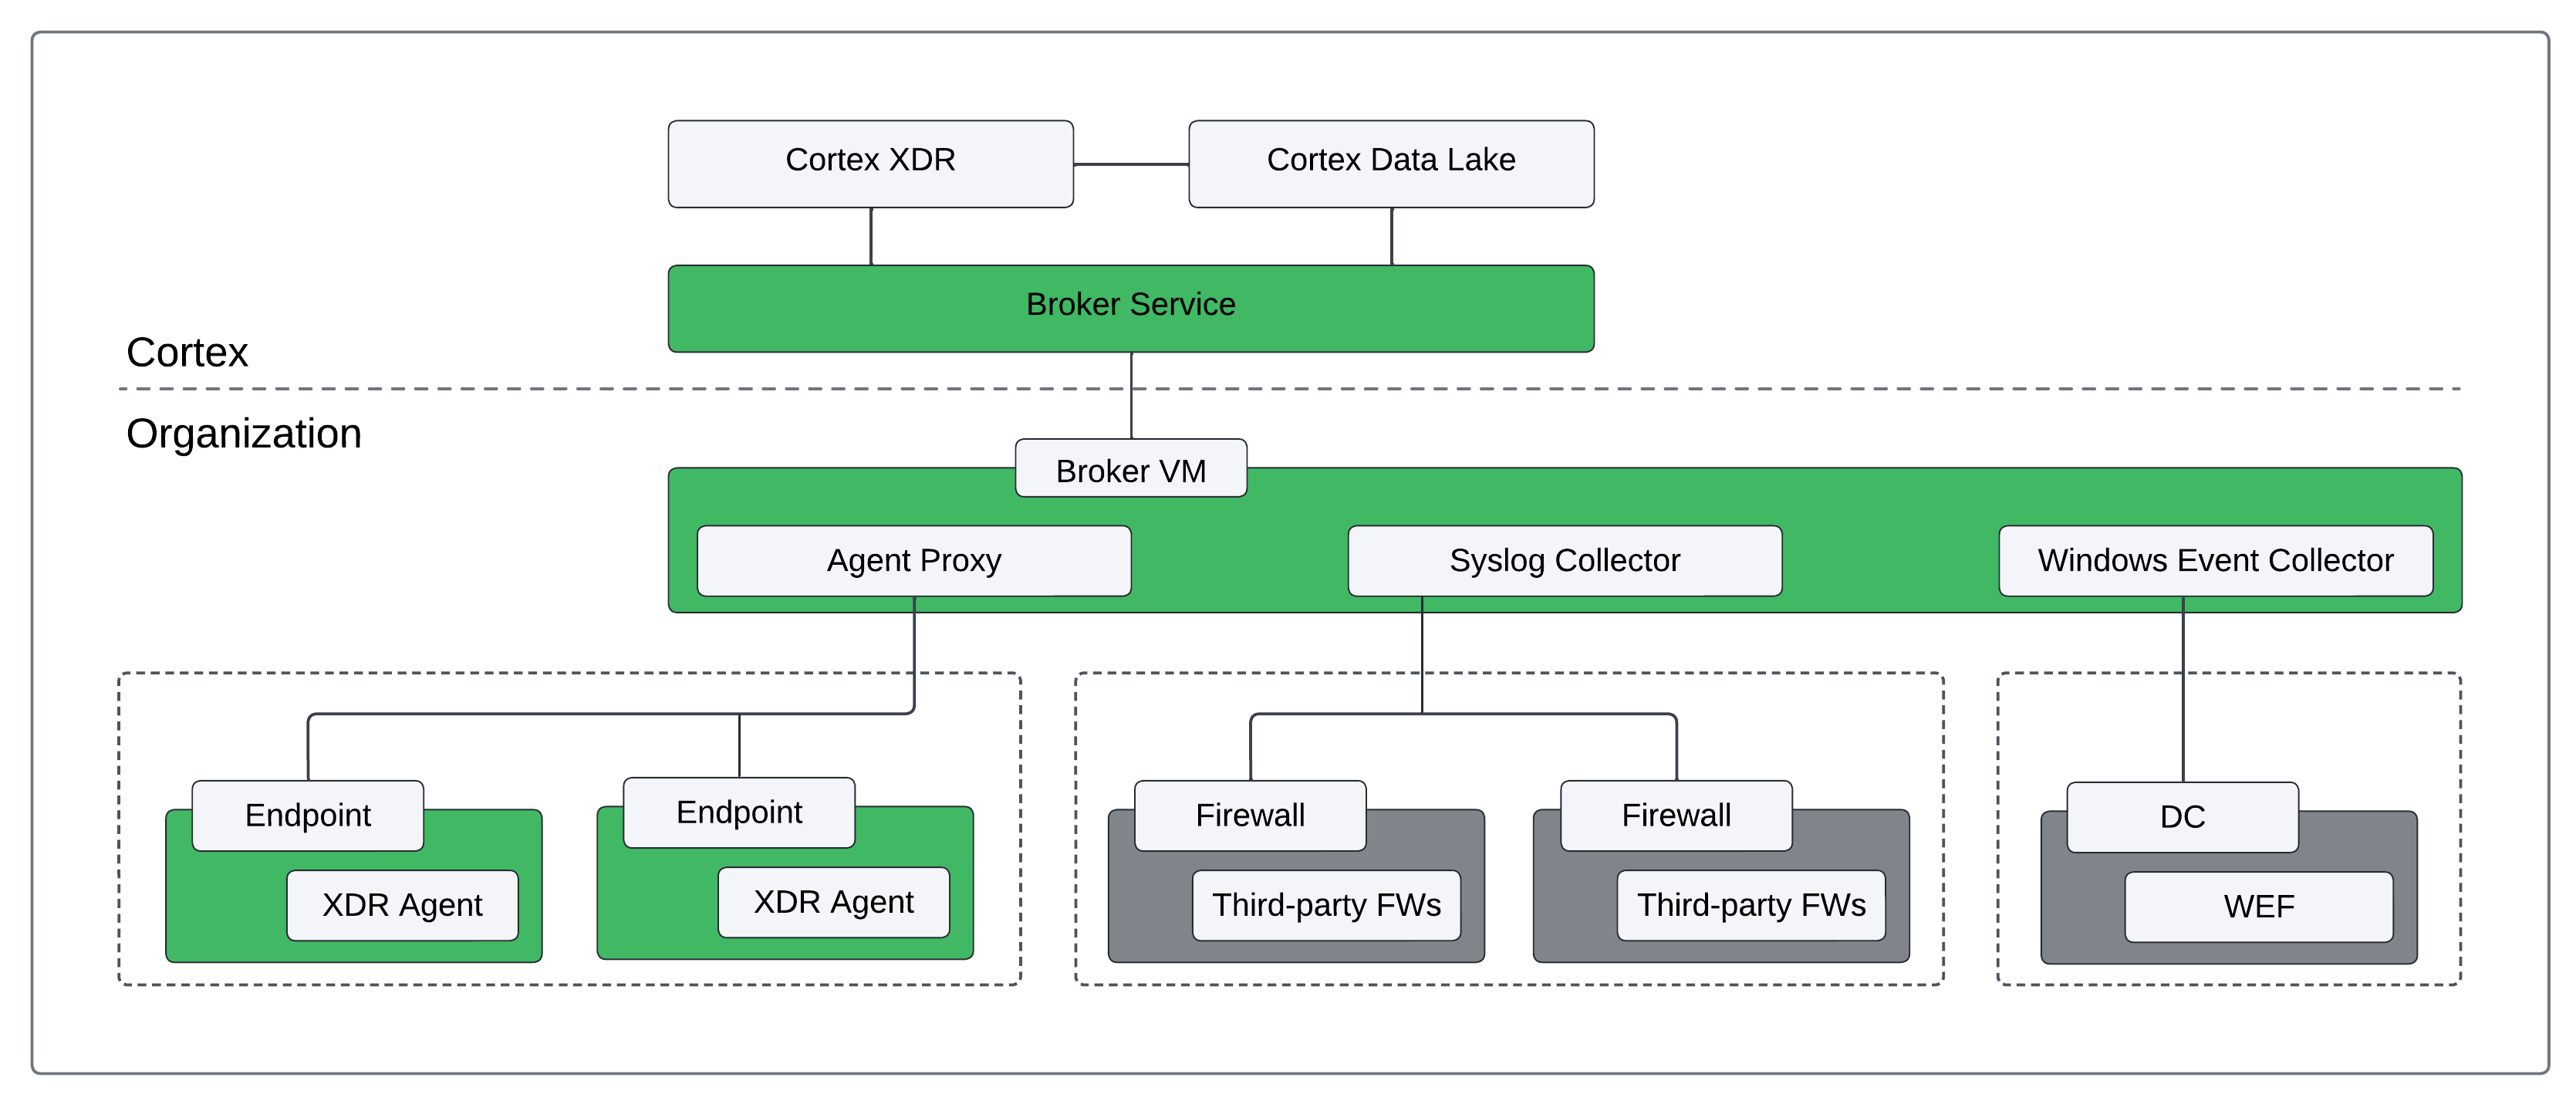
Set up and configure Broker VM
Learn more about how to set up and configure a Broker VM as a standalone broker or add the broker to a high availability (HA) cluster.
You can set up a standalone Broker VM or add a Broker VM to a High Availability (HA) cluster to prevent a single point of failure. For more information, see Broker VM High Availability Cluster.
To set up the Broker virtual machine (VM), you need to deploy an image created by Palo Alto Networks on your network or supported cloud infrastructure and activate the available applications. You can set up several Broker VMs for the same tenant to support larger environments. Ensure each environment matches the necessary requirements.
Requirements
Before you set up the Broker VM, verify you meet the following requirements:
Hardware
For standard installation, use a minimum of a 4-core processor, 8 GB RAM, and 512 GB disk.
- If you only intend to use the Broker VM for the agent proxy, you can use a 2-core processor.
- If you intend to use the Broker VM for the agent installer and content caching, you must use a minimum of an 8-core processor and increase the disk space allocated for data storage to 1024 GB. For more information, see Increase Broker VM storage allocated for data caching.
Note
The Broker VM comes with a 512 GB disk. Therefore, deploy the Broker VM with thin provisioning, meaning the hard disk can grow up to 512 GB but will do so only if needed.
Bandwidth
Bandwidth is higher than 10 mbit/s.
When the Broker VM is collecting data, the optimal outgoing bandwidth into the Cortex XSIAM server should be about 25% of the incoming data traffic into the Broker VM applets.
Important
There can be instances in which the Broker VM requires up to 50% of the incoming bandwidth as outgoing. Such instances can be, network instability between the Broker VM and Cortex XSIAM, or data that is being collected, but not well compressed.
Virtual machine compatibility
Before downloading, ensure that your virtual machine (VM) is compatible with one of the options below. To download the image, select Settings → Configurations → Data Broker → Broker VMs, click Add Broker, and select the applicable image you want to install:
| Infrastructure | Image Type | Broker Image Installation |
|---|---|---|
| Alibaba Cloud | QCOW2 | Set up Broker VM on Alibaba Cloud |
| Amazon Web Services (AWS) | VMDK | Set up Broker VM on Amazon Web Services |
| Google Cloud Platform | VMDK | Set up Broker VM on Google Cloud Platform (GCP) |
| KVM | QCOW2 | Set up Broker VM on KVM using Ubuntu |
| Microsoft Azure | VHD (Azure) | Set up Broker VM on Microsoft Azure |
| Microsoft Hyper-V 2012 | VHD | Hyper-V 2012 or later Set up Broker VM on Microsoft Hyper-V |
| Nutanix Hypervisor | QCOW2 | Nutanix AHV 10.3 or later Set up Broker VM on Nutanix Hypervisor |
| VMware ESXi | OVA | VMware ESXi 6.5 or later Set up Broker VM on VMware ESXi using vSphere Client |
Communication between services and applications
Enable communication between the Broker Service, and other Palo Alto Networks services and applications.
Important
The internal network for the Broker VM must be unique and reserved. Other devices should not use the same IP as the Broker VM internal network as it can lead to communication issues with the Broker VM.
| FQDN, Protocol, and Port | Description |
|---|---|
<p>(Default)</p><ul><li>time.google.com</li><li>pool.ntp.org</li></ul><p>UDP port 123</p> |
Broker's NTP server used for broker registration and communication encryption. The Broker VM provides default servers you can use, or you can define an NTP server of your choice. |
<p>br-<XDR tenant>.xdr.<region>.paloaltonetworks.com</p><p>HTTPS over TCP port 443</p> |
Broker Service server depending on the region of your deployment, such as us or eu. |
distributions.traps.paloaltonetworks.com HTTPS over TCP port 443 |
Information needed to communicate with your Cortex XSIAM tenant. Used by tenants deployed in all regions. |
br-<xdr-tenant>.xdr.federal.paloaltonetworks.comHTTPS over TCP port 443 |
Broker Service server for Federal (US Government) deployment. |
<p>distributions-prod-fed.traps.paloaltonetworks.com</p><p>HTTPS over TCP port 443</p> |
Used by tenants with Federal (US Government) deployment |
From Broker VM version 19.x.x and later, you can navigate to the following URL to open the Broker VM web console: https://<broker_vm_ip_address>.:4443 HTTPS over TCP port 4443 |
Broker VM web console |
Note
When DHCP is not enabled in your network and there isn't an IP address for your Broker VM, configure the Broker VM with a static IP using the serial console menu.
Enable access to Cortex XSIAM
Enable access to Cortex XSIAM from the Broker VM to allow communication between agents and collectors and Cortex XSIAM. The Broker VM communicates with the Cortex XSIAM tenant with TLS 1.2 (or higher, if that applies).
For more information on enabling access to Cortex XSIAM, see Enable access to required PANW resources.
Important
If you use SSL decryption in your firewalls and proxies, see the Understanding CA certificate functionality in Broker VM deployments section below. In addition, verify that the proxies used support HTTP/2, gRPC-specific headers, and HTTP/2 trailers, and the inspection policies support gRPC traffic. Any devices that you use with this configuration should also support these standards.
When adding a CA certificate to the broker is not possible, ensure that you’ve added the Broker Service FQDNs to the SSL Decryption Exclusion list on your firewalls. For more information on adding a trusted self-signed certificate authority, see Update the Trusted CA Certificate for the Broker VM in Task 1. Configure the Broker VM settings.
Understanding CA certificate functionality in Broker VM deployments
The Broker VM utilizes a CA certificate to establish trust with intermediary network devices, such as firewalls performing SSL/TLS decryption, positioned between the Broker VM and the tenant environment. Failure of the Broker VM to validate the certificate presented by an intermediate network component results in the termination of the SSL/TLS connection.
This CA certificate is optional to configure depending on your system configurations and helps provide more flexibility in securing communications between the Broker VM and the tenant according to your preferences and network topology. Specifically, it can help facilitate all communication between the Broker VM and tenant, such as the following:
- Broker VM configuration: Secure transmission of configuration parameters.
- Broker VM upgrades: Authenticated delivery and execution of upgrade packages.
- Metric Uploads: Encrypted and authenticated transfer of operational metrics to the tenant.
Note
- When configuring a Local Agent Settings applet with installer and content caching, you need to configure an SSL certificate for the Broker VM as explained in the task below. For more information on specific requirements for the Local Agent Settings applet, see Activate Local Agent Settings.
- Keep in mind that several Broker VM applets, such as the Syslog Collector and Kafka Collector, have their own dedicated CA certificate bundle.
Initial Setup
Perform the following procedures in the order listed below.
Note
When a Broker VM is disconnected for more than 30 days, it will have to go through a re-registration process.
Task 1. Generate a token for your broker
- Select Settings → Configurations → Data Broker → Broker VMs.
- Click Add Broker → Generate Token, and copy to your clipboard. The token is valid for 24 hours. A new token is generated each time you select Generate Token. You'll paste this token after configuring settings and the Broker VM is registered in Task 2. Register your Broker VM.
Task 2. Open the Broker VM URL
Depending on the Broker VM version, navigate to either of the following URLs:
- From Broker VM version 19.x.x and later:
https://<broker_vm_ip_address>.:4443 - From Broker VM version 18.x.x and earlier:
https://<broker_vm_ip_address>/
Note
When DHCP is not enabled in your network and there isn't an IP address for your Broker VM, configure the Broker VM with a static IP using the serial console menu.
Task 3. Log in and set a new password
Log in with the default password !nitialPassw0rd, and then define your own unique password. The password must contain a minimum of twelve characters, contain letters and numbers, and at least one capital letter and one special character.
How to configure Broker VM settings
Perform the following procedures in the order listed below.
Task 1. Configure the Broker VM settings
- Define the network interfaces settings. Review the pre-configured Name, IP address, and MAC Address, and select the Address Allocation: DHCP (default) or Static. If you choose Static, define the static IP address, Netmask, Default Gateway, and DNS Server settings, and then save your configurations.
Important
When configuring more than one network interface, ensure that only one Default Gateway is defined. The rest must be set to 0.0.0.0, which configures them as undefined. In addition, we recommend assigning each network interface to a different subnet, as oppose to configuring two interfaces on the same subnet which can potentially cause unexpected behavior. You can also specify which of the network interfaces is designated as the Admin and can be used to access the Broker VM web interface. Only one interface can be assigned for this purpose from all of the available network interfaces on the Broker VM, and the rest should be set to Disable.
- (Optional) Set the internal network settings (requires Broker VM 14.0.42 and later). Specify a network subnet to avoid the Broker VM dockers colliding with your internal network. By default, the Network Subnet is set to
172.17.0.1/16.
Important
Internal IP must be:
- Formatted as
prefix/mask, for example192.0.2.1/24. - Must be within
/8to/24range. - Cannot be configured to end with a zero.
For Broker VM version 9.0 and earlier, Cortex XSIAM will only accept 172.17.0.0/16.
-
(Optional) Configure a proxy server address and other related details to route Broker VM communication.
- Select the proxy Type as HTTP, SOCKS4, or SOCKS5. For any proxy selected, you must ensure the proxy supports HTTP/2, gRPC-specific headers, and HTTP/2 trailers, and the inspection policies support gRPC traffic. Any devices that you use with this configuration should also support these standards.
Note
You can configure another Broker VM as a proxy server for this Broker VM by selecting the HTTP type. When selecting HTTP to route Broker VM communication, you need to add the IP Address and Port number (set when activating the Agent Proxy) for another Broker VM registered in your tenant. This designates the other Broker VM as a proxy for this Broker VM.
- Specify the proxy Address (IP or FQDN), Port, and an optional User and Password. Select the pencil icon to specify the password. Avoid using special characters in the proxy username and password.
- Save your configurations.
- (Optional) Configure your NTP servers (requires Broker VM 8.0 and later). Specify the required server addresses using the FQDN or IP address of the server.
-
(Optional) Allow SSH connections to the Broker VM (Requires Broker VM 8.0 and later).
Important
- We strongly recommend disabling SSH connectivity when it's not being used. Therefore, activate SSH connectivity when it's needed and disable it right afterwards.
- When generating a new SSH key ensure to avoid embedding the domain-style username, by not using any backslashes (
\) in the comment field, to ensure the SSH key passes validation.
Enable or disable SSH connections to the Broker VM. SSH access is authenticated using a public key, provided by the user. Using a public key grants remote access to colleagues and Cortex XSIAM support who need the private key. You must have Instance Administrator role permissions to configure SSH access.\
\
To enable connection, generate an RSA Key Pair, and enter the public key in the SSH Public Key section. Once one SSH public key is added, you can Add Another. When you are finished, Save your configuration.\
\
When using PuTTYgen to create your public and private key pairs, you need to copy the public key generated in the Public key for pasting into OpenSSH authorized_keys file box, and paste it in the Broker VM SSH Public Key section as explained above. This public key is only available when the PuTTYgen console is open after the public key is generated. If you close the PuTTYgen console before pasting the public key, you will need to generate a new public key.\
\
When you SSH the Broker VM using PuTTY or a command prompt, you need to use theadminusername.\
For example:ssh -i [/path/to/private.key] admin@[broker_vm_address] - (Optional) Update the SSL Server certificates for the Broker VM. Upload your signed server certificate and key to establish a validated secure SSL connection between your endpoints and the Broker VM. Ensure the Private Key is uploaded in an unencrypted format. When you configure the server certificate and the key files in the Broker VM, Cortex XSIAM automatically updates them in the tenant UI. Cortex XSIAM validates that the certificate and key match, but does not validate the Certificate Authority (CA).
Note
The Palo Alto Networks Broker VM supports only strong cipher SHA256-based certificates. MD5/SHA1-based certificates are not supported.
- Update the Trusted CA Certificate for the Broker VM. Upload your Certificate Authority (CA) bundle file associated with the public TLS certificates belonging to the applicable firewalls, and click Save. These applicable firewalls include SSL/TLS decryption. For example, when configuring Palo Alto Networks NGFW to decrypt SSL using a self-signed certificate, you need to ensure the Broker VM can validate a self-signed CA by uploading the
cert_ssl-decrypt.crtfile on the Broker VM.
Note
If adding a CA certificate to the Broker VM is not possible, ensure that you’ve added the Broker Service FQDNs to the SSL Decryption Exclusion list on your firewalls. See Enable Access to Cortex XSIAM.
- (Optional) Configure the advanced settings of the Broker VM.
- Only use recommended cipher suites: Select this to use a limited set of strong cipher suites for Broker VM communications. You must enable this option to comply with Spain's Esquema Nacional de Seguridad (ENS) National Security Framework. It is critical that you configure this option before you register the Broker VM with a tenant for compliance reasons.
- Enforce TLS 1.3: Select this to enforce the TLS 1.3 cryptographic protocol for communication between the Broker VM and the tenant. This setting is often required to meet specific regional security standards. When this option is unchecked, the broker continues to use the default TLS 1.2 (or higher, if applicable) connection protocols. This option is unchecked by default for new brokers.
- Allow legacy SSL renegotiation: Select this to allow connections to servers still using legacy SSL renegotiation. This option is unchecked by default.
- Accept certificates without AKID: Select this to accept certificates that do not contain the Authority Key Identifier (AKID) extension. This option is unchecked by default.
- (Optional) Collect and Generate New Logs (Requires Broker VM 8.0 and later). Your Cortex XSIAM logs will download automatically after approximately 30 seconds.
Task 2. Register your Broker VM
Register and enter your unique Token, created in the Broker VMs page. This can take up to 30 seconds.
After a successful registration, Cortex XSIAM displays a notification.
You are directed to Settings → Configurations → Data Broker → Broker VMs. The Broker VMs page displays your Broker VM details and allows you to edit the defined configurations.
Broker VM image installations
Learn more about the Broker VM image types available that are compatible with your virtual machine (VM).
Before downloading, ensure that your virtual machine (VM) is compatible with one of the options below. To download the image, select Settings → Configurations → Data Broker → Broker VMs, click Add Broker, and select the applicable image you want to install:
| Infrastructure | Image Type | Broker Image Installation |
|---|---|---|
| Alibaba Cloud | QCOW2 | Set up Broker VM on Alibaba Cloud |
| Amazon Web Services (AWS) | VMDK | Set up Broker VM on Amazon Web Services |
| Google Cloud Platform | VMDK | Set up Broker VM on Google Cloud Platform (GCP) |
| KVM | QCOW2 | Set up Broker VM on KVM using Ubuntu |
| Microsoft Azure | VHD (Azure) | Set up Broker VM on Microsoft Azure |
| Microsoft Hyper-V 2012 | VHD | Hyper-V 2012 or later Set up Broker VM on Microsoft Hyper-V |
| Nutanix Hypervisor | QCOW2 | Nutanix AHV 10.3 or later Set up Broker VM on Nutanix Hypervisor |
| VMware ESXi | OVA | VMware ESXi 6.5 or later Set up Broker VM on VMware ESXi using vSphere Client |
Set up Broker VM on Alibaba Cloud
Learn how to set up your Cortex XSIAM Broker virtual machine (VM) on Alibaba Cloud.
After you download your Cortex XSIAM Broker virtual machine (VM) QCOW2 image, you need to upload it to Alibaba Cloud. Since the image file is larger than 5G, you need to download the ossutil utility file provided by Alibaba Cloud to upload the image.
Prerequisite
Download a Cortex XSIAM Broker VM QCOW2 image. For more information, see the virtual machine compatibility requirements in Set up and configure Broker VM.
Perform the following procedures in the order listed below.
Task 1. Download the ossutil utility file provided by Alibaba Cloud
The download is dependent on the operating system and infrastructure you are using.
- Alibaba Cloud supports using the following operating systems for the utility file: Windows, Linux, and macOS.
- Supported architectures: x86 (32-bit and 64-bit) and ARM (32-bit and 64-bit)
For more information on downloading the utility, see the Alibaba Cloud documentation.
Task 2. Upload the image file to Alibaba Cloud using the utility file you downloaded
The command is dependent on the operating system and architecture you are using. Below are a few examples of the commands to use based on the different operating systems and architectures, which you may need to modify based on your system requirements.
Format ./ossutil64 cp Downloads/ oss:/// Example ./ossutil64 cp Downloads/QCOW2_broker-vm-14.0.1.qcow2 oss://kvm-images-qcow2/Cortex XSIAM -broker-vm-14.0.1.qcow2
Format ./ossutilmac64 cp Downloads/<name of Broker VM QCOW2 image oss:/// Example ./ossutilmac64 cp Downloads/QCOW2_broker-vm-14.0.1.qcow2 oss://kvm-images-qcow2/Cortex XSIAM -broker-vm-14.0.1.qcow2
Format for 64-bit D:\ossutil>ossutil64.exe cp Downloads\<name of Broker VM QCOW2 image> oss:/// Example for 64-bit D:\ossutil>ossutil64.exe cp Downloads\QCOW2_broker-vm-14.0.1.qcow2 oss://kvm-images-qcow2/Cortex XSIAM -broker-vm-14.0.1.qcow2
Note
For Linux and Windows uploads, you can use Alibaba Cloud’s graphical management tool called ossbrowser.
Task 3. Create the image file in the Alibaba Cloud format
- Open the Alibaba Cloud console.
- Select Hamburger menu → Object Storage Service → , where the is the directory you configured when uploading the image. For example, in the step above the used in the examples provided is kvm-images-qcow2.
Note
The Object Storage Service must be created in the same Region as the image of the virtual machine.
- From the list of images displayed, find the row for the Broker VM QCOW2 image that you uploaded, and click View Details.
- In the URL field of the View Details right-pane displayed, copy the internal link for the image in Alibaba cloud. The URL that you copy ends with .com and you should not include any of the text displayed after this.
- Select Hamburger menu → Elastic Compute Service → Instances & Images → Images.
- In the Import Images area on the Images page, click Import Images.
- In the Import Images window, set the following parameters:
- OSS Object Address: This field is a combination of the internal link that you copied for the Broker VM image and the file name for the uploaded image, using this format /. Paste the internal link for the Broker VM QCOW2 image in Alibaba Cloud that you copied, and add the following text after the .com: /.
- Image Name: Specify a name for the image.
- Operating System/Platform: Leave Linux configured and change CentOS to Ubuntu.
- System Architecture: Leave the default x86_64 selected.
- Leave the rest of the fields as defined by the default or change them according to your system requirements.
- Click OK. A notification is displayed indicating that image was imported successfully. Once the Status for the imported image in the Images page changes to Available, you will know the process is complete. This can take a few minutes.
Task 4. Create a new VM in Alibaba Cloud
- Select Hamburger menu → Elastic Compute Service → Instances & Images → Instances.
- Create Instance to open a wizard to define the VM machine.
- Define the Basic Configurations screen by setting these parameters:
- Billing Method: Select the applicable billing method according to your system requirements.
- Region: Ensure the Region selected is the same as the OSS Object Address.
- Instance Type: Set these settings according to your system requirements.
- Selected Instance Type Quantity: Set these settings according to your system requirements.
- Image: Select Custom Image, and in the field select the image that you imported to Alibaba Cloud.
- Storage (Optional): Set these settings according to your system requirements.
- Snapshot (Optional): Set these settings according to your system requirements.
- Click Next.
- Define the Networking screen by setting these parameters:
- Network Type: Select the applicable Network Type and update the field according to your system configuration.
- Public IP Address (Optional): Enable the instance to access the public network.
- Security Group: You must select a Security Group for setting network access controls for the instance. Ensure that port 22 and port 443 are allowed in the security group rules to access the Broker VM.
- Elastic Network Interface (Optional): Add an ENI according to you system requirements.
- Click Next.
- Define the System Configurations screen by setting these parameters:
- Logon Credentials: Select Inherit Password From Image.
- Instance Name: You can either leave the default instance name or specify a new name for the VM instance.
- Description (Optional): Specify a description for the VM instance.
- The rest of the fields are optional to configure.
- Click Next.
- (Optional) Define the Grouping screen according to your system requirements.
- Click Next.
- Review the Preview screen settings, select ECS Terms of Service and Product Terms of Service, and click Create Instance. A dialog box is displayed indicating that the VM instance has been created. Click Console to bring you back to the Instances page, where you can see the IP Address listed to connect to the VM instance.
Task 5. Reboot the Broker VM
Reboot the Broker VM before logging in for the first time.
Set up Broker VM on Amazon Web Services
Learn how to set up your Cortex XSIAM Broker virtual machine (VM) on AWS.
After you download your Cortex XSIAM Broker VMDK image, you can convert the image to an Amazon Web Services (AWS) Amazon Machine Image (AMI) using the AWS CLI. The task below explains how to do this on Linux.
Prerequisite
- Download a Cortex XSIAM Broker VM VMDK image. For more information, see the virtual machine compatibility requirements in Set up and configure Broker VM.
- You need to set up an AWS VM Import role (
vmimport) before running theimport-snapshotCLI command. If the rolevmimportdoes not exist or does not have the required permissions, you can create it using the steps below or use a different role with the necessary permissions. You'll need an Administrator role or the required permissions to create or modify this role. For more information on setting up an AWS VM Import role and the permissions required, see Required service role.
To convert the image to AWS, perform the following procedures in the order listed below.
Task 1. Create an IAM User with Proper Permissions
You need to log in using an AWS Identity and Access Management (IAM) user, where the permissions are defined in the IAM policy to use the virtual machine Import and export.
- Log in to the AWS IAM Console, and in the navigation pane, select Access Management → Users, and click Create user.
- Under User name, specify a username, and click Next.
- In the Permissions options section, select Attach Existing Policies directly, and then in the Permissions policies section, click Create policy.
- In the JSON tab, copy and paste the following syntax to define the policy:
{ "Version": "2012-10-17", "Statement": [ { "Effect": "Allow", "Action": [ "s3:GetBucketLocation", "s3:GetObject", "s3:PutObject" ], "Resource": ["arn:aws:s3:::mys3bucket","arn:aws:s3:::mys3bucket/_"] }, { "Effect": "Allow", "Action": [ "ec2:CancelConversionTask", "ec2:CancelExportTask", "ec2:CreateImage", "ec2:CreateInstanceExportTask", "ec2:CreateTags", "ec2:DescribeConversionTasks", "ec2:DescribeExportTasks", "ec2:DescribeExportImageTasks", "ec2:DescribeImages", "ec2:DescribeInstanceStatus", "ec2:DescribeInstances", "ec2:DescribeSnapshots", "ec2:DescribeTags", "ec2:ExportImage", "ec2:ImportInstance", "ec2:ImportVolume", "ec2:StartInstances", "ec2:StopInstances", "ec2:TerminateInstances", "ec2:ImportImage", "ec2:ImportSnapshot", "ec2:DescribeImportImageTasks", "ec2:CancelImportTask" ], "Resource": "_" } ] }
- Click Next.
- In the Policy details section, under Policy name, specify a name for the policy, and click Create policy.
- Select the policy that you created above based on the syntax you added, and click Next.
- Complete the user creation process by clicking Create user.
Task 2. Create access credentials
- After confirmation that the user is created, select the user that you created.
- Open the Security credentials tab, scroll down to the Access key section, and click Create access key.
- In Step 1 Access key best practices & alternatives perform the following:
- Select the Command Line Interface (CLI) option.
- Select the Confirmation checkbox.
- Click Next.
- (Optional) In Step 2 Set description tag, you can enter a description for the access key, or leave it empty, and then click Create access key.
- In Step 3 Retrieve access keys, copy the following user information, which you will need later:
- User name
- Access key ID
- Secret access key
Task 3. Setup AWS CLI
You can run the AWS CLI commands using one of the two options below.
Option 1: AWS CloudShell (Recommended - No Installation)
AWS CloudShell is a browser-based shell that is pre-authenticated with your Console credentials.
- Log in to the AWS Management Console.
- Select the Region where your S3 bucket is located.
- Click the CloudShell icon (
Option 2: External Terminal
Install the AWS CLI and configure it with the IAM user that you created.
- Login to the server with admin privilege and install the AWS CLI.
# sudo bash # apt update # apt install awscli
- Run the following command to configure the AWS CLI:
# aws configure
You need to specify the proper configurations for the following:
- AWS Access Key ID: The Access key ID for the IAM user you created.
- AWS Secret Access Key: The Secret access key for the IAM user you created.
- Default region name: The Region where you've defined the IAM user you created. You are now ready to implement commands in the AWS CLI.
Task 4. Create an AMI Image
To create an AMI image, you need to download Broker VM VMDK file from the Cortex XSIAM Web Console, import this file to your S3 bucket, and then convert the VMDK file to an AMI Image.
- In the Cortex XSIAM Web Console , select Settings → Configurations → Data Broker → Broker VMs → Add Broker → VMDK.
- Download the VMDK file, such as
broker-vm-<broker-vm-version>.vmdk, to your computer. - Navigate and log in to your AWS account.
- In the AWS Console, select All services → Storage → S3.
- On the Buckets page, click Create bucket to upload your Broker VM image to this bucket. Specify a unique name for the S3 bucket and use the default configurations.
- Upload the Broker VM VMDK you downloaded from Cortex XSIAM to the AWS S3 bucket using one of the following methods:
- Using the AWS Management Console: On the Buckets page, select your bucket, and click Upload to upload the VMDK file.
-
Using an external terminal: Run
# aws s3 cp \~/\<path/to/broker-vm-version.vmdk> s3://\<your\_bucket/broker-vm-version.vmdk>
- Prepare the following configurations files on your hard drive.
Create configuration.json
- In a terminal, create the file:
# vi configuration.json
- Copy the following content into the file. Replace
<your_bucket>with the bucket name. Replace<broker-vm-version.vmdk>with the VMDK filename.
{ "Description":"Cortex XSIAM Broker VM ", "Format":"vmdk", "UserBucket":{ "S3Bucket":"\<your\_bucket>", "S3Key":"\<broker-vm-version.vmdk>" } }
Create trust-policy.json
- In a terminal, create the file:
# vi trust-policy.json
- Copy the following content into the file.
{ "Version": "2012-10-17", "Statement": [ { "Effect": "Allow", "Principal": { "Service": "vmie.amazonaws.com" }, "Action": "sts:AssumeRole", "Condition": { "StringEquals":{ "sts:Externalid": "vmimport" } } } ] }
Create role-policy.json
- In a terminal, create the file:
# vi role-policy.json
- Copy the following content into the file. Replace the bucket placeholders with your bucket name. Use
*to allow access to all S3 buckets.
{ "Version":"2012-10-17", "Statement":[ { "Effect": "Allow", "Action": [ "s3:GetBucketLocation", "s3:GetObject", "s3:ListBucket" ], "Resource": [ "arn:aws:s3:::", "arn:aws:s3:::/_" ] }, { "Effect": "Allow", "Action": [ "s3:GetBucketLocation", "s3:GetObject", "s3:ListBucket", "s3:PutObject", "s3:GetBucketAcl" ], "Resource": [ "arn:aws:s3:::", "arn:aws:s3:::/_" ] }, { "Effect": "Allow", "Action": [ "ec2:ModifySnapshotAttribute", "ec2:CopySnapshot", "ec2:RegisterImage", "ec2:Describe*", "ec2:ImportSnapshot", "ec2:DescribeImportSnapshotTasks" ], "Resource": "*" } ] }
- Use the
create-rolecommand to create a role namedvmimportand grant VM import and export permissions using thetrust-policy.jsonfile.
# aws iam create-role --role-name vmimport --assume-role-policy-document "file://trust-policy.json"
- Use the
put-role-policycommand to attach the policy to thevmimportrole created above.
# aws iam put-role-policy --role-name vmimport --policy-name vmimport --policy-document "file:// role-policy.json"
- Create a snapshot from the VMDK file. Run the following command to start the import process:
# aws ec2 import-snapshot --description "\<Cortex XSIAM Broker VM " --disk-container "file://configuration.json"
To track the progress, use the task id value from the output and run:
# aws ec2 describe-import-snapshot-tasks --import-task-ids import-snap-
Completed status output:
{ "ImportSnapshotTasks": [ { "Description": "Broker VM snapshot import", "ImportTaskId": "import-snap-12346b69617c1395t", "SnapshotTaskDetail": { ... "DiskImageSize": 2976817664.0, "Format": "vmdk", "SnapshotId": "snap-1234567890", "Status": "completed", "UserBucket": { "S3Bucket": "broker-vm", "S3Key": "broker-vm-.vmdk" } }, "Tags": [] } ] }
- Register the AMI from the snapshot. Once the
describe-import-snapshot-taskscommand shows a status ofcompleted, a new Snapshot has been created in your account. You must now register this snapshot as an AMI.- Locate the snapshot ID. In the output of your completed task, find the
SnapshotId, for examplesnap-0123456789abcdef0. Alternatively, you can find it in the AWS Console: - Select All services → EC2.
- In the left sidebar, under Elastic Block Store, select Snapshots.
- Locate the snapshot with the description you provided during the import.
- Create the image from the snapshot.
- Select the checkbox next to your snapshot.
- Select Actions → Create image from snapshot.
- Specify mandatory settings in the Create image from snapshot section. To ensure the Broker VM functions correctly, configure these settings in the following sections:
- Image settings
- Architecture: x86_64
- Root device name:
/dev/sda1 - Virtualization type: Hardware-assisted virtualization
- Boot mode: Legacy BIOS
- Block device mappings - optional
- Size (GIB):
480GB - Volume type: General Purpose SSD (gp3)
- IOPS:
3000 - Throughput (MB/s): 125 Once the task is complete, the AMI Image is ready for use.
- Size (GIB):
- Image settings
- Locate the snapshot ID. In the output of your completed task, find the
- (Optional) After the AMI image has been created, you can define a new name for the image. Select All services → EC2 → IMAGES → AMIs and locate your AMI image using the task ID. Select the pencil icon to specify a new name.
Task 5. Launch a Broker VM Instance in AWS EC2
You can launch the a Broker VM instance in AWS EC2 using the AMI Image created.
Important
A t3.xlarge (16 GB RAM) is the lowest machine type that can be used as an instance type to meet the mandatory 4 vCPU requirement.
- To view the AMI image that you added, select All services → EC2 → Images → AMIs.
- Select EC2 → Instances, and click Launch instances to create an instance of the AMI image.
- In the Launch Instance Wizard define the instance according to your company requirements and Launch.
- (Optional) In the Instances page, locate your instance and use the pencil icon to rename the instance Name.
- Define HTTPS and SSH access (optional) to your instance. Select your instance and then choose Actions → Security → Change security groups. Attach a security group that allows HTTPS to access the Broker VM Web UI and SSH for remote access when troubleshooting. Make sure to allow these connections to the Broker VM from secure networks only.
Note
Assigning security groups can take up to 15 minutes.
6. Verify the Broker VM has started correctly. On the Instances page, select your instance, and the choose Actions → Monitor and troubleshoot → Troubleshoot → Get instance screenshot. You are directed to your Broker VM console listing your Broker details.
Set up Broker VM on Google Cloud Platform (GCP)
Learn more about how to set up your Cortex XSIAM Broker VM on Google Cloud Platform.
You can deploy the Broker VM on Google Cloud Platform. The Broker VM allows communication with external services through the installation and setup of applets such as the Syslog collector applet.
To set up the Broker VM on the Google Cloud Platform, install the VMDK image provided in Cortex XSIAM.
Prerequisite
- Download a Cortex XSIAM Broker VM VMDK image. For more information, see the virtual machine compatibility requirements in Set up and configure Broker VM.
- To complete the set up, you must have G Cloud installed and have an authenticated user account.
Perform the following procedures in the order listed below.
Create a Google Cloud Storage bucket in G Cloud
From G Cloud, create a Google Cloud Storage bucket to store the Broker VM image.
- Create a project in GCP. Enable Google Cloud Storage, for example,
brokers-project. Define a default network. - Create a bucket, such as
broker-vms.
Set up the GCP project
Open a command prompt and run the following:
gcloud config set project <project-id>
Upload the VMDK image to the Google Cloud Storage bucket
Upload the VMDK image to the bucket, run the following:
gsutil cp </path/to/broker.vmdk> gs://<bucket-name>
Import the GCP image
You can import the GCP image using either G Cloud CLI or Google Cloud console.
Note
The import tool uses Cloud Build API, which must be enabled in your project. For the import to work, Cloud Build service account must have compute.admin and iam.serviceAccountUser roles. When using the Google Cloud console to import the image, you will be prompted to add these permissions automatically.
Danger
Before importing a GCP image using the gcloud CLI, ensure that you update the Google Cloud components to version 371.0.0 and above using the following command:
gcloud components update
The following command uses the minimum required parameters. For more information on permissions and available parameters, refer to the Google Cloud SDK.
Open a command prompt and run the following:
gcloud compute images import <VMDK image> --data-disk --source-file="gs://<image path>" --network=<network_name> --subnet=<subnet_name> --zone=<region> --async
Create a new instance of the image
When the Google Compute completes the image creation, create a new instance.
- In Google Cloud Platform, select Compute Engine → VM instances.
- Select Create instance.
- Under Boot disk, choose Custom images. Select the image you created.
- Configure the instance for your workload:
- Use
e2-standard-2for Agent Proxy only. - Use
e2-standard-4for multiple applets.
- Use
Allow the 4443 port in your firewall configuration
- In the Google Cloud menu, select VPC network → Firewall. Select Create firewall rule.
- Set the rule parameters:
- Name: Enter a name for the rule.
- Network: Select the Broker VM network.
- Direction of traffic: Select Ingress.
- Targets: Select All instances in the network.
- Source IPv4 ranges: Enter the allowed client IP range. Use
0.0.0.0/0to allow all addresses. - TCP: Enter
4443.
- Select Create. The rule appears under VPC firewall rules.
Verify that the firewall rule is assigned to the Broker VM
- In the Google Cloud menu, select Compute Engine → VM instances.
- For the Broker VM, select More actions (⋮) → View network details.
- Under Firewall and routes details, select Firewalls.
- Verify that the firewall rule appears.
You can now connect to the Broker VM web console using the Broker VM IP address. Connect with https over port 4443 using the format https://<ip address>:4443.
Set up Broker VM on KVM using Ubuntu
Learn set up your Cortex XSIAM Broker virtual machine (VM) on a KVM using Ubuntu.
After you download your Cortex XSIAM Broker virtual machine (VM) QCOW2 image, you need to upload it to a kernel-based Virtual Machine (KVM). The instructions below provide an example of doing this on the latest Ubuntu.
Prerequisite
Download a Cortex XSIAM Broker VM QCOW2 image. For more information, see the virtual machine compatibility requirements in Set up and configure Broker VM.
- Open KVM on Ubuntu.
- Click the New VM icon.
- Complete the new virtual machine wizard:
- In Step 1, select Import existing disk image. Click Forward.
- In Step 2, configure the storage:
- Browse to the downloaded QCOW2 image.
- Click Browse Local, select the image, then click Open.
- Leave OS type and Version set to Generic.
- Click Forward.
- In Step 3, specify these resources:
- Memory (RAM):
8192MB (8 GB) - CPUs:
4 - Click Forward.
- Memory (RAM):
- In Step 4, enter a name for the VM.
- Click Finish. The VM is listed and ready to use.
Set up Broker VM on Microsoft Azure
Learn how to set up your Cortex XSIAM Broker virtual machine (VM) on Microsoft Azure.
After you download your Cortex XSIAM Broker VHD (Azure) image, you need to upload it to Azure as a storage blob.
Prerequisite
Download a Cortex XSIAM Broker VM VHD (Azure) image. For more information, see the virtual machine compatibility requirements in Set up and configure Broker VM.
Perform the following procedures in the order listed below.
Task 1. Extract the downloaded VHD (Azure) image
Make sure you extract the zipped hard disk file on a server that has more then 512 GB of free space.
Note
Extraction can take up to a few hours.
Task 2. Create a new storage blob on your Azure account by uploading the VHD file
Upload from Microsoft Windows or Ubuntu.
- Verify you have:
- Windows PowerShell version 5.1 or later.
- .NET Framework 4.7.2 or later.
-
Open PowerShell and run:
Set-ExecutionPolicy unrestricted [Net.ServicePointManager]::SecurityProtocol = [Net.SecurityProtocolType]::Tls12 Install-PackageProvider -Name NuGet -MinimumVersion 2.8.5.201-Force
-
Install
azure cmdlets.Install-Module -Name Az -AllowClobber
-
Connect to your Azure account.
Connect-AzAccount
- Start the upload.
-
For Azure PowerShell:
Set-AzStorageBlobContent -Container $containerName -File $localFilePath -Context $storageContext -BlobType Page
-
For Azure CLI:
az storage blob upload -f -n -c --account-name
-
Note
Upload can take up to a few hours.
-
Install Azure util. There are two different ways to install the Azure util.
Note
For more information, see the Azure Documentation.
-
Option 1:
curl -sL https://aka.ms/InstallAzureCLIDeb | sudo bash
-
Option 2:
-
Get the packages needed for the installation process:
sudo apt-get update sudo apt-get install apt-transport-https ca-certificates curl gnupg lsb-release
-
Download and install the Microsoft signing key:
sudo mkdir -p /etc/apt/keyrings curl -sLS https://packages.microsoft.com/keys/microsoft.asc | gpg --dearmor | sudo tee /etc/apt/keyrings/microsoft.gpg > /dev/null sudo chmod go+r /etc/apt/keyrings/microsoft.gpg
-
Add the Azure CLI software repository:
AZ_DIST=$(lsb_release -cs) echo "Types: deb URIs: https://packages.microsoft.com/repos/azure-cli/ Suites: ${AZ_DIST} Components: main Architectures: $(dpkg --print-architecture) Signed-by: /etc/apt/keyrings/microsoft.gpg" | sudo tee /etc/apt/sources.list.d/azure-cli.sources -
Update repository information and install the
azure-clipackage:sudo apt-get update sudo apt-get install azure-cli
-
-
-
Connect to Azure.
az login
-
Start the upload.
az storage blob upload -f <vhd to upload> -n <vhd name> -c <container name> --account-name <account name>
Task 3. Add and configure a new disk in Azure
- In the Azure home page, navigate to Azure services → Disks and Add a new disk.
-
Navigate to the Create a managed disk → Basics page, and define the following information:
Heading Parameter Project details Resource group: Select your resource group. Disk details <p>Disk name: Enter a name for the disk object.
Region: Select your preferred region.
Source type: SelectStorage Blob.
Additional fields are displayed, which you can define as follows:</p><ul><li><p>Source blob:</p><ul><li>Select Browse. You are directed to the Storage accounts page.</li><li>From the navigation panel, select the bucket and then container to which you uploaded the Cortex XSIAM VHD image.</li><li>In the Container page, Select your VHD image.</li></ul></li><li>OS type: Select Linux</li><li>VM generation: Select Gen 1</li></ul> - Check you settings by clicking Review + create.
Task 4. Create the Broker VM disk
- Create your Broker VM disk, and after deployment is complete, click Go to resource.
- In your created Disks page, click Create VM.
-
In the Create a virtual machine page, define the following:
Heading Parameter Instance details <p>(Optional) Virtual machine name: Enter the same name as the disk name you defined.
Size: Select the size according to your company guidelines. Select Next to navigate to the Networking tab.</p>Network interface <p>NIC network security group: Select Advanced.
Configure network security group: Select HTTPS to be able to access the Broker VM Web UI, and SSH to allow for remote access when troubleshooting. Make sure to allow these connection to the Broker VM from secure networks only.</p> - To check your settings, click Review + create.
- Create your VM. After deployment is complete, click Go to resource. You are directed to your VM page.
Note
Creating the VM can take up to 15 minutes. The Broker VM Web UI is not accessible during this time.
-
Ensure that the VM you created contains an Outbound port rule that allows the broker to reach the Azure Instance Metadata Service using the IP address
169.254.169.254and port80. For more information about the Azure Instance Metadata Service, see the Azure Documentation. To configure an outbound rule on your VM, select Networking → Network settings, and under the Rules → Outbound port rules section, you can either:Note
For more information on creating a rule in an Azure VM, see Create a Security Rule in the Azure Documentation.
- Configure a new outbound port rule by selecting Create port rule → Outbound port rule and setting the following settings in the Add outbound security rule dialog box:
- Destination: Select IP Addresses.
- Destination IP addresses/CIDR ranges: Enter the IP address as
169.254.169.254. - Destination port ranges: Enter the port as
80. - Protocol: Select TCP.
- Name: Enter a unique name for this new outbound port rule, such as AzureInstanceMetadataService. Click Add to create the new outbound port rule.
- Edit an existing outbound port rule and ensure that the settings provided above for creating a new outbound port rule match what is already configured in the rule.
- Configure a new outbound port rule by selecting Create port rule → Outbound port rule and setting the following settings in the Add outbound security rule dialog box:
Set up Broker VM on Microsoft Hyper-V
Learn how to set up your Cortex XSIAM Broker virtual machine (VM) on Microsoft Hyper-V.
To set up a Broker virtual machine (VM) image on Microsoft Hyper-V, you need to download a Cortex XSIAM Broker VM VHD image, and then upload it to your newly created Microsoft Hyper-V VM. Microsoft Hyper-V 2012 or later is supported.
Prerequisite
Download a Cortex XSIAM Broker VM VHD image. For more information, see the virtual machine compatibility requirements in Set up and configure Broker VM.
Perform the following procedures in the order listed below.
Task 1. Create a new VM in the Hyper-V Manager and upload the VHD image
- In the Hyper-V Manager, select New → Virtual Machine to open the New Virtual Machine Wizard.
- In the Specify Name and Location screen, specify a Name for your VM, and click Next.
- In the Specify Generation screen, select Generation 1, and click Next.
- In the Assign Memory screen, set the Startup memory to 8192 MB, and click Next.
- In the Configuring Networking screen, select the network adapter for the Connection, and click Next.
- In the Connect Virtual Hard Disk screen, select Use an existing virtual hard disk, Browse to the downloaded VHD image file, and click Next.
- In the Completing the New Virtual Machine Wizard screen, click Finish.
Task 2. Start the VM that you created for Microsoft Hyper-V
- From the Virtual Machines list, right-click the VM that you created, and select Start.
- When the State of the VM updates to Running, right-click the VM, and select Connect. The Broker VM console now displays.
Set up Broker VM on Nutanix Hypervisor
Learn how to set up your Cortex XSIAM Broker virtual machine (VM) on Nutanix Hypervisor.
After you download your Cortex XSIAM Broker virtual machine (VM) QCOW2 image, you need to upload it to a Nutanix hypervisor. Nutanix AHV 10.3 or later is supported.
Prerequisite
Download a Cortex XSIAM Broker VM QCOW2 image. For more information, see the virtual machine compatibility requirements in Set up and configure Broker VM.
Perform the following procedures in the order listed below.
Task 1. Upload the downloaded QCOW2 image file to a Nutanix hypervisor
- Select Compute → Images, and click Add Image.
- In the Add Images page, ensure the Image Source is set to Image File, and click Add File.
- Select the downloaded QCOW2 file and click Open. Additional fields related to the QCOW2 file are automatically displayed in the Add Image page, where the Name and Type of file are automatically populated. Ensure the Type is set to Disk.
- (Optional) Define the rest of the fields displayed for the QCOW2 file.
- Click Next.
- Select the location by defining the Placement Method and Select Clusters settings.
- Click Save. The image is now listed in the list of images.
Note
Saving the image to Nutanix hypervisor can take time as it’s a large file. We recommend verifying periodically that the connection is alive for the upload process to finish successfully.
Task 2. Create a new VM
- Select Compute → VMs, and click Create VM.
- In the Create VM screen, set the following Configuration fields, and ensure the advanced settings options are not selected:
- Name: Specify a name for the new VM.
- Description (Optional): Specify a description to identify the VM.
- Number of VMs: Select the number of VMs you want to create. The default is set to 1.
- VM Properties
- CPU: Select 4 CPUs.
- Cores per CPU: Select the number of cores to create for each CPU. The default number is 1.
- Memory: Select 8GB as the allotted memory for the VM.
- Click Next.
-
Set the Resources fields:
Disks
Select Attach Disk and set the following field settings:
- Type: Leave the default Disk type.
- Operation: Select Clone from Image.
- Image: Select the QCOW2 image file that you uploaded.
- Capacity: Specify the capacity of the image file as 512 GB.
- Bus Type—Leave the default SCUI selected. When you finish, click Save.
Networks
Select Attach to Subnet and set the following field settings.
- Subnet: Select the subnet from the list.
- Network Connection State: Leave the default Connected option selected. When you finish, click Save.
Boot Configuration
Leave the default Legacy BIOS Mode selected.
- Verify the Shield VM Security Settings options are not selected.
- Click Next.
- Set the Management fields, where you can leave the default settings for the various fields.
- Click Next.
- Click Create VM. The VM is now listed in the list of VMs.
Note
Creating the VM can take up to 15 minutes. The Broker VM Web user interface is not accessible during this time.
Task 3. Review the VM details for connecting to the VM
Select Summary and you can use the IP Addresses and Host IP listed to connect to the VM.
Set up Broker VM on VMware ESXi using vSphere Client
Learn more about how to set up you Cortex XSIAM Broker VM on VMware ESXi.
To set up the Broker VM on VMware ESXi, you deploy the OVA image provided in Cortex XSIAM. VMware ESXi 6.5 or later is supported. The instructions below provide an example of doing this using vSphere Client 7.0.3.01400.
Prerequisite
- Ensure you have a virtualization platform installed that is compatible with an OVA image, and have an authenticated user account.
- Download a Cortex XSIAM Broker VM OVA image. For more information, see the virtual machine compatibility requirements in Set up and configure Broker VM.
Deploy the Broker VM OVA image on vSphere Client
- From vSphere Client, right-click an inventory object for the virtual machine of your broker, and select Deploy OVF Template.
- In the Select an OVF template page of the wizard, select Local file, click UPLOAD FILES to select the OVA image file that you downloaded, and click NEXT.
- In the Select a name and folder page, enter a unique name for the virtual machine, select a deployment location, and click NEXT.
- In the Select a compute resource page, select a resource where to run the deployed VM template, and click NEXT.
- In the Review details page, verify the OVA template details, and click NEXT.
- In the Select storage page, define where and how to store the files for the deployed OVA template, and click NEXT. For more information on the options available, see the VMware vSphere documentation.
- In the Select networks page, select a source network and map it to a destination network, and click NEXT. The Source Network column lists all networks that are defined in the OVA template.
- In the Ready to complete page, review the details and click FINISH. A new task for creating the virtual machine is displayed in the Recent Tasks pane. When the Status of the task reaches 100%, the task is complete, and the new virtual machine is created on the selected resource.
- Navigate to the resource where the new virual machine is created, right-click the resource, and select Power → Power On.
Broker VM data collector applets
Learn more about the different Broker VM data collector applets available to configure.
Notice
Some data collector applets require the Data Collection add-on.
The Broker VM has a number of data collector applets that you can configure to ingest different types of data. These data collector applets are in addition to the others that are available in the Settings → Data Sources & Integrations page.
For more information on activating the Broker VM applets, see Generic on-premise data collectors.
Manage Broker VM
After you configure the Broker VMs, you can manage these brokers from the Cortex XSIAM management console in the Broker VMs page.
When managing a Broker VM, the options differ for a standalone Broker VM versus a Broker VM node that is added to a high availability (HA) cluster. Certain configuration options that are only relevant for a Broker VM cluster node, such as Remove from Cluster, are only displayed when the Broker VM is a cluster peer.
Select Settings → Configurations → Data Broker → Broker VMs to view detailed information regarding your registered Broker VMs in the Brokers tab.
Understanding the Broker VM table
The Broker VMs table enables you to monitor and mange your Broker VM and applet connectivity status, version management, device details, and usage metrics. A status icon is displayed in the following columns, where the colors can indicate different statuses:
- Device Name: Indicates whether the Broker machine is registered and connected to Cortex XSIAM.
- Black: Disconnected to Cortex XSIAM
- Red: Disconnected from Cortex XSIAM
- Green: Connected
- Version: Indicates whether the Broker VM is running the latest version.
- Orange: Past Version
- Green: Latest Version
- Apps: Indicates whether the available Broker VM data collector applets are connected to Cortex XSIAM and up-to-date..
- Green (Connected): Indicates the applet has no issues and is running the latest version.
- Orange (Warning):
- Indicates the applet has minor connectivity or configuration issues, such as a new applet version is available.
- During an active update, the indicator flashes orange and the status displays as Updating.
- Red (Error): Indicates the applet has errors.
Note
For more information on troubleshooting errors and warnings for these broker applets, see Troubleshoot Broker VM applet errors.
Broker VM table field descriptions
The following table describes common fields that you can add to the Brokers table using the column manager and lists the fields in alphabetical order.
Note
Certain fields are also exposed in the Clusters tab, when a Broker VM node is added to a High Availability (HA) cluster, and each cluster node is expanded to view the Broker VM nodes table. An asterisk (*) is beside every field that is also included in the Broker VM nodes table for each HA cluster.
| Field | Description |
|---|---|
| ALL interfaces | All IP addresses of the different interfaces on the device. |
| APPS* | List of active or inactive applets and the connectivity status for each. |
| CLUSTER NAME* | Indicates the name of the HA cluster that the Broker VM has been added to. For a standalone Broker VM, which isn't added to any HA cluster, this field is empty. |
| CPU USAGE* | CPU usage percentage of the Broker VM device that is synced every 5 minutes. |
| CONFIGURATION STATUS* | <p>Broker VM configuration status. Status is defined by the following according to changes made to any of the Broker VM configurations:</p><ul><li>up to date: Broker VM configuration changes made through the Cortex XSIAM console have been applied.</li><li>in progress: Broker VM configuration changes made through the Cortex XSIAM console are being applied.</li><li>submitted: Broker VM configuration changes made through the Cortex XSIAM console have reached the Broker VM and awaiting implementation.</li><li>failed: Broker VM configuration changes made through the Cortex XSIAM console have failed. Need to open a Palo Alto Networks support ticket.</li></ul> |
| DEVICE ID | Device ID allocated to the Broker VM by Cortex XSIAM after registration. |
| DEVICE NAME* | <p>Same as the Device ID.</p><p>A ⚠ icon notifies of an expired Broker VM. To reconnect, generate a new token and re-register your Broker VM as described in steps 1 through 7 of Configure the Broker VM. Once registered, all previous Broker VM configurations are reinstated.</p> |
| DISK USAGE* | <p>Disk usage percentage from the total allocated for data caching in the Broker VM. Inside the brackets is displayed how much this is in GB from the total disk size in GB.</p><p>A notification is added to the Notification Center whenever the disk space is low disk and whenever the disk size is increased.</p> |
| EXTERNAL INTERFACE | <p>The IP interface the Broker VM is using to communicate with the server.</p><p>For AWS and Azure cloud environments, the field displays the Internal IP value.</p> |
| LAST SEEN | Indicates when the Broker VM was last seen on the network. |
| MEMORY USAGE* | Memory usage percentage of the Broker VM that is synced every 5 minutes. |
| STATUS* | Connection status of the Broker VM. Status is defined by either Connected or Disconnected. Disconnected Broker VMs do not display CPU Usage, Memory Usage, and Disk Usage information. Notifications about the Broker VM losing connectivity to Cortex XSIAM appear in the Notification Center. |
| UPGRADE TIME | Timestamp of when the Broker VM was upgraded. |
| VERSION* | <p>Version number of the Broker VM.</p><ul><li>Broker VM version: If the status indicator is not green, the Broker VM is not running the latest version.</li><li>Applets version: You can view the current version of an individual applet by clicking the applet in the APPS column.</li></ul><p>Notifications about the available new Broker VM version appear in the Notification Center.</p><p> </p> |
Maintenance releases
Cortex XSIAM updates and enhances the Broker VM automatically through maintenance releases. The Broker VM version release process uses several security measures and tools to ensure that every released version is highly secure. These include the following.
- CIS Server Level 1 and 2 benchmarks (using a 3rd party product)
- Vulnerability scanning for containers running on the Broker VM
- Vulnerability scanning for the host kernel
- Periodic 3rd party penetration testing
Edit Broker VM Configuration
After configuring and registering your Broker VM, you can edit existing configurations and define additional settings in the Broker VMs page in the Brokers tab. When you have a high availability (HA) cluster configured, you can also edit any Broker VM nodes configurations in the Clusters tab from the Broker VMs table under the Cluster.
Perform the following procedures in the order listed below.
Open the Configurations page for the Broker VM
- Select Settings → Configurations → Data Broker → Broker VMs.
- In the Broker VMs table, locate the Broker VM. Right-click it and select Configure.
Note
If the Broker VM is disconnected, you can only view its configuration.
You can also configure HA cluster nodes from the Clusters tab.
Define the settings in the Configurations page
Edit the existing Network Interfaces, Proxy Server, NTP Server, and SSH Access configurations.
Device Name (Requires Broker VM 8.0 and later)
Change the name of your Broker VM device name by selecting the pencil icon. The new name will appear in the Brokers table.
FQDN
Set your Broker VM FQDN as it will be defined in your Domain Name System (DNS). This enables connection between the WEF and WEC, acting as the subscription manager. The Broker VM FQDN settings affect the WEC and Agent Installer and Content Caching.
(Optional) Internal Network (Requires Broker VM 8.0 and later)
Specify a network subnet to avoid the Broker VM dockers colliding with your internal network. By default, the Network Subnet is set to 172.17.0.1/16.
Note
Internal IP must be:
- Formatted as
prefix/mask, for example192.0.2.1/24. - Must be within
/8to/24range. - Cannot be configured to end with a zero.
For Broker VM version 9.0 and lower, Cortex XSIAM accepts only 172.17.0.0/16.
Auto Upgrade
Enable or Disable automatic upgrade of the Broker VM. By default, auto upgrade is enabled at Any time for all 7 days of the week, but you can also set the Days in Week and Specific time for the automatic upgrades. If you disable auto-upgrade, new features and improvements will require manual upgrade.
Monitoring
Enable or Disable of local monitoring of the Broker VM usage statistics in Prometheus metrics format, allowing you to tap in and export data by navigating to http://<broker_vm_address>:9100/metrics/. By default, monitoring your Broker VM is disabled. For more information with an example of how to set up Prometheus and Grafana to monitor the Broker VM, see Monitor Broker VM using Prometheus.
(Optional) SSH Access
Broker VM 7.4.5 and earlier
Enable/Disable ssh Palo Alto Networks support team SSH access by using a Cortex XSIAM token.
Enabling allows Palo Alto Networks support team to connect to the Broker VM remotely, not the customer, with the generated password. If you use SSL decryption in your firewalls, you need to add a trusted self-signed CA certificate on the Broker VM to prevent any difficulties with SSL decryption. For example, when configuring Palo Alto Networks NGFW to decrypt SSL using a self-signed certificate, you need to ensure the Broker VM can validate a self-signed CA by uploading the cert_ssl-decrypt.crt file on the Broker VM.
Note
Make sure you save the password before closing the window. The only way to re-generate a password is to disable ssh and re-enable.
Broker VM 14.0.42 and later
Customize the login banner displayed, when logging into SSH sessions on the Broker VM in the Welcome Message field by overwriting the default welcome message with a new one added in the field. When the field is empty, the default message is used.
Broker UI Password
Reset your current Broker VM Web UI password. Define and Confirm your new password. Password must be at least 8 characters.
(Optional) SSL Server Certificate section (Requires Broker VM 10.1.9 and later)
Upload your signed server certificate and key to establish a validated secure SSL connection between your endpoints and the Broker VM. When you configure the server certificate and the key files in the tenant UI, Cortex XSIAM automatically updates them in the Broker VM UI, even when the Broker VM UI is disabled.
Cortex XSIAM validates that the certificate and key match, but does not validate the Certificate Authority (CA).
When you are done, Save your changes.
Increase Broker VM storage allocated for data caching
Learn more about increasing the storage allocated for data caching in the Broker VM.
The storage allocated for data caching in the Broker VM is fixed at around 346.4 GB using a Logical Volume Manager (LVM). You can increase the disk space allocated to attain better resilience during network and connectivity issues by adding a new disk. The disk needs to be added manually to an applicable hypervisor that your broker supports, so that the Broker VM automatically detects the physical disk and allows you to connect to it. Extending the existing disk is not supported.
When allocating storage for data caching, ensure you are aware of the following:
- You must allocate the entire disk as opposed to portions of the disk.
- You can connect multiple disks to increase the data caching space according to your requirements.
- Once a disk is connected, It's not possible to dismiss a disk that has already been allocated, or to reduce the disk space of the data caching.
- Adding a disk requires formatting and deleting all its contents.
Warning
This operation is irreversible, and will make the disk become an integral part of the broker, where disconnecting the disk will result in errors and data loss.
How to increase the Broker VM disk size
- Gracefully shutdown the applicable Broker VM in the hypervisor to manually add a disk.
- Add a disk manually through the hypervisor portal. This step involves accessing the portal and attaching a new disk to the VM.
Note
Follow your hypervisor documentation to understand how to add a persistent disk storage to your VM.
- Power On the applicable Broker VM in the hypervisor.
- Select Settings → Configurations → Data Broker → Broker VMs.
- In the Broker VMs table, locate your Broker VM, and wait for a few minutes until the status of the Broker VM is Connected, right-click, and select Configure.
- Scroll down to the Storage section, verify that your disk is detected with a new line that reads New disk detected with the correct disk name and disk size, and click Add to data caching space.
Note
If your disk is not listed and you didn't shutdown your Broker VM in your hypervisor before manually adding a disk to the VM, you'll need to reboot the Broker VM before the disk details are detected by the Broker VM. This can be performed either in the hypervisor or directly in the Broker VMs page.
7. In the ARE YOU SURE? dialog box that is displayed, confirm that you want to add the new disk to the broker's data caching space and are aware of all the ramifications by clicking Yes, add. 8. To apply your changes, click Save. Once completed, a notification is added to the Notification Center indicated whether the disk size was increased successfully. If not, the notification includes the errors encountered during the process. In addition, when the disk is added successfully, the total size of the disk space available is updated in the DISK USAGE column on the Broker VMs page.
Monitor Broker VM using Prometheus
Learn more on monitoring the Broker VM using Prometheus.
You can enable local monitoring of the Broker VM to provide usage statistics in a Prometheus metrics format. You can tap in and export data by navigating to http://<broker_vm_address>:9100/metrics/. By default, monitoring is disabled.
Prerequisite
To monitor the Broker VM using Prometheus, ensure that you enable monitoring on the Broker VM. This is performed after configuring and registering your Broker VM, when you can edit existing configurations and define additional settings in the Broker VMs page.
- Select Settings → Configurations → Data Broker → Broker VMs.
- In the Broker VMs table, locate your Broker VM, right-click, and select Configure.
Note
For all Broker VM nodes added to a HA cluster, you can also Configure the Broker VM nodes from the Clusters tab.
- In the Broker VM Configurations page, select Monitoring from the left pane.
- Clear the Use Default (Disabled) checkbox.
- In the Montoring menu, select Enabled.
- Click Save.
How to set up Prometheus and Grafana to monitor the Broker VM
Below is an example of how to set up Prometheus and Grafana to monitor the Broker VM. This is set up using a docker compose on an Ubuntu machine to monitor the CPU usage.
Perform the following procedures in the order listed below.
Task 1. Install Docker and Docker Compose
-
Update your Ubuntu system:
sudo apt update
-
Install Docker:
Note
For more information on Docker, see the Docker website.
sudo apt install docker.io
-
Start the Docker service:
sudo systemctl start docker
-
Enable Docker to start on boot:
sudo systemctl enable docker
-
Install Docker Compose:
sudo curl -L "https://github.com/docker/compose/releases/latest/download/docker-compose-$(uname -s)-$(uname -m)" -o /usr/local/bin/docker-compose sudo chmod +x /usr/local/bin/docker-compose
Task 2. Create a Docker Compose file
This task includes setting up Prometheus and Grafana.
-
Create a file named
docker-compose.yml, and open it for editing:vim docker-compose.yml
-
Add the following content to the file:
version: '3.8' services: prometheus: image: prom/prometheus:latest container_name: prometheus restart: unless-stopped volumes: - ./prometheus.yml:/etc/prometheus/prometheus.yml - prometheus_data:/prometheus command: - '--config.file=/etc/prometheus/prometheus.yml' - '--storage.tsdb.path=/prometheus' - '--web.console.libraries=/etc/prometheus/console_libraries' - '--web.console.templates=/etc/prometheus/consoles' - '--web.enable-lifecycle' - '--log.level=debug' ports: - '9090:9090' grafana: image: grafana/grafana-enterprise container_name: grafana restart: unless-stopped ports: - '3000:3000' volumes: - grafana_data:/var/lib/grafana volumes: grafana_data: {} prometheus_data: {} -
Save and close the file.
Task 3. Create a Prometheus configuration file
You need to configure Prometheus to scrape the Broker VM metrics by creating a Prometheus configuration file.
- Create a Prometheus configuration file named
prometheus.ymlin the same directory as thedocker-compose.ymlfile that you created above. -
Open the
prometheus.ymlfile for editing:vim prometheus.yml
-
Add the following content to the file:
global: scrape_interval: 15s scrape_timeout: 10s scrape_configs: - job_name: 'prometheus' static_configs: - targets: [':9090'] - job_name: 'node' static_configs: - targets: [':9100'] - Save and close the file.
Task 4. Run Docker Compose
-
In the terminal, run the following command from the project directory:
docker-compose up -d
-
Verify that Prometheus is running correctly:
docker-compose logs -f prometheus
Task 5. Access Grafana and Set Up Prometheus as a Data Source
- Open a web browser and go to
http://<your server>:3000. - Log in to Grafana using the default credentials.
- Username:
admin - Password:
admin
- Set up Prometheus as a data source:
- In the left pane, select Administation → Data sources.
- Click Add data source, and select Prometheus.
- Under HTTP, set the URL to
http://<your server IP address>:9090. - To verify the connection, click Save & Test.
Task 6. Create Dashboards in Grafana
You can now create dashboards in Grafana to visualize the data from Prometheus.
- In Grafana, on the left pane, click Dashboards.
- Select New and create a new dashboard.
- Add a panel to the dashboard and configure the dashboard to display the Prometheus metrics that you want.
-
To monitor CPU usage, use the following metric:
100 - (avg by (instance) (rate(node_cpu_seconds_total{job="node",mode="idle"}[1m])) * 100)
Collect Broker VM Logs
Learn more about collecting logs from a Broker VM to review them as part of an investigation.
Cortex XSIAM enables you to collect your Broker VM logs directly from the Cortex XSIAM management console.
You can collect logs by either regenerating the most up-to-date logs and downloading them once they are ready, or downloading the current logs from the last creation date reflected in the TIMESTAMP.
- Select Settings → Configurations → Data Broker → Broker VMs to view the Broker VMs table in the Brokers tab.
- Locate your Broker VM, right-click and select either Generate New Logs or Download Logs ().
Note
The Download Logs () is only displayed when you’ve downloaded your logs previously using Generate New Logs. Logs are generated automatically, but can take up to a few minutes depending on the size of the logs.
Upgrade Broker VM
Learn more about upgrading the Broker VM from the Cortex XSIAM management console.
If your Broker VM was deployed using an image downloaded before February 22, 2026 (running Ubuntu 20.04 or earlier), you must reinstall the broker with a new image (running Debian 13 or later) before you can upgrade to the latest version. For more information, see Learn more about migrating to the latest broker VM image.
- Select Settings → Configurations → Data Broker → Broker VMs.
- In either the Brokers or Clusters tab, locate your Broker VM, right-click, and select Upgrade Broker version. Upgrading your Broker VM takes approximately 5 minutes.
Important
After a Broker VM upgrade, your broker may require a reboot to finish installing important updates. A notification about this will be sent to your Cortex XSIAM console Notification Center.
Update Broker VM applets independently
Cortex XSIAM allows you to update individual Broker VM applets independently. This enables faster deployment of hot-fixes and new features with minimal broker downtime.
Applet versioning and visibility
You can view the current version of an active applet by navigating to Settings > Configurations > Data Broker > Broker VMs and clicking the applet icon in the APPS column.
Automatic applet updates
If Auto Upgrade is enabled for your Broker VM, applets will upgrade automatically when a new version is available.
- For standalone brokers: The applet updates as soon as a new version is available.
- For clusters: Applets follow a rolling upgrade mechanism to ensure service continuity.
Manual applet updates
When a new version of an applet is released, Cortex XSIAM triggers a notification:
- The applet status indicator changes to orange, indicating a WARNING state.
- A message appears in the applet hovering menu: New version available: X.Y.Z.
- To update, select Update from the hovering menu.
- While the update is in progress, the status displays as Updating.
- Upon completion, the status indicator changes to green, indicating a CONNECTED state.
- A successful update is recorded in the Management Audit Logs.
Import Broker VM Configuration
Learn more about importing one Broker VM configuration to another.
Important
This option can only be used on Broker VMs with version 20.0 and later, and is only suitable for importing a configuration of brokers in the same version, or from a broker in an older version to a broker in a newer version.
Importing Broker VM configurations allows you to copy, including applet settings, the configuration of one Broker VM to another. The import overrides the Broker VM and applet settings in the target Broker VM.
- To replace the Broker VM configuration, right-click the Broker VM and select Import Configuration.
- Select the Broker VM that has the configuration that you want to import.
- (Optional) After the import is complete and the new configurations are applied to the target Broker VM, you can choose to shutdown the source Broker VM (default configuration). This step ensures that there are no conflicts in data collection and applets operation.
Note
If this option is selected, the shutdown process can take up to 10 minutes to allow the broker to finish offloading the data cache.
- Select the confirmation checkbox.
- Click Import. After a successful import, the new configurations are immediately applied to the target Broker VM.
Important
If your source Broker VM configuration includes a WEC applet, you'll need to ensure that you update the DNS record of this Broker VM's FQDN to point to the target Broker VM IP address.
Open Live Terminal
Learn more about remotely connecting to a Cortex XSIAM Broker VM.
Cortex XSIAM enables you to connect remotely to a Broker VM directly from Cortex XSIAM.
- In Cortex XSIAM, select Settings → Configurations → Data Broker → Broker VMs table.
- Locate the Broker VM you want to connect to, right-click and select Open Live Terminal. Cortex XSIAM opens a CLI window where you can perform the following commands:
Logs
Broker VM logs are located in /data/logs/folder and contain the applet name in the file name. Example 19. Folder /data/logs/[applet name], containing container_ctrl_[applet name].log
Administration commands
Broker VM supports the commands listed in the following table. All the commands are located in the /home/admin/sbin folder.
Applet Names
- CSV Collector:
file_collector - Database Collector:
db_collector - Files and Folders Collector:
log_collector - FTP Collector:
ftp_collector - Kafka Collector:
kafka_collector - Local Agent Settings:
tms_proxy - NetFlow Collector:
netflow_collector - Network Mapper:
network_mapper - Syslog Collector:
anubis - Windows Event Collector:
wec
Services
- Upgrade:
zenith_upgrade - Frontend service:
webui - Sync with Cortex XSIAM:
cloud_sync - Internal messaging service (RabbitMQ):
rabbitmq-server - Upload metrics to Cortex XSIAM:
metrics_uploader - Prometheus node exporter:
node_exporter - Backend service:
backend
The following table displays the available commands in alphabetical order:
| Command | Description | Example |
|---|---|---|
applets_restart |
Restarts one or more applets. | sudo ./sbin/applets_restart wec |
applets_start |
Start one or more applets. | sudo ./sbin/applets_start wec |
applets_status |
Check the status of one or more applets. | sudo ./sbin/applets_status wec |
applets_stop |
Stop one or more applets. | sudo ./sbin/applets_stop wec |
restart_routes |
Invoke a restart of the routing service after updating your static network route configuration file, /etc/network/routes. The /etc/network/routes configuration file is a standard routes configuration file and can be edited directly. The admin user that you logged in with, when using the remote terminal or via SSH, has read/write permissions to this file. |
sudo ./sbin/restart_routes |
services_restart |
Restarts one or more services. OS services are not supported. | sudo ./sbin/services_restart cloud_sync |
services_start |
Start one or more services. | sudo ./sbin/services_start cloud_sync |
services_status |
Check the status of one or more services. | sudo ./sbin/services_status cloud_sync |
services_stop |
Stop one or more services. | sudo ./sbin/services_restart cloud_sync |
set_ui_password.sh |
Change the password of the Broker VM Web UI. Run the command, enter the new password followed by Ctrl+D. | sudo ./sbin/set_ui_password.sh |
squid_tail |
Display the Proxy applet Squid log file in real-time. | sudo ./sbin/squid_tail |
Note
You can either restart_routes or reboot the Broker VM for the changes in the /etc/network/routes file to take affect.
Add Broker VM to cluster
Learn more about adding a Broker VM to a high availability cluster.
You can add standalone Broker VMs to a high availability (HA) cluster from either the Brokers tab or Clusters tab.
You can only add a Broker VM to a cluster, when the Broker VM version is 19.0 and later, the STATUS is Connected, and the Broker VM version isn't older than the cluster version.
Once you add a Broker VM to a cluster, the Broker VM becomes a cluster node and is added to the cluster folder in the Clusters tab. If it is the only peer Broker VM in the cluster, it is designated as the Primary node; otherwise, it is designated as a standby node.
- Select Settings → Configurations → Data Broker → Broker VMs.
- Add a Broker VM in one of the following tabs:
1) Right-click a standalone Broker VM, and select Add Broker to Cluster.
2) In the Select Cluster field, choose the cluster that you want this Broker VM to be added to.
- Right-click a cluster node, and select Add Broker to Cluster.
-
In the Select broker field, choose the standalone Broker VM that you want to add to this cluster.
- Click Add Broker. Adding a Broker VM to a cluster overrides all previous Broker VM settings and disables all active applets on this Broker VM. When the Broker VM is added to a cluster, the cluster configuration and cluster applet settings propagate to the Broker VM. The state of the applets on the Broker VM is dependent on the applet mode and Broker VM node role in the cluster. When the operation completes, a notification is added to the Notification Center.
Switchover Primary Node in Cluster
Learning more about changing the role of the current Primary node in a HA cluster.
You can manually change the role of the current Primary node in a high availability (HA) cluster from both the Brokers tab and Clusters tab of the Broker VMs page.
There are various reasons for changing the role of the current Primary node to another node in the HA cluster, for example, to perform maintenance, by initiating a manual switchover.
The option is only available for a Primary node, and only if there is another available standby node that is connected in the cluster.
- Select Settings → Configurations → Data Broker → Broker VMs.
- In either the Brokers tab or Clusters tab, right-click a Primary Broker VM node, and select Switchover.
- If multiple standby nodes are connected in the cluster, select the node that you want to change to Primary in the Select broker menu. When only one standby node is configured, skip this step.
- Click Switchover. When the switchover is completed, the roles of the node are switched. The new node is designated as Primary and the old node becomes a standby node. In addition, a notification is added to the Notification Center.
Remove from Cluster
Learn more about removing a Broker VM node from a high availability cluster.
You can remove a Broker VM node from a high availability (HA) cluster in either the Brokers tab or Clusters tab of the Broker VMs page. This option is only available if the Broker VM is currently a member of a cluster.
When a Broker VM node is removed from a HA cluster, it becomes a standalone Broker VM. All its configuration settings, including applet settings, are reset to default like a newly created Broker VM. If you remove a Primary node, an automatic failover occurs.
You can remove a Broker VM node from a cluster if the current node STATUS is Connected.
- Select Settings → Configurations → Data Broker → Broker VMs.
- In either the Brokers tab or Clusters tab, right-click a Broker VM node, and select Remove from Cluster.
- Follow the instructions in the dialog box, and click Remove. When removing the last node in the cluster, all applets in this cluster become Inactive, and the cluster becomes Unavailable. When the Broker VM receives the new configuration, the Broker VM becomes a standalone Broker VM with settings reset to default.
Note
If you've enabled a Load Balancer Health-Check on the cluster, you need to exclude this Broker VM from your Load Balancer settings.
Manage Broker VM data collector applets
Learn more about managing your Broker VM data collector applets from the Broker VMs page.
After you activate a Broker VM data collector applet, you can make additional changes as needed to the specific applet configured on the Broker VM or cluster. Select Settings → Configurations → Data Broker → Broker VMs to view detailed information regarding your registered Broker VMs in either the Brokers or Clusters tab. To modify a configuration, left-click the Broker VM applet in the APPS column to display the data collector applet settings and view detailed information regarding your applet. For more information on configuring these specific applets, see Broker VM data collector applets.
Note
For more information on the Broker VM applet connectivity status, see Manage Broker VM.
Configuration options available for all Broker VM data collector applets
The following options are available to select for all data collector applets:
- Configure: Enables you to redefine the Broker VM data collector configurations.
- Deactivate: Disables the Broker VM data collector. Cortex XSIAM provides the ability to maintain the Broker VM applet configurations whenever an applet is deactivated. This ensures that whenever the applet is reactivated the saved configuration is restored. When the dialog box is displayed to confirm deactivating the Broker VM data collector applet, leave the Save applet configuration checkbox selected (default) to maintain the applet configuration; otherwise, if this checkbox is unmarked, the applet configuration is deleted.
- Update: Initiates a manual upgrade for the specific applet. This option is only visible in the applet hovering menu when a new version is available.
Configuration options available to specific Broker VM data collector applets
The following additional options are only available to specific Broker VM data collector applets:
- Network Mapper:
- Scan Now: Initiates a scan.
- Windows Event Collector:
- Collection Configuration: Enables you to view or edit existing events or add new events to the collect.
Broker VM High Availability Cluster
Learn more about creating Broker VMs in a High Availability Cluster
High availability (HA) is a deployment in which at least two Broker VMs are placed in a Broker VM cluster, and their configuration is synchronized to prevent a single point of failure on your network at the hardware and application level. A heartbeat connection between the Broker VM nodes and the Cortex XSIAM Server ensures seamless failover if a node fails. Setting up a HA cluster provides redundancy and enables data collection continuity.
Cluster Architecture
The Clusters tab on the Broker VMs page enables you to view your cluster configurations, which display the associated nodes, node statuses, applets configured, and applet statuses. You can add as many clusters as you want in a tenant. Each Cortex XSIAM cluster can include as many nodes as you need. The cluster operation is fully managed from the tenant, and there is no need to install additional components. There is no need for cluster nodes to communicate with one another on the network. In each cluster, one Broker VM is designated as the Primary cluster node, and the rest of the nodes are designated as standby nodes. The cluster architecture is dependent on the type of applets configured in the cluster. Applets on cluster nodes run either in the active/active mode or in the active/passive mode and exhibit different behaviors as detailed in the table below.
Applet mode table
active/active
The applets that operate in the active/active mode listen simultaneously on all the nodes in the cluster to achieve High Availability and Load Balancing. Failure of an applet on a particular node causes all traffic to be redistributed to the remaining nodes in the HA cluster. Any applet that is a listener is active/active to ensure the source can send data, and anyone can pick it up based on availability.
Note
For Load Balancing, you must install a Load Balancer in your network, which will distribute the incoming data between the nodes.
The active/active applets are:
- Syslog Collector
- Netflow Collector
- Windows Event Collector
- Local Agent Settings
active/passive
The applets that operate in the active/passive mode retrieve data from the source, and run only on the Primary Node designated in the cluster. The other nodes are synchronized and ready to transition from standby to the active Primary Node should there be a failover. In this mode, all nodes share the same configuration settings, while only one operates at a given time. Any applet that is going outbound and pulling data is active/passive as the applet should only have one active Primary Node at a point in time, and the rest of the nodes should be passive.
The active/passive applets are:
- Kafka Collector
- Network Mapper
- CSV Collector
- FTP Collector
- Files and Folders Collector
- DB Collector
- Registry Scanner
Note
The following applets aren't supported when configuring Broker VMs in HA clusters: Cortex Network Scanner, DSPM Fileshare, Registry Scanner, and Transporter.
Automatic Failover
In each cluster, whenever there's a failure on the Primary node, Cortex XSIAM automatically switches to one of the standby nodes, initiates the applets on the new Primary node, and continues data collection on that node. Any successful or unsuccessful failover attempt displays an issue in the notification area and is logged in the Management Audit Logs table.
The following conditions can trigger a failover for the Primary node:
- Connectivity issues between a Primary node and the Cortex XSIAM server
- Application failure, such as failing to start an applet or an applet crashes
- Any failure of one of the internal components, such as MariaDB, Redis, RabbitMQ, or Docker engine
- Hardware failure, including:
- Running out of disk space
- CPU usage of more than 95% for more than 10 minutes
- Memory usage of more than 95% for more than 10 minutes
Manual Switchover
At any time, you can change the role of the current Primary node in the cluster to another node in the HA cluster, for example, to perform maintenance, by initiating a manual switchover.
Automatic Upgrades
You can configure automatic upgrades within Broker VM HA cluster nodes to update cluster nodes without noticeable downtime or other disruption of the HA cluster service by implementing the rolling upgrade mechanism. An automatic upgrade is performed in the following order:
- Standby nodes are upgraded one by one.
- The Primary node is switched over to one of the upgraded standby nodes.
- The previous Primary node, now a standby node, is upgraded.
Configure High Availability Cluster
Learn how to configure a High Availability Cluster.
You can create a High Availability (HA) cluster by either creating a new cluster from scratch and then adding applets and Broker VM nodes to the cluster, or by creating a new cluster from an existing standalone Broker VM. There is no limit to the number of clusters and nodes that you can add.
There are a number of different ways that you can configure the HA cluster to achieve fault tolerance depending on your system requirements. For example, once a cluster is created from scratch, you can start by configuring the applets that you want the cluster to maintain and then adding the Broker VM nodes that will be managed by the cluster to maintain this configuration, or vise versa. When you create a new cluster from an existing Broker VM, the cluster inherits the applets already configured, which can help save time with your cluster configuration.
Guidelines
Note the following guidelines:
- For the cluster to start working and provide services, you need at least one operational node. Until this node is added, the cluster is unavailable. Once a node is added, the cluster begins operating, but it's not considered healthy.
- For the cluster to be healthy and maintain HA and redundancy, you need at least two working nodes in the cluster.
- For active/active applets that require load balancing, you must install a Load Balancer in your network to distribute the incoming data between the nodes.
Prerequisite
Be sure you do the following task before creating a cluster from an existing Broker VM:
- If the Broker VM is explicitly specified in some Agent Settings profile, which means Cortex XDR agents retrieve release upgrades and content updates from this Broker VM, you must change the Broker VM's current designated role. To do this, you need to modify the Agent Settings profile by removing the specific selection of this broker as a Download Source for XDR agents (Endpoints → Policy Management → Prevention → Profiles → Edit Profile → Download Source → Broker Selection). After you create the cluster for this broker, you can go back the Agent Settings profile and select the cluster that you created from this broker to be used as a Download Source for XDR agents.
Perform the following procedures in the order listed below.
Task 1. Open the Broker VMs page in Cortex XSIAM
Select Settings → Configurations → Data Broker → Broker VMs.
Task 2: Determine how you want to create an HA cluster.
- To create a cluster and then add Broker VMs to the cluster, click Add Cluster.
- To create a new cluster from an existing Broker VM in the Brokers tab, right-click a standalone Broker VM, and click Create a Cluster from this Broker.
Important
- You can only create a new cluster from an existing Broker VM, when the Broker VM version is 19.0 and later, and the STATUS is Connected.
- The Create a Cluster from this Broker option is only listed if the Broker VM is not already added to a cluster.
Task 3. Set the applicable parameters
Define the following parameters:
Load Balancer FQDN
Specify the domain name of your Load Balancer FQDN as configured in your local DNS server. The Load Balancer FQDN settings affect the Windows Event Collector and Local Agent Settings applets.
When creating a cluster from an existing Broker VM and either a WEC or Local Agent Settings applet are enabled in the Broker VM, the Load Balancer FQDN is mandatory to configure, and is automatically populated based on the Broker VM settings.
Load Balancer Health Check options
Implementing a Load Balancer requires exposing a health check API that is called by the Load Balancer at regular intervals. You can access the health check page by sending an HTTP request to http[s]://<Broker VM IP>:<port>/health/. A successful HTTP response of 200 OK as the status code indicates the Broker VM’s readiness to receive logs.
Disabled/Enabled toggle
When Disabled the Load Balancer Health Check listening port is blocked. When Enabled (default), the listening port is opened, and you must define the Port number (default 8088) and Protocol (default HTTP).
Note
The Broker VM Load Balancer Health Check requires HTTP/1.1 or higher. Legacy HTTP/1.0 is no longer supported. Ensure your external load balancer is configured to use HTTP/1.1 or above when performing health checks.
Important
When the Protocol is set to HTTPS, you may need to perform a few follow-up steps to establish a validated secure SSL connection with the Broker VM.
- If you're using your own Certificate Authority (CA) to sign the certificates, you'll need to place the CA in the client, such as the Load Balancer, and upload the certificates to the Broker VM.
- If you're using a Trusted CA Signed SSL Certificate, you'll only need to upload it to the Broker VM.
- If the SSL Server Certificates of the Broker VM are self-signed certificates, no further steps are necessary.
Auto Upgrade options
You can configure automatic upgrades within Broker VM HA cluster nodes to update cluster nodes without noticeable down-time or other disruption of the HA cluster service by implementing the rolling upgrade mechanism. Setting automatic upgrades includes these parameters:
Auto Upgrade
In a HA cluster configuration, the rolling upgrades process is automatically performed by default whenever a new version of the Broker VM is available.
If you want to upgrade the Broker VM nodes manually, clear the Use Default (Enabled) checkbox, and set Auto Upgrade to Disabled. You can manually upgrade the Broker VM nodes individually by right-clicking the Broker VM and selecting Upgrade Broker version.
Days In Week
You can configure the days in the week that the rolling upgrades are performed. By default, the upgrades are configured to run every day.
Schedule
You can configure whether the rolling upgrades are performed at any time during the day or at a specific time by setting a time range of at least 4 hours.
Once configured, the rolling upgrades are only performed when the cluster STATUS is Healthy. An automatic upgrade is performed in the following order:
Read more...
- Standby nodes are upgraded one by one.
- The Primary node is switched over to one of the upgraded standby nodes.
- The previous Primary node, now a standby node, is upgraded.
Task 4. Save your changes
Click Save.
The cluster is now listed in the Clusters tab of the Broker VMs page, whose output differs depending on how the cluster was created:
New cluster added
When the cluster is added from scratch, the cluster is listed as an empty folder, and you can start to add Broker VM nodes and applets to this cluster. While the cluster doesn’t have any peer nodes, the STATUS is Unavailable.
Cluster added from an existing Broker VM
When the cluster is added from an existing Broker VM, the cluster inherits all applet settings from the Broker VM. You can leave the configuration as is or add/remove additional applets as desired. This node automatically becomes the first node (Primary) in the cluster. You can now add other Broker VM nodes to this HA cluster. While the cluster contains only one Broker VM node, the STATUS is Warning.
Task 5. Add Broker VMs to your cluster as you require to achieve fault tolerance and high availability
For the cluster to be healthy and maintain HA and redundancy, you need at least two working nodes in the cluster.
- To add Broker VM, see Add Broker VM to cluster.
- To add applets, see Add applet to cluster.
Manage Broker VM clusters
Learn more about managing your broker VM clusters from the Clusters tab of the Broker VMs page.
After you've configured a cluster, you can manage all your Broker VM clusters from the Clusters tab on the Broker VMs page (Settings → Configurations → Data Broker → Broker VMs → Clusters).
The Clusters tab displays in a heirarchical view the clusters with their nodes, performance stats, applets configured, and the state of each applet. You can right-click any cluster to open a menu listing the tasks available management options.
View cluster details
Learn more about viewing the details of any particular cluster.
The Clusters tab of the Broker VMs page (Settings → Configurations → Data Broker → Broker VMs) enables you to view detailed information regarding your High Availability (HA) cluster.
The Clusters table enables you to monitor and mange your cluster nodes and applets, and view stats.
In addition, when each cluster is expanded, a table is displayed, which enables you to view detailed information regarding the various Broker VM nodes that are currently added to your cluster. If you haven't added any Broker VM nodes to a particular cluster, the table is empty.
Clusters Table
The following table describes all the fields that are available in the Clusters table. You can hide any field column using the column manager.
| Fields | Description |
|---|---|
| CLUSTER NAME | <p>Beside the full name of each cluster, a status indicator is displayed with one of the following colors:</p><ul><li>Green: Healthy, the Primary node and all available standby nodes are connected and operating with no warnings, and all activated applets are running without a problem.</li><li>Orange: Warning as the system has detected errors in the cluster, but the applets can still be running. For example, all applets are running normally in the Primary Broker VM, but no available standby nodes are detected, or the Primary node is operating fine, but there is an applet that failed to start in one of the standby nodes. The errors must be addressed as soon as possible.</li><li>Red: Critical as the system has detected one or more critical errors in the cluster, and nodes are not able to run some applets. For example, an error was detected in some Primary applet and no standby node is available for failover. All errors must be addressed as soon as possible.</li><li>Black: Unavailable as the cluster doesn’t have any peer nodes configured.</li></ul> |
| STATUS | Connection status of the cluster according to the statuses and colors explained in the CLUSTER NAME field above. Unavailable clusters do not display CPU USAGE, MEMORY USAGE, and DISK USAGE information. Notifications about the cluster losing connection between applets and Broker VM nodes appear in the Notification Center. |
| CPU USAGE | Average CPU utilization between all nodes in the cluster as a percentage. |
| MEMORY USAGE | Sum of all memory in use out of the sum of the total memory on all nodes in the cluster as a percentage. |
| DISK USAGE | Sum of all disk space in use out of the sum of the total disk space on all nodes in the cluster as a percentage. |
| APPS | <p>List of active applets and the connectivity status for each. Colors depict the following statuses:</p><ul><li>Green (Connected): Indicates the applet has no issues.</li><li>Orange (Warning): Indicates the applet has minor issues.</li><li>Red (Error): Indicates the applet has errors.</li><li>White (Inactive): Indicates the applet is inactive.</li></ul><p>Note</p><p>For more information on troubleshooting errors and warnings for these applets, see Troubleshoot Broker VM applet errors.</p> |
Cluster Broker VM Nodes Table
The fields that are available in the Broker VM nodes table for each cluster are similar to many of the fields that are displayed in the table for the Broker VMs in the Brokers tab. For more information on these fields, see Manage Broker VM.
Edit cluster
Learn how to edit a High Availability cluster.
After configuring a high availability (HA) cluster, you can always edit the cluster configurations from the Clusters tab of the Broker VMs page.
An HA cluster is always configurable no matter what the status of the cluster or whether it has any Broker VM nodes added.
- Select Settings → Configurations → Data Broker → Broker VMs, and select the Clusters tab.
- In the Clusters table, locate the cluster, right-click, and select Configure.
- In the Cluster Configurations window, you can edit the parameters based on your previous settings. For more information on each of these settings, see Configure High Availability Cluster.
- Update the cluster with your changes.
Add applet to cluster
You can add an applet to a high availability (HA) cluster from the Clusters tab of the Brokers VM page.
You can always add an applet to a cluster, even if the cluster status is Unavailable or Error. When an applet is added to a cluster without any Broker VM nodes, the cluster status is Unavailable and the cluster APPS status displays as Inactive.
- Select Settings → Configurations → Data Broker → Broker VMs, and select the Clusters tab.
- In the Clusters table, locate the cluster that you want to add an applet.
- You can either right-click the cluster, and select Add App → , or in the APPS column, left-click Add → . The applet is only available for you to add to the cluster if it hasn't already been added.
- Configure your applet. The various applets that you can configure are the same as when configuring a standalone Broker VM. For more information on a particular applet configuration, locate the applet in the Set up Broker VM section in the Cortex XSIAM Admin Guide. The applet is listed with a status indicator in the APPS column, where the colors depict the following statuses:
- Green (Connected): Indicates the applet has no issues.
- Orange (Warning): Indicates the applet has minor issues.
- Red (Error): Indicates the applet has errors.
- White (Inactive): Indicates the applet is inactive.
Note
For more information on troubleshooting errors and warnings for these applets, see Troubleshoot Broker VM applet errors.
Once the applet configuration is changed in a cluster, the changes are automatically applied to the cluster nodes depending on the applet and cluster node role. For example, if you add the Kafka Collector, which is an "active/passive" applet, the applet is automatically initiated and enters an active state on the Primary node and is on standby on the standby nodes. While if you add the Syslog Collector "active/active" applet, the changes automatically propagate so that the applet is active on all cluster nodes, including Primary and standby.
Add Broker VM to cluster
You can add standalone Broker VMs to a high availability (HA) cluster from either the Brokers tab or Clusters tab.
You can only add a Broker VM to a cluster, when the Broker VM version is 19.0 and later, the STATUS is Connected, and the Broker VM version isn't older than the cluster version.
Once you add a Broker VM to a cluster, the Broker VM becomes a cluster node and is added to the cluster folder in the Clusters tab. If it is the only peer Broker VM in the cluster, it is designated as the Primary node; otherwise, it is designated as a standby node.
- Select Settings → Configurations → Data Broker → Broker VMs.
- Add a Broker VM in one of the following tabs:
1) Right-click a standalone Broker VM, and select Add Broker to Cluster.
2) In the Select Cluster field, choose the cluster that you want this Broker VM to be added to.
- Right-click a cluster node, and select Add Broker to Cluster.
-
In the Select broker field, choose the standalone Broker VM that you want to add to this cluster.
- Click Add Broker. Adding a Broker VM to a cluster overrides all previous Broker VM settings and disables all active applets on this Broker VM. When the Broker VM is added to a cluster, the cluster configuration and cluster applet settings propagate to the Broker VM. The state of the applets on the Broker VM is dependent on the applet mode and Broker VM node role in the cluster. When the operation completes, a notification is added to the Notification Center.
Remove cluster
Learn more about removing a high availability cluster.
You can remove a high availability (HA) cluster in the Clusters tab of the Broker VMs page.
When removing a cluster, the cluster is disassembled and the cluster object is deleted. All nodes in the cluster are reverted back to standalone Broker VMs with their settings reset to default as a newly created Broker VMs.
If you've configured load balancing for any "active/active" applets configured, you need to update your Load Balancer configuration settings to stop sending logs to these Broker VM nodes.
You cannot remove a cluster that is used as a download source from which the Cortex XDR agents retrieve release upgrades and content updates. You'll need to change the cluster's current designated role before removing a cluster.
- Select Settings → Configurations → Data Broker → Broker VMs.
- In the Clusters tab, right-click a cluster, and select Remove Cluster.
- Follow the instructions in the REMOVE CLUSTER window, whose instructions differ depending on the type of cluster you are trying to remove, and Remove the cluster.
Broker VM notifications
Learn about the notifications that are relevant to Cortex XSIAM Broker VMs.
To help you monitor your Broker VM version, connectivity, and high availability clusters, Cortex XSIAM sends notifications to your Cortex XSIAM console Notification Center.
Cortex XSIAM sends the following notifications:
Add Cluster
Notifies when a cluster was added.
Applet Activated
Notifies when an applet is activated on a cluster.
Applet configuration
Notifies when an applet on a cluster configuration was updated.
Applet Deactivated
Notifies when an applet is deactivates on a cluster.
Broker VM Connectivity
Notifies when the Broker VM has lost connectivity to Cortex XSIAM .
Broker VM Disk Usage
Notifies when the Broker VM is utilizing over 90% of the allocated disk space.
Cluster Configuration
- Notifies when a Broker VM node was added to a cluster.
- Notifies when a Broker VM node was removed from a cluster.
- Notifies when the configuration for the cluster needs to be set.
Cluster failover
- Notifies when a failover is initiated in the cluster from one Broker VM node to another.
- Notifies when a failover completed successfully. The Broker VM is now Primary in the cluster.
- Notifies when a failover in the cluster completed with errors and error message.
- Notifies when couldn't perform a failover in the cluster as there is no available standby node with sufficient redundancy.
Cluster health declined
- Notifies when failed to detect an available standby Broker VM node in the cluster.
- Notifies when critical errors detected in the cluster and there is no available standby Broker VM node for failover.
Cluster health recovered
Notifies when detected an available standby Broker VM node in the cluster.
Disk space allocation on broker
Notifies whether the disk space allocated for data caching in the Broker VM has been increased successfully. If not, the notification includes the errors encountered during the process. For more information on allocating disk space to the Broker VM, see Increase Broker VM storage allocated for data caching.
Broker VM requires a reboot
Notifies after a Broker VM update whether a broker needs a reboot to finish installing important updates.
New Broker VM Version
Notifies when a new Broker VM version has been released.
- If the Broker VM Auto Upgrade is disabled, the notification includes a link to the latest release information. It is recommend you upgrade to the latest version.
- If the Broker VM Auto Upgrade is enabled, 12 hours after the release you are notified of the latest upgrade, or you are notified that the upgrade failed. In such a case, open a Palo Alto Networks Support Ticket.
Reinstall Broker VM with a new image
For all brokers that were deployed with an old Broker VM image downloaded prior to July 9th, 2023 (installed with Ubuntu 18.04 or earlier), the Broker VM must be reinstalled with a new image (installed with Ubuntu 20.04 or later) before upgrading to the latest version. The name of the Broker VM to upgrade is indicated with a link to the instructions.
Note
For more information on upgrading to a new Broker VM image, see Migrating to a New Broker VM Image.
Remove Cluster
Notifies when a cluster was removed.
To ensure you stay informed about Broker VM activity, you can also configure notification forwarding to forward your Broker audit logs to an email distribution list or Syslog server. For more information about the Broker VM audit logs, see Broker VM Activity in the Cortex XSIAM Administrator Guide.
Monitor Broker VM activity
Learn more about the monitored Cortex XSIAM Broker VM activities.
Cortex XSIAM logs entries for events related to the Broker VM monitored activities. Cortex XSIAM stores the logs for 365 days. To view the Broker VM audit logs, select Settings → Management Audit Logs.
To ensure you and your colleagues stay informed about Broker VM activity, you can Configure notification forwarding to forward your Broker VM audit logs to an email distribution list or Syslog server.
You can customize your view of the logs by adding or removing filters to the Management Audit Logs table. You can also filter the page result to narrow down your search. The following table describes the default and optional fields that you can view in the Cortex XSIAM Management Audit Logs table:
Certain fields are exposed and hidden by default. An asterisk (*) is beside every field that is exposed by default.
| Field | Description |
|---|---|
| Description* | Log message that describes the action. |
| Email of the user who performed the action. | |
| Host Name* | Name of any relevant affected hosts. |
| ID | Unique ID of the action. |
| Reason | This field is not applicable for Broker VM logs. |
| Result* | The result of the action ( Success, Fail, or N/A) |
| Severity* | <p>Severity associated with the log:</p><ul><li>Critical</li><li>High</li><li>Medium</li><li>Low</li><li>Informational</li></ul> |
| Timestamp* | Date and time when the action occurred. |
| Type* and Sub-Type* | <p>Additional classifications of Broker VM logs (Type and Sub-Type):</p><ul><li><p>Broker VMs:</p><ul><li>Action on device</li><li>Add Cluster</li><li>Applet Activated</li><li>Applet Configuration</li><li>Applet connection_test Action</li><li>Applet Deactivated</li><li>Applet License Expired</li><li>Applet Mount Share Action</li><li>Applet Mount Share Test Action</li><li>Applet preview Action</li><li>Applet Scan Now Action</li><li>Applet Set Configuration</li><li>Applet Unmount All Shares Action</li><li>Applet Upgrade: Records manual or automatic updates of individual applets.</li><li>Authentication succeeded</li><li>Broker Log</li><li>Cluster Configuration</li><li>Cluster Failover</li><li>Cluster health declined</li><li>Cluster health recovered</li><li>Cluster Switchover</li><li>Device configuration</li><li>Disconnect</li><li>Register</li><li>Remove Cluster</li><li>Remove Device</li><li>Rolling Upgrades</li><li>Subscription Created</li><li>Subscription Deleted</li><li>Subscription Edited</li></ul></li><li><p>Broker API:</p><ul><li>Authentication failed</li></ul></li></ul> |
| User Name* | Name of the user who performed the action. |
Troubleshoot Broker VM applet errors
Learn more about how to verify the Broker VM applet application, connectivity, and processing errors and troubleshoot.
You can monitor the Broker VM applet status from the Broker VM page in the Apps column. For all Broker VM applets in both the Brokers and Clusters tabs, a status indicator icon indicates whether the applet is connected or has an error. Certain Broker VM applets provide more information to help you troubleshoot by providing specific errors and warnings. For each of these errors and warnings, a different root cause is provided with a recommended action so that you can easily resolve the problem. In addition, you can always monitor your Broker VM application, connectivity, and processing errors for supported applets using the Cortex Query Language (XQL) and the collection_auditing dataset.
| COLLECTOR\_TYPE | INSTANCE | CLASSIFICATION | DESCRIPTION | \_BROKER\_DEVICE\_ID | \_BROKER\_DEVICE\_NAME | \_BROKER\_IP\_ADDRESS | \_TIME |
|---|---|---|---|---|---|---|---|
| Local Agent Settings | LVVTKM6S | INFORMATION | The applet is back to an active status | LVVTKM6S | LVVTKM6S | 155.11.23.22 | Jan 18th 2025 16:27:26 |
| Local Agent Settings | LVVTKM6S | ERROR | There is at least one inaccessible url. The broker VM needs to communicate with the same URLs that the agents communicate with. | LVVTKM6S | LVVTKM6S | 155.11.23.22 | Jan 18th 2025 11:15:26 |
| Local Agent Settings | LVVTKM6S | INFORMATION | The applet is active | LVVTKM6S | LVVTKM6S | 155.11.23.22 | Jan 10th 2025 16:25:21 |
Understand how to troubleshoot
To help you troubleshoot your supported Broker VM applets, the table below lists the different possible warning and error event types, including the applicable error or warning that is displayed when you left-click the applet on the Broker VM page, the description displayed in the collection_auditing dataset, the root cause of the problem, and the recommended action to resolve the problem. We recommend that you use this table as a first resource to troubleshoot your application, connectivity, and processing errors.
| Applet | Event Type | Broker VM page message | Description in the collection_auditing dataset | Root Cause | Recommended Action |
|---|---|---|---|---|---|
| Database Collector | Warning | The query has been running for over minutes. driver: , server: , port: , database: , query title: . | One of the queries has been running for too long. | A long-running query was detected. This may indicate inefficiencies in the query logic or large data retrieval. | <ul><li>Consider optimizing the query.</li><li>Check database performance.</li><li>Try running the query directly on the database. Check runtime and verify the issue is the query and not the collector.</li><li>If the problem persists, contact support for further assistance.</li></ul> |
| Database Collector | Warning | Could not parse the initial value. driver: , server: , port: , database: , query title: , initial value: <initial_value>. | Could not parse the initial value for a query. | The rising column initial value failed to parse when initializing the query parameters from the configuration. | <ul><li>Validate the initial value has a valid format.</li><li>If the problem persists, contact support for further assistance.</li></ul> |
| Database Collector | Warning | The system couldn't run the new snapshot query because the results from your previous query are still uploading. | The system couldn't run the new snapshot query because the results from your previous query are still uploading. | The query kept running for a long time even when a new execution was supposed to start. | First, on the server side, confirm that the query is taking a long time. If it is, increase the collection interval to prevent the next run from overlapping with the current query. |
| Database Collector | Warning | The snapshot query and data upload were canceled because they either exceeded the hour time limit or encountered an internal error. | The snapshot query and data upload were canceled because they took too long, or encountered an internal error. | The query and data upload were canceled because they exceeded the time limit. | On the server, confirm the query is taking a long time. |
| Database Collector | Error | Could not connect to the database. driver: , server: , port: , database: . | Could not connect to the database. | An issue occurred when the collector tried to establish an initial connection to the specified database. | <ul><li>Check database connectivity and credentials.</li><li>Check database for refused connections and reasons.</li><li>If the problem persists, contact support for further assistance.</li></ul> |
| Database Collector | Error | Could not run the query. driver: , server: , port: , database: , query title: . | Could not run one of the configured queries. | An issue occurred while executing one of the configured queries, possibly due to syntax or permissions. | <ul><li>Check the query syntax and database permissions.</li><li>Ensure all fields are properly defined.</li><li>Try running the query directly on the database.</li><li>If the problem persists, contact support for further assistance.</li></ul> |
| Database Collector | Error | Could not write the state to server cache. | Could not write data to the server cache. | The collector encountered an error while trying to write data to the server's cache. | This issue can occur intermittently. If the problem persists, contact support for further assistance. |
| Database Collector | Error | Could not stream the collector results to the server. | Could not stream results to the server. | An issue occurred where results could not be streamed to the tenant due to an internal component failure. | This issue can occur intermittently. If the problem persists, contact support for further assistance. |
| Files and Folders Collector | Warning | The total file size in the folder <folder_path> for file type <file_type> has exceeded the allowed 30 MB limit in replace mode | The total folder size exceeded the allowed 30MB limit in replace mode. | An issue that occurs when the total folder size exceeds the allowed 30MB limit in Replace mode for the Storage Method as defined in the Data Source Mapping. For more information, see Activate Files and Folders Collector. | This issue occurs when the total folder size exceeds the allowed 30MB limit in Replace mode for the Storage Method as defined in the Data Source Mapping. For more information, see Activate Files and Folders Collector. |
| Files and Folders Collector/FTP Collector | Error | Failed to stream collector results to server | Could not write data to server cache. | An issue occurred where the collector failed to stream data to an internal component, preventing it from reaching the tenant. | This issue can occur intermittently. If the problem persists, contact support for further assistance. |
| Files and Folders Collector | Error | Invalid mount detected at path <folder_path> | Invalid mount point detected. | An issue that occurs when an invalid mount point is detected. | <ul><li>Make sure the path configured is the correct path and there are no permissions issues.</li><li>If the problem persists, contact support for further assistance.</li></ul> |
| FTP Collector | Error | Failed to load SSH key for server at path <folder_path> | Failed to load SSH key. | The SSH key file for SFTP connections could not be loaded or parsed. | Verify the SSH key configuration. If the problem continues, contact support for further assistance. |
| FTP Collector | Error | Failed to login to server at path <folder_path> due to an SSL Certification error. | Failed to login to the server due to an SSL Certification error. | SSL/TLS certificate validation failed during secure FTP connection. | Verify the server's certificates. Ensure the Certificate Authority (CA) is valid and trusted. |
| FTP Collector | Error | Login failed for server at path <folder_path> with user . | Login failed for the server. | FTP authentication failed due to incorrect username/password. | Check the configured login details and permissions. Ensure the correct username and password are used. |
| FTP Collector | Error | Failed to login to server at path <folder_path> with user as the connection timed out. | Failed to login to the server as the connection timed out. | Connection attempt to the FTP server timed out. | Check the network connection and confirm the FTP server is accessible from the Broker VM. |
| FTP Collector | Error | Failed to connect to server at path <folder_path>. | Failed to connect to server. | Unable to establish a connection to the FTP server. | Confirm the server can be accessed and there are no network restrictions. If the problem continues, contact support for further assistance. |
| FTP Collector | Error | Connection to the FTP server at path <folder_path> timed out while trying to list the directory content. This probably happened as the server is using Active mode, but only Passive mode is supported. | Connection to the FTP server timed out while trying to list the directory content. This probably happened as the server is using Active mode, but only Passive mode is supported. | FTP server failed to list directory contents, likely due to Active/Passive mode misconfiguration. | Configure the FTP server to use Passive mode, and verify directory listing permissions. If the problem continues, contact support for further assistance. |
| FTP Collector | Error | Failed to access the path <folder_path> on server . The path doesn't exist, is unavailable, or access was denied due to permissions. | The specified path couldn't be accessed as either the path doesn't exist, is unavailable, or access was denied due to permissions. | The configured path does not exist, is unavailable, or access was denied due to permissions. | Make sure the configured path is correct and that there are no permissions issues. If the problem continues, contact support for further assistance. |
| Kafka Collector | Warning | Failed to parse a log from the configured server list: <bootstrap_server_list>. The log does not match the expected format <expected_type>. Consider using the 'RAW' type to ingest logs in their current format. | Log parsing failed due to an unexpected format for Apache Kafka servers. | The user configured the port to receive logs from type CEF or LEEF, but the logs are either of a different type or contain errors. | Verify the logs in the Apache Kafka topics are in the correct format. If the format doesn't match, consider using the 'RAW' log type in the collector configuration. |
| Kafka Collector | Error | Could not create an Apache Kafka dialer for the configured server list: <bootstrap_server_list> | Could not create an Apache Kafka dialer for the Kafka client. | Attempt to create the SSL/SASL dialer configuration failed during initialization. | Verify the Apache Kafka configuration, including SSL/SASL settings, and ensure that the certificates are valid and correctly configured. If the problem continues, contact support for further assistance. |
| Kafka Collector | Error | Failed to retrieve a topic list from the configured server list: <bootstrap_server_list> | Failed to retrieve a topic list from the Apache Kafka servers. | The collector failed to retrieve a topic list from the Apache Kafka servers. | Check for any network connectivity issues and the status of the Apache Kafka server. If the problem continues for an extended period, contact support for further assistance. |
| Kafka Collector | Error | Failed to create an Apache Kafka consumer for the configured server list: <bootstrap_server_list> | Failed to create an Apache Kafka consumer. | The collector failed to create a consumer for any of the configured topics. | Check for any network connectivity issues and the status of the Apache Kafka server. If the problem continues for an extended period, contact support for further assistance. |
| Kafka Collector | Error | Failed to read a message using the Apache Kafka consumer from the configured server list: <bootstrap_server_list> | Failed to read a message using the Apache Kafka consumer. | An error occurred while the collector was reading messages using the Apache Kafka consumer. | Review the collector's logs for more specific error details. If the problem continues, contact support for further assistance. |
| Kafka Collector | Error | Couldn't retrieve the number of partitions for the topic from the configured server list: <bootstrap_server_list> | Couldn't retrieve the number of partitions for the topic. | The collector failed to retrieve the partition list from the Apache Kafka server. | Check for any network connectivity issues and the status of the Apache Kafka server. If the problem continues for an extended period, contact support for further assistance. |
| Kafka Collector | Error | There are no configured topics available on the configured server list: <bootstrap_server_list> | There are no configured topics available on the Apache Kafka servers. | The topic patterns configured don't match any existing topics on the Kafka Collector applets. The system will automatically try again to find them. | This is mainly an informational message. The system will automatically try again to find the topics. If the topics are expected to exist, verify the topic names and patterns in the collector configuration. |
| Local Agent Settings | Warning | Failed to download and store <package_type> (version: , os: ) inside the Broker VM for agent package caching | Failed to download and store content/installer for agent package caching. | An issue that occurs while downloading the content/installer and extracting it. | If the problem persists, contact support for further assistance. |
| Local Agent Settings | Warning | The Broker VM failed to process request of agent package cache update <package_type>. | Failed to process request of agent package cache update. | Broker VM failed to get the list of content/installer from the tenant. | If the problem persists, contact support for further assistance. |
| Local Agent Settings | Warning | The disk space allocated for agent installer and content caching exceeds 90% (<number> GB). | The disk space allocated for agent installer and content caching exceeds 90%. | Agent installer and content caching exceeds 90% of the allocated disk space for. | If you intend to use the Broker VM for agent installer and content caching, you must use extra disk space. For more information, Increase Broker VM storage allocated for data caching. |
| Local Agent Settings | Error | Inaccessible url: The Broker VM needs to communicate with the same URLs as the Agents. | There is at least one inaccessible URL. The Broker VM needs to communicate with the same URLs that the agents communicate with. | An issue with the accessibility to a URL as the Broker VM needs to communicate with the same URLs as the Agents. | <ul><li>Make sure the URL is not blocked by the firewall.</li><li>Try running a curl command on the URL marked as inaccessible inside the VM: curl -I <URL></li><li>Contact support for further assistance</li></ul> |
| Local Agent Settings | Error | No more disk space available for agent installer and content caching. | No more disk space available for agent installer and content caching. | Agent installer and content caching exceeds 100% of the allocated disk space for. | If you intend to use the Broker VM for agent installer and content caching, you must use extra disk space. For more information, Increase Broker VM storage allocated for data caching. |
| NetFlow Collector | Warning | Received a NetFlow packet with an unsupported protocol version on port <dest_port>. The supported versions are <supported_versions>. | Received a NetFlow packet with an unsupported protocol version. | The NetFlow Collector received packets using an unsupported protocol version by the current implementation. | Ensure the NetFlow exporter is configured to use one of the supported NetFlow versions. Verify that only NetFlow traffic is being sent to the configured port. If the problem continues, contact support for further assistance. |
| Network Mapper | Warning | Part of the IP range configured has no hosts. Check the Broker VM logs for more details. | Part of the IP range configured has no hosts. Check the Broker VM logs for more details. | The Network Mapper wasn't able to detect any active hosts in part of the configured IP range during the scanning process. | Verify the configured IP range and ensure hosts are active and reachable. If the problem continues for an extended period, contact support for further assistance. |
| Syslog Collector | Warning | First log over the connection doesn't have the expected type. Log format: , expected format: . The connection has been closed by the collector. vendor: , product: , source: , port: . | The initial received log over the connection does not match the expected log format. | The Syslog collector applet was configured to receive logs of a specific type, and the logs that were received through the configured port are either of a different type or contain errors. | Check the logs transmitted over the connection and ensure they match the log type specified in the configuration. |
| Syslog Collector | Warning | Log size exceeded 65 KB for , on port: (vendor: , product: ). This may happen if a single log entry is too large or if logs lack end-of-line delimiters, causing them to merge and exceed the size limit. | A log entry exceeded the maximum allowed size. | The issue is caused by either a log exceeding 65 KB or logs missing an end-of-line delimiter, which causes them to aggregate as 'partial logs' and hit the 65 KB limit. | Ensure the logs are within the size limit and include an end-of-line delimiter. |
| Syslog Collector | Warning | Connection rejected from . Port is restricted to specific source IPs, and the provided IP is not on the allowed list. | Connection rejected due to a source IP restriction. | The configuration includes specific networks/IPs to send logs to a specific port of the Syslog collector applet. The Syslog collector applet detected a src IP that tried to send logs through the port, which isn't in the allowed list. |
This is an informational event and does not impact the data collector applet's operation, except for rejecting the SRC IP connection. Examine the srcIP detected by the data collector applet and verify its origin. |
| Syslog Collector | Warning | Failed to parse log from on port (vendor: , product: ). The log does not match the expected format 'CEF', as configured for this port. Consider using the 'RAW' type to ingest logs in their current format. | Log parsing failed due to an unexpected format. | The port was configured to receive logs in a CEF format, and the logs that were sent from the log exporter were either of a different type or contain errors. | Ensure that the logs are in the correct CEF format. If it does not match the format type, consider using 'RAW' type logs in the configuration. |
| Syslog Collector | Warning | Failed to parse log from on port (vendor: , product: ). The log does not match the expected format 'LEEF', as configured for this port. Consider using the 'RAW' type to ingest logs in their current format. | Log parsing failed due to an unexpected format. | The port was configured to receive logs in a LEEF format, and the logs that were sent from the log exporter were either of a different type or contain errors. | Ensure that the logs are in the correct LEEF format. If it does not match the type, consider using 'RAW' type logs in the configuration. |
| Syslog Collector | Warning | Unable to automatically detect the initial log over the connection for vendor: , product: , source: , port: . the log will be discarded. | Unable to automatically detect the initial log over the connection, the log will be discarded. | The configuration is set to 'auto-detect' for the log type, and the Syslog collector applet can't detect the first log over the connection from the four known log types: CEF, LEEF, Corelight, and Cisco. The Syslog collector applet does attempt a second try on the second log over the connection. If this attempt fails as well, then the Syslog collector uses the 'RAW' type log for all the logs over this specific connection. | Ensure that the logs being sent have one of the four supported log types: CEF, LEEF, Cisco, or Corelight. If it does not match any of the types, consider using 'RAW' type logs in the configuration. |
| Syslog Collector | Warning | Failed to parse octet-framing packet from on port (vendor: , product: ). Please verify the packet structure and format. | Failed to process the packet due to a missing length header. The packet does not conform to the expected octet-framing format. | The log exporter is sending the logs using a octet-framing method, and the Syslog collector is experiencing problems with the structure/format that is being sent. | Ensure that the logs are being sent correctly using the octet-framing method. |
| Syslog Collector | Error | Failed loading client key from the configuration on port . Please verify the certificate and key settings. | Failed to load a client key from the configuration. | An issue with the certificates added by the user to the Syslog collector's configuration. | Verify the settings for the certificates and keys. |
| Syslog Collector | Error | Failed to process CA certificate from the .pem file configured on port . Please verify the certificate and key settings. |
Failed to parse the CA certificate from the provided configuration. | An issue with the certificates added by the user to the Collector's configuration. | Verify the settings for the certificates and keys. |
| WEC | Error | Failed starting WEC applet due to an internal error. The applet would require a restart to restore functionality. | Failed starting WEC applet due to an internal error. | A rare error that can occur due to an internal program issue. | Deactivate the WEC, and then reactivate it. The WEC configuration will be saved, and the collector will restart. If the error persists, contact support for further assistance. |
| Database Collector/ Files and Folders Collector/ FTP Collector/ Kafka Collector/ NetFlow Collector/ Network Mapper/ WEC / Syslog Collector | Warning | Log entry limit exceeded for ( format). Entry Size: KB Maximum Allowed: KB | Log entry limit exceeded. | A log entry has exceeded the maximum size limit. This occurs when an entry remains larger than the allowed threshold even after compression. | Review the log source configuration to reduce individual log entry sizes. |
| Database Collector/ Files and Folders Collector/ FTP Collector/ Kafka Collector/ NetFlow Collector/ Network Mapper/ WEC / Syslog Collector | Error | The collector could not connect to the third-party persistence service. This issue must be resolved to restore functionality. | Failed to establish an initial connection to the persistence service. | The persistence service for the data collector applet, is not functioning properly. As a result, the applet is unable to operate since this service is essential for its functionality. | If the problem persists, contact support for further assistance. |
| Database Collector/ Files and Folders Collector/ FTP Collector/ Kafka Collector/ NetFlow Collector/ Network Mapper/ WEC / Syslog Collector | Error | The collector is unable to read from the persistence service. This issue must be resolved to restore functionality. | Unable to read from the persistence service. | The persistence service for the applets, is not functioning properly. As a result, the applet is unable to operate since this service is essential for its functionality. | The data collector applet is unable to read from the persistence service. This issue must be resolved to restore functionality. |
| Database Collector/ Files and Folders Collector/ FTP Collector/ Kafka Collector/ NetFlow Collector/ Network Mapper/ WEC / Syslog Collector | Error | The collector could not reach the receptor (Tenant) to transmit data. This issue must be resolved to restore functionality. | Unable to connect to the receptor for data transmission. | The applet can't send logs to the tenant due to some network problem. | Review the network setup and check for any firewalls, proxies, or other network components that could potentially cause interruptions. |
| Files and Folders Collector/ FTP Collector | Warning | Failed to parse log from <folder_path> (vendor: , product: . The log does not match the expected format <expected_type>, as configured for this folder path. Consider using the 'RAW' type to ingest logs in their current format. | Log parsing failed due to an unexpected format. | The user configured the port to receive logs from type CEF or LEEF, but the logs are either of a different type or contain errors. | Verify the logs in the configured folder path and ensure they match the expected format. As a workaround, consider using the 'RAW' log type in the collector configuration. |
Dataset management
Prerequisite
Dataset Management requires View/Edit RBAC permissions for Data Management (under Configurations → Data Management), which are the same permissions required for Parsing Rules, Data Model Rules, and Event Forwarding.
The Dataset Management page enables you to manage your datasets and understand your overall data storage duration for different retention periods and datasets based on your hot and cold storage licenses, and retention add-ons that extend your storage. You can view details about your Cortex XSIAM licenses and retention add-ons by selecting Settings → Cortex XSIAM License. For more information on license retention and the defaults provided per license, see Data retention.
Cortex XSIAM enforces retention on all log-type datasets excluding Host Inventory, Vulnerability Assessment, Metrics, and Users.
Hot and cold storage
Your current hot and cold storage licenses, including the default license retention and any additional retention add-ons to extend storage, are listed within the Hot Storage License and Cold Storage License sections of the Dataset Management page. Whenever you extend your license retention, depending on your requirements and license add-ons for both hot storage and cold storage, the add-ons are listed.
Note
Cold storage, in addition to a cold storage license, requires compute units (CU) to run cold storage queries. For more information on CU, see Manage compute units.
For information on the CU add-on license, see Cortex XSIAM product licenses.
Additional hot storage
You can expand your license retention to include flexible Hot Storage based retention to help accommodate varying storage requirements for different retention periods and datasets. This add-on license is available to purchase based on your storage requirements for a minimum of 1,000 GB. If this license is purchased, an Additional Storage subheading in the Hot Storage License section is displayed on the Dataset Management page with a bar indicating how much of the storage is used.
Note
Only datasets that are already handled as part of the GB license are supported for this license. In addition, the retention configuration is only available in Cortex XSIAM, as opposed to the public APIs.
Edit the retention plan
On any dataset configured to use Additional Hot Storage, you can edit the retention period. This enables you to view the current retention details and configure the retention. This includes setting the amount of flexible hot storage-based retention designated for a dataset and the priority for the dataset's hot storage.
How to edit the retention plan
- Select Settings → Configurations → Data Management → Dataset Management.
- In the Datasets table, right-click any dataset designated with flexible hot storage, and select Edit Retention Plan.
- Set the following parameters:
- Additional hot storage: Set the amount of flexible hot storage-based retention designated for this dataset in months, where a month is calculated as 31 days.
- Hot Storage Priority: Select the priority designated for this dataset's hot storage as either Low, Medium, or High.
- Click Save.
Datasets table
For each dataset listed in the table, the following information is available:
Note
- Certain fields are exposed and hidden by default. An asterisk (*) is beside every field that is exposed by default.
- Datasets include dataset permission enforcements in the Cortex Query Language(XQL), Query Center, and XQL Widgets. For example, to view or access any of the
endpointsandhost_inventorydatasets, you need role-based access control (RBAC) permissions to the Endpoint Administration and Host Inventory views. Managed Security Services Providers (MSSP) administration permissions are not enforced on child tenants, but only on the MSSP tenant.
| Field | Description |
|---|---|
| *TYPE | Displays the type of dataset based on the method used to upload the data. The possible values include: Correlation, Lookup, Raw, Snapshot, System, and User. For more information on each dataset type, see What are datasets?. |
| *LOG UPDATE TYPE | Event logs are updated either continuously (Logs) or the current state is updated periodically (State) as detailed in the Last Updated column. |
| *LAST UPDATED | <p>Last time the data in the dataset logs were updated.</p><div data-gb-custom-block data-tag="hint" data-style="info" class="hint hint-info"><p>Important</p><p>This column is updated once a day. Therefore, if the dataset was created or updated by the target or lookup flows, it's possible that the Last Updated value is a day behind when the queries or reports were run as it was before this column was updated.</p></div> |
| *ADDITIONAL STORAGE | Amount of flexible hot storage-based retention designated for this dataset in months, where a month is calculated as 31 days. |
| *TOTAL DAYS STORED | Actual number of days that the data is stored in the Cortex XSIAM tenant, which is comprised of the HOT RANGE + the COLD RANGE. |
| *HOT RANGE | Details the exact period of the Hot Storage from the start date to the end date. |
| *COLD RANGE | Details the exact period of the Cold Storage from the start date to the end date. |
| *TOTAL SIZE STORED | Actual size of the data that is stored in the Cortex XSIAM tenant. This number is dependent on the events stored in the hot storage. For the xdr_data dataset, where the first 31 days of storage are included with your license, the first 31 days are not included in the TOTAL SIZE STORED number. |
| *ADDITIONAL SIZE STORED | Actual size of the additional flexible hot storage data that is stored in the Cortex XSIAM tenant in GB. This number is dependent on the events stored in the hot storage. |
| *AVERAGE DAILY SIZE | Average daily amount stored in the Cortex XSIAM tenant. This number is dependent on the events stored in the hot storage. |
| *HOT STORAGE PRIORITY | Indicates the priority set for the dataset's hot storage as either Low, Medium, or High. |
| *TOTAL EVENTS | Number of total events/logs that are stored in the Cortex XSIAM tenant. This number is dependent on the events stored in the hot storage. |
| *AVERAGE EVENT SIZE | Average size of a single event in the dataset (TOTAL SIZE STORED divided by the TOTAL EVENTS). This number is dependent on the events stored in the hot storage. |
| *TTL | <p>For lookup datasets, displays the value of the time to live (TTL) configured for when lookup entries expire and are removed automatically from the dataset. The possible values are:</p><ul><li>Forever: Lookup entries never expire (default).</li><li>Custom: Lookup entries expire according to a set number of days, hours, and minutes. The maximum number of days is 99999.</li></ul><p>For more information, see Set time to live for lookup datasets.</p> |
| DEFAULT QUERY TARGET | Details whether the dataset is configured to use as your default query target in XQL Search, so when you write your queries you do not need to define a dataset. By default, only the xdr_data dataset is configured as the DEFAULT QUERY TARGET and this field is set to Yes. All other datasets have this field set to No. When setting multiple default datasets, your query does not need to mention any of the dataset names, and Cortex XSIAM queries the default datasets using a join. |
| TOTAL HOT RETENTION | Total hot storage retention configured for the dataset in months, where a month is calculated as 31 days. |
| TOTAL COLD RETENTION | Total cold storage retention configured for the dataset in months, where a month is calculated as 31 days. |
Dataset views
Cortex XSIAM supports creating dataset views in the Dataset Management page to enhance data efficiency and security. Dataset views provide a virtual representation of data from one or more datasets, based on the Cortex Query Language (XQL) query defined, and provide multiple benefits, such as joining datasets into logical subsets through defined queries, manipulating data without altering underlying datasets, and segregating data for specific user needs or access privileges through the Role-based access control (RBAC) settings.
Once a dataset view is created, you can edit or delete the dataset view by right-clicking the dataset view in the Dataset Views table. A dataset view can only be deleted if there are no other dependencies. For example, if a Correlation Rule is based on a dataset view, you wouldn't be able to delete the dataset view until you removed the dataset view from the XQL query of the Correlation Rule.
Cortex XSIAM logs entries for events related to creating, editing, and deleting datasets or dataset views. These monitored activities are available to view in the datasets and dataset views audit logs in the Management Audit Logs. For more information, see Monitor datasets and dataset views activity.
Building XQL dataset view queries
When building an XQL query to define a dataset view, the query is built in the same way as creating a query through the Query Builder. Yet, it's important to be aware of the following points that are specific for dataset view queries:
- The following features are unsupported in dataset view queries:
- RT Correlation Rules
- Cortex Data Model (XDM)
- Query Library
- Presets
- Cold storage queries (
cold_dataset = <dataset name>)
- Only the following XQL stages are supported when building a dataset view query:
alterdedupfieldsfilterjoinreplacenullunion
- Once the dataset view is created, it is listed as an available
datasetwhen building your XQL queries as long as you have the necessary permissions to access the dataset view in the Role-based access control (RBAC) settings.
How to create a dataset view
- Select Settings → Configurations → Data Management → Dataset Management → Dataset Views.
- Click New Datset View.
- Enter a Name and Description (optional) for the dataset view.
- Create your XQL query for the dataset view by typing in the query box.
-
(Optional) Click Run to view the query results.
The query must contain no errors, including using only supported commands, to run; otherwise, the Run button remain disabled.
-
Click Save.
You'll only be able to save the dataset view if the query contains no errors; otherwise, the Save button is disabled.
Once the dataset view is created, you can now control user access permissions through Role-based access control (RBAC).
Dataset views access permissions
Access permissions for dataset views are configured in the same way that you set dataset access permissions for any dataset through user roles in Cortex XSIAM Access Management. Cortex XSIAM uses role-based access control (RBAC) to manage roles with specific permissions for controlling user access. RBAC helps manage access to Cortex XSIAM components and datasets, so that users, based on their roles, are granted minimal access required to accomplish their tasks. Once the user role is configured to access these dataset views, you can now assign the user role to the designated users or user groups, who you want to access these dataset views.
How to set access permissions for dataset views
- Select Settings → Configurations → Access Management.
-
Configure a user role with the dataset views that you want users to access.
- Select Roles.
- You can perform one of the following:
- To create a new role to assign the dataset views, click New Role, and set a Role Name and Description (optional).
- To edit an existing user role with these dataset views, right-click the relevant user role, and select Edit Role.
- To create a new role based on an existing role, right-click the relevant user role, select Save As New Role, and set a Role Name and Description (optional).
- Under Datasets, you have two options for setting the Cortex Query Language (XQL) dataset access permissions for the user role:
- Set the user role with access to all XQL datasets by disabling the Enable dataset access management toggle.
- Set the user role with limited access to certain XQL datasets by selecting the Enable dataset access management toggle and selecting the datasets under the different dataset category headings.
- Scroll down to Dataset View and select the particular dataset views that you want assigned to this user role.
- Click Save.
For more information on user roles, see Manage user roles.
- Assign the user role with the dataset views configured to the designated users or user groups. For more information, see Assign user roles and groups.
Dataset Views table
For each dataset view listed in the table, information is available. Here are descriptions on the columns that may require further explanation:
| Field | Description |
|---|---|
| SOURCE QUERY | Displays the query used to create the dataset view. |
| IS VALID | Details whether the query for the dataset view is still valid or not. |
| RELATED TABLES | Details the other datasets that are related to this dataset view. |
What are datasets?
Prerequisite
Dataset Management requires View/Edit RBAC permissions for Data Management (under Configurations → Data Management).
Cortex XSIAM runs every Cortex Query Language (XQL) query against a dataset. A dataset is a collection of column:value sets. If you do not specify a dataset in your query, Cortex XSIAM runs the query against the default datasets configured, which is by default xdr_data for a dataset query. The xdr_data dataset contains all of the endpoint and network data that Cortex XSIAM collects. For a Cortex Data Model (XDM) query, unless specific datasets are specified, a query will run against all mapped datasets. You can always change the default datasets using the set to default option. You can also upload datasets as a CSV, TSV, or JSON file that contains the data you are interested in querying. These uploaded datasets are called lookup datasets.
It's also possible to create dataset views, which provide a virtual representation of data from one or more datasets, based on the Cortex Query Language (XQL) query defined. Dataset views enhance data efficiency and security. For example, by segregating data for specific user needs or access privileges through the Role-based access control (RBAC) settings. For more information, see Dataset views.
To query other datasets, you have the following options:
- Set a dataset as default, which enables you to query the datasets without specifying them in the query.
- Name a specific dataset at the beginning of your query with the
datasetstage command.
Dataset types
The type of dataset is based on the method used to upload the data. The possible types include:
- Correlation: A dataset containing data saved from a correlation rule.
- Lookup: A dataset containing key-value pairs that can be used as a reference to correlate to events. For example, a user list with corresponding access privileges. You can import or create a lookup dataset, and then reference the values for a certain key, run queries and take action. For more information, see Lookup datasets.
- Raw: Every dataset where PANW data is ingested out-of-the-box or third-party data is ingested using a configured dedicated collector. The schema for the raw dataset is automatically generated based on the log data collected by Cortex XSIAM and the data format sent, such as JSON, CEF, and LEEF.
- Snapshot: A dataset that contains only the last successful snapshot of the data, such as Workday or ServiceNow CMDB tables.
- System: Cortex XSIAM datasets that are created out-of-the-box.
- User: If saved by a query using the
targetcommand, the Type can be either User or Lookup.
Dataset parsers
To ensure accurate visibility and threat detection within Cortex XSIAM, the platform utilizes a variety of specialized dataset parsers. The selection and effectiveness of these parsers are directly dependent on the specific data sources ingested, encompassing both the source data (the original log format generated by the device) and the integration configuration. By identifying whether logs arrive as structured JSON, standardized security formats like CEF and LEEF, or unstructured raw text, Cortex XSIAM can properly parse the information for analysis.
Supported parser types
- CEF (Common Event Format): A parser for logs formatted in the ArcSight CEF standard. CEF logs contain a pipe-delimited header with vendor, product, version, event class, name, and severity fields, followed by key-value pair extensions. Commonly used by vendors like Check Point, Fortinet, and Zscaler.
- Cisco ASA: A parser for specific Cisco Adaptive Security Appliance (ASA) syslog messages. Supports logs like connection-related messages (Built/Teardown) and AnyConnect VPN events. Only a subset of Cisco ASA message types is supported.
- Corelight: A parser for network traffic logs generated by Corelight sensors (based on Zeek/Bro). Processes structured JSON logs containing network connection metadata such as connection records, DNS queries, and HTTP transactions.
- Filebeat: A parser for logs collected and forwarded using Elastic Filebeat agents. Extracts the log payload from the Filebeat JSON envelope, handling metadata fields such as timestamps, agent information, and host details.
- JSON: A general-purpose parser for logs sent in standard JSON format. This is the most common format for third-party data sources that send structured data, including cloud services, SaaS applications, and API-based integrations.
-
LEEF (Log Event Extended Format): A parser for the IBM QRadar LEEF standard. LEEF logs contain a tab-delimited or custom-delimited header with version, vendor, product, product version, and event ID fields, followed by key-value pair attributes. Typically used by IBM security products and QRadar-integrated vendors.
Note
CEF and LEEF logs are often wrapped in a Syslog envelope (RFC 3164/5424). Cortex XSIAM automatically detects and strips the Syslog header to extract the reporting device IP and hostname before parsing the inner CEEF or LEEF payload.
- Raw Text: A parser for unstructured, plain-text log data that does not conform to any specific structured format. The raw text is ingested as-is and can be processed using parsing rules. This is also the default parser used when the log format cannot be identified or is not explicitly defined.
- WEC (Windows Event Collection): A parser for Windows Event logs collected via Windows Event Forwarding (WEF/WEC). Parses XML-formatted Windows Event logs and converts them into a structured format. Supports Windows Security, System, and Application event logs.
- Windows DNS Debug: A parser for Microsoft Windows DNS Server debug log files. Extracts DNS query and response details including query type, remote IP, protocol, response code, and question name from the Windows DNS debug log format.
- Winlogbeat: A parser for Windows Event logs collected using Elastic Winlogbeat agents. Similar to the WEC parser but handles the Winlogbeat-specific JSON envelope format, extracting Windows Event data along with associated metadata.
Datasets in XQL
Important
By default, forensic datasets are not included in XQL query results, unless the dataset query is explicitly defined to use a forensic dataset.
Cortex Query Language (XQL) supports using different languages for dataset and field names. In addition, when setting up your XQL query, it is important to keep in mind the following:
- The dataset formats supported are dependent on the data retention offerings available in Cortex XSIAM according to whether you want to query hot storage or cold storage.
-
Hot Storage queries are performed on a dataset using the format
dataset = <dataset name>. This is the default option.dataset = xdr_data
-
Cold Storage queries are performed using the format
cold_dataset = <dataset name>.cold_dataset = xdr_data
-
- Dataset refresh times: While most out-of-the-box system datasets are ingested in near real-time, the following datasets have specific refresh schedules.
endpoints: Refreshed every hour.pan_dss_raw: Refreshed daily.- Forensics datasets: Data collection behavior depends on your Agent Settings profile.
- Default: Data is collected as a one-time snapshot and does not update.
- Scheduled: If you specify a collection interval, the value represents the number of hours between updates, such as an interval of 24 equals once per day.
- Minimum: The shortest allowable interval is 12 hours.
- Query against a dataset by selecting it with the
datasetcommand when you create an XQL query. For more information, see Create XQL query. - After your query runs, you can always save your query results as a dataset. You can use the
targetstage command to save query results as a dataset. - Schema changes to datasets may not be reflected in the autocomplete suggestions and definitions as you type in real time the XQL query and can appear with a slight delay.
Dataset field limits
Cortex XSIAM enforces a 2,000-field limit for every dataset. This limit ensures optimal performance and efficiency when processing and querying logs.
If a dataset reaches this limit, Cortex XSIAM stops parsing and falls back to saving the raw log. To resume automatic parsing when datasets grow unexpectedly, you can add a parsing rule with a fields stage in the INGEST section. This allows you to explicitly select the specific fields you need for ingestion, even if the total number of potential fields exceeds the 2,000-limit. For more information, see fields.
Managing datasets and dataset views
You can manage your datasets and dataset views in Cortex XSIAM from the Settings → Configurations → Data Management → Dataset Management page.
Below are some of the main tasks available for all dataset types by right-clicking a particular dataset or dataset view listed in either the Datasets or Dataset Views table. Only tasks that need further explanation are explained below. Datasets and dataset views can only be deleted if there are no other dependencies. For example, if a Correlation Rule is based on a dataset or dataset view or dataset view, you wouldn't be able to delete the dataset or dataset view until you removed the dataset view from the XQL query of the Correlation Rule.
For more information on tasks specific to lookup datasets, see Lookup datasets.
View Schema
Select View Schema to view the schema information for every field found in the dataset or dataset view result set in the Schema tab after running the query in XQL. Each system field in the schema is written with an underscore (_) before the name of the field in the FIELD NAME column in the table.
Schema changes to datasets may not be reflected in the autocomplete suggestions and definitions as you type in real time the XQL query and can appear with a slight delay.
Set as default
Select Set as default to query the dataset without having to specify it in your queries in XQL by typing dataset = <name of dataset>. Once configured, the DEFAULT QUERY TARGET column entry for this dataset is set to Yes in the Datasets table. By default, this option is not available when right-clicking the xdr_data dataset as this dataset is the only dataset configured as the DEFAULT QUERY TARGET as it contains all of the endpoint and network data that Cortex XSIAM collects. Once you Set as default another dataset, you can always remove it by right-clicking the dataset and selecting Remove from defaults. When setting multiple default datasets, your query does not need to mention any of the dataset names, and Cortex XSIAM queries the default datasets using a join. This option is only relevant for datasets.
Copy text to clipboard
Select Copy text to clipboard to copy the name of the dataset or dataset view to your clipboard.
Lookup datasets
Prerequisite
Dataset Management requires View/Edit RBAC permissions for Data Management (under Configurations → Data Management), which are the same permissions required for Parsing Rules, Data Model Rules, and Event Forwarding.
Lookup datasets enable you to correlate data from a data source you provide with the events in your environment. For example, you can create a lookup with a list of high-value assets, terminated employees, or service accounts in your environment. Use lookups in your search, detection rules, threat hunting, and response playbooks. Lookups are stored as name-value pairs and are cached for optimal query performance and low latency.
Lookup tables support low-frequency changes of up to 1200 modifications per day. Changes are implemented whenever a lookup dataset is edited, where only one person or user can edit the file at a given time. Concurrent users editing the file are not supported.
Use case scenarios
- Investigate threats and respond to cases quickly with the rapid import of IP addresses, file hashes, and other data from CSV files. After you import the data, use lookup name-value pairs for joins and filters in threat hunting and general queries.
- Import business data as a lookup. For example, import user lists with privileged system access, or terminated employees. Then, use the lookup to create allow lists and blocklists to detect or prevent those users from logging in to the network.
- Create allow lists to suppress issues from a group of users, such as users from authorized IP addresses that perform tasks that would normally trigger the issue. Prevent benign events from becoming issues.
- Enrich event data. Use lookups to enrich your event data with name-value combinations derived from external data sources.
How are lookup datasets created?
You can import or create a lookup dataset, and then reference the values for a certain key, run queries, and take action. Lookup datasets are created by any of the following methods:
- Manual upload from a CSV, TSV, or JSON file to Cortex XSIAM from the Dataset Management page. For more information, see Import a lookup dataset.
- Automatic upload by the Files and Folders Collector.
-
Query results are saved to a lookup dataset. If saved using the
targetstage, the Type can be either User or Lookup. For more information, see thetargetstage.Important
When you create or add data to a lookup dataset using the
targetstage, the_timefield won't be included by default unless you explicitly add it with thefieldsstage.
After a lookup, a dataset is imported, you can always edit the dataset to update the data manually by right-clicking the dataset and selecting Edit.
Note
A lookup dataset can only be deleted if there are no other dependencies. For example, if a Correlation Rule is based on a lookup dataset, you wouldn't be able to delete the lookup dataset until you removed the dataset from the XQL query of the Correlation Rule.
Import a lookup dataset
Prerequisite
Dataset Management requires View/Edit RBAC permissions for Data Management (under Configurations → Data Management), which are the same permissions required for Parsing Rules, Data Model Rules, and Event Forwarding.
You can import data from CSV, TSV, or JSON files into Cortex XSIAM to create or update lookup datasets.
Prerequisite
When uploading a CSV, TSV, or JSON file, ensure that the file meets the following requirements:
- The maximum size for the total data to be imported into a lookup dataset is 30 MB from the Dataset Management page. Otherwise, the limit is 50 MB using Cortex Query Language (XQL) or APIs.
- Field names can contain characters from different languages, special characters, numbers (
0-9), and underscores (_). - Field names can't exceed 128 characters.
- Field names can't contain duplicate names, white spaces, or carriage returns.
- The file doesn't contain a byte array (binary data) as it can't be uploaded.
- Each line in the JSON file must represent one JSON object. Ensure no brackets enclose the objects at the top-level.
Here's an example of a JSON file in the correct format for upload:
{"firstName": "NAME_1", "SurName": "NAME_11", "employeeID": {"id": "ID_AAAAA_2"}} {"firstName": "NAME_2", "SurName": "NAME_22", "employeeID": {"id": "ID_AAAAA_3"}} {"firstName": "NAME_3", "SurName": "NAME_32", "employeeID": {"id": "ID_AAAAA_4"}}
- Select Settings → Configurations → Data Management → Dataset Management → + Lookup.
- Browse to your CSV, TSV, or JSON file. You can only upload a TSV file if it contains a
.tsvfile extension. -
(Optional) Under Name, type a new name for the target dataset.
By default, Cortex XSIAM uses the name of the original file as the dataset name. You can change this name to something that will be more meaningful for your users when they query the dataset. For example, if the original file name is mrkdptusrsnov23.json, you can save the dataset as marketing_dept_users_Nov_2023.
Dataset names can contain special characters from different languages, numbers (
0-9) and underscores (_). You can create dataset names using uppercase characters, but in queries, dataset names are always treated as if they are lowercase.Important
The name of a dataset created from a TSV file must always include the extension. For example, if the original file name is
mrkdptusrsnov23.tsv, you can save the dataset with the namemarketing_dept_users_Nov_2023.tsv. - Replace the existing data in the dataset overwrites the data in an existing lookup dataset with the contents of the new file.
- Click Add to add the file as a lookup.
-
After receiving a notification reporting that the upload succeeded, Refresh
 to view it in your list of datasets.
If the upload fails for any reason, you'll receive a notification in the Notification Center.
Download JSON file of lookup dataset
Prerequisite
Dataset Management requires View/Edit RBAC permissions for Data Management (under Configurations → Data Management), which are the same permissions required for Parsing Rules, Data Model Rules, and Event Forwarding.
You can only download a JSON file for a lookup dataset, where the Type set to Lookup on the Dataset Management page. This option is not available for any other dataset type.
When you download a lookup dataset with field names in a foreign language, the downloaded JSON file displays the fields as COL_<randomstring> as opposed to returning the fields in the foreign language as expected.
- Open the Settings → Configurations → Data Management → Dataset Management page.
- In the Datasets table, right-click the lookup dataset that you want to download as a JSON file, and select Download.
Set time to live for lookup datasets
Prerequisite
Dataset Management requires View/Edit RBAC permissions for Data Management (under Configurations → Data Management), which are the same permissions required for Parsing Rules, Data Model Rules, and Event Forwarding.
You can specify when lookup entries expire and are removed automatically from the lookup dataset by configuring the time to live (TTL). The time period of the TTL interval is based on when the data was last updated. The default is forever and the entries never expire. You can also configure a specific time according to the days, hours, and minutes. Expired elements are removed from the lookup dataset by a scheduled job that runs every five minutes.
- Open the Settings → Configurations → Data Management → Dataset Management page.
- In the Datasets table, right-click the lookup dataset, and select Set TTL.
- Select one of the following to configure when lookup dataset entries expire and are removed:
- Forever: Lookup entries never expire (default).
- Custom: Lookup entries expire according to a set number of days, hours, and minutes. The maximum number of days is 99999.
-
Click Save.
The TTL column in the Datasets table is updated with the changes and these changes are applied immediately on all existing lookup entries.
Monitor datasets and dataset views activity
Prerequisite
Dataset Management requires View/Edit RBAC permissions for Data Management (under Configurations → Data Management), which are the same permissions required for Parsing Rules, Data Model Rules, and Event Forwarding.
Cortex XSIAM logs entries for events related to datasets and dataset views monitored activities. Cortex XSIAM stores the logs for 365 days. To view the datasets and dataset views audit logs, select Settings → Management Audit Logs.
You can customize your view of the logs by adding or removing filters to the Management Audit Logs table. You can also filter the page result to narrow down your search. The following table describes the default and optional fields that you can view in the Cortex XSIAM Management Audit Logs table:
Note
Certain fields are exposed and hidden by default. An asterisk (*) is beside every field that is exposed by default.
| Field | Description |
|---|---|
| Description* | Log message that describes the action. |
| Email of the user who performed the action. | |
| Host Name* | This field is not applicable for datasets and dataset views logs. |
| ID | Unique ID of the action. |
| Reason | This field is not applicable for datasets and dataset views logs. |
| Result* | The result of the action (Success, Fail, or N/A) |
| Severity* | Severity associated with the log: Critical, High, Medium, Low, or Informational. |
| Timestamp* | Date and time when the action occurred. |
| Type* and Sub-Type* | Additional classifications of dataset and dataset view logs. Datasets: Create Dataset, Delete Dataset, and Update Dataset. Dataset Views: Create Dataset View, Delete Dataset View, and Update Dataset View. |
| User Name* | Name of the user who performed the action. |
Archived data
Cortex XSIAM enables you to import historical data into cold storage as archived data. Learn how to send the data in the recommended format, so that you can import the data to access and search the data for analysis, compliance, and audits.
Import historical data into cold storage
Importing historical data into cold storage requires a Period-Based Retention - Cold Storage add-on license.
Prerequisite
Importing historical data into cold storage requires a View/Edit RBAC permission for Data Management (under Configurations).
Importing historical data into Cortex XSIAM cold storage is a detailed process made up of different phases as illustrated in the image below. This dedicated process is available for data migration to ensure secure, long-term storage. Some phases, such as the Data Extraction phase and Data Preparation phase, are not performed in Cortex XSIAM, and are the customer’s responsibility to complete before the data is ready to be sent to Cortex XSIAM. It is critical that the data is sent in the recommended format to be able to access and search the data for analysis, compliance, and audits.
Each data source that is imported to Cortex XSIAM is available as a cold storage dataset and can be accessed using the Cortex Query Language (XQL). These datasets are a new type of archived dataset in cold storage, and after the import, are renamed using the format archive_<dataset name>.
The entire import process requires sufficient time and planning as it takes time to extract data from your third party sources, prepare the data according to your requirements, send the files to the HTTP collector, and import the data into cold storage. There are also additional limitations due to your retention licenses for cold and hot storage, and how the HTTP collector is configured to work. We highly recommend that you review carefully the different phases explained below, so you can make the best decisions to access and analyze your data from cold storage.
Initial planning and prerequisites before data is ready to import
The import process requires initial planning and data preparation before the data is ready to import in Cortex XSIAM. This process can take time, so ensure to factor this into your import timeline.
The sections below explain the various phases in the import process along with the necessary preparation and prerequisite guidelines, so you understand what is required at each phase before your data is ready to be imported. Review these initial guidelines carefully, so that your data is imported successfully, and meets your expectations when you choose to query the data in cold storage.
These phases are listed in a suggested order for importing your data in cold storage. Some phases can overlap or are interchangeable according to your preferences. This is explained more in each phase.
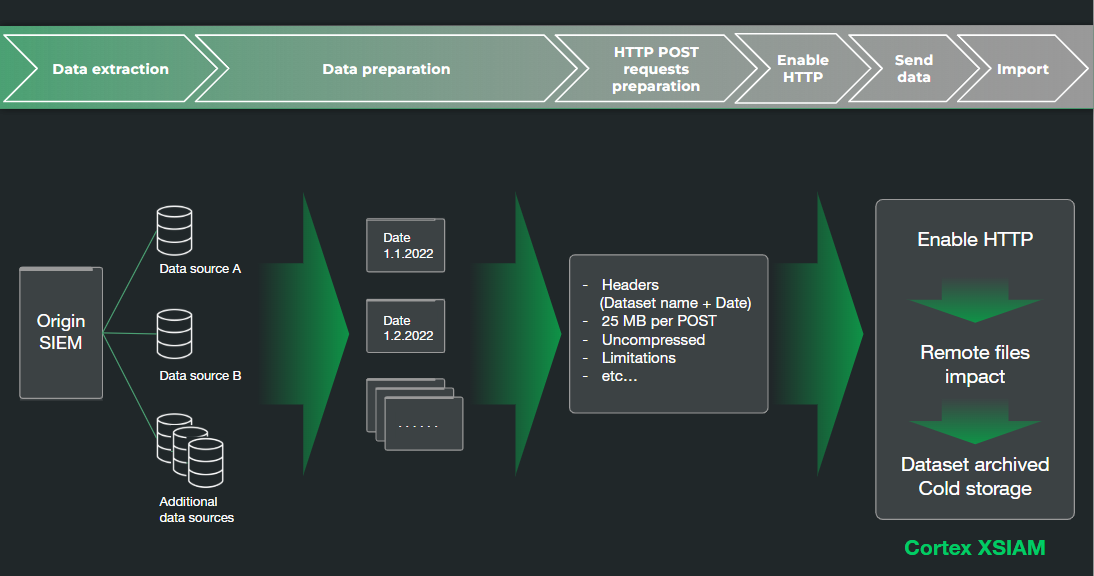
Phase 1: Data extraction
Reason to perform: Initial prerequisite task for you to import any data into Cortex XSIAM.
Where is this performed: You must perform this task on a system. This phase is not performed in Cortex XSIAM.
Description: To import data into Cortex XSIAM, you need to extract the data from a system. It’s your responsibility to perform this task according to your vendor’s specifications. Since extracting data can involve multiple sources of different schemas (called datasets in Cortex XSIAM), you’ll need to bring each one individually into Cortex XSIAM.
Understand the process:
Typically there are two approaches to data extraction depending on the system:
- Querying the system: Involves querying the system for the data and storing the output results.
- Bulk extraction: In some systems, there are bulk extraction capabilities that you can leverage to extract the data.
Preparation and prerequisite guidelines:
- How to decide which data extraction method to use? Both approaches to extraction require the data to be prepared before the data can be sent to the HTTP collector. It’s important to carefully review the Data preparation phase to decide which of the two approaches to implement to extract your data. There are tradeoffs to each extraction method that you choose.
- Example 1: If you need to extract a lot of data, it could be that bulk extraction is the more suitable method. In contrast, if your data is relatively small, querying the system may make more sense.
- Example 2: It’s possible that the bulk extraction capabilities outputs the data quicker. Yet, it may require more data engineering effort to prepare the data after it’s extracted. In this case, you may decide to go with querying the system as it can be the more efficient option.
- Understand all Cortex XSIAM requirements in the context of preparing the data to influence your extraction decision.
- The Cortex XSIAM retention licenses for hot and cold storage limit the data that can be imported. You have to send data within the license retention period for hot and cold storage, so ensure to only extract data within this time period.
Phase 2: Data preparation
Reason to perform: Initial prerequisite task for you to import historical data into Cortex XSIAM.
Where is this performed: You must perform this task on all data extracted from the third party systems in phase 1. This phase is not performed in Cortex XSIAM.
Description: Prepare the extracted data into manageable chunks that can be sent to the HTTP collector and meets Cortex XSIAM requirements for sending data to the HTTP collector. This phase requires you to make decisions about your data by carefully reviewing the guidelines provided, so you'll be able to access the data according to your requirements in cold storage.
Understand the output of the process:
- Separate data according to the data source / schema (dataset).
- For each separated source, separate by time periods (date).
- For each separated time period, separate the data into files, where no file can be more than 25 MB.
- Separate records with a new line.
- Files sent to the HTTP collector must be uncompressed.
Preparation and prerequisite guidelines:
Before dividing up the data, consider the following points to determine how best to prepare the data before sending it to the HTTP collector:
- Data format: The format of the data and how the data is prepared impacts your ability to query the data in Cortex XSIAM. You can send the data in any format to cold storage. Yet, querying some data formats from cold storage can be difficult. If you plan on querying the data and analyzing it in XQL, we recommend that you transform the data to a JSON format and parse it. If not, the data will be stored as is in cold storage. Within the JSON file, you can store the raw log and/or parse the data. When importing JSON files, they are parsed and brought into cold storage, so instead of having a table with a single column, you'll have a table of n columns according to the dataset schema.
- Raw format: You can prepare the data to include the raw format of the raw log if it's important for you to hold on to the original raw log format. The raw format of the raw log for data sent to cold storage is stored in a unique column called RAW_FORMAT. If you want to save on import capacity and don't want to send a lot of data, you don't have to leave the raw format. This data is only for you to query using cold storage. The data is not used for any other purposes, such as detection or analysis. We recommend converting the data into a JSON and parsing it. If not, the data will be stored as is in cold storage.
- File size: No file can be more than 25 MB.
- Files sent to the HTTP collector must be uncompressed.
Phase 3: HTTP POST requests preparation
Reason to perform: Prerequisite task for you to import data into Cortex XSIAM.
Where is this performed: You must create the HTTP POST requests, which is performed outside Cortex XSIAM.
Description: Prepare an HTTP POST request for each file that needs to be sent (as explained in Phase 2). Each request sent to the HTTP collector must contain the appropriate headers for the dataset and date as well as conform to a specific format. You will need to use the API URL and generated key that is available when you enable the HTTP collector connection (as explained in Phase 4).
Understand the process:
For examples on how to prepare the HTTP POST requests, see Task 2. Send data to your Cortex XSIAM HTTP collector. Yet, you can only retrieve all the information necessary to complete your HTTP POST request, when you enable the HTTP collector connection as explained in Phase 4.
Preparation and prerequisite guidelines:
When sending files to the HTTP collector, the header of the HTTP request must include the following tags / headers to store the data correctly:
- Dataset name: A valid dataset name is alphanumeric with an option to use underscores (_) to concatenate multiple names using the format <dataset name1>_<dataset name2>_.... This is added in the header using the x-cortex-source-dataset parameter.
- Date: Use the format YYYY-MM-DD. This is added in the header using the x-cortex-partition parameter.
- What determines whether data is found when you query it? These headers determine how this data will be accessible through querying cold storage. For example, the date that you put in the header of the HTTP request and send to the HTTP collector impacts how you can query the data. If you put the date that you sent the data in the header, but the data is really for a different day, when you search cold storage you won't find the data. The date in the header is the date used for the data in cold storage.
- How is the data sent? The headers are critical to send data to cold storage and alignment of the data is important. If the headers in the HTTP POST request sent to the HTTP collector are valid, the data is accepted. As a result, you need to ensure the data is set up correctly. For example, if you send different data with the same headers or the same source with the same date, you'll create a problem that you'll have data of different schemas, potentially of different formats, for the same day and if you query the data in XQL it will be difficult to understand the output.
Phase 4: Enable the HTTP collector connection
Reason to perform: Prerequisite task for you to perform in Cortex XSIAM to retrieve the required HTTP collector settings to define in the HTTP POST requests (as explained in Phase 3), and send these requests (as explained in Phase 5).
Where is this performed: You must perform this task in Cortex XSIAM to prepare the HTTP POST requests and be able to send the requests to the HTTP collector (as explained in Phase 5).
Description: Data is sent to Cortex XSIAM in an HTTP request using the dedicated API of the HTTP collector when the HTTP connection is enabled and a key is generated. You'll need to use the API URL and the generated key to prepare your HTTP POST requests.
Understand the process:
See Task 1. Enable the HTTP collector connection in Cortex XSIAM.
Once the HTTP collector connection is enabled, you can finish defining the HTTP POST requests as explained in Task 2. Send data to your Cortex XSIAM HTTP collector.
Preparation and prerequisite guidelines:
- The HTTP collector connection is automatically disabled if not used for 14 days. If disabled, you will need to generate a new key for your HTTP POST requests.
Phase 5: Send data to HTTP collector through the HTTP requests
Reason to perform: Prerequisite task for you to import data in Cortex XSIAM.
Where is this performed: You must send all the HTTP POST requests that you've created in phase 3.
Description: Send the files through the HTTP POST requests to the HTTP collector. Every POST request sent is answered with a notification to indicate if the request to upload the data was successful or not. If there is an issue, the request can fail and there are different error messages provided to help troubleshoot.
Understand the process:
For details on how to send the HTTP POST requests, see Task 2. Send data to your Cortex XSIAM HTTP collector.
Preparation and prerequisite guidelines:
- Files uploaded by the HTTP collector must be uncompressed.
- Maximum file size limit is 25 MB for uploading data by the HTTP collector.
- HTTP request headers must include the dataset name and date as explained in the step above.
- Daily upload limit of 100,000 files sent to the HTTP Collector.
- Total daily upload capacity for sending files to the HTTP collector is based on the formula: 100 * (Daily GB License).
- Total upload capacity for sending files to the HTTP Collector is related to the retention license using the formula: (# of months of hot + cold storage) * 30 * (Daily ingest limit), where 30 represents the number of days in a month.
Phase 6: Import the files in Cortex XSIAM
Reason to perform: Final task performed in Cortex XSIAM.
Where is this performed: You must perform this task in Cortex XSIAM.
Description: After you validate that all the files sent to Cortex XSIAM are listed in the Remote Files table in the Archived Data page with a Remote status, you can now import the dataset files into cold storage. Once imported, the files are no longer available in the Remote Files table. They are now accessible in cold storage as archived datasets and are listed in the Dataset Management page.
Understand the process:
See Task 3. Import the dataset files to cold storage.
Preparation and prerequisite guidelines:
- You can import multiple remote files at once, which can take time, up to several days, to complete. A notification is sent once the import is completed.
How to import data
Perform the following procedures in the order listed below.
Task 1. Enable the HTTP collector connection in Cortex XSIAM
- Select Settings → Configurations → Data Management → Archived Data.
- Open the HTTP collector settings by clicking HTTP Collector.
- Select the Enable HTTP connection toggle.
-
Copy the API URL.
Click the copy icon beside the API URL displayed and record it somewhere safe. You'll use this URL when you configure your HTTP POST request to send your data to the HTTP collector.
-
Click Generate Key.
Next to the key displayed, in the Generated Key dialog box, click the copy icon and record it somewhere safe. You will need to provide this key when you configure your HTTP POST request and define the Authorization key. If you forget to record the key and close the window, you will need to generate a new key and repeat this process. The HTTP connection is only established after a key is generated.
Click Close when finished.
Task 2. Send data to your Cortex XSIAM HTTP collector
-
Send an HTTP POST request to the URL for your HTTP collector.
Here is a CURL example:
curl -X POST "https://api-{tenant external URL}/logs/v1/bulk_load" \ -H "Authorization: {generated_key}" \ -H "x-cortex-partition: {partition_date_of_the_data}" \ -H "x-cortex-source-dataset: {dataset_name}" \ -H "Content-Type: application/json" \ -d '{"example1": "test", "timestamp": 1609100113039} {"example2": [12321,546456,45687,1]}'
Python 3 example:
import requests def test_http_collector(generated_key): headers = { "Authorization": generated_key, "x-cortex-partition": partition_date_of_the_data, "x-cortex-source-dataset": dataset_name, "Content-Type": "application/json" } # Note: the logs must be separated by a new line body = "{'example1': 'test', 'timestamp': 1609100113039}" \ "{'example2': [12321,546456,45687,1]}" res = requests.post(url="https://api-{tenant external URL}/logs/v1/event", headers=headers, data=body) return res
- Substitute the values specific to your configuration.
- API URL: Paste the API URL that you copied when you enabled the HTTP collector from the Archived Data page. The format of the URL is
https://api-{tenant external URL}/logs/v1/bulk_load. - Authorization: Paste the generated key you previously recorded when enabling the HTTP collector, which is defined in the header.
- x-cortex-partition: Enter the name of the file/folder containing the data from the log source / schema that you want to send to the HTTP collector. The file/folder name must be a date in the format
YYYY-MM-DD. This is defined as part of the header. - x-cortex-source-dataset: Enter the name of the dataset for the data you want to send to the HTTP collector. A valid dataset name is alphanumeric with an option to use underscores (
_) to concatenate multiple names using the format<dataset name1>_<dataset name2>_..... This is defined as part of the header. - Content-Type: This setting is dependent on the data object format of your files. For example, use
application/jsonfor JSON format ortext/plainfor Text format. This is defined as part of the header. - Body: The body contains the records you want to send to Cortex XSIAM. Separate records with a \n (new line) delimiter. The request body can contain up to 25 MB of records, and uncompressed. In the case of a CURL command, the records are contained in the -d ‘<records>’ parameter.
- API URL: Paste the API URL that you copied when you enabled the HTTP collector from the Archived Data page. The format of the URL is
-
Review the possible success and failure code responses to your HTTP POST requests.
For more information on the possible error codes you can encounter, so you can troubleshoot the errors, see Success and failure code responses to your HTTP POST requests.
-
Monitor the Remote Files table in the Settings → Configurations → Data Management → Archived Data page.
Once the HTTP requests are sent to the HTTP collector, the data begins to be displayed by the dataset name in the Remote Files table. It can take time for all the datasets and associated folders with the data to be displayed as this is dependent on several factors, such as the number of files, daily upload limit of the HTTP collector, and total daily upload capacity for sending files to the HTTP collector. In some cases, it can take several days to complete. When the dataset has a Remote status, the upload is complete.
####
-
Select the datasets and associated folders with the data to upload in the Remote Files table.
You can select the data to upload in two different ways:
- To import all the folders associated with the dataset, select the dataset name in the Remote Files table.
- To import specific folders from a dataset, click the dataset name in the Remote Files table, and then select the files you want to import.
- When you've finished selecting the applicable datasets and folders to import, right-click, and select
Import. -
Confirm the import in the dialog box that opens by clicking Start Import.
The statuses of the datasets and folders imported in the Remote Files table will update to In Progress. The import can take time, even up to several days. For more information, see Phase 6.
When the import finishes, a notification is sent to your Notification Center indicating whether the import was successful or not. The statuses of the imported datasets and folders get updated, which is dependent on the dataset and folders imported.
- Import entire dataset: If you import a dataset, or multiple datasets, with all its folders, after the import completes the status of the dataset updates to Imported, the dataset is disabled from the Remote Files table, and the dataset is now listed in the Dataset Management page with the name using the format
archive_<dataset name>. - Partial import of dataset: If you import only some of the folders of a dataset, after the import completes the status of the dataset updates to Partially Imported, the folders imported have a status of Imported, and the rest of the folders not imported remain with a Remote status. The dataset is left enabled to allow you to import the rest of the data at a later time. Also, the dataset is now listed in the Dataset Management page with the name using the format
archive_<dataset name>. If you choose to import the same dataset with the rest of the folders at a later time, the leftover files are added to the dataset that was created previously in the Data Management page. In addition, in the Remote Files table, the dataset is disabled and the status updates to Imported. - Reimport dataset or folders in a dataset: If you resend data to the HTTP collector that has already been imported previously, the statuses of the dataset and folders update to Partially Imported. If you choose to reimport, these files will be added (not replaced) to the existing dataset in the Dataset Management page. It's also possible to combine previously imported folders with new folders, so the statuses of the new folders update to Remote and the previously imported dataset and folders update to Partially Imported.
- Import entire dataset: If you import a dataset, or multiple datasets, with all its folders, after the import completes the status of the dataset updates to Imported, the dataset is disabled from the Remote Files table, and the dataset is now listed in the Dataset Management page with the name using the format
Remote Files table
The Remote Files table on the Archived Data page enables you to keep track of your data that you're in the process of uploading to import to cold storage and the data ready to import. As soon as any files are received by the HTTP collector through the HTTP POST requests sent, the file contents are displayed in the Remote Files table. The data is ordered by the datasets, where for each dataset you can see the aggregated number of folders/files, total folder size when calculated, and the status of the files. When you select any dataset name, the folders indicate the different dates of the data as sent in the HTTP request header. For each folder, the following is listed: aggregated number of folders/files, total folder size when calculated, and the status of the files.
You can select different datasets and folders to import to cold storage. It can take time for all the files to be sent to the HTTP collector and then imported as this is dependent on several factors, such as the numbers of files, daily upload limit of files sent to the HTTP collector, and total daily upload capacity by the HTTP collector. In some cases, it can take several days to complete. Use the statuses to help you monitor your data.
You can pivot (right-click) any dataset or folder listed in the Remote Files table to import, delete, and calculate the folder size. You can calculate the folder size of a dataset or folder, when the dataset or folder status are either Remote or Partially Imported.
Building XQL archived data queries
Prerequisite
Archived cold storage, in addition to a Period-Based Retention - Cold Storage add-on license, requires compute units (CU) to run archived cold storage queries. Cortex XSIAM provides a free daily quota of compute units (CU) allocated according to your license size. Queries run without enough quota will fail. To expand your investigation capabilities, you can purchase additional CU by enabling the Compute Unit add-on. Ensure that you have enough CU to run your archived cold storage data. For more information on CU and running cold storage queries, see Manage compute units.
For information on the CU add-on license, see Cortex XSIAM product licenses.
Each data source that is imported to Cortex XSIAM is available as a cold storage dataset and can be accessed using Cortex Query Language (XQL). These datasets are a new type of archived dataset. After being imported to cold storage, the datasets are renamed using the format archive_<dataset name>, and can be queried as any other cold storage dataset, with one exception that makes them unique. You can query these datasets during the hot retention period. Typically, this isn't enabled for cold storage datasets, as during the hot storage period, the cold storage data isn't relevant. Yet, for this type of data, you can query the archived data in cold storage during the hot storage period using CU.
You can perform queries on archived cold storage data using the dataset format:
cold_dataset = archive_<dataset name>
Success and failure code responses to your HTTP POST requests
The following table provides the various success and failure code responses to your HTTP POST requests, which can help you troubleshoot any problems with your HTTP collector configuration.
| Success/failure response code | Description | Output code displayed (if applicable) |
|---|---|---|
| 200 | Success code that indicates there are no errors and the request was successful. The last_used field timestamp is updated accordingly. |
{ "ok": "true"} |
| 400 | <p>Error code that indicates that there is a problem with any of the following:</p><ul><li>The partition date value (x-cortex-partition) is missing or empty in the HTTP request.</li><li>The partition date value in the HTTP request (x-cortex-partition) isn't in the correct format of YYYY-MM-DD.</li><li>Dataset name value (x-cortex-source-dataset) is missing or empty in the HTTP request.</li></ul> |
<ul><li><p>Partition date value missing or empty in HTTP request:</p><p>{ "error": "partition value is missing or empty"}</p></li><li><p>Partition date value isn't in the correct format of YYYY-MM-DD:</p><p>{ "error": "partition value must be in the format YYYY-MM-DD"}</p></li><li><p>Dataset name value is missing or empty in the HTTP request:</p><p>{ "error": "sourceDataset value is missing or empty"}</p></li></ul> |
| 401 | Unauthorized error code that indicates an incorrect authorization key for the HTTP collector is being used. | { "error": "Failed to validate authentication detail"} |
| 403 | <p>Error code that indicates one of the following:</p><ul><li>Wrong header key for the HTTP collector is in the HTTP request and cannot be used.</li><li>Partition date value (x-cortex-partition) in the HTTP request is not within the license retention period for hot and cold storage.</li></ul> | <ul><li><p>Wrong header key in HTTP request:</p><p>The Bulk Load configuration has been deleted and cannot be used</p></li><li><p>Partition date value not within the license retention period for hot and cold storage:</p><p>partition is less than license start date</p></li></ul> |
| 413 | Error code indicating the request entity is too large as the request size is more than the 25 MB limit. | Request entity too large as the size is more than 25 MB limit |
| 429 | <p>Error code indicating too many requests as the ingestion limits are reached for one of the following reasons:</p><ul><li>Daily ingestion limit of <number> files is exceeded.</li><li>Daily file size ingestion limit of <number> GB is exceeded.</li></ul> | <ul><li><p>Daily ingestion file limit exceeded:</p><p>exceeds daily limit of <number> files</p></li><li><p>Daily ingestion file size limit exceeded:</p><p>Daily file size limit of <number> GB for HTTP requests sent is exceeded</p></li></ul> |
| 500 | Error code indicating an unexpected internal error while processing the bulk load HTTP request. | Unexpected error while processing bulk load request |
Parsing Rules
What are Parsing Rules?
Prerequisite
Parsing Rules requires View/Edit RBAC permissions for Data Management (under Configurations → Data Management), which are the same permissions required for Dataset Management, Data Model Rules, and Event Forwarding.
Cortex XSIAM includes an editor for creating 3rd party Parsing Rules, which enables you to:
- Remove unused data that is not required for analytics, hunting, or regulation.
- Reduce your data storage costs.
- Pre-process all incoming data for complex rule performance.
- Add tags to the ingested data as part of the ingestion flow.
- Easily identify and resolve Parsing Rules errors so you can troubleshoot them quickly.
- Test your Parsing Rules on actual logs and validate their outputs before implementation.
Parsing Rules contain the following built-in characteristics:
- Parsing Rules are bound to a specific vendor and product.
- Parsing Rules take raw log input, perform an arbitrary number of transitions and modifications to the data using Cortex Query Language (XQL), and return zero, one, or more rows that are eventually inserted into the Cortex XSIAM tenant.
- Parsing Rules can be grouped together by a no-match policy. If all the rules of a group did not produce an output for a specific log record, a no-match policy defines what to do, such as drop the log or keep the log in some default format.
- Upon ingestion, all fields are retained even fields with a null value. You can also use XQL to query parsing rules for null values.
Parsing Rules editor views
Prerequisite
Parsing Rules requires View/Edit RBAC permissions for Data Management (under Configurations → Data Management), which are the same permissions required for Dataset Management, Data Model Rules, and Event Forwarding.
The Parsing Rules editor contains the following views:
- User Defined (default): Displays an editor for writing your own custom parsing rules that override or extend the default rules and a List of Errors section to help you troubleshoot errors in your Parsing Rules.
- Default Rules: Displays the parsing rules that are provided by default with Cortex XSIAM in read-only mode and a List of Errors section to view any errors in your Parsing Rules.Any Parsing Rules that are included with your installed Content Packs from the Marketplace are also listed under Installed Rules.
- Both: Side-by-side view of both the Default Rules and User Defined rules, so you can easily view the different rules on one screen. In addition, the List of Errors section helps you troubleshoot any errors in your Parsing Rules.
- Simulate: Enables you to test your Parsing Rules on actual logs and validate their outputs, which helps minimize your errors when creating Parsing Rules. The editor includes the following sections.
- User defined: A list of the current User defined rules on the left side of the window.
- XQL Samples: A table of the existing Cortex Query Language (XQL) raw data samples on the right side of the window, which contain sample logs listing the Vendor, Product, Raw Log, and Sample Time. For each Vendor and Product, up to 5 different samples are available to choose from. From this list, you can select the logs used to simulate the rule.
- Logs Output: Displays in a table format the following columns per dataset at the bottom of the window.
- Dataset: Displays the applicable dataset name and a line number associated to this dataset in the User defined section.
- Vendor: The vendor associated with this dataset.
- Product: The product associated with this dataset.
- Logs Output: Displays the output logs that are available based on your User defined rules and XQL Samples selected after simulating the results. When there is no output log to display, the text
Output logs is not availablewith the corresponding error message is displayed. When there is no output due to a missing rule in the User defined section for the logs selected, the text No output logs. You can change your parsing rules and try again is displayed. - Input Logs: Displays the relevant input log with a right-click pivot to Show diff between the Output Logs and Input Logs.
Parsing Rules file structure and syntax
Prerequisite
Parsing Rules requires View/Edit RBAC permissions for Data Management (under Configurations → Data Management), which are the same permissions required for Dataset Management, Data Model Rules, and Event Forwarding.
File structure
The Parsing Rules file consists of multiple sections of these three types, which also represent the custom syntax specific to Parsing Rules.
INGEST: This section is used to define the resulting dataset.COLLECT(Optional): This section defines a rule that enables data reduction and data manipulation at the Broker VM to help avoid sending unnecessary data to the Cortex XSIAM server and reduce traffic, storage, and computing costs. In addition, theCOLLECTsection is used to manipulate, alter, and enrich the data before it’s passed to the Cortex XSIAM server. While this rule is optional to configure, once added this rule runs before theINGESTsection.CONST(Optional): This section is used to define strings and numbers that can be reused multiple times within Cortex Query Language (XQL) statements in otherINGESTsections by using$constName.RULE(Optional): Rules are part of the XQL syntax, which are tagged with a name, and can be reused in the code in theINGESTsections by using[rule:ruleName].EXTEND(Optional): This section is used to chain your Parsing Rules logic to extend your existing defaultRULEsections, which are added by a Content Package you installed from the Marketplace. AnEXTENDsection runs immediately after the defaultRULEsection that it extends and enables data manipulation without overriding or interfering with the existing vendor Parsing Rules.
The order of the sections is unimportant. The data of each section type gets grouped together during the parsing stage. Before any action takes place all COLLECT, CONST, RULE, EXTEND, and INGEST objects are grouped together and collected to the same list.
Syntax
The syntax used in the Parsing Rules file is derived from XQL, but with a few modifications. This subset of XQL is called XQL for Parsing (XQLp).
Note
For more information on the XQL syntax, see Cortex XQL Language Reference.
The COLLECT, CONST, INGEST, RULE, and EXTENDsyntax is derived from XQL, but with the following modifications for XQLp:
- A statement never starts with a dataset or preset selection. The query's data source is meaningless. It is transparent to the user where the raw logs are coming from, fully handled by the system.
-
Only the following XQL stages are permitted: alter, fields, filter, and join. In addition, a new
callstage is supported, which is used to invoke another rule.Note
- An
innertype ofjoinstage is only supported inCONST,INGEST, andRULEsections and is not supported in aCOLLECTsection. - You cannot
callaRULEsection that exists in Default Rules from the User Defined Rules section.
- An
-
Only the following XQL functions are permitted in all sections: parse_timestamp, parse_epoch, and regexcapture.
Note
The regexcapture function is only supported in Parsing Rules and cannot be used in any other XQL query.
- No output stages are supported.
- A
Ruleobject can only contain a single statement. -
A
join innerquery is restricted to using a lookup as a data source and is only supported in XQLp stages.There is no default lookup, so all
join innerqueries must start withdataset=<lookup> | .... CONSTreference ($MY_CONST) is supported.- An
INcondition can only take a sequence list, such asdevice_name in (“device1”, “device2”, “device3”)and not another XQL or XQLpinnerqueries. - You can't create parsing rules for Next-Generation Firewall (NGFW) datasets that are in the format
panw_ngfw_<text>_raw, and the Observability dataset calledpanw_observability_raw.
Comments in C programming language can be used anywhere throughout the Parsing Rules file:
// line comment /* inner comment */
Note
Every statement in the Parsing Rules file must end with a semicolon (;).
INGEST
Prerequisite
Parsing Rules requires View/Edit RBAC permissions for Data Management (under Configurations → Data Management), which are the same permissions required for Dataset Management, Data Model Rules, and Event Forwarding.
An INGEST section is used to define the resulting dataset. The COLLECT, CONST, and RULE sections are only add-ons, used to help organize the INGEST sections, and are optional to configure. Yet, a Parsing Rules file that contains no INGEST sections, generates no Parsing Rules. Therefore, the INGEST section is mandatory to configure.
INGEST syntax is derived from Cortex Query Language (XQL) with a few modifications as explained in the Parsing Rules file structure and syntax. In addition, INGEST sections contain the following syntax add-ons:
INGESTsections can have more than one XQLp statement, separated by a semicolon (;). Each statement creates a different Parsing Rule.- The following XQL functions and stages are also supported in the
INGESTsection:- Functions: arrayfilter, arraycreate, arraymerge, object_create, parse_cef, parse_cisco, and parse_json.
- Stages: iploc and arrayexpand.
- fields: Using the
fieldsstage in the[INGEST]section of the parsing rule explicitly controls the schema creation of the raw dataset. If you explicitly define only to ingest a few fields, then only these fields will be stored in Cortex XSIAM and available to query. Definingfieldsis a good way to only ingest clean data without including any corrupt data. Cortex XSIAM enforces a 2,000-field limit for every dataset. If a dataset has reached its 2,000-field limit, you can use thefieldsstage to manage these larger datasets.
- fields: Using the
- Another new stage is available called
drop.droptakes a condition similar to the XQLfilterstage (same syntax), but drops every log entry that passes that condition. One can think of it as a negative filter, sodrop <condition>is not equivalent tofilter not <condition>.dropcan only appear last in a statement. No other XQLp rules can follow.
-
INGESTsections take parameters, and not names asRULEsections use, where some are mandatory and others optional.[ingest:vendor=<vendor>, product=<product>, target_dataset=<dataset>, no_hit=<keep\drop>, ingestnull=<true\false>] filter raw_log not contains "issue";
The parameter descriptions are explained in the following table:
| Parameter | Description |
|---|---|
vendor |
The vendor that the specified Parsing Rules apply to (mandatory). |
product |
The product that the specified Parsing Rules apply to (mandatory). |
target_dataset |
The name of the dataset to insert every row with the results after applying any of the specified Parsing Rules (mandatory). |
no_hit |
<p>No-match strategy to use for the entire specified group of rules (optional). The default is keep.</p><ul><li>If no_hit = drop, then in a scenario where none of the rules in the group generates output for a given log record, that record is discarded.</li><li>If no_hit = keep, then in a scenario where none of the rules in the group generates output for a given log record, that record is kept in the _raw_log field. This record is inserted into the group's dataset once, but every column holds NULL except for _raw_log, which holds the original JSON log record.</li></ul> |
ingestnull |
Defines whether null value fields are ingested (optional). By default this is set to true, so you only need to set this parameter when you want to overwrite the default definition. |
Each statement represents a different Parsing Rule in the same group as depicted in the following example:
[CONST] DEVICE_NAME = "ngfw"; [rule:use_two_rules] filter severity = "medium" | call basic_rule | call use_xql_and_another_rule; [rule:basic_rule] fields log_type, severity | filter log_type="eal" and severity="HIGH" and type="something"; [rule:use_xql_and_another_rule]call multiline_statement | filter severity = "medium"; [rule:multiline_statement] alter url = json_extract(_raw_log, "$.url") | join type = inner conflict_strategy = both (dataset=my_lookup) as inn url=inn.url |filter severity = "medium"; [ingest:vendor=panw, product=ngfw, target_dataset=panw_ngfw_ds, no_hit=drop] filter log_type="traffic" | alter url = json_extract(_raw_log, "$.url"); call use_two_rules | join type = inner conflict_strategy = both (dataset=my_lookup) as inn severity=inn.severity | fields severity, log_type | drop device_name = $DEVICE_NAME;
This generates 1 group of 2 Parsing Rules for panw/ngfw, where all the ingested data into panw_ngfw_ds dataset.
The following represents the syntax for the rules:
Rule #1: filter log_type="traffic" | alter url = json_extract(_raw_log, "$.url"); Rule #2: filter severity = "medium" | fields log_type, severity | filter log_type="eal" and severity="HIGH" and type="something" | alter url = json_extract(_raw_log, "$.url") | join type = inner conflict_strategy = both (dataset=my_lookup) as inn url=inn.url | filter severity = "medium" | filter severity = "medium" | join type = inner conflict_strategy = both (dataset=my_lookup) as inn severity=inn.severity | fields severity, log_type | drop device_name = $DEVICE_NAME
A few more points to keep in mind when writing INGEST sections:
INGESTparameter names are not case-sensitive. Therefore,vendor=PANWandvendor=panware the same.- Since section order is unimportant, you do not have to declare a
RULEor aCONSTbefore using it in anINGESTsection. -
You can have multiple
INGESTsections with the samevendor,product,dataset, andno_hitvalues. Yet, this can lead to unexpected results. Consider the following example:Example 36.
[ingest:vendor=panw, product=ngfw, tartget_dataset=panw_ngfw_ds, no_hit=keep] filter raw_log not contains "issue"; [ingest:vendor=panw, product=ngfw, target_dataset=panw_ngfw_ds, no_hit=keep] filter device_type not contains "agent";
Let
lwbe a log row. Iflw.raw_logdoesn't contain anissueandlw.device_typedoesn't contain anagent, thenlwis inserted twice into thepan_ngfw_dsdataset as every section is standalone.- To eliminate these kinds of errors and misunderstandings, it is highly advised to group all rules having the same
vendor,product,dataset, andno_hitvalues in a singleINGESTsection. - Logs that were discarded by a
dropstage are considered ingested with a no-match policy. This means they are not kept even ifno_hit = keep. - Keep in mind that all rules inside a group get evaluated independently. This is in contrast to firewall-like rules, which stop evaluating the first rule that is able to make a decision. Therefore, without proper filtering, it is possible to ingest the same log more than once.
- To eliminate these kinds of errors and misunderstandings, it is highly advised to group all rules having the same
- You can override the default raw dataset in
INGESTsections. For more information, see Parsing Rules Raw Dataset. -
Cortex XSIAM supports configuring case sensitivity in Parsing Rules only within the
INGESTsection using the following configuration stage:config case_sensitive = true | false
-
You can add a single tag or list of tags to the ingested data as part of the ingestion flow that you can easily query. You can add tags as part of the
INGESTsection or use both theINGESTandRULEsections.Note
You can't add tags to parsing rules using the Next-Generation Firewall (NGFW) datasets that are in the format
panw_ngfw_<text>_raw, and the Observability dataset calledpanw_observability_raw.The following are examples of each:
-
INGESTsection:Adding a single tag:
[INGEST:vendor="MSFT", product="Azure AD Audit", target_dataset="msft_ad_audit_tagging", no_hit=drop, ingestnull = false ] tag add "New Event"
Adding a list of tags:
[INGEST:vendor="MSFT", product="Azure AD Audit", target_dataset="msft_ad_audit_tagging", no_hit=drop, ingestnull = false ] tag add "New Event1", "New Event2", "New Event3"
-
INGESTandRULEsections:Example 38.
Adding a single tag:
[INGEST:vendor="Check Point", product="Anti Malware", target_dataset="malware_test", no_hit= drop , ingestnull = true ] alter xx = call new_tag_rule;
[RULE:new_tag_rule] tag add "test";
Adding a list of tags:
[INGEST:vendor="Check Point", product="Anti Malware", target_dataset="malware_test", no_hit= drop , ingestnull = true ] alter xx = call new_tag_rule;
[RULE:new_tag_rule] tag add "test1", "test2", "test3";
-
fields
Syntax
[INGEST: vendor="<vendor>", product="<product>", target_dataset="<dataset_name>"] fields <field_1>, <field_2>, ... ;
Description
The fields stage in the INGEST section of a parsing rule allows you to explicitly define which fields from a raw log should be saved into a dataset.
This stage works identically to the fields stage in XQL, which defines the columns returned in a query result set. Yet, when used within the INGEST section of a parsing rule, it serves to control the schema of the stored data.
Usage
Use the fields stage to:
- Resume data flow: If a dataset has reached its 2,000-field limit, you can use the
fieldsstage to explicitly select only the necessary fields, allowing automatic parsing to continue. - Manage large datasets: If you know in advance that a data source will ingest more than 2,000 fields, you can use this stage to pre-filter and define the specific fields you wish to retain.
Note
For more details on field selection, including how to use aliases and wildcards, see the Cortex Query Language (XQL) fields stage reference.
parse_cef
Syntax
parse_cef()
Description
The parse_cef() function processes a CEF string and returns an object whose structure (key and\
value pairs) is determined by the input parameters.
Example: Parsing CEF logs during ingestion
The following example demonstrates how to use the parse_cef function within a parsing rule to process raw logs and store the resulting object in a specific dataset. This logic is configured in the INGEST section to execute as data is written to Cortex XSIAM.
[INGEST:vendor="test", product="parse_cef", target_dataset="test_parse_cef_raw", no_hit = keep] alter raw ="<14>Oct 2 10:06:18 PAN-PROD-APPSVC-EU-W4-FW01 CEF:0|Palo Alto Networks|PAN-OS|8.1.15-h3|end|TRAFFIC|1|rt=Oct 02 2022 17:06:18 GMT src=35.204.254.72 app=ssl proto=TCP in=8697 double=1.15 mac=B3-F5-10-ED-C4-EE ad.vd=root ad.subtype=forward pattern:test=test" | alter parsed = parse_cef(raw) | fields parsed;
Explanation of the rule components:
INGESTsection: Defines thevendor,product, and thetarget_datasetwhere the parsed logs will be stored.alter raw: In this rule context, this defines the source string to be parsed (simulating the_raw_loginput).parse_cef(raw): Processes the CEF string into a structured object containing key-value pairs.- Semicolon (
;): Required at the end of the rule to ensure proper compilation.
Output results
The following JSON represents the structured object stored in the parsed field of the test_parse_cef_raw dataset after the rule is applied:
"parsed": {
"ad.subtype": "forward",
"ad.vd": "root",
"app": "ssl",
"cefDeviceEventClassId": "end",
"cefDeviceProduct": "PAN-OS",
"cefDeviceVendor": "Palo Alto Networks",
"cefDeviceVersion": "8.1.15-h3",
"cefName": "TRAFFIC",
"cefSeverity": "1",
"cefVersion": "CEF:0",
"double": "1.15",
"in": "8697",
"mac": "B3-F5-10-ED-C4-EE",
"pattern:test": "test",
"proto": "6",
"rt": 1664730378000,
"src": "35.204.254.72"
}
parse_cisco
Syntax
parse_cisco(<string>)
Description
The parse_cisco() function processes a Cisco string and returns an object whose structure (key and value pairs) is determined by the input parameters. This function isn't available through the autocomplete when defining a user defined parsing rule. Yet, it is used in the parsing rule syntax for default parsing rules. Only a subset of Cisco ASA message types is supported as detailed in the Marketplace content pack.
Example
This example shows how to parse a Cisco string called _raw_log into a JSON field called _json in a parsing rule.
Where the _raw_log field contains the following input:
<166>Apr 06 12:14:15 172.16.1.5 : %ASA-6-302014: Teardown TCP connection 1764964360 for TAP-Interface2:172.16.1.130/34206 to TAP-Interface:10.10.10.188/8000 duration 0:00:30 bytes 783 SYN Timeout
Updated [INGEST] section in the parsing rule:
[INGEST:vendor="cisco", product="asa", target_dataset="cisco_asa_raw", no_hit = keep] alter _json = parse_cisco(_raw_log) | alter tmp_time = _json -> date | alter _time = if(tmp_time contains "Z", parse_timestamp("%Y-%m-%dT%H:%M:%SZ", tmp_time), tmp_time ~= "[+-]\d{1,2}:\d{1,2}", parse_timestamp("%Y-%m-%dT%H:%M:%S%Ez", tmp_time)) | fields - tmp_time;
Where the _json field contains the following output:
{ "severity": "informational", "logType": "302014", "date": "2026-04-06T12:14:15Z", "device": "172.16.1.5", "action": "teardown", "protocol": "TCP", "inOutBound": "unknown", "connectionId": "1764964360", "durationSeconds": 30, "sentBytes": 783, "to": { "interface": "TAP-Interface", "address": "10.10.10.188", "port": 8000 }, "from": { "interface": "TAP-Interface2", "address": "172.16.1.130", "port": 34206 }, "generalCiscoLog": { "action": "Teardown", "protocol": "TCP", "src_ip": "172.16.1.130", "src_port": "34206", "dst_ip": "10.10.10.188", "dst_port": "8000", "src_interface": "TAP-Interface2", "dst_interface": "TAP-Interface", "src_mapped_ip": "", "src_mapped_port": "", "duration": "0:00:30", "transferred_bytes": "783" } }
parse_json
Syntax
parse_json()
Description
The parse_json() function processes a JSON string and returns an object whose structure (key and\
value pairs) is determined by the input parameters.
COLLECT
Prerequisite
Parsing Rules requires View/Edit RBAC permissions for Data Management (under Configurations → Data Management), which are the same permissions required for Dataset Management, Data Model Rules, and Event Forwarding.
A COLLECT section defines a rule that enables data reduction and data manipulation at the Broker VM to help avoid sending unnecessary data to the Cortex XSIAM server and reduces traffic, storage, and computing costs. In addition, the COLLECT section is used to manipulate, alter, and enrich the data before it’s passed to the Cortex XSIAM server. While this rule is optional to configure, once added, this rule runs before the INGEST section.
Note
The CSV Collector applet is not affected by the COLLECT rules applied to a Broker VM.
To avoid performance issues on the Broker VM, Cortex XSIAM does not permit all Parsing Rules to run on the Broker VM by default, but only the Parsing Rules that you designate.
The Broker VM is directly affected by the [COLLECT] rules you create, so depending on the complexity of the rules more hardware resources on the Broker VM may be required. As a result, ensure that your Broker VM meets the following minimum hardware requirements to run [COLLECT] rules:
- 8-core processor
- 8GB RAM
- 512GB disk
- Plan for a max of 10K eps (events per second) per core.
COLLECT syntax is derived from Cortex Query Language (XQL) with a few modifications as explained in the Parsing Rules file structure and syntax. In addition, COLLECT rules contain the following syntax add-ons:
COLLECTrules can have more than one XQLp statement, separated by a semicolon (;). Each statement creates a different data reduction and manipulation at the Broker VM for a different vendor and product.- While the XQL stages alter and fields are permitted in
COLLECTrules for various vendors and products, you should avoid using them for supported vendors that can be used for Analytics as these stages can disrupt the operation of the Analytics Engine. For a list of these vendors, see the Visibility of logs and alerts from external sources table specifically those vendors with Normalized Log Visibility. - Another new stage is available called
drop.droptakes a condition similar to the XQLfilterstage (same syntax), but drops every log entry that passes that condition. One can think of it as a negative filter, sodrop <condition>is not equivalent tofilter not <condition>.dropcan only appear last in a statement. No other XQLp syntax can follow.
-
COLLECTsections take parameters, where some are mandatory and others optional.[COLLECT:vendor=<vendor>, product=<product>, target_brokers = (<broker_ID1, brokerID2,...>), no_hit = <keep\drop>];
Here's an example of how to define the
COLLECTsection with a singlebroker_ID:[COLLECT:vendor="PANW", product="NGFW_CEF", target_brokers=(BROKER_ID), no_hit=drop]
Here's an example of how to define the
COLLECTsection with multiplebroker_IDs:[COLLECT:vendor="PANW", product="NGFW_CEF", target_brokers=(BROKER_ID1, BROKER_ID2, BROKERID3), no_hit=drop]
The parameter descriptions are explained in the following table:
| Parameter | Description |
|---|---|
vendor |
The vendor that the specified COLLECT rule for data reduction and data manipulation at the Broker VM applies to (mandatory). |
product |
The product that the specified COLLECT rule for data reduction and data manipulation at the Broker VM applies to (mandatory). |
target_brokers |
<p>Specifies the list of Brokers to run the COLLECT rule for data reduction and data manipulation based on the vendor and product configured (mandatory). When target_brokers=*, the COLLECT rule applies to all the data collected by the Broker VM applets.</p><div data-gb-custom-block data-tag="hint" data-style="info" class="hint hint-info"><p>Note</p><p>The CSV Collector applet is not affected by the COLLECT rules applied to a Broker VM.</p></div> |
no_hit |
<p>No-match strategy to use for the entire specified group of COLLECT rules (optional). The default is keep.</p><ul><li>If no_hit = drop, then in a scenario where none of the COLLECT rules in the group generates output for a given event, that event is discarded.</li><li>If no_hit = keep, then in a scenario where none of the COLLECT rules in the group generates output for a given event, that event is passed to the Cortex XSIAM server.</li></ul> |
The following is an example of using a COLLECT rule to filter data for a specific vendor and product that will run before the INGEST section.
[COLLECT:vendor="Apache", product="ApacheServer", target_brokers = (bvm1, bvm2, bvm3), no_hit = drop] alter source_log = json_extract_scalar(_raw_log, "$.source") | filter source_log = "WebApp-Logs" | fields source_log, _raw_log; [INGEST:vendor="Apache", product="ApacheServer", target_dataset = "dvwa_application_log"] alter log_timestamp = json_extract_scalar(_raw_log, "$.timestamp") | alter log_msg = json_extract_scalar(_raw_log, "$.msg") | alter log_remote_ip = json_extract_scalar(_raw_log, "$.Remote_IP") | alter scanned_ip = json_extract_scalar(_raw_log, "$.Scanned_IP") | fields log_msg ,log_remote_ip ,log_timestamp ,source_log ,scanned_ip , _raw_log;
A few more points to keep in mind when writing COLLECT rules:
-
There are no
COLLECTrules by default, so all collected events are forwarded by the Broker VM to the Cortex XSIAM server.Tip
To reduce the amount of data transmitted to Cortex XSIAM from the broker, use filters to drop logs. Yet, be aware that once the logs are modified using
alterorfieldsstages, the Broker VM will convert the original log into a JSON format, which could increase the data size being sent from the broker to Cortex XSIAM. - When
COLLECTrules are defined, the designated Broker VMs check every collected event versus each rule. When there is a match for a given product or vendor, the Broker VM checks if it meets the filter criteria.- If it meets the criteria, the event is passed to the Cortex XSIAM server.
-
If it doesn’t meet the criteria, it depends on the
no_hitparameter.-If
no_hit=drop, then thisCOLLECTrule will not pass the event. Yet, the event still goes through other rules on this Broker VM.-If
no_hit=keep, the event is passed to the Cortex XSIAM server, and goes through other rules on this Broker VM.
- When the evaluated event, doesn’t match any product or vendor for a defined
COLLECTrule, the event is passed to the Cortex XSIAM server.
CONST
Prerequisite
Parsing Rules requires View/Edit RBAC permissions for Data Management (under Configurations → Data Management), which are the same permissions required for Dataset Management, Data Model Rules, and Event Forwarding.
A CONST section is used to define strings and numbers that can be reused multiple times within Cortex Query Language (XQL) statements in other INGEST sections by using $constName. This can be helpful to avoid writing the same value in multiple sections, similar to constants in modern programming languages.
[CONST] DEFAULT_DEVICE_NAME = "firewall3060"; // string FILE_REGEX = "c:\\users\\[a-zA-Z0-9.]*"; // complex string my_num = 3; /* int */
An example of using a CONST inside XQL statements in other INGEST sections using $constName:
Note
The dollar sign ($) must be adjacent to the [CONST] name, without any whitespace in between.
... | filter device_name = $DEFAULT_DEVICE_NAME | alter new_field = JSON_EXTRACT(field, $FILE_REGEX) | filter age < $MAX_TIMEOUT | join type=$DEFAULT_JOIN_TYPE conflict_strategy=$DEFAULT_JOIN_CONFLICT_STRATEGY (dataset=my_lookup) as inn url=inn.url ...
Important
Only quoted or integer terminal values are considered valid for CONST sections.
These will not compile:
[CONST] WORD_CONST = abcde; //invalid func_val = regex_extract(_raw_log, "regex"); // not possible RECURSIVE_CONST = $WORD_CONST; // not terminal - not possible
CONST sections are meant to replace values. Other types, such as column names, are not supported:
... | filter $DEVICE_NAME = "my_device" // illegal ...
A few more points to keep in mind when writing CONST sections:
CONSTnames are not case-sensitive. They can be written in any user-desired casing, such as UPPER_SNAKE, lower_snake, camelCase, and CamelCase. For example,MY_CONST=My_Const=my_const.CONSTnames must be unique inside a section, and across all sections of the file. You cannot have the sameCONSTname defined again in the same section, or in any otherCONSTsections in the file.- Since section order is unimportant, you do not have to declare a
CONSTbefore using it. You can have theCONSTsection written below other sections that use thoseCONSTsections. - A
CONSTis an add-on to the Parsing Rule syntax and is optional to configure. CONSTsyntax is derived from XQL, but a few modifications as explained in the Parsing Rules file structure and syntax.
RULE
Prerequisite
Parsing Rules requires View/Edit RBAC permissions for Data Management (under Configurations → Data Management), which are the same permissions required for Dataset Management, Data Model Rules, and Event Forwarding.
Rules are very similar to functions in modern programming languages. They are essentially pieces of Cortex Query Language (XQL) syntax, tagged with a name - alias, for easier code reuse and avoiding code duplications. A RULE is an add-on to the Parsing Rule syntax and is optional to configure.
RULE syntax is derived from XQL with a few modifications, as explained in the Parsing Rules file structure and syntax.
Note
For more information on the XQL syntax, see Get started with XQL.
A few more points to keep in mind when writing RULE sections.
-
Rules are defined by
[rule:ruleName]as depicted in the following example:[rule:filter_issues] filter raw_log not contains "issue";
-
Rules are invoked by using a
callkeyword as depicted in the following example:[rule:filter_issues] filter raw_log not contains "issue"; [rule:use_another_rule] filter severity="LOW" | call filter_issues | fields - raw_log;
This is equivalent to writing:
[rule:use_another_rule] filter severity="LOW" | filter raw_log not contains "issue" | fields - raw_log;
- Rule names are not case-sensitive. They can be written in any user-desired casing, such as UPPER_SNAKE, lower_snake, camelCase, and CamelCase). For example,
MY_RULE=My_Rule=my_rule. - Rule names must be unique across the entire file. This means you cannot have the same rule name defined more than once in the same file.
- Since section order is unimportant, you do not have to declare a
rulebefore using it. You can have theruledefinition section written below other sections that use this rule. -
You can add a single tag or list of tags to the ingested data as part of the ingestion flow that you can easily query. You can add tags using both the
INGESTandRULEsections.Adding a single tag:
[INGEST:vendor="Check Point", product="Anti Malware", target_dataset="malware_test", no_hit= drop , ingestnull = true ] alter xx = call new_tag_rule;
[RULE:new_tag_rule] tag add "test";
Adding a list of tags:
[INGEST:vendor="Check Point", product="Anti Malware", target_dataset="malware_test", no_hit= drop , ingestnull = true ] alter xx = call new_tag_rule;
[RULE:new_tag_rule] tag add "test1", "test2", "test3";
Note
You can also add tags using only the
INGESTsection. For more information, see INGEST.
EXTEND
Prerequisite
Parsing Rules requires View/Edit RBAC permissions for Data Management (under Configurations → Data Management), which are the same permissions required for Dataset Management, Data Model Rules, and Event Forwarding.
An EXTEND section is used to chain your Parsing Rules logic to extend your existing default RULE sections, which are added by a Content Package you installed from Marketplace. While optional to configure, an EXTEND section runs immediately after the default RULE section that it extends, and enables data manipulation without overriding or interfering with the existing vendor Parsing Rules. For more information on the RULE section in Parsing Rules, see RULE.
EXTEND syntax is derived from Cortex Query Language (XQL) with a few modifications as explained in the Parsing Rules file structure and syntax section. You can have multiple XQL statements, separated by a semicolon (;). Each statement creates a different extension.
Note
For more information on the XQL syntax, see Get started with XQL.
A few more points to keep in mind when writing EXTEND sections:
- You can only extend a default rule that is not overridden in the
RULEsections. - A rule can only be extended once.
- A
CONSTsection that is defined in Default Rules cannot be used in the User Defined Rules when configuring anEXTENDsection. -
An
EXTENDsection must specify the full header of the rule it is extending. When you extend a rule that was added by a Content Package installed from Marketplace, theEXTENDsection uses the format[EXTEND:<rule name> content_id = "<pack id>"], where thecontent_idcomes from the Content Package that the extended rule belongs to.Example 47.
You can see here the
EXTENDsection in User Defined Rules uses the full header of theRULEit’s extending from Default Rules.Default Rules:
[RULE:parse_ngfw_hipmatch content_id = "IronNet"] alter _time = time_generated | call extract_common_ngfw_fields | call extract_hipmatch_only_fields | call common_post_processing;
User Defined Rules:
[EXTEND:parse_ngfw_hipmatch content_id = "IronNet"] alter source = json_extract_scalar(source, "$.string") | filter __firewall_type = "firewall.hipmatch";
When this rule is run, the default
RULEsection runs, and is immediately followed by theEXTENDsection. This is equivalent to running one singleRULEsection as follows:[RULE:parse_ngfw_hipmatch content_id = "IronNet"] alter _time = time_generated | call extract_common_ngfw_fields | call extract_hipmatch_only_fields | call common_post_processing | alter source = json_extract_scalar(source, "$.string") | filter __firewall_type = "firewall.hipmatch";
Create Parsing Rules
Prerequisite
Parsing Rules requires View/Edit RBAC permissions for Data Management (under Configurations → Data Management), which are the same permissions required for Dataset Management, Data Model Rules, and Event Forwarding.
Cortex XSIAM provides a number of default Parsing Rules that you can easily override or extend as required using XQL and additional custom syntax that is specific to creating Parsing Rules. Before creating your own Parsing Rules, we recommend you review the following:
Important
When creating Parsing Rules, the _time field is a mandatory field. If the field is null or invalid, the _insert_time field is used instead. This field can be automatically parsed depending on the type of data being ingested. For example, for CEF or LEEF logs, the parser first tries to ingest timestamps from these fields in the following order: rt, start, end, and _insert_time.
How to create Parsing Rules
- In Cortex XSIAM , select Settings → Configurations → Data Management → Parsing Rules.
-
Select the Parsing Rules editor view for writing your Parsing Rules.
You can select one of the following views.
- User Defined: Leave the default view open and write your Parsing Rules directly in the editor.
- Default Rules: Select this view to understand which parsing rules are provided by default with Cortex XSIAM in read-only mode.
- Both: Select this view to see the Parsing Rules editor as well as the default rules as you write your Parsing Rules.
- Simulate: Select this view to test your Parsing Rules on actual logs and validate their outputs as you write your Parsing Rules.
- Write your Parsing Rules using XQL syntax and the syntax specific for Parsing Rules.
-
(Optional) Test your Parsing Rules on actual logs and validate their outputs using the Simulate view.
Note
You need Cortex XSIAM administrator or Instance Administrator permissions to access the Simulate view and perform these tests.
- Select the Simulate view.
- For the User defined rules that you want to test, select the logs from the XQL Samples listed that you want to use to simulate the rule. For each Vendor and Product, up to 5 different samples are available to choose from.
-
Simulate the rules based on the logs selected.
You can also pivot (right-click) any of the logs that you’ve selected to Simulate the rules.
-
Review the results in the Logs output table to determine if your User defined rules are fine or need further changes.
The Logs output table displays the following columns per dataset at the bottom of the window.
- Dataset: Displays the applicable dataset name and a line number associated with this dataset in the User defined rules section.
- Vendor: The vendor associated with this dataset.
- Product: The product associated with this dataset.
- Output Logs: Displays the available output log. When there is no output log to display, the text
Output logs is not availablewith the corresponding error message is displayed. When there is no output due to a missing rule in the User defined rules section for the logs selected, the text No output logs. You can change your parsing rules and try again is displayed. - Input Logs: Displays the relevant input log with a right-click pivot to Show diff between the Output Logs and Input Logs.
- (Optional) Modify your User defined rules and repeat steps #2-4 until you are satisfied with the results.
- (Optional) Override the default Parsing Rules raw dataset.
- Save your changes.
Troubleshooting Parsing rules errors
Prerequisite
Parsing Rules requires View/Edit RBAC permissions for Data Management (under Configurations → Data Management), which are the same permissions required for Dataset Management, Data Model Rules, and Event Forwarding.
To help you easily identify and resolve parsing errors in Cortex XSIAM, all parsing errors are saved to a separate dataset called parsing_rules_errors. This dataset displays important information about each error, including the RAW_LOG, log metadata, Parsing Rule metadata, and error description, which you need to effectively troubleshoot the problem. In addition, a Parsing Rules Error notification is sent to the Notification Center whenever a new parsing error is added to the dataset.
Types of Parsing Errors
There are different types of parsing errors:
- Compilation Errors: Unable to compile a rule for different reasons including invalid function parameters, such as invalid regex.
- Data Format Errors: A mismatch between the expected data type, such as CEF, LEEF, or JSON with the actual data, such as TEXT or CSV.
- Runtime Errors: Unable to apply a rule to the data, such as an attempt to add a String to a Number.
Parsing Errors Dataset
All parsing errors and Cortex Data Model (XDM) errors are saved to a dataset called parsing_rules_errors. The following table describes the fields that are available when running a query in XQL Search for the parsing_rules_errors dataset in alphabetical order.
Some errors can only be found after the applicable logs are collected in Cortex XSIAM.
Read more...
| Field | Description | Source |
|---|---|---|
| _BROKER_DEVICE_ID | Displays the ID of the Broker VM associated to the log that triggered this error. | Log Metadata |
| _BROKER_IP_ADDRESS | Displays the IP address of the Broker VM associated to the log that triggered this error. | Log Metadata |
| _BROKER_DEVICE_NAME | Displays the device name of the Broker VM associated to the log that triggered this error. | Log Metadata |
| _COLLECTOR_HOSTNAME | Displays the host name of the data collector associated to the log that triggered this error. | Log Metadata |
| _COLLECTOR_ID | Displays the ID of the data collector associated to the log that triggered this error. | Log Metadata |
| _COLLECTOR_IP_ADDRESS | Displays the IP address of the data collector associated to the log that triggered this error. | Log Metadata |
| _COLLECTOR_NAME | Displays the name of the data collector associated to the log that triggered this error. | Log Metadata |
| _COLLECTOR_TYPE | Displays the type of data collector associated to the log that triggered this error. | Log Metadata |
| CONTENT_ID | Displays the package_id of a content pack containing the default Parsing Rule for which this error was generated. |
Parsing Rule |
| CREATED_AT | Displays a timestamp for when the rule, which generated the error, was created. | Parsing Rule |
| END_LINE | Displays the last line of the particular rule associated to this error. | Parsing Rule |
| ERROR_CATEGORY | <p>Displays the category of the error, which can be one of the following:</p><ul><li>Compile: Compilation error, such as syntax error, missing argument, and invalid regex.</li><li>Data format: Errors relating to the data format, such as received LEEF when expected CEF.</li><li>Runtime: Error at run time, such as an attempt to add a String to a Number.</li></ul> | N/A |
| ERROR_MESSAGE | Displays the error message. | N/A |
| _FINAL_REPORTING_DEVICE_IP | Displays the IP address of the device that the log was collected from that triggered this error. | Log Metadata |
| _FINAL_REPORTING_DEVICE_NAME | Displays the name of the device that the log was collected from that triggered this error. | Log Metadata |
| _ID | Displays the Rule ID that triggered this error. | Parsing Rule |
| INGEST_NULL | Displays a boolean value of either TRUE or FALSE to indicate whether null value fields are configured to be ingested or not. By default, null fields are ingested. | Parsing Rule |
| NO_HIT | Displays the no-match strategy configured for the rule group that generated the parsing error. | Parsing Rule |
| _PRODUCT | Displays the defined PRODUCT associated to the log (for data format errors) or rule (for compilation and runtime errors) that triggered this error. | Log Metadata or Parsing Rule |
| RAW_LOG | Displays the raw log for the Parsing Rule error or parsed log for the Data Model Rule error. | Raw log |
| _REPORTING_DEVICE_IP | Displays the IP address of the device that the log originated from that triggered this error. | Log Metadata |
| _REPORTING_DEVICE_NAME | Displays the name of the device that the log originated from that triggered this error. | Log Metadata |
| RULE_TYPE | Displays the type of rule that triggered this error. | Parsing Rule |
| START_LINE | Displays the first line of the particular rule associated to this error. | Parsing Rule |
| TARGET_DATASET | Displays the Target dataset associated to the rule that triggered this error. | Parsing Rule |
| _TIME | Displays the timestamp when the error was generated. | Raw log |
| _VENDOR | Displays the defined VENDOR associated to the log (for data format errors) or rule (for compilation and runtime errors) that triggered this error. | Raw log or Parsing Rule |
| XDRC_ID | Displays the ID of the XDR Collector associated to the log that triggered this error. | Log Metadata |
| XDRC_IP | Displays the IP address of the XDR Collector associated to the log that triggered this error. | Log Metadata |
| XDRC_NAME | Displays the name of the XDR Collector associated to the log that triggered this error. | Log Metadata |
| XQL_TEXT | Displays the specific section of the rule related to the error generated. | Parsing Rule |
Parsing Rules Raw Dataset
Prerequisite
Parsing Rules requires View/Edit RBAC permissions for Data Management (under Configurations → Data Management), which are the same permissions required for Dataset Management, Data Model Rules, and Event Forwarding.
Each vendor and product has its own raw dataset that uses the format <vendor>_<product>_raw. For example, for Palo Alto Networks Next-Generation Firewall, the dataset is called panw_ngfw_raw. This raw dataset by default keeps all raw logs, whether ingested or dropped for other datasets.
You can override the default raw dataset, by creating an INGEST section referring to that dataset.
The following syntax overrides the panw_ngfw_raw automatic Parsing Rule:
[ingest:vendor=panw, product=ngfw, target_dataset=panw_ngfw_raw] filter ... | alter ...;
Data Model Rules
Notice
Only a user with Cortex Account Administrator or Instance Administrator permissions can access Data Model Rules.
Learn more about Cortex Data Model (XDM) Rules.
What are Data Model Rules?
Prerequisite
Data Model Rules requires View/Edit RBAC permissions for Data Management (under Configurations → Data Management), which are the same permissions required for Dataset Management, Parsing Rules, and Event Forwarding.
Cortex XSIAM enables you to map your logs into a single, unified data model. This data model provides a consolidated schema, and a simpler way to interact with your data, regardless of its source or dataset. To familiarize yourself with the data model schema, see XSIAM Data Model Schema.
You can map your data to the data model using Data Model Rules, either by using the Default Rules that are automatically added when installing Content Packages from the Marketplace, or by creating user-defined rules. You create rules with the Data Model Rules editor, which enables you to do the following:
- Map 3^(rd) party data to a consolidated schema with predefined data types.
- Enjoy auto-complete and mapping suggestions.
- Map multiple quarriable datasets to the data model.
Data Model Rules contain the following built-in characteristics:
- Each Data Model Rule is mapped between one dataset and the data model.
- A Data Model Rule takes rows from a dataset to use as an input, performs an arbitrary number of transitions and modifications on each column in the dataset using Cortex Query Language (XQL), and then returns the normalized rows with the corresponding data model’s schema.
Data Model Rules editor views
Prerequisite
Data Model Rules requires View/Edit RBAC permissions for Data Management (under Configurations → Data Management), which are the same permissions required for Dataset Management, Parsing Rules, and Event Forwarding.
The Data Model Rules editor contains the following views.
- User Defined Rules (default): Displays an editor for writing your own custom Data Model Rules that override the default rules. Once you edit a default Data Model mapping, you will no longer receive Marketplace updates.
- Default Rules (read-only): Displays the data model rules that are provided by default.
- Both: Side-by-side view of both the Default Rules and User Defined Rules, so that you can easily view both sets of rules on the same screen.
Data Model Rules file structure and syntax
Prerequisite
Data Model Rules requires View/Edit RBAC permissions for Data Management (under Configurations → Data Management), which are the same permissions required for Dataset Management, Parsing Rules, and Event Forwarding.
File structure
The Data Model Rules file consists of multiple sections of the following two types, which also represent the custom syntax specific to Data Model Rules:
- MODEL: This section is used to define the mapping between a single dataset and the data model.
- (OPTIONAL) RULE: Rules are part of the Cortex Query Language (XQL) syntax, which are tagged with a name, and can be reused in the code in the MODEL sections, or in other RULE sections (recursively), by using
[rule:ruleName].
The order of the sections is not significant.
Syntax
The syntax used in the Data Model Rules file is derived from XQL, with a few modifications. This subset of XQL is called XQL for Data Modeling (XQLm).
Note
For more information on XQL syntax, see the XQL Language Reference Guide.
In the MODEL and RULE sections, the following modifications apply to the XQLm syntax:
-
Only the following XQL stages are permitted: alter and filter. An additional
callstage is supported, which is used to invoke another rule.Note
You cannot
callaRULEsection that exists in Default Rules from the User Defined Rules section. - No output stages are supported.
XDM_ALIAScannot be used in rules. It is only supported in queries. For more information, see the search stage.- Every model definition in the Data Model Rules file must end with a semicolon (
;). -
Each XDM field used in the
MODELandRULEsections is constructed using dot notation using the following format:xdm.[<context>].[<compound>].<field>
For more information, see Field structure.
MODEL
A MODEL section is used to define the mapping between a single dataset and the data model. The MODEL section is mandatory per dataset. A RULE section is optional, and is used to help organize the MODEL sections.
MODEL syntax is derived from Cortex Query Language (XQL), with a few modifications, as explained in Data Model Rules file structure and syntax. In addition, MODEL sections contain the following syntax add-ons:
- You can have multiple MODEL sections.
-
MODEL sections take parameters, and not names as RULE sections use, where some are mandatory and others are optional.
[MODEL: dataset=<dataset>, content_id=<content_id>] <build the XQL logic>;
The parameter descriptions are explained in the following table:
| Parameter | Description |
|---|---|
| dataset | The name of the dataset that contains the source data to apply the mapping on (mandatory). |
| content_id | Identifier of the content as defined in the content package from the Marketplace. This parameter is relevant only for Default Rules and is not available in User Defined Rules (optional). |
[MODEL: dataset=panw_ngfw_traffic] filter appid = "dns" | alter dns_helper = json_extract(event, "$.dns") | alter xdm.network.dns.opcode = to_integer(json_extract_scalar(dns_helper, "$.opcode"), xdm.network.dns.is_truncated = to_boolean(json_extract_scalar(dns_helper, "$.is_truncated") );
Points to keep in mind when writing MODEL sections
- MODEL parameter names are not case-sensitive.
- Cortex Data Model (XDM) System fields (
_time,_insert_time,_vendor,_product) are mapped automatically from the dataset from the fields with the same names. - As section order is not significant, you do not have to declare a
RULEbefore using it in aMODELsection. - Each field used in the
MODELandRULEsections is constructed using dot notation with a specific format. Each field must be part of the predefined field set of the data model's schema. However, temporary variables, which will not affect the modeling, may be used. For more information, see Field structure. -
A
MODELsection can invoke a rule using thecallstage.Example 50.
In this example, both the RULE and
MODELsections are provided, so you can see how thecallstage invokes the rule.[RULE: common_ngfw_modeling] alter xdm.source.ipv4 = json_extract_scalar(actor, "$.client_ip") | alter xdm.network.ip_protocol = if( proto = 6, XDM_CONST.IP_PROTOCOL_TCP, proto = 11, XDM_CONST.IP_PROTOCOL_UDP, proto );
[MODEL: dataset=panw_ngfw_traffic] filter appid = "dns" | call common_ngfw_modeling | alter dns_helper = json_extract(event, "$.dns") | alter xdm.network.dns.opcode = to_integer(json_extract_scalar(dns_helper, "$.opcode"), xdm.network.dns.is_truncated = to_boolean(json_extract_scalar(dns_helper, "$.is_truncated") );
-
You can use the
config case_sensitivestage in theMODELsection to configure whether field values in the XDM are evaluated as case-sensitive or case-insensitive. Theconfig case_sensitivestage must be added at the beginning of the query. If you do not provide this stage in your query, the default behavior isfalse; case is not considered when evaluating field values.Note
The Settings → Configurations → XQL Configuration → Case Sensitivity (case_sensitive) setting can overwrite this
case_sensitiveconfiguration for all fields in the application except for BIOCs, which will remain case insensitive no matter what this setting is set to. For more information on this setting, see case_sensitive. -
Cortex XSIAM enables analytics to run on the following data:
- All mapped network data to the network 5 tuple (source IP, source port, target IP, target port, IP protocol), automatically creating network stories for XDM network data.
- All mapped authentication data, automatically creating authentication stories for XDM identity data when certain mandatory fields are mapped. For more information, see How to map authentication story events?.
Note
We recommend that you do not configure the same data source in both Marketplace and using a Cortex XSIAM data collector. Yet, if you do, the following will happen:
- For network data, all relevant logs from the different data sources are stitched to the same network story.
- For authentication data, all relevant logs from the different data sources are stitched to the same authentication story as long as the logs contain the network 5 tuple (source IP, source port, target IP, target port, IP protocol). The rest of the logs, without the network 5 tuple, create duplicate authentication stories.
RULE
Rules are very similar to functions in modern programming languages. They are essentially named pieces of Cortex Query Language (XQL) syntax, and can be reused in the code in the MODEL sections, or in other RULE sections (recursively), by using [rule:ruleName]. A RULE is an optional data model syntax.
RULE syntax is derived from XQL with a few modifications, as explained in the Data Model Rules file structure and syntax.
Note
For more information on the XQL syntax, see the XQL Language Reference Guide.
Points to keep in mind when writing RULE sections
-
Rules are defined by
[rule:ruleName]as shown in the following example:[RULE: common_ngfw_modeling] alter xdm.source.ipv4 = json_extract_scalar(actor, "$.client_ip") | alter xdm.network.ip_protocol = if( proto = 6, XDM_CONST.IP_PROTOCOL_TCP, proto = 11, XDM_CONST.IP_PROTOCOL_UDP, proto );
- Rules are invoked by using a
callstage. - Rule names are not case-sensitive.
- Rule names must be unique across the entire file.
- As section order is not significant, you do not have to declare a
rulebefore using it. You can have theruledefinition section written below other sections that use that specific rule. - Each field used in the
MODELandRULEsections is constructed using dot notation with a specific format. However, temporary variables, which will not affect the modeling, can be used. For more information, see Field structure.
Field structure
Prerequisite
Data Model Rules requires View/Edit RBAC permissions for Data Management (under Configurations → Data Management), which are the same permissions required for Dataset Management, Parsing Rules, and Event Forwarding.
When creating Data Model Rules, each field used in the MODEL and RULE sections is constructed using dot notation using the following format:
xdm.<context>.[<compound>].<field>
-
xdm.<context>.[<compound>].<field>Example 53.
xdm.source.host.device_id
-
xdm.<context>.<field>Example 54.
xdm.source.ipv4
| Part | Description |
|---|---|
<context> |
This is a composition of fields (<field>), either simple or <compound>, that are grouped together to form a logically coherent unit. |
<compound> |
This is a set of simple fields that are grouped together to form a meaningful group. For example, subject and recipients are part of the <compound> field called email. |
<field> |
This is a field that represents a primitive data type, such as a string or number or an array, or an IP address. |
Note
For more information on these data model fields, see XSIAM Data Model Schema.
Using ENUM fields
For fields of the ENUM type, you can map values from a predefined list of ENUMs. For example, the field xdm.network.ip_protocol is defined as Enum.IP_PROTOCOL, so you can assign it values such as XDM_CONST.IP_PROTOCOL_TCP. The full list can be found in the automatically suggested values for the relevant fields.
This syntax is not mandatory, and you can map any STRING value, but we recommend its use for consistency across all model mapping.
[RULE: common_ngfw_modeling] alter xdm.source.ipv4 = json_extract_scalar(actor, "$.client_ip") | alter xdm.network.ip_protocol = if( proto = 6, XDM_CONST.IP_PROTOCOL_TCP, proto = 11, XDM_CONST.IP_PROTOCOL_UDP, proto );
How to map authentication events for analytics
License
To enable Identity Threat Detection and Response (ITDR) analytics, you must have the ITDR license and ingest identity logs. Full identity analytics capabilities are optimized for data collected via Cortex XDR agents and specific cloud/SaaS integrations.
Cortex XSIAM enables analytics to run on all mapped authentication data, which automatically creates authentication stories for Cortex Data Model (XDM) identity data. To build these stories, you must map authentication events to the XDM schema using specific mandatory fields and principles. For a complete list of these fields, see XDM fields for mapping authentication events.
Prerequisite
- You must have View/Edit RBAC permissions for Data Management (under Configurations > Data Management).
- Familiarize yourself with the Cortex Data model (XDM) schema for field definitions and naming conventions, see XSIAM Data Model Schema.
Scope Clarification
This Feature focuses on authentication events related to SSO (Single Sign-On) and SaaS (Software-as-a-Service) application authentications. It does not cover internal authentication mechanisms such as Kerberos, NTLM, or traditional domain logon events generated by on-premise infrastructure.
Mapping principles
When mapping your authentication data, follow these guidelines:
- Prioritize conclusive events: Focus on mapping events that represent the final result of an authentication process.
- Exclude ambiguous steps: Intermediate or informational events should not be treated as indicators of success or failure.
- Preserve context across the full authentication flow: Include intermediate events to provide visibility into the process, while making it clear they are not final outcomes.
- Normalize raw error and outcome data: Define explicit mapping logic between the raw event fields that contain outcome or error messages, such as
get_reasonanddebugdata_errorcode, and the target XDM fields. This logic should normalize provider-specific strings or codes into a canonical format to support reliable detection and analytics across diverse sources. - Preserve attack evidence: Do not sanitize identity fields at model time. Hostile values, such as template-injection probes, must be preserved verbatim as they are critical evidence for detection.
Why follow the mapping principles?
- Prevents misclassification of failed sessions as successful.
- Avoids distorted behavioral baselines that can mask real attacks.
- Preserves full visibility of authentication flows without misleading analytics.
Third-party mapping examples
Mandatory XDM fields to map for authentication events
You must map all 15 of the following fields. If a mandatory field is unmapped or incorrect, the event will be dropped from authentication stories and identity analytics. For more detailed information on these fields, see XDM fields for mapping authentication events.
Important
To maximize the variety of issues that are retrieved based on the XDM authentication stories, we recommend that the following additional fields are populated: xdm.logon.type, xdm.source.user_agent, and xdm.source.host.device_category. Should you decide to change the default XDM mappings, ensure that both the mandatory and recommended fields are populated and do not contain any empty values.
| XDM Target Field | Data Type | Purpose and Guidance |
|---|---|---|
xdm.auth.service | String | System Role. Decided PER EVENT TYPE: IDP (validates), SP (initiates), or Universal (local/AAA). Do not use protocol names here. |
xdm.event.operation | String | Describes the action (such as AUTH_LOGIN, AUTH_MFA). Never blind-default if unclear. |
xdm.event.original_event_type | String | The raw vendor event name exactly as logged. |
xdm.event.outcome | Enum | Set only to SUCCESS or FAILED. Do not set on intermediate steps. |
xdm.event.tags | Array | Must include XDM_CONST.EVENT_TAG_AUTHENTICATION |
xdm.event.type | String | Must contain authentication. |
xdm.network.ip_protocol | Enum | The transport protocol (e.g., TCP). Fallback to IP_PROTOCOL_IP if unknown. |
xdm.source.ipv4 | String | The client IP observed by the authenticator. Never static or empty. |
xdm.source.port | Integer | Map real value; otherwise 0. |
xdm.source.user.upn | String | Identity Key. Must be UPN-shaped (user@domain). Use a shape-guard to append @localhost if the source provides only a bare username. |
xdm.source.user.identity_type | Enum | The nature of the principal (such as USER, MACHINE, BUILTIN). |
xdm.source.user.user_type | Enum | The account class (such as REGULAR, SERVICE_ACCOUNT). |
xdm.target.ipv4 | String | The IP of the device being accessed. If absent, use "". |
xdm.target.port | Integer | Map real value; otherwise 0. |
xdm.target.resource.name | String | The name or address of the service being accessed. Set this in addition to specific host/app fields. Never pad this; if absent, resolve to null. |
Detailed implementation guidance
The three branches logic
When an authentication field is missing from your source log, apply these treatments in order:
- MAP: If the source carries the value directly.
- DERIVE: If the value can be constructed from another field (e.g., synthesizing a UPN).
- PAD: Use semantically empty placeholders only if derivation is impossible.
- Valid Pads:
to_integer(0)for ports,""for target IP,IP_PROTOCOL_IPfor protocol. - Invalid Pads: Never pad
xdm.target.resource.nameorxdm.source.ipv4.
- Valid Pads:
Principal Classification (Identity vs. User Type)
To support identity analytics, you must map both fields using specific constants:
identity_type: Classifies the nature of the principal (such asIDENTITY_TYPE_MACHINEfor names ending in$,IDENTITY_TYPE_BUILTINforSYSTEM).user_type: Defines the operational class (such asUSER_TYPE_REGULARfor human logins,USER_TYPE_SERVICE_ACCOUNTforsvc_prefixes).
Mandatory Field Crosswalk for Network/AAA Devices
| Vendor Field Hint | XDM Target Field | Implementation Note |
|---|---|---|
user, username |
xdm.source.user.upn |
Synthesize UPN: concat(tmp_user, "@localhost") |
priv_lvl, privilege |
xdm.auth.privilege_level |
Band 15+ to ADMIN, 1+ to USER, 0 to GUEST. |
dvc_ip, nas-ip |
xdm.target.ipv4 |
The IP of the accessed device. |
src_ip, rem_addr |
xdm.source.ipv4 |
The IP of the authenticating client workstation. |
service |
xdm.auth.auth_method |
Protocol. (e.g., RADIUS). Do not map to xdm.auth.service. |
task_id, session-id |
xdm.network.session_id |
Crucial for correlating session lifecycle events. |
Important topologies
Device-local authentication
When a device logs a login to itself (such as SSH into a router):
- Observer: The device that wrote the log is the
xdm.observer.*. - Target: If the login was into that device, the device is ALSO the target:
xdm.target.host.hostnameandxdm.target.ipv4. - Source: The remote workstation initiating the connection is the source:
xdm.source.ipv4,xdm.source.port, andxdm.source.user.*.
AAA Gateway topology
Network-device AAA logs (TACACS+, RADIUS) involve three parties:
- Principal: The human or service account (
xdm.source.user.upn). - Source: The user's workstation (
xdm.source.ipv4). - Target: The network device being accessed (
xdm.target.ipv4andxdm.target.resource.name). - Observer: The AAA server validating the credential (
xdm.observer.name).
Logout convention
A logout record should take xdm.event.outcome = OUTCOME_SUCCESS but leave xdm.event.operation unset. This ensures logout events do not incorrectly inflate login metrics.
Generate data model rules with AI (preview)
Prerequisite
- Data model rules require View/Edit RBAC permissions for Data Management (under Configurations > Data Management).
- The AI generation option is available when adding a data model rule only when the Agents & LLM Experience is enabled in your Server Settings under Settings > Configurations > General > Server Settings > AI Configurations.
- The selected dataset must have collected at least 10 logs within the last 90 days. If a dataset does not meet this minimum volume requirement, the AI generator will not have enough data samples to analyze, and you will not be able to generate the rule.
Cortex XSIAM leverages built-in AI, available in preview mode, to simplify the process of writing custom data model rules for data sources without out-of-the-box support. AI handles data normalization intelligently, removing the burden of manual Cortex Data Model (XDM) schema mapping. By optimizing the mapping of fields to the XDM, the AI-driven generator enhances downstream detections and ensures your custom data is immediately query-ready.
Key Benefits
- Precision normalization: Automatically applies the correct mapping logic to ensure your custom data is immediately "query-ready" within the Cortex Data Model (XDM).
- Current XDM alignment: The AI generator is built using the most recent XDM schema definitions. This ensures that every new rule you generate is structurally compliant with the latest version of the Cortex Data Model available at that time.
- Increased SOC velocity: By streamlining the rule-writing process and eliminating repetitive retries, analysts can onboard a wider variety of data sources in a fraction of the time. This ensures critical data is ready much quicker for downstream threat detection.
- Built-in analytics for network data: For network logs, the AI generator automatically maps the core network 5-tuple (source IP, source port, destination IP, destination port, and IP protocol). This precise mapping ensures that network stories are generated which automatically enable Cortex XSIAM’s network analytics.
AI disclaimer
Always check AI-generated output for accuracy before saving the rule to ensure it meets your specific security and compliance requirements.
How to generate data model rules with AI
You can use AI to generate a custom data model rule, which will be added directly to your environment as a user-defined rule. The AI generation option is available exclusively for datasets of type Raw. When generating these rules, the tool assists you in building the necessary mapping logic using the Cortex Query Language (XQL).
- Access data model rules:\
Select Settings > Configurations > Data Management > Data Model Rules. - Choose your Data Model Editor view. The option to generate with AI is available in the following tabs:
- User Defined Rules: Shows custom data model rules.
- Both: Shows the default rules provided by Cortex XSIAM alongside the user-defined rules.
- Generate rule with AI:\
Click Generate with AI to open the Generate with AI window. -
In the Select Dataset field, choose a dataset from the list of available ingested and parsed data sources. Only datasets of type raw are shown. The Generate rule button remains disabled until you make a selection.
Note
The dataset you select must contain at least 10 logs ingested within the last 90 days. If the dataset does not meet this log volume threshold, the system cannot analyze the samples, and the rule generation process cannot proceed. - Click Generate rule. Wait until the rule is generated; this can take a few minutes. Do not close the window while generation is in progress, as doing so will interrupt the process. You can review the XQL before proceeding with the rule.
- Apply the generated rule:\
After the rule is displayed, click Apply. When prompted with a warning that this action will override any existing user-defined rule, click Apply to proceed. The rule is listed in the Data Model Editor, where only the relevant dataset section is either overwritten or added depending on the dataset selected. Before the rule a comment is added in the format:\
//Generated with AI | UUID: <UUID> | Timestamp: <timestamp> - Review and, if needed, customize the data model rule according to your requirements.
- Click Save.
Data security and control
The AI-powered data model rules are built on responsible AI principles to ensure its use is safe, fair, and trustworthy.
The following describes how AI-powered data model rules protects sensitive data and gives you control and understanding over its automated actions for data security and control:
How sensitive data is protected
Data is hosted and encrypted by default on a dedicated Google Cloud Platform (GCP) project, and is isolated and protected by your specific IAM permissions. Google's multi-tenant architecture enforces strict data separation between customers.
User approval for generated content
A rule generated by AI is never implemented automatically. Before a rule is activated, you are presented with the proposed Cortex Query Language (XQL) syntax and Cortex Data Model (XDM) mapping for review. This "human-in-the-loop" approach ensures you can validate, edit, or reject any generated content before saving changes to your environment.
Data user policy
Inputs, such as the dataset on which to build the rule, and the resulting outputs are processed only to generate the immediate response. This data is not harvested for model training, nor is it ever shared with third-party entities.
Data residency
To align with modern data-governance standards, all prompts and responses stay within your specific region’s compute boundary. This ensures that your AI-assisted data onboarding workflows remain compliant with regional data-residency practices.
Create Data Model Rules
Prerequisite
Data Model Rules requires View/Edit RBAC permissions for Data Management (under Configurations → Data Management), which are the same permissions required for Dataset Management, Parsing Rules, and Event Forwarding.
You can override rules or create your own rules using XQL and additional custom syntax that is specific to defining Data Model Rules. Once you edit a default data model mapping, you will no longer receive Marketplace updates.
Review the following:
- Data Model Rules editor views
- Data Model Rules file structure and syntax
- How to map authentication story events?
How to create Data Model Rules
- In Cortex XSIAM, select Settings → Configurations → Data Management → Data Model Rules.
-
Select the Data Model editor view for writing your Data Model Rules.
You can select one of the following views:
- User Defined Rules: Leave the default view open and write your Data Model Rules directly in the editor.
- Both: Select this view to see the Data Model Rules editor as well as the default rules as you write your Data Model Rules.
- Write your rules using XQL syntax and the syntax specific to Data Model Rules.
-
(Optional) Use XQL Search to test your Data Model Rules and review logs.
You can create queries on the data model. For more information, see Create XQL query.
Troubleshooting Data Model Rules
Prerequisite
Data Model Rules requires View/Edit RBAC permissions for Data Management (under Configurations → Data Management), which are the same permissions required for Dataset Management, Parsing Rules, and Event Forwarding.
To help you easily identify and resolve errors related to invalid Cortex Data Model (XDM) Rules, Cortex XSIAM provides the following:
- When an XDM query runs and one of the Data Model Rules is invalid, the invalid rule is automatically disabled and excluded from the query, and a warning is displayed.
- When a Data Model Rule is disabled, a message is added to your Cortex XSIAM console Notification Center. For more information about the Data Model Rules notifications, see Data Model Rules notifications.
- The Data Model Rules editor displays an error icon and a message beside invalid Data Model Rules.
-
An audit log is added to the Management Audit Log whenever a Data Model Rule becomes invalid, and when an invalid Data Model Rule becomes valid.
Tip
To ensure you and your colleagues stay informed about Data Model Rules activity, you can also Configure notification forwarding to forward your Data Model Rules audit logs to an email distribution list or Syslog server. For more information about the Data Model Rules audit logs, see Monitor Data Model Rules activity.
- When a rule is fixed, it is automatically enabled. User defined Data Model Rules are updated manually in the User Defined Rules editor. While default Data Model Rules are updated as part of a Marketplace package update, or a background change, such as an XQL content change.
- All Data Model Rules compilation errors are added to the
parsing_rules_errorsdataset.
Dataset for Data Model Rules Errors
All Data Model Rules compilation errors, such as syntax errors, missing arguments, and invalid regex, are saved to a dataset called parsing_rules_errors. This dataset also includes Parsing Rules errors. The following table describes the fields that are applicable to troubleshooting Data Model Rules errors when running a query in XQL Search for the parsing_rules_errors dataset in alphabetical order.
Note
Since this dataset also contains Parsing Rules errors, some of the fields are irrelevant for Data Model Rules and aren't included in the table.
Read more...
| Field | Description |
|---|---|
| CREATED_AT | Displays the timestamp when the error was generated. |
| ERROR_CATEGORY | Displays the category of the error, which for Data Model Rules errors is always Compile for compilation errors. |
| ERROR_MESSAGE | Displays the error message. |
| _ID | Displays the Rule ID that triggered this error. |
| RULE_TYPE | Displays the type of rule that triggered this error. |
| TARGET_DATASET | Displays the target dataset associated to the rule that triggered this error. |
| _TIME | Displays the timestamp when the error was generated. |
| XQL_TEXT | Displays the specific section of the Data Model Rule related to the error generated. |
Using data enrichment
Prerequisite
Data Model Rules requires View/Edit RBAC permissions for Data Management (under Configurations → Data Management), which are the same permissions required for Dataset Management, Parsing Rules, and Event Forwarding.
Cortex XSIAM automatically enriches your Cortex Data Model (XDM) data with additional information and context. Some examples of the types of data that are enriched include:
Note
For a complete list of auto-enriched fields, see the XSIAM Data Model Schema.
- IP addresses are enriched with geolocation information.
- User data is normalized.
- If DSS exists, it is also enriched.
These enrichments are important for cyber analytics, rule detection, and investigations. Since these fields are enriched automatically by default, they do not have to be mapped manually in Data Model Rules. Note that enrichment is not performed when the input fields needed for enrichment are not available.
Enriched data is calculated by the system upon ingestion, and is saved for future queries. Keep in mind that some data may change over time, such as IP addresses that may change geolocation. Therefore, checking the same IP address in external systems at a later time might return a different geolocation result.
Overriding Data Enrichment
We do not recommend overriding enriched fields. However, if enriched fields are not desired, they can be overridden by mapping data to fields that are usually enriched.
[MODEL: dataset=okta_sso_raw] | alter xdm.source.ip = actor->ip_address, xdm.source.location.country = actor->country, xdm.source.location.city = actor->geo.city;
When overriding enriched fields, ensure the following:
- The overridden data should be normalized.
- All relevant enriched fields should be overridden (for example, all location fields), and empty values should be filled with “unknown” (or with NULL, if calculated enrichments are desired). These actions will prevent data mismatch and conflicts.
Important
When manually mapping ASN fields that are enriched, such as xdm.source.asn.as_number, with other ISP and domain fields that are not enriched, such as xdm.source.asn.isp and xdm.source.asn.domain, it's possible to receive incorrect XDM query results due to the misalignment between the overridden enrichement and system enrichment fields.
Limitations
- Geolocation limitations
- Some values will be NULL if the log country doesn't match the country detected by an external geolocation tool.
- There might be discrepancies when some data come from the log and other data from the enrichment. For example, log country data versus enrichment longitude data.
- Data enrichment is not performed for EDR events.
- This feature is not supported in cold storage.
Backward compatibility
Data ingested by versions prior to Cortex XSIAM version 1.3 will not be enriched, because enrichment is calculated at the time of ingestion.
By default, enrichment is performed for NULL values only (non-NULL values are not overridden). Therefore, some existing mapping rules may need to be updated, in order to prevent mapping data to the enriched fields. Contact Customer Support for assistance with converting custom modeling rules and saved queries.
Data Model Rules notifications
Prerequisite
Data Model Rules requires View/Edit RBAC permissions for Data Management (under Configurations → Data Management), which are the same permissions required for Dataset Management, Parsing Rules, and Event Forwarding.
To help you monitor effectively your Data Model Rules, Cortex XSIAM sends notifications to your Cortex XSIAM console Notification Center.
Cortex XSIAM sends the following notification:
- Invalid Data Model Rules: Notifies when a Data Model Rule is invalid and will be excluded from
datamodelqueries.
To ensure you and your colleagues stay informed about Data Model Rules activity, you can also Configure notification forwarding to forward your Data Model Rules logs to an email distribution list or Syslog server. For more information about the Data Model Rules audit logs, see Monitor Data Model Rules activity.
Monitor Data Model Rules activity
Prerequisite
Data Model Rules requires View/Edit RBAC permissions for Data Management (under Configurations → Data Management), which are the same permissions required for Dataset Management, Parsing Rules, and Event Forwarding.
Cortex XSIAM logs entries for events related to the Data Model Rules monitored activities. Cortex XSIAM stores the logs for 365 days. To view the Data Model Rules audit logs, select Settings → Management Audit Logs.
To ensure you and your colleagues stay informed about Data Model Rules activity, you can Configure notification forwarding to forward your Data Model Rules audit logs to an email distribution list or Syslog server.
You can customize your view of the logs by adding or removing filters to the Management Audit Logs table. You can also filter the page result to narrow down your search. The following table describes the default and optional fields that you can view in the Cortex XSIAM Management Audit Logs table:
Note
Certain fields are exposed and hidden by default. An asterisk (*) is beside every field that is exposed by default.
| Field | Description |
|---|---|
| Description* | Log message that describes the action. |
| Email of the user who performed the action. | |
| Host Name* | This field is not applicable for Data Model Rules logs. |
| ID | Unique ID of the action. |
| Reason | This field is not applicable for Data Model Rules logs. |
| Result* | The result of the action ( Success, Fail, or Partial) |
| Severity* | <p>Severity associated with the log:</p><ul><li>Critical</li><li>High</li><li>Medium</li><li>Low</li><li>Informational</li></ul> |
| Timestamp* | Date and time when the action occurred. |
| Type* and Sub-Type* | <p>Additional classifications of Data Model Rules logs (Type and Sub-Type):</p><ul><li><p>XDM Config:</p><ul><li>Saving XDM mappings file: Indicates whenever a Data Model Rule is saved in the editor, the specific changes made to the Cortex Data Model (XDM) mappings. In addition, indicates whenever the changes weren't able to be saved.</li><li>Disabled: Indicates the Data Model Rule and associated dataset that are now disabled. This invalid rule is excluded from the query until the changes are made to fix the problem.</li><li>Enabled: Indicates the Data Model Rule and associated dataset that have been updated and are now enabled.</li></ul></li></ul> |
| User Name* | Name of the user who performed the action. |
Manage Event Forwarding
Currently, Event Forwarding via Google Pub/Sub is not supported for third-party destinations that require subscription discovery permissions, such as Splunk, Cribl, or Security Onion. These solutions typically require additional Google Cloud permissions, such as pubsub.subscriptions.get, that are not provided by the default Cortex XSIAM service account role. Before configuring event forwarding, verify if your destination requires subscription discovery or specific metadata parameters that exceed the standard Pub/Sub Subscriber role.
Prerequisite
Event Forwarding requires View/Edit RBAC permissions for Data Management (under Configurations → Data Management), which are the same permissions required for Parsing Rules, Data Model Rules, and Dataset Management.
You can save your ingested, parsed data in an external location by exporting your event logs to a temporary storage bucket on Google Cloud Platform (GCP).
After exporting logs, you can download them from GCP for up to 14 days. The Pub/Sub subscription messages are available for 7 days.
Event forwarding has the following purposes:
- Compliance: You may have specific compliance requirements to retain logs in a separate, secure environment for long-term storage or auditing purposes.
- Long-term archive: The core function is to export the event logs that the tenant has ingested and parsed to a storage location outside of the XSIAM tenant. This provides you with a copy of the normalized and processed data.
- External analytics: Download the exported event logs for use in other security tools, data analysis platforms, or for offline forensic investigation.
You can forward the following events to GCP:
-
Endpoints Event Forwarding
Forwards raw, high-fidelity security telemetry collected by EDR, including data from endpoints through the XDR Agent and cloud workloads (VMs, containers, or third-party EDRs). The exported logs are raw data, without any stories, and export a subset of the endpoint data without filtering or configuration options. For more information about the type of information forwarded, see Endpoints Event Forwarding - included/excluded fields by event type.
Note
Requires the Endpoints Event Forwarding add-on.
-
GB Event Forwarding
Covers all other security data measured by daily ingestion volume (in Gigabytes). This includes non-endpoint logs such as firewall traffic, cloud audit logs, network flow logs, identity data, and general Syslogs from servers and devices. The exported logs are raw data, without any stories, and export all the data without filtering or configuration options.
Note
Requires the GB Event Forwarding add-on
Use the Event Forwarding page to activate Event Forwarding, to retrieve the path and credentials of your external storage destination on GCP. Once this page is activated, Cortex XSIAM automatically creates the GCP bucket.
Important
Since data is aggregated and compressed, it may take up to two hours until the data is available in the forwarding bucket.
Upload to a temporary GCP storage bucket
Before you begin, ensure that you have the view/edit permission for Data Management. Instance Administrators have this permission by default.
- Under Settings → Configurations → Data Management → Event Forwarding, activate one or more of the following:
- Enable GB Event Forwarding
- Enable Endpoints Event Forwarding
-
Save your selection.
The Destination section displays the details of the GCP bucket created by Cortex XSIAM, where your data is stored for 14 days. The data is compressed and saved as a line-delimited JSON gzip file.
- Access GCP Cloud Storage using a Service Account.
- Copy the storage path displayed.
-
Generate and download the Service Account JSON WEB TOKEN, which contains the access key.
Save it in a secure location. If you need to regenerate the access token, Replace and download a new token. This action invalidates the previous token.
The token provides access to all your data stored in this bucket. It must be saved in a safe place.
Use the storage path and access key to manually retrieve your files or use an API for automated retrieval.
- Using the storage path and access key, retrieve your files manually or using an API.
- (Optional) Use the Pub/Sub subscription to ensure reliable data retrieval without any loss.
- Copy the Pub/Sub subscription provided.
-
Configure your application or system to receive messages from the Pub/Sub subscription.
Whenever a new file is added to the GCS bucket, a message is sent to the Pub/Sub subscription. The object path of the file in the bucket has the prefix
internal/. - Process the received message to initiate the download of the corresponding file.
Endpoints Event Forwarding - included/excluded fields by event type
Prerequisite
Event Forwarding requires View/Edit RBAC permissions for Data Management (under Configurations → Data Management), which are the same permissions required for Parsing Rules, Data Model Rules, and Dataset Management.
Endpoints Event Forwarding exports raw, high-fidelity security telemetry collected by EDR, including data from endpoints through the XDR Agent and cloud workloads (VMs, containers, or third-party EDRs). The exported logs are raw data, without any stories, and export a subset of the endpoint data without filtering or configuration options.
Types of events exported for the endpoints
The table below lists the types of events exported for the endpoints and the fields that are included and excluded:
Exported event type: Network
| Included field | Excluded field |
|---|---|
| action_socket_type | is_boot_replay |
| action_remote_ip | action_proxy |
| action_remote_port | action_network_app_ids |
| action_local_ip | action_network_rule_ids |
| action_local_port | action_network_dpi_fields |
| action_network_connection_id | action_network_is_loopback |
| action_network_is_server | action_upload |
| action_network_creation_time | action_download |
| action_total_upload | action_network_stats_seq |
| action_total_download | action_network_is_ipv6 |
| action_network_protocol | |
| action_network_stats_is_last |
Exported event type: Process
| Included field | Excluded field |
|---|---|
| uuid / _id | action_process_causality_id |
| action_process_os_pid | action_process_is_causality_root |
| action_process_instance_id | action_process_is_replay |
| action_process_image_md5 | action_process_yara_file_scan_result |
| action_process_image_sha256 | action_process_wf_verdict |
| action_process_image_path | action_process_static_analysis_score |
| action_process_image_name | execution_actor_causality_id |
| action_process_image_extension | action_process_ns_pid |
| action_process_image_command_line | action_process_container_id |
| action_process_signature_product | action_process_is_container_root |
| action_process_signature_vendor | action_process_image_command_line_indices |
| action_process_signature_is_embedded | action_process_is_special |
| action_process_signature_status | action_process_ns_user_sid |
| action_process_integrity_level | action_process_ns_user_real_sid |
| action_process_username | action_process_file_size |
| action_process_user_sid | action_process_file_create_time |
| action_process_in_txn | action_process_file_mod_time |
| action_process_pe_load_info | action_process_remote_session_ip |
| action_process_peb | action_process_file_info |
| action_process_peb32 | action_process_device_info |
| action_process_last_writer_actor | execution_actor_instance_id |
| action_process_token | action_process_user_real_sid |
| action_process_privileges | action_process_requested_parent_pid |
| action_process_fds | action_process_requested_parent_iid |
| action_process_scheduled_task_name | |
| action_process_termination_date | |
| action_process_instance_execution_time | |
| action_process_termination_code |
Exported event type: File
| Included field | Excluded field |
|---|---|
| action_file_path | action_file_wf_verdict |
| action_file_name | action_file_yara_file_scan_result |
| action_file_previous_file_path | action_file_dir_query |
| action_file_previous_file_name | action_file_previous_device_info |
| action_file_md5 | action_file_device_info |
| action_file_sha256 | action_file_reparse_path |
| action_file_size | action_file_reparse_count |
| action_file_attributes | action_file_dirty_reason |
| action_file_create_time | action_file_remote_ip |
| action_file_mod_time | action_file_remote_port |
| action_file_access_time | action_file_remote_file_ip |
| action_file_type | action_file_remote_file_host |
| action_file_operation_flags | action_file_sec_desc |
| action_file_mode | action_file_previous_file_extension |
| action_file_owner | action_file_extension |
| action_file_owner_name | action_file_archive_list |
| action_file_group | action_file_contents |
| action_file_group_name | |
| action_file_device_type | |
| action_file_signature_product | |
| action_file_signature_vendor | |
| action_file_signature_is_embedded | |
| action_file_signature_status | |
| action_file_pe_info | |
| action_file_prev_type | |
| action_file_last_writer_actor | |
| action_file_is_anonymous |
Exported event type: Registry
| Included field | Excluded field |
|---|---|
| action_registry_value_type | |
| action_registry_key_name | |
| action_registry_data | |
| action_registry_value_name | |
| action_registry_old_key_name | |
| action_registry_file_path | |
| action_registry_return_val |
Exported event type: Injection
| Included field | Excluded field |
|---|---|
| action_remote_process_thread_id | action_remote_process_causality_id |
| action_remote_process_os_pid | action_remote_process_is_causality_root |
| action_remote_process_instance_id | action_remote_process_is_replay |
| action_remote_process_image_md5 | action_remote_process_image_extension |
| action_remote_process_image_sha256 | action_remote_process_image_command_line_indices |
| action_remote_process_image_path | action_remote_process_is_special |
| action_remote_process_image_name | action_remote_process_file_size |
| action_remote_process_image_command_line | action_remote_process_file_create_time |
| action_remote_process_signature_product | action_remote_process_file_mod_time |
| action_remote_process_signature_vendor | action_remote_process_file_info |
| action_remote_process_signature_is_embedded | |
| action_remote_process_signature_status | |
| action_remote_process_thread_start_address | |
| action_remote_process_integrity_level | |
| action_remote_process_username | |
| action_remote_process_user_sid | |
| address_mapping |
Exported event type: Load Image
| Included field | Excluded field |
|---|---|
| action_module_path | action_module_is_replay |
| action_module_md5 | action_module_yara_file_scan_result |
| action_module_sha256 | action_module_file_size |
| action_module_base_address | action_module_file_create_time |
| action_module_image_size | action_module_file_mod_time |
| action_module_signature_product | action_module_file_access_time |
| action_module_signature_vendor | action_module_device_info |
| action_module_signature_is_embedded | action_module_wf_verdict |
| action_module_signature_status | |
| action_module_file_info | |
| action_module_last_writer_actor | |
| action_module_other_load_location | |
| action_module_page_protection | |
| action_module_system_properties | |
| action_module_code_integrity | |
| action_module_boot_code_integrity |
Exported event type: User Status Change
| Included field | Excluded field |
|---|---|
| action_user_status | |
| action_username | |
| action_user_status_sid | |
| action_user_session_id | |
| action_user_is_local_session |
Exported event type: Host Status Change
| Included field | Excluded field |
|---|---|
| action_boot_time | |
| action_powered_off |
Exported event type: Agent Status Change
| Included field | Excluded field |
|---|---|
| action_boot_instance_cleanup_required | |
| agent_status_component |
Exported event type: Host Metadata Discovery/Change
| Included field | Excluded field |
|---|---|
| host_metadata_interface_map | |
| host_metadata_hostname | |
| host_metadata_domain |
Common fields for all event types
The table below lists the common fields for all event types and the fields that are included and excluded.
| Common fields for all event types | Included field | Excluded field |
|---|---|---|
| Agent | agent_content_version | agent_install_type |
| agent_hostname | event_utc_diff_minutes | |
| agent_interface_map | manifest_file_version | |
| agent_os_sub_type | source_message_id | |
| agent_os_type | zip_id | |
| agent_version | agent_request_time | |
| agent_id | server_request_time | |
| agent_ip_addresses | agent_id_hash | |
| agent_ip_addresses_v6 | agent_id_hash_bre | |
| backtrace_identities | ||
| _product | ||
| _vendor | ||
| actor_fields | ||
| agent_is_vdi | ||
| Common | event_version | event_is_impersonated |
| event_type | event_is_replay | |
| event_sub_type | event_impersonation_status | |
| event_id | event_is_simulated | |
| event_timestamp | event_user_presence | |
| event_rpc_interface_uuid | agent_host_boot_time | |
| event_rpc_func_opnum | agent_session_start_time | |
| event_validity_enum | ||
| event_invalidity_field | ||
| event_rpc_inteface_version_major | ||
| event_rpc_inteface_version_minor | ||
| event_rpc_protocol | ||
| event_address_mapped | ||
| event_user_presence_status | ||
| Actor | os_actor_local_ip | actor_ns_user_sid |
| os_actor_local_port | actor_process_auth_id | |
| os_actor_primary_user_sid | actor_process_causality_id | |
| os_actor_primary_username | actor_process_ns_pid | |
| os_actor_process_command_line | actor_process_session_id | |
| os_actor_process_image_md5 | actor_process_signature_is_embedded | |
| os_actor_process_image_name | actor_process_signature_product | |
| os_actor_process_image_path | actor_process_signature_vendor | |
| os_actor_process_image_sha256 | actor_remote_host | |
| os_actor_process_signature_status | actor_remote_pipe_name | |
| os_actor_process_logon_id | actor_remote_port | |
| os_actor_process_os_pid | actor_rpc_interface_version_major | |
| os_actor_remote_ip | actor_rpc_interface_version_minor | |
| os_actor_process_instance_id | actor_rpc_protocol | |
| os_actor_thread_thread_id | actor_type | |
| actor_rpc_func_opnum | ||
| actor_rpc_interface_uuid | ||
| actor_process_device_info | ||
| actor_process_execution_time | ||
| actor_process_file_create_time | ||
| actor_process_file_mod_time | ||
| actor_process_file_size | ||
| actor_process_image_extension | ||
| actor_process_instance_id | ||
| actor_process_command_line_indices | ||
| actor_process_integrity_level | ||
| actor_process_is_special | ||
| actor_process_last_writer_actor | ||
| actor_process_instance_id | ||
| actor_thread_thread_id | ||
| actor_is_injected_thread | ||
| actor_causality_id | ||
| actor_effective_username | ||
| actor_effective_user_sid |
Manage compute units
Cortex XSIAM uses compute units (CU) for these types of queries:
- API Queries: When running Cortex Query Language (XQL) queries on your data sources using APIs, each XQL query API consumes CU based on the timeframe, complexity, and number of API response results.
- Apps: The Notebooks instance consumes 1000 CU each day, and BigQuery queries consume CU based on the timeframe, complexity, and number of results. Apps are charged daily at 00:00 UTC.
-
Cold Storage Queries: Cold Storage is a data retention offering for cheaper storage, usually for long-term compliance needs, with limited search options. You can perform queries on Cold Storage data using the following dataset formats:
- For typical cold storage queries:
cold_dataset = <dataset name> -
For historical data imported into cold storage queries:
cold_dataset = archive_<dataset name>.Note
For more information, see Import historical data into cold storage.
These cold storage queries consume CU according to the following calculations:
- Amount of data queried. 1CU for querying 35GB of data.
- Timeframe, complexity, and the number of Cold Storage response results of each XQL Cold Storage query.
When you query Cold Storage data, the rewarmed data is saved in a temporary hot storage cache that is available for subsequent queries on the same time range at no additional cost. The rewarmed data is available in the cache for 24 hours, and on each re-query, the cached data is extended for 24 hours, for up to 7 days.
Note
The CU consumption of cold storage queries is based on the number of days in the query time frame. For example, when querying 1 hour of a specific day, the CU of querying this entire day is consumed. When querying 1 hour that extends past 2 days, such as from 23:50 to 00:50 of the following day, the CU of querying these two days is consumed.
- For typical cold storage queries:
Important
Agentic and LLM information is shown only for informational purposes and does not currently consume compute units.
Compute units usage
Cortex XSIAM provides a free daily quota of compute units (CU) allocated according to your license size. Queries called without enough quota will fail.
Important
Compute units consumption currently applies only to XQL queries. Agentic and LLM information is shown only for informational purposes and does not consume compute units.
To expand your investigation capabilities, you can purchase additional CU by enabling the Compute Unit add-on. After purchasing the additional CU, you can enable the add-on by selecting Settings → Cortex XSIAM License → Addons, hovering over the Extended Compute Units tile and clicking Enable.
\
The Compute Unit add-on provides an additional 1 compute unit per day for a year, in addition to your free annual quota. For example, if you have allocated 1,825 free annual CU, with the add-on, you will have a total of 2,190 annual compute units. The Compute Unit add-on is calculated on an annual basis, starting from the procurement of your add-on license. The minimum purchase amount is 50 compute units.
You can configure the daily consumption limit for your compute units according to your organizational needs and change it when needed. For example, you can set a lower limit on a daily basis, and during an incident investigation, you can change it to a higher limit that enables you to consume more compute units.
Your unused compute unit balance cannot be transferred from one licensing period to the next.
To gauge how many CU you require, Cortex XSIAM provides a 30-day free trial period with 1/12 of your allocated annual CU quota to run XQL API and Cold Storage queries. You can then track the cost of each XQL API and Cold Storage query response in the Compute Unit Consumption page. In addition, Cortex XSIAM sends a notification when the Compute Units add-on has reached your daily threshold.
View and manage your compute units usage
You can view and manage your compute units usage at Settings → Configurations → Data Management → Compute Unit Consumption.
Important
Compute units consumption currently applies only to XQL queries. Agentic and LLM information is shown only for informational purposes and does not consume compute units.
Widgets
The following widgets present information about your compute units consumption and enable you to manage the daily limit.
NOTE
Widgets include data for agents and LLM usage, but agents and LLM usage does not consume compute units at this time. Data is provided only for informational purposes.
The Total annual usage widget shows the number of free compute units per license year, the number of purchased compute units per license year, and the ratio of used compute units to your yearly total compute units.
The Daily limit widget shows the day’s consumption of compute units. If you have Edit permissions for Public APIs, you can click Set daily limit to customize the daily limit to meet your organizational needs. The default daily limit is the annual quota divided evenly. For Managed Security tenants, the values calculated are the total daily usage of parent and child tenants.
- Divide annual quota evenly: Total annual compute units divided by 365.
- 1% of annual quota: 1% of the total annual compute units.
- No limit
- Custom: Configure a daily amount that is equal to or greater than your daily average calculated over a year (annual total/365). Use only integers.
The Consumption by category over time widget, by default, displays the last 30 days. You can click individual categories under the graph to filter. You can also change the timeframe to the last 12 months by filtering by timestamp in the Compute Units Usage table below.
The daily compute units are calculated at 00:00 UTC time. The red line represents your daily limit for that day. If you change the daily limit multiple times on a specific day, the displayed limit is the last number you configured on that day.\
\
The Usage by type default, by default, displays the last 30 days. You can click individual categories in the graph to filter. You can also change the timeframe to the last 12 months days by filtering by timestamp in the Compute Units Usage table below.
NOTE: For Managed Security tenants, select a tenant from the MSSP Tenant Selection drop-down menu to display information for that tenant.
Compute Units Table
In the Compute Units Usage table, you can filter all the requests that were executed on your tenant. You can filter and sort according to the following fields:
- ID: Unique identifier representing the executed XQL API query or request.
- Timestamp: Date and time of execution. For Notebooks and BQ queries, this is the data and time the query is charged.
- Type: Indicates the type of request.
- Trigger/PAPI Key ID:
- For API calls: PAPI Key.
- For manual actions: User.
- For automated actions: Rule or playbook.
- Query/Prompt: The query or prompt.
- Compute Unit Usage: How many units were used.
- Category: XQL Queries, Agents & LLM.
- Trigger Type: The type of source of the query or prompt. For example, automation rule or playbook.
- Billable: Whether the query was deducted from your compute units. Requests that are non-billable are displayed for informational purposes and do not affect your daily limit or compute units balance.
- Tenant: Appears only in a Managed Security tenant. Displays which tenant executed the query.
NOTE: For Managed Security tenants, select a tenant from the MSSP Tenant Selection drop-down menu to display information for that tenant.
Investigate the XQL API results.
In the Compute Units Usage table, locate an XQL API query, right-click, and select Show results.
The query is displayed in the query field of the Query Builder, where you can view the query results. For more information, see How to build XQL queries.
Cortex XSIAM Data Sources and Connectors
What are Cortex XSIAM data sources and connectors?
Data sources and connectors are the foundational mechanisms used to ingest security and operational data, including logs, events, and asset metadata, into Cortex XSIAM for analysis, correlation, and response. By consolidating data from diverse origins like endpoints, network devices, cloud environments, and third-party security tools, Cortex XSIAM constructs a comprehensive and contextualized security story.
Customer availability by tenant type
The ingestion methods and configuration options available to you in the UI depend on your tenant onboarding date:
- New tenants (onboarded after July 26, 2026): You will primarily interact with the strategic Connector experience. Standalone Marketplace integrations managed by Palo Alto Networks that have been consolidated into connectors are hidden from the catalog to ensure a unified configuration flow. Partner and community-contributed integrations remain available as standalone packs.
- Existing tenants (onboarded before July 26, 2026): You will continue to see both standalone Marketplace integrations and unified Connectors. Refer to the specific documentation for each vendor to determine the supported configuration method for your account.
Clarifying terminology: Data sources and connectors
In the Cortex XSIAM user interface (UI), configuring ingestion involves different areas and terminologies depending on the type of connection and your tenant onboarding date. While Cortex XSIAM is introducing connectors as a new, unified approach to ingestion, traditional data source methods remain supported.
In the current intermediate state, it is important to understand how these terms relate to each other:
- Data sources: Represents the traditional method for any integration that provides data to Cortex XSIAM. In this documentation, Data Source is used as the category for these ingestion methods, which include:
- Data collectors: Built-in tools primarily focused on raw log ingestion. This includes generic logs ingested via XDR Collectors and core ingestion functionalities found using the Data Source Onboarder.
- Broker VM applets: Specialized applications running on the Broker VM that function as collectors, such as the Syslog Collector.
-
Marketplace (integrations): Content packs that include collection integrations. These are often referred to as data sources in the UI, as integrations that fetch data are configured through the Data Source Onboarder on the Data Sources & Integrations page.
Note
This implementation is primarily available to existing customers; new customers (onboarded after July 26, 2026) will use the new Connectors framework for Palo Alto Networks managed integrations (see Customer availability by tenant type above). Partner and community-contributed integrations remain available via the Marketplace.
- Connectors: The new, unified mechanism for data ingestion. For supported vendors, a Connector groups multiple security capabilities, such as logs, automation, and posture into a single, uniquely named entry with a guided configuration wizard.
While specific components like Data Collectors, Broker VM applets, and Connectors are named explicitly when discussing their unique configuration workflows, they all fall under the foundational goal of ingesting data into Cortex XSIAM.
Why are different data sources and connectors necessary?
Cortex XSIAM enables you to collect data across a vast and varied enterprise landscape. This necessitates distinct data source types and connectors designed for different environments and needs:
- Connectors: Streamline the onboarding of third-party services by grouping multiple capabilities, such as log collection, automation, posture management, into a single, uniquely named entry with a guided configuration wizard. This unified approach represents the strategic method for all new vendor integrations.
- Standard data collectors (API/Built-in): These are built-in functionalities primarily focused on ingesting raw logs and security events for core security analysis, parsing, and normalization. They often involve direct API connections, such as Okta and CrowdStrike, or file collection tools, such as Amazon S3.
- Broker VM data collector applets: These are modular applications installed on a local Broker VM virtual appliance, designed for on-premise data collection needs like the Syslog Collector or Database Collector.
- XDR Collectors (XDRC): These are lightweight agents dedicated to on-premise log collection on Windows and Linux host machines, typically gathering logs and events using tools such as Filebeat or Winlogbeat.
- Cloud Service Provider (CSP) Onboarding: These are specialized wizards for integrating cloud environments, such as AWS, Azure, GCP, and OCI, enabling streamlined setup for asset discovery, posture/runtime security, and log collection.
-
Marketplace content packs: These packages offer specialized security functionality by bundling both a collection integration (for data ingestion) and automation components, such as playbooks and correlation rules.
Note
Standalone Marketplace integrations managed by Palo Alto Networks are primarily used by existing customers (onboarded before July 26, 2026). New customers will find these integrations consolidated within the new Connector framework, while partner and community integrations continue to be available as standalone Marketplace content packs.
- Palo Alto Networks Integrations: Cortex XSIAM provides both standard data sources and new unified connectors for Palo Alto Networks products to ensure deep telemetry ingestion and seamless cross-platform orchestration.
- Cloud Posture and Runtime Security data sources: These data sources provide agentless visibility and real-time control over cloud risks by using cloud-native APIs to monitor misconfigurations, scan container registries, and secure serverless functions or sensitive data across multi-cloud environments.
Current UI and future direction
Cortex XSIAM is transitioning toward a unified ingestion experience. While Cortex XSIAM is moving toward a model where all data sources and integrations are unified into the Connector framework, different ingestion methods currently involve distinct configuration workflows and locations in the UI.
The following table summarizes the different ingestion methods and where to manage them:
| Ingestion Method | Primary UI Location(s) for Configuration | Key Components |
|---|---|---|
| Connectors | Data Sources & Integrations page (Settings → Data Sources & Integrations → + Add New) | Unified wizard for multi-capability vendor integrations. |
| Standard data collectors | Data Sources & Integrations page (Settings → Data Sources & Integrations → + Add New) | Built-in functionalities primarily focused on ingesting raw logs and security events, such as Okta and Amazon S3. |
| Broker VM applets | Broker VMs page (Settings → Configurations → Data Broker → Broker VMs) | Specialized applications running on a Broker VM, such as Syslog Collector. |
| XDR Collectors | XDR Collectors page (Settings → Configurations → XDR Collectors) | Management of XDR Collectors dedicated for on-premise data collection on Windows and Linux machines. |
| CSP onboarding | Data Sources & Integrations page (Settings → Data Sources & Integrations → + Add New) | Specialized wizards for integrating cloud environments, such as AWS, Azure, and GCP. |
| Marketplace content packs | <p>Data Sources & Integrations page (Settings → Data Sources & Integrations via Data Source Onboarder, for packs with data ingestion or after a Marketplace install)</p><div data-gb-custom-block data-tag="hint" data-style="info" class="hint hint-info"><p>Note</p><p>Some content packs provide parsing rules and data model rules for data sources ingested using a Syslog Collector applet of the Broker VM or for standard data sources, and won't be listed in the Data Sources & Integrations page.</p></div> | <p>Discovery and installation of integration-specific content packs.</p><div data-gb-custom-block data-tag="hint" data-style="info" class="hint hint-info"><p>Note</p><p>For new tenants from July 26, 2026, services consolidated into connectors are managed via the Data Sources & Integrations page.</p></div> |
| Cloud Posture and Runtime Security data sources | <ul><li>Data Sources & Integrations page (Settings → Data Sources & Integrations → + Add New)</li><li>Broker VMs page (Settings → Configurations → Data Broker → Broker VMs)</li></ul> | Direct API ingestion or Broker VM applets for monitoring misconfigurations and securing cloud workloads. |
What is the data source and connector catalog?
The complete data source catalog is a conceptual grouping that is comprised of all configuration points available for data ingestion across Cortex XSIAM. It represents the aggregate of every integration method, from unified vendor connectors and cloud onboarding wizards to generic on-premise collectors and specialized Marketplace integrations.
The catalog is best understood by categorizing ingestion methods into the following core groups. By consulting the specific documentation sections dedicated to each category as detailed below, you gain a complete overview of all available ingestion options that collectively form the data source and connector catalog.
Vendor-specific data sources and connectors
This section includes integrations for specific third-party security and IT products, such as Okta, Box, and Salesforce. These include:
- Connectors: The strategic, unified experience that allows you to manage all of a vendor's capabilities, such as log collection, automation, and posture, through a single configuration wizard.
- Standard data collectors: Traditional built-in API and file-based collection functionalities.
Access to specific connectors depends on your license and tenant onboarding date. For more information, see What are Cortex XSIAM Data Sources and Connectors?. Configured on the Data Sources & Integrations page.
Cloud Service Provider (CSP) onboarding
Cortex XSIAM provides specialized onboarding wizards for integrating major cloud environments, such as AWS, Azure, GCP, and OCI. These wizards enable streamlined setup for asset discovery, cloud posture/runtime security, and log collection across your cloud infrastructure. Configured on the Data Sources & Integrations page.
Generic on-premise data collectors
Flexible collectors for logs and data from local environments not tied to a specific vendor, including:
- Broker VM applets, such as Syslog Collector and Database Collector, configured using the Broker VMs page.
- XDR Collectors (XDRC) for on-host log collection, configured on the XDR Collectors page.
Marketplace content packs (integrations)
Packages that offer rich security content, often including a collection integration for data ingestion alongside automation components.
- New Tenants: For tenants onboarded after July 26, 2026, standalone Marketplace integrations managed by Palo Alto Networks that have been consolidated into unified connectors are hidden from the catalog. These integrations are managed as sub-capabilities within the relevant vendor connector on the Data Sources & Integrations page. Partner and community-contributed integrations remain visible and available as standalone packs in the Marketplace catalog.
- Existing Tenants: Continue to use Marketplace integrations for services not yet migrated to the connector framework for your account. These are installed from Settings → Configurations → Marketplace and configured using the Data Source Onboarder on the Data Sources & Integrations page.
Palo Alto Networks integrations
These integrations include both traditional data sources and new unified connectors to ensure deep telemetry ingestion and seamless cross-platform orchestration across the Palo Alto Networks security stack, such as Next-Generation Firewall and Prisma Access, configured on the Data Sources & Integrations page.
Cloud Posture and Runtime Security data sources
These data sources provide agentless visibility and real-time control over cloud risks by using cloud-native APIs to monitor misconfigurations and secure container environments. These data sources are configured:
- Using Broker VM applets, such as AppSec Transporter, configured using the Broker VMs page.
- On the Data Sources & Integrations page.
Vendor-specific data sources and connectors
Cortex XSIAM enables you to ingest data from a wide range of third-party vendors and security services. For many popular vendors, you can choose between distinct types of ingestion methods to fit your organizational needs:
- Connectors
- Standard data sources (also called data collectors)
- Cloud Service Provider (CSP) onboarding data sources
- Content pack integrations (Marketplace)
In some cases, the same vendor is available through multiple options. Check the available descriptions for each entry in both the user interface and documentation to decide which option is more suitable for your needs.
| Data Source Type | Primary Use | Configuration Method | Cortex XSIAM Features | Recommendation |
|---|---|---|---|---|
| Connector | Unified integration for all vendor capabilities. | Configured on the Data Sources & Integrations page using a unified wizard. | Includes data ingestion, parsing, normalization, plus built-in commands, automations, and posture management. | Recommended approach for all supported vendors. Choose this for a streamlined, multi-capability setup. |
| Standard data source (also called data collectors) | Ingesting raw logs and events. | Configured in the Data Sources & Integrations page using the Data Source Onboarder. | Limited to data ingestion, parsing, and normalization. | Choose this if you only need raw data ingestion for a service not yet covered by a unified connector. |
| Cloud Service Provider (CSP) onboarding data source | Ingesting cloud assets and infrastructure logs. | Configured in the Data Sources & Integrations page using the cloud service provider (CSP) onboarding wizard. | Facilitates seamless setup of CSP data, such as AWS, Azure, GCP, and OCI, with minimal user input. | Choose this for streamlined discovery and security posture management of your cloud environments. |
| Content pack integration (Marketplace) | Ingesting data and enabling rich security functionality. | <p>Configured via a content pack downloaded from Marketplace by either:</p><ul><li>Using the Data Source Onboarder on the Data Sources & Integrations page (if available)</li><li>Installing the content pack from Settings → Configurations → Marketplace, and then configuring the integration instance on the Data Sources & Integrations page.</li></ul> | Includes: Data ingestion, parsing, normalization, plus built-in commands and automations, such as playbooks, scripts, correlation rules, and data model rules. | <p>Primarily used for partner-managed, community-contributed, or Palo Alto Networks managed integrations that have not yet been consolidated into a unified connector.</p><p>Choose this option for any of the following reasons:</p><ul><li>You need to define automations.</li><li>You need to collect data that is not covered by a standard collector.</li><li>You need to install rules or automations relevant to integrations or data sources.</li></ul> |
Availability for new tenants
If your Cortex XSIAM tenant was onboarded after July 26, 2026, a strategic Connector experience is available for Palo Alto Networks managed integrations. Standalone Marketplace integrations that have been consolidated into unified connectors are hidden from Marketplace to ensure a simplified configuration flow. For these specific vendors, always use the uniquely named Connector to manage all supported sub-capabilities. Partner and community integrations remain available as standalone entries in Marketplace.
Third-party vendor list
Cortex XSIAM provides specific documentation for each vendor to help you choose and configure the right connection. To ensure you have a single, unified reference point, the vendors are listed in alphabetical order and includes every supported vendor, regardless of the data source group connector, such as the Broker VM or CSP Onboarding.
Keep in mind the following:
- Unique connector names: Each connector has its own unique name. Even if multiple connectors exist for a single vendor, they will be clearly labeled to distinguish their capabilities.
- Licensing requirements: Availability of specific connectors, capabilities, and sub-capabilities is determined by your tenant license. You will only see and be able to onboard services supported by your active license.
- Consolidated management: Regardless of whether you are using a traditional data source or a new unified connector, all active instances are managed from the Data Sources & Integrations page.
- Marketplace reference: This list identifies vendors that offer Palo Alto Networks managed connectors. It does not include every available Marketplace content pack, particularly partner-managed and community-contributed integrations, which are always managed as standalone packs. To view the complete list of all available integrations, see the Cortex Developer Docs for Marketplace. This site provides instructions for these integrations by selecting the <content pack> → Content → Integrations, and choosing the relevant steps for your implementation. You can always install these standalone integrations directly from Settings → Configurations → Marketplace or the Data Sources & Integrations page (if available).
- Requirement hand-off (new tenants): If your tenant was onboarded after July 26, 2026, the unified wizard handles all configuration steps. Yet, you must still refer to the Cortex Developer Docs for Marketplace for critical technical information not provided in the wizard, such as available fetched incidents data, commands, and other specific technical details related to the integration. Note that the Marketplace site may occasionally reference a different Cortex product, but the technical requirements remain applicable.
1Password
1Password
Important
This connector is only available for tenants that onboarded after July 26, 2026. For tenants that onboarded before this date, use Marketplace to access the standalone integration. For more information, see Marketplace.
This connector is available with any active Cortex XSIAM license.
1Password is a password manager used for storing and managing your account credentials, financial information, documents, and other sensitive data. This connector fetches events about actions performed by 1Password users within a specific account, access and modifications to items in shared vaults, and user sign-in attempts.
This connector includes the following sub-capabilities (Marketplace integrations link to PAN DEV for more information):
- OnePassword: Fetch events about actions performed by 1Password users within a specific account, access and modifications to items in shared vaults, and user sign-in attempts.
To configure this connector, follow the steps outlined in the configuration wizard.
Abnormal Security
Abnormal Security
Important
This connector is only available for tenants that onboarded after July 26, 2026. For tenants that onboarded before this date, use Marketplace to access the standalone integration. For more information, see Marketplace.
This connector is available with any active Cortex XSIAM license.
Abnormal Security provides comprehensive defense against the entire landscape of messaging threats, ranging from high-sophistication Vendor Email Compromise (VEC) and targeted spear-phishing to lower-priority graymail and unsolicited spam. Threat data is ingested via the Abnormal Security REST API, enabling continuous visibility into detected threats, remediation status, and attack metadata.
This connector includes the following sub-capabilities (Marketplace integrations link to PAN DEV for more information):
- Abnormal Security Event Collector: Abnormal Security Event Collector integration for XSIAM.
To configure this connector, follow the steps outlined in the configuration wizard.
Absolute
Absolute
Important
This connector is only available for tenants that onboarded after July 26, 2026. For tenants that onboarded before this date, use Marketplace to access the standalone integration. For more information, see Marketplace.
This connector is available with any active Cortex XSIAM or Cortex AgentiX license.
Absolute is an adaptive endpoint security solution that delivers device security, data security, and asset management of endpoints. Manage and secure your data, devices, and applications with an unbreakable connection to every endpoint, so your sensitive data remains protected even when accessed from outside your network.
This connector includes the following sub-capabilities (Marketplace integrations link to PAN DEV for more information):
- Absolute: Absolute is an adaptive endpoint security solution that delivers device security, data security, and asset management of endpoints.
To configure this connector, follow the steps outlined in the configuration wizard.
abuse.ch
abuse.ch
Important
This connector is only available for tenants that onboarded after July 26, 2026. For tenants that onboarded before this date, use Marketplace to access the standalone integration. For more information, see Marketplace.
This connector is available with any active Cortex XSIAM or Cortex AgentiX license.
abuse.ch is a set of community threat intelligence projects. Fetch and enrich indicators of compromise from URLhaus (malicious URLs used for malware distribution), Feodo Tracker (botnet C&C IP blocklists), MalwareBazaar (malware samples and file-hash intel), ThreatFox (IOCs associated with malware), and the SSL Blacklist (malicious SSL certificates and associated IP addresses).
This connector includes the following sub-capabilities (Marketplace integrations link to PAN DEV for more information):
- abuse.ch SSL Blacklist Feed:
- FeedURLhaus: Fetch url indicators for URLHaus.
- Feodo Tracker IP Blocklist Feed:
- MalwareBazaar: MalwareBazaar is a project from abuse.ch with the goal of sharing malware samples with the Infosec community, AV vendors, and threat intelligence providers.
- MalwareBazaar Feed: Use the MalwareBazaar Feed integration to get the list of malware samples added to MalwareBazaar within the last 60 minutes.
- ThreatFox Feed:
- URLhaus: URLhaus has the goal of sharing malicious URLs that are being used for malware distribution.
To configure this connector, follow the steps outlined in the configuration wizard.
AbuseIPDB
AbuseIPDB
Important
This connector is only available for tenants that onboarded after July 26, 2026. For tenants that onboarded before this date, use Marketplace to access the standalone integration. For more information, see Marketplace.
This connector is available with any active Cortex XSIAM, Cortex Cloud, Cortex Cloud Runtime Security, Cortex XDR, or Cortex AgentiX license.
Use the AbuseIPDB integration to report and identify IP addresses that have been associated with malicious activity online. Check, report, and get block lists of the top malicious IPs.
This connector includes the following sub-capabilities (Marketplace integrations link to PAN DEV for more information):
To configure this connector, follow the steps outlined in the configuration wizard.
Accenture
Accenture
Important
This connector is only available for tenants that onboarded after July 26, 2026. For tenants that onboarded before this date, use Marketplace to access the standalone integration. For more information, see Marketplace.
This connector is available with any active Cortex XSIAM or Cortex AgentiX license.
Use the Symantec Managed Security Services (Symantec MSS) integration to create issues from Symantec MSS alerts.
This connector includes the following sub-capabilities (Marketplace integrations link to PAN DEV for more information):
- Symantec MSS: Leverage the power of Symantec Managed Security Services for continual threat monitoring and customized guidance 24x7.
To configure this connector, follow the steps outlined in the configuration wizard.
AdminByRequest
AdminByRequest
Important
This connector is only available for tenants that onboarded after July 26, 2026. For tenants that onboarded before this date, use Marketplace to access the standalone integration. For more information, see Marketplace.
This connector is available with any active Cortex XSIAM or Cortex AgentiX license.
AdminByRequest is a Privileged Access Management (PAM) solution that enables secure, temporary elevation to local admin rights.
This connector includes the following sub-capabilities (Marketplace integrations link to PAN DEV for more information):
To configure this connector, follow the steps outlined in the configuration wizard.
Aha
Aha!
The capabilities and sub-capabilities listed for this connector are available with any active Cortex XSIAM or Cortex Cloud Posture Security license.
This connector includes the following capabilities and sub-capabilities (if applicable):
- Security Posture: Detect, monitor and alert on settings of your SaaS application.
- saas-posture-config-remediation: Help remediate the misconfigured security settings of your SaaS application.
Prerequisites
Complete the steps below on your Aha! instance to connect with Cortex.
Cortex connects to your Aha! instance using Okta SSO or Microsoft Azure credentials that you provide during the connection process. For this reason, your organization must be using Okta or Microsoft Azure as an identity provider. The Okta or Microsoft Azure account must be configured for multi-factor authentication (MFA) using one-time passcodes.\
\
Cortex logs in to Aha! instance using administrator account credentials. This account is used to scan your Aha! instance for misconfigured settings. If there are misconfigured settings, Cortex suggests a remediation action based on best practices.
To onboard your Aha! instance, complete the following actions:
-
Collect information for accessing your Aha! instance.
To access your Aha! instance, you will need the following information, which you will specify during the onboarding process:
- User email: The login email address of the account that SSPM will use to access your Aha! instance. Required Permissions: The user account must be assigned to both the Account and Billing administrator roles in Aha!.
- Password: The password for the login account.
- Instance Host: The custom domain for accessing your organization's Aha! account. You specify this domain when you sign up for an Aha! account, and it is included as part of the URL that you use to access the account.
If you're logging in through Okta, you must provide SaaS Security with the following additional information:
- Okta subdomain: The Okta subdomain for your organization. The subdomain was included in the login URL that Okta assigned to your organization.
- Okta 2FA secret: A key that is used to generate one-time passcodes for MFA.
If you're using Azure Active Directory (AD) as your identity provider, you must provide Cortex with the following additional information:
- Azure 2FA secret: A key that is used to generate one-time passcodes for MFA.
As you complete the following steps, make note of the values of the items described in the preceding sections. You will need to enter these values during onboarding to access your Aha.io instance from SaaS Security.
- Identify the Okta user account that SaaS Security will use to access your Aha! instance. The user account must be assigned to both the Account and Billing administrator roles in Aha.io.
- Get a secret key for MFA. The steps you follow to get the MFA secret key differ depending on the identity provider you're using to access the account.
- To access the account through Okta:
- Identify your Okta subdomain.
- Generate and copy an MFA secret key.
- To access the account through Microsoft Azure:
- Enable third-party software OATH tokens for the administrator account.
- Configure the account for MFA and copy the MFA secret key.
- Make note of your organization's Aha.io instance host name.
- To access the account through Okta:
After you log in to Aha!, the instance host name is a unique subdomain included in the Aha! URL. The URL format is <instance_host>.aha.io.
Configure Aha!
Once you have setup your Aha! instance, follow the steps outlined in the Cortex Aha! data connector configuration wizard to complete the connection process. Provide the Tenant ID, Client ID, and Client Secret, of your Aha! instance, under the Connections step when prompted.
Aha
Important
This connector is only available for tenants that onboarded after July 26, 2026. For tenants that onboarded before this date, use Marketplace to access the standalone integration. For more information, see Marketplace.
This connector is available with any active Cortex XSIAM or Cortex AgentiX license.
Aha! provides products for organizations to set strategy, ideate, plan, showcase, build, and launch new products and enhancements.
This connector includes the following sub-capabilities (Marketplace integrations link to PAN DEV for more information):
- Aha: Use the Aha! integration to list and manage Cortex XSIAM features from Aha.
To configure this connector, follow the steps outlined in the configuration wizard.
AIOps
AIOps
Important
This connector is only available for tenants that onboarded after July 26, 2026. For tenants that onboarded before this date, use Marketplace to access the standalone integration. For more information, see Marketplace.
This connector is available with any active Cortex XSIAM, Cortex Cloud, Cortex Cloud Runtime Security, Cortex XDR, or Cortex AgentiX license.
The Palo Alto Networks Best Practice Assessment (BPA) measures your usage of Next-Generation Firewall (NGFW) and Panorama security management capabilities across your deployment, enabling you to make adjustments that maximize your return on investment and strengthen security. This connector enables you to programmatically generate BPA data for both the free and premium instances of AIOps for NGFW.
This connector includes the following sub-capabilities (Marketplace integrations link to PAN DEV for more information):
- Palo Alto Networks AIOps: Palo Alto Networks Best Practice Assessment (BPA) analyzes NGFW and Panorama configurations and compares them to the best practices.
To configure this connector, follow the steps outlined in the configuration wizard.
Akamai
Akamai
Important
This connector is only available for tenants that onboarded after July 26, 2026. For tenants that onboarded before this date, use Marketplace to access the standalone integration. For more information, see Marketplace.
This connector is available with any active Cortex XSIAM or Cortex AgentiX license.
Integrate with Akamai Technologies products. Akamai's security solutions provide protection for your websites, applications, APIs, and users. Manage network lists for Akamai security products such as Kona Site Defender, Web App Protector, and Bot Manager; collect security events from the Akamai Web Application Firewall (WAF); and use Akamai GuardiCore for micro-segmentation and Zero Trust protection across hybrid cloud and data center infrastructure.
This connector includes the following sub-capabilities (Marketplace integrations link to PAN DEV for more information):
- Akamai WAF: Use the Akamai WAF integration to manage common sets of lists used by various Akamai security products and features. This is the modified version where a new command "akamai-update-network-list-elements" was added by the SA.
- Akamai WAF SIEM:
- GuardiCore v2: The GuardiCore v2 integration provides access to incident and endpoint (asset) information via the GuardiCore API.
To configure this connector, follow the steps outlined in the configuration wizard.
AlgoSec
AlgoSec
Important
This connector is only available for tenants that onboarded after July 26, 2026. For tenants that onboarded before this date, use Marketplace to access the standalone integration. For more information, see Marketplace.
This connector is available with any active Cortex XSIAM or Cortex AgentiX license.
AlgoSec AppViz, Firewall Analyzer (AFA), and FireFlow (AFF).
This connector includes the following sub-capabilities (Marketplace integrations link to PAN DEV for more information):
- AlgoSec: Algosec AppViz, Firewall Analyzer (AFA) and FireFlow(AFF).
To configure this connector, follow the steps outlined in the configuration wizard.
Alibaba Cloud
Alibaba Cloud
Important
This connector is only available for tenants that onboarded after July 26, 2026. For tenants that onboarded before this date, use Marketplace to access the standalone integration. For more information, see Marketplace.
This connector is available with any active Cortex XSIAM license.
Alibaba log event collector integration for XSIAM. This integration was integrated and tested with API version 0.6 of Alicloud Log Service.
This connector includes the following sub-capabilities (Marketplace integrations link to PAN DEV for more information):
- Alibaba Action Trail Event Collector: Alibaba logs event collector integration for XSIAM.
To configure this connector, follow the steps outlined in the configuration wizard.
AlienVault
AlienVault
Important
This connector is only available for tenants that onboarded after July 26, 2026. For tenants that onboarded before this date, use Marketplace to access the standalone integration. For more information, see Marketplace.
This connector is available with any active Cortex XSIAM or Cortex AgentiX license.
Integrate with AlienVault to fetch threat intelligence indicators, query Indicators of Compromise in AlienVault OTX, and search and monitor alarms and events from AlienVault USM Anywhere. Includes the AlienVault OTX TAXII feed and the open-source AlienVault Reputation Data feed.
This connector includes the following sub-capabilities (Marketplace integrations link to PAN DEV for more information):
- AlienVault OTX TAXII Feed:
- AlienVault OTX v2: Query Indicators of Compromise in AlienVault OTX.
- AlienVault Reputation Feed:
- AlienVault USM Anywhere: Searches for and monitors alarms and events from AlienVault USM Anywhere.
To configure this connector, follow the steps outlined in the configuration wizard.
Amazon
Here are the articles in this section:
Amazon Cloud Watch
You can configure collecting Amazon CloudWatch logs and data using a standard data source, content pack integration (onboarded prior to July 26, 2026), or connector (onboarded after July 26, 2026):
| Collection Method | Description |
|---|---|
| Standard data source overview | Forward generic and Elastic Kubernetes Service (EKS) logs to Cortex XSIAM from Amazon CloudWatch using the Amazon CloudWatch data source. |
| Link to standard data source instructions | <p>The following types of data can be ingested from Amazon CloudWatch:</p><ul><li>Generic logs of the raw data or in a JSON format from Amazon Kinesis Firehose</li><li>EKS logs are automatically ingested in a JSON format from Amazon Kinesis Firehose</li></ul><p>For more information, see Ingest logs from Amazon CloudWatch.</p> |
| Links to content pack/integration details (onboarded prior to July 26, 2026) | <p>The AWS - CloudWatchLogs content pack facilitates interaction with the Amazon Web Services CloudWatch Logs service. It contains the following integration:</p><ul><li>AWS - CloudWatchLogs: Use this integration to monitor, store, and access your log files from AWS Elastic Compute Cloud (Amazon EC2) instances, AWS CloudTrail, AWS Route 53, and other sources. You can then retrieve the associated log data from CloudWatch Logs. It contains commands for managing log streams and log groups, including creating, deleting, filtering, and describing log streams and log groups.</li></ul><p>For detailed instructions about setting up authentication, see AWS Integrations - Authentication.</p> |
| Link to connector (onboarded after July 26, 2026) | AWS Automation and Collection |
Ingest logs from Amazon CloudWatch
You can forward generic and Elastic Kubernetes Service (EKS) logs to Cortex XSIAM from Amazon CloudWatch. When forwarding EKS logs, the following log types are included:
- API Server: Logs pertaining to API requests to the cluster.
- Audit: Logs pertaining to cluster access via the Kubernetes API.
- Authenticator: Logs pertaining to authentication requests into the cluster.
- Scheduler: Logs pertaining to scheduling decisions.
- Controller Manager: Logs pertaining to the state of cluster controllers.
You can ingest generic logs of the raw data or in a JSON format from Amazon Kinesis Firehose. EKS logs are automatically ingested in a JSON format from Amazon Kinesis Firehose. To enable log forwarding, you set up Amazon Kinesis Firehose and then add that to your Amazon CloudWatch configuration. After you complete the set up process, logs from the respective service are then searchable in Cortex XSIAM to provide additional information and context to your investigations.
As soon as Cortex XSIAM begins receiving logs, the application automatically creates one of the following Cortex Query Language (XQL) datasets depending on the type of logs you've configured:
- Generic:
<Vendor>_<Product>_raw - EKS:
amazon_eks_raw
These datasets enable you to search the logs in XQL Search. For example, queries refer to the in-app XQL Library. For enhanced cloud protection, you can also configure Cortex XSIAM to normalize EKS audit logs, which you can query with XQL Search using the cloud_audit_logs dataset. Cortex XSIAM can also generate Cortex XSIAM issues (Analytics, IOC, BIOC, and Correlation Rules) when relevant from AWS logs. While Correlation Rules issues are generated on non-normalized and normalized logs, Analytics, IOC, and BIOC issues are only generated on normalized logs.
Enhanced cloud protection provides the following:
- Normalization of cloud logs
- Cloud logs stitching
- Enrichment with cloud data
- Detection based on cloud analytics
- Cloud-tailored investigations
To set up Amazon CloudWatch integration, you require certain permissions in AWS. You need a role that enables access to configuring Amazon Kinesis Firehose.
- Set up the Amazon CloudWatch integration in Cortex XSIAM.
- Navigate to Settings → Data Sources & Integrations.
- On the Data Sources & Integrations page, click + Add New, search for Amazon CloudWatch, then hover over it and click Add.
- Specify a descriptive Name for your log collection configuration.
- Select the Log Type as one of the following, where your selection changes the options displayed:
- Generic: When selecting this log type, you can configure the following settings:
- Log Format: Choose the format of the data input source (CloudWatch) that you'll export to Cortex XSIAM , either JSON or Raw.
-
Specify the Vendor and Product for the type of generic logs you are ingesting.
The vendor and product are used to define the name of your XQL dataset (
<Vendor>_<Product>_raw). If you do not define a vendor or product, Cortex XSIAM uses the default values of Amazon and AWS with the resulting dataset name asamazon_aws_raw. To uniquely identify the log source, consider changing the values.
- EKS: When selecting this log type, the following options are displayed:
- The Vendor is automatically set to Amazon and Product to EKS , and is non-configurable. This means that all data for the EKS logs, whether it's normalized or not, can be queried in XQL Search using the
amazon_eks_rawdataset. - (Optional) You can decide whether to Normalize and enrich audit logs as part of the enhanced cloud protection by selecting the checkbox (default). If selected, Cortex XSIAM is configured to normalize EKS audit logs, which you can query with XQL Search using the
cloud_audit_logsdataset.
- The Vendor is automatically set to Amazon and Product to EKS , and is non-configurable. This means that all data for the EKS logs, whether it's normalized or not, can be queried in XQL Search using the
- Generic: When selecting this log type, you can configure the following settings:
-
Save & Generate Token.
Click the copy icon next to the key and record it somewhere safe. You will need to provide this key when you set up output settings in AWS Kinesis Firehose. If you forget to record the key and close the window you will need to generate a new key and repeat this process.
- Click Done to close the window.
- Create a Kinesis Data Firehose delivery stream to your chosen destination.
- Log in to the AWS Management Console, and open the Kinesis console.
-
Select Data Firehose → Create delivery stream.
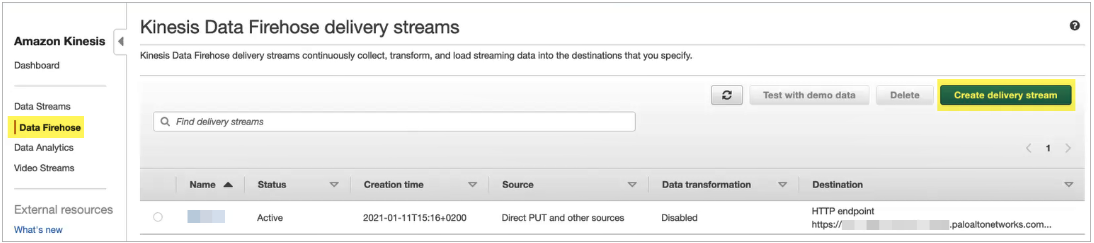
-
Define the name and source for your stream.
- Delivery stream name: Enter a descriptive name for your stream configuration.
- Source: Select Direct PUT or other sources.
- Server-side encryption for source records in the delivery stream: Ensure this option is disabled.
Click Next to proceed to the process record configuration.
-
Define the process records.
- Transform source records with AWS Lambda: Set the Data Transformation as Disabled.
- Convert record format: Set Record format conversion as Disabled.
Click Next to proceed to the destination configuration.
-
Choose a destination for the logs.
Choose HTTP Endpoint as the destination and configure the HTTP endpoint configuration settings:
- HTTP endpoint name: Specify the name you used to identify your AWS log collection configuration in Cortex XSIAM.
- HTTP endpoint URL: Copy the API URL associated with your log collection from the Cortex XSIAM management console. The URL will include your tenant name (
https://api-<tenant external URL>/logs/v1/aws). - Access key: Paste in the token key you recorded earlier during the configuration of your Cortex XSIAM log collection settings.
- Content encoding: Select GZIP. Disabling content encoding may result in high egress costs.
- Retry duration: Enter 300 seconds.
- S3 bucket: Set the S3 backup mode as Failed data only. For the S3 bucket, we recommend that you create a dedicated bucket for Cortex XSIAM integration.
Click Next to proceed to the settings configuration.
-
Configure additional settings.
- HTTP endpoint buffer conditions: Set the Buffer size as 1 MiB and the Buffer interval as 60 seconds.
- S3 buffer conditions: Use the default settings for Buffer size as 5 MiB and Buffer interval as 300 seconds unless you have alternative sizing preferences.
- S3 compression and encryption: Choose your desired compression and encryption settings.
- Error logging: Select Enabled.
- Permissions: Create or update IAM role option.
Select Next.
-
Review your configuration and Create delivery stream.
When your delivery stream is ready, the status changes from Creating to Active.
-
To begin forwarding logs, add the Kinesis Firehose instance to your Amazon CloudWatch configuration.
To do this, add a subscription filter for Amazon Kinesis Firehose.
-
Verify the status of the integration.
Return to the Integrations page and view the statistics for the log collection configuration.
- After Cortex XSIAM begins receiving logs from your Amazon services, you can use the XQL Search to search for logs in the new dataset.
Amazon S3
You can configure collecting Amazon S3 logs using a standard using a standard data source, content pack integration (onboarded prior to July 26, 2026), or connector (onboarded after July 26, 2026):
| Collection Method | Description |
|---|---|
| Standard data source overview | Forward different types of logs to Cortex XSIAM from Amazon Simple Storage Service (Amazon S3) using the Amazon S3 data source. |
| Links to standard data source instructions | <p>The following types of logs can be ingested from Amazon S3:</p><ul><li>Audit logs: See Ingest audit logs from AWS Cloud Trail</li><li>Flow logs: See Ingest network flow logs from Amazon S3</li><li><p>Generic logs: See Ingest generic logs from Amazon S3</p><ul><li>BeyondTust Privilege Management Cloud logs: See BeyondTrust Privilege Management Cloud</li></ul></li><li>Route 53 logs: See Ingest network Route 53 logs from Amazon S3</li></ul><p>Configuring these types of Amazon S3 logs can include following these instructions:</p><ul><li>Create an assumed role</li><li>Configure data collection from Amazon S3 manually</li></ul> |
| Links to content pack/integration details (onboarded prior to July 26, 2026) | <ul><li><p>The AWS - S3 content pack provides integration with the Amazon Web Services Simple Storage Service (S3) for management, security controls, and visibility of stored objects. It includes the following integration:</p><ul><li>AWS - S3: Use this integration to manage Amazon Web Services Simple Storage Service (S3) objects and security configurations, including listing contents, setting encryption, and blocking public access. Commands are included for fetching bucket encryption status (aws-s3-get-bucket-encryption), controlling public access settings (aws-s3-put-public-access-block, aws-s3-get-public-access-block), and listing objects within a bucket, with support for pagination, delimiters, and prefixes (aws-s3-list-objects), alongside core support for authentication using AWS STS session tokens.</li></ul></li><li><p>The AWS - Route53 content pack provides an interface to manage the Amazon Web Services managed Cloud DNS service. It includes the following integration:</p><ul><li>AWS - Route53: Use this integration to manage the Amazon Web Services managed Cloud DNS service. Commands included allow users to list resource record sets, address issues such as when a set is missing its TTL value, and manage configurations related to AWS authentication like STS endpoint resolution logic.</li></ul></li><li><p>The AWS - CloudTrail content pack provides functionality for interacting with an AWS CloudTrail trail via automation and includes rules for parsing and modeling ingested audit logs. It also includes the following integration:</p><ul><li>AWS - CloudTrail: Use this integration to interact with a CloudTrail trail on AWS via playbooks and the Playground. It includes commands that enable retrieving information about the trail status using aws-cloudtrail-get-trail-status, and manage authentication configurations like specifying the AWS STS endpoint resolution logic.</li></ul></li></ul> |
| Link to connector (onboarded after July 26, 2026) | AWS Automation and Collection |
Ingest audit logs from AWS CloudTrail
You can forward audit logs for the relative service to Cortex XSIAM from AWS CloudTrail.
To receive audit logs from Amazon Simple Storage Service (Amazon S3) via AWS CloudTrail, you must first configure data collection from Amazon S3. You can then configure the Data Sources & Integrations settings in Cortex XSIAM for Amazon S3. After you set up collection integration, Cortex XSIAM begins receiving new logs and data from the source.
Note
For more information on configuring data collection from Amazon S3 using AWS CloudTrail, see the AWS CloudTrail Documentation.
When Cortex XSIAM begins receiving logs, the app automatically creates an Amazon S3 Cortex Query Language (XQL) dataset (aws_s3_raw). This enables you to search the logs with XQL Search using the dataset. For example queries, refer to the in-app XQL Library.
For enhanced cloud protection, you can also configure Cortex XSIAM to stitch Amazon S3 audit logs with other Cortex XSIAM authentication stories across all cloud providers using the same format, which you can query with XQL Search using the cloud_audit_logs dataset. Cortex XSIAM can also generate Cortex XSIAM issues (Analytics, IOC, BIOC, and Correlation Rules), when relevant, from Amazon S3 logs. While Correlation Rules issues are generated on non-normalized and normalized logs, Analytics, IOC, and BIOC issues are only generated on normalized logs.
Enhanced cloud protection provides the following:
- Normalization of cloud logs
- Cloud logs stitching
- Enrichment with cloud data
- Detection based on cloud analytics
- Cloud-tailored investigations
Prerequisite Steps
Be sure you do the following tasks before you begin configuring data collection from Amazon S3 via AWS CloudTrail.
- Ensure that you have the proper permissions to access AWS CloudTrail and have the necessary permissions to create audit logs. The following permissions in AWS are the minimum requirements for an Amazon S3 bucket and Amazon Simple Queue Service (SQS).
- Amazon S3 bucket:
GetObject - SQS:
ChangeMessageVisibility,ReceiveMessage, GetQueueAttributes, andDeleteMessage.
- Amazon S3 bucket:
- Determine how you want to provide access to Cortex XSIAM to your logs and to perform API operations. You have the following options:
- Use Workload Federated Identity to allow Cortex XSIAM's dedicated log collector service account to assume an IAM role in your AWS environment without storing any long-lived credentials. This is the Workload Federated Identity option described in the Amazon S3 collection configuration. This is the recommended option when your log collector is deployed as a Cortex-managed cloud service.
- Designate an AWS IAM user, where you will need to know the Account ID for the user and have the relevant permissions to create an access key/id for the relevant IAM user. This is the default option as explained in Configure the Amazon S3 collection by selecting Access Key.
- Create an assumed role in AWS to delegate permissions to a Cortex XSIAM AWS service. This role grants Cortex XSIAM access to your flow logs. For more information, see Creating a role to delegate permissions to an AWS service. This is the Assumed Role option described in the Amazon S3 collection configuration. To collect Amazon S3 logs that use server-side encryption (SSE), the user role must have an IAM policy that states that Cortex XSIAM has kms:Decrypt permissions. With this permission, Amazon S3 automatically detects if a bucket is encrypted and decrypts it. If you want to collect encrypted logs from different accounts, you must have the decrypt permissions for the user role also in the key policy for the master account Key Management Service (KMS). For more information, see Allowing users in other accounts to use a KMS key.
- If using Workload Federated Identity, ensure you have permissions to create an AWS IAM Identity Provider and an IAM role with a trust policy in your AWS account. You will need the Cortex XSIAM service account identifier (provided in the Cortex XSIAM UI after saving the configuration) to configure the trust relationship.
To configure Cortex XSIAM to receive audit logs from Amazon S3 via AWS Cloudtrail:
- Log in to the AWS Management Console.
- From the menu bar, ensure that you have selected the correct region for your configuration.
-
Configure an AWS CloudTrail trail with audit logs.
Note
- For more information on creating an AWS CloudTrail trail, see Create a trail.
- If you already have an Amazon S3 bucket configured with AWS CloudTrail audit logs, skip this step and go to Configure an Amazon Simple Queue Service (SQS).
- Open the CloudTrail Console, and click Create trail.
-
Configure the following settings for your CloudTrail trail, where the default settings should be configured unless otherwise indicated.
- Trail name: Specify a descriptive name for your CloudTrail trail.
-
Storage location: Select Create new S3 bucket to configure a new Amazon S3 bucket, and specify a unique name in the Trail log bucket and folder field, or select Use existing S3 bucket and Browse to the S3 bucket you already created. If you select an existing Amazon S3 bucket, the bucket policy must grant CloudTrail permission to write to it. For information about manually editing the bucket policy, see Amazon S3 Bucket Policy for CloudTrail.
Note
It is your organization's responsibility to define a retention policy for your Amazon S3 bucket by creating a Lifecycle rule in the Management tab. We recommend setting the retention policy to at least 7 days to ensure that the data is retrieved under all circumstances.
- Customer managed AWS KMS key: You can either select a New key and specify the AWS KMS alias, or select an Existing key, and select the AWS KMS alias. The KMS key and S3 bucket must be in the same region.
- SNS notification delivery: (Optional) If you want to be notified whenever CloudTrail publishes a new log to your Amazon S3 bucket, click Enabled. Amazon Simple Notification Service (Amazon SNS) manages these notifications, which are sent for every log file delivery to your S3 bucket, as opposed to every event. When you enable this option, you can either Create a new SNS topic by selecting New and the SNS topic is displayed in the field, or use an Existing topic and select the SNS topic. For more information, see Configure SNS Notifications for CloudTrail.
Note
The CloudWatch Logs - optional settings are not supported and should be left disabled.
- Click Next, and configure the following Choose log events settings.
- Event type: Leave the default Management events checkbox selected to capture audit logs. Depending on your system requirements, you can also select Data events to log the resource operations performed on or within a resource, or Insights events to identify unusual activity, errors, or user behavior in your account. Based on your selection, additional fields are displayed on the screen to configure under section headings with the same name as the event type.
-
Management events section: Configure the following settings.
-API activity: For Management events, select the API activities you want to log. By default, the Read and Write activities are logged.
-Exclude AWS KMS events: (Optional) If you want to filter AWS Key Management Service (AWS KMS) events out of your trail, select the checkbox. By default, all AWS KMS events are included.
- Data events section: (Optional) This section is displayed when you configure the Event type to include Data events, which relate to resource operations performed on or within a resource, such as reading and writing to a S3 bucket. For more information on configuring these optional settings in AWS CloudTrail, see Creating a trail.
- Insights events section: (Optional) This section is displayed when you configure the Event type to include Insight events, which relate to unusual activities, errors, or user behavior on your account. For more information on configuring these optional settings in AWS CloudTrail, see Creating a trail.
- Click Next.
-
In the Review and create page, look over the trail configurations settings that you have configured and if they are correct, click Create trail. If you need to make a change, click Edit beside the particular step that you want to update.
The new trail is listed in the Trails page, which lists the trails in your account from all Regions. It can take up to 15 minutes for CloudTrail to begin publishing log files. You can see the log files in the S3 bucket that you specified. For more information, see Creating a trail.
-
Configure an Amazon Simple Queue Service (SQS).
Note
Ensure that you create your Amazon S3 bucket and Amazon SQS queue in the same region.
- In the Amazon SQS Console, click Create Queue.
- Configure the following settings, where the default settings should be configured unless otherwise indicated.
- Type: Select Standard queue (default).
- Name: Specify a descriptive name for your SQS queue.
- Configuration section: Leave the default settings for the various fields.
-
Access policy → Choose method: Select Advanced and update the Access policy code in the editor window to enable your Amazon S3 bucket to publish event notification messages to your SQS queue. Use this sample code as a guide for defining the
“Statement”with the following definitions:-
“Resource”: Leave the automatically generated ARN for the SQS queue that is set in the code, which uses the format“arn:sqs:region:account-id:queue-name”.You can retrieve your bucket’s ARN by opening the Amazon S3 Console in a browser window. In the Buckets section, select the bucket that you created for collecting the AWS CloudTrail logs, click Copy ARN, and paste the ARN in the field.
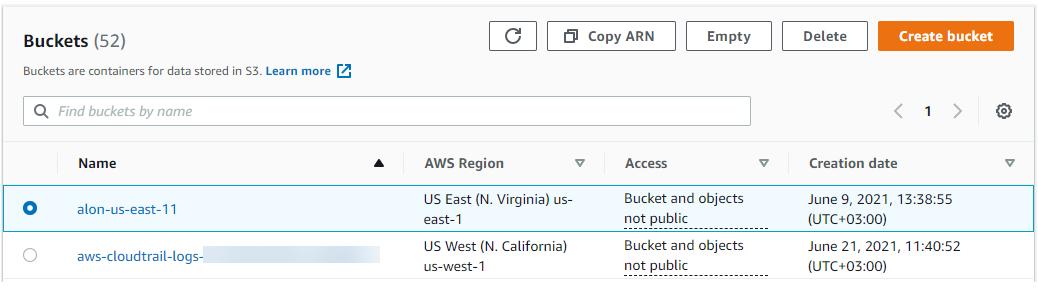
Note
For more information on granting permissions to publish messages to an SQS queue, see Granting permissions to publish event notification messages to a destination.
{ "Version": "2012-10-17", "Statement": [ { "Effect": "Allow", "Principal": { "Service": "s3.amazonaws.com" }, "Action": "SQS:SendMessage", "Resource": "[Leave automatically generated ARN for the SQS queue defined by AWS]", "Condition": { "ArnLike": { "aws:SourceArn": "[ARN of your Amazon S3 bucket]" } } }, ] }
- Dead-letter queue section: We recommend that you configure a queue for sending undeliverable messages by selecting Enabled, and then in the Choose queue field selecting the queue to send the messages. You may need to create a new queue for this, if you do not already have one set up. For more information, see Amazon SQS dead-letter queues.
-
Click Create queue.
Once the SQS is created, a message indicating that the queue was successfully configured is displayed at the top of the page.
- Configure an event notification to your Amazon SQS whenever a file is written to your Amazon S3 bucket.
- Open the Amazon S3 Console and in the Properties tab of your Amazon S3 bucket, scroll down to the Event notifications section, and click Create event notification.
- Configure the following settings.
- Event name: Specify a descriptive name for your event notification containing up to 255 characters.
- Prefix: Do not set a prefix as the Amazon S3 bucket is meant to be a dedicated bucket for collecting audit logs.
- Event types: Select All object create events for the type of event notifications that you want to receive.
- Destination: Select SQS queue to send notifications to an SQS queue to be read by a server.
-
Specify SQS queue: You can either select Choose from your SQS queues and then select the SQS queue, or select Enter SQS queue ARN and specify the ARN in the SQS queue field.
You can retrieve your SQS queue ARN by opening another instance of the AWS Management Console in a browser window, and opening the Amazon SQS Console, and selecting the Amazon SQS that you created. In the Details section, under ARN, click the copy icon (), and paste the ARN in the field.
-
Click Save changes.
Once the event notification is created, a message indicating that the event notification was successfully created is displayed at the top of the page.
Note
If your receive an error when trying to save your changes, you should ensure that the permissions are set up correctly.
-
Configure access keys for the AWS IAM user that Cortex XSIAM uses for API operations.
Note
- It your organization's responsibility to ensure that the user who performs this task of creating the access key is designated with the relevant permissions. Otherwise, this can cause the process to fail with errors.
- Skip this step if you are using an Assumed Role or Workload Federated Identity for Cortex XSIAM.
- Open the AWS IAM Console, and in the navigation pane, select Access management → Users.
- Select the User name of the AWS IAM user.
- Select the Security credentials tab, scroll down to the Access keys section, and click Create access key.
-
Click the copy icon next to the Access key ID and Secret access key keys, where you must click Show secret access key to see the secret key and record them somewhere safe before closing the window. You will need to provide these keys when you edit the Access policy of the SQS queue and when setting the AWS Client ID and AWS Client Secret in Cortex XSIAM. If you forget to record the keys and close the window, you will need to generate new keys and repeat this process.
Note
For more information, see Managing access keys for IAM users.
-
Update the Access policy of your Amazon SQS queue.
Skip this step if you are using an Assumed Role or Workload Federated Identity for Cortex XSIAM.
- In the Amazon SQS Console, select the SQS queue that you created in Configure an Amazon Simple Queue Service (SQS).
- Select the Access policy tab, and Edit the Access policy code in the editor window to enable the IAM user to perform operations on the Amazon SQS with permissions to
SQS:ChangeMessageVisibility,SQS:DeleteMessage,SQS:ReceiveMessage, andSQS:GetQueueAttributes. Use this sample code as a guide for defining the“Sid”: “__receiver_statement”with the following definitions:“aws:SourceArn”: Specify the ARN of the AWS IAM user. You can retrieve the User ARN from the Security credentials tab, which you accessed when configuring access keys for the AWS API user.-
“Resource”: Leave the automatically generated ARN for the SQS queue that is set in the code, which uses the format“arn:sqs:region:account-id:queue-name”.Note
For more information on granting permissions to publish messages to an SQS queue, see Granting permissions to publish event notification messages to a destination.
{ "Version": "2012-10-17", "Statement": [ { "Effect": "Allow", "Principal": { "Service": "s3.amazonaws.com" }, "Action": "SQS:SendMessage", "Resource": "[Leave automatically generated ARN for the SQS queue defined by AWS]", "Condition": { "ArnLike": { "aws:SourceArn": "[ARN of your Amazon S3 bucket]" } } }, { "Sid": "__receiver_statement", "Effect": "Allow", "Principal": { "AWS": "[Add the ARN for the AWS IAM user]" }, "Action": [ "SQS:ChangeMessageVisibility", "SQS:DeleteMessage", "SQS:ReceiveMessage", "sqs:GetQueueAttributes" ], "Resource": "[Leave automatically generated ARN for the SQS queue defined by AWS]" } ] }
- Configure the Amazon S3 collection in Cortex XSIAM.
- Navigate to Settings → Data Sources & Integrations.
- On the Data Sources & Integrations page, click + Add New, search for Amazon S3, then hover over it and click Add.
- Set these parameters, where the parameters change depending on whether you configured an Access Key or Assumed Role.
- To provide access to Cortex XSIAM to your logs and perform API operations using a designated AWS IAM user, leave the Access Key option selected. Otherwise, select Assumed Role, and ensure that you Create an Assumed Role for Cortex XSIAM before continuing with these instructions. In addition, when you create an Assumed Role for Cortex XSIAM, ensure that you edit the policy that defines the permissions for the role with the Amazon S3 Bucket ARN and SQS ARN.
- SQS URL: Specify the SQS URL, which is the ARN of the Amazon SQS that you configured in the AWS Management Console.
- Name: Specify a descriptive name for your log collection configuration.
- When setting an Access Key, set these parameters.
- AWS Client ID: Specify the Access key ID, which you received when you configured access keys for the AWS IAM user in AWS.
- AWS Client Secret: Specify the Secret access key you received when you configured access keys for the AWS IAM user in AWS.
- When setting an Assumed Role, set these parameters.
- Role ARN: Specify the Role ARN for the Assumed Role you created for in AWS.
- External Id: Specify the External Id for the Assumed Role you created for in AWS.
-
Log Type: Select Audit Logs to configure your log collection to receive audit logs from Amazon S3 via AWS CloudTrail. When configuring audit log collection, the following additional field is displayed for Enhanced Cloud Protection.
You can Normalize and enrich audit logs by selecting the checkbox. If selected, Cortex XSIAM stitches Amazon S3 audit logs with other Cortex XSIAM authentication stories across all cloud providers using the same format, which you can query with XQL Search using the
cloud_audit_logsdataset.
-
Click Test to validate access, and then click Enable.
Once events start to come in, a green check mark appears underneath the Amazon S3 configuration with the number of logs received.
Ingest network flow logs from Amazon S3
You can forward network flow logs to Cortex XSIAM from Amazon Simple Storage Service (Amazon S3).
To receive network flow logs from Amazon S3, you must first configure data collection from Amazon S3. You can then configure the Data Sources & Integrations settings in Cortex XSIAM for Amazon S3. After you set up collection integration, Cortex XSIAM begins receiving new logs and data from the source.
You can either configure Amazon S3 with SQS notification manually on your own or use the AWS CloudFormation Script that we have created for you to make the process easier. The instructions below explain how to configure Cortex XSIAM to receive network flow logs from Amazon S3 using SQS. To perform these steps manually, see Configure Data Collection from Amazon S3 Manually.
Note: For more information on configuring data collection from Amazon S3, see the Amazon S3 Documentation.
When Cortex XSIAM begins receiving logs, the app automatically creates an Amazon S3 Cortex Query Language (XQL) dataset (aws_s3_raw). This enables you to search the logs with XQL Search using the dataset. For example, queries refer to the in-app XQL Library. For enhanced cloud protection, you can also configure Cortex XSIAM to ingest network flow logs as Cortex XSIAM network connection stories, which you can query with XQL Search using the xdr_data dataset with the preset called network_story. Cortex XSIAM can also generate Cortex XSIAM issues (Analytics, Correlation Rules, IOC, and BIOC) when relevant from Amazon S3 logs. While Correlation Rules issues are generated on non-normalized and normalized logs, Analytics, IOC, and BIOC issues are only generated on normalized logs.
Enhanced cloud protection provides the following:
- Normalization of cloud logs
- Cloud logs stitching
- Enrichment with cloud data
- Detection based on cloud analytics
- Cloud-tailored investigations
Be sure you do the following tasks before you begin configuring data collection from Amazon S3 using the AWS CloudFormation Script.
- Ensure that you have the proper permissions to run AWS CloudFormation with the script provided in Cortex XSIAM. You need at a minimum the following permissions in AWS for an Amazon S3 bucket and Amazon Simple Queue Service (SQS):
- Amazon S3 bucket:
GetObject - SQS:
ChangeMessageVisibility,ReceiveMessage,GetQueueAttributes, andDeleteMessage.
- Amazon S3 bucket:
- Ensure that you can access your Amazon Virtual Private Cloud (VPC) and have the necessary permissions to create flow logs.
- Determine how you want to provide access to Cortex XSIAM to your logs and perform API operations. You have the following options:
- Use Workload Federated Identity to allow Cortex XSIAM's dedicated log collector service account to assume an IAM role in your AWS environment using a short-lived OIDC token, without storing any long-lived credentials. This is the Workload Federated Identity option in the Amazon S3 collection configuration and is the recommended option when available.
- Designate an AWS IAM user, where you will need to know the Account ID for the user and have the relevant permissions to create an access key/id for the relevant IAM user. This is the default option as explained in Configure the Amazon S3 Collection in Cortex XSIAM by selecting Access Key.
- Create an assumed role in AWS to delegate permissions to a Cortex XSIAM AWS service. This role grants Cortex XSIAM access to your flow logs. For more information, see Creating a role to delegate permissions to an AWS service. This is the Assumed Role option as described in Configure the Amazon S3 collection in Cortex XSIAM. For more information on creating an assumed role for Cortex XSIAM, see create an assumed role. To collect Amazon S3 logs that use server-side encryption (SSE), the user role must have an IAM policy that states that Cortex XSIAM has kms:Decrypt permissions. With this permission, Amazon S3 automatically detects if a bucket is encrypted and decrypts it. If you want to collect encrypted logs from different accounts, you must have the decrypt permissions for the user role also in the key policy for the master account Key Management Service (KMS). For more information, see Allowing users in other accounts to use a KMS key.
- If using Workload Federated Identity, ensure you have permissions to create an AWS IAM Identity Provider and an IAM role with a trust policy in your AWS account. You will need the Cortex XSIAM service account identifier (provided in the Cortex XSIAM UI after saving the configuration) to configure the trust relationship.
Configure Cortex XSIAM to receive network flow logs from Amazon S3 using the CloudFormation Script.
- Download the CloudFormation Script in Cortex XSIAM.
- Navigate to Settings → Data Sources & Integrations.
- On the Data Sources & Integrations page, click + Add New, search for Amazon S3, then hover over it and click Add.
- Select the authentication method to use for Cortex XSIAM to access your logs and peform API operations:
- To use Workload Federated Identity, select Workload Federated Identity. Cortex XSIAM's dedicated log collector assumes an IAM role in your AWS environment using a short-lived OIDC token, without storing any long-lived credentials. Ensure that you have created an IAM role with a trust policy before continuing.
- To use a designated AWS IAM user with static credentials, select Access Key.
- To use an IAM assumed role, select Assumed Role, and ensure that you create an assumed role for Cortex XSIAM before continuing with these instructions.
- For the Log Type, select Flow Logs to configure your log collection to receive network flow logs from Amazon S3, and the following text is displayed under the field Download CloudFormation Script. See instructions here.
- Click the Download CloudFormation Script link to download the script to your computer.
-
Create a new Stack in the CloudFormation Console with the script you downloaded from Cortex XSIAM.
For more information on creating a Stack, see Creating a stack on the AWS CloudFormation console.
- Log in to the CloudFormation Console.
- From the CloudFormation → Stacks page, ensure that you have selected the correct region for your configuration.
- Select Create Stack → With new resources (standard).
- Specify the template that you want AWS CloudFormation to use to create your stack. This template is the script that you downloaded from Cortex XSIAM, which will create an Amazon S3 bucket, Amazon Simple Queue Service (SQS) queue, and Queue Policy. Configure the following settings in the Specify template page.
- Prerequisite - Prepare template → Prepare template: Select Template is ready.
- Specify Template
- Template source: Select Upload a template file.
-
Upload a template file: Choose file, and select the
cortex-xdr-create-s3-with-sqs-flow-logs.jsonfile that you downloaded from Cortex XSIAM.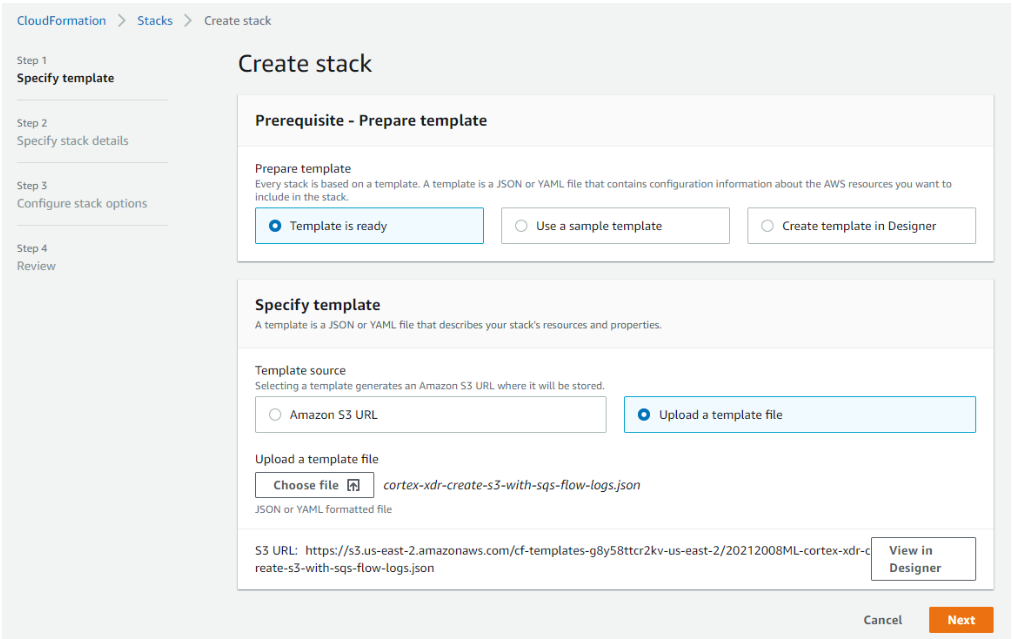
- Click Next.
- In the Specify stack details page, configure the following stack details.
- Stack name: Specify a descriptive name for your stack.
- Parameters → Cortex XDR Flow Logs Integration
- Bucket Name: Specify the name of the S3 bucket to create, where you can leave the default populated name as xdr-flow-logs or create a new one. The name must be unique.
- Publisher Account ID: Specify the AWS IAM user account ID with whom you are sharing access.
-
Queue Name: Specify the name for your Amazon SQS queue to create, where you can leave the default populated name as xdr-flow or create a new one. The name must be unique.
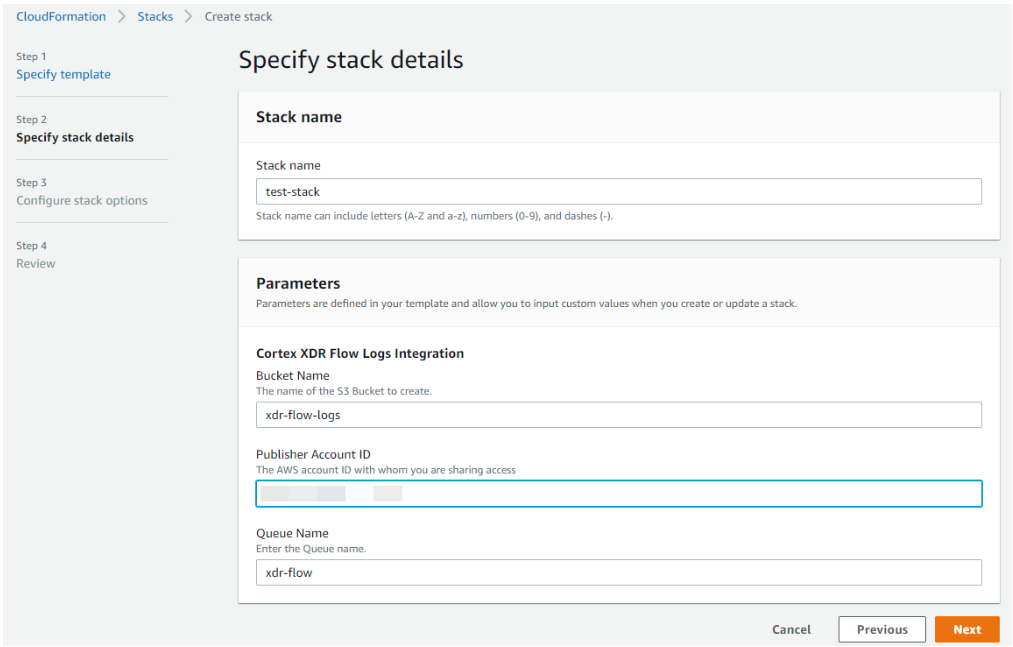
- Click Next.
- In the Configure stack options page, there is nothing to configure, so click Next.
-
In the Review page, look over the stack configurations settings that you have configured and if they are correct, click Create stack. If you need to make a change, click Edit beside the particular step that you want to update.
The stack is created and is opened with the Events tab displayed. It can take a few minutes for the new Amazon S3 bucket, SQS queue, and Queue Policy to be created. Click Refresh to get updates. Once everything is created, leave the stack opened in the current browser, because you will need to access information in the stack for other steps detailed below.
Note: For the Amazon S3 bucket created using CloudFormation, it is the customer’s responsibility to define a retention policy by creating a Lifecycle rule in the Management tab. We recommend setting the retention policy to at least 7 days to ensure that the data is retrieved under all circumstances.
- Configure your Amazon Virtual Private Cloud (VPC) with flow logs:
-
Open the Amazon VPC Console, and in the Resources by Region listed, select VPCs to view the VPCs configured for the current region selected. To select another VPC from another region, select See all regions, and select one of them.
Note: To create a new VPC, click Launch VPC Wizard. For more information, see AWS VPC Flow Logs.
-
From the list of Your VPCs, select the checkbox beside the VPC that you want to configure to create flow logs, and then select Actions → Create flow log.
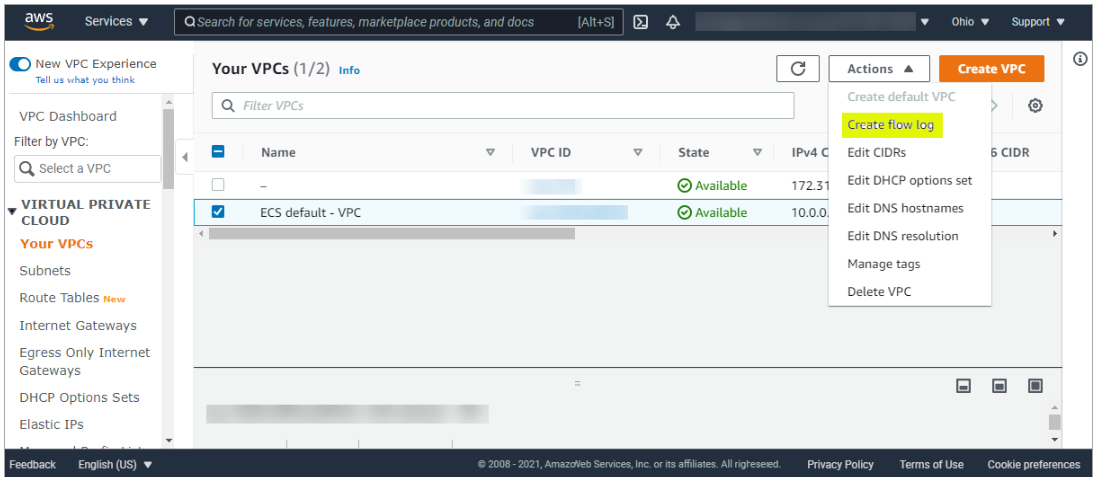
- Configure the following Flow log settings:
- Name - optional: (Optional) Specify a descriptive name for your VPC flow log.
- Filter: Select All types of traffic to capture.
- Maximum aggregation interval: If you anticipate a heavy flow of traffic, select 1 minute. Otherwise, leave the default setting as 10 minutes.
- Destination: Select Send to an Amazon S3 bucket as the destination to publish the flow log data.
-
S3 bucket ARN:Specify the Amazon Resource Name (ARN) for your Amazon S3 bucket.
You can retrieve your bucket’s ARN by opening another instance of the AWS Management Console in a browser window and opening the Amazon S3 console. In the Buckets section, select the bucket that you created for collecting the Amazon S3 flow logs when you created your stack, click Copy ARN, and paste the ARN in this field.
- Log record format: Select Custom Format, and in the Log Format field, specify the following fields to include in the flow log record, which you can select from the list displayed:
- account-id
- action
- az-id
- bytes
- dstaddr
- dstport
- end
- flow-direction
- instance-id
- interface-id
- packets
- log-status
- pkt-srcaddr
- pkt-dstaddr
- protocol
- region
- srcaddr
- srcport
- start
- sublocation-id
- sublocation-type
- subnet-id
- tcp-flags
- type
- vpc-id
- version
-
Click Create flow log.
Once the flow log is created, a message indicating that the flow log was successfully created is displayed at the top of the Your VPCs page.
In addition, if you open your Amazon S3 bucket configurations, by selecting the bucket from the Amazon S3 console, the Objects tab contains a folder called
AWSLogs/to collect the flow logs.
-
-
Configure access keys for the AWS IAM user that Cortex XSIAM uses for API operations.
Note:
- It is the responsibility of the customer’s organization to ensure that the user who performs this task of creating the access key is designated with the relevant permissions. Otherwise, this can cause the process to fail with errors.
- Skip this step if you are using an Assumed Role or Workload Federated Identity for Cortex XSIAM.
- Open the AWS IAM Console, and in the navigation pane, select Access management → Users.
- Select the User name of the AWS IAM user.
- Select the Security credentials tab, scroll down to the Access keys section, and click Create access key.
- Click the copy icon next to the Access key ID and Secret access key keys, where you must click Show secret access key to see the secret key and record them somewhere safe before closing the window. You will need to provide these keys when you edit the Access policy of the SQS queue and when setting the AWS Client ID and AWS Client Secret in Cortex XSIAM. If you forget to record the keys and close the window, you will need to generate new keys and repeat this process.
Note: For more information, see Managing access keys for IAM users.
-
When you create an Assumed Role in Cortex XSIAM, ensure that you edit the policy that defines the permissions for the role with the S3 Bucket ARN and SQS ARN, which is taken from the Stack you created.
Note: Skip this step if you are using an Access Key to provide access to Cortex XSIAM.
- Configure the Amazon S3 collection in Cortex XSIAM.
- Navigate to Settings → Data Sources & Integrations.
- Select the Amazon S3 integration and click Add Instance.
- Set these parameters, where the parameters change depending on whether you configured an Access Key or Assumed Role.
- SQS URL: Specify the SQS URL, which is taken from the stack you created. In the browser you left open after creating the stack, open the Outputs tab, copy the Value of the QueueURL and paste it in this field.
- Name: Specify a descriptive name for your log collection configuration.
- When setting an Access Key, set these parameters.
- AWS Client ID: Specify the Access key ID, which you received when you created access keys for the AWS IAM user in AWS.
- AWS Client Secret: Specify the Secret access key you received when you created access keys for the AWS IAM user in AWS.
- When setting an Assumed Role, set these parameters.
- Role ARN: Specify the Role ARN for the Assumed Role you created for in AWS.
- External Id:Specify the External Id for the Assumed Role you created for in AWS.
-
Log Type: Select Flow Logs to configure your log collection to receive network flow logs from Amazon S3. When configuring network flow log collection, the following additional field is displayed for Enhanced Cloud Protection.
You can Normalize and enrich flow logs by selecting the checkbox. If selected, Cortex XSIAM ingests the network flow logs as network connection stories, which you can query using XQL Search from the
xdr_datadataset using the preset callednetwork_story.
-
Click Test to validate access, and then click Enable.
When events start to come in, a green check mark appears underneath the Amazon S3 configuration with the number of logs received.
Ingest generic logs from Amazon S3
You can forward generic logs for the relevant service to Cortex XSIAM from Amazon S3.
To receive generic data from Amazon Simple Storage Service (Amazon S3), you must first configure data collection from Amazon S3. You can then configure the Data Sources & Integrations settings in Cortex XSIAM for Amazon S3. After you set up collection integration, Cortex XSIAM begins receiving new logs and data from the source.
Note: For more information on configuring data collection from Amazon S3, see the Amazon S3 Documentation.
When Cortex XSIAM begins receiving logs, the app automatically creates an Amazon S3 Cortex Query Language (XQL) dataset (<Vendor>_<Product>_raw). This enables you to search the logs using XQL Search with the dataset. For example queries, refer to the in-app XQL Library. Cortex XSIAM can also generate Cortex XSIAM issues (Correlation Rules only), when relevant, from Amazon S3 logs.
Note: You need to set up an Amazon S3 data collector to receive generic logs when collecting logs from BeyondTrust Privilege Management Cloud. For more information, see Ingest logs from BeyondTrust Privilege Management Cloud.
Prerequisites
Perform the following tasks before you begin configuring data collection from Amazon S3:
-
Create a dedicated Amazon S3 bucket, which collects the generic logs that you want to capture. For more information, see Creating a bucket using the Amazon S3 Console.
Note: It is the customer’s responsibility to define a retention policy for your Amazon S3 bucket by creating a Lifecycle rule in the Management tab. We recommend setting the retention policy to at least 7 days to ensure that the data is retrieved under all circumstances.
- The logs collected by your dedicated Amazon S3 bucket must adhere to the following guidelines.
- Each log file must use the 1 log per line format. By default, multi-line format is not supported. It can only be used for
rawformat when you specifically configure your environment for that use case. - The log format must be compressed as gzip or uncompressed.
- For best performance, we recommend limiting each file size to up to 50 MB (compressed).
- Each log file must use the 1 log per line format. By default, multi-line format is not supported. It can only be used for
- Ensure that you have at a minimum the following permissions in AWS for an Amazon S3 bucket and Amazon Simple Queue Service (SQS).
- Amazon S3 bucket:
GetObject - SQS:
ChangeMessageVisibility,ReceiveMessage,GetQueueAttributes, andDeleteMessage.
- Amazon S3 bucket:
- Determine how you want to provide access to Cortex XSIAM to your logs and perform API operations. You have the following options:
- Use Workload Federated Identity to allow Cortex XSIAM's dedicated log collector service account to assume an IAM role in your AWS environment using a short-lived OIDC token, without storing any long-lived credentials. This is the Workload Federated Identity option in the Amazon S3 collection configuration and is the recommended option when available.
- Designate an AWS IAM user, where you will need to know the Account ID for the user and have the relevant permissions to create an access key/id for the relevant IAM user.
- Create an assumed role in AWS to delegate permissions to a Cortex XSIAM AWS service. This role grants Cortex XSIAM access to your flow logs. For more information, see Creating a role to delegate permissions to an AWS service. This is the Assumed Role option described in the configure the Amazon S3 collection in Cortex XSIAM. For more information on creating an assumed role for Cortex XSIAM, see Create an assumed role.
- If using Workload Federated Identity, ensure you have permissions to create an AWS IAM Identity Provider and an IAM role with a trust policy in your AWS account. You will need the Cortex XSIAM service account identifier (provided in the Cortex XSIAM UI after saving the configuration) to configure the trust relationship.
- To collect Amazon S3 logs that use server-side encryption (SSE), the user role must have an IAM policy that states that Cortex XSIAM has kms:Decrypt permissions. With this permission, Amazon S3 automatically detects if a bucket is encrypted and decrypts it. If you want to collect encrypted logs from different accounts, you must have the decrypt permissions for the user role also in the key policy for the master account Key Management Service (KMS). For more information, see Allowing users in other accounts to use a KMS key.
Configure Cortex XSIAM to receive generic logs from Amazon S3:
- Log in to the AWS Management Console.
- From the menu bar, ensure that you have selected the correct region for your configuration.
-
Configure an Amazon Simple Queue Service (SQS).
Note: Ensure that you create your Amazon S3 bucket and Amazon SQS queue in the same region.
- In the Amazon SQS Console, click Create Queue.
- Configure the following settings, where the default settings should be used unless otherwise indicated.
- Type: Select Standard queue (default).
- Name: Specify a descriptive name for your SQS queue.
- Configuration section: Leave the default settings for the various fields.
-
Access policy → Choose method: Select Advanced and update the Access policy code in the editor window to enable your Amazon S3 bucket to publish event notification messages to your SQS queue. Use this sample code as a guide for defining the
“Statement”with the following definitions.-
“Resource”: Leave the automatically generated ARN for the SQS queue that is set in the code, which uses the format“arn:sns:Region:account-id:topic-name”.You can retrieve your bucket’s ARN by opening the Amazon S3 Console in a browser window. In the Buckets section, select the bucket that you created for collecting the Amazon S3 flow logs, click Copy ARN, and paste the ARN in the field.
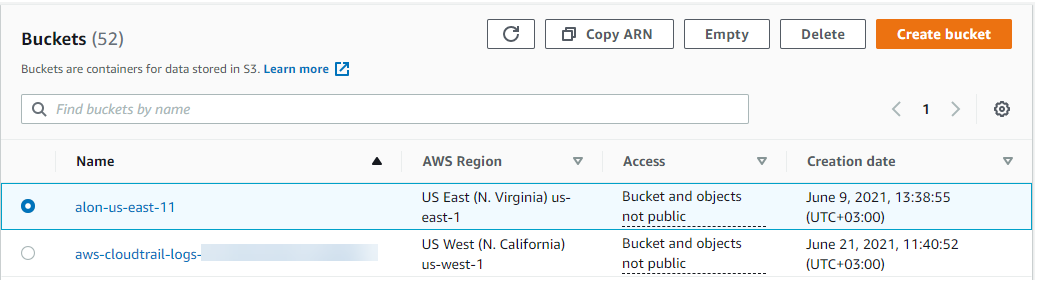
Note: For more information on granting permissions to publish messages to an SQS queue, see Granting permissions to publish event notification messages to a destination.
{ "Version": "2012-10-17", "Statement": [ { "Effect": "Allow", "Principal": { "Service": "s3.amazonaws.com" }, "Action": "SQS:SendMessage", "Resource": "[Leave automatically generated ARN for the SQS queue defined by AWS]", "Condition": { "ArnLike": { "aws:SourceArn": "[ARN of your Amazon S3 bucket]" } } } ] }
- Dead-letter queue section: We recommend that you configure a queue for sending undeliverable messages by selecting Enabled, and then in the Choose queue field selecting the queue to send the messages. You may need to create a new queue for this, if you do not already have one set up. For more information, see Amazon SQS dead-letter queues.
-
Click Create queue.
Once the SQS is created, a message indicating that the queue was successfully configured is displayed at the top of the page.
- Configure an event notification to your Amazon SQS whenever a file is written to your Amazon S3 bucket.
- Open the Amazon S3 Console and in the Properties tab of your Amazon S3 bucket, scroll down to the Event notifications section, and click Create event notification.
- Configure the following settings:
- Event name: Specify a descriptive name for your event notification containing up to 255 characters.
- Prefix: Do not set a prefix, as the Amazon S3 bucket is meant to be a dedicated bucket for collecting only network flow logs.
- Event types: Select All object create events for the type of event notifications that you want to receive.
- Destination: Select SQS queue to send notifications to an SQS queue to be read by a server.
-
Specify SQS queue: You can either select Choose from your SQS queues and then select the SQS queue, or select Enter SQS queue ARN and specify the ARN in the SQS queue field.
You can retrieve your SQS queue ARN by opening another instance of the AWS Management Console in a browser window, and opening the Amazon SQS Console, and selecting the Amazon SQS that you created. In the Details section, under ARN, click the copy icon (), and paste the ARN in the field.
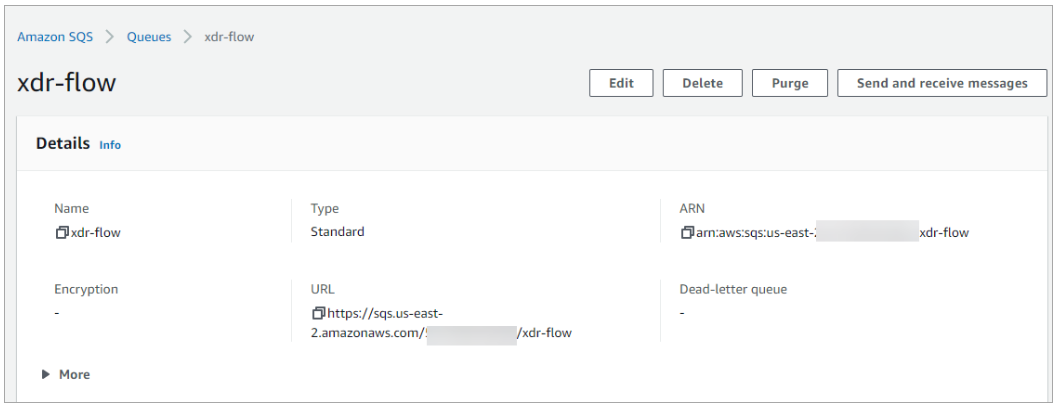
-
Click Save changes.
Once the event notification is created, a message indicating that the event notification was successfully created is displayed at the top of the page.
Note: If your receive an error when trying to save your changes, you should ensure that the permissions are set up correctly.
-
Configure access keys for the AWS IAM user.
Note:
- It is the responsibility of your organization to ensure that the user who performs this task of creating the access key is assigned the relevant permissions. Otherwise, this can cause the process to fail with errors.
- Skip this step if you are using an Assumed Role or Workload Federated Identity for Cortex XSIAM.
- Open the AWS IAM Console, and in the navigation pane, select Access management → Users.
- Select the username of the AWS IAM user.
- Select the Security credentials tab, scroll down to the Access keys section, and click Create access key.
-
Click the copy icon () next to the Access key ID and Secret access key. You must click Show secret access key to see the secret key, and record them somewhere safe before closing the window. You will need to provide these keys when you edit the Access policy of the SQS queue and when setting the AWS Client ID and AWS Client Secret in Cortex XSIAM. If you forget to record the keys and close the window, you will need to generate new keys and repeat this process.
For more information, see Managing access keys for IAM users.
-
Update the Access policy of your Amazon SQS queue.
Note: Skip this step if you are using an Assumed Role or Workload Federated Identity for Cortex XSIAM.
- In the Amazon SQS Console, select the SQS queue that you created when you configured an Amazon Simple Queue Service (SQS).
- Select the Access policy tab, and edit the Access policy code in the editor window to enable the IAM user to perform operations on the Amazon SQS with permissions to
SQS:ChangeMessageVisibility,SQS:DeleteMessage,SQS:ReceiveMessage, andSQS:GetQueueAttributes. Use this sample code as a guide for defining the“Sid”: “__receiver_statement”with the following definitions.“aws:SourceArn”: Specify the ARN of the AWS IAM user. You can retrieve the User ARN from the Security credentials tab, which you accessed when you configured access keys for the AWS API user.-
“Resource”: Leave the automatically generated ARN for the SQS queue that is set in the code, which uses the format“arn:sns:Region:account-id:topic-name”.Note: For more information on granting permissions to publish messages to an SQS queue, see Granting permissions to publish event notification messages to a destination.
{ "Version": "2012-10-17", "Statement": [ { "Effect": "Allow", "Principal": { "Service": "s3.amazonaws.com" }, "Action": "SQS:SendMessage", "Resource": "[Leave automatically generated ARN for the SQS queue defined by AWS]", "Condition": { "ArnLike": { "aws:SourceArn": "[ARN of your Amazon S3 bucket]" } } }, { "Sid": "__receiver_statement", "Effect": "Allow", "Principal": { "AWS": "[Add the ARN for the AWS IAM user]" }, "Action": [ "SQS:ChangeMessageVisibility", "SQS:DeleteMessage", "SQS:ReceiveMessage", "sqs:GetQueueAttributes" ], "Resource": "[Leave automatically generated ARN for the SQS queue defined by AWS]" } ] }
- Configure the Amazon S3 collection in Cortex XSIAM.
- Navigate to Settings → Data Sources & Integrations.
- On the Data Sources & Integrations page, click + Add New, search for Amazon S3, then hover over it and click Add.
- Select the authentication method you configured and enter the values relevant for your method:
| Field | Input |
|---|---|
| SQS URL | Specify the SQS URL, which is the URL of the Amazon SQS that you configured in the AWS Management Console. |
| Name | Specify a descriptive name for your log collection configuration. |
| Role ARN | Specify the Role ARN for the Assumed Role you created in AWS. |
| Audience | (Workload Federated Identity only) Specify the OIDC audience value configured in your AWS IAM identity provider trust policy. This value scopes the OIDC token to your specific AWS environment. |
| AWS Client ID | (Access Key only) Specify the Access key ID, which you received when you configured access keys for the AWS IAM user in AWS. |
| AWS Client Secret | (Access Key only) Specify the Secret access key you received when you configured access keys for the AWS IAM user in AWS. |
| External ID | (STS AssumeRole only) Specify the External ID for the Assumed Role you created in AWS. |
| Log Type | Select Generic to configure your log collection to receive generic logs from Amazon S3, which can include different types of data, such as file and metadata. |
| Log Format | Select the log format type as Raw, JSON, CEF, LEEF, Cisco, Corelight, or Beyondtrust Cloud ECS. Note:
|
| Vendor | (Optional) Specify a particular vendor name for the Amazon S3 generic data collection, which is used in the Amazon S3 XQL dataset <Vendor>_<Product>_raw that Cortex XSIAM creates as soon as it begins receiving logs. |
| Product | (Optional) Specify a particular product name for the Amazon S3 generic data collection, which is used in the Amazon S3 XQL dataset name <Vendor>_<Product>_raw that Cortex XSIAM creates as soon as it begins receiving logs. |
| Compression | Select whether the logs are compressed into a gzip file or are uncompressed. |
| Multiline Parsing Regex | (Optional, Raw format only) Enter a regular expression to identify the start of a new log event. Cortex XSIAM assumes each new event start indicates the previous event has ended. |
When Log Format is set to one of the following, the fields are pre-populated as shown:
| Log Format | Vendor | Product | Compression | Configurable? |
|---|---|---|---|---|
| Beyondtrust Cloud ECS | Beyondtrust | Privilege Management | Uncompressed | No |
| Cisco | Cisco | ASA | N/A | No |
| Corelight | Corelight | Zeek | N/A | No |
| Raw or JSON | AMAZON | AWS | N/A | Yes |
- Cortex XSIAM supports logs in single-line format or multiline format. For a JSON format, multiline logs are collected automatically when the Log Format is configured as JSON. When configuring a Raw format, you must also define the Multiline Parsing Regex as explained below.
d. Click Test to validate access, and then click Enable.
Once events start to come in, a green check mark appears underneath the Amazon S3 configuration with the number of logs received.
Ingest network Route 53 logs from Amazon S3
You can forward network AWS Route 53 DNS logs to Cortex XSIAM from Amazon Simple Storage Service (Amazon S3).
To receive network Route 53 DNS logs from Amazon S3, you must first configure data collection from Amazon S3. You can then configure the Collection Integrations settings in Cortex XSIAM for Amazon S3. After you set up collection integration, Cortex XSIAM begins receiving new logs and data from the source.
You can configure Amazon S3 with SQS notification using the AWS CloudFormation Script that we have created for you to make the process easier. The instructions below explain how to configure Cortex XSIAM to receive network Route 53 DNS logs from Amazon S3 using SQS.
Note
For more information on configuring data collection from Amazon S3 for Route 53 DNS logs, see the AWS Documentation.
When Cortex XSIAM begins receiving logs, the app automatically creates an Amazon Route 53 Cortex Query Language (XQL) dataset (amazon_route53_raw). This enables you to search the logs with XQL Search using the dataset. For example, queries refer to the in-app XQL Library. For enhanced cloud protection, you can also configure Cortex XSIAM to ingest network Route 53 DNS logs as Cortex XSIAM network connection stories, which you can query with XQL Search using the xdr_data dataset with the preset called network_story. Cortex XSIAM can also generate Cortex XSIAM issues (Analytics, Correlation Rules, IOC, and BIOC) when relevant from Amazon Route 53 DNS logs. While Correlation Rules issues are generated on non-normalized and normalized logs, Analytics, IOC, and BIOC issues are only generated on normalized logs.
Enhanced cloud protection provides:
- Normalization of cloud logs
- Cloud logs stitching
- Enrichment with cloud data
- Detection based on cloud analytics
- Cloud-tailored investigations
Be sure you do the following tasks before you begin configuring data collection from Amazon S3 using the AWS CloudFormation Script.
- Ensure that you have the proper permissions to run AWS CloudFormation with the script provided in Cortex XSIAM. You need at a minimum the following permissions in AWS for an Amazon S3 bucket and Amazon Simple Queue Service (SQS):
- Amazon S3 bucket:
GetObject - SQS:
ChangeMessageVisibility,ReceiveMessage,GetQueueAttributes, andDeleteMessage.
- Amazon S3 bucket:
- Ensure that you can access your Amazon Virtual Private Cloud (VPC) and have the necessary permissions to create Route 53 Resolver Query logs.
- Determine how you want to provide access to Cortex XSIAM to your logs and perform API operations. You have the following options.
- Use Workload Federated Identity to allow Cortex XSIAM's dedicated log collector service account to assume an IAM role in your AWS environment using a short-lived OIDC token, without storing any long-lived credentials. This is the Workload Federated Identity option in the Amazon S3 collection configuration and is the recommended option when available.
- Designate an AWS IAM user, where you will need to know the Account ID for the user and have the relevant permissions to create an access key/id for the relevant IAM user. This is the default option when you configure the Amazon S3 collection by selecting Access Key.
- Create an assumed role in AWS to delegate permissions to a Cortex XSIAM AWS service. This role grants Cortex XSIAM access to your flow logs. For more information, see Creating a role to delegate permissions to an AWS service. This is the Assumed Role option when you configure the Amazon S3 collection in Cortex XSIAM. For more information on creating an assumed role for Cortex XSIAM, see create an assumed role. To collect Amazon S3 logs that use server-side encryption (SSE), the user role must have an IAM policy that states that Cortex XSIAM has kms:Decrypt permissions. With this permission, Amazon S3 automatically detects if a bucket is encrypted and decrypts it. If you want to collect encrypted logs from different accounts, you must have the decrypt permissions for the user role also in the key policy for the master account Key Management Service (KMS). For more information, see Allowing users in other accounts to use a KMS key.
- If using Workload Federated Identity, ensure you have permissions to create an AWS IAM Identity Provider and an IAM role with a trust policy in your AWS account. You will need the Cortex XSIAM service account identifier (provided in the Cortex XSIAM UI after saving the configuration) to configure the trust relationship.
Configure Cortex XSIAM to receive network Route 53 DNS logs from Amazon S3 using the CloudFormation Script.
- Download the CloudFormation Script in Cortex XSIAM.
- Navigate to Settings → Data Sources & Integrations.
- On the Data Sources & Integrations page, click + Add New, search for Amazon S3, then hover over it and click Add.
- To provide access to Cortex XSIAM to your logs and to perform API operations using a designated AWS IAM user, leave the Access Key option selected. Otherwise, select Assumed Role, and ensure that you Create an Assumed Role before continuing with these instructions.
- For the Log Type, select Route 53 to configure your log collection to receive network Route 53 DNS logs from Amazon S3, and the following text is displayed under the field Download CloudFormation Script. See instructions here.
- Click the Download CloudFormation Script link to download the script to your computer.
-
Create a new Stack in the CloudFormation Console with the script you downloaded from Cortex XSIAM.
Note
For more information on creating a Stack, see Creating a stack on the AWS CloudFormation console.
- Log in to the CloudFormation Console.
- From the CloudFormation → Stacks page, ensure that you have selected the correct region for your configuration.
- Select Create Slack → With new resources (standard).
- Specify the template that you want AWS CloudFormation to use to create your stack. This template is the script that you downloaded from Cortex XSIAM, which will create an Amazon S3 bucket, Amazon Simple Queue Service (SQS) queue, and Queue Policy. Configure the following settings in the Specify template page.
- Prerequisite - Prepare template → Prepare template: Select Template is ready.
- Specify Template
- Template source: Select Upload a template file.
- Upload a template file: Choose file, and select the
CloudFormation-Script.jsonfile that you downloaded.
- Click Next.
- In the Specify stack details page, configure the following stack details.
- Stack name: Specify a descriptive name for your stack.
- Parameters → Cortex XSIAM Flow Logs Integration
- Bucket Name: Specify the name of the S3 bucket to create, where you can leave the default populated name as xdr-route53-logs or create a new one. The name must be unique.
- Publisher Account ID: Specify the AWS IAM user account ID with whom you are sharing access.
- Queue Name: Specify the name for your Amazon SQS queue to create, where you can leave the default populated name as xdr-route53 or create a new one. The name must be unique.
- Click Next.
- In the Configure stack options page, there is nothing to configure, so click Next.
-
In the Review page, look over the stack configuration settings that you have configured and if they are correct, click Create stack. If you need to make a change, click Edit beside the particular step that you want to update.
The stack is created and is opened with the Events tab displayed. It can take a few minutes for the new Amazon S3 bucket, SQS queue, and Queue Policy to be created. Click Refresh to get updates. Once everything is created, leave the stack opened in the current browser as you will need to access information in the stack for other steps detailed below.
Note
For the Amazon S3 bucket created using CloudFormation, it is the customer’s responsibility to define a retention policy by creating a Lifecycle rule in the Management tab. We recommend setting the retention policy to at least 7 days to ensure the data can be retrieved under all circumstances.
- Configure Route 53 Query Logging in AWS.
- Log in to the AWS Management Console.
- From the menu bar, ensure that you have selected the correct region for your configuration.
- Search for Route 53 and select Resolver → Query Logging.
- Configure query logging.
- Set the following parameters in the different sections on the Configure query logging page.
- Query logging configuration name
- Name: Specify a name for your Resolver query logging configuration.
- Query logs destination
- Destination for query logs: Select S3 bucket as the place where you want Resolver to publish query logs.
- Amazon S3 bucket: Browse S3 to select the Amazon S3 bucket created after running the CloudFormation script, which is by default called xdr-route53-logs or select the one that you created.
- VPCs to log queries for
- Add VPC: Clicking the Add VPC button opens the Add VPC page, where you can choose the VPCs that you want to log queries for. When you are done, click Add.
- Query logging configuration name
- Click Configure query logging.
-
Configure access keys for the AWS IAM user that Cortex XSIAM uses for API operations.
Note
- It is the responsibility of the customer’s organization to ensure that the user who performs this task of creating the access key is designated with the relevant permissions. Otherwise, this can cause the process to fail with errors.
- Skip this step if you are using an Assumed Role or Workload Federated Identity for Cortex XSIAM.
- Open the AWS IAM Console, and in the navigation pane, select Access management → Users.
- Select the username of the AWS IAM user.
- Select the Security credentials tab, scroll down to the Access keys section, and click Create access key.
-
Click the copy icon next to the Access key ID and Secret access key, where you must click Show secret access key to see the secret key and record it somewhere safe before closing the window. You will need to provide these keys when you edit the Access policy of the SQS queue and when setting the AWS Client ID and AWS Client Secret in Cortex XSIAM. If you forget to record the keys and close the window, you will need to generate new keys and repeat this process.
Note
For more information, see Managing access keys for IAM users.
-
When you create an Assumed Role, ensure that you edit the policy that defines the permissions for the role with the S3 Bucket ARN and SQS ARN, which is taken from the stack you created.
Note
Skip this step if you are using an Access Key to provide access to Cortex Cloud.
- Configure the Amazon S3 collection in Cortex XSIAM.
- Navigate to Settings → Data Sources & Integrations.
- In the Amazon S3 configuration, click Add Instance to begin a new configuration.
- Set these parameters, where the parameters change depending on whether you configured an Access Key or Assumed Role.
- SQS URL: Specify the SQS URL, which is taken from the stack you created. In the browser you left open after creating the stack, open the Outputs tab, copy the Value of the QueueURL and paste it in this field.
- Name: Specify a descriptive name for your log collection configuration.
- When setting an Access Key, set these parameters.
- AWS Client ID: Specify the Access key ID, which you received when you created access keys for the AWS IAM user in AWS.
- AWS Client Secret: Specify the Secret access key you received when you created access keys for the AWS IAM user in AWS.
- When setting an Assumed Role, set these parameters.
- Role ARN: Specify the Role ARN for the Assumed Role you created for Cortex XSIAMin AWS.
- External Id: Specify the External Id for the Assumed Role you created for Cortex XSIAM in AWS.
-
Log Type: Select Route 53 to configure your log collection to receive network Route 53 DNS logs from Amazon S3. When configuring network Route 53 log collection, the following additional field is displayed for Enhanced Cloud Protection.
You can Normalize DNS logs by selecting the checkbox (default configuration). When selected, Cortex XSIAM ingests the network Route 53 DNS logs as XDR network connection stories, which you can query using XQL Search from the
xdr_datadataset using the preset callednetwork_story.
-
Click Test to validate access, and then click Enable.
When events start to come in, a green check mark appears underneath the Amazon S3 configuration with the number of logs received.
Create an assumed role
If you do not designate a separate AWS IAM user to provide access to Cortex XSIAM to your logs and to perform API operations, you can create an assumed role in AWS to delegate permissions to a Cortex XSIAM AWS service. This role grants Cortex XSIAM access to your logs. For more information, see Creating a role to delegate permissions to an AWS service.
When setting up any type of Amazon S3 Collector in Cortex XSIAM, these instructions explain setting up an Assumed Role.
Prerequisite
You need ensure you have an Amazon S3 bucket and Amazon Simple Queue Service (SQS) already configured as it's needed to configure an IAM policy. The S3 bucket and SQS required depends on how you plan to configure your Amazon S3 data source:
- When using a CloudFormation script provided by Cortex XSIAM to configure Amazon S3 with SQS notifications, you'll need to either:
- Use the out-of-the-box Amazon S3 bucket and Amazon Simple Queue Service (SQS), whose names change according to the Amazon S3 log type you are defining.
- Create a new S3 bucket and SQS according to your system requirements.
- When configuring data collection from Amazon S3 manually, create a S3 bucket and SQS according to your system requirements.
When creating the S3 bucket and SQS, follow any other relevant instructions provided, for example in the prerequisite section, for the specific type of Amazon S3 data you want to ingest in the relevant topic.
- Log in to the AWS Management Console, and open the IAM console to create a policy in the same region as your AWS account.
- In the navigation pane on the left, select Access Management → Policies, and click Create policy.
- For the Policy editor, select the JSON tab.
-
Copy the following JSON policy and paste it within the editor window.
The
<s3-arn>and<sqs-arn>are placeholders. These are filled out using the S3 bucket and SQS that you configured in the prerequisite steps above.Note
- You can retrieve your bucket’s ARN by opening the Amazon S3 Console in a browser window. In the Buckets section, select the bucket, click Copy ARN, and paste the ARN in the field.
- You can retrieve the SQS queue ARN by opening another instance of the AWS Management Console in a browser window, and opening the Amazon SQS Console, and selecting the Amazon SQS that you created. In the Details section, under ARN, click the copy icon ()), and paste the ARN in the field.
{ "Version": "2012-10-17", "Statement": [ { "Effect": "Allow", "Action": "s3:GetObject", "Resource": "<s3-arn>/*" }, { "Effect": "Allow", "Action": [ "sqs:ReceiveMessage", "sqs:DeleteMessage", "sqs:ChangeMessageVisibility", "sqs:GetQueueAttributes" ], "Resource": "<sqs-arn>" } ] }
- Click Next.
- Review and create the policy.
-
Create a role for Cortex XSIAM in the IAM console of the AWS Management Console.
Note
For more information, see the AWS instructions.
- In the navigation pane on the left, select Access Management → Roles, and click Create role.
-
Select trusted entity, and use the following values and options when creating the role:
- Trusted entity type: Select Custom trust policy.
- Custom trust policy: On the right pane, configure the following settings.
- Under Edit statement → Read or write, verify the AssumeRole is selected.
-
Add a principle by clicking Add and setting the following:
- Principal type: Select AWS account and root user.
- ARN: Replace (Account) with the Account ID 006742885340. When using a Cortex XSIAM FedRAMP environment, specify the Account ID as 685269782068.
When you are finished, click Add principal.
-
Add a condition for an External ID by clicking Add and setting the following:
- Condition key: Select sts:ExternalId.
- Qualifier: Select Default.
- Operator: Select StringEquals.
- Value: Enter the value of the External ID, a unique alphanumeric string, by generating a secure UUIDv4 using an Online UUID Generator. Copy the External ID as you will use this when configuring the Amazon S3 Collector in Cortex XSIAM.
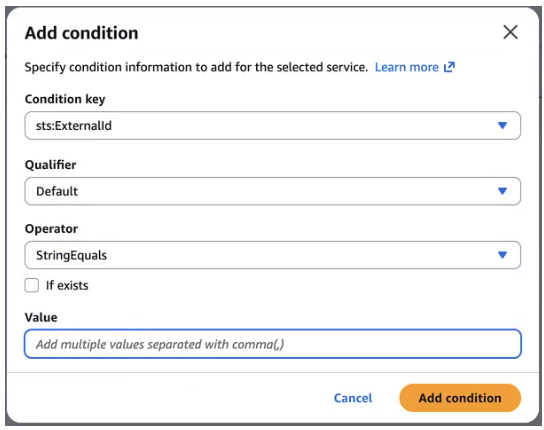
When you are finished, click Add condition.
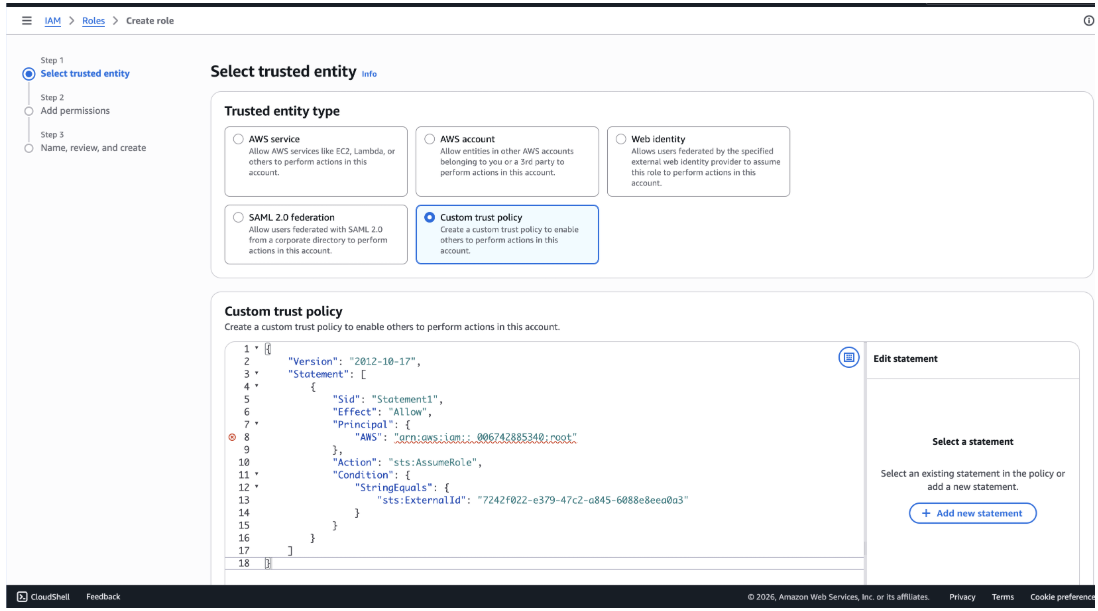
-
Click Next and add permissions by selecting the policy you created.
-
Click Next to name, review, and create.
- Role name: Specify a name for the new role, and click Create role.
- Copy the Policy ARN and Role ARN for future use by opening the policy and role that you created.
-
Continue with the task for the applicable Amazon S3 logs you want to configure.
The following types of logs are available.
Configure data collection from Amazon S3 manually
There are various reasons why you may need to configure data collection from Amazon S3 manually, as opposed to using the CloudFormation Script provided in Cortex XSIAM. For example, if your organization does not use CloudFormation scripts, you will need to follow the instructions below, which explain at a high-level how to perform these steps manually with a link to the relevant topic in the Amazon S3 documentation with the detailed steps to follow.
As soon as Cortex XSIAM begins receiving logs, the app automatically creates an Amazon S3 Cortex Query Language (XQL) dataset (aws_s3_raw). This enables you to search the logs with XQL Search using the dataset. For example queries, refer to the in-app XQL Library. For enhanced cloud protection, you can also configure Cortex XSIAM to ingest network flow logs as Cortex XSIAM network connection stories, which you can query with XQL Search using the xdr_dataset dataset with the preset called network_story. Cortex XSIAM can also generate Cortex XSIAM issues (Analytics, Correlations, IOC, and BIOC) when relevant from Amazon S3 logs. While Correlation Rules issues are generated on non-normalized and normalized logs, Analytics, IOC, and BIOC issues are only generated on normalized logs.
Enhanced cloud protection provides:
- Normalization of cloud logs
- Cloud logs stitching
- Enrichment with cloud data
- Detection based on cloud analytics
- Cloud-tailored investigations
Be sure you do the following tasks before you begin configuring data collection manually from Amazon CloudWatch to Amazon S3.
Note: If you already have an Amazon S3 bucket configured with VPC flow logs that you want to use for this configuration, you do not need to perform the prerequisite steps detailed in the first two bullets.
- Ensure that you have at a minimum the following permissions in AWS for an Amazon S3 bucket and Amazon Simple Queue Service (SQS).
- Amazon S3 bucket:
GetObject - SQS:
ChangeMessageVisibility,ReceiveMessage,GetQueueAttributes, andDeleteMessage.
- Amazon S3 bucket:
-
Create a dedicated Amazon S3 bucket for collecting network flow logs with the default settings. For more information, see Creating a bucket using the Amazon S3 Console.
It is your responsibility to define a retention policy for your Amazon S3 bucket by creating a Lifecycle rule in the Management tab. We recommend setting the retention policy to at least 7 days to ensure that the data can be retrieved under all circumstances.
- Ensure that you can access your Amazon Virtual Private Cloud (VPC) and have the necessary permissions to create flow logs.
- Determine how you want to provide access to Cortex XSIAM to your logs and perform API operations. You have the following options.
- Use Workload Federated Identity to allow Cortex XSIAM's dedicated log collector service account to assume an IAM role in your AWS environment using a short-lived OIDC token, without storing any long-lived credentials. This is the Workload Federated Identity option in the Amazon S3 collection configuration and is the recommended option when available.
- Designate an AWS IAM user, where you will need to know the Account ID for the user and have the relevant permissions to create an access key/id for the relevant IAM user. This is the default option as explained in Configure the Amazon S3 collection by selecting Access Key.
- Create an assumed role in AWS to delegate permissions to a Cortex XSIAM AWS service. This role grants Cortex XSIAM access to your flow logs. For more information, see Creating a role to delegate permissions to an AWS service. This is the Assumed Role option as described in the Configure the Amazon S3 collection. For more information on creating an assumed role for Cortex XSIAM, see Create an assumed role. To collect Amazon S3 logs that use server-side encryption (SSE), the user role must have an IAM policy that states that Cortex XSIAM has kms:Decrypt permissions. With this permission, Amazon S3 automatically detects if a bucket is encrypted and decrypts it. If you want to collect encrypted logs from different accounts, you must have the decrypt permissions for the user role also in the key policy for the master account Key Management Service (KMS). For more information, see Allowing users in other accounts to use a KMS key.
- If using Workload Federated Identity, ensure you have permissions to create an AWS IAM Identity Provider and an IAM role with a trust policy in your AWS account. You will need the Cortex XSIAM service account identifier (provided in the Cortex XSIAM UI after saving the configuration) to configure the trust relationship.
Note: For resources such as Amazon S3, SQS, VPC flow logs, and event notifications, you may use the default configurations; yet, these settings remain fully customizable to meet your specific environment requirements.
Configure Cortex XSIAM to receive network flow logs from Amazon S3 manually.
- Log in to the AWS Management Console.
- From the menu bar, ensure that you have selected the correct region for your configuration.
-
Configure your Amazon Virtual Private Cloud (VPC) with flow logs. For more information, see AWS VPC Flow Logs.
If you already have an Amazon S3 bucket configured with VPC flow logs, skip this step and go to Configure an Amazon Simple Queue Service (SQS).
-
Configure an Amazon Simple Queue Service (SQS). For more information, see Configuring Amazon SQS queues (console).
Ensure that you create your Amazon S3 bucket and Amazon SQS queue in the same region.
- Configure an event notification to your Amazon SQS whenever a file is written to your Amazon S3 bucket. For more information, see Amazon S3 Event Notifications.
- Configure access keys for the AWS IAM user that Cortex XSIAM uses for API operations. For more information, see Managing access keys for IAM users.
- It is the responsibility of the customer’s organization to ensure that the user who performs this task of creating the access key is designated with the relevant permissions. Otherwise, this can cause the process to fail with errors.
- Skip this step if you are using an Assumed Role or Workload Federated Identity for Cortex XSIAM.
-
Update the Access Policy of your SQS queue and grant the required permissions mentioned above to the relevant IAM user. For more information, see Granting permissions to publish event notification messages to a destination.
Skip this step if you are using an Assumed Role or Workload Federated Identity for Cortex XSIAM.
- Configure the Amazon S3 collection in Cortex XSIAM.
- Navigate to Settings → Data Sources & Integrations.
- On the Data Sources & Integrations page, click + Add New, search for Amazon S3, then hover over it and click Add.
- Set these parameters, where the parameters change depending on whether you configured an Access Key or Assumed Role.
- To provide access to Cortex XSIAM to your logs and perform API operations using a designated AWS IAM user, leave the Access Key option selected. Otherwise, select Assumed Role, and ensure that you Create an Assumed Role for Cortex XSIAM before continuing with these instructions. In addition, when you create an Assumed Role for Cortex XSIAM, ensure that you edit the policy that defines the permissions for the role with the Amazon S3 Bucket ARN and SQS ARN.
- SQS URL: Specify the SQS URL, which is the ARN of the Amazon SQS that you configured in the AWS Management Console. For more information on how to retrieve your Amazon SQS ARN, see the Specify SQS queue field when you configure an event notification to your Amazon SQS whenever a file is written to your Amazon S3 bucket.
- Name: Specify a descriptive name for your log collection configuration.
- When setting an Access Key, set these parameters.
- AWS Client ID: Specify the Access key ID, which you received when you created access keys for the AWS IAM user in AWS.
- AWS Client Secret: Specify the Secret access key you received when you created access keys for the AWS IAM user in AWS.
- When setting an Assumed Role, set these parameters.
- Role ARN: Specify the Role ARN for the Assumed Role for Cortex XSIAM in AWS.
- External Id: Specify the External Id for the Assumed Role for Cortex XSIAM in AWS.
-
Log Type: Select Flow Logs to configure your log collection to receive network flow logs from Amazon S3. When configuring network flow log collection, the following additional field is displayed for Enhanced Cloud Protection.
You can Normalize and enrich flow logs by selecting the checkbox. When selected, Cortex XSIAM ingests the network flow logs as Cortex XSIAM network connection stories, which you can query using XQL Search from the
xdr_datasetdataset using the preset callednetwork_story.
-
Click Test to validate access, and then click Enable.
Once events start to come in, a green check mark appears underneath the Amazon S3 configuration with the number of logs received.
Amazon Web Services
You can onboard your Amazon Web Services (AWS) environment using Cloud Service Provider (CSP) or configure collecting Amazon Web Services logs using a connector (onboarded after July 26, 2026):
| Collection Method | Description |
|---|---|
| Link to full configuration Cloud Service Provider (CSP) onboarding data source instructions for Cortex XDR Premium license. | Onboard Amazon Web Services |
| Link to basic configuration Cloud Service Provider (CSP) onboarding data source instructions for Cortex XSIAM NG SIEM, Cortex XSIAM Enterprise license, and Cortex XSIAM Enterprise+ licenses. | How to onboard Amazon Web Services |
| Link to connector (onboarded after July 26, 2026) | AWS Automation and Collection |
AWS Automation and Collection
Important
This connector is only available for tenants that onboarded after July 26, 2026. For tenants that onboarded before this date, use Marketplace to access the standalone integration. For more information, see Marketplace.
Integrate with Amazon Web Services (AWS) to automate and orchestrate security operations across AWS services. This connector runs automation and remediation commands, fetches issues, collects logs and events, ingests threat intelligence indicators, and retrieves secrets across services such as EC2, IAM, GuardDuty, Security Hub, S3, Lambda, CloudTrail, CloudWatch Logs, Organizations, WAF, EKS, DynamoDB, and Secrets Manager.
This connector includes the following sub-capabilities (Marketplace integrations link to PAN DEV for more information):
- Amazon DynamoDB: This sub-capability is available with any active Cortex XSIAM or Cortex AgentiX license.
- AWS - AccessAnalyzer: Amazon Web Services IAM Access Analyzer. This sub-capability is available with any active Cortex XSIAM or Cortex AgentiX license.
- AWS - ACM: Amazon Web Services Certificate Manager Service (ACM). This sub-capability is available with any active Cortex XSIAM or Cortex AgentiX license.
- AWS - Athena - Beta: This sub-capability is available with any active Cortex XSIAM or Cortex AgentiX license.
- AWS - CloudTrail: Amazon Web Services CloudTrail. This sub-capability is available with any active Cortex XSIAM or Cortex AgentiX license.
- AWS - CloudWatchLogs: Amazon Web Services CloudWatch Logs (logs). This sub-capability is available with any active Cortex XSIAM or Cortex AgentiX license.
- AWS - EC2: Amazon Web Services Elastic Compute Cloud (EC2). This sub-capability is available with any active Cortex XSIAM, Cortex Cloud Runtime Security, or Cortex AgentiX license.
- AWS - GuardDuty: Amazon Web Services Guard Duty Service (gd). This sub-capability is available with any active Cortex XSIAM or Cortex AgentiX license.
- AWS - GuardDuty Event Collector: Amazon Web Services Guard Duty Service (gd) event collector integration for Cortex XSIAM. This sub-capability is available with any active Cortex XSIAM license.
- AWS - IAM: Amazon Web Services Identity and Access Management (IAM). This sub-capability is available with any active Cortex XSIAM, Cortex Cloud Posture Security, Cortex Cloud, Cortex Cloud Runtime Security, Cortex XDR, or Cortex AgentiX license.
- AWS - IAM Identity Center: Amazon Web Services IAM Identity Center. This sub-capability is available with any active Cortex XSIAM or Cortex AgentiX license.
- AWS - Lambda: Amazon Web Services Serverless Compute service (lambda). This sub-capability is available with any active Cortex XSIAM or Cortex AgentiX license.
- AWS - Organizations: Manage Amazon Web Services accounts and their resources. This sub-capability is available with any active Cortex XSIAM or Cortex AgentiX license.
- AWS - Route53: Amazon Web Services Managed Cloud DNS Service. This sub-capability is available with any active Cortex XSIAM or Cortex AgentiX license.
- AWS - S3: Amazon Web Services Simple Storage Service (S3). This sub-capability is available with any active Cortex XSIAM or Cortex AgentiX license.
- AWS - Security Hub: Amazon Web Services Security Hub Service. This sub-capability is available with any active Cortex XSIAM or Cortex AgentiX license.
- AWS - SNS: Amazon Web Services Simple Notification Service (SNS). This sub-capability is available with any active Cortex XSIAM or Cortex AgentiX license.
- AWS - SQS: Amazon Web Services Simple Queuing Service. This sub-capability is available with any active Cortex XSIAM or Cortex AgentiX license.
- AWS - System Manager: AWS Systems Manager is the operations hub for your AWS applications and resources and a secure end-to-end management solution for hybrid cloud environments that enables safe and secure operations at scale. This sub-capability is available with any active Cortex XSIAM or Cortex AgentiX license.
- AWS Feed: This sub-capability is available with any active Cortex XSIAM or Cortex AgentiX license.
- AWS Network Firewall: AWS Network Firewall is a stateful, managed network firewall and intrusion detection and prevention service for Amazon Virtual Private Cloud (Amazon VPC). This sub-capability is available with any active Cortex XSIAM or Cortex AgentiX license.
- AWS Sagemaker: AWS Sagemaker - Demisto Phishing Email Classifier. This sub-capability is available with any active Cortex XSIAM or Cortex AgentiX license.
- AWS Security Hub Event Collector: An XSIAM event collector integration for AWS Security Hub. This sub-capability is available with any active Cortex XSIAM license.
- AWS Security Lake: Amazon Security Lake is a fully managed security data lake service. This sub-capability is available with any active Cortex XSIAM or Cortex AgentiX license.
- AWS-EKS: The AWS EKS integration allows for the management and operation of Amazon Elastic Kubernetes Service (EKS) clusters. This sub-capability is available with any active Cortex XSIAM or Cortex AgentiX license.
- AWS-ILM: Integrate with AWS's services to execute CRUD and Group operations for employee lifecycle processes. This sub-capability is available with any active Cortex XSIAM or Cortex AgentiX license.
- AwsSecretsManager: AWS Secrets Manager helps you to securely encrypt, store, and retrieve credentials for your databases and other services. This sub-capability is available with any active Cortex XSIAM or Cortex AgentiX license.
- AWS-SNS-Listener: Amazon Simple Notification Service (SNS) is a managed service that provides message delivery from publishers to subscribers. This sub-capability is available with any active Cortex XSIAM or Cortex AgentiX license.
- AWS-WAF: Amazon Web Services Web Application Firewall (WAF). This sub-capability is available with any active Cortex XSIAM or Cortex AgentiX license.
To configure this connector, follow the steps outlined in the configuration wizard.
Anomali
Anomali
Important
This connector is only available for tenants that onboarded after July 26, 2026. For tenants that onboarded before this date, use Marketplace to access the standalone integration. For more information, see Marketplace.
Integrate with Anomali products. Anomali ThreatStream is a leading threat intelligence platform designed to help organizations collect, analyze, and act on vast amounts of threat data. Use Anomali Match to search indicators and enrich domains, use the ThreatStream Feed to automatically fetch Indicators of Compromise (IOCs) such as IPs, domains, URLs, and file hashes, and use ThreatStream v3 to query and submit threats.
This connector includes the following sub-capabilities (Marketplace integrations link to PAN DEV for more information):
- Anomali Enterprise: Use Anomali Match to search indicators and enrich domains. This sub-capability is available with any active Cortex XSIAM or Cortex AgentiX license.
- Anomali ThreatStream Feed: Use the Anomali ThreatStream Feed Integration to fetch indicators from the Anomali ThreatStream. This sub-capability is available with any active Cortex XSIAM, Cortex Cloud Posture Security with the Application Security Posture Management (ASPM) module, Cortex Cloud, Cortex Cloud Runtime Security, Cortex XDR, or Cortex AgentiX license with the Attack Surface Management (ASM), Exposure Management, or Threat Intel Management (TIM) add-on.
- Anomali ThreatStream v3: Use Anomali ThreatStream to query and submit threats. This sub-capability is available with any active Cortex XSIAM or Cortex AgentiX license.
To configure this connector, follow the steps outlined in the configuration wizard.
Anthropic
Claude Automation and Collection
Important
This connector is only available for tenants that onboarded after July 26, 2026. For tenants that onboarded before this date, use Marketplace to access the standalone integration. For more information, see Marketplace.
This connector is available with any active Cortex XSIAM or Cortex AgentiX license.
Integrate with Anthropic Claude to assist security professionals with investigations, threat hunting, and anomaly detection using Claude's natural language conversational capabilities. Send messages to Claude models and receive AI-generated responses, analyze email headers and bodies for security threats, and generate SOC email templates.
This connector includes the following sub-capabilities (Marketplace integrations link to PAN DEV for more information):
- Anthropic Claude: Designed to assist security professionals with security investigations, threat hunting, and anomaly detection, leveraging Anthropic Claude's natural language conversational capabilities.
To configure this connector, follow the steps outlined in the configuration wizard.
Claude
The capabilities and sub-capabilities listed for this connector are available with any active Cortex XSIAM, Cortex Cloud Posture Security, Cortex Cloud Runtime Security, or Cortex Data Security license.
Scan sensitive content and monitor data security risks for Anthropic Claude AI.
This connector includes the following capabilities and sub-capabilities (if applicable):
- Data Security: Scan and protect data across the Claude service
- Identity Posture: Maintain visibility and control over Claude identities, including users, groups, roles, and granular permissions.
To configure this connector, follow these steps:
Prerequisite
Sign in to your Anthropic Claude organization as a Primary Owner and generate a Compliance API key.
1. Enable Compliance API access
- Sign in to the Claude.ai console using an account with Primary Owner privileges.
- Click Settings in the left navigation menu, and select Organization Settings.
- In Organization Settings, select the API tab.
- Verify that the Compliance API option is enabled.
2. Generate a Compliance API key and assign scopes
- On the API tab, locate the Keys section and click + Create Key.
- Enter a name for the API key.
- Under Scopes, select the required scopes:
read:compliance_activities— Read compliance activity logs and audit trails.read:compliance_org_data— Read organization-level workspace metadata and asset definitions.read:compliance_user_data— Read user identities, group memberships, and role assignments.delete:compliance_user_data— Allow programmatic purging or remediation of non-compliant sensitive data.
- Click Create.
-
Copy the generated API key and store it securely.
Note: You cannot retrieve the API key after you close the dialog.
How to configure the Claude connector
Task 1. Select services
- In Cortex Cloud, navigate to Settings → Data Sources & Integrations.
- Click + Add new.
- On the Add Data Source page, search for Claude, hover over it, and click Add.
In the Configuration Wizard, configure the following settings.
Capabilities tab
- Enter a unique name for the new connector instance.
-
Under Select Capabilities, select the capabilities that you want to enable.
- Data Security to enable scanning and inventory collection across the selected repositories.
- Identity Posture to maintain visibility and control over SaaS-based identities, including users, groups, roles, and granular permissions.
Note: Identity Posture is automatically enabled when Data Security is selected and cannot be disabled during setup. Identity Posture is required for user and group validation and cross-tenant exposure analysis.
- Click Next.
Connection tab
- On the Connection tab, select your preferred authentication method:
- Recommended: Paste your Anthropic Claude organization API key into the API key field.
- Advanced: Select this option if your enterprise security policy requires separate authentication tokens for Data Security and Identity Posture.
- Click Test to validate the connection.
- If the connection is successful, the wizard displays a green Verified status indicator.
- Click Save to save the connection settings.
- Click Next.
Summary tab
- On the Summary tab, verify that each selected capability displays a Connected status.
- If validation succeeds, the wizard displays a Verification Success message.
- Click Create Instance to create the Claude connector.
Task 2. Post verification
After configuration is complete, verify asset discovery and data security findings.
1. Verify discovered assets
- Go to Inventory > All Assets.
- Filter the asset list by setting Provider to Anthropic.
- Verify that Cortex discovers the following supported asset types:
- Claude Personal Workspace: Individual user conversations, chat history, and associated metadata.
- Claude Project: Shared workspaces, custom prompt instructions, and attached knowledge repositories.
2. Verify policy findings
- Select an asset to open the details panel.
- Click the Overview tab to review general properties and total finding counts.
- Click Findings or navigate to the Compliance tabs to review detected security findings, such as:
- Personally identifiable information (PII)
- API keys or secrets
- Credit card numbers
- Unauthorized data sharing
Apache
Apache
Important
This connector is only available for tenants that onboarded after July 26, 2026. For tenants that onboarded before this date, use Marketplace to access the standalone integration. For more information, see Marketplace.
This connector is available with any active Cortex XSIAM or Cortex AgentiX license.
Integrate with ActiveMQ to send and read messages on queues and topics, and to fetch messages from a queue or topic and create issues in Cortex XSIAM per message.
This connector includes the following sub-capabilities (Marketplace integrations link to PAN DEV for more information):
- ActiveMQ: Integration with ActiveMQ queue.
To configure this connector, follow the steps outlined in the configuration wizard.
API Security
You can configure retrieving and collecting API data for further analysis by Cortex's comprehensive API Security capabilities using the following standard data sources:
AWS API Gateway vendor
| Collection Method | Description |
|---|---|
| Standard data source overview | Integrate AWS API Gateway with the Cortex XSIAM AWS API Gateway data source to begin scanning the APIs for potential threats and vulnerabilities. |
| Link to standard data source instructions | Ingest AWS API Gateway |
Azure APIM vendor
| Collection Method | Description |
|---|---|
| Standard data source overview | Send HTTP request/response data to Cortex XSIAM using the Azure APIM data source. |
| Link to standard data source instructions | Ingest Azure APIM |
F5 vendor
| Collection Method | Description |
|---|---|
| Standard data source overview | Integrate a dedicated F5 log plugin to enable seamless traffic ingestion from your F5 Gateway to Cortex XSIAM, allowing for comprehensive security measures, such as OWASP Top-10, bot detection, access control, and more. |
| Link to standard data source instructions | Ingest-F5 |
GCP Apigee Proxy vendor
| Collection Method | Description |
|---|---|
| Standard data source overview | Integrate Apigee Proxy with Cortex XSIAM to begin scanning the APIs for potential threats and vulnerabilities using the Apigee’s JavaScript (JS) policy. |
| Link to standard data source instructions | Ingest Apigee Proxy |
Kong vendor
| Collection Method | Description |
|---|---|
| Standard data source overview | Integrate a dedicated Kong HTTP log plugin to enable seamless traffic ingestion from your Kong API gateway to Cortex XSIAM, allowing for comprehensive security measures, such as OWASP Top-10, bot detection, access control, and more. |
| Link to standard data source instructions | Ingest Kong |
Ingest data for API security
Configure the settings in both Cortex XSIAM and your cloud service provider to retrieve and collect API data for further analysis by Cortex's comprehensive API security capabilities that provides a transparent view of API traffic, helping to identify potential security threats.
Ingest AWS API Gateway
Integrate AWS API Gateway with Cortex XSIAM to begin scanning the APIs for potential threats and vulnerabilities.
Settings in Cortex XSIAM
In Cortex XSIAM, set up the AWS API Gateway data source to integrate with the AWS API Gateway.
- From Settings → Data Sources, click Add Data Source and search for AWS API Gateway and then click Connect or Connect Another Instance.
- In the AWS API Collector wizard, enter a relevant name and click Create and Proceed.
- Copy the key and save it for later.
You must generate a new key if you did not save it.
- Click Close.
Settings in AWS Management Console
Configure the settings in the AWS Management Console to integrate with Cortex XSIAM:
- Log in to the AWS Management Console.
- In AWS Management Console, navigate to API Gateway.
- Expand the left-hand menu of the API project.
- Go to Settings → Logging and click Edit. Verify that the CloudWatch log role ARN is filled.
- Click Stages and from Stages, select the relevant stage.
- From Logs and Tracing, click Edit and configure the following:
- CloudWatch Logs: Select Errors and info logs
- Select Data tracing
- Select Detailed metrics
-
Click Save.
This creates a unique log group inside CloudWatch.
- Open CloudWatch in another window by typing CloudWatch in the search bar.
-
Go to Logs → Log groups and search for the log group just created.
The group name follows the following format:
“API-Gateway-Execution-Logs_<gw ID>/<stage name>” -
Click the log group, and from the Log group details, copy the ARN.
-
-
Return to Edit logs and tracing, go to enable the custom access logging , and paste the ARN without the * in the Access log destination ARN field.
ARN:
arn:aws:logs:us-east-1:123456789012:log-group:API-Gateway-Execution-Logs_153tp249k2/Prod:*Paste in Access log destination ARN:
arn:aws:logs:us-east-1:123456789012:log-group:API-Gateway-Execution-Logs_153tp249k2/Prod -
In Log format, type the following and click Save:
($context.requestId) accountId: $context.accountId; requestTime: $context.requestTime; path: $context.path
- Click Create Firehose stream.
- Configure the following:
- Source: Direct PUT
- Destination: HTTP Endpoint
- Firehose stream name: Add a relevant name.
- In Destination settings, configure the following:
- HTTP endpoint URL : Add the API URL from Cortex XSIAM.
- Authentication: Select Use access key.
- Access key: Paste the generated token from AWS API Gateway.
- Content encoding: Select GZIP.
- In Backup settings, configure the following:
- Source record backup in Amazon S3: select Failed date only.
- S3 backup bucket: select a bucket or enter a bucket URI.
-
Click Create.
It takes up to 5 minutes for the stream to be activated.
- Configure the following:
-
Refer to Subscription filters with Amazon Data Firehose. To create an IAM Role and provide CloudWatch with the appropriate permissions for the streaming, refer to steps 8-11.
After the Data Firehose delivery stream is active and you have created the IAM role, you can create the CloudWatch Logs subscription filter. The subscription filter immediately starts the flow of real-time log data from the chosen log group to your Amazon Data Firehose delivery stream:
aws logs put-subscription-filter \ --log-group-name "<YOUR_LOG_GROUP_NAME>" \ --filter-name "<any_filter_name>" \ --filter-pattern "" \ --destination-arn "arn:aws:firehose:region:123456789012:deliverystream/<YOUR_DELIVERY_STREAM>" \ --role-arn "arn:aws:iam::<ACCOUNT_ID>:role/<YOUR_IAM_ROLE>"
Important
Leave –filter-pattern empty as displayed above.
After you create the filter, go back to Data Sources → AWS API Gateway to see the logs starting to come in.
If no logs are showing, send some API requests using Postman or cURL.
Ingest Azure APIM
Integrate Azure APIM with Cortex XSIAM to start scanning its APIs for potential threats and vulnerabilities.
You need to set up a policy that enables you to customize the behavior of managed APIs. You can configure the sending of HTTP request/response data to Cortex XSIAM. The data is saved and analyzed by API security modules, which provide information on the security risks associated with the APIs.
Note
Microsoft Azure APIM service must be running before starting to configure the integration.
Settings in Cortex XSIAM
In Cortex XSIAM, set up the Azure API Management data source to integrate with the Azure API Gateway.
- From Settings → Data Sources & Integrations, click + Add New, search for Azure API Management, then hover over it and click Add or Add Instance.
- In the APIM Collector wizard, enter a relevant name and then click Create and Proceed.
- Copy the key and paste it somewhere so that you can access it for later. If you forget to record the key and close the window, you must generate a new key and repeat this process.
- Click Close.
Settings in Azure APIM policy
Configure an inbound and outbound policy to send HTTP traffic data of the APIs to Cortex XSIAM. You can configure a policy for individual operations (endpoints) or all operations of a single API.
Follow the steps to configure the policy.
- Log in to Microsoft Azure.
- Go to API Management services and select the relevant service.
- From the left-hand menu, select APIs → Named values.
Note
From the URL, save the UUID and the resource group - /resource/subscriptions/<UUID>/resourceGroups/<ResourceGroup>.
The UUID is the Azure account/subscription ID and the resource group, which is the group where the APIM Service is defined.
- Configure the settings in each section. Follow the listed order.
Note
Use search to navigate to each section.
Named values: Add these values:
- cloud-account-id
- Type: Plain
- Value: The UUID you saved from the previous step.
- cloud-resource-group
- Type: Plain
- Value: The resource group you saved from the previous step.
- cortex-api-key
- Type: Secret
- Value: The token that you saved from data sources in Cortex.
- cortex-api-url
- Type: Plain
- Value: The API URL from data sources in Cortex.
- cortex-http-body-size-limit-bytes
- Type: Plain
- Value: 131072
Note
131072 bytes = 128 KB. This value determines the size (in bytes) of request and response bodies to send to Cortex. Any bytes beyond this limit are truncated.
APIs: From the left-hand menu, go to APIs → APIs.
- You can create a policy on a specific API or choose to create a policy on all APIs.
-
From Inbound Processing, click .
The Policies screen opens. There are three sections:
<inbound><backend><outbound>
The
<inbound>includes the request before it's sent to the<outbound>. The parameters are saved before they're sent.Add the following inside the
<inbound>:<!-- Save the request body and headers to be sent to Cortex. This should always be placed at the very beginning of the inbound element. --> <set-variable name="requestBody" value="@((context.Request?.Body?.As<string>(preserveContent: true)) ?? string.Empty)" /> <set-variable name="requestHeaders" value="@(JsonConvert.SerializeObject(context.Request.Headers))" /> <!-- End of setting variables for sending to Cortex --><!-- Save the request body and headers to be sent to Cortex. This should always be placed at the very beginning of the inbound element. --> <set-variable name="requestBody" value="@((context.Request?.Body?.As<string>(preserveContent: true)) ?? string.Empty)" /> <set-variable name="requestHeaders" value="@(JsonConvert.SerializeObject(context.Request.Headers))" /> <!-- End of setting variables for sending to Cortex -->Note
If any other inbound policies should be added, they must be added after these elements.
\
The<outbound>includes the request before it returns a response.\
Add the following inside the <outbound> element, at the end, after the other child elements:<!-- Send data to Cortex. This should always be placed at the very end of the outbound element. --> <send-request mode="new" response-variable-name="mirrorMessage"> <set-url>{{cortex-api-url}}</set-url> <set-method>POST</set-method> <set-header name="Content-Type" exists-action="override"> <value>application/json</value> </set-header> <set-header name="Authorization" exists-action="override"> <value>{{cortex-api-key}}</value> </set-header> <set-body>@{ string requestBody = context.Variables.GetValueOrDefault<string>("requestBody"); string responseBody = context.Response.Body.As<string>(preserveContent: true); int bodySizeLimit = {{cortex-http-body-size-limit-bytes}}; bool requestBodySizeExceedsLimit = requestBody.Length > bodySizeLimit; bool responseBodySizeExceedsLimit = responseBody.Length > bodySizeLimit; return JsonConvert.SerializeObject(new { accountId = "{{cloud-account-id}}", serviceId = context.Deployment.ServiceId, requestId = context.RequestId, url = context.Request.OriginalUrl, httpMethod = context.Request.Method, requestBody = requestBodySizeExceedsLimit ? requestBody.Substring(0, bodySizeLimit) : requestBody, requestBodyTruncated = requestBodySizeExceedsLimit, requestHeaders = JsonConvert.DeserializeObject(context.Variables.GetValueOrDefault<string>("requestHeaders")), timestamp = new DateTimeOffset(context.Timestamp).ToUnixTimeMilliseconds(), requestIpAddress = context.Request.IpAddress, statusCode = context.Response.StatusCode, responseBody = responseBodySizeExceedsLimit ? responseBody.Substring(0, bodySizeLimit) : responseBody, responseBodyTruncated = responseBodySizeExceedsLimit, responseHeaders = context.Response.Headers, region = context.Deployment.Region, subscription = context.Subscription, }); } </set-body> </send-request> <!-- End of sending data to Cortex -->Important
If you want to add additional data to the <outbound>, add it at the start of the <outbound> code.
3. Click Save. Your APIM traffic collection is now configured. Request and response data for the configured endpoints are sent to Cortex XSIAM for inspection by API security modules.
5. Go to Azure API Management data source to validate that data is ingested from Azure APIM.
6. Do the following to remove the integration of Azure APIM with Cortex XSIAM:
- Remove the snippets you added to the policies.
- Remove the named values from the API service.
- Delete the HTTP log collector from Data Sources & Integrations in Cortex.
Ingest Apigee Proxy
Integrate Apigee Proxy with Cortex XSIAM to begin scanning the APIs for potential threats and vulnerabilities.
The integration uses the Apigee’s JavaScript (JS) policy, implemented within a shared flow and deployed as a pre-proxy and post-proxy flow-hook in selected environments. The JS policy is designed to capture both request and response data from all traffic entering and exiting the proxy.
Settings in Cortex XSIAM
In Cortex XSIAM, set up the Apigee data source to integrate with the Apigee Gateway.
- From Settings → Data Sources & Integrations, click +Add New, search for Apigee, then hover over it and click Add or Add Instance.
- In the Apigee Collector wizard, enter a relevant name and then click Create and Proceed.
- Copy the key and paste it somewhere so that you can access it for later. If you forget to record the key and close the window, you must generate a new key and repeat this process.
- Click the Download Configuration Script link to download the plugin, which you can then upload from the Apigee Gateway.
- Click Close.
First, download the resource file and then select the method to set up the integration with Apigee.
Run an automated script to deploy configurations to Apigee
Use the script for full deployment (with or without connecting a flow hook).
Note: The following steps cover prerequisites for automated deployment. For manual configuration, refer to Manual deployment.
-
Edit
deploy.shand add values for the following:Variable Description PROJECT_ID Google project ID where Apigee is provisioned. ORG Apigee organization. By default, this is the same as PROJECT_ID. ENV In Apigee, from the left-side menu, click Environments and copy the name of the environment you want to use. TARGET_URL Copy the URL for your Apigee Collector from the Custom Collectors page. For example, https://api-{tenant external URL}/logs/v1/event.APIsec_API_KEY Token generated from Cortex XSIAM. -
Check that the GCP user running the script has
IAMpermissions.apigee.resourcefiles.list apigee.resourcefiles.create apigee.resourcefiles.update apigee.sharedflows.get apigee.sharedflows.create apigee.deployments.create apigee.sharedflowrevisions.deploy apigee.flowhooks.attachSharedFlow apigee.keyvaluemaps.create apigee.keyvaluemaps.delete apigee.keyvaluemapentries.create
-
Run the
deploy.shscript:chmod +x ./deploy.sh
-
Verify that the JavaScript policies have been added to the shared flows:
Go to Apigee → Proxy development → Shared Flows and check that the following policies have been added.
sf-api-sec-extension-postflowsf-api-sec-extension-preflow
-
Validate data ingestion:
Send a request to the gateway and go to the Apigee data source to validate that the data has been received from Apigee.
- (Optional) Exclude unwanted domains from being tracked by APIsec:
- Uncomment: DOMAIN_EXCLUSION_LIST.
- Add the domains to exclude.
-
Edit
deploy.shand set the following variables:export DOMAIN_EXCLUSION_LIST="domain1,domain2"
- Discontinue the integration:
-
Edit
undeploy.sh:export PROJECT_ID=example-project-id export ORG=$PROJECT_ID export ENVIRONMENT=example-env
-
Run the undeploy.sh script:
chmod +x ./undeploy.sh
Go to Apigee → Proxy development → Shared Flows and check that the following policies have been removed.
sf-api-sec-extension-postflowsf-api-sec-extension-preflow
-
Configure Apigee's JavaScript for manual deployment
You can customize the shared flow and apply it to an existing flow hook (pre-proxy, post-proxy).
Set up Apigee's JavaScript policy to send Apigee Collector's API data to Cortex XSIAM.
Note: If you have an existing hookand would like to integrate with the shared flow, run the deploy.sh script, and select n' and exit at the prompt to create a new hook. Refer to the section Connect to existing hook.
- Edit
panw-api-sec-extension-configuration.propertiesfile:- Enter the
targetUrlandprojectID. - You can update 127KB of
maxBodyInspectionSizeKB. -
For domain exclusion, uncomment the line and add the URL to exclude.
targetUrl=<Cortex collector url> projectID=<GCP project id of apigee> maxBodyInspectionSizeKB=127 // This is default and can be modified if needed. commonBinaryContentType=audio/,video/,image/, application/octet-stream,application/ogg,application/ pdf,application/zip,application/gzip,application/ vnd.rar,application/x-7z-compressed #domainExclusionList=example.com,example2.com/shopping
- Enter the
- Upload the edited
property set:-
Get a token to upload updates via an API request. For more information, refer to property sets.
Input:
gcloud config config-helper --force-auth-refresh --format
Output:
configuration: active_configuration: properties: compute: region: zone: core: account: disable_usage_reporting: project: credential: access_token: <Copy this value> id_token: token_expiry: sentinels: config_sentinel: -
Copy the
<access_token>value from the output.
-
-
Upload the
property setto Apigee:curl --silent -X GET "https://apigee.googleapis.com/v1/organizations/ <ORG>/environments/<ENVIRONMENT>/resourcefiles/ properties" -H "Authorization: Bearer <access_token from above>"
-
Generate Key Value Map (KVM), which stores the Cortex API key that's encrypted
curl --silent -X POST "https://apigee.googleapis.com/v1/organizations/ <ORG>/environments/<ENVIRONMENT>/keyvaluemaps" -H "Authorization: Bearer <access_token from above>" -H "Content-Type: application/json" --data-raw '{"name": "'"APISec-KVM"'", "encrypted": true}'
If there's an error when creating the KVM because of an existing name, delete the KVM and recreate.
curl --silent -X DELETE "https://apigee.googleapis.com/v1/organizations/ <ORG>/environments/<ENVIRONMENT>/keyvaluemaps/ $APISEC_KVM_NAME" -H "Authorization: Bearer <access_token from above>"
Add the Cortex API key entry to the created KVM.
curl --silent -X POST "https://apigee.googleapis.com/ v1/organizations/<ORG>/environments/<ENVIRONMENT>/ keyvaluemaps/$APISEC_KVM_NAME/entries" -H "Authorization: Bearer <access_token from above>" -H "Content-Type: application/json" --data-raw '{"name": "api-key","value": "'"<Generated key from cortex env>"'"}'
-
Upload the shared flows:
Shared flows:
sf-api-sec-extension-postflowsf-api-sec-extension-preflow
Upload
Replace the
<sf>with the shared flows:curl --silent -X POST --data-binary "<sf>.zip" -H "Content-Type: application/octet-stream" -H "Authorization: Bearer <access_token from above>" "https://apigee.googleapis.com/v1/organizations/$ORG/ sharedflows?action=import&name=<sf>"
Deploy
Input:
curl --silent -X GET "https://apigee.googleapis.com/ v1/organizations/<ORG>/sharedflows/<sf>" -H "Authorization: Bearer <access_token from above>"
Output:
{ "metaData": { "createdAt": "1736952161610", "lastModifiedAt": "1736952161610", "subType": "SharedFlow" }, "name": "sf-api-sec-extension-postflow", "revision": [ "1" // This is the revision number ], "latestRevisionId": "1" }
-
Deploy
<sf>:curl --silent -X POST -H "Authorization: Bearer <access_token from above>" "https://apigee.googleapis.com/ v1/organizations/$ORG/environments/<ENVIRONMENT>/ sharedflows/$sf/revisions/<REVISION>/ deployments?override=true"
-
Verify API security shared flows were created:
Go to Apigee → Proxy development → Shared Flows and check that the following policies have been added.
sf-api-sec-extension-postflowsf-api-sec-extension-preflow
Connect to an existing hook
Follow the steps if you have an existing hook and would like to integrate with a shared flow.
- Check for existing flow hooks.
- Go to Apigee → Management → Environments and select the environment to hook the shared flow.
- In the Flow Hooks tab, select the relevant flow hook.
-
Configure the policy for the shared flow to the existing hook.
-
Go to Apigee → Proxy development → Shared Flows and select the flow hook from the relevant environment.
Note: Start with the hook in pre-proxy.
- From the Develop tab, expand Policies and select Flow Callout.
- Enter a meaningful name and select the Sharedflow:
sf-api-sec-extension-preflow, and then click Create. - From the Develop tab, select Shared flows and expand Default.
- From Select policy, select Select existing policy, and select the policy just created and then click Add.
- Repeat the previous steps for the post-proxy hook. Select the Sharedflow:
sf-api-sec-extension-postflow. - Click Save and Deploy.
The steps automatically run without linking to the hooks.
Important: This should only be done when there are already existing hooks, and API security shared flows can't be hooked as a standalone. Run the deployment script, but skip step 9 by passing
n. This step publishes API security shared flows to the desired Apigee environment without setting them to flow hooks. -
Limitations:
-
The API security extension deployment scripts currently do not support archive-deployment Apigee environments. Refer to Manage archive deployment for more information.
Archive deployments are currently in preview and are subject to change.
- The API security extension for Apigee relies on flow-hooks, which are available only with Intermediate or Comprehensive Apigee Environment types. Refer to Environments for more information.
- For requests/responses with binary payloads, the binary payload is not sent to the collector for analysis; only the metadata (for example, HTTP headers, query parameters, etc.) is sent.
Ingest Kong
Integrate Kong with Cortex XSIAM to start scanning its APIs for potential threats and vulnerabilities.
You need to integrate a dedicated Kong HTTP log plugin. This plugin enables seamless traffic ingestion from your Kong API gateway to Cortex XSIAM, allowing for comprehensive security measures such as OWASP Top-10, bot detection, access control, and more.
Settings in Cortex XSIAM
In Cortex XSIAM, set up the Kong data source to integrate with the Kong API Gateway.
- From Settings → Data Sources & Integrations, click + Add New, search for Kong, then hover over it and click Add or Add Instance.
- In the Kong Collector wizard, enter a relevant name and then click Create and Proceed.
- Copy the key and paste it somewhere so that you can access it later. If you forget to record the key and close the window, you must generate a new key and repeat this process.
- Click the Download Custom Plugin link to download the plugin, which you can then upload from the Kong API Gateway.
- Click Close.
Follow the steps to integrate Kong's API gateway with Cortex XSIAM.
Download the Cortex custom plugin
Download the custom plugin gzip file. The file includes the handler.lua, utils.lua, and schema.lua files that make up the custom plugin.
Note
Contact support to obtain the custom plugin file.
Provision Kong API gateway with the custom plugin
To deploy the custom plugin, refer to the Kong API documentation online:
Example
-
Add the plugin by mounting the plugin directory, adding it to the
Luapackage path variable, and then adding the plugin name to Kong’s plugin list variable.This can be done by passing the following arguments to the
docker runcommand, assuming./plugin_directory/kongis the directory containing theplugins/panw-apisec-http-log/ directory.-v "./plugin_directory/kong:/tmp/custom_plugins/kong" \ -e "KONG_LUA_PACKAGE_PATH=/tmp/custom_plugins/?.lua;;" \ -e "KONG_PLUGINS=bundled,panw-apisec-http-log"
You may want to adjust the size of the nginx body buffer, which is used by Kong internally. This size sets the upper limit on the amount of HTTP body bytes that can be mirrored by the plugin. By default, this value is 8192 bytes (8 KB). To change it, another argument can be passed to Docker - for example, setting it to 128 KB:
-e "KONG_NGINX_HTTP_CLIENT_BODY_BUFFER_SIZE=128k"
See https://nginx.org/en/docs/syntax.html for information on the allowed values of this variable.https://nginx.org/en/docs/syntax.html for information on the allowed values of this variable. For information on the allowed values of this variable.
Important
The size of the buffer must be equal or larger than the max body size setting in the plugin configuration, on every data plane node.
-
To verify that the plugin is installed, query Kong’s Admin API using the following command:
curl admin-api-hostname:8001 | jq .configuration.loaded_plugins.'"panw-apisec-http-log"'This prints true to the terminal if the plugin is loaded into the Kong instance.
Add and configure the custom plugin
Add and configure the plugin.
- From the Kong Manager menu, go to Plugins.
- From the Plugins page, scroll down to the Custom Plugins section.
-
Select panw-apisec-http-log and click Edit to configure the panw-apisec-http-log plugin settings.
Configuration Description Example Protocols The request protocols the plugin will be applied to. Either http, https, or both Cloud Context Cloud context, such as AWS Account ID, GCP Project ID, Azure Subscription or an appropriate value for on-prem. 987654321000 Cloud Provider Cloud provider where Kong API Gateway is installed. AWS. Cloud Region Cloud region. us-east-2 Cloud API Key The collector authorization key provided by the Cortex platform. HTTP Endpoint The Cortex collector's endpoint URL. -
Click the View Advanced Parameters to configure optional settings.
Note
The queue parameters can be updated to change when the plugin mirrors data to Cortex.
Configuration Description Example Instance Name A custom name for this plugin instance. This is useful when applying different instances to different scopes. Empty Tags <p>An optional set of strings for grouping and filtering.</p><div data-gb-custom-block data-tag="hint" data-style="info" class="hint hint-info"><p>Note</p><p>Use commas to separate tags.</p></div> Empty Keepalive An optional value in milliseconds that defines how long an idle connection will live before being closed. 60000 (60 seconds) Timeout An optional timeout in milliseconds when sending data to Cortex. 10000 (10 seconds) Max body size The maximum body size to mirror in bytes (for example: 1024 is 1KB). Any bytes beyond this size are omitted from the request and response bodies. Must be <= 4 MB and <= the value of Kong's nginx_http_client_body_buffer_size setting. 131072 (128 KB), or the nginx body buffer size if it’s smaller. Queue Concurrency Limit The number of queue delivery timers. -1 indicates unlimited. 1 Queue.Initial Retry Delay Time in seconds before the initial retry is made for a failing batch. 0.01 (10 milliseconds) Queue.Max Batch Size Maximum number of entries that can be processed at a time. 1 Queue.Max Bytes Maximum number of bytes that can be waiting in a queue, requires string content Unlimited Queue.Max Coalescing Delay Maximum number of (fractional) seconds to elapse after the first entry was queued before the queue starts calling the handler. 1 Queue.Max Entries Maximum number of entries that can be waiting in the queue. 10000 Queue.Max Retry Delay Maximum time in seconds between retries, caps exponential backoff. 60 Queue.Max Retry Time Time in seconds before the queue gives up calling a failed handler for a batch. 60 - Go to Kong data source to validate that data is ingested from the Kong API Gateway.
Limitations
- The plugin supports HTTP and HTTP/S protocols.
- The plugin supports Kong API Gateway version 3.4.x and above.
- The nginx body buffer size on each data plane node must be equal or larger than the max body size setting.
- Request and response bodies will not be mirrored if their size exceeds the nginx body buffer size. When this occurs, it is indicated in the metadata that is sent to Cortex along with the HTTP transaction data.
- The mirrored response body is the body returned from the upstream service. This means that changes made to the response body by other plugins are not reflected in the mirrored data.
Ingest F5
Integrate F5 with Cortex XSIAM to start scanning its APIs for potential threats and vulnerabilities.
You need to integrate a dedicated F5 log plugin. This plugin enables seamless traffic ingestion from your F5 gateway to Cortex XSIAM, allowing for comprehensive security measures such as OWASP Top-10, bot detection, access control, and more.
Settings in Cortex XSIAM
In Cortex XSIAM, set up the F5 data source to integrate with the F5 API Gateway.
- From Settings → Data Sources & Integrations , click + Add New, search for F5 BIG-IP LTM , then hover over it and click Add or Add Instance.
- In the F5 BIG-IP LTM Collector wizard, enter a relevant name and then click Create and Proceed.
- Copy the key and paste it somewhere so that you can access it for later. If you forget to record the key and close the window, you must generate a new key and repeat this process.
- Click the Download iRules LX Plugin link to download the plugin to upload it from the F5 Gateway.
- Click Close.
Settings in F5 BIG-IP LTM
- Log in to your F5 environment.
- Verify that the following is configured: Navigate to System → Resource Provisioning and enable iRules Language Extensions (iRulesLX) . Check Provisioning and set to Nominal.
-
Navigate to Local Traffic → iRules → LX Workspaces and follow the steps under the relevant tab:\
LX Workspaces:-
Click Import. In the General Properties page, enter a Name and for Source, select apisec_bigip_plugin_tar.gz.
Extract the F5 plugin files into a folder before uploading them to F5.
- In the General Properties page, enter:
- Name: Enter the name panw_apisec_workspace.
- Source: Select apisec_bigip_plugin_tar.gz.
- Select Import to import the plugin.
LX Plugins:
- Click Create.
- In the General Properties page, enter:
- Name: Enter panw_apisec_plugin.
- From Workspace: Select panw_apisec_workspace.
- Click Finished.
-
- Navigate to System → File Management → Data Group File List → Import.
- From File Name, select the panw_apisec_config.txt file that was extracted from the zip that was downloaded from Cortex XSIAM.
- In the Name field, select Create New and enter panw_apisec_config.
- From File Contents, select String.
- For Data Group Name, enter panw_apisec_config.
- Click Import.
- Navigate to System → File Management → Data Group File List.
- Click panw_apisec_config.
-
In Definition, fill in the values for the following:
"context_account_id" := "", "context_provider" := "", "context_region" := "", "cortex_collector_key" := "", "cortex_collector_url" := "",
- Paste the F5 VIG-IP LTM Collector key you copied from Cortex XSIAM in the
"cortex_collector_key". -
From Cortex XSIAM, go to Data Sources & Integrations and from F5 BIG_IP LTM , copy the API URL and paste it in the
"cortex_collector_url". -
The
context_account_id,context_provider, andcontext_regiondepend on the cloud environment. In this instance, AWS is the example:- The provider for
"context_provider"should always be uppercase. - Supported providers: AWS, GCP, Azure, On-prem.
"context_account_id" := "12345", "context_provider" := "AWS", "context_region" := "us-east-2", "cortex_collector_key" := "collector key", "cortex_collector_url" := "API URL",
- The provider for
- Click Update.
- Paste the F5 VIG-IP LTM Collector key you copied from Cortex XSIAM in the
- Navigate to Local Traffic → Virtual Servers → Virtual Server List. The virtual server functions as an API Gateway, handling all incoming and outgoing requests and responses, then forwarding that data to the Cortex XSIAM collector.
- From the virtual server that serves as the gateway, click Edit.
- In the Resources tab, under iRules, click Manage.
-
From the Available list, navigate to /Common/panw_apisec_plugin and select panw_apisec_data_collection and panw_apisec_set_ssl_data, and then click the left arrow button to move them to the Enabled list.
Select panw_apisec_set_ssl_data only if your client SSL profile is enabled.
- Click Finished.
- Click the Properties tab.
- Test the request/response and verify that the logs are sent to Cortex XSIAM. This can be verified by checking that the counter has increased. The scanned API endpoint metadata from f5-bigip is ready for investigation in the API inventory.
APIVoid
APIVoid
Important
This connector is only available for tenants that onboarded after July 26, 2026. For tenants that onboarded before this date, use Marketplace to access the standalone integration. For more information, see Marketplace.
This connector is available with any active Cortex XSIAM or Cortex AgentiX license.
Provides threat intelligence and security analysis using the APIVoid V2 API. APIVoid wraps up a number of services such as ipvoid and urlvoid.
This connector includes the following sub-capabilities (Marketplace integrations link to PAN DEV for more information):
- APIVoid: APIVoid wraps up a number of services such as ipvoid & urlvoid.
To configure this connector, follow the steps outlined in the configuration wizard.
Apollo.io
Apollo.io
The capabilities and sub-capabilities listed for this connector are available with any active Cortex XSIAM or Cortex Cloud Posture Security license.
This connector includes the following capabilities and sub-capabilities (if applicable):
- Security Posture: Detect, monitor and alert on settings of your SaaS application.
- saas-posture-config-remediation: Help remediate the misconfigured security settings of your SaaS application.
To configure this connector, follow the steps outlined in the configuration wizard.
AppSentinels
AppSentinels
Important
This connector is only available for tenants that onboarded after July 26, 2026. For tenants that onboarded before this date, use Marketplace to access the standalone integration. For more information, see Marketplace.
This connector is available with any active Cortex XSIAM license.
AppSentinels.ai is an application security platform for collecting, analyzing, and managing security events and audit logs to provide comprehensive application protection. It tracks user activities, security events, and administrative operations, enabling organizations to maintain an audit trail for compliance and security monitoring.
This connector includes the following sub-capabilities (Marketplace integrations link to PAN DEV for more information):
- AppSentinels.ai: Appsentinels.ai offers a platform for collecting, analyzing, and managing security events to provide comprehensive application protection.
To configure this connector, follow the steps outlined in the configuration wizard.
ArcSight
ArcSight
Important
This connector is only available for tenants that onboarded after July 26, 2026. For tenants that onboarded before this date, use Marketplace to access the standalone integration. For more information, see Marketplace.
This connector is available with any active Cortex XSIAM or Cortex AgentiX license.
ArcSight is a security information and event management (SIEM) solution. ArcSight ESM collects and analyzes security log data from across the enterprise to surface signs of compromise, attacks, and other malicious activity, and generates cases for security teams. ArcSight Logger delivers universal log management that unifies searching, reporting, alerting, and analysis across any type of enterprise machine data.
This connector includes the following sub-capabilities (Marketplace integrations link to PAN DEV for more information):
- ArcSight ESM v2: ArcSight ESM SIEM by Micro Focus (Formerly HPE Software).
- ArcSight Logger: ArcSight events logger.
To configure this connector, follow the steps outlined in the configuration wizard.
Arista Networks
Arista Networks
Important
This connector is only available for tenants that onboarded after July 26, 2026. For tenants that onboarded before this date, use Marketplace to access the standalone integration. For more information, see Marketplace.
This connector is available with any active Cortex XSIAM or Cortex AgentiX license.
Integrate with Arista Networks products. Use the Awake Security integration to manage and respond to network threats.
This connector includes the following sub-capabilities (Marketplace integrations link to PAN DEV for more information):
- Awake Security: Network Traffic Analysis.
To configure this connector, follow the steps outlined in the configuration wizard.
Arkime
Arkime
Important
This connector is only available for tenants that onboarded after July 26, 2026. For tenants that onboarded before this date, use Marketplace to access the standalone integration. For more information, see Marketplace.
This connector is available with any active Cortex XSIAM or Cortex AgentiX license.
Arkime (formerly Moloch) is a large scale, open source, indexed packet capture and search tool. This integration was integrated and tested with version 3.4.1 (API v3) of Arkime. For older versions, see the Moloch pack (deprecated).
This connector includes the following sub-capabilities (Marketplace integrations link to PAN DEV for more information):
- Arkime: Arkime (formerly Moloch) is a large scale, open source, indexed packet capture and search tool.
To configure this connector, follow the steps outlined in the configuration wizard.
Armis
Armis
Important
This connector is only available for tenants that onboarded after July 26, 2026. For tenants that onboarded before this date, use Marketplace to access the standalone integration. For more information, see Marketplace.
This connector is available with any active Cortex XSIAM license.
Agentless and passive security platform that sees, identifies, and classifies every device, tracks behavior, identifies threats, and takes action automatically to protect critical information and systems. Collects alerts, devices, and activities from Armis resources.
This connector includes the following sub-capabilities (Marketplace integrations link to PAN DEV for more information):
- ArmisEventCollector: Collects alerts, devices and activities from Armis resources.
To configure this connector, follow the steps outlined in the configuration wizard.
Articulate Global
Articulate Global
The capability and sub-capability listed for this connector are available with any active Cortex XSIAM or Cortex Cloud Posture Security license.
This connector includes the following capabilities and sub-capabilities (if applicable):
- Security Posture: Detect, monitor and alert on settings of your SaaS application.
- saas-posture-config-remediation: Help remediate the misconfigured security settings of your SaaS application.
To configure this connector, follow the steps outlined in the configuration wizard.
Asana
Asana
The capabilities and sub-capabilities listed for this connector are available with any active Cortex XSIAM or Cortex Cloud Posture Security license.
This connector includes the following capabilities and sub-capabilities (if applicable):
- Security Posture: Detect, monitor and alert on settings of your SAAS application.
- saas-posture-config-remediation: Help remediate the misconfigured security settings of your SAAS application.
To configure this connector, follow the steps outlined in the configuration wizard.
Atlassian
Atlassian
Secure configurations, monitor identity risks, and manage agent security across your Atlassian environment (including Rovo).
This connector includes the following capabilities and sub-capabilities (if applicable):
- Agent Security Scanning (Atlassian Rovo): This capability is available with any active Cortex Cloud Posture Security license.
- Identity Posture: Maintain visibility and control over Atlassian identities, including users, groups, roles, and policies. This capability is available with any active Cortex XSIAM, Cortex Cloud Posture Security, Cortex Cloud Runtime Security, or Cortex Data Security license.
- Security Posture: Detect, monitor and alert on settings of your SAAS application. This capability is available with any active Cortex XSIAM or Cortex Cloud Posture Security license.
- saas-posture-config-remediation: Help remediate the misconfigured security settings of your SAAS application. This sub-capability is available with any active Cortex XSIAM or Cortex Cloud Posture Security license.
To configure this connector, follow the steps outlined in the configuration wizard.
Atlassian Automation and Collection
Important
This connector is only available for tenants that onboarded after July 26, 2026. For tenants that onboarded before this date, use Marketplace to access the standalone integration. For more information, see Marketplace.
Integrate with Atlassian products to automate work and collect data across Jira, Jira Service Management, Confluence, Bitbucket, OpsGenie, and Atlassian IAM. Manage issues, content, spaces, users, alerts, and assets; run automated actions; and collect audit logs and events from Atlassian Cloud and on-prem deployments.
This connector includes the following sub-capabilities (Marketplace integrations link to PAN DEV for more information):
- Atlassian Cloud MCP: Use this integration to connect securely with an Atlassian Cloud Model Context Protocol (MCP) server and access its tools in real time. This sub-capability is available with any active Cortex XSIAM, Cortex Cloud Posture Security, Cortex Cloud, Cortex Cloud Runtime Security, Cortex XDR, or Cortex AgentiX license.
- Atlassian Confluence Cloud: Atlassian Confluence Cloud allows users to interact with confluence entities like content, space, users, and groups. Users can also manage the space permissions. This sub-capability is available with any active Cortex XSIAM or Cortex AgentiX license.
- Atlassian Confluence Server: This sub-capability is available with any active Cortex XSIAM or Cortex AgentiX license.
- Atlassian IAM: This sub-capability is available with any active Cortex XSIAM, Cortex XDR, or Cortex AgentiX license.
- AtlassianJiraServiceManagement: Use this integration to manage Jira objects and attach files to Jira objects from Cortex XSIAM. This sub-capability is available with any active Cortex XSIAM or Cortex AgentiX license.
- Bitbucket: Bitbucket Cloud is a Git-based code and CI/CD tool optimized for teams using Jira. This sub-capability is available with any active Cortex XSIAM or Cortex AgentiX license.
- Jira Event Collector: Jira logs event collector integration for Cortex XSIAM. This sub-capability is available with any active Cortex XSIAM license.
- Jira V3: Use the Jira integration to manage issues, create Cortex XSIAM incidents from Jira projects, and mirror issues to existing issue incidents in Cortex XSIAM. The integration now supports both OnPrem, and Cloud instances. This sub-capability is available with any active Cortex XSIAM, Cortex Cloud Posture Security, Cortex Cloud, Cortex Cloud Runtime Security, Cortex XDR, or Cortex AgentiX license.
- OpsGenieV3: Integration with Atlassian OpsGenie. OpsGenie is a cloud-based service that enables operations teams to manage alerts generated by monitoring tools to ensure the right people are notified, and the problems are addressed in a timely manner. This sub-capability is available with any active Cortex XSIAM or Cortex AgentiX license.
To configure this connector, follow the steps outlined in the configuration wizard.
AttackIQ
AttackIQ
Important
This connector is only available for tenants that onboarded after July 26, 2026. For tenants that onboarded before this date, use Marketplace to access the standalone integration. For more information, see Marketplace.
This connector is available with any active Cortex XSIAM or Cortex AgentiX license.
Use the AttackIQ integration to simulate a platform that provides validations for security controls, responses, and remediation exercises. Retrieve testing scenarios, execute penetration assessments, and retrieve detailed assessment results.
This connector includes the following sub-capabilities (Marketplace integrations link to PAN DEV for more information):
- AttackIQFireDrill: An attack simulation platform that provides validations for security controls, responses, and remediation exercises.
To configure this connector, follow the steps outlined in the configuration wizard.
Aurora Endpoint Security
Aurora Endpoint Security
Important
This connector is only available for tenants that onboarded after July 26, 2026. For tenants that onboarded before this date, use Marketplace to access the standalone integration. For more information, see Marketplace.
This connector is available with any active Cortex XSIAM or Cortex AgentiX license.
CylancePROTECT is an integrated threat prevention solution that combines the power of artificial intelligence (AI) to block malware infections. Use this connector to manage endpoints, streamline remediation, and respond to threats.
This connector includes the following sub-capabilities (Marketplace integrations link to PAN DEV for more information):
- Cylance Protect v2: Manage Endpoints using Cylance protect.
To configure this connector, follow the steps outlined in the configuration wizard.
Automox
Automox
The capabilities and sub-capabilities listed for this connector are available with any active Cortex XSIAM or Cortex Cloud Posture Security license.
This connector includes the following capabilities and sub-capabilities (if applicable):
- SaaS Posture Configuration Monitoring: Detect, monitor and alert on settings of your SAAS application.
- saas-posture-config-remediation: Help remediate the misconfigured security settings of your SAAS application.
To configure this connector, follow the steps outlined in the configuration wizard.
BeyondTrust
BeyondTrust Privilege Management Cloud
You can configure collecting BeyondTrust Privilege Management Cloud logs using a standard data source or connector (onboarded after July 26, 2026):
| Collection Method | Description |
|---|---|
| Standard data source overview | Forward logs to Cortex XSIAM from BeyondTrust Privilege Management Cloud using an Amazon S3 data source for a generic log type using the Beyondtrust Cloud ECS log format. |
| Link to standard data source instructions | Ingest logs from BeyondTrust Privilege Management Cloud |
| Link to connector (onboarded after July 26, 2026) | BeyondTrust |
Ingest logs from BeyondTrust Privilege Management Cloud
If you use BeyondTrust Privilege Management Cloud, you can take advantage of Cortex XSIAM investigation and detection capabilities by forwarding your logs to Cortex XSIAM. This enables Cortex XSIAM to help you expand visibility into computer, activity, and authorization requests in the organization, correlate and detect access violations, and query BeyondTrust Endpoint Privilege Management logs using XQL Search.
When Cortex XSIAM starts to receive logs, Cortex XSIAM can analyze your logs in XQL Search and you can create new Correlation Rules.
To integrate your logs, you first need to configure SIEM settings and an AWS S3 Bucket according to the specific requirements provided by BeyondTrust. You can then configure data collection in Cortex XSIAM by configuring an Amazon S3 data collector for a generic log type using the Beyondtrust Cloud ECS log format.
Before you begin configuring data collection verify that you are using BeyondTrust Privilege Management Cloud version 21.6.339 or later.
Configure BeyondTrust Privilege Management Cloud collection in Cortex XSIAM.
-
Configure SIEM settings and an AWS S3 Bucket according to the requirements provided in the BeyondTrust documentation.
Ensure that when you add the AWS S3 bucket in the PMC and set the SIEM settings, you select ECS - Elastic Common Schema as the SIEM Format.
-
Configure BeyondTrust logs collection with Cortex XSIAM using an Amazon S3 data collector for generic data.
Ensure your Amazon S3 data collector is configured with the following settings.
- Log Type: Select Generic to configure your log collection to receive generic logs from Amazon S3.
-
Log Format: Select the log format type as Beyondtrust Cloud ECS.
Note
For a Log Format set to Beyondtrust Cloud ECS, the following fields are automatically set and not configurable.
- Vendor: Beyondtrust
- Product: Privilege Management
- Compression: Uncompressed
-
After Cortex XSIAM begins receiving data from BeyondTrust Privilege Management Cloud, you can use XQL Search to search your logs using the
beyondtrust_privilege_management_rawdataset that you configured when setting up your Amazon S3 data collector.
BeyondTrust
Important
This connector is only available for tenants that onboarded after July 26, 2026. For tenants that onboarded before this date, use Marketplace to access the standalone integration. For more information, see Marketplace.
Integrate with BeyondTrust products. BeyondTrust Password Safe provides unified password and session management for accountability and control over privileged accounts. BeyondTrust Privilege Management Cloud (PM Cloud) retrieves audit events and activity logs for endpoint privilege management.
This connector includes the following sub-capabilities (Marketplace integrations link to PAN DEV for more information):
- BeyondTrust Password Safe: Unified password and session management for seamless accountability and control over privileged accounts. This sub-capability is available with any active Cortex XSIAM or Cortex AgentiX license.
- BeyondTrust Privilege Management Cloud: BeyondTrust Privilege Management Cloud (PM Cloud) integration for retrieving audit events and activity logs. This sub-capability is available with any active Cortex XSIAM license.
To configure this connector, follow the steps outlined in the configuration wizard.
BitSight
BitSight
Important
This connector is only available for tenants that onboarded after July 26, 2026. For tenants that onboarded before this date, use Marketplace to access the standalone integration. For more information, see Marketplace.
This connector is available with any active Cortex XSIAM license.
Bitsight for Security Performance Management (SPM) enables security leaders to use an external view of security performance to measure, monitor, manage, and report on their cybersecurity program performance over time. The Bitsight Security Rating provides a trusted metric that reflects the organization's cybersecurity program performance over time. Take action on Bitsight findings in your security program and leverage issue management workflows to pinpoint and control the sources of infections in your company infrastructure, going from awareness to rapid remediation.
This connector includes the following sub-capabilities (Marketplace integrations link to PAN DEV for more information):
- BitSight Event Collector: Use this integration to fetch BitSight findings as events in XSIAM.
To configure this connector, follow the steps outlined in the configuration wizard.
bitwarden
bitwarden
Important
This connector is only available for tenants that onboarded after July 26, 2026. For tenants that onboarded before this date, use Marketplace to access the standalone integration. For more information, see Marketplace.
This connector is available with any active Cortex XSIAM license.
Bitwarden Password Manager integrates with Cortex to fetch records of events that occur within your Teams or Enterprise organization. Password Manager helps organizations store their passwords and other sensitive data securely in an encrypted vault and can identify compromised passwords.
This connector includes the following sub-capabilities (Marketplace integrations link to PAN DEV for more information):
- Bitwarden Password Manager: This integration collects event logs from Bitwarden Password Manager to Cortex XSIAM.
To configure this connector, follow the steps outlined in the configuration wizard.
Blocklist.de
Blocklist.de
Important
This connector is only available for tenants that onboarded after July 26, 2026. For tenants that onboarded before this date, use Marketplace to access the standalone integration. For more information, see Marketplace.
This connector is available with any active Cortex XSIAM or Cortex AgentiX license.
Use the Blocklist.de feed integration to fetch indicators from the daily Threat Feed and custom feeds from Blocklist.de. When you configure your servers, you can use this information to reject a connection because of the indicators received from the Blocklist.de feed.
This connector includes the following sub-capabilities (Marketplace integrations link to PAN DEV for more information):
To configure this connector, follow the steps outlined in the configuration wizard.
BloodHound Enterprise
BloodHound Enterprise
Important
This connector is only available for tenants that onboarded after July 26, 2026. For tenants that onboarded before this date, use Marketplace to access the standalone integration. For more information, see Marketplace.
This connector is available with any active Cortex XSIAM license.
BloodHound Enterprise is a cyber security tool for identifying, analyzing, and mitigating attack paths within Active Directory environments. It maps potential attack paths, highlights excessive permissions or misconfigurations, and provides actionable recommendations to reduce vulnerabilities. Use this connector to fetch audit logs from BloodHound Enterprise as events in Cortex XSIAM.
This connector includes the following sub-capabilities (Marketplace integrations link to PAN DEV for more information):
- BloodHoundEnterprise: Use this integration to fetch audit logs from BloodHound Enterprise as events in Cortex XSIAM.
To configure this connector, follow the steps outlined in the configuration wizard.
BlueCat Address Manager
BlueCat Address Manager
Important
This connector is only available for tenants that onboarded after July 26, 2026. For tenants that onboarded before this date, use Marketplace to access the standalone integration. For more information, see Marketplace.
This connector is available with any active Cortex XSIAM or Cortex AgentiX license.
Use the BlueCat Address Manager integration to enrich IP addresses and manage response policies. This integration supports BlueCat Address Manager version 9.5.
This connector includes the following sub-capabilities (Marketplace integrations link to PAN DEV for more information):
- BluecatAddressManager: Use the BlueCat Address Manager integration to enrich IP addresses and manage response policies.
To configure this connector, follow the steps outlined in the configuration wizard.
BMC
BMC
Important
This connector is only available for tenants that onboarded after July 26, 2026. For tenants that onboarded before this date, use Marketplace to access the standalone integration. For more information, see Marketplace.
This connector is available with any active Cortex XSIAM or Cortex AgentiX license.
BMC connectors help streamline security-related service management and IT operations. Manage service requests, issues, change requests, tasks, problem investigations, known errors, and work order tickets in BMC Helix ITSM and BMC Helix Remedyforce, and get server details from BMC Remedy AR System.
This connector includes the following sub-capabilities (Marketplace integrations link to PAN DEV for more information):
- BMCHelixRemedyforce: BMC Helix Remedyforce integration enables customers to create/update service requests and incidents, update statuses, and resolve service requests and incidents with customer notes. This integration exposes standard ticketing capabilities that can be utilized as part of automation & orchestration.
- BmcITSM: BMC Helix ITSM integration enables customers to manage service request, incident, change request, task, problem investigation, known error and work order tickets.
- Remedy AR: BMC Remedy AR System is a professional development environment that leverages the recommendations of the IT Infrastructure Library (ITIL) and provides a foundation for Business Service Management (BSM) solutions. For incident management (i.e. create, fetch, update), please refer to Remedy On-Demand integration.
To configure this connector, follow the steps outlined in the configuration wizard.
Box
You can configure collecting Box logs and data using a standard data source, content pack integration (onboarded prior to July 26, 2026), or connectors:
| Collection Method | Description |
|---|---|
| Standard data source overview | Forward different types of data from Box enterprise accounts to Cortex XSIAM using the Box data source. |
| Link to standard data source instructions | <p>The following types of data can be ingested from Dropbox:</p><ul><li><p>Events and security alerts</p><ul><li>Events (admin_logs)</li><li>Box Shield Alerts</li></ul></li><li><p>Directory and metadata</p><ul><li>Users</li><li>Groups</li></ul></li></ul><p>For more information, see Ingest logs and data from Box.</p> |
| Links to content pack integration details (onboarded prior to July 26, 2026) | <p>The Box content pack contains classifiers, issue fields and types, and parsing and modeling rules to normalize Box data in Cortex XSIAM. It also includes the following integrations:</p><ul><li>Box Event Collector: Use this integration to collect events from Box's logs. It includes a command to get Box events.</li><li>Box V2: Use this integration to manage Box users. It includes commands to search Box content and manage file folders and share links.</li></ul> |
| Link to connectors | <ul><li>Box Automation and Collection (onboarded after July 26, 2026)</li><li>Box</li></ul> |
Ingest logs and data from Box
Cortex XSIAM can ingest different types of data from Box enterprise accounts using the Box data collector. To receive logs and data from Box enterprise accounts via the Box REST APIs, you must configure the Collection Integrations settings in Cortex XSIAM based on your Box enterprise account credentials. After you set up data collection, Cortex XSIAM begins receiving new logs and data from the source.
When Cortex XSIAM begins receiving logs, the app creates a new dataset for the different types of data that you are collecting, which you can use to initiate XQL Search queries. For example queries, refer to the in-app XQL Library. For all logs, Cortex XSIAM can generate Cortex XSIAM issues (Analytics, Correlation Rules, IOC, and BIOC), when relevant, from Box logs. While Correlation Rules issues are generated on non-normalized and normalized logs, Analytics, IOC, and BIOC issues are only generated on normalized logs.
The following table provides a brief description of the different types of data you can collect, the collection method and fetch interval for new data collected, the name of the dataset to use in Cortex XSIAM to query the data using XQL Search, and whether the data is normalized.
Note: Fetch intervals are non-configurable.
| Type of data | Description | Collection method | Fetch interval | Dataset name | Normalized data |
|---|---|---|---|---|---|
| Events and security alerts | |||||
| Events (admin_logs) | Retrieves events related to file/folder management, permission changes, access and login activities, user/groups management, folder collaboration, file/folder sharing, security settings changes, tasks, permission changes on folders, storage expiration and data retention, and workflows. | Appends data | 60 seconds | box_admin_logs_raw |
When relevant, Cortex XSIAM normalizes SaaS audit event logs into stories, which are collected in a dataset called saas_audit_logs. |
| Box Shield Alerts | Retrieves security alerts related to suspicious locations, suspicious sessions, anomalous download, and malicious content. Note: Collecting Box Shield Alerts requires implementing Box Shield. | Appends data | 60 seconds | box_shield_alerts_raw |
— |
| Directory and metadata | |||||
| Users | Lists user data. | Overwrites data | 10 minutes | box_users_raw |
— |
| Groups | Lists user group data. | Overwrites data | 10 minutes | box_groups_raw |
— |
Prerequisite
-
Set up an Enterprise Box plan.
Important
To collect Box Shield Alerts, you must purchase Box Shield and it must be enabled on Box enterprise.
- Create a valid Box account that is assigned to a role with sufficient permissions for the data you want to collect. For example, create an account assigned to an Admin role to enable Cortex XDR to collect all metadata for all files, folders, and enterprise events for the entire organization.
- Enable two-factor authentication for the Box account. For more information, see the Box documentation.
Configure Cortex XSIAM to receive logs and data from Box.
- Complete the prerequisites mentioned above for your Box enterprise account.
- Create a new app in your Box account.
- Log in to your Box account, and in the Dev Console, click Create New App.
- Select Custom App.
- Set these settings in the Custom App dialog:
- Select Server Authentication (Client Credentials Grant).
- Specify an App Name.
- Click Create App. The new app is created and the opened in the Configuration tab.
-
In the Configuration tab of the new app, scroll down to the following sections and configure the app.
- In the App Access Level section, select App + Enterprise Access.
-
In the Application Scopes section, set the following Administrative Action permissions depending on the type of data you want to collect.
Administrative action Data type Manage users Users Manage groups <p>Groups</p><div data-gb-custom-block data-tag="hint" data-style="info" class="hint hint-info"><p>Note</p><p>There is a current bug with the Groups API from Box. If you don't configure the Box app with the proper permissions for managing groups data, the Groups API from Box won't return an error message to Cortex XSIAM indicating that the API failed to receive the data, and the Groups data will not be collected.</p></div> Manage enterprise properties <ul><li>Events (admin_logs)</li><li>Box Shield Alerts</li></ul>
Once completed, scroll up in the tab to Save Changes.
-
In the Authorization tab, click Review and Submit to send your changes to the administrator for approval.
In the Review App Authorization Submission dialog that is displayed, you can add a Description of the app changes, and then click Submit.
- Ensure the new app changes are approved by an administrator in the Admin Console of the Box account.
- Select Apps → Customer Apps Manager → Server Authentication Apps.
- In the table, look for the Name of the Box app with the changes, where the Authorization Status is set to Pending Authorization, and select the options menu → Authorize App.
-
Click Authorize.
Note
For any future change that you make to your Box app, ensure that you send the changes for approval to the administrator, who will need to approve them as explained above.
- Navigate to Settings → Data Sources & Integrations.
- On the Data Sources & Integrations page, click + Add New, search for Box, then hover over it and click Add.
- Set the following parameters, where some values require you to log in to your Box account to copy and paste the values to the applicable fields:
- Name: Specify a descriptive name for this Box instance.
- Enterprise ID: Specify the unique identifier for your organization's Box instance, which is used to access the token request. This field can't be edited once the Box data collector instance is created. You can retrieve this value from your Box account in the the General Settings tab, and scrolling to the App Info section. Copy the Enterprise ID and paste it in this field in Cortex XSIAM.
- Client ID: Specify the client ID or API key for the Box app you created. You can retrieve this value from your Box account in the Configuration tab, and scrolling down to the OAuth 2.0 Credentials section. COPY the Client ID and paste it into this field in Cortex XSIAM.
- Client Secret: The client secret or API secret fort he Box app you created. You can retrieve this value from your Box account in the Configuration tab, and scrolling down to the OAuth 2.0 Credentials section. Click Fetch Client Secret, where you will need to authenticate yourself according to the two-factor authentication method (as explained as one of the prerequisites above) defined in your Box app before the Client Secret is displayed. Copy this value and paste it in this field in Cortex XSIAM.
- Collect: Select the types of data you want to collect from Box. All the options are selected by default.
- Events and security alerts
- Events (admin_logs): Collects events related to file/folder management, permission changes, access and login activities, user/groups management, folder collaboration, file/folder sharing, security settings changes, tasks, permission changes on folders, storage expiration and data retention, and workflows.
- Box Shield Alerts: Collects security alerts related to suspicious locations, suspicious sessions, anomalous download, and malicious content.
-
Directory and metadata
Note
Inventory data snapshots are collected every 10 minutes.
- Users: Collects user data.
- Groups: Collects user group data.
- Events and security alerts
- To test the connection settings, click Test.
- If the test is successful, click Enable to enable Box log collection. When events start to come in, a green check mark appears underneath the Box configuration.
Box Automation and Collection
Important
This connector is only available for tenants that onboarded after July 26, 2026. For tenants that onboarded before this date, use Marketplace to access the standalone integration. For more information, see Marketplace.
Manage Box users and collect events from Box's logs. Authentication is handled via JSON Web Tokens (JWT) using a Box custom app with Server Authentication.
This connector includes the following sub-capabilities (Marketplace integrations link to PAN DEV for more information):
- Box v2: Manage Box users. This sub-capability is available with any active Cortex XSIAM or Cortex AgentiX license.
- BoxEventsCollector: Collect events from Box's logs. This sub-capability is available with any active Cortex XSIAM license.
To configure this connector, follow the steps outlined in the configuration wizard.
Box
The capabilities and sub-capabilities listed for this connector are available with any active Cortex Cloud Posture Security license.
This connector includes the following capabilities and sub-capabilities (if applicable):
- Agent Security Scanning
To configure this connector, follow the steps outlined in the configuration wizard.
Broadcom
Broadcom
Important
This connector is only available for tenants that onboarded after July 26, 2026. For tenants that onboarded before this date, use Marketplace to access the standalone integration. For more information, see Marketplace.
Broadcom Symantec security products for endpoint, email, web, and data protection. This connector groups Symantec Endpoint Detection and Response (EDR), Endpoint Protection, Endpoint Security, Data Loss Prevention, Email Security Cloud, Messaging Gateway, Management Center, Cloud Secure Web Gateway, CloudSOC, and Blue Coat Content and Malware Analysis to manage protection, collect events, and perform remediation.
This connector includes the following sub-capabilities (Marketplace integrations link to PAN DEV for more information):
- Symantec Blue Coat Content and Malware Analysis: This sub-capability is available with any active Cortex XSIAM or Cortex AgentiX license.
- Symantec Cloud Secure Web Gateway Event Collector: Palo Alto Networks Symantec Cloud Secure Web Gateway Event Collector integration for Cortex XSIAM. This sub-capability is available with any active Cortex XSIAM or Cortex AgentiX license.
- Symantec Data Loss Prevention v2: This sub-capability is available with any active Cortex XSIAM or Cortex AgentiX license.
- Symantec Email Security Cloud: This sub-capability is available with any active Cortex XSIAM or Cortex AgentiX license.
- Symantec Endpoint Protection V2: Query the Symantec Endpoint Protection Manager using the official REST API. This sub-capability is available with any active Cortex XSIAM or Cortex AgentiX license.
- Symantec Endpoint Security: Symantec Endpoint Security Event Collector for Cortex XSIAM. This sub-capability is available with any active Cortex XSIAM or Cortex AgentiX license.
- Symantec Management Center: Symantec Management Center provides a unified management environment for the Symantec Security Platform portfolio of products. This sub-capability is available with any active Cortex XSIAM or Cortex AgentiX license.
- Symantec Messaging Gateway: Symantec Messaging Gateway protects against spam, malware, targeted attacks and provides advanced content filtering, data loss prevention, and email encryption. This sub-capability is available with any active Cortex XSIAM or Cortex AgentiX license.
- SymantecCloudSOCEventCollector: Gets Events from Symantec CloudSOC. This sub-capability is available with any active Cortex XSIAM license.
- SymantecEDR: Symantec EDR (On Prem) endpoints help to detect threats in your network by filter endpoints data to find Indicators of Compromise (IoCs) and take actions to remediate the threat(s). EDR on-premise capabilities allow incident responders to quickly search, identify, and contain all impacted endpoints while investigating threats using a choice of on-premises. This sub-capability is available with any active Cortex XSIAM or Cortex AgentiX license.
To configure this connector, follow the steps outlined in the configuration wizard.
BruteForceBlocker
BruteForceBlocker
Important
This connector is only available for tenants that onboarded after July 26, 2026. For tenants that onboarded before this date, use Marketplace to access the standalone integration. For more information, see Marketplace.
This connector is available with any active Cortex XSIAM or Cortex AgentiX license.
BruteForceBlocker is a Perl script that works with pf – the firewall developed by the OpenBSD team, and is also available on FreeBSD from version 5.2. From BruteForceBlocker version 1.2 it is also possible to report blocked IP addresses to the project site and share your information with other users.
This connector includes the following sub-capabilities (Marketplace integrations link to PAN DEV for more information):
To configure this connector, follow the steps outlined in the configuration wizard.
Businessmap
Businessmap
The capabilities and sub-capabilities listed for this connector are available with any active Cortex XSIAM or Cortex Cloud Posture Security license.
This connector includes the following capabilities and sub-capabilities (if applicable):
- Security Posture: Detect, monitor and alert on settings of your SAAS application.
saas-posture-config-remediation: Help remediate the misconfigured security settings of your SAAS application.
To configure this connector, follow the steps outlined in the configuration wizard.
C2SEC
C2SEC
Important
This connector is only available for tenants that onboarded after July 26, 2026. For tenants that onboarded before this date, use Marketplace to access the standalone integration. For more information, see Marketplace.
This connector is available with any active Cortex XSIAM or Cortex AgentiX license.
Use the C2sec irisk integration to scan domains and return scan results. Add domains to a portfolio, check scan status, re-scan domains, and retrieve issues and scan results for a domain.
This connector includes the following sub-capabilities (Marketplace integrations link to PAN DEV for more information):
To configure this connector, follow the steps outlined in the configuration wizard.
CAPESandbox
CAPESandbox
Important
This connector is only available for tenants that onboarded after July 26, 2026. For tenants that onboarded before this date, use Marketplace to access the standalone integration. For more information, see Marketplace.
This connector is available with any active Cortex XSIAM or Cortex AgentiX license.
CAPE Sandbox is an open-source software for automating the analysis of suspicious files and URLs. It provides comprehensive malware analysis capabilities, including behavioral analysis, memory forensics, and network traffic capture. This integration allows you to interact with CAPE Sandbox for automated malware analysis.
This connector includes the following sub-capabilities (Marketplace integrations link to PAN DEV for more information):
- CapeSandbox: CAPE Sandbox is an open-source software for automating the analysis of suspicious files and URLs.
To configure this connector, follow the steps outlined in the configuration wizard.
Carbon Black
Carbon Black
Important
This connector is only available for tenants that onboarded after July 26, 2026. For tenants that onboarded before this date, use Marketplace to access the standalone integration. For more information, see Marketplace.
VMware Carbon Black is a cloud-delivered endpoint protection platform. Carbon Black Endpoint Standard (formerly CB Defense) is a next-generation antivirus (NGAV) and behavioral EDR solution, Enterprise EDR delivers advanced threat hunting and issue response, App Control (formerly Enterprise Protection) provides endpoint threat prevention, and Live Response lets security operators collect information and take action on remote endpoints in real time.
This connector includes the following sub-capabilities (Marketplace integrations link to PAN DEV for more information):
- Carbon Black Endpoint Standard: Endpoint Standard is an industry-leading next-generation antivirus (NGAV) and behavioral endpoint detection and response (EDR) solution. Endpoint Standard is delivered through the Carbon Black Cloud, an endpoint protection platform that consolidates security in the cloud using a single agent, console and data set. This sub-capability is available with any active Cortex XSIAM or Cortex AgentiX license.
- Carbon Black Endpoint Standard v3: Endpoint Standard is an industry-leading next-generation antivirus (NGAV) and behavioral endpoint detection and response (EDR) solution. Endpoint Standard is delivered through the Carbon Black Cloud, an endpoint protection platform that consolidates security in the cloud using a single agent, console and data set. This sub-capability is available with any active Cortex XSIAM or Cortex AgentiX license.
- Carbon Black Enterprise EDR: VMware Carbon Black Enterprise EDR (formerly known as Carbon Black ThreatHunter) is an advanced threat hunting and incident response solution delivering continuous visibility for top security operations centers (SOCs) and incident response (IR) teams. (formerly known as ThreatHunter). This sub-capability is available with any active Cortex XSIAM or Cortex AgentiX license.
- CarbonBlackEndpointStandardEventCollector: Endpoint Standard (formerly called Carbon Black Defense), a Next-Generation Anti-Virus + EDR. Collect Anti-Virus & EDR alerts and Audit Log Events. This sub-capability is available with any active Cortex XSIAM license.
- carbonblackliveresponse: Collect information and take action on remote endpoints in real time with VMware Carbon Black EDR (Live Response API) (formerly known as Carbon Black Enterprise Live Response). This sub-capability is available with any active Cortex XSIAM or Cortex AgentiX license.
- CarbonBlackLiveResponseCloud: VMware Carbon Black Endpoint Standard Live Response is a feature that enables security operators to collect information and take action on remote endpoints in real time. These actions include the ability to upload, download, and remove files, retrieve and remove registry entries, dump contents of physical memory, and execute and terminate processes. This sub-capability is available with any active Cortex XSIAM or Cortex AgentiX license.
- CarbonBlackProtectionV2: This sub-capability is available with any active Cortex XSIAM or Cortex AgentiX license.
To configure this connector, follow the steps outlined in the configuration wizard.
Celonis
Celonis Collection
Important
This connector is only available for tenants that onboarded after July 26, 2026. For tenants that onboarded before this date, use Marketplace to access the standalone integration. For more information, see Marketplace.
This connector is available with any active Cortex XSIAM license.
Celonis is a process mining and execution management platform that helps organizations analyze and optimize their business processes for improved efficiency and performance. This connector collects Celonis Audit, Studio Adoption, and Login History logs.
This connector includes the following sub-capabilities (Marketplace integrations link to PAN DEV for more information):
- CelonisEventCollector: The Celonis Platform offers you a suite of process mining and intelligence features, helping you to integrate your data and then use that data to analyze, improve, and monitor your business performance across key metrics.
To configure this connector, follow the steps outlined in the configuration wizard.
Celonis
The capabilities and sub-capabilities listed for this connector are available with any active Cortex XSIAM or Cortex Cloud Posture Security license.
This connector includes the following capabilities and sub-capabilities (if applicable):
- SaaS Posture Configuration Monitoring: Detect, monitor and alert on settings of your SAAS application.
- saas-posture-config-remediation: Help remediate the misconfigured security settings of your SAAS application.
To configure this connector, follow the steps outlined in the configuration wizard.
Centreon
Centreon
Important
This connector is only available for tenants that onboarded after July 26, 2026. For tenants that onboarded before this date, use Marketplace to access the standalone integration. For more information, see Marketplace.
This connector is available with any active Cortex XSIAM or Cortex AgentiX license.
Use Centreon to check the status of hosts and services. This integration was integrated and tested with Centreon v2.8.20.
This connector includes the following sub-capabilities (Marketplace integrations link to PAN DEV for more information):
- Centreon: IT & Network Monitoring.
To configure this connector, follow the steps outlined in the configuration wizard.
ChatGPT Enterprise
ChatGPT Enterprise
The capabilities and sub-capabilities listed for this connector are available with any active Cortex Cloud Posture Security license.
This connector includes the following capabilities and sub-capabilities (if applicable):
- Agent Security Scanning
To configure this connector, follow the steps outlined in the configuration wizard.
Check Point
Check Point FW1/VPN1
You can configure collecting Check Point FW1/VPN1 logs using a Broker VM Syslog Collector applet, content pack integration (onboarded prior to July 26, 2026), or connector (onboarded after July 26, 2026):
| Collection Method | Description |
|---|---|
| Syslog Collector applet overview | If you use Check Point FW1/VPN1 firewalls, you can forward Check Point firewall logs to Cortex XSIAM using the Broker VM Syslog Collector applet in a CEF format. |
| Link to Syslog Collector applet instructions | Ingest logs from Check Point firewalls |
| Link to content pack/integration details (onboarded prior to July 26, 2026) | <p>The Check Point Firewall content pack manages Check Point firewall devices via API, allowing the reading information, sending commands, and orchestrating configuration and blocking actions. It contains a modeling rule (CheckPoint Firewall Collection) and several playbooks (for example Checkpoint - Block IP - Append Group, Checkpoint - Publish&Install configuration, Checkpoint - Block IP - Custom Block Rule, and Checkpoint - Block URL). It also includes the following integration:</p><ul><li>CheckPoint Firewall v2: Use this integration to read information and send commands to the Check Point Firewall server. It includes commands for handling threat protection and profiles, such as checkpoint-set-threat-protection and checkpoint-add-threat-profile.</li></ul> |
| Link to connector (onboarded after July 26, 2026) | Checkpoint Firewall |
Checkpoint Firewall
Important
This connector is only available for tenants that onboarded after July 26, 2026. For tenants that onboarded before this date, use Marketplace to access the standalone integration. For more information, see Marketplace.
This connector is available with any active Cortex XSIAM or Cortex AgentiX license.
Integrate with Check Point Software Technologies products. Manage the Check Point Firewall server, protect endpoints with Check Point Harmony Endpoint, perform remote file analysis with Check Point Threat Emulation (SandBlast), and manage the security and compliance of the public cloud with Check Point Dome9 (CloudGuard).
This connector includes the following sub-capabilities (Marketplace integrations link to PAN DEV for more information):
- checkpointdome9: Dome9 integration allows to easily manage the security and compliance of the public cloud.
- CheckPointFirewall_v2: Use this integration to read information and send commands to the Check Point Firewall server.
- CheckPointHarmonyEndpoint: Checkpoint Harmony Endpoint provides a complete endpoint security solution built to protect organizations and the remote workforce from today's complex threat landscape.
- CheckPointSandBlast: Deprecated. Use Check Point Threat Emulation (SandBlast) instead. Query, upload and download data using Check Point Sandblast on cloud.
To configure this connector, follow the steps outlined in the configuration wizard.
CheckPhish
CheckPhish
Important
This connector is only available for tenants that onboarded after July 26, 2026. For tenants that onboarded before this date, use Marketplace to access the standalone integration. For more information, see Marketplace.
This connector is available with any active Cortex XSIAM or Cortex AgentiX license.
Check any URL to detect suspicious behavior. CheckPhish (by BolsterAI) classifies URLs by disposition, detecting zero-day phishing, tech support scams, gift card scams, survey scams, adult websites, drug/pharmacy spam, illegal streaming, gambling, hacked websites, and cryptojacking/cryptomining.
This connector includes the following sub-capabilities (Marketplace integrations link to PAN DEV for more information):
- CheckPhish: Check any URL to detect suspicious behavior.
To configure this connector, follow the steps outlined in the configuration wizard.
CipherTrust
CipherTrust
Important
This connector is only available for tenants that onboarded after July 26, 2026. For tenants that onboarded before this date, use Marketplace to access the standalone integration. For more information, see Marketplace.
This connector is available with any active Cortex XSIAM or Cortex AgentiX license.
Manage secrets and protect sensitive data through the Thales CipherTrust Manager security platform. Configure, manage, and monitor user groups, users, and digital certificates, and manage local and external Certificate Authorities to maintain secure communication channels and access control.
This connector includes the following sub-capabilities (Marketplace integrations link to PAN DEV for more information):
To configure this connector, follow the steps outlined in the configuration wizard.
CIRCL
CIRCL
Important
This connector is only available for tenants that onboarded after July 26, 2026. For tenants that onboarded before this date, use Marketplace to access the standalone integration. For more information, see Marketplace.
This connector is available with any active Cortex XSIAM or Cortex AgentiX license.
Use the CIRCL integration to research malware history for IPs, DNSs, and hostnames, and to query certificate history and details. It also searches for CVE information using circl.lu.
This connector includes the following sub-capabilities (Marketplace integrations link to PAN DEV for more information):
- CIRCL: CIRCL Passive DNS is a database storing historical DNS records from various resources. CIRCL Passive SSL is a database storing historical X.509 certificates seen per IP address. The Passive SSL historical data is indexed per IP address.
- CIRCL CVE Search: Searches for CVE information using circl.lu.
To configure this connector, follow the steps outlined in the configuration wizard.
CircleCI
CircleCI
Important
This connector is only available for tenants that onboarded after July 26, 2026. For tenants that onboarded before this date, use Marketplace to access the standalone integration. For more information, see Marketplace.
This connector is available with any active Cortex XSIAM or Cortex AgentiX license.
Gets the details of the CircleCI workflows, including the details of the last runs and the jobs, and retrieves the artifacts of the jobs. This integration was integrated and tested with version v2 of CircleCI.
This connector includes the following sub-capabilities (Marketplace integrations link to PAN DEV for more information):
- CircleCI: Gets the details of the CircleCI workflows; including the details of the last runs and the jobs, and retrieves the artifacts of the jobs.
To configure this connector, follow the steps outlined in the configuration wizard.
Cisco
Here are the articles in this section:
- cisco-asa-firewalls-and-anyconnect
- cisco-asa
- cisco-duo
- cisco-duo-automation-and-collection
- cisco-firepower
- cisco-ise
- cisco-meraki
- cisco-meraki-automation-and-remediation
- cisco-security
- cisco-umbrella
Cisco ASA firewalls and AnyConnect
You can configure collecting Cisco ASA firewall and AnyConnect VPN logs using a Broker VM Syslog Collector applet, content pack integration (onboarded prior to July 26, 2026), or connector (onboarded after July 26, 2026):
| Collection Method | Description |
|---|---|
| Syslog Collector applet overview | If you use Cisco ASA firewalls or Cisco AnyConnect VPN, you can forward Cisco ASA firewall and AnyConnect VPN logs to Cortex XSIAM using the Broker VM Syslog Collector applet in a CISCO format. |
| Link to Syslog Collector applet instructions | Ingest logs from Cisco ASA firewalls and AnyConnect |
| Link to content pack/integration instructions (onboarded prior to July 26, 2026) | <p>The Cisco ASA content pack interacts with the Cisco Adaptive Security Appliance Software via an API to manage interfaces, rules, and network objects. The content pack includes the following integration:</p><ul><li>Cisco Adaptive Security Appliance Software: Use this integration to manage interfaces, rules, and network objects on the Cisco Adaptive Security Appliance Software platform. This integration includes commands for listing and managing network object groups, local user groups, local users, time ranges, security object groups, user objects, interface information, configuration backup, and creating, listing, getting, editing, and deleting firewall rules, along with the command to save the running configuration to memory (cisco-asa-write-memory).</li></ul> |
| Link to connector (onboarded after July 26, 2026) | Cisco ASA |
Cisco ASA
Important
This connector is only available for tenants that onboarded after July 26, 2026. For tenants that onboarded before this date, use Marketplace to access the standalone integration. For more information, see Marketplace.
This connector is available with any active Cortex XSIAM or Cortex AgentiX license.
Cisco Adaptive Security Appliances (ASA) is a unified security solution that integrates firewall capabilities, intrusion prevention (IPS), and VPN services. Use this connector to manage interfaces, rules, and network objects.
This connector includes the following sub-capabilities (Marketplace integrations link to PAN DEV for more information):
- Cisco ASA: Use the Cisco Adaptive Security Appliance Software integration to manage interfaces, rules, and network objects.
To configure this connector, follow the steps outlined in the configuration wizard.
Cisco Duo
The capabilities and sub-capabilities listed for this connector are available with any active Cortex XSIAM or Cortex Cloud Posture Security license.
This connector includes the following capabilities and sub-capabilities (if applicable):
- SaaS Posture Configuration Monitoring: Detect, monitor and alert on settings of your SAAS application.
- saas-posture-config-remediation: Help remediate the misconfigured security settings of your SAAS application.
To configure this connector, follow the steps outlined in the configuration wizard.
Cisco DUO Automation and Collection
Important
This connector is only available for tenants that onboarded after July 26, 2026. For tenants that onboarded before this date, use Marketplace to access the standalone integration. For more information, see Marketplace.
The Duo Admin API provides programmatic access to the administrative functionality of Duo Security's two-factor authentication platform. This connector runs automation actions against Duo and collects Auth and Audit log events using the Duo Admin API.
This connector includes the following sub-capabilities (Marketplace integrations link to PAN DEV for more information):
- DUO Admin: This sub-capability is available with any active Cortex XSIAM or Cortex AgentiX license.
- Duo Event Collector: Collects Auth and Audit events for Duo using the API. This sub-capability is available with any active Cortex XSIAM license.
To configure this connector, follow the steps outlined in the configuration wizard.
Cisco Firepower
Important
This connector is only available for tenants that onboarded after July 26, 2026. For tenants that onboarded before this date, use Marketplace to access the standalone integration. For more information, see Marketplace.
This connector is available with any active Cortex XSIAM or Cortex AgentiX license.
Use the Cisco Firepower integration for unified management of firewalls, application control, intrusion prevention, URL filtering, and advanced malware protection.
This connector includes the following sub-capabilities (Marketplace integrations link to PAN DEV for more information):
- Cisco Firepower: Use the Cisco Firepower integration for unified management of firewalls, application control, intrusion prevention, URL filtering, and advanced malware protection.
To configure this connector, follow the steps outlined in the configuration wizard.
Cisco ISE
Important
This connector is only available for tenants that onboarded after July 26, 2026. For tenants that onboarded before this date, use Marketplace to access the standalone integration. For more information, see Marketplace.
This connector is available with any active Cortex XSIAM or Cortex AgentiX license.
Cisco Identity Services Engine (ISE) offers a network-based approach for adaptable, trusted access everywhere, based on context. It gives you intelligent, integrated protection through intent-based policy and compliance solutions. Use this connector to get endpoint data, and to manage and update endpoints and ANC policies.
This connector includes the following sub-capabilities (Marketplace integrations link to PAN DEV for more information):
- Cisco ISE: Next-generation secure network access.
To configure this connector, follow the steps outlined in the configuration wizard.
Cisco Meraki
The capabilities and sub-capabilities listed for this connector are available with any active Cortex XSIAM or Cortex Cloud Posture Security license.
This connector includes the following capabilities and sub-capabilities (if applicable):
- Security Posture: Detect, monitor and alert on settings of your SAAS application.
- saas-posture-config-remediation: Help remediate the misconfigured security settings of your SAAS application.
To configure this connector, follow the steps outlined in the configuration wizard.
Cisco Meraki Automation and Remediation
Important
This connector is only available for tenants that onboarded after July 26, 2026. For tenants that onboarded before this date, use Marketplace to access the standalone integration. For more information, see Marketplace.
This connector is available with any active Cortex XSIAM or Cortex AgentiX license.
Cisco Meraki is a cloud-managed IT platform that simplifies networking, security, communications, and endpoint management through a centralized web interface. This connector runs automated actions and remediation against organizations, networks, devices, and their licenses via the Meraki Dashboard API.
This connector includes the following sub-capabilities (Marketplace integrations link to PAN DEV for more information):
- Cisco Meraki v2: Cisco Meraki is a cloud-managed IT company that simplifies networking, security, communications, and endpoint management. Its platform offers centralized management for devices, networks, and security through an intuitive web interface. Key functionalities include managing organizations, networks, devices, and their licenses, as well as monitoring device statuses and client activities.
To configure this connector, follow the steps outlined in the configuration wizard.
Cisco Security
Important
This connector is only available for tenants that onboarded after July 26, 2026. For tenants that onboarded before this date, use Marketplace to access the standalone integration. For more information, see Marketplace.
Cisco security products for endpoint malware protection (AMP/Secure Endpoint), email and web security (ESA, SMA, WSA), network and cloud analytics (Secure Network Analytics/Stealthwatch, Secure Cloud Analytics), malware analysis and threat intelligence (Secure Malware Analytics/Threat Grid, Webex Feed), collaboration (Webex Teams), application performance (AppDynamics), cloud security (CloudLock), vulnerability management (Kenna), phishing lookup (PhishTank), and event collection across the Cisco portfolio. Use these connectors to fetch events and issues, enrich indicators, and run automation and remediation.
This connector includes the following sub-capabilities (Marketplace integrations link to PAN DEV for more information):
- AMP: Uses CISCO AMP Endpoint. This sub-capability is available with any active Cortex XSIAM or Cortex AgentiX license.
- AMPv2: Cisco Advanced Malware Protection software is designed to prevent, detect, and help remove threats in an efficient manner from computer systems. Threats can take the form of software viruses and other malware such as ransomware, worms, Trojans, spyware, adware, and fileless malware. This sub-capability is available with any active Cortex XSIAM or Cortex AgentiX license.
- Cisco AppDynamics: This sub-capability is available with any active Cortex XSIAM license.
- Cisco CloudLock: Query Cisco CloudLock. This sub-capability is available with any active Cortex XSIAM or Cortex AgentiX license.
- Cisco Secure Malware Analytics: This sub-capability is available with any active Cortex XSIAM or Cortex AgentiX license.
- Cisco Spark: Send messages, create rooms and more, via the Cisco Spark API. This sub-capability is available with any active Cortex XSIAM or Cortex AgentiX license.
- Cisco Stealthwatch: Scalable visibility and security analytics. This sub-capability is available with any active Cortex XSIAM or Cortex AgentiX license.
- Cisco WebEx Feed: Use the Cisco Webex Feed integration to fetch indicators from Webex. This sub-capability is available with any active Cortex XSIAM or Cortex AgentiX license.
- CiscoAMPEventCollector: This is the Cisco AMP event collector integration for Cortex XSIAM. This sub-capability is available with any active Cortex XSIAM license.
- CiscoESA: This sub-capability is available with any active Cortex XSIAM or Cortex AgentiX license.
- CiscoSMA: The Security Management Appliance (SMA) is used to centralize services from Email Security Appliances (ESAs) and Web Security Appliances (WSAs). This sub-capability is available with any active Cortex XSIAM or Cortex AgentiX license.
- CiscoThousandEyes: This is the Cisco ThousandEyes event collector integration for Cortex XSIAM. This sub-capability is available with any active Cortex XSIAM license.
- CiscoWebexEventCollector: Cisco Webex Event Collector fetches Events and Admin Audit Events and Security Audit Events. This sub-capability is available with any active Cortex XSIAM license.
- CiscoWSAv2: Cisco Secure Web Appliance protects your organization by automatically blocking risky sites and testing unknown sites before allowing users to click on them. This sub-capability is available with any active Cortex XSIAM or Cortex AgentiX license.
- Kennav2: Use the Kenna v2 integration to search and update vulnerabilities, schedule a run connector, and manage tags and attributes. This sub-capability is available with any active Cortex XSIAM or Cortex AgentiX license.
- PhishTank V2: PhishTank is a free community site where anyone can submit, verify, track, and share phishing data. This sub-capability is available with any active Cortex XSIAM or Cortex AgentiX license.
- Stealthwatch Cloud: Protect your cloud assets and private network. This sub-capability is available with any active Cortex XSIAM or Cortex AgentiX license.
- ThreatGridv2: Query and upload samples to Cisco threat grid. This sub-capability is available with any active Cortex XSIAM or Cortex AgentiX license.
To configure this connector, follow the steps outlined in the configuration wizard.
Cisco Umbrella
Important
This connector is only available for tenants that onboarded after July 26, 2026. For tenants that onboarded before this date, use Marketplace to access the standalone integration. For more information, see Marketplace.
This connector is available with any active Cortex XSIAM or Cortex AgentiX license.
Cisco Umbrella is a cloud security platform providing the first line of defense against internet threats. It uses DNS-layer security to block malicious requests before a connection is established, offering protection against malware, ransomware, phishing, and more. This connector supports enforcement, threat investigation of domains, IPs, and URLs, and reporting on request and blocked activity.
This connector includes the following sub-capabilities (Marketplace integrations link to PAN DEV for more information):
- Cisco Umbrella Cloud Security v2: Cisco Umbrella is a cloud security platform providing the first line of defense against internet threats. It uses DNS-layer security to block malicious requests before a connection is established, offering protection against malware, ransomware, phishing, and more. It offers real-time reporting, integrates with other Cisco solutions for layered security, and uses machine learning to uncover and predict threats.
- Cisco Umbrella Enforcement: Add and remove domains in Cisco OpenDNS.
- Cisco Umbrella Investigate: Cisco Umbrella Investigate enables you to research domains, IPs, and URLs observed by the Umbrella resolvers.
- Cisco Umbrella Reporting: The Umbrella Reporting v2 API provides visibility into your core network and security activities and Umbrella logs.
To configure this connector, follow the steps outlined in the configuration wizard.
Citrix
Citrix
Important
This connector is only available for tenants that onboarded after July 26, 2026. For tenants that onboarded before this date, use Marketplace to access the standalone integration. For more information, see Marketplace.
This connector is available with any active Cortex XSIAM license.
Citrix Cloud is a cloud-based management platform that provides the centralized control plane for delivering and managing all Citrix digital workspace services, including virtual apps and desktops. Citrix DaaS delivers secure virtual apps and desktops from the cloud while maintaining centralized control and configuration management. This connector collects Citrix Cloud system log records and Citrix DaaS configuration log records.
This connector includes the following sub-capabilities (Marketplace integrations link to PAN DEV for more information):
To configure this connector, follow the steps outlined in the configuration wizard.
ClickUp
ClickUp
The capabilities and sub-capabilities listed for this connector are available with any active Cortex XSIAM or Cortex Cloud Posture Security license.
This connector includes the following capabilities and sub-capabilities (if applicable):
- Security Posture: Detect, monitor and alert on settings of your SAAS application.
- saas-posture-config-remediation: Help remediate the misconfigured security settings of your SAAS application.
To configure this connector, follow the steps outlined in the configuration wizard.
Cloaken
Cloaken
Important
This connector is only available for tenants that onboarded after July 26, 2026. For tenants that onboarded before this date, use Marketplace to access the standalone integration. For more information, see Marketplace.
This connector is available with any active Cortex XSIAM or Cortex AgentiX license.
Use the Cloaken integration to unshorten URLs in AWS behind TOR. Unshorten a URL to run the expanded URL through intelligence sources.
This connector includes the following sub-capabilities (Marketplace integrations link to PAN DEV for more information):
- Cloaken: Unshorten URLs onsite using the power of a Tor proxy server to prevent leaking IP addresses to adversaries.
To configure this connector, follow the steps outlined in the configuration wizard.
CloudConvert
CloudConvert
Important
This connector is only available for tenants that onboarded after July 26, 2026. For tenants that onboarded before this date, use Marketplace to access the standalone integration. For more information, see Marketplace.
This connector is available with any active Cortex XSIAM or Cortex AgentiX license.
Use the CloudConvert integration to convert your files to the required format. This integration was integrated and tested with version v2 of CloudConvert.
This connector includes the following sub-capabilities (Marketplace integrations link to PAN DEV for more information):
- CloudConvert: Use the CloudConvert integration to convert your files to the desired format.
To configure this connector, follow the steps outlined in the configuration wizard.
Cloudflare
Cloudflare
Important
This connector is only available for tenants that onboarded after July 26, 2026. For tenants that onboarded before this date, use Marketplace to access the standalone integration. For more information, see Marketplace.
Cloudflare provides network and security products for consumers and businesses, using reverse proxies for web traffic, edge computing, and a content delivery network. This connector fetches indicators from the Cloudflare feed, connects to a Cloudflare Model Context Protocol (MCP) server to access Cloudflare tools in real time, collects Cloudflare Zero Trust audit and access authentication logs as events, and manages Cloudflare WAF firewall rules, filters, and IP-lists.
This connector includes the following sub-capabilities (Marketplace integrations link to PAN DEV for more information):
- Cloudflare Feed: This sub-capability is available with any active Cortex XSIAM or Cortex AgentiX license.
- Cloudflare MCP: Use this integration to connect securely with a Cloudflare Model Context Protocol (MCP) server and access its tools in real time. This sub-capability is available with any active Cortex XSIAM or Cortex AgentiX license.
- Cloudflare Zero Trust: This sub-capability is available with any active Cortex XSIAM license.
- CloudflareWAF: Cloudflare WAF integration allows customers to manage firewall rules, filters, and IP-lists. It also allows to retrieve zones list for each account. This sub-capability is available with any active Cortex XSIAM or Cortex AgentiX license.
To configure this connector, follow the steps outlined in the configuration wizard.
Code42
Code42
Important
This connector is only available for tenants that onboarded after July 26, 2026. For tenants that onboarded before this date, use Marketplace to access the standalone integration. For more information, see Marketplace.
This connector is available with any active Cortex XSIAM license.
Code42 Insider Risk software solutions provide the right balance of transparency, technology and training to detect and appropriately respond to data risk. Use the Code42 Event Collector to fetch file events and audit logs.
This connector includes the following sub-capabilities (Marketplace integrations link to PAN DEV for more information):
- Code42 Event Collector: Code42 Insider Risk software solutions provide the right balance of transparency, technology and training to detect and appropriately respond to data risk. Use the Code42EventCollector integration to fetch file events and audit logs.
To configure this connector, follow the steps outlined in the configuration wizard.
Cohesity
Cohesity
Important
This connector is only available for tenants that onboarded after July 26, 2026. For tenants that onboarded before this date, use Marketplace to access the standalone integration. For more information, see Marketplace.
This connector is available with any active Cortex XSIAM license.
Cohesity Helios is a next-gen data management platform that combines an immutable file system with DataLock, anomaly detection, policy-based data isolation, quorum, and MFA to protect backup data from ransomware attacks. This connector integrates ransomware detection and audit and alert log collection into Cortex XSOAR for automated ransomware attack recovery.
This connector includes the following sub-capabilities (Marketplace integrations link to PAN DEV for more information):
- Cohesity Helios Event Collector: This is the Cohesity Helios Event Collector integration for XSIAM.
To configure this connector, follow the steps outlined in the configuration wizard.
Contentful
Contentful
The capabilities and sub-capabilities listed for this connector are available with any active Cortex XSIAM or Cortex Cloud Posture Security license.
This connector includes the following capabilities and sub-capabilities (if applicable):
- SaaS Posture Configuration Monitoring: Detect, monitor and alert on settings of your SAAS application.
- saas-posture-config-remediation: Help remediate the misconfigured security settings of your SAAS application.
To configure this connector, follow the steps outlined in the configuration wizard.
Corelight
Corelight Zeek
You can configure collecting Corelight Zeek logs using a Broker VM Syslog Collector applet or content pack integration (onboarded prior to July 26, 2026):
| Collection Method | Description |
|---|---|
| Syslog Collector applet overview | If you use Corelight Zeek sensors for network monitoring, you can forward network connection logs to Cortex XSIAM using the Broker VM Syslog Collector applet with TCP as the transport Protocol and a Corelight format. |
| Link to Syslog Collector applet instructions | Ingest logs from Corelight Zeek |
| Link to content pack/integration details (onboarded prior to July 26, 2026) | The Corelight Zeek content pack provides data normalization capabilities through rules for parsing and modeling network protocol logs that are ingested via a Syslog collector on the Broker VM into Cortex XSIAM. It includes Corelight Zeek Modeling Rules and Corelight Zeek Parsing Rules. |
Couchbase
Couchbase
This connector includes the following capabilities and sub-capabilities, if applicable:
- SaaS Posture Configuration Monitoring: Detect, monitor and alert on settings of your SaaS application.
- saas-posture-config-remediation: Help remediate the misconfigured security settings of your SaaS application.
To configure this connector, follow the steps outlined in the configuration wizard.
CounterTack
Here are the articles in this section:
CounterTack
Important
This connector is only available for tenants that onboarded after July 26, 2026. For tenants that onboarded before this date, use Marketplace to access the standalone integration. For more information, see Marketplace.
This connector is available with any active Cortex XSIAM or Cortex AgentiX license.
CounterTack is a predictive endpoint protection platform that empowers endpoint security teams to assure endpoint protection by identifying cyber threats.
This connector includes the following sub-capabilities (Marketplace integrations link to PAN DEV for more information):
- CounterTack: CounterTack empowers endpoint security teams to assure endpoint protection for Identifying Cyber Threats. Integrating a predictive endpoint protection platform.
To configure this connector, follow the steps outlined in the configuration wizard.
Coveo
Coveo
The capabilities and sub-capabilities listed for this connector are available with any active Cortex XSIAM or Cortex Cloud Posture Security license.
This connector includes the following capabilities and sub-capabilities (if applicable):
- SaaS Posture Configuration Monitoring: Detect, monitor and alert on settings of your SAAS application.
- saas-posture-config-remediation: Help remediate the misconfigured security settings of your SAAS application.
To configure this connector, follow the steps outlined in the configuration wizard.
Cribl
You can configure collecting Cribl data using a standard data source or connector (onboarded after July 26, 2026):
| Collection Method | Description |
|---|---|
| Standard data source overview | Forward data that Cribl collects from multiple data sources and streams to Cortex XSIAM using a Cribl data source. |
| Link to standard data source instructions | <p>Ingest data from Cribl</p><p>Configuring this data source includes this topic:</p><ul><li>Disable or delete Cribl integration</li><li>Data source UUIDs</li><li>Collect Windows Event Logs for Cortex XSIAM via Cribl</li></ul> |
| Link to connector (onboarded after July 26, 2026) | Cribl connector |
Ingest data from Cribl
The Cribl data collector is a standard, out-of-the-box integration that ingests data collected by Cribl from multiple sources and streams it to Cortex XSIAM. This integration ensures that all downstream capabilities, including advanced analytics, are fully available within the platform.
Because the onboarding configuration in Cribl directly impacts the output sent to Cortex XSIAM, certain sources must be implemented according to specific requirements to ensure compatibility.
Key requirements and recommendations
- Data integrity: Raw data must be collected and streamed "as-is" from the original vendor. Any modifications made within Cribl may interfere with how Cortex XSIAM processes the data.
- Format consistency: For data sources supporting multiple collection methods, Cortex XSIAM expects the data format to match its standard collectors.
- Palo Alto Networks products: For optimal results, it is recommended to ingest data from Palo Alto Networks products, such as Next-Generation Firewall, using dedicated Cortex XSIAM data collectors rather than through Cribl. Ingesting NGFW data via Cribl will omit the Enhanced Application Logging (EAL) layer.
Implementation workflow
Perform the following tasks in the order they appear:
Tasks 1 through 3 are typically performed once during the initial integration setup.
Task 1. Create New Data Sources in Cribl
Onboard your data sources in Cribl following the standard Cribl documentation.
Ensure you have the necessary credentials and IDs for each source, such as Tenant ID, App ID, and Client Secret.
- Collector selection: Use specific collectors from the Cribl catalog when available. If a dedicated collector does not exist, use the generic UUID collector. In this case, verify the log collection method and ensure the data format aligns with Cortex XSIAM ingestion requirements.
- Data segmentation: To ensure optimal performance, configure a separate Cribl source collector for each data type to make routing/filtering easier and more efficient. For example, configure separate collectors for Microsoft 365 users, groups, and contacts.
- Analytics support: Any data source can be ingested using the generic UUID collector with the correct vendor and product fields. Yet, while parsing and modeling rules can be applied to any source, out-of-the-box (OOTB) analytics are only available for data sources using dedicated UUIDs. For more information, see Data source UUIDs.
Task 2. Generate Credentials in Cortex XSIAM
Only one Cribl data collector instance can be configured in Cortex XSIAM. All Cribl sources will share this single connection.
- Select Settings → Data Sources & Integrations.
- Search for Cribl, select the integration, and click Add Instance.
- In the Name field, enter a descriptive name, and click Save & generate token.
- Copy the Authorization Token (by clicking the copy icon) and save it in a secure location immediately. You cannot access this token again once the dialog is closed.
- On the Data Sources & Integrations page, click the link icon for your Cribl instance to Copy API URL, and save it for future use.
Task 3. Configure the Cortex XSIAM destination in Cribl
Using the credentials from Task 2, configure the Cortex XSIAM destination tile in Cribl.
| Item | Field | Details |
|---|---|---|
| Cortex XSIAM URL | XSIAM Endpoint | Paste the API URL. |
| Authorization Token | Authorization Token | Paste the token. |
For general destination configuration details, see Cribl documentation.
Task 4. Apply the Palo Alto XSIAM pack and pipelines in Cribl
You must apply the Palo Alto XSIAM pack and configure a dedicated pipeline for each data source.
These steps differ depending on whether you are connecting to a specific data source supported from the Cortex XSIAM Cribl catalog or another product using the generic UUID. For a complete list of the supported data sources in the catalog, see Data source UUIDs.
Apply the XSIAM pack using a collector supported in the Cribl catalog
- Install the Palo Alto XSIAM pack.
- In Cribl, select Stream → Worker Groups, and select the default Worker Group that you want to add the pack to.
- Select Processing → Packs.
- Select Add Pack → Add from Dispensary.
- Search for XSIAM, and install the Palo Alto XSIAM pack.
-
Connect the data source to the XSIAM destination to define the route.
This step can be performed using either QuickConnect or Routes. The instructions below explain how to do this using QuickConnect.
- For the same default worker group, select the Overview tab.
- Under QuickConnect, click Source.
- Under Source, find the data source that you onboarded in Task 1, and from the
+icon drag and drop to the XSIAM destination to define the route.
- Assign the pack.
- Click on the line connecting the data source to the XSIAM destination, and click Pack.
- In the Add Pack to Connection window, select the Palo Alto XSIAM pack.
- Click Save.
-
End-to-end connection.
The pack includes built-in pipelines for supported sources. Each contains a specific UUID in the
__sourceIdentifierparameter. This UUID signals to the XSIAM destination, which data source is streaming.To enable the connection, the specific source must be enabled in the pack, and the pipeline must route the data using a filter using the format
__inputId=='data_source'. These filters are usually specific to the environment and is how Cribl Stream is configured.- For the same default worker group, select Processing → Packs.
- Under Display name, click Palo Alto XSIAM.
- On the left pane, expand the third row.
- Scroll down to the data source that you connected to XSIAM, enable the toggle.
-
Click on the name of the data source under Route to display the routing information, including the configured route name, filter, and pipeline. The values displayed here must match the data source connected to XSIAM.
To view the configuration of the pipeline, select the attachment icon → Eval. Under Evaluate fields, you can see the _sourceIdentifier configured, where the Value Expression field should match the UUID for the specific collector from the Cribl catalog. This UUID is automatically configured once you've enabled the data source in the pack.
- Click Save.
Apply XSIAM pack using generic UUID collector
If you wish to connect a data source not listed in the UUID Cribl catalog, use the generic UUID with the correct vendor and product fields. Make sure the vendor and the product match the existing content packs available in Cortex XSIAM.
- Install the Palo Alto XSIAM pack.
- In Cribl Stream → Worker Groups, select the default Worker Group that you want to add the pack to.
- Select Processing → Packs.
- Select Add Pack → Add from Dispensary.
- Search for XSIAM, and install the Palo Alto XSIAM pack.
- Create a dedicated pipeline for the new data source to the Palo Alto XSIAM pack, such as Fortinet Fortigate.
- For the same default worker group, select Processing → Pipelines.
- Select Add Pipeline → Add Pipeline.
- In the ID field, provide a name for this data source, such as GenericDataSource.
- Click Save.
- Add three additional fields to this pipeline.
- Click Add Function, search for Eval, and select Eval.
- Under Evaluate fields, select Add Field, and define the following fields:
- Fields 1:
- Name:
__sourceIdentifier - Value Expression:
'af01292940d7426594d3d3e55ae17ee0', which is the Generic UUID.
- Name:
- Field 2:
- Name:
__vendor - Value Expression:
<name of vendor>, such as'fortinet'.
- Name:
- Field 3:
- Name:
__product - Value Expression:
<name of product>, such as'fortigate
- Name:
- Fields 1:
Note
Data streams into the vendor_product_raw dataset in Cortex XSIAM. It should match an existing Marketplace content pack.
- Create a dedicated route between the data source and the newly-created pipeline.
- Select the Routes tab, and click Add Route.
- Configure the following:
- Route name: Enter a distinct name for the route.
- Filter: Enter or select a filter using the format
__inputId=='data_source'so the the pipeline can route the data from the data source. These filters are usually specific to the environment and is how Cribl Stream is configured. - Pipeline: Enter the name of the pipeline that you created above for the new generic data source, such as GenericDataSource as created above.
- Description (optional): Enter a description for this route.
- On the blue line of the new route, click the ellipse menu, and select Group Actions → Create Group.
- Define the following:
- Group name: Enter a generic name for these types of generic data sources , such as "Generic Data Sources with PANW assigned UUID".
- Description (optional): Enter a unique description.
- Click Save.
Task 5. Verification
Verify that data is streaming as expected from Cribl to Cortex XSIAM.
- In Cribl:
- Select Stream → Worker Groups, and select the default Worker Group that you want to add the pack to.
- In the Overview tab and under QuickConnect, click Source.
- Hover over the data source that you connected to Cortex XSIAM, and click Configure.
- In the Charts tab, verify that streaming is in progress.
- In Cortex XSIAM, on the Data Sources & Integrations page, when streaming begins, a green check mark appears below the Cribl configuration, along with the amount of data received.
\
\
Disable or delete Cribl integration
Use the Disable and Delete options with extreme caution.
- Disabling the integration will cease streaming from Cribl.
- Deleting the integration will erase the integration completely and will require reconfiguration, because the original authorization token will be lost.
Disable the integration with Cribl
- To disable the integration, in Cortex XSIAM, search for the Cribl integration on the Data Sources & Integrations page, and clear the Enable checkbox.
- In the Are you sure? dialog box, type
disable, and then click Disable.
Delete the integration with Cribl
- To delete the Cribl integration, in Cortex XSIAM, search for the integration on the Data Sources & Integrations page, and click the integration's Delete icon.
- In the Are you sure? dialog box, type
delete, and then click Delete.
Data souce UUIDs
This table lists the Cribl catalog for the the specific collectors supported. If a dedicated collector does not exist, use the generic UUID collector.
Any data source can be ingested using the generic UUID collector with the correct vendor and product fields. Yet, while parsing and modeling rules can be applied to any source, out-of-the-box (OOTB) analytics are only available for data sources using dedicated UUIDs.
Indicate specific vendor name as not listed below (Generic)
| Product | UUID | Datasets | Collection Method |
|---|---|---|---|
| Indicate specific product name as not listed below (Generic) | <p>af01292940d7426594d3d3e55ae17ee0</p><p>Do not use this generic UUID when your data source is listed in this table.</p> | <Vendor>_<Product>_raw |
Amazon
| Product | UUID | Datasets | Collection Method |
|---|---|---|---|
| AWS audit logs | c19f87b6262f48259b3d5d2a2c691802 | amazon_aws_raw |
These AWS logs are collected via Amazon S3. To ensure compatibility, see Ingest audit logs from AWS Cloud Trail. |
| AWS EKS | fb8a9d4922cb4095b76d71e921d2d999 | amazon_eks_raw |
These AWS logs are collected via Amazon CloudWatch. To ensure collector compatibility, see Ingest logs from Amazon CloudWatch. |
| AWS flow logs | 667083aa68544eee8b67cdd2d4cc327b | amazon_aws_raw |
These logs are collected via Amazon S3. To ensure collector compatibility, see Ingest network flow logs from Amazon S3. |
| AWS generic logs | 0498f8a24de04b3e85102e742f6783f8 | amazon_aws_raw |
These logs are collected via Amazon S3. To ensure collector compatibility, see Ingest generic logs from Amazon S3. |
| AWS prompt logs | a53edad7ef0c46ffb5037fb2e21520cb | amazon_aws_raw |
For setup details, see Prompt log collection in AWS. |
| AWS Route 53 logs | <ul><li>d57ae82c1e2a4d138fc34084d159b09e (old)</li><li>0a7544038b444998a20e698669817e3d (new)</li></ul> | <ul><li>amazon_route53_raw (via old UUID)</li><li>amazon_route53_raw (via new UUID)</li></ul> |
These logs are collected via Amazon S3. Using the old UUID routes data to the generic AWS dataset. For native routing to the Route 53 dataset, use the new dedicated UUID. To ensure collector compatibility, see Ingest network Route 53 logs from Amazon S3. |
Box
| Product | UUID | Datasets | Collection Method |
|---|---|---|---|
| Box | 3ef05d14ae9349f8bbd48c8a4797334a | <ul><li>Events (admin_logs): box_admin_logs_raw</li><li>Box Shield Alerts: box_shield_alerts_raw</li><li>Users: box_users_raw</li><li>Groups: box_groups_raw</li></ul> |
<p>The BOX_DIRECTORIES connector queries the following Box API endpoints:</p><ul><li><p>Users</p><ul><li>Endpoint: https://api.box.com/2.0/users</li><li>Purpose: To fetch the list of users in Box enterprise.</li></ul></li><li><p>Groups</p><ul><li>Endpoint: https://api.box.com/2.0/groups</li><li>Purpose: To fetch the list of groups in Box enterprise.</li></ul></li></ul><p>For setup details, see Ingest logs and data from Box.</p> |
CrowdStrike
| Product | UUID | Datasets | Collection Method |
|---|---|---|---|
| Falcon incident | 230b2b0233bf4327806af72e6e5769f3 | crowdstrike_falcon_incident_raw |
<p>Currently not supported by Cribl</p><p>CrowdStrike Streaming API</p><p>Base URL: https://api.crowdstrike.com (or api.us-2.crowdstrike.com, api.eu-1.crowdstrike.com, etc.)</p><p>GET /sensors/entities/datafeed/v2</p><p>For setup details, see Ingest alerts and metadata from CrowdStrike APIs.</p> |
| Hosts | 8b673ac8e2f34b4a8dc14c22f0e6063b | crowdstrike_hosts_raw |
<p>CrowdStrike Devices API</p><p>GET /devices/queries/devices-scroll/v1</p><p>POST /devices/entities/devices/v2</p><p>For setup details, see Ingest alerts and metadata from CrowdStrike APIs.</p> |
Dropbox
| Product | UUID | Datasets | Collection Method |
|---|---|---|---|
| Directory | e8d2c52bc9594621924fab0507264586 | <ul><li>dropbox_members_devices_raw</li><li>dropbox_users_raw</li><li>dropbox_groups_raw</li></ul> |
<p>Base URL: https://api.dropboxapi.com</p><ul><li><p>Users (dropbox_users_raw)</p><ul><li>Endpoint: /2/team/members/list_v2</li></ul></li><li><p>Groups (dropbox_groups_raw)</p><ul><li>Endpoint: /2/team/groups/list</li></ul></li><li><p>Devices (dropbox_member_devices_raw)</p><ul><li>Endpoint: /2/team/devices/list_members_devices</li></ul></li></ul><p>For setup details, see Ingest logs and data from Dropbox.</p> |
| Events | a6322b2fd9e545e0a4223ba754c48fb9 | dropbox_events_raw |
<p>Base URL: https://api.dropboxapi.com</p><p>Endpoint: /2/team_log/get_events</p><p>For setup details, see Ingest logs and data from Dropbox.</p> |
| Product | UUID | Datasets | Collection Method |
|---|---|---|---|
| Cloud Logging (audit logs/flow logs) | 00a8322c85e14beabfa7ad5f3d62db73 | google_cloud_logging_raw |
For setup details, see Ingest logs and data from a GCP Pub/Sub. |
| Gmail | 8607490288d1407ba82b5c5ad9dc64a0 | google_gmail_raw |
<p>GET https://gmail.googleapis.com/gmail/v1/users/{userId}/messages</p><p>For setup details, see Ingest logs and data from Google Workspace.</p> |
| Workspace alerts | 4f263650cd29475c81f2ff953cf19827 | google_workspace_alerts_raw |
<p>Description: Ingests security and system alerts from the Google Workspace Alert Center.</p><ul><li><p>API Details</p><ul><li>API Name: Google Alert Center API</li><li>Version: v1beta1</li><li>Base URL: https://alertcenter.googleapis.com</li><li>Endpoint: /v1beta1/alerts</li><li>Method: GET (List)</li><li>OAuth Scope: https://www.googleapis.com/auth/apps.alerts</li></ul></li><li><p>Request Parameters</p><ul><li>filter: Used for incremental ingestion based on createTime.</li><li>Format: createTime >= "[TIMESTAMP_START]" AND createTime < "[TIMESTAMP_END]"</li><li>orderBy: createTime asc</li><li>pageToken: Used for pagination.</li></ul></li><li><p>Data Mapping</p><ul><li>Source: The full JSON response object from the alerts list.</li><li>Destination: Each alert object is ingested as a single record.</li></ul></li></ul><p>For setup details, see Ingest logs and data from Google Workspace.</p> |
| Workspace ChromeOS devices | e82ae276e6b9442fa80920a03d2a38d6 | google_workspace_chrome_raw |
<p>GET https://admin.googleapis.com/admin/directory/v1/customer/{customer}/devices/chromeos</p><p>For setup details, see Ingest logs and data from Google Workspace.</p> |
| Workspace groups | 689ae8ef14e848e3855b81e91d8af9bc | google_workspace_enterprise_groups_raw |
<p>GET https://admin.googleapis.com/admin/directory/v1/groups</p><p>For setup details, see Ingest logs and data from Google Workspace.</p> |
| Workspace rules | 2621aaf3334a4147ae727afe84db31a9 | google_workspace_rules_raw |
<p>GET https://gmail.googleapis.com/gmail/v1/users/{userId}/settings/filters</p><p>For setup details, see Ingest logs and data from Google Workspace.</p> |
| Workspace users | 359ecd845fa54caab6ddb4b7c7a2764d | google_workspace_user_acounts_raw |
<p>GET https://admin.googleapis.com/admin/directory/v1/users/{userKey}</p><p>For setup details, see Ingest logs and data from Google Workspace.</p> |
Microsoft
| Product | UUID | Datasets | Collection Method |
|---|---|---|---|
| Azure | fce13a1d51294f84bae4a37851503060 | msft_azure_raw |
Azure Event Hubs SDK (AMQP): For setup details, see Ingest logs from Microsoft Azure Event Hub. |
| Azure AD | c00d6d52e5b141a8baa8db9d9345423d | msft_azure_ad_raw |
For set up details, see Ingest logs from Microsoft Office 365. |
| Azure AD audit | 0e076d5abe864bf78e8145ea9e0d749e | msft_azure_ad_audit_raw |
<p>Microsoft Graph API: GET /v1.0/auditLogs/directoryaudits</p><p>For set up details, see Ingest logs from Microsoft Office 365.</p> |
| Azure AD sign-ins | f56dcfdf6bca43e793a4b6e9290e7b12 | msft_azure_ad_raw |
<p>Microsoft Graph API: GET /v1.0/auditLogs/signIns</p><p>For set up details, see Ingest logs from Microsoft Office 365.</p> |
| Defender | ce9e8cf36e0742c38aa89787a256855f | msft_defender_raw |
<p>Azure Event Hubs SDK (AMQP): For setup details, see Ingest raw EDR events from Microsoft Defender for Endpoint.</p><p>To enable analytics, contact Customer Support.</p> |
| DHCP | b55819e8959c49728d5d98a6d87eafb6 | msft_dhcp_raw |
<p>File Collection: C:\Windows\System32\dhcp\DhcpSrvLog-*.log</p><p>For set up details, see Ingest logs from Windows DHCP using Elasticsearch Filebeat.</p> |
| Graph security alerts | 5619f2f691fc46c4b202587fdaa031c3 | msft_graph_security_alerts_raw |
<p>Microsoft Graph API: /v1.0/security/alerts_v2</p><p>For set up details, see Ingest logs from Microsoft Office 365.</p> |
| Office 365 Azure AD | e1f109f886ea42fbb96be6ec0cc597a9 | msft_o365_azure_ad_raw |
<p>The Base URLs for the APIs are (depending on the environment):</p><p>Worldwide: https://manage.office.com</p><p>GCC: https://manage-gcc.office.com</p><p>GCC High: https://manage.office365.us</p><p>DoD: https://manage.protection.apps.mil</p><p>Endpoints:</p><p>Start Subscription: /api/v1.0/{tenantID}/activity/feed/subscriptions/start?contentType={type}</p><p>List Available Content: /api/v1.0/{tenantID}/activity/feed/subscriptions/content?contentType={type}</p><p>Fetch Content Blob: Dynamic URI returned from the “List Available Content” call.</p><p>Content Types: audit.exchange, audit.sharepoint, audit.general, audit.azureactivedirectory, dlp.all.</p><p>For set up details, see Ingest logs from Microsoft Office 365.</p> |
| Office 365 DLP | 8f052782739d4b8389644cca23b994ac | msft_o365_dlp_raw |
<p>See Office 365 Azure AD.</p><p>For set up details, see Ingest logs from Microsoft Office 365.</p> |
| Office 365 domains | cae29fd87b554bd9a5694afb225e8dc9 | msft_o365_domains_raw |
Microsoft Graph API: GET /v1.0/domains |
| Office 365 Exchange Online | dee8e85ce7db4573a8bc21b807e1d73a | msft_o365_exchange_online_raw |
<p>See Office 365 Azure AD.</p><p>For set up details, see Ingest logs from Microsoft Office 365.</p> |
| Office 365 General | c7655e83805b4a058e66043a6715156c | msft_o365_general_raw |
<p>See Office 365 Azure AD.</p><p>For set up details, see Ingest logs from Microsoft Office 365.</p> |
| Office 365 Sharepoint Online | 3a37f519e9094a3f8c4185fa572cd111 | msft_o365_sharepoint_online_raw |
<p>See Office 365 Azure AD.</p><p>For set up details, see Ingest logs from Microsoft Office 365.</p> |
| Office 365 contacts (email) | de1b694a6c8341958bc08c4b7c140874 | msft_o365_contacts_raw |
<p>Microsoft Graph API: GET /v1.0/users/{id}/mailFolders/inbox/messageRules</p><p>For set up details, see Ingest logs and data from Microsoft 365.</p> |
| Office 365 devices (email) | de229685f708413fad46289657ea09de | msft_o365_devices_raw |
<p>Microsoft Graph API: GET /v1.0/users/{id}/registeredDevices</p><p>For set up details, see Ingest logs and data from Microsoft 365.</p> |
| Office 365 groups (email) | 0b0499ac0d984145b201c6d674771dbf | msft_o365_groups_raw |
<p>Microsoft Graph API: GET /v1.0/groups</p><p>For set up details, see Ingest logs and data from Microsoft 365.</p> |
| Office 365 mailboxes (email) | 9855a03559ce4263b568671e695d1fa8 | msft_o365_mailboxes_raw |
<p>The Base URLs for the APIs are (depending on the environment): https://graph.microsoft.com</code> (or <code>https://graph.microsoft.us` for FedRAMP)</p><p>Incoming Messages: GET /v1.0/users/{id}/messages</p><p>Outgoing Messages: GET /v1.0/users/{id}/mailFolders/sentitems/messages/delta</p><p>For set up details, see Ingest logs and data from Microsoft 365.</p> |
| Office 365 rules (email) | 6b925df8923d4038bf78998d1ffde77c | msft_o365_rules_raw |
<p>Microsoft Graph API: /users/{id}/mailFolders/inbox/messageRules</p><p>For set up details, see Ingest logs and data from Microsoft 365.</p> |
| Office 365 users (email) | dcfb7a412e654efd868de0b8cf81766a | msft_o365_users_raw |
<p>Microsoft Graph API: GET /v1.0/users</p><p>For set up details, see Ingest logs and data from Microsoft 365.</p> |
| Windows Event Logs | 63b0fbeb501e4650896e7064d3412e14 | microsoft_windows_raw |
For more information, see Collect Windows Event Logs for Cortex XSIAM via Cribl. |
Okta
| Product | UUID | Datasets | Collection Method |
|---|---|---|---|
| SSO | 5faf4c1fdb8443d9920d6a54815432c1 | okta_sso_raw |
<p>Okta System Log API</p><p>Base URL: https://{your-okta-domain}.okta.com</p><p>GET /api/v1/logs</p><p>For set up details, see Ingest logs and data from Okta.</p> |
OneLogin
| Product | UUID | Datasets | Collection Method |
|---|---|---|---|
| Events | 22b23a3f9f1e49998645b683d5dc3a6f | onelogin_events_raw |
<p>Base URL: https://<subdomain>.onelogin.com</p><p>Endpoint: /api/1/events`</p><p>For set up details, see Ingest logs and data from OneLogin.</p> |
| OneLogin | 88cfbd3e7b974d999b10edac83995b8a | <ul><li>onelogin_users_raw</li><li>onelogin_groups_raw</li><li>onelogin_apps_raw</li></ul> |
<p>Base URL: https://<subdomain>.onelogin.com</p><p>Endpoints: /api/1/users/api/1/groups/api/2/apps</p><p>For set up details, see Ingest logs and data from OneLogin.</p> |
PingID
| Product | UUID | Datasets | Collection Method |
|---|---|---|---|
| PingONE | 924951a8394b4605b1725f943292ab4f | pingid_pingone_raw |
<p>PingOne API:</p><p>Base URL: https://admin-api.pingone.com</p><p>Endpoint: /v3/reports/{account_id}/poll-subscriptions/{subscription_id}/events</p><p>For set up details, see Ingest authentication logs and data from PingOne.</p> |
Proofpoint
| Product | UUID | Datasets | Collection Method |
|---|---|---|---|
| TAP | 3eefce0f791e4391a3643b8cf860a361 | proofpoint_tap_raw |
<p>API Base URL: https://tap-api-v2.proofpoint.com</p><p>Resource Path: /v2/siem/all</p><p>For set up details, see Ingest logs from Proofpoint Targeted Attack Protection.</p> |
Salesforce: Salesforce logs
| UUID | Datasets | Collection Method |
|---|---|---|
| ab109687acd24978aabcb7ad8b5742e3 | <ul><li>salesforce_login_raw</li><li>salesforce_audit_raw</li><li>salesforce_eventlogfile_raw</li></ul> |
<p>The data schema for salesforce_eventlogfile_raw is dynamic and not hardcoded in the data collector's source code.</p><p>Here's how it works:</p><p>Dynamic Field Discovery: The collector calls the Salesforce describe endpoint (/services/data/v56.0/sobjects/EventLogFile/describe) to retrieve the list of all available fields for the EventLogFile object.</p><p>Query Construction: It constructs a SOQL query selecting all these discovered fields, such as SELECT Id, LogFile, LogDate,.... FROM EventLogFile).</p><p>CSV to JSON: The downloaded log files are in CSV format. The collector converts each CSV row into a JSON object where the keys are the CSV headers (which correspond to the fields discovered in the Dynamic Field Discovery explained above).</p><p>For set up details, see Ingest logs and data from Salesforce.</p> |
Salesforce: Salesforce snapshots
| UUID | ||
|---|---|---|
| addbf31a6372491e88d45934dff5b5b0 | <p>The data fetched by this data collector is written to datasets based on the Salesforce object being retrieved. The data collector dynamically sets the Product field in the response to the name of the Salesforce object. Assuming the standard naming convention <vendor>_<product>_raw (where Vendor is salesforce); the data will be written to the following datasets (corresponding to the objects defined in consts.go):</p><ul><li>salesforce_ConnectedApplication_raw</li><li>salesforce_PermissionSet_raw</li><li>salesforce_Profile_raw</li><li>salesforce_GroupMember_raw</li><li>salesforce_Group_raw</li><li>salesforce_User_raw</li><li>salesforce_UserRole_raw</li><li>salesforce_TenantSecurityLogin_raw</li><li>salesforce_UserAccountTeamMember_raw</li><li>salesforce_TenantSecurityUserPerm_raw</li></ul> |
<p>Authentication:</p><p>Path: /services/oauth2/token</p><p>Purpose: Used for obtaining and refreshing access tokens.</p><p>Data Query:</p><p>Path: /services/data/v56.0/queryAll</p><p>Purpose: Used to execute SOQL queries to fetch records for the snapshot objects, such as User, Profile, and Group.</p><p>Object Description:</p><p>Path: /services/data/v56.0/sobjects/{object}/describe</p><p>Purpose: Used to dynamically retrieve the list of fields for a specific object before querying it.</p><p>All endpoints are relative to the base URL: https://{domain}.my.salesforce.com.</p><p>For set up details, see Ingest logs and data from Salesforce.</p> |
Sentinel One: Deep Visibility
| UUID | Datasets | Collection Method |
|---|---|---|
| b9fa55e6fa564c709358425ce0f61517 | sentinelone_deep_visibility_raw |
<p>For set up details, see Ingest raw EDR events from SentinelOne DeepVisibility.</p><p>To enable analytics, contact Customer Support.</p> |
Service Now: CDMB
| UUID | Datasets | Collection Method |
|---|---|---|
| 8b3e767247e44471a95e563378d0b9be | <p>servicenow_cmdb_</p><p><table name>_raw</p> | <p>ServiceNow Table API</p><p>Base URL: https://{instance}.service-now.com</p><p>GET /api/now/table/{table_name}</p><p>For set up details, see Ingest data from ServiceNow CMDB.</p> |
Workday
| UUID | Datasets | Collection Method |
|---|---|---|
| 00d4e740702d4eb2939a87c2318513dd | workday_workday_raw |
<p>Workday Report-as-a-Service (RaaS)</p><p>Endpoint: Configurable Report URL</p><p>For set up details, see Ingest report data from Workday.</p> |
Collect Windows Event Logs for Cortex XSIAM via Cribl
There are two primary methods for streaming Windows Event Logs to Cortex XSIAM using Cribl. The choice depends on whether you prefer a centralized, agentless architecture or a distributed, agent-based approach.
Avoid data duplication: Do not enable both WEF and Cribl Edge on the same endpoint for the same log channels.
For the general Cribl-to-XSIAM integration workflow (credentials, destination, XSIAM pack, and verification), see the Cribl integration documentation.
Comparison of collection methods
| Option | Method | Description |
|---|---|---|
| A | Cribl Stream + WEF | Agentless: Cribl Stream acts as the Windows Event Collector. Endpoints forward events via mutual TLS (port 5986). |
| B | Cribl Edge | Agent-based: The Cribl Edge agent is installed on every endpoint to read local logs directly. |
Optional A: Windows Event Forwarding (Agentless)
Use this method if you want to avoid installing software on every Windows endpoint. This requires existing Windows-side configurations for certificates and Group Policy. Cribl Stream receives Windows events directly from endpoints using the Windows Event Forwarder Source with mutual TLS authentication.
Windows endpoints must be configured to forward events to Cribl Stream. For the Windows-side configuration (certificate generation, Group Policy, Subscription Manager), see Cribl WEF Configuration Guide.
Task 1. Import the CA Certificate
Import the CA certificate that signed the client certificates on the Windows endpoints.
- In the Cribl Stream Worker Group UI, select Settings → Security → Certificates → New Certificate.
-
Cribl Stream requires every CA certificate to be accompanied by a cert/key pair. Generate a placeholder pair:
openssl req -x509 -newkey rsa:2048 -nodes -keyout key.pem -out cert.pem -sha256 -days 365 -subj "/CN=placeholder"
- Configure the certificate:
- Certificate: Paste the placeholder
cert.pemcontents. - Private key: Paste the placeholder
key.pemcontents. - CA certificate: Paste the CA certificate PEM from your Windows environment.
- Certificate: Paste the placeholder
- If the client certificates contain a CA chain (root and intermediate signers), import the entire chain. Concatenate the PEM files in the CA certificate field, ordered from host to root CA.
- Save the certificate configuration.
Task 2. Create the WEF source
- Select Data → Sources → Push → Windows Event Forwarder → New Source.
- Configure General Settings:
- Input ID: Enter a descriptive name, such as wef-windows-events.
- Address:
0.0.0.0 - Port:
5986(do not change as this is the WEF mTLS port) - Authentication method: Client certificate
- Configure Certificate Settings:
- Certificate: Select the certificate created in Task 1.
- Private key path: For Cribl.Cloud, use
/opt/criblcerts/criblcloud.key - Certificate path: For Cribl.Cloud, use
/opt/criblcerts/criblcloud.crt
- Configure Advanced Settings:
- MachineID Mismatch: Set to Yes if using a shared certificate, or No if using auto-enrollment for higher security.
Configure subscriptions
- In the WEF Source configuration, click Subscriptions in the left navigation.
-
Add the event log channels to collect:
Query Path Query Expression Security*[System]System*[System]Application*[System]Microsoft-Windows-Sysmon/Operational*[System] -
Save, Commit, and Deploy the configuration.
All settings, including certificate configuration, only take effect after committing and deploying.
Option B: Cribl Edge Direct Windows Event Collection
Cribl Edge collects Windows Event Logs directly from the endpoint where it is installed.
Task 1. Deploy Cribl Edge
- Download the Cribl Edge MSI from the Cribl portal.
- Install the Edge agent on the target Windows machine.
- Verify the Edge node appears in the Cribl Edge interface under Fleet.
Task 2. Add a Windows Event Logs Source
- In the Cribl Edge interface, add a new Windows Event Logs source tile.
-
Configure the event logs to collect:
Event Log Name Description SecurityWindows Security events SystemWindows System events ApplicationWindows Application events Microsoft-Windows-Sysmon/OperationalSysmon events (requires Sysmon installed on the endpoint)
Task 3. Configure Optional Settings
Expand the Optional Settings section and set the following:
| Setting | Value | Reason |
|---|---|---|
| Read Mode | Entire log |
Ensures complete data ingestion from the beginning of the log |
| Event Format | XML |
Guarantees properly structured data for downstream parsing in Cortex XSIAM |
Task 4. Save and deply
Save the source configuration and deploy to the Edge node.
\
\
Cribl connector
Important
This connector is only available for tenants that onboarded after July 26, 2026. For tenants that onboarded before this date, use Marketplace to access the standalone integration. For more information, see Marketplace.
This connector is available with any active Cortex XSIAM, Cortex Cloud Posture Security with the Application Security Posture Management (ASPM) module, Cortex Cloud, Cortex Cloud Runtime Security, Cortex XDR, or Cortex AgentiX license with the Attack Surface Management (ASM), Exposure Management, or Threat Intel Management (TIM) add-on.
Cribl Search is a search solution that allows you to query, retrieve, and manage search jobs, datasets, and saved searches across your Cribl Cloud deployment.
This connector includes the following sub-capabilities (Marketplace integrations link to PAN DEV for more information):
- CriblSearch: Cribl Search allows you to query, retrieve, and manage search jobs, datasets, and saved searches across your Cribl Cloud deployment.
To configure this connector, follow the steps outlined in the configuration wizard.
CrowdStrike
Here are the articles in this section:
Crowdstrike APIs
You can configure collecting CrowdStrike API real-time alerts and logs using a standard collector:
| Collection Method | Description |
|---|---|
| Standard collector overview | Forward CrowdStrike API real-time alerts and logs to Cortex XSIAM using the CrowdStrike Platform data source. |
| Link to standard collector instructions | Ingest alerts and metadata from CrowdStrike APIs |
Ingest alerts and metadata from Crowdstrike APIs
To enable some of the APIs, you may need to reach out to CrowdStrike support.
To receive CrowdStrike API real-time alerts and logs, you must first configure data collection from CrowdStrike APIs. You can then configure the data source settings in Cortex XSIAM for the CrowdStrike APIs.
For more information on configuring data collection from CrowdStrike APIs, see the CrowdStrike Documentation.
When Cortex XSIAM begins receiving alerts and logs, it automatically creates a CrowdStrike API XQL dataset (crowdstrike_falcon_incident_raw). You can use the issues created by Cortex XSIAM in rules, and search the logs using XQL Search. For example queries, refer to the in-app XQL Library.
In order to ingest alert and host data, they must be configured correctly at both the CrowdStrike and the Cortex XSIAM sides, as explained in the following steps.
-
Configure data collection from CrowdStrike APIs.
- In the CrowdStrike Falcon application, select
 Support → API Clients and Keys.
 - Under the OAuth2 API Clients section, Add new API client.
- Configure your new API client with these settings
- CLIENT NAME: Specify a name for the new API client.
- DESCRIPTION: (Optional) Specify a description for the new API client.
- API SCOPES → Event streams: Select the Read permissions check box.
- API SCOPES → Hosts: Select the Read permissions check box.
- Click ADD.
-
Copy the values for the CLIENT ID, SECRET, and BASE URL, and save them, because you will need them when you configure the Data Collection settings in Cortex XSIAM.
Ensure that you save the SECRET value because this is the only time that it is displayed
f. Click DONE.
- In the CrowdStrike Falcon application, select
-
Configure the CrowdStrike Platform collection in Cortex XSIAM.
- Navigate to Settings → Data Sources & Integrations.
- On the Data Sources & Integrations page, click + Add New, search for CrowdStrike Platform, then hover over it and click Add.
- Set these parameters:
- Name: Specify a descriptive name for your log collection configuration, preferably the same CLIENT NAME used when adding a new client API in the CrowdStrike Falcon application, as explained above.
- Base URL: Specify the BASE URL you received when you created the client API in the CrowdStrike Falcon application, as explained above.
- Client ID: Specify the CLIENT ID you received when you created the client API in the CrowdStrike Falcon application, as explained above.
- Secret: Specify the SECRET you received when you created the client API in the CrowdStrike Falcon application, as explained above.
- Collect: Select the items that you want to collect (Alerts, Hosts).
- Click Test to validate access, and then click Enable.
When events start to come in, a green check mark appears below the CrowdStrike Platform configuration, along with the amount of data received.
CrowdStrike Falcon Data Replicator
You can configure collecting raw EDR event data from CrowdStrike Falcon Data Replicator (FDR) using a standard data source, content pack integration (onboarded prior to July 26, 2026), or connector (onboarded after July 26, 2026):
| Collection Method | Description |
|---|---|
| Standard collector overview | Forward raw EDR event data from CrowdStrike Falcon Data Replicator (FDR), streamed to Amazon S3, and Cortex XSIAM using the CrowdStrike Falcon Data Replicator data source. In addition to all standard SIEM capabilities, this integration unlocks some advanced Cortex XSIAM features, enabling comprehensive analysis of data from all sources, enhanced detection and response, and deeper visibility into CrowdStrike FDR data. |
| Link to standard collector instructions | Ingest raw EDR events from CrowdStrike Falcon Data Replicator |
| Links to content pack integration details (onboarded prior to July 26, 2026) | <p>The CrowdStrike Falcon content pack contains automations to load the CrowdStrike process file content and transform the data . It also includes the following integration:</p><ul><li>CrowdStrike Falcon: Use this integration to perform endpoint security operations such as fetching and resolving detections, searching devices, getting behaviors by ID, containing hosts, and lifting host containment. It includes commands for immediate actions, including searching devices, resolving detections, running remote commands on hosts, and managing custom Indicators of Compromise (IOCs).</li></ul> |
| Link to connector (onboarded after July 26, 2026) | CrowdStrike |
Ingest raw EDR events from CrowdStrike Falcon Data Replicator
Cortex XSIAM enables ingestion of raw EDR event data from CrowdStrike Falcon Data Replicator (FDR), streamed to Amazon S3. In addition to all standard SIEM capabilities, this integration unlocks some advanced Cortex XSIAM features, enabling comprehensive analysis of data from all sources, enhanced detection and response, and deeper visibility into CrowdStrike FDR data.
Key benefits include:
- Querying all raw event data received from CrowdStrike FDR using XQL.
- Querying critical modeled and unified EDR data via the
xdr_datadataset. - Enriching case and issue investigations with relevant context.
- Grouping issues with issues from other sources to accelerate the scoping process of cases, and to cut investigation time.
- Leveraging the data for analytics-based detection.
- Utilizing the data for rule-based detection, including correlation rules, BIOC, and IOC.
- Leveraging the data within playbooks for case response.
When Cortex XSIAM begins receiving EDR events from CrowdStrike FDR, it automatically creates a new dataset labeled crowdstrike_fdr_raw, allowing you to query all CrowdStrike FDR events using XQL. For example XQL queries, refer to the in-app XQL Library.
In addition, Cortex XSIAM parses and maps critical data into the xdr_data dataset and XDM data model, enabling unified querying and investigation across all supported EDR vendors' data, and unlocking key benefits like stitching and advanced analytics. While mapped data from all supported EDR vendors, including CrowdStrike, will be available in the xdr_data dataset, it's important to note that third-party EDR data present some limitations.
Third-party agents, including CrowdStrike, typically provide less data compared to our native agents, and do not include the same level of optimization for causality analysis and cloud-based analytics. Furthermore, external EDR rate limits and filters might restrict the availability of critical data required for comprehensive analytics. As a result, only a subset of our analytics-based detectors will function with third-party EDR data.
Raw event data from CrowdStrike FDR lacks key contextual information. To enhance its usability, we allocate additional resources to stitch it with other event data and data sources. Therefore, enabling the CrowdStrike FDR integration might temporarily make the tenant unavailable for a maintenance period of up to an hour.
We are continuously enhancing our support and using advanced techniques to enrich missing third-party data, while somehow replicating some proprietary functionalities available with our agents. This approach maximizes value for our customers using third-party EDRs within existing constraints. However, it’s important to recognize that the level of comprehensiveness achieved with our native agents cannot be matched, as much of the logic happens on the agent itself. These capabilities are unique, and are not found in typical SIEMs. Many of them, along with their underlying logic, are patented by Palo Alto Networks. Therefore, they should be regarded as added value beyond standard SIEM functionalities for customers who are not using our agents.
Ensure that your organization has a license for the CrowdStrike Falcon Data Replicator (FDR).
Ensure that CrowdStrike FDR is enabled. CrowdStrike FDR can only be enabled by CrowdStrike Support. If CrowdStrike FDR is not enabled, submit a support ticket through the CrowdStrike support portal.
Follow these steps to check if CrowdStrike FDR is enabled:
- Log in to the CrowdStrike Falcon user interface using an account that has view/create permission for the API clients and keys page.
- Navigate to Support → API Clients and Keys.
- Verify that FDR AWS S3 Credentials and SQS Queue is listed.
- CrowdStrike can provide multiple streams. It can only be read once per stream.
- For more information on configuring data collection from CrowdStrike via Falcon Data Replicator, see CrowdStrike documentation.
Task 1. Create a CrowdStrike FDR feed
- In the CrowdStrike user interface, select Support and resources → Resources and Tools → Falcon data replicator.
- Click the FDR feeds tab.
- Click Create feed.
- Enter a feed name.
- In Falcon Flight Control deployments, there is an option called Select which CID will manage this feed. In typical environments, the parent CID manages the feed for all of its child CIDs. This creates an aggregated feed that has data from all of the child CIDs. For information about aggregated feeds, and how they compare to individual feeds, see CrowdStrike documentation.
- To set up an aggregated feed, select the parent CID.
- To set up an individual feed, select a child CID or select both a parent CID and the Exclude Child CIDs option.
- To exclude only some of the child CIDs, don’t select the Exclude Child CIDs option. Instead, select Customize your FDR feed in the next step.
- Set the feed status.
- Select the method for creating your feed, from the following options:
- Create your FDR feed with default settings, where you get the recommended settings, including all current and future events, all secondary events (if available), and no partitions.
- Customize your FDR feed, where you start with the option to use a filter to get the specific events that you want in the feed. You can then customize secondary events and partitioning.
- Include secondary events. They are required for data stitching and enrichment.
- Optionally, in Flight Control deployments, edit the existing child CIDs included in the feed, and choose whether future CIDs are automatically included, by using the Include future CIDs option.
- Click Create feed.
- From the summary page that appears, copy and save all the information shown on the page somewhere safe, for later use. This page includes the credentials that are required for setting up an SQS consumer.
Ensure that you copy the Secret, and store it in a safe place. You will not be able to retrieve it later. If you need a new secret, you must reset the feed credentials.
Task 2. Configure Crowdstrike Falcon Data Replicator
- Log in to CrowdStrike Falcon using an account that has view/create permission for the API clients and keys page.
- Navigate to Support → API Clients and Keys.
-
On the same line as FDR AWS S3 Credentials and SQS Queue, click Create new credentials.
CrowdStrike Falcon Data Replicator only supports one FDR credential configuration.
- Configure your new FDR credentials.\
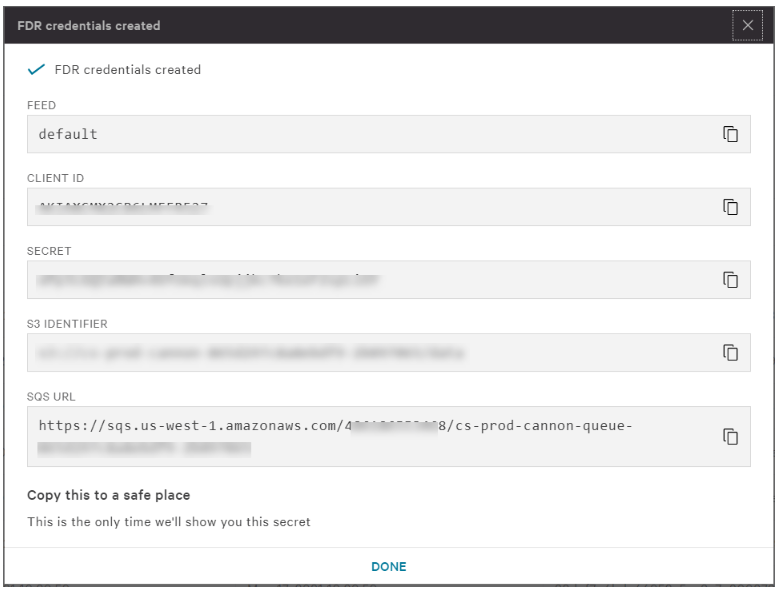
- Copy the values for the CLIENT ID, SECRET, S3 IDENTIFIER, and SQS URL, and save them somewhere safe, because you will need them when you configure data collection in Cortex XSIAM.
Ensure that you save the SECRET value, because this is the only time that it is displayed. You can go back to this page later to copy the other credentials, but you will not have access to the secret again.
6. Click DONE.
Task 3. Configure ingesting into Cortex XSIAM
- Navigate to Settings → Data Sources & Integrations.
- On the Data Sources & Integrations page, click + Add New, search for CrowdStrike Falcon Data Replicator, then hover over it and click Add.
- Set these parameters:
- Name: Specify a descriptive name for your log collection configuration.
- SQS URL: Specify the SQS URL you received when you created the FDR credential in CrowdStrike Falcon, as explained above.
- AWS Client ID: Specify the CLIENT ID you received when you created the FDR credential in CrowdStrike Falcon, as explained above.
- AWS Client Secret: Specify the SECRET you received when you created the FDR credential in CrowdStrike Falcon, as explained above.
- Click Test to validate access, and then click Enable.
When events start to come in, a green check mark appears below the CrowdStrike Falcon Data Replicator configuration, along with the amount of data received.
CrowdStrike
Important
This connector is only available for tenants that onboarded after July 26, 2026. For tenants that onboarded before this date, use Marketplace to access the standalone integration. For more information, see Marketplace.
CrowdStrike Falcon is a leading Endpoint Protection Platform (EPP) that helps organizations quickly detect, analyze, block, and contain malicious attacks on enterprise endpoints and servers. It provides real-time response, vulnerability assessment, and host containment, along with a CrowdStrike Falcon Intel threat intelligence feed to help organizations defend against adversary activity.
This connector includes the following sub-capabilities (Marketplace integrations link to PAN DEV for more information):
- CrowdStrike Falcon Intel v2: CrowdStrike Threat intelligence service integration helps organizations defend themselves against adversary activity by investigating incidents, and accelerating alert triage and response. This sub-capability is available with any active Cortex XSIAM or Cortex AgentiX license.
- CrowdstrikeFalcon: The CrowdStrike Falcon OAuth 2 API (formerly the Falcon Firehose API), enables fetching and resolving detections, searching devices, getting behaviors by ID, containing hosts, and lifting host containment. This sub-capability is available with any active Cortex XSIAM or Cortex AgentiX license with the Exposure Management add-on.
To configure this connector, follow the steps outlined in the configuration wizard.
CryptoCurrency
CryptoCurrency
Important
This connector is only available for tenants that onboarded after July 26, 2026. For tenants that onboarded before this date, use Marketplace to access the standalone integration. For more information, see Marketplace.
This connector is available with any active Cortex XSIAM or Cortex AgentiX license.
Classify Cryptocurrency indicators as suspicious when they are ingested. Supported cryptocurrencies: bitcoin.
This connector includes the following sub-capabilities (Marketplace integrations link to PAN DEV for more information):
- Cryptocurrency: Cryptocurrency will help classify Cryptocurrency indicators with the configured score when ingested.
To configure this connector, follow the steps outlined in the configuration wizard.
Cuckoo Sandbox
Cuckoo Sandbox
Important
This connector is only available for tenants that onboarded after July 26, 2026. For tenants that onboarded before this date, use Marketplace to access the standalone integration. For more information, see Marketplace.
This connector is available with any active Cortex XSIAM or Cortex AgentiX license.
Cuckoo Sandbox is an automated malware analysis system. Analyze files and URLs in a safe environment (sandbox) and view Cuckoo's tasks and machines.
This connector includes the following sub-capabilities (Marketplace integrations link to PAN DEV for more information):
- Cuckoo Sandbox: Malware dynamic analysis sandboxing.
To configure this connector, follow the steps outlined in the configuration wizard.
Cursor
Cursor
The capabilities and sub-capabilities listed for this connector are available with any active Cortex Cloud Posture Security license.
This connector includes the following capabilities and sub-capabilities (if applicable):
- Agent Security Scanning
To configure this connector, follow the steps outlined in the configuration wizard.
CybelAngel
CybelAngel
Important
This connector is only available for tenants that onboarded after July 26, 2026. For tenants that onboarded before this date, use Marketplace to access the standalone integration. For more information, see Marketplace.
This connector is available with any active Cortex XSIAM or Cortex AgentiX license.
CybelAngel is a cybersecurity firm specializing in external attack surface protection and management. This connector receives reports from the CybelAngel platform, providing advanced EASM protection for enhanced security.
This connector includes the following sub-capabilities (Marketplace integrations link to PAN DEV for more information):
- CybelAngel Event Collector: CybelAngel collects reports from the CybelAngel platform, which specializes in external attack surface protection and management.
To configure this connector, follow the steps outlined in the configuration wizard.
CyberArk
Here are the articles in this section:
CyberArk
Important
This connector is only available for tenants that onboarded after July 26, 2026. For tenants that onboarded before this date, use Marketplace to access the standalone integration. For more information, see Marketplace.
CyberArk secures human and machine identities across hybrid and multi-cloud environments. This connector collects audit and authentication events from the CyberArk Identity Security Platform, CyberArk Identity, and CyberArk Endpoint Privilege Manager (EPM), activates and deactivates EPM risk plans for endpoints as a SOC response, and retrieves certificate information from CyberArk Certificate Manager.
This connector includes the following sub-capabilities (Marketplace integrations link to PAN DEV for more information):
- CyberArk Identity Event Collector: This integration collects events from the Idaptive Next-Gen Access (INGA) using REST APIs. This sub-capability is available with any active Cortex XSIAM license.
- CyberArkEPMEventCollector: CyberArk EPM Event Collector fetches events. This sub-capability is available with any active Cortex XSIAM, Cortex Cloud, Cortex Cloud Runtime Security, or Cortex XDR license.
- CyberArkEPMSOCResponse: Use the CyberArk EPM integration to activate and deactivate CyberArk EPM risk plans for specific endpoints. This sub-capability is available with any active Cortex XSIAM, Cortex XDR, or Cortex AgentiX license.
- CyberArkISP: CyberArk Identity Security Platform secures human and machine identities across hybrid/multi-cloud environments with intelligent privilege controls, AI-driven threat detection, and Zero Trust enforcement. This sub-capability is available with any active Cortex XSIAM license.
- VenafiTLSProtect: This sub-capability is available with any active Cortex XSIAM or Cortex AgentiX license.
To configure this connector, follow the steps outlined in the configuration wizard.
Cyber Triage
Here are the articles in this section:
Cyber Triage
Important
This connector is only available for tenants that onboarded after July 26, 2026. For tenants that onboarded before this date, use Marketplace to access the standalone integration. For more information, see Marketplace.
This connector is available with any active Cortex XSIAM or Cortex AgentiX license.
Collect and analyze endpoint data using Cyber Triage. It sends an agentless collection tool to a remote endpoint, retrieves volatile and file system data, and analyzes it for evidence of an intrusion. Requires the Team version of Cyber Triage (not the Standalone desktop version).
This connector includes the following sub-capabilities (Marketplace integrations link to PAN DEV for more information):
- Cyber Triage: Allows you to conduct a mini-forensic investigation on an endpoint. It pushes a collection tool to the remote endpoint, collects volatile and file system data, and analyzes the data.
To configure this connector, follow the steps outlined in the configuration wizard.
CYFIRMA
Here are the articles in this section:
- cyfirma Configure the CYFIRMA connector for Cortex XSIAM.
CYFIRMA
Important
This connector is only available for tenants that onboarded after July 26, 2026. For tenants that onboarded before this date, use Marketplace to access the standalone integration. For more information, see Marketplace.
This connector is available with any active Cortex XSIAM license.
CYFIRMA's core platform, DeCYFIR, combines cyber threat intelligence with attack surface discovery and digital risk protection to deliver predictive, personalized, contextual, and multi-layered threat intelligence. This connector collects Access Logs, Asset Logs, and Digital Risk Keyword Logs automatically from DeCYFIR into Cortex XSIAM.
This connector includes the following sub-capabilities (Marketplace integrations link to PAN DEV for more information):
- DecyfirEventCollector: Collects event logs from DeCYFIR for ingestion into Cortex XSIAM.
To configure this connector, follow the steps outlined in the configuration wizard.
Darktrace
Here are the articles in this section:
Darktrace
Important
This connector is only available for tenants that onboarded after July 26, 2026. For tenants that onboarded before this date, use Marketplace to access the standalone integration. For more information, see Marketplace.
This connector is available with any active Cortex XSIAM license.
Enrich your security operations with Darktrace's self-learning AI. This connector fetches a list of model breaches, filtered by the specified parameters, so anomalous activity across your network, SaaS, cloud, and industrial environments is available alongside your other security data. Alerts from the connector populate as issues.
This connector includes the following sub-capabilities (Marketplace integrations link to PAN DEV for more information):
- Darktrace Event Collector: Use this integration to fetch model breaches from Darktrace as events in XSIAM.
To configure this connector, follow the steps outlined in the configuration wizard.
Databricks
You can configure collecting Databricks logs using a Cloud Posture and Runtime Security data source or connector:
| Collection Method | Description |
|---|---|
| Cloud Posture and Runtime Security data source overview | Add the Databricks platform as a third-party data source. |
| Link to Cloud Posture and Runtime Security data source instructions | How to onboard Databricks |
| Link to connector | Databricks |
How to onboard Databricks
This feature is included with a Cortex XSIAM Premium license. It is also included with any other Cortex XSIAM license that has the Cloud Posture Security or Cloud Runtime Security add-on.
You can add the Databricks platform as a third-party data source in Cortex Cloud Data Security.
Prerequisites
- In order to use Databricks, you must be registered.
- Make sure you have the following account permissions to onboard:
Account Admin: For information about this role, see Set up users, groups, and roles.Metastore Admin: Databricks admin that can only be assigned by anAccount Admin. Databricks recommends assigning this role to a group rather than an individual user in order to facilitate management and ensure continuity in case an individual leaves the organization.
- Make sure you have the following ID numbers at hand:
-
Account ID: Refers to the unique identifier of the user account.
How to find the Account ID
- Log in to the account console.
- In the account console, your user name should appear in the upper right corner of the page.
- Click the icon of your user name.
- Your account ID appears in the list.
-
Application ID: Refers to the unique identifier for a service principal in Databricks.
How to find the Application ID
- Log in to the account console.
- Click User Management and navigate to the Service Principals tab.
- Click the name of the service principal for which you need the Application ID. The service principal must also be the account admin.
- On the service principal settings page, navigate to the Configuration tab.
- The Application ID appears in the list.
-
Add the Databricks data source
To add the Databricks platform as a data source, you need to add configuration details, establish a connection, and then verify the connection.
Add configuration details
- Navigate to Settings → Data Sources & Integrations.
- On the Data Sources & Integrations page, click + Add New.
- On the Add Data Sources or Integrations page, search for Databricks, then hover over it and click Add.
- On the Databricks integration instance settings page, for the Configuration step do the following:
- Enter the display name for your Databricks integration instance.
- Enter your Databricks Account ID.
- Enter your Application ID.
- Select a cloud platform.
-
(Optional) Turn on the toggle for My Databricks account protected by network policies and select a region.
If you turn on this feature, both the cloud and region will be used for scanning, possibly incurring cost and requiring adherence to certain compliance policies.
- Click Next.
- Click Next.
Establish a connection
- For the Establish Connection step, you are now instructed to open your Databricks console in a new browser tab.
- On the Establish Connection tab, click the arrow to open the Generated script code block. Do one or both of the following:
- Click the cloud icon to download the .sh script file.
- Click the copy icon to copy the script to your clipboard.
- Run the script in your Databricks CLI.
- Click Verify Connection.
Verify the connection
- For the Verify Connection step, if the connection is verified, a confirmation message is displayed.
- Click Close.
Databricks now appears in the list of data sources on the Data Sources & Integrations page.
Verify the Cortex Gateway connection
At the end of the onboarding process, a pending request for Databricks approval is automatically created and displayed on the Cortex Gateway screen. In order to complete the onboarding process, approve the pending request. If you do not have permissions, contact your Cortex Cloud administrator.
For more information, see Egress configurations.
Databricks
Secure configurations and monitor identity risks across your Databricks environment.
This connector includes the following capabilities and sub-capabilities (if applicable):
- Identity Posture: Maintain visibility and control over Databricks identities, including users, groups, roles, and service principals. This capability is available with any active Cortex XSIAM, Cortex Cloud Posture Security, Cortex Cloud Runtime Security, or Cortex Data Security license.
- Groups: Ingest user groups from Databricks. This sub-capability is available with any active Cortex XSIAM, Cortex Cloud Posture Security, Cortex Cloud Runtime Security, or Cortex Data Security license.
- Roles: Ingest roles from Databricks. This sub-capability is available with any active Cortex XSIAM, Cortex Cloud Posture Security, Cortex Cloud Runtime Security, or Cortex Data Security license.
- Service Principals: Ingest service principals from Databricks. This sub-capability is available with any active Cortex XSIAM, Cortex Cloud Posture Security, Cortex Cloud Runtime Security, or Cortex Data Security license.
- Users: Ingest users from Databricks. This sub-capability is available with any active Cortex XSIAM, Cortex Cloud Posture Security, Cortex Cloud Runtime Security, or Cortex Data Security license.
- Security Posture: Detect, monitor and alert on settings of your SaaS application. This capability is available with any active Cortex XSIAM or Cortex Cloud Posture Security license.
- saas-posture-config-remediation: Help remediate the misconfigured security settings of your SaaS application. This sub-capability is available with any active Cortex XSIAM or Cortex Cloud Posture Security license.
To configure this connector, follow the steps outlined in the configuration wizard.
DataDog
Here are the articles in this section:
- datadog Configure the DataDog connector for Cortex XSIAM.
DataDog
The capabilities and sub-capabilities listed for this connector are available with any active Cortex XSIAM or Cortex Cloud Posture Security license.
This connector includes the following capabilities and sub-capabilities (if applicable):
- Security Posture: Detect, monitor and alert on settings of your SaaS application.
saas-posture-config-remediation: Help remediate the misconfigured security settings of your SaaS application.
To configure this connector, follow the steps outlined in the configuration wizard.
DeHashed
Here are the articles in this section:
DeHashed
Important
This connector is only available for tenants that onboarded after July 26, 2026. For tenants that onboarded before this date, use Marketplace to access the standalone integration. For more information, see Marketplace.
This connector is available with any active Cortex XSIAM or Cortex AgentiX license.
DeHashed checks if personal information, such as emails, usernames, or passwords, has been compromised.
This connector includes the following sub-capabilities (Marketplace integrations link to PAN DEV for more information):
- DeHashed: This integration allows you to check if your personal information such as your email, username, or password is being compromised.
To configure this connector, follow the steps outlined in the configuration wizard.
DHS
Here are the articles in this section:
DHS
Important
This connector is only available for tenants that onboarded after July 26, 2026. For tenants that onboarded before this date, use Marketplace to access the standalone integration. For more information, see Marketplace.
This connector is available with any active Cortex XSIAM or Cortex AgentiX license.
The Cybersecurity and Infrastructure Security Agency's (CISA's) free Automated Indicator Sharing (AIS) capability enables the exchange of cyber threat indicators, at machine speed, to the Federal Government community. Read more about it here.
This connector includes the following sub-capabilities (Marketplace integrations link to PAN DEV for more information):
- DHS Feed: The Cybersecurity and Infrastructure Security Agency's (CISA's) free Automated Indicator Sharing (AIS) capability enables the exchange of cyber threat indicators, at machine speed, to the Federal Government community.
- DHS Feed v2: The Cybersecurity and Infrastructure Security Agency's (CISA's) free Automated Indicator Sharing (AIS) capability enables the exchange of cyber threat indicators, at machine speed, to the Federal Government community.
To configure this connector, follow the steps outlined in the configuration wizard.
digicert
Here are the articles in this section:
digicert
Important
This connector is only available for tenants that onboarded after July 26, 2026. For tenants that onboarded before this date, use Marketplace to access the standalone integration. For more information, see Marketplace.
This connector is available with any active Cortex XSIAM license.
Vercara UltraDNS is a cloud-based DNS management platform that provides DNS services and configuration management capabilities. This connector collects DNS configuration audit logs from Vercara UltraDNS, tracking DNS record changes and user activities for security and compliance. For more information, visit https://vercara.digicert.com/resources/ultradns.
This connector includes the following sub-capabilities (Marketplace integrations link to PAN DEV for more information):
- VercaraUltraDNS: Vercara UltraDNS integration for Cortex. Leverage UltraDNS's cloud-based DNS event and configuration data for security automation and real-time threat detection in Cortex.
To configure this connector, follow the steps outlined in the configuration wizard.
dnstwist
Here are the articles in this section:
dnstwist
Important
This connector is only available for tenants that onboarded after July 26, 2026. For tenants that onboarded before this date, use Marketplace to access the standalone integration. For more information, see Marketplace.
This connector is available with any active Cortex XSIAM or Cortex AgentiX license.
Interfaces with dnstwist to find similar-looking domains that adversaries can use for attacks. dnstwist detects typosquatting, phishing attacks, fraud, and corporate espionage, and is useful as an additional source of targeted threat intelligence.
This connector includes the following sub-capabilities (Marketplace integrations link to PAN DEV for more information):
- dnstwist: Use the DNSTwist integration to detect typosquatting, phishing, and corporate espionage.
To configure this connector, follow the steps outlined in the configuration wizard.
Docker
Here are the articles in this section:
Connect Docker Hub registry
The Docker Hub registry data source allows you to connect your public or private Docker Hub account to scan and secure container images against vulnerabilities, malware, and exposed secrets.
License type: This feature is included with a Cortex XSIAM Premium license. It is also included with any other Cortex XSIAM product that has the Cloud Posture Security or the Cloud Runtime Security add-on.
How to connect Docker Hub registry
Follow the wizard to connect your Docker Hub registry with Cortex XSIAM.
- Navigate to Settings → Data Sources & Integrations and click + Add New.
- On the Add Data Sources or Integrations page, search for Docker Hub, then hover over it and click Add.
- The Instance Name is automatically populated. You can change it to a more meaningful name.
- Choose the Scan Mode, and then follow the steps for that mode to configure the connection.
Cloud Scan
Security scanning is performed in the Cortex XSIAM environment when you select this mode.
-
Select the appropriate Cloud Provider and Region for the Cortex Cloud environment to use for registry scanning.
As a best practice, choose the region closest to your registry deployment to achieve the best scanning throughput and potentially reduce cloud costs.
- (Optional) Enable Allow access by IPs to specify a static IP address for the scanner to use. Make sure the static IP is allowed through your firewall so the scanner can access the registry during the scanning process.
- Choose the relevant Repository Access for scanning:
- Authenticated access: Discover and scan private and public repositories within the given account.
- Under Authentication Method, enter your private Docker Hub account credentials (Username and Password) for authentication.
- Public access only: Discover and scan images within a specific public repository.
-
Enter your public Docker Hub Repository Name.
To specify an official Docker Hub repository, enter
library/, followed by the short string used to designate the repo. For example, to scan the images in the official Alpine Linux repository, enterlibrary/alpine. -
Under Authentication Method, enter your public Docker Hub account user credentials (Username and Password) for authentication.
-
- Authenticated access: Discover and scan private and public repositories within the given account.
- Select Next.
Scan with Outpost
Security scanning is performed on infrastructure deployed to a cloud account that you own. This mode requires additional cloud provider permissions and may incur extra costs.
Prerequisite
Ensure an Outpost is connected to your tenant.
-
Choose a Cloud Provider to initialize registry scanning.
Note
If you choose Azure as the Cloud Provider, you must also select the Tenant Id. The Tenant Id is required to approve Cortex as an enterprise application in your Azure tenant.
-
Choose Outpost account to use for this instance. If no Outposts are shown, you can Create a new one. For more details, see Outposts.
Note
If you choose Azure as the cloud provider, only Outposts associated with the selected tenant ID are displayed.
- Select the Region where the registry is hosted.
- (Optional) Enable Allow access by IPs if you want to specify a static IP address for the scanner to use. Make sure the static IP is allowed through your firewall so that the scanner can access the registry during the scanning process.
- Choose the relevant Repository Access for scanning:
- Authenticated access: Discover and scan private and public repositories within the given account.
- Under Authentication Method, enter your private Docker Hub account credentials (Username and Password) for authentication.
- Public access only: Discover and scan images within a specific public repository.
-
Enter your public Docker Hub Repository Name.
To specify an official Docker Hub repository, enter
library/, followed by the short string used to designate the repo. For example, to scan the images in the official Alpine Linux repository, enterlibrary/alpine. -
Under Authentication Method, enter your public Docker Hub account user credentials (Username and Password) for authentication.
-
- Authenticated access: Discover and scan private and public repositories within the given account.
- Select Next.
Scan with Broker VM
Security scanning in private networks is done using broker VM infrastructure when you select this mode.
Prerequisite
- Choose a Scan with Broker VM mode to initiate registry scanning. You can select either a standalone Broker VM or a High Availability (HA) Cluster.
-
Select Applicable Broker VMs.
Choose the appropriate Broker VM or Cluster from the list configured in your tenant.
- The list of Broker VMs displays only VMs that support registry scanning.
- The list of high-availability Clusters displays only clusters that contain at least one VM supporting registry scanning.
- The registry scanning status for each VM appears in brackets if it was previously activated for that specific VM.
If the list does not display any Broker VMs or Clusters, Add New Broker VM or Add New Cluster. For more details, see Set up and configure Broker VM.
- Choose the relevant Repository Access for scanning:
- Authenticated access: Discover and scan private and public repositories within the given account.
- Under Authentication Method, enter your private Docker Hub account credentials (Username and Password) for authentication.
- Public access only: Discover and scan images within a specific public repository.
-
Enter your public Docker Hub Repository Name.
To specify an official Docker Hub repository, enter
library/, followed by the short string used to designate the repo. For example, to scan the images in the official Alpine Linux repository, enterlibrary/alpine. -
Under Authentication Method, enter your public Docker Hub account user credentials (Username and Password) for authentication.
-
- Authenticated access: Discover and scan private and public repositories within the given account.
-
Select Next.
- In Initial Scan Configuration, set your scanning process to focus on recently added or modified container images and exclude older ones that do not align with your current scanning objectives. This setting helps avoid unnecessary scans. Choose one of the following options:
- All: Scans all container images, including all versions (tags), in all discovered repositories.
- Latest Tag: Scans only images tagged 'latest' in all discovered repositories.
- Days Modified: Scans container images created or modified in the last few days. You can select a range of up to 90 days for the scan.
-
Select Save.
When the Docker Hub data source is saved, a new data connector is created, and the initial discovery scan begins. The connection process may take up to 15 minutes.
- To check the connector status and scan results, follow these steps:
- Navigate to Settings → Data Sources & Integrations.
- Find the Docker Hub instance from the list of 3rd Party Data Sources connectors, or use Search.
- In the Docker Hub instance row, select View Details. The Docker Hub Instances page appears.
- On the Docker Hub Instances page, you can filter results by any heading and value.
-
Select an Instance Name to open the details pane. The details pane contains the following granular information:
Instance Details Description Status Shows the status of the connector: Connected, Error, Warning, Disabled, or Pending. Applet Status on Broker VM Shows the status of the Registry Scanner applet on the Broker VM page. This status is visible only when the Scan with Broker VM mode is selected. Repositories Shows the number of scanned repositories in the registry. Scan Mode Shows the selected scan mode for the data connector, such as Cloud Scan, Scan with Outpost, or Scan with Broker VM. Security Capabilities Shows a breakdown of the security capabilities enabled on the instance and their individual statuses. For example, select Registry Scanning when it shows a warning or error status to see the open errors and issues that contributed to the status.
-
After the scan is complete, you can view the scanned images on the Container Images Inventory page. For more details, see Container Image assets.
If you have selected the Scan with Broker VM option, then a Registry Scanner applet is created on the selected Broker VM or Cluster. For details, see Verify Registry Scanner connection.
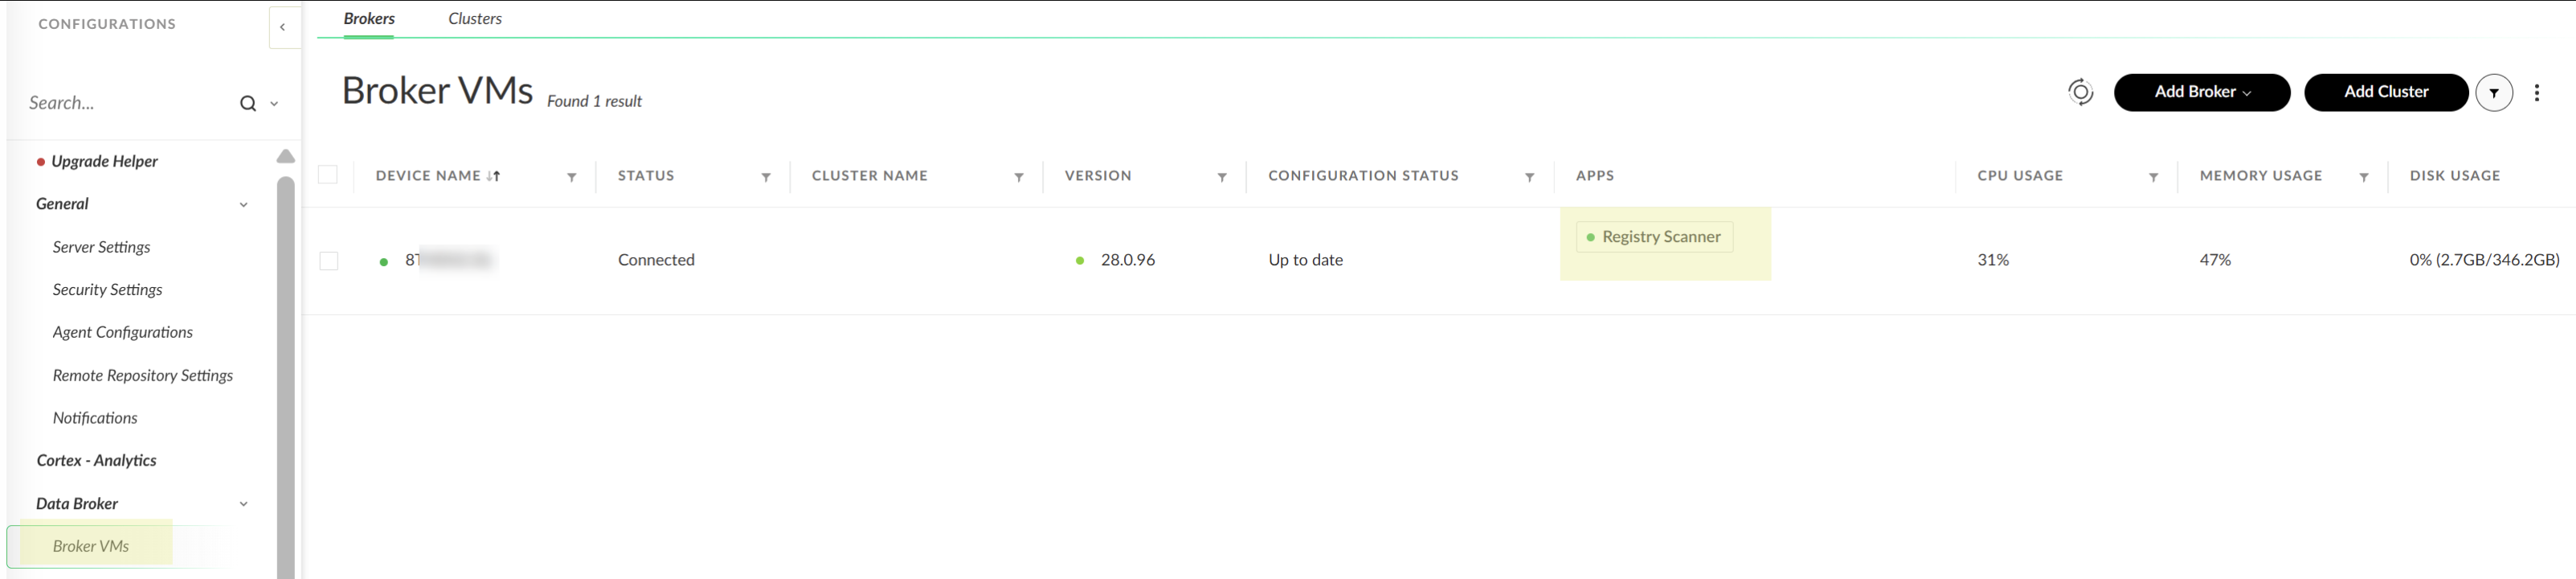
Manage a Docker Hub connector
After you add a Docker Hub connector, you can modify the connector settings and configure the scanning scope to control which images are scanned in the connected registry.
To manage the connector, follow these steps:
- Navigate to Settings → Data Sources & Integrations.
- Find the Docker Hub data source from the list of data sources, or use the filter to search.
-
Select the Docker Hub row. A pane opens with a list of integration instances and their details.
You can create a new instance by selecting Add Instance and following the onboarding wizard to define the settings.
- Right click an instance to perform actions on it as follows:
| Action | Instructions |
|---|---|
| Action | Instructions |
| Edit | Edit the Docker integration instance.
|
| Exclude/Include images | Define conditions to automatically exclude or include specific images while scanning. Conditions can be based on Repository or Tags. These conditions apply automatically to newly discovered images in the account. |
| Disable | Stops image scanning for the connector without deleting it. |
| Delete | Removes the connector. |
Connect Docker V2 compliant container registry
A Docker V2-compliant registry is a registry service that complies with the specifications and requirements outlined in the Docker Registry HTTP API V2. This API defines the protocol for interacting with a Docker registry, a repository where Docker images are stored and from which they can be pulled or pushed.
Note: To scan public and private repositories on Docker Hub, use the Docker Hub registry connector.
License type: This feature is included with a Cortex XSIAM Premium license. It is also included with any other Cortex XSIAM product that has the Cloud Posture Security or the Cloud Runtime Security add-on.
How to connect Docker V2
Follow the wizard to use the Docker V2 connector in Cortex XSIAM to scan and secure container images from any container registry that supports the Docker V2 protocol, ensuring comprehensive security.
- Navigate to Settings → Data Sources & Integrations and click + Add New.
- On the Add Data Sources or Integrations page, search for Docker Hub, then hover over it and click Add.
- The Instance Name is automatically populated. You can change it to a more meaningful name.
- Choose the Scan Mode, and then follow the steps for that mode to configure the connection.
Cloud Scan
Security scanning is performed in the Cortex XSIAM environment when you select this mode.
-
Select the appropriate Cloud Provider and Region for the Cortex environment to use for registry scanning.
As a best practice, choose the region closest to your registry deployment to achieve the best scanning throughput and potentially reduce cloud costs.
- (Optional) Enable Allow access by IP’s to specify a static IP address for the scanner to use. Ensure the static IP is allowed through your firewall so the scanner can access the registry during the scanning process.
-
Enter the Registry URL. This must match the URL you use with the docker login command.
Equivalent URL:
https://docker.io/If you are using a CA certificate for authentication, enter the server IP address instead of the Registry URL.
-
Under Authentication Method, enter the Username and Password of the registry that you want to connect.
Use your Docker ID as the username (for example, john0907) and not your email address.
-
(Optional) Expand Show Advanced Settings, and then enter the CA certificate in PEM format for Cortex to validate the Docker registry v2.
Ensure that the Custom CA certificate that you use is not revoked by the issuing authority.
- Select Next.
Scan with Outpost
Security scanning is performed on infrastructure deployed to a cloud account that you own. This mode requires additional cloud provider permissions and may incur extra costs.
Prerequisite
Ensure an Outpost is connected to your tenant.
-
Choose a Cloud Provider to initialize registry scanning.
Note
If you choose Azure as the Cloud Provider, you must also select the Tenant Id. The Tenant Id is required to approve Cortex as an enterprise application in your Azure tenant.
-
Choose Outpost account to use for this instance. If no Outposts are shown, you can Create a new one. For more details, see Outposts.
Note
If you choose Azure as the cloud provider, only Outposts associated with the selected tenant ID are displayed.
- Select the Region where the registry is hosted.
- (Optional) Enable Allow access by IP’s if you want to specify a static IP address for the scanner to use. Make sure the static IP is allowed through your firewall so that the scanner can access the registry during the scanning process.
-
Enter the Registry URL. This must match the URL you use with the docker login command.
Equivalent URL:
https://docker.io/If you are using a CA certificate for authentication, enter the server IP address instead of the Registry URL.
-
Under Authentication Method, enter the Username and Password of the registry that you want to connect.
Use your Docker ID as the username (for example, john0907) and not your email address.
-
(Optional) Expand Show advanced settings, and then enter the CA certificate in PEM format for Cortex to validate the Docker registry v2.
Ensure that the Custom CA certificate that you use is not revoked by the issuing authority.
- Select Next.
Scan with Broker VM
Security scanning in private networks is performed using broker VM infrastructure when you select this mode.
Prerequisite
Ensure one of the following is configured:
- Choose a Scan with Broker VM mode to initiate registry scanning. You can select either a standalone Broker VM or a High Availability (HA) Cluster.
-
Select Applicable Broker VMs.
Choose the appropriate Broker VM or Cluster from the list configured in your tenant.
Note
- The list of Broker VMs displays only VMs that support registry scanning.
- The list of high-availability Clusters displays only clusters that contain at least one VM supporting registry scanning.
- The registry scanning status for each VM appears in brackets if it was previously activated for that specific VM.
If the list does not display any Broker VMs or clusters, Add New Broker VM or Add New Cluster. For more details, see Set up and configure Broker VM.
-
Enter the Registry URL. This must match the URL you use with the docker login command.
Equivalent URL:
https://docker.io/If you are using a CA certificate for authentication, enter the server IP address instead of the Registry URL.
-
Under Authentication Method, enter the Username and Password of the registry that you want to connect.
Use your Docker ID as the username (for example, john0907) and not your email address.
-
(Optional) Expand Show advanced settings, and then enter the CA certificate in PEM format for Cortex to validate the Docker registry v2.
Ensure that the Custom CA certificate that you use is not revoked by the issuing authority.
-
Select Next.
- In the Initial Scan Configuration, set your scanning process to focus on recently added or modified container images and exclude older ones that do not align with your current scanning objectives. This setting helps avoid unnecessary scans. Choose one of the following options:
- All: Scans all container images, including all versions (tags), in all discovered repositories.
- Latest Tag: Scans only images tagged 'latest' in all discovered repositories.
- Days Modified: Scans container images that have been created in the last few days. You can select a range of up to 90 days for the scan.
-
Select Save.
When the Docker V2 data source is saved successfully, a new data connector is created, and the initial discovery scan begins. The connection process can take up to 15 minutes.
- To check the connector status and scan results, follow these steps:
- Navigate to Settings → Data Sources & Integrations.
- Find the Docker V2 integration from the list of data sources, or filter for it.
-
Select the Docker V2 instance row. A pane opens with a list of integration instances and their details showing the following information:
Instance Details Description Status Shows the status of the connector: Connected, Error, Warning, Disabled, or Pending. Applet Status on Broker VM Shows the status of the Registry Scanner applet on the Broker VM page. This status is visible only when the Scan with Broker VM mode is selected. Repositories Shows the number of scanned repositories in the registry. Scan Mode Shows the selected scan mode for the data connector, such as Cloud Scan, Scan with Outpost, or Scan with Broker VM. Security Capabilities Shows a breakdown of the security capabilities enabled on the instance and their individual statuses. For example, select Registry Scanning when it shows a warning or error status to see the open errors and issues that contributed to the status.
- Next Steps
- After the scan is complete, you can view the scanned images on the Container Images Inventory page. For more details, see Container Images assets.
- If you have selected the Scan with Broker VM option, then a Registry Scanner applet is created on the selected Broker VM or Cluster. For details, see Verify Registry Scanner connection.
Manage a Docker V2 connector
After you add a Docker V2 connector, you can modify the connector settings and configure the scanning scope to control which images are scanned in the connected registry.
To manage the connector, follow these steps:
- Navigate to Settings → Data Sources & Integrations.
- Find the Docker V2 data source from the list of data sources, or filter to search.
-
Select the Docker V2 row. A pane opens with a list of integration instances and their details.
You can create a new instance by selecting Add Instance and following the onboarding wizard to define the settings.
-
Right click an instance to perform actions on it as follows:
Action Instructions Edit <p>Edit the Docker V2 instance.</p><div data-gb-custom-block data-tag="hint" data-style="info" class="hint hint-info"><h4>Note</h4><ul><li>If you selected Scan with Broker VM mode, you can't change to a different scan mode (such as Cloud Discovery or Scan with Outpost) when you edit the instance.</li><li>When editing an instance configured for Scan with Broker VM, you must re-enter your authentication credentials, including Username, Password, and CA certificate.</li></ul></div> Exclude/Include images Define conditions to automatically exclude or include specific images while scanning. Conditions can be based on Repository or Tags. These conditions apply automatically to newly discovered images in the account. Delete Removes the connector. Disable Stops image scanning for the connector without deleting it.
DocuSign
Here are the articles in this section:
DocuSign
Important
This connector is only available for tenants that onboarded after July 26, 2026. For tenants that onboarded before this date, use Marketplace to access the standalone integration. For more information, see Marketplace.
This connector is available with any active Cortex XSIAM license.
Docusign is a leading provider of electronic signature and digital transaction management technology, allowing individuals and organizations to sign, send, and manage documents digitally. Fetch Customer Events (Monitor API) and Audit Users (Admin API) logs from Docusign for threat detection and compliance monitoring, and run automation and remediation commands against the service.
This connector includes the following sub-capabilities (Marketplace integrations link to PAN DEV for more information):
- Docusign: Docusign is a leading provider of electronic signature technology, allowing individuals and organizations to sign, send, and manage documents digitally.
To configure this connector, follow the steps outlined in the configuration wizard.
Dropbox
You can configure collecting Dropbox logs and data using a standard data source, content pack integration (onboarded prior to July 26, 2026), or connector (onboarded after July 26, 2026):
| Collection Method | Description |
|---|---|
| Standard data source overview | Forward different types of data from Dropbox Business accounts to Cortex XSIAM using the Dropbox data source. |
| Link to standard data source instructions | <p>The following types of data can be ingested from Dropbox:</p><ul><li><p>Log collection</p><ul><li>Events</li></ul></li><li><p>Directory and metadata</p><ul><li>Member Devices</li><li>Users</li><li>Groups</li></ul></li></ul><p>For more information, see Ingest logs and data from Dropbox.</p> |
| Links to content pack/ integration details (onboarded prior to July 26, 2026) | <p>The Dropbox content pack fetches and collects security events from Dropbox logs. It includes Correlation Rules, Modeling Rules, Parsing Rules, a Playbook, and a Cortex XSIAM Dashboard. It also includes the following integration:</p><ul><li>Dropbox Event Collector: Use this integration to collect events from Dropbox logs. It contains commands such as dropbox-auth-start to initiate the authorization process, dropbox-auth-complete to finish authorization, dropbox-auth-test to check connectivity, dropbox-auth-reset to reset authentication, and dropbox-get-events to retrieve events.</li></ul> |
| Link to connector (onboarded after July 26, 2026) | Dropbox |
Ingest logs and data from Dropbox
Cortex XSIAM can ingest different types of data from Dropbox Business accounts using the Dropbox data collector. To receive logs and data from Dropbox Business accounts via the Dropbox Business API, you must configure the Collection Integrations settings in Cortex XSIAM based on your Dropbox Business Account credentials. After you set up data collection, Cortex XSIAM begins receiving new logs and data from the source.
When Cortex XSIAM begins receiving logs, the app creates a new dataset for the different types of data that you are collecting, which you can use to initiate XQL Search queries. For example queries, refer to the in-app XQL Library. For all logs, Cortex XSIAM can generate Cortex XSIAM issues (Analytics, Correlation Rules, IOC, and BIOC), when relevant, from Dropbox Business logs. While Correlation Rules issues are generated on non-normalized and normalized logs, Analytics, IOC, and BIOC issues are only generated on normalized logs.
The following table provides a brief description of the different types of data you can collect, the collection method and fetch interval for new data collected, the name of the dataset to use in Cortex XSIAM to query the data using XQL Search, and whether the data is normalized.
Note
The fetch interval is not configurable.
| Type of data | Description | Collection method | Fetch interval | Dataset name | Normalized data |
|---|---|---|---|---|---|
| Log collection | |||||
| Events | Retrieves team events, including access events, administrative events, file/folders events, security settings events, and more. team_log/get_events | Appends data | 60 seconds | dropbox_events_raw |
When relevant, Cortex XSIAM normalizes SaaS audit event logs into stories, which are collected in a dataset called saas_audit_logs. |
| Directory and metadata | |||||
| Member Devices | Lists all device sessions of a team. team/devices/list_members_devices | Overwrites data | 10 minutes | dropbox_members_devices_raw |
— |
| Users | Lists members of a group. team/members/list_v2 | Overwrites data | 10 minutes | dropbox_users_raw |
— |
| Groups | Lists groups on a team. team/groups/list | Overwrites data | 10 minutes | dropbox_groups_raw |
— |
Prerequisite
- Set up an Advanced Dropbox plan.
- Create a Dropbox Business admin account with Security admin permissions, which is required to authorize Cortex XSIAM to access the Dropbox Business account and generate the OAuth 2.0 access token.
Configure Cortex XSIAM to receive logs and data from Dropbox.
- Complete the prerequisite steps mentioned above for your Dropbox Business account.
- Log in to Dropbox using an admin account designated with Security admin level permissions.
- In the Dropbox App console, ensure that you either create a new app, or your existing app is created, with the following settings:
- Choose an API: Select Scoped access.
- Choose the type of access you need: Select Full dropbox for access to all files and folders in a user's Dropbox.
-
In the Permissions tab of your app, ensure that the applicable permissions are selected under the relevant section heading for the type of data you want to collect:
Section heading Permission Data to collect Account Info account_info.read All types of data Team Data team_data.member All types of data Members members.read Users groups.read Groups Sessions sessions.list Member Devices events.read Events - In the Settings tab of your app, copy the App key and App secret , where you must click Show to see the App secret and record them somewhere safe. You will need to provide these keys when you configure the Dropbox data collector in Cortex XSIAM.
- Navigate to Settings → Data Sources & Integrations.
- On the Data Sources & Integrations page, click + Add New, search for Dropbox, then hover over and click Add.
- Set the following parameters:
- Name: Specify a descriptive name for this Dropbox instance.
- App Key: Specify the App key, which is taken from the Settings tab of your Dropbox app.
- App Secret: Specify the App secret, which is taken from the Settings tab of your Dropbox app.
-
Access Code: After specifying an App Key, you can obtain the access code by hovering over the Access Code tooltip, clicking the here link, and signing in with your Dropbox Business account credentials. The URL link is
https://www.dropbox.com/oauth2/authorize?client_id=%APP_KEY%&token_access_type=offline&response_type=code, where the%APP_KEY%is replaced with the App Key value specified.Note
When the App Key field is empty, the here link in the tooltip is disabled. An incorrect App Key returns a 404 error.
To obtain the Access Code, complete the following steps in the page that opens in your browser:
- Read the disclaimer and click Continue.
- Review the permissions listed, which should match the permissions you configured in your Dropbox app in the Permissions tab according to the type of data you want to collect, and click Allow.
- Copy the Access Code Generated and paste it in the Access Code field in Cortex XSIAM. The access code is valid for around four minutes from when it is generated.
Note
Whenever you change Dropbox app permissions, generate a new Access Code. This keeps collector permissions aligned with the app.
- Collect: Select the types of data you want to collect from Dropbox. All the options are selected by default.
- Log collection
-
Events (get_events}: Retrieves team events, including access events, administrative events, file/folders events, security settings events and more.
Note
Event data is collected every 60 seconds with a 10-minute lag.
-
- Directory and metadata
- Member Devices: Collects all device sessions of a team.
- Users: Collects all members of a group.
-
Groups: Collects all groups on a team.
Note
Inventory data snapshots are collected every 10 minutes.
- Log collection
- To test the connection settings, click Test.
- If the test is successful, click Enable to enable Dropbox log collection. After events start to come in, a green check mark appears underneath the Dropbox configuration.
Dropbox
Important
This connector is only available for tenants that onboarded after July 26, 2026. For tenants that onboarded before this date, use Marketplace to access the standalone integration. For more information, see Marketplace.
This connector is available with any active Cortex XSIAM license.
Use the Dropbox Event Collector integration to get Audit and Auth logs from Dropbox using REST APIs.
This connector includes the following sub-capabilities (Marketplace integrations link to PAN DEV for more information):
To configure this connector, follow the steps outlined in the configuration wizard.
Druva
Here are the articles in this section:
Druva
Important
This connector is only available for tenants that onboarded after July 26, 2026. For tenants that onboarded before this date, use Marketplace to access the standalone integration. For more information, see Marketplace.
This connector is available with any active Cortex XSIAM license.
The Druva Cloud Platform integration empowers you to automate ransomware issue response playbooks and orchestrate recovery actions across both your primary and backup environments. This event collector is applicable to customers using the Realize Ransomware Recovery module with inSync and Phoenix on Druva Public Cloud.
This connector includes the following sub-capabilities (Marketplace integrations link to PAN DEV for more information):
- DruvaEventCollector: Druva Ransomware Response Integration provides ransomware protection for endpoints, SaaS applications and data center workloads for Druva Ransomware Recovery customers.
To configure this connector, follow the steps outlined in the configuration wizard.
EasyVista
Here are the articles in this section:
EasyVista
Important
This connector is only available for tenants that onboarded after July 26, 2026. For tenants that onboarded before this date, use Marketplace to access the standalone integration. For more information, see Marketplace.
This connector is available with any active Cortex XSIAM or Cortex AgentiX license.
Use the EasyVista integration to search for issues and requests, and retrieve their status and information. This integration was integrated and tested with EasyVista v2016.1.300.2. For more information, visit the EasyVista REST API documentation.
This connector includes the following sub-capabilities (Marketplace integrations link to PAN DEV for more information):
- EasyVista: EasyVista Service Manager manages the entire process of designing, managing and delivering IT services.
To configure this connector, follow the steps outlined in the configuration wizard.
Email Hippo
Here are the articles in this section:
Email Hippo
Important
This connector is only available for tenants that onboarded after July 26, 2026. For tenants that onboarded before this date, use Marketplace to access the standalone integration. For more information, see Marketplace.
This connector is available with any active Cortex XSIAM or Cortex AgentiX license.
Email Hippo is an email intelligence and data services provider that delivers accurate cloud-based email validation and domain profiling. Check the reputation of a given domain name or email address and return enrichment data for available indicators (observables).
This connector includes the following sub-capabilities (Marketplace integrations link to PAN DEV for more information):
- Email Hippo: This is the Email Hippo integration used to verify email sources as fake emails that were used as part of phishing attacks.
To configure this connector, follow the steps outlined in the configuration wizard.
Elastic
Here are the articles in this section:
Elasticsearch Filebeat
Note
You can configure collecting container logs from Google Kubernetes Engine using Elasticsearch Filebeat with a Custom - Filebeat based Collector or with a content pack Integration. For more information, see Google Kubernetes Engine.
You can ingest logs related to file activity on your endpoints and servers without using the Cortex XDR agent by installing Elasticsearch Filebeat as a system logger and then forward those logs to Cortex XSIAM using a Custom - Filebeat based Collector.
| Collection Method | Description |
|---|---|
| Custom - Filebeat based Collector (standard data source) overview | Forward logs from Elasticsearch Filebeat to Cortex XSIAM using the Custom - Filebeat based Collector data source. |
| Link to custom - Filebeat based Collector (standard data source) instructions | Ingest logs from Elasticsearch Filebeat |
Ingest logs from Elasticsearch Filebeat
If you want to ingest logs about file activity on your endpoints and servers and do not use the Cortex XDR agent, you can install Elasticsearch Filebeat as a system logger and then forward those logs to Cortex XSIAM. To facilitate log ingestion, Cortex XSIAM supports the same protocols that Filebeat and Elasticsearch use to communicate. Cortex XSIAM supports using Filebeat up to version 8.2 with the Filebeat data collector. Cortex XSIAM also supports logs in single line format or multiline format. For more information on handling messages that span multiple lines of text in Elasticsearch Filebeat, see Manage Multiline Messages.
Cortex XSIAM supports all sections in the filebeat.yml configuration file, such as support for Filebeat fields and tags. As a result, this enables you to use the add_fields processor to identify the product/vendor for the data collected by Filebeat so the collected events go through the ingestion flow (Parsing Rules). To configure the product/vendor ensure that you use the default fields attribute, as opposed to the target attribute, as shown in the following example.
processors:
- add_fields:
fields:
vendor: <Vendor>
product: <Product>
To provide additional context during investigations, Cortex XSIAM automatically creates a new Cortex Query Language (XQL) dataset from your Filebeat logs. You can then use the XQL dataset to search across the logs Cortex XSIAM received from Filebeat.
To receive logs, you configure collection settings for Filebeat in Cortex XSIAM and output settings in your Filebeat installations. As soon as Cortex XSIAM begins receiving logs, the data is visible in XQL Search queries.
-
In Cortex XSIAM, set up Data Collection.
a. Navigate to Settings → Data Sources & Integrations.
b. On the Data Sources & Integrations page, click + Add New, search for Custom - Filebeat, then hover over it and click Add.
c. Specify a descriptive Name for your Filebeat log collection configuration.
d. Specify the Vendor and Product for the type of logs you are ingesting.
The vendor and product are used to define the name of your XQL dataset (
<vendor>_<product>_raw). If you do not define a vendor or product, Cortex XSIAM examines the log header to identify the type and uses that to define the vendor and product in the dataset. For example, if the type is Acme and you opt to let Cortex XSIAM determine the values, the dataset name would beacme_acme_raw.e. Save & Generate Token.
Click the copy icon next to the key and record it somewhere safe. You will need to provide this key when you set up output settings on your Filebeat instance. If you forget to record the key and close the window you will need to generate a new key and repeat this process.
-
Set up Filebeat to forward logs.
After installing the Filebeat agent, configure an Elasticsearch output:
a. Under the output.elasticsearch section, configure the following entities:
hosts: Copy the API URL from your Filebeat configuration and paste it in this field.compression_level: 5 (recommended)bulk_max_size: 1000 (recommended)api_key: Paste the key you created in when you configured Filebeat Log Collection in Cortex XSIAM.proxy_url: (Optional)<server_ip>:<port_number>. You can specify your own<server_ip>or use the Broker VM to proxy Filebeat communication using the format<Broker_VM_ip>:<port_number>. When using the Broker VM, ensure that you activate the Local Agent Settings applet with the Agent Proxy enabled.
b. Save the changes to your output file.
After Cortex XSIAM begins receiving logs from Filebeat, they will be available in XQL Search queries.
-
(Optional) Monitor your Filebeat integration.
You can return to the Settings → Configurations → Data Collection → Custom Collectors page to monitor the status of your Filebeat configuration. For each instance, Cortex XSIAM displays the number of logs received in the last hour, day, and week. You can also use the Data Ingestion Dashboard to view general statistics about your data ingestion configurations.
-
(Optional) Set up issue notifications to monitor the following events.
- A Filebeat agent status changes to disconnected.
- A Filebeat module has stopped sending logs.
Windows DHCP via Elasticsearch Filebeat
You can configure collecting Windows DHCP logs using a Standard Collector or content pack integration (onboarded prior to July 26, 2026):
| Collection Method | Description |
|---|---|
| Standard Collector (basic) overview | Forward logs to Cortex XDR from Windows DHCP logs using Elasticsearch Filebeat with the Windows DHCP data source. |
| Link to Standard Collector instructions | Ingest logs from Windows DHCP using Elasticsearch Filebeat |
| Link to content pack details (onboarded prior to July 26, 2026) | The Microsoft DHCP content pack processes and normalizes audit logs from the Dynamic Host Configuration Protocol (DHCP) service for security analysis in Cortex XSIAM. It includes modeling Rules and parsing rules for events collected using the XDR Collector via the microsoft_dhcp_raw dataset. |
Ingest logs from Windows DHCP using Elasticsearch Filebeat
You can configure Cortex XSIAM to receive Windows DHCP logs using Elasticsearch Filebeat with the following data collectors.
Ingest Windows DHCP logs with an XDR Collector profile
Extend Cortex XSIAM visibility into logs from Windows DHCP using an XDR Collector Windows Filebeat profile.
You can enrich network logs with Windows DHCP data when defining data collection in an XDR Collector Windows Filebeat profile. When you add a XDR Collector Windows Filebeat profile using the Elasticsearch Filebeat default configuration file called filebeat.yml, you can define whether the collected data undergoes follow-up processing in the backend for Windows DHCP data. Cortex XSIAM uses Windows DHCP logs to enrich your network logs with hostnames and MAC addresses that are searchable in XQL Search using the Windows DHCP Cortex Query Language (XQL) dataset (microsoft_dhcp_raw).
While this enrichment is also available when configuring a Windows DHCP Collector for a cloud data collection integration, we recommend configuring Cortex XSIAM to receive Windows DHCP logs with an XDR Collector Windows Filebeat profile because it’s the ideal setup configuration.
-
Configure Cortex XSIAM to receive logs from Windows DHCP using an XDR Collector Windows Filebeat profile.
-
Add an XDR Collector Profile for Windows.
Follow the steps for creating a Windows Filebeat profile as described in Add an XDR Collector Profile for Windows, and in the Filebeat Configuration File area, ensure that you select and Add the DHCP template. The template's content will be displayed here, and is editable.Add an XDR Collector Profile for Windows
-
To configure collection of Windows DHCP data, edit the template text as necessary for your system.
You can enrich network logs with Windows DHCP data when defining data collection by setting the
vendorto“microsoft”, andproductto“dhcp”in thefilebeat.ymlfile, which you can then query in themicrosoft_dhcp_rawdataset.
Note
To avoid formatting issues in
filebeat.yml, edit the text file in the user interface. Do not copy it elsewhere. Validate the YAML syntax before creating the profile. -
Ingest Windows DHCP logs with the Windows DHCP Collector
Extend Cortex XSIAM visibility into logs from Windows DHCP using Elasticsearch Filebeat with the Windows DHCP data collector.
To receive Windows DHCP logs, you must configure data collection from Windows DHCP via Elasticsearch Filebeat. This is configured by setting up a Windows DHCP Collector in Cortex XSIAM and installing and configuring an Elasticsearch Filebeat agent on your Windows DHCP Server. Cortex XSIAM supports using Filebeat up to version 8.0.1 with the Windows DHCP Collector.
Certain settings in the Elasticsearch Filebeat default configuration file called filebeat.yml must be populated with values provided when you configure the Data Sources & Integrations settings in Cortex XSIAM for the Windows DHCP Collector. To help you configure the filebeat.yml correctly, Cortex XSIAM provides an example file that you can download and customize. After you set up collection integration, Cortex XSIAM begins receiving new logs and data from the source.
Note
For more information on configuring the filebeat.yml file, see the Elastic Filebeat Documentation.
Windows DHCP logs are stored as CSV (comma-separated values) log files. The logs rotate by days (DhcpSrvLog-<day>.log), and each file contains two sections: Event ID Meaning and the events list.
As soon as Cortex XSIAM begins receiving logs, the app automatically creates a Windows DHCP XQL dataset (microsoft_dhcp_raw). Cortex XSIAM uses Windows DHCP logs to enrich your network logs with hostnames and MAC addresses that are searchable in XQL Search using the Windows DHCP Cortex Query Language (XQL) dataset.
Configure Cortex XSIAM to receive logs from Windows DHCP via Elasticsearch Filebeat with the Windows DHCP collector.
- Configure the Windows DHCP Collector in Cortex XSIAM.
- Navigate to Settings → Data Sources & Integrations.
- On the Data Sources & Integrations page, click + Add New, search for Windows DHCP, then hover over it and click Add.
-
(Optional) Download example filebeat.yml file. To help you configure your
filebeat.ymlfile correctly, Cortex XSIAM provides an examplefilebeat.ymlfile that you can download and customize. To download this file, use the link provided in this dialog box.Note
To avoid formatting issues in your
filebeat.yml, we recommend that you use the download example file to make your customizations. Do not copy and paste the code syntax examples provided later in this procedure into your file. - Specify a descriptive Name for your log collection configuration.
- Save & Generate Token. The token is displayed in a blue box, which is blurred out in the image below. Click the copy icon next to the key and record it somewhere safe. You will need to provide this key when you set the
api_keyvalue in the Elasticsearch Output section in thefilebeat.ymlfile as explained in Step #2. If you forget to record the key and close the window you will need to generate a new key and repeat this process. - Select Done to close the window.
- In the Integrations page for the Windows DHCP Collector that you created, select Copy api url and record it somewhere safe. You will need to provide this URL when you set the
hostsvalue in the Elasticsearch Output section in thefilebeat.ymlfile as explained in Step #2.
- Configure an Elasticsearch Filebeat agent on your Windows DHCP Server.
- Navigate to the Elasticsearch Filebeat installation directory, and open the
filebeat.ymlfile to configure data collection with Cortex XSIAM. We recommend that you use the download example file provided by Cortex XSIAM. - Update the following sections and tags in the
filebeat.ymlfile. The example code below details the specific sections to make these changes in the file.-
Filebeat inputs: Define the paths to crawl and fetch. The code below provides an example of how to configure the Filebeat inputs section in the
filebeat.ymlfile with these paths configured.# ============================== Filebeat inputs =============================== filebeat.inputs: # Each - is an input. Most options can be set at the input level, so # you can use different inputs for various configurations. # Below are the input specific configurations. - type: log # Change to true to enable this input configuration. enabled: true # Paths that should be crawled and fetched. Glob based paths. paths: - c:\Windows\System32\dhcp\DhcpSrvLog\*.log -
Elasticsearch Output: Set the
hostsandapi_key, where both of these values are obtained when you configured the Windows DHCP Collector in Cortex XSIAM as explained in Step #1. The code below provides an example of how to configure the Elasticsearch Output section in thefilebeat.ymlfile and indicates which settings need to be obtained from Cortex XSIAM.# ---------------------------- Elasticsearch Output ---------------------------- output.elasticsearch: enabled: true # Array of hosts to connect to. hosts: ["OBTAIN THIS URL FROM CORTEX XSIAM"] # Protocol - either `http` (default) or `https`. protocol: "https" compression_level: 5 # Authentication credentials - either API key or username/password. api_key: "OBTAIN THIS KEY FROM CORTEX XSIAM"
-
Processors: Set the
tokenizerand add adrop_event processorto drop all events that do not start with an event ID. The code below provides an example of how to configure the Processors section in thefilebeat.ymlfile and indicates which settings need to be obtained from Cortex XSIAM.Note
The
tokenizerdefinition is dependent on the Windows server version that you are using as the log format differs.- For platforms earlier than Windows Server 2008, use
"%{id},%{date},%{time},%{description},%{ipAddress},%{hostName},%{macAddress}" - For Windows Server 2008 and 2008 R2, use
"%{id},%{date},%{time},%{description},%{ipAddress},%{hostName},%{macAddress},%{userName},%{transactionID},%{qResult},%{probationTime},%{correlationID}" - For Windows Server 2012 and above, use
"%{id},%{date},%{time},%{description},%{ipAddress},%{hostName},%{macAddress},%{userName},%{transactionID},%{qResult},%{probationTime},%{correlationID},%{dhcid},%{vendorClassHex},%{vendorClassASCII},%{userClassHex},%{userClassASCII},%{relayAgentInformation},%{dnsRegError}"
# ================================= Processors ================================= processors: - add_host_metadata: when.not.contains.tags: forwarded - drop_event.when.not.regexp.message: "^[0-9]+,.*" - dissect: tokenizer: "%{id},%{date},%{time},%{description},%{ipAddress},%{hostName},%{macAddress},%{userName},%{transactionID},%{qResult},%{probationTime},%{correlationID},%{dhcid},%{vendorClassHex},%{vendorClassASCII},%{userClassHex},%{userClassASCII},%{relayAgentInformation},%{dnsRegError}" - drop_fields: fields: ["message"] - add_locale: ~ - rename: fields: - from: "event.timezone" to: "dissect.timezone" ignore_missing: true fail_on_error: false - add_cloud_metadata: ~ - add_docker_metadata: ~ - add_kubernetes_metadata: ~ - For platforms earlier than Windows Server 2008, use
-
- Navigate to the Elasticsearch Filebeat installation directory, and open the
-
Verify the status of the integration.
Return to the Integrations page and view the statistics for the log collection configuration.
- After Cortex XSIAM begins receiving logs from Windows DHCP via Elasticsearch Filebeat, you can use the XQL Search to search for logs in the new dataset (
microsoft_dhcp_raw).
ElasticSearch
Important
This connector is only available for tenants that onboarded after July 26, 2026. For tenants that onboarded before this date, use Marketplace to access the standalone integration. For more information, see Marketplace.
Elasticsearch is the distributed search and analytics engine at the heart of the Elastic Stack, where the indexing, search, and analysis happens. Query Elasticsearch instances using DSL, EQL, and Lucene syntaxes, search and index documents, collect events, fetch issues with a predefined query, and fetch threat intelligence indicators from an Elasticsearch database.
This connector includes the following sub-capabilities (Marketplace integrations link to PAN DEV for more information):
- Elasticsearch v2: Search for and analyze data in real time.\
Supports version 6 and later. This sub-capability is available with any active Cortex XSIAM, Cortex Cloud, Cortex Cloud Runtime Security, Cortex XDR, or Cortex AgentiX license. - ElasticsearchEventCollector: Search for and analyze data in real time.\
Supports version 6 and later. This sub-capability is available with any active Cortex XSIAM license. - ElasticsearchFeed: This sub-capability is available with any active Cortex XSIAM or Cortex AgentiX license.
To configure this connector, follow the steps outlined in the configuration wizard.
Endgame
Here are the articles in this section:
Endgame
Important
This connector is only available for tenants that onboarded after July 26, 2026. For tenants that onboarded before this date, use Marketplace to access the standalone integration. For more information, see Marketplace.
This connector is available with any active Cortex XSIAM or Cortex AgentiX license.
Endpoint protection built to stop advanced attacks before damage and loss occurs.
This connector includes the following sub-capabilities (Marketplace integrations link to PAN DEV for more information):
- Endgame: Endpoint protection built to stop advanced attacks before damage and loss occurs.
To configure this connector, follow the steps outlined in the configuration wizard.
Envoy
Here are the articles in this section:
Envoy
Important
This connector is only available for tenants that onboarded after July 26, 2026. For tenants that onboarded before this date, use Marketplace to access the standalone integration. For more information, see Marketplace.
This connector is available with any active Cortex XSIAM, Cortex XDR, or Cortex AgentiX license.
Integrate with Envoy Identity Access Management (IAM) services to automate user provisioning and execute CRUD operations across employee lifecycle processes. The Envoy integration uses a set of API endpoints tested with version v2 of the Envoy SCIM API.
This connector includes the following sub-capabilities (Marketplace integrations link to PAN DEV for more information):
- Envoy IAM: Integrate with Envoy Identity Access Management services to execute CRUD operations to employee lifecycle processes.
To configure this connector, follow the steps outlined in the configuration wizard.
Exabeam
Here are the articles in this section:
Exabeam
Important
This connector is only available for tenants that onboarded after July 26, 2026. For tenants that onboarded before this date, use Marketplace to access the standalone integration. For more information, see Marketplace.
This connector is available with any active Cortex XSIAM or Cortex AgentiX license.
Integrate with Exabeam products. The Exabeam Security Management Platform provides end-to-end detection, User Event Behavioral Analytics (UEBA), and SOAR. Exabeam Data Lake provides a searchable log management system for log collection, storage, processing, and presentation, and the Exabeam Security Operations Platform offers a centralized and scalable platform for log management.
This connector includes the following sub-capabilities (Marketplace integrations link to PAN DEV for more information):
- Exabeam: The Exabeam Security Management Platform provides end-to-end detection, User Event Behavioral Analytics, and SOAR.
- Exabeam Data Lake: Exabeam Data Lake provides a searchable log management system. Data Lake is used for log collection, storage, processing, and presentation.
- ExabeamSecOpsPlatform: Exabeam Security Operations Platform offers a centralized and scalable platform for log management.
To configure this connector, follow the steps outlined in the configuration wizard.
ExtraHop
ExtraHop
Important
This connector is only available for tenants that onboarded after July 26, 2026. For tenants that onboarded before this date, use Marketplace to access the standalone integration. For more information, see Marketplace.
This connector is available with any active Cortex XSIAM license.
ExtraHop Reveal(x) 360 is a cloud-based network detection and response platform that provides complete visibility of network communications at enterprise scale, with real-time threat detections backed by machine learning and guided investigation workflows. It monitors network traffic using behavioral analytics to identify and respond to security threats in hybrid and multi-cloud environments.
This connector includes the following sub-capabilities (Marketplace integrations link to PAN DEV for more information):
- ExtrahopRevealXEventCollector: ExtraHop Reveal(x) is a network detection and response solution that provides complete visibility of network communications at enterprise scale, real-time threat detections backed by machine learning, and guided investigation workflows that simplify response.
To configure this connector, follow the steps outlined in the configuration wizard.
F5
Here are the articles in this section:
F5 Automation and Remediation
Important
This connector is only available for tenants that onboarded after July 26, 2026. For tenants that onboarded before this date, use Marketplace to access the standalone integration. For more information, see Marketplace.
This connector is available with any active Cortex XSIAM or Cortex AgentiX license.
Automate and remediate across F5 products. Use F5 Application Security Manager (ASM/WAF) to read information and manage web application firewall policies, F5 Firewall to manage firewall rules, and F5 Silverline to retrieve alerts and read/update threat-intelligence IP lists (allowlists and denylists).
This connector includes the following sub-capabilities (Marketplace integrations link to PAN DEV for more information):
- F5 ASM: Manages F5 firewall.
- F5 firewall: Manages F5 firewall rules.
- F5Silverline: F5 Silverline Threat Intelligence is a cloud-based service incorporating external IP reputation and reducing threat-based communications. By identifying IP addresses and security categories associated with malicious activity, this managed service integrates dynamic lists of threatening IP addresses with the Silverline cloud-based platform, adding context-based security to policy decisions.
To configure this connector, follow the steps outlined in the configuration wizard.
Fastly
Here are the articles in this section:
Fastly
Important
This connector is only available for tenants that onboarded after July 26, 2026. For tenants that onboarded before this date, use Marketplace to access the standalone integration. For more information, see Marketplace.
This connector is available with any active Cortex XSIAM or Cortex AgentiX license.
Integrate with Fastly products. Use Fastly Feed to get assigned CIDRs and add them to your firewall's allowlist in order to enable using Fastly's services, and use the Signal Sciences next-gen web application firewall to increase security and maintain reliability.
This connector includes the following sub-capabilities (Marketplace integrations link to PAN DEV for more information):
To configure this connector, follow the steps outlined in the configuration wizard.
Fidelis
Here are the articles in this section:
Fidelis
Important
This connector is only available for tenants that onboarded after July 26, 2026. For tenants that onboarded before this date, use Marketplace to access the standalone integration. For more information, see Marketplace.
This connector is available with any active Cortex XSIAM or Cortex AgentiX license.
Fidelis Endpoint provides advanced endpoint detection and response (EDR) across Windows, Mac and Linux OSes for faster threat remediation. Fidelis Elevate Network automates detection and response to network threats and data leakage in your organization. Supported version - 9.2.
This connector includes the following sub-capabilities (Marketplace integrations link to PAN DEV for more information):
- Fidelis EDR:
- Fidelis Elevate Network: Automate Detection and Response to Network Threats and data leakage in your organization with Fidelis Elevate Network Integration.
To configure this connector, follow the steps outlined in the configuration wizard.
Filigran
Here are the articles in this section:
Filigran OpenCTI
Important
This connector is only available for tenants that onboarded after July 26, 2026. For tenants that onboarded before this date, use Marketplace to access the standalone integration. For more information, see Marketplace.
This connector is available with any active Cortex XSIAM or Cortex AgentiX license.
OpenCTI is a cyber threat intelligence platform. Get lists of indicators linked to threats with additional context for your investigations, report new indicators, and update or delete existing ones. The OpenCTI Feed integration periodically ingests indicators from the OpenCTI feed.
This connector includes the following sub-capabilities (Marketplace integrations link to PAN DEV for more information):
- OpenCTI: Manages OpenCTI platform. Compatible with OpenCTI 4.X API and OpenCTI 5.X API versions.
- OpenCTI Feed 4.X
To configure this connector, follow the steps outlined in the configuration wizard.
Forcepoint
Here are the articles in this section:
Forcepoint DLP
You can configure collecting Corelight Zeek logs using a Broker VM Syslog Collector applet, content pack integration (onboarded prior to July 26, 2026), or connector (onboarded after July 26, 2026):
| Collection Method | Description |
|---|---|
| Syslog Collector applet overview | If you use Forcepoint DLP to prevent data loss over endpoint channels, you can forward logs to Cortex XSIAM using the Broker VM Syslog Collector applet in a CEF or LEEF format. |
| Link to Syslog Collector applet instructions | Ingest logs from Forcepoint DLP |
| Link to content pack/integration details (onboarded prior to July 26, 2026) | <p>The Forcepoint DLP content pack fetches security incidents from Forcepoint DLP and ingests them as events into Cortex XSIAM for processing and analysis. contains the Forcepoint DLP Modeling Rule, and the Forcepoint DLP Parsing Rule. It also includes the following integration:</p><ul><li>Forcepoint DLP Event Collector (Beta): Use this integration to fetch security incidents from Forcepoint DLP as Cortex XSIAM events. This integration is an event collector and utilizes parsing and modeling rules within the content pack for data normalization.</li></ul> |
| Link to connector (onboarded after July 26, 2026) | Forcepoint |
Forcepoint
Important
This connector is only available for tenants that onboarded after July 26, 2026. For tenants that onboarded before this date, use Marketplace to access the standalone integration. For more information, see Marketplace.
Forcepoint is an advanced threat protection product with added local management controls. This connector lets you create and manage custom URL/IP block-list categories in Forcepoint Web Security, centrally manage Forcepoint engines through the Security Management Center, and collect activity logs from Forcepoint DLP.
This connector includes the following sub-capabilities (Marketplace integrations link to PAN DEV for more information):
- Forcepoint: Advanced threat protection with added local management controls. This sub-capability is available with any active Cortex XSIAM, Cortex Cloud, or Cortex AgentiX license.
- Forcepoint DLP Event Collector: This sub-capability is available with any active Cortex XSIAM license.
- Forcepoint Security Management Center: Forcepoint SMC provides unified, centralized management of all models of Forcepoint engines whether physical, virtual or cloud—across large, geographically distributed enterprise environments. This sub-capability is available with any active Cortex XSIAM or Cortex AgentiX license.
To configure this connector, follow the steps outlined in the configuration wizard.
ForeScout
Here are the articles in this section:
ForeScout
Important
This connector is only available for tenants that onboarded after July 26, 2026. For tenants that onboarded before this date, use Marketplace to access the standalone integration. For more information, see Marketplace.
This connector is available with any active Cortex XSIAM or Cortex AgentiX license.
Forescout CounterACT is a unified device visibility and control platform for IT and OT security. Forescout EyeInspect delivers flexible and scalable OT/ICS asset visibility, giving you in-depth device visibility for the computing systems used to manage industrial operations.
This connector includes the following sub-capabilities (Marketplace integrations link to PAN DEV for more information):
- Forescout: Unified device visibility and control platform for IT and OT Security.
- ForescoutEyeInspect: Delivers flexible and scalable OT/ICS asset visibility.
To configure this connector, follow the steps outlined in the configuration wizard.
Fortinet
Here are the articles in this section:
Fortinet Fortigate
You can configure collecting Fortinet Fortigate firewall logs using a Broker VM Syslog Collector applet, content pack integration (onboarded prior to July 26, 2026), or connector (onboarded after July 26, 2026):
| Collection Method | Description |
|---|---|
| Syslog Collector applet overview | If you use Fortinet Fortigate firewalls, you can forward network connection logs to Cortex XSIAM using the Broker VM Syslog Collector applet in a CEF format. |
| Link to Syslog Collector applet instructions | Ingest logs from Fortinet Fortigate firewalls |
| Links to content pack/integration details (onboarded prior to July 26, 2026) | <p></p><ul><li><p>The FortiManager content pack enables managing Fortinet devices through a single console central management system and provides data normalization for FortiManager event logs ingested via Syslog into Cortex XSIAM. It contains the Fortinet FortiManager Modeling Rule, the Fortinet FortiManager Parsing Rule, and the FortiManager - Install Policy Package on Device playbook. It also includes the following integration:</p><ul><li>FortiManager: Use this integration to manage Fortinet devices as a single console central management system. This integration enables executing the FortiManager - Install Policy Package on Device playbook, which installs a FortiManager firewall policy package on a given device.</li></ul></li><li><p>The FortiGate content pack manages FortiGate firewalls, delivering convergence and deep security visibility across diverse network environments, and facilitating data normalization for ingested event logs. It contains the Fortinet FortiGate Modeling Rule, and the FortiGate Parsing Rule. It also includes the following integration:</p><ul><li>FortiGate: Use this integration to manage Fortinet FortiGate firewall devices, leveraging the Fortinet FortiOS operating system to provide deep visibility and consistent security across environments like remote offices, campuses, and data centers. It includes commands for listing, creating, updating, moving, and deleting firewall policies, addresses (IPv4 and IPv6, including multicasts), and service groups, alongside functionalities like banning and unbanning IPs.</li></ul></li></ul> |
| Link to connector (onboarded after July 26, 2026) | Fortinet FortiGate connector |
Fortinet FortiGate connector
Important
This connector is only available for tenants that onboarded after July 26, 2026. For tenants that onboarded before this date, use Marketplace to access the standalone integration. For more information, see Marketplace.
This connector is available with any active Cortex XSIAM or Cortex AgentiX license.
FortiGate provides flawless convergence that can scale to any location: remote office, branch, campus, data center, and cloud. FortiGate always delivered on the concept of hybrid mesh firewalls with FortiManager for unified management and consistent security across complex hybrid environments. The Fortinet FortiOS operating system provides deep visibility and security across a variety of form factors.
This connector includes the following sub-capabilities (Marketplace integrations link to PAN DEV for more information):
- FortiGate: FortiGate provides flawless convergence that can scale to any location: remote office, branch, campus, data center, and cloud. FortiGate always delivered on the concept of hybrid mesh firewalls with FortiManager for unified management and consistent security across complex hybrid environments. The Fortinet FortiOS operating system provides deep visibility and security across a variety of form factors.
To configure this connector, follow the steps outlined in the configuration wizard.
Fortinet
Important
This connector is only available for tenants that onboarded after July 26, 2026. For tenants that onboarded before this date, use Marketplace to access the standalone integration. For more information, see Marketplace.
This connector is available with any active Cortex XSIAM or Cortex AgentiX license.
Integrate with Fortinet products. FortiManager is a single console central management system that manages Fortinet devices. Use FortiSIEM to fetch and update issues, search events, and manage watchlists and resource lists. FortiSandbox is an advanced security tool that combines proactive mitigation, enhanced threat detection, and in-depth reporting to counter advanced threats. FortiMail is a comprehensive email security solution offering advanced threat protection, data loss prevention, encryption, and email authentication.
This connector includes the following sub-capabilities (Marketplace integrations link to PAN DEV for more information):
- fortimail: FortiMail is a comprehensive email security solution by Fortinet, offering advanced threat protection, data loss prevention, encryption, and email authentication to safeguard organizations against email-based cyber threats and protect sensitive information.
- FortiManager: FortiManager is a single console central management system that manages Fortinet devices.
- FortiSandboxv2: FortiSandbox is an advanced security tool that goes beyond standard sandboxing. It combines proactive mitigation, enhanced threat detection, and in-depth reporting, using Fortinet's dynamic antivirus technology, dual-level sandboxing, and FortiGuard cloud integration to counter advanced threats. It effectively detects viruses, Advanced Persistent Threats (APTs), and malicious URLs, integrating seamlessly with existing Fortinet devices like FortiGate and FortiMail for comprehensive network protection.
- FortiSIEM: Search and update events of FortiSIEM and manage resource lists.
- FortiSIEMV2: Use FortiSIEM v2 to fetch and update incidents, search events and manage watchlists of FortiSIEM.
To configure this connector, follow the steps outlined in the configuration wizard.
Fortinet FortiWeb VM
Important
This connector is only available for tenants that onboarded after July 26, 2026. For tenants that onboarded before this date, use Marketplace to access the standalone integration. For more information, see Marketplace.
This connector is available with any active Cortex XSIAM or Cortex AgentiX license.
Fortinet FortiWeb VM lets you manage web application firewall (WAF) policies and block cookies, URLs, and host names, performing controlled changes on hosted web applications.
This connector includes the following sub-capabilities (Marketplace integrations link to PAN DEV for more information):
To configure this connector, follow the steps outlined in the configuration wizard.
Fortra
Here are the articles in this section:
Fortra
Important
This connector is only available for tenants that onboarded after July 26, 2026. For tenants that onboarded before this date, use Marketplace to access the standalone integration. For more information, see Marketplace.
Integrate with Fortra products. Digital Guardian's Data Loss Prevention (DLP) platform Analytics & Reporting Cloud (ARC) solution identifies, remediates, and protects sensitive data from insider and outsider threats. Tripwire is a file integrity management (FIM) system that monitors files and folders on systems and is triggered when they have changed.
This connector includes the following sub-capabilities (Marketplace integrations link to PAN DEV for more information):
- DigitalGuardianARCEventCollector: Digital Guardian ARC event collector. This sub-capability is available with any active Cortex XSIAM license.
- Tripwire: Tripwire is a file integrity management (FIM), FIM monitors files and folders on systems and is triggered when they have changed. This sub-capability is available with any active Cortex XSIAM or Cortex AgentiX license.
To configure this connector, follow the steps outlined in the configuration wizard.
FraudWatch
Here are the articles in this section:
FraudWatch
Important
This connector is only available for tenants that onboarded after July 26, 2026. For tenants that onboarded before this date, use Marketplace to access the standalone integration. For more information, see Marketplace.
This connector is available with any active Cortex XSIAM or Cortex AgentiX license.
Manage issues via the FraudWatch API. FraudWatch International provides a fully managed Enterprise Digital Brand Protection Suite, including online brand management and monitoring as well as other brand protection solutions that protect organizations and their customers around the world against online brand-related abuse.
This connector includes the following sub-capabilities (Marketplace integrations link to PAN DEV for more information):
- FraudWatch: Manage incidents via the Fraudwatch API. FraudWatch International provides a fully managed Enterprise Digital Brand Protection Suite, including online brand management & monitoring, as well as providing other brand protection solutions that protect organizations and their customers around the world against online brand-related abuse.
To configure this connector, follow the steps outlined in the configuration wizard.
Freshworks
Here are the articles in this section:
Freshworks
Important
This connector is only available for tenants that onboarded after July 26, 2026. For tenants that onboarded before this date, use Marketplace to access the standalone integration. For more information, see Marketplace.
Manage and create Freshdesk tickets, and streamline security-related service management and IT operations with Freshservice. View, create, update, and delete tickets, users, vendors, software, and purchase orders; fetch and mirror tickets.
This connector includes the following sub-capabilities (Marketplace integrations link to PAN DEV for more information):
- Freshdesk: The Freshdesk integration allows you to create, update, and delete tickets; reply to and create notes for tickets as well as view Groups, Agents and Contacts. This sub-capability is available with any active Cortex XSIAM or Cortex AgentiX license.
- FreshworksFreshservice: Freshservice is a service management solution that allows customers to manage service requests, incidents, change requests tasks, and problem investigation. This sub-capability is available with any active Cortex XSIAM, Cortex Cloud Runtime Security, Cortex XDR, or Cortex AgentiX license.
To configure this connector, follow the steps outlined in the configuration wizard.
Gainsight
Here are the articles in this section:
Gainsight
The capabilities and sub-capabilities listed for this connector are available with any active Cortex XSIAM or Cortex Cloud Posture Security license.
This connector includes the following capabilities and sub-capabilities (if applicable):
- Security Posture: Detect, monitor and alert on settings of your SaaS application.
- saas-posture-config-remediation: Help remediate the misconfigured security settings of your SaaS application.
To configure this connector, follow the steps outlined in the configuration wizard.
Gamma.AI
Here are the articles in this section:
Gamma.AI
Important
This connector is only available for tenants that onboarded after July 26, 2026. For tenants that onboarded before this date, use Marketplace to access the standalone integration. For more information, see Marketplace.
This connector is available with any active Cortex XSIAM or Cortex AgentiX license.
Gamma.AI is an AI-powered enterprise cloud data discovery, data classification, and data loss prevention (DLP) platform. It provides 1-click automatic discovery and remediation of data loss instances across enterprise SaaS applications such as Slack, GitHub, GSuite, the Atlassian Suite, Microsoft Office 365, ServiceNow, and ZenDesk.
This connector includes the following sub-capabilities (Marketplace integrations link to PAN DEV for more information):
- Gamma: Query and update violations in Gamma.
To configure this connector, follow the steps outlined in the configuration wizard.
Gemini Enterprise
Here are the articles in this section:
Gemini Enterprise
The capabilities and sub-capabilities listed for this connector are available with any active Cortex Cloud Posture Security license.
This connector includes the following capabilities and sub-capabilities (if applicable):
- Agent Security Scanning: BEFORE YOU BEGIN - In the Google Cloud Console, on your target service account, grant access to the service account
google-onboarding@{{project_id}}.iam.gserviceaccount.comand assign it theService Account Token Creatorrole. Once completed, you can monitor and assess the security posture of your Gemini Enterprise agents.
To configure this connector, follow the steps outlined in the configuration wizard.
Genetec
Genetec Security Center
Important
This connector is only available for tenants that onboarded after July 26, 2026. For tenants that onboarded before this date, use Marketplace to access the standalone integration. For more information, see Marketplace.
This connector is available with any active Cortex XSIAM license.
Genetec Security Center is a platform that unifies your data so that you can manage security policies, monitor events, and run investigations. This connector collects events from the Security Center Audit Trail endpoint.
This connector includes the following sub-capabilities (Marketplace integrations link to PAN DEV for more information):
- Genetec Security Center Event Collector: Genetec Security Center Audit Trail Event Collector.
To configure this connector, follow the steps outlined in the configuration wizard.
Generic
Here are the articles in this section:
Generic Intel Feed
Important
This connector is only available for tenants that onboarded after July 26, 2026. For tenants that onboarded before this date, use Marketplace to access the standalone integration. For more information, see Marketplace.
This connector is available with any active Cortex XSIAM or Cortex AgentiX license.
Fetch threat intelligence indicators from generic CSV, JSON, plain text, RSS, and public DNS feeds, with extensive configuration options to support a wide variety of feed formats. Also provides the Generic Export Indicators Service to expose a list of indicators from the system as an outbound feed (EDL) for consumption by external products.
This connector includes the following sub-capabilities (Marketplace integrations link to PAN DEV for more information):
- CSVFeed
- EDL: Use the Generic Export Indicators Service integration to provide an endpoint with a list of indicators as a service for the system indicators.
- JSON Feed
- Plain Text Feed
- Public DNS Feed
- RSS Feed
To configure this connector, follow the steps outlined in the configuration wizard.
Generic API Event Collector
Important
This connector is only available for tenants that onboarded after July 26, 2026. For tenants that onboarded before this date, use Marketplace to access the standalone integration. For more information, see Marketplace.
This connector is available with any active Cortex XSIAM license.
The Generic API Event Collector allows you to ingest data from any API endpoint into Cortex. By configuring this collector, you can gather data from various systems and bring it into the Cortex ecosystem for better analysis and correlation.
This integration is currently in Beta, and as such, it may be subject to future changes.
This connector includes the following sub-capabilities (Marketplace integrations link to PAN DEV for more information):
- GenericAPIEventCollector: Collect logs from 3rd party vendors using API.
To configure this connector, follow the steps outlined in the configuration wizard.
Generic MCP
Important
This connector is only available for tenants that onboarded after July 26, 2026. For tenants that onboarded before this date, use Marketplace to access the standalone integration. For more information, see Marketplace.
This connector is available with any active Cortex XSIAM, Cortex Cloud Posture Security with the Application Security Posture Management (ASPM) module, Cortex Cloud, Cortex Cloud Runtime Security, Cortex XDR, or Cortex AgentiX license with the Attack Surface Management (ASM), Exposure Management, or Threat Intel Management (TIM) add-on.
Connect securely with any MCP server and access its tools in real time. This integration automatically discovers the tools available on the connected MCP server.
This connector includes the following sub-capabilities (Marketplace integrations link to PAN DEV for more information):
- Generic MCP: Use this integration to connect to an MCP server and automatically discover its available tools.
To configure this connector, follow the steps outlined in the configuration wizard.
Generic SQL
Important
This connector is only available for tenants that onboarded after July 26, 2026. For tenants that onboarded before this date, use Marketplace to access the standalone integration. For more information, see Marketplace.
This connector is available with any active Cortex XSIAM, Cortex Cloud Posture Security, Cortex Cloud, Cortex Cloud Runtime Security, Cortex XDR, or Cortex AgentiX license.
Generic SQL integration for the databases MySQL, PostgreSQL, Microsoft SQL Server, Oracle, Teradata, and Trino. Run SQL queries against your database and fetch issues from it.
This connector includes the following sub-capabilities (Marketplace integrations link to PAN DEV for more information):
- Generic SQL: Use the Generic SQL integration to run SQL queries on the following databases: MySQL, PostgreSQL, Microsoft SQL Server, Oracle, Teradata and Trino.
To configure this connector, follow the steps outlined in the configuration wizard.
Genesys
Here are the articles in this section:
Genesys
Important
This connector is only available for tenants that onboarded after July 26, 2026. For tenants that onboarded before this date, use Marketplace to access the standalone integration. For more information, see Marketplace.
This connector is available with any active Cortex XSIAM license.
Genesys Cloud is a unified, all-in-one cloud collaboration and contact center platform that provides customer interaction and operational audit event data. Fetch audit events to see changes within a Genesys Cloud organization.
This connector includes the following sub-capabilities (Marketplace integrations link to PAN DEV for more information):
- GenesysCloud: Fetch audit events to see changes within a Genesys Cloud organization.
To configure this connector, follow the steps outlined in the configuration wizard.
Gigamon
Gigamon
Important
This connector is only available for tenants that onboarded after July 26, 2026. For tenants that onboarded before this date, use Marketplace to access the standalone integration. For more information, see Marketplace.
This connector is available with any active Cortex XSIAM or Cortex AgentiX license.
ICEBRG is a network security product used in conjunction with Cortex XSOAR to get events and reports produced in ICEBRG for queries. Top use cases include searching events by query and getting reports by UUID.
This connector includes the following sub-capabilities (Marketplace integrations link to PAN DEV for more information):
- icebrg: Reduces risk by accelerating threat detection, triage, and response to rapidly-evolving breaches across global networks.
To configure this connector, follow the steps outlined in the configuration wizard.
GitGuardian
Here are the articles in this section:
GitGuardian
Important
This connector is only available for tenants that onboarded after July 26, 2026. For tenants that onboarded before this date, use Marketplace to access the standalone integration. For more information, see Marketplace.
This connector is available with any active Cortex XSIAM license.
Collect events automatically from GitGuardian. You can also use the gitguardian-get-events command to manually collect events.
This connector includes the following sub-capabilities (Marketplace integrations link to PAN DEV for more information):
- GitGuardianEventCollector: This is the GitGuardian event collector integration for Cortex XSIAM.
To configure this connector, follow the steps outlined in the configuration wizard.
GitHub
Here are the articles in this section:
GitHub
Important
This connector is only available for tenants that onboarded after July 26, 2026. For tenants that onboarded before this date, use Marketplace to access the standalone integration. For more information, see Marketplace.
GitHub is an internet hosting provider that uses Git for software development and version control, adding access control and collaboration features such as bug tracking, feature requests, task management, and continuous integration. This connector lets you manage GitHub issues and pull requests, provision organization membership, connect to a GitHub Model Context Protocol (MCP) server, collect organization audit logs, and publish indicators from a repository.
This connector includes the following sub-capabilities (Marketplace integrations link to PAN DEV for more information):
- GitHub: Integration to GitHub API. This sub-capability is available with any active Cortex XSIAM, Cortex Cloud Posture Security, Cortex Cloud, Cortex Cloud Runtime Security, Cortex XDR, or Cortex AgentiX license.
- Github Event Collector: GitHub logs event collector integration for Cortex XSIAM. This sub-capability is available with any active Cortex XSIAM license.
- Github Feed: This sub-capability is available with any active Cortex XSIAM or Cortex AgentiX license.
- GitHub IAM: Integrate with GitHub services to perform Identity Lifecycle Management operations. This sub-capability is available with any active Cortex XSIAM, Cortex Cloud Posture Security, Cortex Cloud, Cortex Cloud Runtime Security, Cortex XDR, or Cortex AgentiX license.
- GitHub MCP: Use this integration to connect securely with a GitHub Model Context Protocol (MCP) server and access its tools in real time. This sub-capability is available with any active Cortex XSIAM, Cortex Cloud Posture Security, Cortex Cloud Runtime Security, Cortex XDR, or Cortex AgentiX license.
To configure this connector, follow the steps outlined in the configuration wizard.
GitLab
You can configure collecting GitLab logs and data using a standard data source or connectors:
| Collection Method | Description |
|---|---|
| Standard data source overview | Connect a GitLab container registry to Cortex XSIAM for image scanning. |
| Link to standard data source instructions | Connect GitLab container registry |
| Link to connectors | <ul><li>GitLab Automation and Collection (onboarded after July 26, 2026)</li><li>GitLab</li></ul> |
Connect GitLab container registry
Configure Cortex XSIAM to scan your GitLab Container Registry without using administrator credentials. Use a GitLab Personal Access Token (PAT) to authenticate Cortex to access the GitLab Container Registry. This allows Cortex to list all container registries or images, and secure them from vulnerabilities, malware, and secrets.
License type: This feature is included with a Cortex XSIAM Premium license. It is also included with any other Cortex XSIAM product that has the Cloud Posture Security or the Cloud Runtime Security add-on.
How to connect GitLab registry
Follow the wizard to connect the GitLab Container Registry connector in Cortex XSIAM.
- Navigate to Settings → Data Sources & Integrations.
- On the Data Sources & Integrations page, click + Add New, search for GitLab Container Registry, then hover over it and click Add.
- The Instance Name is automatically populated. You can change it to a more meaningful name.
- Choose the Scan Mode, and then follow the steps provided for that mode to configure the connection.
Cloud Scan
Security scanning is done in the Cortex XSIAM environment when you select this mode.
-
Select the appropriate Cloud Provider and Region for the Cortex environment to use for registry scanning.
As a best practice, choose the region closest to your registry deployment to achieve the best scanning throughput and potentially reduce cloud costs.
- (Optional) Enable Allow access by IPs to specify a static IP address for the scanner to use. Make sure the static IP is allowed through your firewall so the scanner can access the registry during the scanning process.
-
Choose the relevant Account Type for GitLab deployments:
GitLab Cloud (Saas)
-
(Optional) Enter the Group Id.
You can enter a single group ID or a list of group IDs separated by a comma. The group ID is used to locate all the registries within a specific group.
-
(Optional) Enter the Project Id.
You can enter a GitLab Project ID or a list of project IDs separated by a comma. The project ID is used to locate all the registries located within a specific project.
- When both the group ID and project ID are provided, the system retrieves container images from all projects within the specified group as well as from the specified project.
- If neither the group ID nor the project ID is provided, the system retrieves container images from all registries (across all groups and projects) accessible to the authenticated user or token in GitLab.
-
Under Authentication Method, enter your GitLab Access Token.
GitLab Self-Hosted
-
Enter the Registry URL.
If you are using a CA certificate, enter the server IP address instead of the registry url.
-
(Optional) Enter the Group id.
You can enter a single group ID or a list of group IDs separated by a comma. The group ID is used to locate all the registries within a specific group.
-
(Optional) Enter the Project Id.
You can enter a GitLab Project ID or a list of project IDs separated by a comma. The project ID is used to locate all the registries located within a specific project.
- When both the group ID and project ID are provided, the system retrieves container images from all projects within the specified group as well as from the specified project.
- If neither the group ID nor the project ID is provided, the system retrieves container images from all registries (across all groups and projects) accessible to the authenticated user or token in GitLab.
- Enter the Api Domain. Include the GitLab API base URL with the https:// prefix (for example,
https://gitlab.example.dev). - Under Authentication Method, enter your GitLab Access Token.
- (Optional) Expand Show Advanced Settings, and then enter the CA certificate in PEM format for Cortex to validate the GitLab registry.
-
- Select Next.
Scan with Outpost
Security scanning is done on infrastructure deployed to a cloud account that you own. This mode requires additional cloud provider permissions and may incur extra costs.
Prerequisite
Ensure an Outpost is connected to your tenant.
-
Choose a Cloud Provider to initialize registry scanning.
Note
If you choose Azure as the Cloud Provider, you must also select the Tenant Id. The Tenant Id is required to approve Cortex as an enterprise application in your Azure tenant.
-
Choose Outpost account to use for this instance. If no Outposts are shown, you can Create a new one. For more details, see Outposts.
Note
If you choose Azure as the cloud provider, only Outposts associated with the selected tenant ID are displayed.
- Select the Region where the registry is hosted.
- (Optional) Enable Allow access by IPs if you want to specify a static IP address for the scanner to use. Make sure the static IP is allowed through your firewall so that the scanner can access the registry during the scanning process.
-
Choose the relevant Account Type for GitLab deployments:
GitLab Cloud (Saas)
-
(Optional) Enter the Group Id.
You can enter a single group ID or a list of group IDs separated by a comma. The group ID is used to locate all the registries within a specific group.
-
(Optional) Enter the Project Id.
You can enter a GitLab Project ID or a list of project IDs separated by a comma. The project ID is used to locate all the registries located within a specific project.
- When both the group ID and project ID are provided, the system retrieves container images from all projects within the specified group as well as from the specified project.
- If neither the group ID nor the project ID is provided, the system retrieves container images from all registries (across all groups and projects) accessible to the authenticated user or token in GitLab.
-
Under Authentication Method, enter your GitLab Access Token.
GitLab Self-Hosted
-
Enter the Registry URL.
If you are using a CA certificate, enter the server IP address instead of the registry url.
-
(Optional) Enter the Group id.
You can enter a single group ID or a list of group IDs separated by a comma. The group ID is used to locate all the registries within a specific group.
-
(Optional) Enter the Project Id.
You can enter a GitLab Project ID or a list of project IDs separated by a comma. The project ID is used to locate all the registries located within a specific project.
- When both the group ID and project ID are provided, the system retrieves container images from all projects within the specified group as well as from the specified project.
- If neither the group ID nor the project ID is provided, the system retrieves container images from all registries (across all groups and projects) accessible to the authenticated user or token in GitLab.
- Enter the Api Domain. Include the GitLab API base URL with the https:// prefix (for example,
https://gitlab.example.dev). - Under Authentication Method, enter your GitLab Access Token.
- (Optional) Expand Show Advanced Settings, and then enter the CA certificate in PEM format for Cortex to validate the GitLab registry.
-
- Select Next.
Scan with Broker VM
Security scanning in private networks is performed using broker VM infrastructure when you select this mode.
Prerequisite
Ensure one of the following is configured:
- Choose a Scan with Broker VM mode to initiate registry scanning. You can select either a standalone Broker VM or a High Availability (HA) Cluster.
-
Select Applicable Broker VMs.
Choose the appropriate Broker VM or Cluster from the list configured in your tenant.
Note
- The list of Broker VMs displays only VMs that support registry scanning.
- The list of high-availability Clusters displays only clusters that contain at least one VM supporting registry scanning.
- The registry scanning status for each VM appears in brackets if it was previously activated for that specific VM.
If the list does not display any Broker VMs or clusters, Add New Broker VM or Add New Cluster. For more details, see Set up and configure Broker VM.
-
Choose the relevant Account Type for GitLab deployments:
GitLab Cloud (Saas)
-
(Optional) Enter the Group Id.
You can enter a single group ID or a list of group IDs separated by a comma. The group ID is used to locate all the registries within a specific group.
-
(Optional) Enter the Project Id.
You can enter a GitLab Project ID or a list of project IDs separated by a comma. The project ID is used to locate all the registries located within a specific project.
- When both the group ID and project ID are provided, the system retrieves container images from all projects within the specified group as well as from the specified project.
- If neither the group ID nor the project ID is provided, the system retrieves container images from all registries (across all groups and projects) accessible to the authenticated user or token in GitLab.
-
Under Authentication Method, enter your GitLab Access Token.
GitLab Self-Hosted
-
Enter the Registry URL.
If you are using a CA certificate, enter the server IP address instead of the registry url.
-
(Optional) Enter the Group id.
You can enter a single group ID or a list of group IDs separated by a comma. The group ID is used to locate all the registries within a specific group.
-
(Optional) Enter the Project Id.
You can enter a GitLab Project ID or a list of project IDs separated by a comma. The project ID is used to locate all the registries located within a specific project.
- When both the group ID and project ID are provided, the system retrieves container images from all projects within the specified group as well as from the specified project.
- If neither the group ID nor the project ID is provided, the system retrieves container images from all registries (across all groups and projects) accessible to the authenticated user or token in GitLab.
- Enter the Api Domain. Include the GitLab API base URL with the https:// prefix (for example,
https://gitlab.example.dev). - Under Authentication Method, enter your GitLab Access Token.
- (Optional) Expand Show Advanced Settings, and then enter the CA certificate in PEM format for Cortex to validate the GitLab registry.
-
-
Select Next.
- In the Initial Scan Configuration, set your scanning process to focus on recently added or modified container images and exclude older ones that do not align with your current scanning objectives. This setting helps avoid unnecessary scans. Choose one of the following options:
- All: Scans all container images, including all versions (tags), in all discovered repositories.
- Latest Tag: Scans only images tagged 'latest' in all discovered repositories.
- Days Modified: Scans container images that have been created in the last few days. You can select a range of up to 90 days for the scan.
-
Select Save.
When the GitLab data source is saved successfully, a new data connector is created, and the initial discovery scan is started. The connection process may take up to 15 minutes.
- To check connector status and scan results, follow these steps:
- Navigate to Settings → Data Sources & Integrations.
- Find the GitLab Container Registry instance from the list of 3rd Party Data Sources connectors, or use Search.
- In the GitLab Container Registry instance row, select View Details. The GitLab Instances page appears.
- On the GitLab Instances page, you can filter results by any heading and value.
-
Select an instance name to open the details pane. The details pane contains the following granular information:
Instance Details Description Status Shows the status of the connector: Connected, Error, Warning, Disabled, or Pending. Applet Status on Broker VM Shows the status of the Registry Scanner applet on the Broker VM page. This status is visible only when the Scan with Broker VM mode is selected. Repositories Shows the number of scanned repositories in the registry. Scan Mode Shows the selected scan mode for the data connector, such as Cloud Scan, Scan with Outpost, or Scan with Broker VM. Security Capabilities Shows a breakdown of the security capabilities enabled on the instance and their individual statuses. For example, select Registry Scanning when it shows a warning or error status to see the open errors and issues that contributed to the status.
-
Next Steps.
- After the scan is complete, you can view the scanned images on the Container Images Inventory page. For more details, see Container Images assets.
-
If you have selected the Scan with Broker VM option, then a Registry Scanner applet is created on the selected Broker VM or Cluster. For details, see Verify Registry Scanner connection.
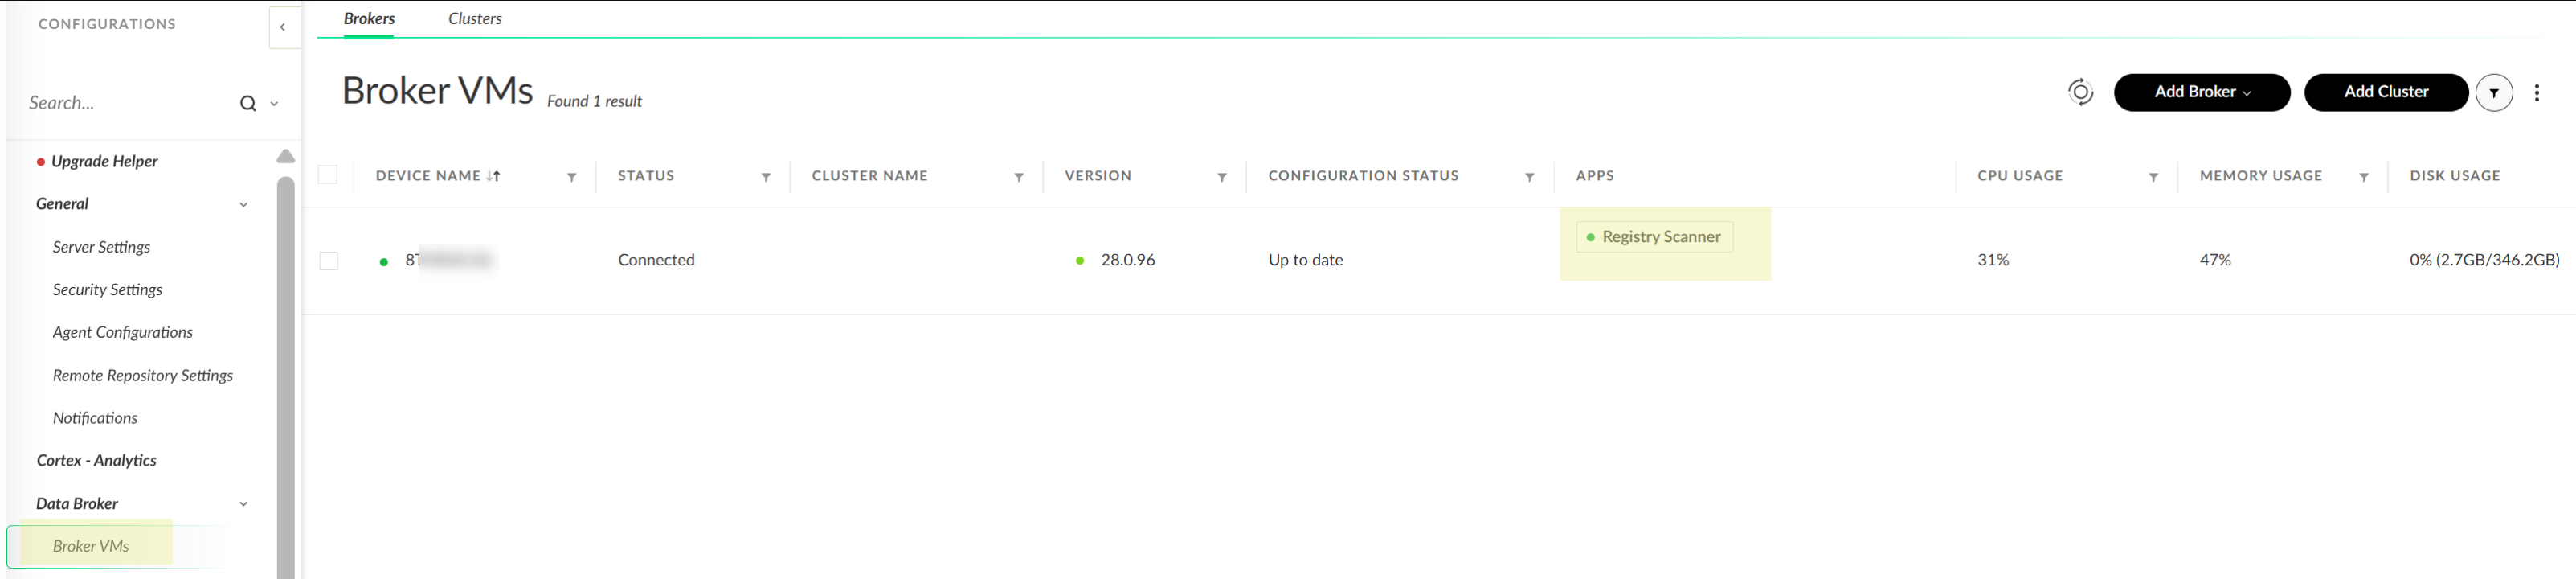
Manage a GitLab Container Registry connector
After you add a GitLab Container Registry connector, you can modify the connector settings and configure the scanning scope to control which images are scanned in the connected registry.
To manage the connector, follow these steps:
- Navigate to Settings → Data Sources & Integrations.
- Find the GitLab Container Registry data source from the list of data sources, or use the filter to search.
-
Select the GitLab Container Registry row. A pane opens with a list of integration instances and their details.
You can create a new instance by selecting Add Instance following the onboarding wizard to define the settings.
-
Right click an instance to perform actions on it as follows:
Action Instructions Edit Edit the GitLab instance.
Note
- If you selected Scan with Broker VM mode, you can't change to a different scan mode (such as Cloud Discovery or Scan with Outpost) when you edit the instance.
- When editing an instance configured for Scan with Broker VM, you must re-enter your authentication credentials, including Username, Password, and CA certificate.
Exclude/Include images Define conditions to automatically exclude or include specific images while scanning. Conditions can be based on Repository or Tags. These conditions apply automatically to newly discovered images in the account. Delete Removes the connector. Disable Stops image scanning for the connector without deleting it.
GitLab Automation and Collection
Important
This connector is only available for tenants that onboarded after July 26, 2026. For tenants that onboarded before this date, use Marketplace to access the standalone integration. For more information, see Marketplace.
Integrate with GitLab, the DevOps platform for managing repositories, projects, and pipelines. Automate the creation, updating, and tracking of GitLab issues, merge requests, branches, files, and pipelines, and collect audit event logs via the GitLab API.
This connector includes the following sub-capabilities (Marketplace integrations link to PAN DEV for more information):
- GitLab Event Collector: This sub-capability is available with any active Cortex XSIAM license.
- GitLabv2: Integration to GitLab API. This sub-capability is available with any active Cortex XSIAM or Cortex AgentiX license.
To configure this connector, follow the steps outlined in the configuration wizard.
GitLab
The capabilities and sub-capabilities listed for this connector are available with any active Cortex XSIAM or Cortex Cloud Posture Security license.
This connector includes the following capabilities and sub-capabilities (if applicable):
- SaaS Posture Configuration Monitoring: Detect, monitor and alert on settings of your SAAS application.
- saas-posture-config-remediation: Help remediate the misconfigured security settings of your SAAS application.
To configure this connector, follow the steps outlined in the configuration wizard.
Giphy
Giphy
Important
This connector is only available for tenants that onboarded after July 26, 2026. For tenants that onboarded before this date, use Marketplace to access the standalone integration. For more information, see Marketplace.
This connector is available with any active Cortex XSIAM or Cortex AgentiX license.
Giphy provides access to the Giphy GIF library. Powered By Giphy.
This connector includes the following sub-capabilities (Marketplace integrations link to PAN DEV for more information):
- Giphy: Display random GIF in the War Room (e.g. !giphy hello). Powered By Giphy.
To configure this connector, follow the steps outlined in the configuration wizard.
Here are the articles in this section:
Google AI
Important
This connector is only available for tenants that onboarded after July 26, 2026. For tenants that onboarded before this date, use Marketplace to access the standalone integration. For more information, see Marketplace.
This connector is available with any active Cortex XSIAM or Cortex AgentiX license.
The Google Gemini connector provides access to Google's advanced large language models for AI-powered chat conversations, text analysis, and natural language processing within Cortex XSOAR / XSIAM. It supports two authentication modes: Google AI Studio (API key) and Google Cloud Vertex AI (service account), and multiple Gemini models.
This connector includes the following sub-capabilities (Marketplace integrations link to PAN DEV for more information):
- GoogleGemini: Google Gemini LLM Integration for AI-powered analysis and chat capabilities. This integration provides access to Google Gemini's large language models for AI-powered chat conversations, text analysis and generation, and natural language processing tasks.
To configure this connector, follow the steps outlined in the configuration wizard.
Google Cloud
Important
This connector is only available for tenants that onboarded after July 26, 2026. For tenants that onboarded before this date, use Marketplace to access the standalone integration. For more information, see Marketplace.
This connector is available with any active Cortex XSIAM or Cortex AgentiX license.
Integrate with Google Cloud Platform services to manage identity and access, compute, storage, key management, resource management, logging, messaging, and analytics. This connector groups the GCP-IAM, Google BigQuery, Google Cloud Compute, Google Cloud Functions, Google Cloud Storage, Google Key Management Service, Google Resource Manager, Google Vision AI, Google Cloud Logging, Google Cloud Translate, Google Kubernetes Engine, Google Cloud Pub/Sub, and Looker integrations.
This connector includes the following sub-capabilities (Marketplace integrations link to PAN DEV for more information):
- GCP-IAM: Manage identity and access control for Google Cloud Platform resources.
- Google BigQuery: Integration for Google BigQuery, a data warehouse for querying and analyzing large databases.
- Google Cloud Compute: Google Compute Engine delivers virtual machines running in Google's innovative data centers and worldwide fiber network.
- Google Cloud Functions: Google Cloud Functions is an event-driven serverless compute platform.
- Google Cloud Storage: Google Cloud Storage is a RESTful online file storage web service.
- Google Key Management Service: Use the Google Key Management Service API for CryptoKey management and encrypt/decrypt functionality.
- Google Resource Manager: Google Cloud Platform Resource Manager.
- Google Vision AI
- GoogleCloudLogging: Centralize logs in a single location.
- GoogleCloudTranslate: A Google API cloud-based translation service.
- GoogleKubernetesEngine: Build and manage container-based applications in Google Cloud Platform.
- GooglePubSub: A fully-managed real-time messaging service.
- Looker: Query explores, save queries as looks, run looks, and fetch results as incidents.
To configure this connector, follow the steps outlined in the configuration wizard.
Google Cloud Platform
You can configure collecting Google Cloud Platform (GCP) logs using a standard data source, Cloud Service Provider (CSP) onboarding data source, content pack integration (onboarded prior to July 26, 2026), or connector (onboarded after July 26, 2026):
| Collection Method | Description |
|---|---|
| Standard data source overview | If you use the Pub/Sub messaging service from Google Cloud Platform (GCP), forward logs and data to Cortex XSIAM from your GCP instance using the Google Cloud Platform data source. |
| Link to standard data source instructions | <p>The following types of logs can be ingested from Google Cloud Platform:</p><ul><li>Audit logs, including Google Kubernetes Engine (GKE) audit logs.</li><li>Generic logs</li><li>Google Cloud DNS logs</li><li>Network flow logs</li></ul><p>For more information, see Ingest logs and data from a GCP Pub/Sub.</p> |
| Link to full configuration Cloud Service Provider (CSP) onboarding data source instructions | Onboard Google Cloud Platform |
| Link to basic configuration Cloud Service Provider (CSP) onboarding data source instructions for Cortex XSIAM NG SIEM, Cortex XSIAM Enterprise license, and Cortex XSIAM Enterprise+ licenses. | How to onboard GCP with foundational configuration |
| Links to content pack/ integration details (onboarded prior to July 26, 2026) | <p>The Google Cloud Pub / Sub content pack integrates with the Google Cloud Pub / Sub messaging service to enable you to send and receive messages between independent applications. It contains the following integration:</p><ul><li>Google Cloud Pub/Sub: Use this integration to enable automated security operations and issue response through a series of dedicated commands that manage messaging topics, subscriptions, and message flow. For example, there are commands for listing, creating, updating, and deleting topics and subscriptions, publishing messages, and manually pulling or seeking messages for processing.</li></ul><p>This integration requires specific elevated permissions such as Project-Owner or Pub/Sub Admin.</p> |
| Link to connector (onboarded after July 26, 2026) | Google Cloud |
Ingest logs and data from a GCP Pub/Sub
If you use the Pub/Sub messaging service from Global Cloud Platform (GCP), you can send logs and data from your GCP instance to Cortex XSIAM. Data from GCP is then searchable in Cortex XSIAM to provide additional information and context to your investigations using the GCP Cortex Query Language (XQL) dataset, which is dependent on the type of GCP logs collected. For example queries, refer to the in-app XQL Library. You can configure a Google Cloud Platform collector to receive generic, flow, audit, or Google Cloud DNS logs. When configuring generic logs, you can receive logs in a Raw, JSON, CEF, LEEF, Cisco, or Corelight format.
You can also configure Cortex XSIAM to normalize different GCP logs as part of the enhanced cloud protection, which you can query with XQL Search using the applicable dataset. Cortex XSIAM can also generate Cortex XSIAM issues (Analytics, IOC, BIOC, and Correlation Rules), when relevant, from GCP logs. While Correlation Rules isssues are generated on non-normalized and normalized logs, Analytics, IOC, and BIOC issues are only raised on normalized logs.
Enhanced cloud protection provides the following:
- Normalization of cloud logs
- Cloud logs stitching
- Enrichment with cloud data
- Detection based on cloud analytics
- Cloud-tailored investigations
The following table lists the various GCP log types the XQL datasets you can use to query in XQL Search:
| GCP log type | Dataset | Dataset with normalized data |
|---|---|---|
| Audit logs, including Google Kubernetes Engine (GKE) audit logs | google_cloud_logging_raw |
cloud_audit_logs |
| Generic logs | <p>Log Format types:</p><ul><li>CEF or LEEF: Automatically detected from either the logs or the user's input in the User Interface.</li><li>Cisco: cisco_asa_raw</li><li>Corelight: corelight_zeek_raw</li><li>JSON or Raw: google_cloud_logging_raw</li></ul> |
N/A |
| Google Cloud DNS logs | google_dns_raw |
xdr_data: Once configured, Cortex XSIAM ingests Google Cloud DNS logs as XDR network connection stories, which you can query with XQL Search using the xdr_data dataset with the preset called network_story. |
| Network flow logs | google_cloud_logging_raw |
xdr_data: Once configured, Cortex XSIAM ingests network flow logs as XDR network connection stories, which you can query with XQL Search using the xdr_data dataset with the preset called network_story. |
Note
When collecting flow logs, we recommend that you include GKE annotations in your logs, which enable you to view the names of the containers that communicated with each other. GKE annotations are only included in logs if appended manually using the custom metadata configuration in GCP. For more information, see VPC Flow Logs Overview. In addition, to customize metadata fields, you must use the gcloud command-line interface or the API. For more information, see Using VPC Flow Logs.
To receive logs and data from GCP, you must first set up log forwarding using a Pub/Sub topic in GCP. You can configure GCP settings using either the GCP web interface or a GCP cloud shell terminal. After you set up your service account in GCP, you configure the Data Collection settings in Cortex XSIAM. The setup process requires the subscription name and authentication key from your GCP instance.
After you set up log collection, Cortex XSIAM immediately begins receiving new logs and data from GCP.
Set up log forwarding using the GCP web interface
-
In Cortex XSIAM, set up Data Collection.
a. Navigate to Settings → Data Sources & Integrations.
b. On the Data Sources & Integrations page, click + Add New, search for Google Cloud Platform, then hover over it and click Add.
c. Specify the Subscription Name that you previously noted or copied.
d. Browse to the JSON file containing your authentication key for the service account.
e. Select the Log Type as one of the following, where your selection changes the options displayed.
- Flow or Audit Logs: When selecting this log type, you can decide whether to normalize and enrich the logs as part of the enhanced cloud protection.
- (Optional) You can Normalize and enrich flow and audit logs by selecting the checkbox (default). If selected, Cortex XSIAM ingests the network flow logs as XSIAM network connection stories, which you can query using XQL Search from the
xdr_datasetdataset with the preset callednetwork_story. In addition, you can configure Cortex XSIAM to normalize GCP audit logs, which you can query with XQL Search using thecloud_audit_logsdataset. - The Vendor is automatically set to Google and Product to Cloud Logging, which is not configurable. This means that all GCP data for the flow and audit logs, whether it's normalized or not, can be queried in XQL Search using the
google_cloud_logging_rawdataset.
- (Optional) You can Normalize and enrich flow and audit logs by selecting the checkbox (default). If selected, Cortex XSIAM ingests the network flow logs as XSIAM network connection stories, which you can query using XQL Search from the
- Generic: When selecting this log type, you can configure the following settings.
- Log Format: Select the log format type as Raw, JSON, CEF, LEEF, Cisco, or Corelight.
-
CEF or LEEF: The Vendor and Product defaults to Auto-Detect.
Note
For a Log Format set to CEF or LEEF, Cortex XSIAM reads events row by row to look for the Vendor and Product configured in the logs. When the values are populated in the event log row, Cortex XSIAM uses these values even if you specified a value in the Vendor and Product fields in the GCP data collector settings. Yet, when the values are blank in the event log row, Cortex XSIAM uses the Vendor and Product that you specified in the GCP data collector settings. If you did not specify a Vendor or Product in the GCP data collector settings, and the values are blank in the event log row, the values for both fields are set to unknown.
-
Cisco: The following fields are automatically set and not configurable.
- Vendor: Cisco
- Product: ASA
Cisco data can be queried in XQL Search using the
cisco_asa_rawdataset. -
Corelight: The following fields are automatically set and not configurable.
- Vendor: Corelight
- Product: Zeek
Corelight data can be queried in XQL Search using the
corelight_zeek_rawdataset. -
Raw or JSON: The following fields are automatically set and are configurable.
- Vendor: Google
- Product: Cloud Logging
Raw or JSON data can be queried in XQL Search using the
google_cloud_logging_rawdataset.Cortex XSIAM supports logs in single line format or multiline format. For a JSON format, multiline logs are collected automatically when the Log Format is configured as JSON. When configuring a Raw format, you must also define the Multiline Parsing Regex as explained below.
-
- Vendor: (Optional) Specify a particular vendor name for the GCP generic data collection, which is used in the GCP XQL dataset
<Vendor>_<Product>_rawthat Cortex XSIAM creates as soon as it begins receiving logs. - Product: (Optional) Specify a particular product name for the GCP generic data collection, which is used in the GCP XQL dataset name
<Vendor>_<Product>_rawthat Cortex XSIAM creates as soon as it begins receiving logs. - Multiline Parsing Regex: (Optional) This option is only displayed when the Log Format is set to Raw, where you can set the regular expression that identifies when the multiline event starts in logs with multilines. It is assumed that when a new event begins, the previous one has ended.
- Log Format: Select the log format type as Raw, JSON, CEF, LEEF, Cisco, or Corelight.
- Google Cloud DNS: When selecting this log type, you can configure whether to normalize the logs as part of the enhanced cloud protection.
- Optional) You can Normalize DNS logs by selecting the checkbox (default). If selected, Cortex XSIAM ingests the Google Cloud DNS logs as XSIAM network connection stories, which you can query using XQL Search from the
xdr_datasetdataset with the preset callednetwork_story. - The Vendor is automatically set to Google and Product to DNS , which is not configurable. This means that all Google Cloud DNS logs, whether it's normalized or not, can be queried in XQL Search using the
google_dns_rawdataset.
- Optional) You can Normalize DNS logs by selecting the checkbox (default). If selected, Cortex XSIAM ingests the Google Cloud DNS logs as XSIAM network connection stories, which you can query using XQL Search from the
f. Test the provided settings and, if successful, proceed to Enable log collection.
- Flow or Audit Logs: When selecting this log type, you can decide whether to normalize and enrich the logs as part of the enhanced cloud protection.
- Log in to your GCP account.
-
Set up log forwarding from GCP to Cortex XSIAM.
a. Select Logging → Logs Router.
b. Select Create Sink → Cloud Pub/Sub topic, and then click Next.
c. To filter only specific types of data, select the filter or desired resource.
d. In the Edit Sink configuration, define a descriptive Sink Name.
e. Select Sink Destination → Create new Cloud Pub/Sub topic.
f. Enter a descriptive Name that identifies the sink purpose for Cortex XSIAM, and then Create.
g. Create Sink and then Close when finished.
-
Create a subscription for your Pub/Sub topic.
a. Select the menu icon in G Cloud, and then select Pub/Sub → Topics.
b. Select the name of the topic you created in the previous steps. Use the filters if necessary.
c. Select Create Subscription → Create subscription.
d. Enter a unique Subscription ID.
e. Choose Pull as the Delivery Type.
f. Create the subscription. After the subscription is set up, G Cloud displays statistics and settings for the service.
g. In the subscription details, identify and note your Subscription Name.
Optionally, use the copy button to copy the name to the clipboard. You will need the name when you configure Collection in Cortex XSIAM.
-
Create a service account and authentication key.
You will use the key to enable Cortex XSIAM to authenticate with the subscription service.
a. Select the menu icon, and then select IAM & Admin → Service Accounts.
b. Create Service Account.
c. Enter a Service account name and then Create.
d. Select a role for the account: Pub/Sub → Pub/Sub Subscriber.
e. Click Continue → Done.
f. Locate the service account by name, using the filters to refine the results, if needed.
g. Click the Actions menu identified by the three dots in the row for the service account and then Create Key.
h. Select JSON as the key type, and then Create. After you create the service account key, G Cloud automatically downloads it.
- After Cortex XSIAM begins receiving information from the GCP Pub/Sub service, you can use the XQL Query language to search for specific data.
Note
If you encounter errors while enabling this integration due to VPC Service Controls (VPC SC) in your Google Cloud organization, configure the required ingress rules. For detailed technical guidance, contact our Customer Support team.
Set up log forwarding using the GCP cloud shell terminal
In Cortex XSIAM, set up Data Collection.
- Navigate to Settings → Data Sources & Integrations.
- On the Data Sources & Integrations page, click + Add New, search for Google Cloud Platform, then hover over it and click Add.
- Specify the Subscription Name that you previously noted or copied.
- Browse to the JSON file containing your authentication key for the service account.
- Select the Log Type as one of the following, where your selection changes the options displayed.
- Flow or Audit Logs: When selecting this log type, you can decide whether to normalize and enrich the logs as part of the enhanced cloud protection.
- (Optional) You can Normalize and enrich flow and audit logs by selecting the checkbox (default). If selected, Cortex XSIAM ingests the network flow logs as XSIAM network connection stories, which you can query using XQL Search from the
xdr_datasetdataset with the preset callednetwork_story. In addition, you can configure Cortex XSIAM to normalize GCP audit logs, which you can query with XQL Search using thecloud_audit_logsdataset. - The Vendor is automatically set to Google and Product to Cloud Logging, which is not configurable. This means that all GCP data for the flow and audit logs, whether it's normalized or not, can be queried in XQL Search using the
google_cloud_logging_rawdataset.
- (Optional) You can Normalize and enrich flow and audit logs by selecting the checkbox (default). If selected, Cortex XSIAM ingests the network flow logs as XSIAM network connection stories, which you can query using XQL Search from the
- Generic: When selecting this log type, you can configure the following settings.
- Log Format: Select the log format type as Raw, JSON, CEF, LEEF, Cisco, or Corelight.
-
CEF or LEEF: The Vendor and Product defaults to Auto-Detect.
For a Log Format set to CEF or LEEF, Cortex XSIAM reads events row by row to look for the Vendor and Product configured in the logs. When the values are populated in the event log row, Cortex XSIAM uses these values even if you specified a value in the Vendor and Product fields in the GCP data collector settings. Yet, when the values are blank in the event log row, Cortex XSIAM uses the Vendor and Product that you specified in the GCP data collector settings. If you did not specify a Vendor or Product in the GCP data collector settings, and the values are blank in the event log row, the values for both fields are set to unknown.
-
Cisco: The following fields are automatically set and not configurable.
- Vendor: Cisco
- Product: ASA
Cisco data can be queried in XQL Search using the
cisco_asa_rawdataset. -
Corelight: The following fields are automatically set and not configurable.
- Vendor: Corelight
- Product: Zeek
Corelight data can be queried in XQL Search using the
corelight_zeek_rawdataset. -
Raw or JSON: The following fields are automatically set and are configurable.
- Vendor: Google
- Product: Cloud Logging
Raw or JSON data can be queried in XQL Search using the
google_cloud_logging_rawdataset.Cortex XSIAM supports logs in single line format or multiline format. For a JSON format, multiline logs are collected automatically when the Log Format is configured as JSON. When configuring a Raw format, you must also define the Multiline Parsing Regex as explained below.
-
- Vendor: (Optional) Specify a particular vendor name for the GCP generic data collection, which is used in the GCP XQL dataset
<Vendor>_<Product>_rawthat Cortex XSIAM creates as soon as it begins receiving logs. - Product: (Optional) Specify a particular product name for the GCP generic data collection, which is used in the GCP XQL dataset name
<Vendor>_<Product>_rawthat Cortex XSIAM creates as soon as it begins receiving logs. - Multiline Parsing Regex: (Optional) This option is only displayed when the Log Format is set to Raw, where you can set the regular expression that identifies when the multiline event starts in logs with multilines. It is assumed that when a new event begins, the previous one has ended.
- Log Format: Select the log format type as Raw, JSON, CEF, LEEF, Cisco, or Corelight.
- Google Cloud DNS: When selecting this log type, you can configure whether to normalize the logs as part of the enhanced cloud protection.
- Optional) You can Normalize DNS logs by selecting the checkbox (default). If selected, Cortex XSIAM ingests the Google Cloud DNS logs as XSIAM network connection stories, which you can query using XQL Search from the
xdr_datasetdataset with the preset callednetwork_story. - The Vendor is automatically set to Google and Product to DNS , which is not configurable. This means that all Google Cloud DNS logs, whether it's normalized or not, can be queried in XQL Search using the
google_dns_rawdataset.
- Optional) You can Normalize DNS logs by selecting the checkbox (default). If selected, Cortex XSIAM ingests the Google Cloud DNS logs as XSIAM network connection stories, which you can query using XQL Search from the
- Flow or Audit Logs: When selecting this log type, you can decide whether to normalize and enrich the logs as part of the enhanced cloud protection.
- Test the provided settings and, if successful, proceed to Enable log collection.
-
Launch the GCP cloud shell terminal or use your preferred shell with gcloud installed.
-
Define your project ID.
gcloud config set project <PROJECT_ID> -
Create a Pub/Sub topic.
gcloud pubsub topics create <TOPIC_NAME> -
Create a subscription for this topic.
gcloud pubsub subscriptions create <SUBSCRIPTION_NAME> --topic=<TOPIC_NAME>Note the subscription name you define in this step as you will need it to set up log ingestion from Cortex XSIAM.
-
Create a logging sink.
During the logging sink creation, you can also define additional log filters to exclude specific logs. To filter logs, supply the optional parameter
--log-filter=<LOG_FILTER>gcloud logging sinks create <SINK_NAME> pubsub.googleapis.com/projects/<PROJECT_ID>/topics/<TOPIC_NAME> --log-filter=<LOG_FILTER>If setup is successful, the console displays a summary of your log sink settings:
Created [https://logging.googleapis.com/v2/projects/PROJECT_ID/sinks/SINK_NAME]. Please remember to grant `serviceAccount:LOGS_SINK_SERVICE_ACCOUNT` \ the Pub/Sub Publisher role on the topic. More information about sinks can be found at /logging/docs/export/configure_export
-
Grant log sink service account to publish to the new topic.
Note the
serviceAccountname from the previous step and use it to define the service for which you want to grant publish access.gcloud pubsub topics add-iam-policy-binding <TOPIC_NAME> --member serviceAccount:<LOGS_SINK_SERVICE_ACCOUNT> --role=roles/pubsub.publisher
-
Create a service account.
For example, use cortex-xdr-sa as the service account name and Cortex XSIAM Service Account as the display name.
gcloud iam service-accounts create <SERVICE_ACCOUNT> --description="<DESCRIPTION>" --display-name="<DISPLAY_NAME>"
-
Grant the IAM role to the service account.
gcloud pubsub subscriptions add-iam-policy-binding <SUBSCRIPTION_NAME> --member serviceAccount:<SERVICE_ACCOUNT>@<PROJECT_ID>.iam.gserviceaccount.com --role=roles/pubsub.subscriber
-
Create a JSON key for the service account.
You will need the JSON file to enable Cortex XSIAM to authenticate with the GCP service. Specify the file destination and filename using a .json extension.
gcloud iam service-accounts keys create <OUTPUT_FILE> --iam-account <SERVICE_ACCOUNT>@<PROJECT_ID>.iam.gserviceaccount.com
- After Cortex XSIAM begins receiving information from the GCP Pub/Sub service, you can use the XQL Query language to search for specific data.
Google Kubernetes Engine
Note
It's also possible to use a Custom - Filebeat based Collector to ingest logs related to file activity on your endpoints and servers without using the Cortex XDR agent. For more information, see Elasticsearch Filebeat.
You can configure collecting Google Kubernetes logs and data using a Custom - Filebeat based Collector (standard data source), content pack integration (onboarded prior to July 26, 2026), or connector (onboarded after July 26, 2026):
| Collection Method | Description |
|---|---|
| Custom - Filebeat based Collector overview (standard data source) overview | Forward container logs from Google Kubernetes Engine using Elasticsearch Filebeat to Cortex XSIAM using the Custom - Filebeat based Collector data source. |
| Link to custom collector (standard data source) instructions | Ingest logs from Google Kubernetes Engine |
| Links to content pack/integration instructions (onboarded prior to July 26, 2026) | <p>The Google Kubernetes Engine content pack builds and manages container-based applications in Google Cloud Platform (GCP), powered by the open source Kubernetes technology. It contains the Google Kubernetes Engine Operations Generic Polling playbook as well as the following integration:</p><ul><li>Google Kubernetes Engine: Use this integration to build and manage container-based applications in Google Cloud Platform (GCP), utilizing the open source Kubernetes technology. This integration is used by the Google Kubernetes Engine Operations Generic Polling playbook, which checks operation status and facilitates the waiting between steps in cluster configuration.</li></ul> |
| Link to connector (onboarded after July 26, 2026) | Google Cloud |
Ingest logs from Google Kubernetes Engine
Instead of forwarding Google Kubernetes Engine (GKE) logs directly to Google StackDrive, Cortex XSIAM can ingest container logs from GKE using Elasticsearch Filebeat. To receive logs, you must install Filebeat on your containers and enable Data Collection settings for Filebeat.
When Cortex XSIAM begins receiving logs, the app automatically creates an Cortex Query Language (XQL) dataset using the vendor and product name that you specify during Filebeat setup. It is recommended to specify a descriptive name. For example, if you specify google as the vendor and kubernetes as the product, the dataset name will be google_kubernetes_raw. If you leave the product and vendor blank, Cortex XSIAM assigns the dataset a name of container_container_raw.
After Cortex XSIAM creates the dataset, you can search your GKE logs using XQL Search.
- Install Filebeat on your containers. For more information, see https://www.elastic.co/guide/en/beats/filebeat/current/running-on-kubernetes.html.
-
Ingest logs from Elasticsearch Filebeat.
Record your token key and API URL for the Filebeat Collector instance as you will need these later in this workflow.
-
Deploy a Filebeat as a DaemonSet on Kubernetes.
This ensures there is a running instance of Filebeat on each node of the cluster.
a. Download the manifest file to a location where you can edit it.
curl -L -O https://raw.githubusercontent.com/elastic/beats/7.10/deploy/kubernetes/filebeat-kubernetes.yaml
b. Open the YAML file in your preferred text editor.
c. Remove the
cloud.idandcloud.authlines.\
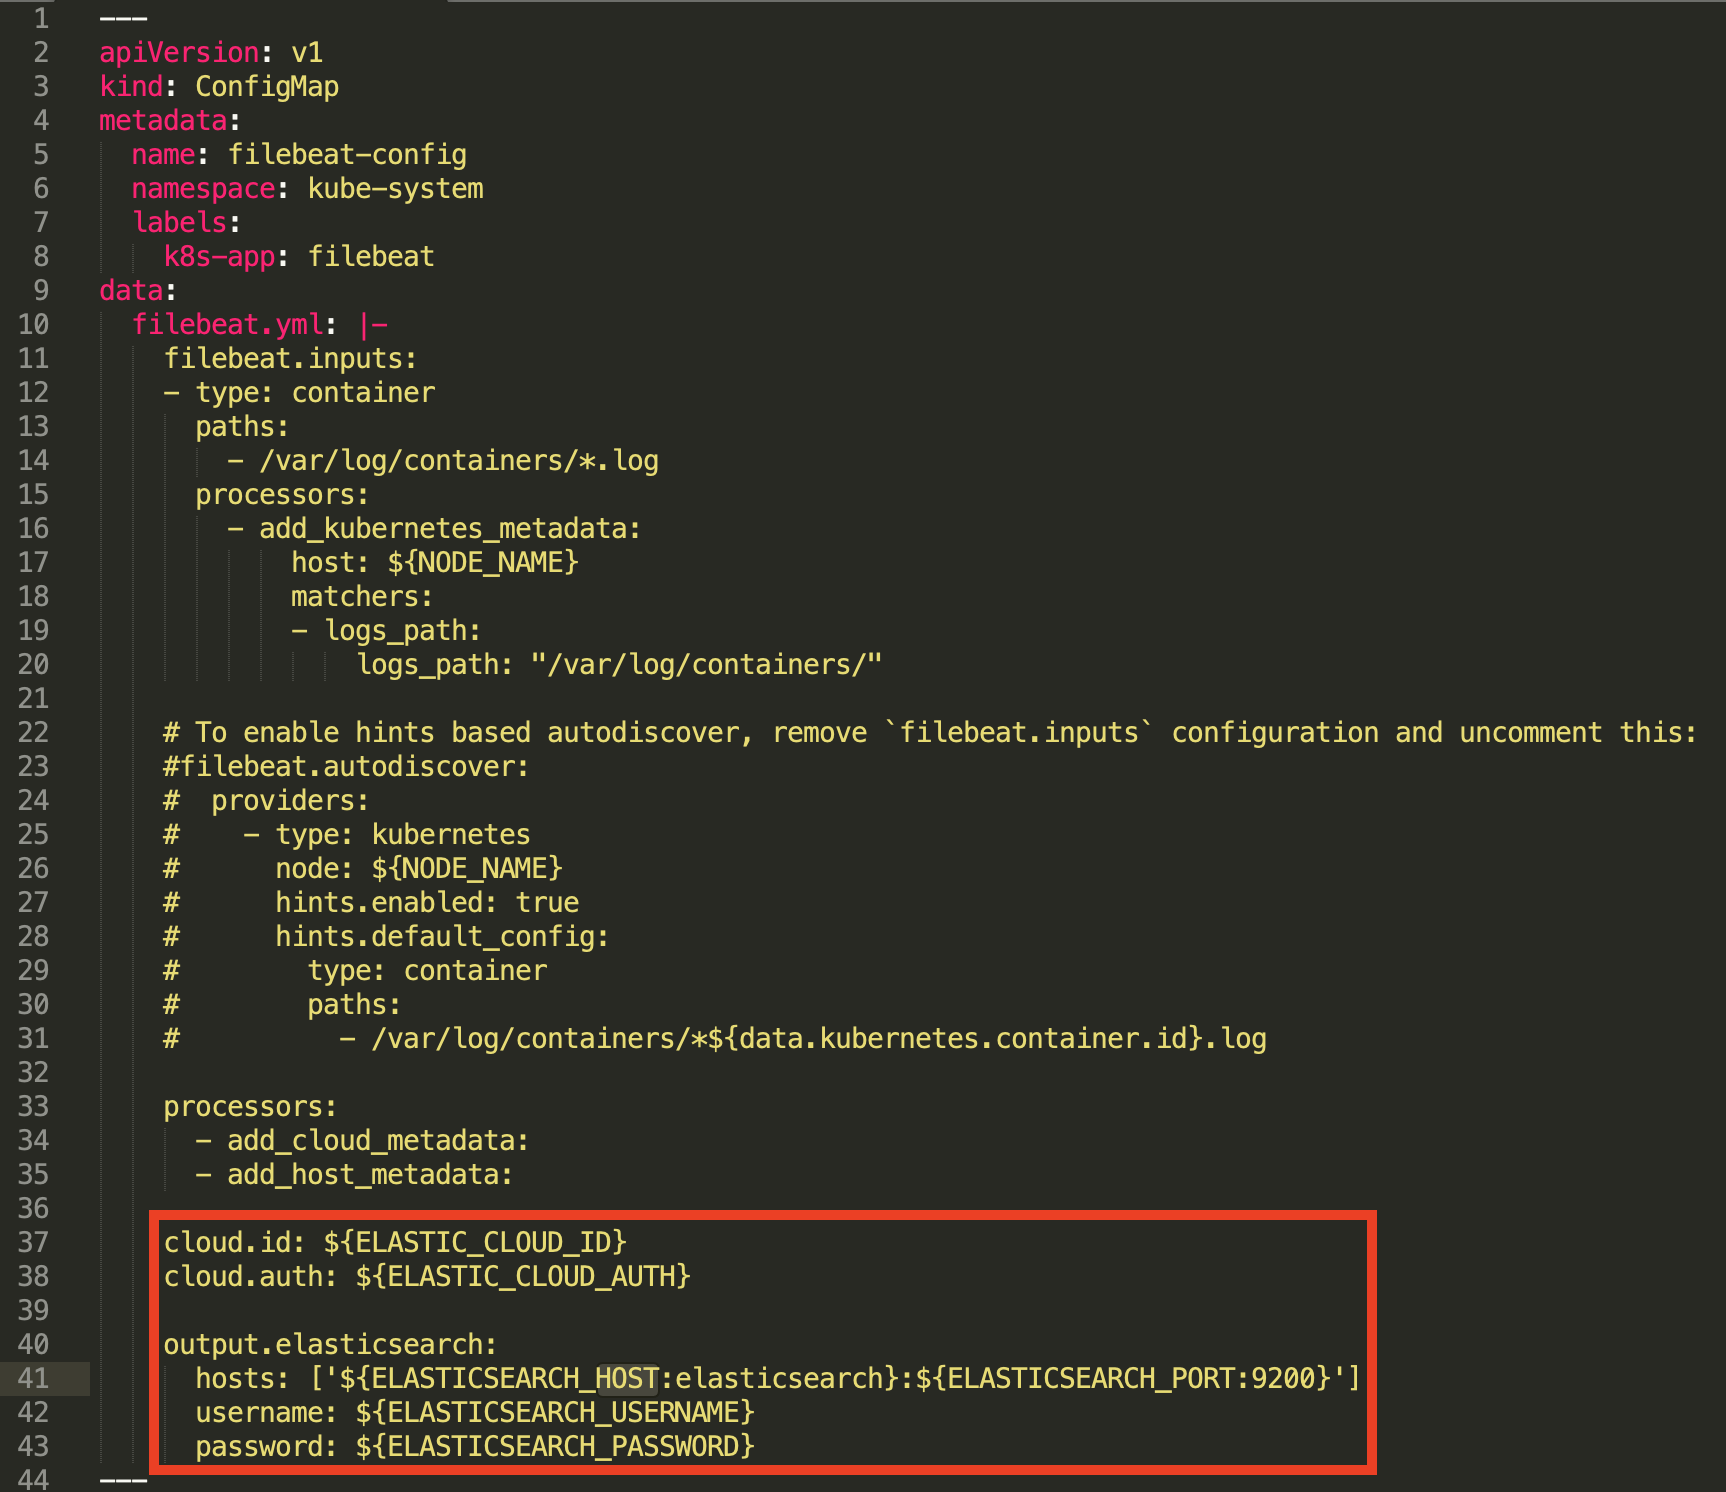
d. For the
output.elasticsearchconfiguration, replace thehosts,username, andpasswordwith environment variable references forhostsandapi_key, and add a field and value forcompression_levelandbulk_max_size.\

e. In the
DaemonSetconfiguration, locate theenvconfiguration and replaceELASTIC_CLOUD_AUTH,ELASTIC_CLOUD_ID,ELASTICSEARCH_USERNAME,ELASTICSEARCH_PASSWORD,ELASTICSEARCH_HOST,ELASTICSEARCH_PORTand their relative values with the following.ELASTICSEARCH_ENDPOINT: Specify the API URL for your Cortex XSIAM tenant. You can copy the URL from the Filebeat Collector instance you set up for GKE in the Cortex XSIAM management console (Settings → (ConfigurationsData CollectionCustom CollectorsCopy API URLhttps://api-tenant external URL:443/logs/v1/filebeat)ELASTICSEARCH_API_KEY: Specify the token key you recorded earlier during the configuration of your Filebeat Collector instance.
After you configure these settings your configuration should look like the following image.
f. Save your changes.
- If you use RedHat OpenShift, you must also specify additional settings. See https://www.elastic.co/guide/en/beats/filebeat/7.10/running-on-kubernetes.html.
- Deploy Filebeat on your Kubernetes.
kubectl create -f filebeat-kubernetes.yaml
This deploys Filebeat in the kube-system namespace. If you want to deploy the Filebeat configuration in other namespaces, change the namespace values in the YAML file (in any YAML inside this file) and add -n <your_namespace>.\
\
After you deploy your configuration, the Filebeat DameonSet runs throughout your containers to forward logs to Cortex XSIAM. You can review the configuration from the Kubernetes Engine console: Workloads → Filebeat → YAML.
Note
Cortex XSIAM supports logs in single line format or multiline format. For more information on handling messages that span multiple lines of text in Elasticsearch Filebeat, see Manage Multiline Messages.
- After Cortex XSIAM begins receiving logs from GKE, you can use the XQL Search to search for logs in the new dataset.
Google SecOps
Important
This connector is only available for tenants that onboarded after July 26, 2026. For tenants that onboarded before this date, use Marketplace to access the standalone integration. For more information, see Marketplace.
This connector is available with any active Cortex XSIAM or Cortex AgentiX license.
Verodin simulations and topology.
This connector includes the following sub-capabilities (Marketplace integrations link to PAN DEV for more information):
- Verodin: Verodin simulations and topology.
To configure this connector, follow the steps outlined in the configuration wizard.
Google Services
Important
This connector is only available for tenants that onboarded after July 26, 2026. For tenants that onboarded before this date, use Marketplace to access the standalone integration. For more information, see Marketplace.
Google Services groups multiple Google integrations: Apigee (Google Cloud's API management platform) for collecting Apigee Edge audit logs, Google IP Ranges Feed for GCP and Google global IP ranges, Google Safe Browsing v2 for checking URLs against Google's lists of unsafe web resources, and Google Maps for the Geocoding API.
This connector includes the following sub-capabilities (Marketplace integrations link to PAN DEV for more information):
- Google Apigee: This sub-capability is available with any active Cortex XSIAM license.
- Google IP Ranges Feed: This sub-capability is available with any active Cortex XSIAM or Cortex AgentiX license.
- Google Safe Browsing v2: Search Safe Browsing, The Safe Browsing APIs (v4) let your client applications check URLs against Google's constantly updated lists of unsafe web resources. This sub-capability is available with any active Cortex XSIAM or Cortex AgentiX license.
- GoogleMaps: Use the Google Maps API. This sub-capability is available with any active Cortex XSIAM or Cortex AgentiX license.
To configure this connector, follow the steps outlined in the configuration wizard.
Google Workspace
You can configure collecting Google Workspace logs and data using a Standard Collector, content pack integration (onboarded prior to July 26, 2026), or connectors:
| Collection Method | Description |
|---|---|
| Standard Collector overview | Forward logs and data to Cortex XSIAM from Google Workspace using the Google Workspace data source. |
| Link to Standard Collector instructions | <p>The following types of data can be ingested from Google Workspace:</p><ul><li>Google Chrome</li><li>Admin Console</li><li>Google Chat</li><li>Enterprise Groups</li><li>Login</li><li>Rules</li><li>Google drive</li><li>Token</li><li>User Accounts</li><li>SAML</li><li>Alerts</li><li>Emails</li></ul><p>For more information, see Ingest logs and data from Google Workspace.</p> |
| Links to content pack/ integration details (onboarded prior to July 26, 2026) | <p>The G Suite Admin content pack integrates with Cortex XSIAM to handle various administrative tasks for G Suite or Google Workspace Admin environments. It contains the following integration:</p><ul><li>Google Workspace Admin: Use this integration to perform actions on IT infrastructure, create users, update settings, and manage other administrative duties. It includes commands for user management, device management (Chrome browser devices), policy management, and data transfer.</li></ul> |
| Link to connectors | <ul><li>Google Workspace connector</li><li>Google Workspace Automation and Collection (onboarded after July 26, 2026)</li></ul> |
Ingest logs and data from Google Workspace
Cortex XSIAM can ingest various types of data from Google Workspace. Most data is collected as audit events from various Google reports using the Google Workspace data collector.
To receive logs from Google Workspace for any of the data types except emails, you must first enable the Google Workspace Admin SDK API with a user with access to the Admin SDK Reports API. For emails, you must set up a compliance email account as explained in the prerequisite steps below and then enable the Google Workspace Gmail API.
Once implemented, you can then configure the Data Sources & Integrations settings in Cortex XSIAM. After you set up data collection, Cortex XSIAM begins receiving new logs and data from the source.
Ingestible data types
Cortex XSIAM can ingest the following data types:
- Google Chrome: Chrome browser and Chrome OS events from activity reports.
- Admin Console: Administrator activity events from audit logs.
- Google Chat: Activity events from Chat reports.
- Enterprise Groups: Group activity events from Enterprise Groups reports.
- Login: Information regarding login activity events.
- Rules: Activity events included in Rules activity reports.
- Google drive: Activity events from Google Drive application reports.
- Token: Token activity events from Token application reports.
- User Accounts: Activity events related to user accounts.
- SAML: Activity events included in SAML activity reports.
- Alerts: Alerts retrieved via the Alert Center API.
- Emails: Message details, excluding headers and body content (
payload.body,payload.parts, andsnippet), via a compliance mailbox to ingest email data (not email reports).
Required Google APIs
The following Google APIs must be enabled in your Google Cloud project:
- For all data types except emails: Admin SDK API.
- For all data types except alerts and emails: Admin Reports API (part of Admin SDK API). ### Note For all types of data collected via the Admin Reports API, except alerts and emails, the log events are collected with a preset lag time as reported by Google Workspace. For more information on these lag times for the different types of data, see Google Workspace Data retention and lag times.
- Alerts: Alert Center API (part of Admin SDK API).
- Emails: Gmail API.
Prerequisite Steps
- For all data types except emails: Complete the Google Workspace Reports API Prerequisites to set up the Google Workspace Admin SDK environment. This entails completing the instructions for Set up the basics and Set up a Google API Console project without activating the Reports API service as this will be explained in greater detail in the task below. For more information on these Google Workspace prerequisite steps, see Reports API Prerequisites.
- For Alerts only: If you are not configuring other data types, you must still set up a Cloud Platform project and enable the Alert Center API.
-
For Google Emails:
- Set up a compliance email account (compliance mailbox) to receive email data.
-
Set up a BCC for all incoming and outgoing emails of any user to this compliance account.
a. Login to the Admin direct routing URL in Google Workspace for the user account that you want to configure.
b. Double-click Routing, and set the following parameters in the Add setting dialog. \
- Routing: Configure the compliance email account that you want to receive a BCC for emails from this user account using the format
BCC TO <compliance email>. For example,BCC TO admin@organization.com. - Select Inbound and Outbound to ensure all incoming and outgoing emails are sent.
- (Optional) To configure another email address to receive a BCC for emails from this account, select Add more recipients in the Also deliver to section, and then click Add.
- Click Show options, and from the list displayed select Account types to affect → Users.
- Save your changes.\
This configuration ensures to forward every message sent to a user account to a defined compliance mailbox. After the Google Workspace data collector ingests the emails, they are deleted from the compliance mailbox to prevent email from building up over time (nothing touches the actual users’ mailboxes). \
- Routing: Configure the compliance email account that you want to receive a BCC for emails from this user account using the format
Note
- Spam emails from the compliance email account, and from all other monitored email accounts, are not collected.
- Any draft emails written in the compliance email account are collected by the Google Workspace data collector, and are then deleted even if the email was never sent.
- Create a custom role with at least these permissions: To follow the principle of least privilege, you must create a custom role in the Google Admin Console to ensure the user being impersonated has at least the following permissions:
- In the Google Admin Console, select Account → Admin roles.
- Click Create new role.
- Assign at least the following permissions:
- Reports: View Reports.
- Services: Alerts (Full Access).
- Assign this custom role to the user account you intend to use for impersonation. Record this user's email address.
Set up the Google Workspace integration
Task 1. Perform Google Workspace Domain-Wide Delegation of Authority
When collecting any type of data from Google Workspace, except Google emails, you must authorize your service account to access user data on your Google Workspace domain without requiring each user to manually give consent.
Note
For more information on the entire process, see Perform Google Workspace Domain-Wide Delegation of Authority.
-
In your Google Cloud Platform (GCP) project, enable the Admin SDK API to create a service account and set credentials for this service account.
As you complete this step, you need to gather information related to your service account, including the Client ID, Private key file, and Email address, which you will need to use later on in this task.
a. Select the menu icon → APIs & Services → Library.
b. Search for the
Admin SDK API, and select the API from the results list.c. Enable the Admin SDK API.
d. Select APIs & Services → Credentials.
e. Select + CREATE CREDENTIALS → Service account.
f. Set the following Service account details in the applicable fields:
- Specify a service account name. This name is automatically used to populate the following field as the service account ID, where the name is changed to lowercase letters and all spaces are changed to hyphens.
- Specify the service account ID, where you can either leave the default service account ID or add a new one. This service account ID is used to set the service account email using the following format:
<id>@<project name>.iam.gserviceaccount.com. - (Optional) Specify a service account description.
g. CREATE AND CONTINUE.
h. (Optional) Decide whether you want to Grant this service account access to project or Grant users access to this service account.
i. Click Done.
j. Select your newly created Service Account from the list.
k. Create a service account private key and download the private key file as a JSON file.
\
In the Keys tab, select ADD KEY → Create new key, leave the default Key type set to JSON, and CREATE the private key. Once you’ve downloaded the new private key pair to your machine, ensure that you store it in a secure location, because it’s the only copy of this key. You will need to browse to this JSON file when configuring the Google Workplace data collector in Cortex XSIAM.Note
You don't need to add permissions to the GCP Project-org service account.
-
When collecting alerts, enable the Alert Center API to create a service account and set credentials for this service account.
Note
When collecting Google Workspace alerts with other types of data, except emails, you need to configure a service account in Google with the applicable permissions to collect events from the Google Reports API and alerts from the Alert Center API. If you prefer to use different service accounts to collect events and alerts separately, you'll need to create two service accounts with different instances of the Google Workspace data collector. One instance to collect events with a certain service account, and another instance to collect alerts using another service account. The instructions below explain how to set up one Google Workspace instance to collect both event and alerts.
a. Select the menu icon → APIs & Services → Library.
b. Search for the
Alert Center API, and select the API from the results list.c. Enable the Alert Center API.
d. Select APIs & Services → Credentials.
e. Select the same service account in the Service Accounts section that you created for the Admin SDK API above.
-
Delegate domain-wide authority to your service account with the Admin Reports API and Alert Center API scopes.
a. Open the Google Admin Console.
b. Select Security → Access and data control → API controls.
c. Scroll down to the Domain wide delegation section, and select MANAGE DOMAIN WIDE DELEGATION.
d. Click Add new.
e. Set the following settings to define permissions for the Admin SDK API:
- Client ID: Specify the service account’s Unique ID, which you can obtain from the Service accounts page by clicking the email of the service account to view further details. When creating a single Google Workspace data collector instance to collect both events and alert data, provide the same service account ID as the Admin SDK API.
- In the OAuth scopes (comma-delimited) field, paste in the first of the two Admin Reports API scopes:
https://www.googleapis.com/auth/admin.reports.audit.readonly - In the following OAuth scopes (comma-delimited) field, paste in the second Admin Reports API scope:
https://www.googleapis.com/auth/admin.reports.usage.readonly
Note
For more information on the Admin Reports API scopes, see OAuth 2.0 Scopes for Google APIs.
- When collecting alerts, add the following Alert Center API scope:
https://www.googleapis.com/auth/apps.alerts
f. Authorize the domain-wide authority to your service account.\
\
This ensures that your service account now has domain-wide access to the Google Admin SDK Reports API and Google Workspace Alert Center API, if configured, for all of the users of your domain.
Task 2. Enable the Gmail API to collect Google emails
When you are configuring the Google Workspace data collector to collect Google emails, the instruction differ depending on whether you are configuring the collection along with other types of data with the Admin SDK API already set up or you are configuring the collection to only include emails using only the Gmail API. The steps below explain both scenarios.
- Select the menu icon → APIs & Services → Library.
- Search for the
Gmail API, and select the API from the results list. - Enable the Gmail API.
- Select APIs & Services → Credentials.\
\
The instructions for setting up credentials differ depending on whether you are setting up the Gmail API together with the Admin SDK API as you are collecting other data types, or you are configuring collection for emails only with the Gmail API.- When you’ve already set up the Admin SDK API, verify that the same Service Account that you configured for the Admin SDK API is listed, and continue on to the next step.
- When you’re only collecting Google emails without the Admin SDK API, complete these steps.
- Select + CREATE CREDENTIALS → Service account.
- Set the following Service account details in the applicable fields. -Specify a service account name. This name is automatically used to populate the following field as the service account ID, where the name is changed to lowercase letters and all spaces are changed to hyphens. -Specify the service account ID, where you can either leave the default service account ID or add a new one. This service account ID is used to set the service account email using the following format:
<id>@<project name>.iam.gserviceaccount.com. -(Optional) Specify a service account description. - CREATE AND CONTINUE.
- (Optional) Decide whether you want to Grant this service account access to project or Grant users access to this service account.
- Click Done.
- Select your newly created Service Account from the list.
- Create a service account private key and download the private key file as a JSON file. In the Keys tab, select ADD KEY → Create new key, leave the default Key type set to JSON, and CREATE the private key. Once you’ve downloaded the new private key pair to your machine, ensure that you store it in a secure location as it’s the only copy of this key. You will need to browse to this JSON file when configuring the Google Workplace data collector in Cortex XSIAM .
- Delegate domain-wide authority to your service account with the Gmail API scopes.
- Open the Google Admin Console.
- Select Security → Access and data control → API controls.
- Scroll down to the Domain wide delegation section, and select MANAGE DOMAIN WIDE DELEGATION.\
This step explains how the following Gmail API scopes are added:https://mail.google.com/https://www.googleapis.com/auth/gmail.addons.current.action.composehttps://www.googleapis.com/auth/gmail.addons.current.message.actionhttps://www.googleapis.com/auth/gmail.addons.current.message.metadatahttps://www.googleapis.com/auth/gmail.addons.current.message.readonlyhttps://www.googleapis.com/auth/gmail.composehttps://www.googleapis.com/auth/gmail.inserthttps://www.googleapis.com/auth/gmail.labelshttps://www.googleapis.com/auth/gmail.metadatahttps://www.googleapis.com/auth/gmail.modifyhttps://www.googleapis.com/auth/gmail.readonlyhttps://www.googleapis.com/auth/gmail.sendhttps://www.googleapis.com/auth/gmail.settings.basichttps://www.googleapis.com/auth/gmail.settings.sharing
Note
For more information on the Gmail API scopes, see OAuth 2.0 Scopes for Google APIs.
The instructions differ depending on whether you are setting up the Gmail API together with the Admin SDK API as you are collecting other data types, or you are configuring collection for emails only with the Gmail API.
- When you’ve already set up the Admin SDK API, Edit the same Service Account that you configured for the Admin SDK API, and add the Gmail API scopes listed above.
-
When you’re only collecting Google emails without the Admin SDK API, click Add New, and set the following settings to define permissions for the Admin SDK API.
Client ID—Specify the service account’s Unique ID, which you can obtain from the Service accounts page by clicking the email of the service account to view further details.\
\
In the OAuth scopes (comma-delimited) field, paste in the first of the Gmail API scopes listed above, and continue adding in the rest of the scopes.\
\
Authorize the domain-wide authority to your service account. This ensures that your service account now has domain-wide access to the Google Gmail API for all of the users of your domain.
Task 3. Prepare your service account to impersonate a user with access to the Admin SDK Reports API
You can prepare your service account to impersonate a user with access to the Admin SDK Reports API when collecting any type of data from Google Workspace except Google emails.
Only users with access to the Admin APIs can access the Admin SDK Reports API. Therefore, your service account needs to be set up to impersonate one of these users to access the Admin SDK Reports API. This means that when collecting any type of data from Google Workspace except Google emails, you need to designate a user whose Roles permissions are set to access reports, where Security → Reports is selected. This user’s email will be required when configuring the Google Workspace data collector in Cortex XSIAM.
- In the Google Admin Console, select Directory → Users.
- From the list of users listed, select the user configured with the necessary permissions in Admin roles and privileges to view reports that you want to set up your service account to impersonate. This is the user you created the custom role for in the Create a custom role with at least these permissions of the prerequisite steps above.
- Record the email of this user as you will need it in Cortex XSIAM .
Task 4. Integrate with Cortex XSIAM
- In Cortex XSIAM, select Settings → Data Sources & Integrations.
- On the Data Sources & Integrations page, click + Add New, search for Google Workspace, then hover over it and click Add.
-
Integrate the applicable Google Workspace service with Cortex XSIAM.
a. Specify a descriptive Name for your log collection integration.
b. Browse to the JSON file containing your service account key Credentials for the Google Workspace Admin SDK API that you enabled. If you’re only collecting Google emails, ensure that you Browse to the JSON file containing your service account private key Credentials for the Gmail API that you enabled.\
c. Select the types of data that you want to Collect from Google Workspace.- Google Chrome: Chrome browser and Chrome OS events included in the Chrome activity reports.
- Admin Console: Account information about different types of administrator activity events included in the Admin console application's activity reports.
- Google Chat: Chat activity events included in the Chat activity reports.
- Enterprise Groups: Enterprise group activity events included in the Enterprise Groups activity reports.
- Login: Account information about different types of login activity events included in the Login application's activity reports.
- Rules: Rules activity events included in the Rules activity report.
- Google drive: Google Drive activity events included in the Google Drive application's activity reports.
- Token: Token activity events included in the Token application's activity reports.
- User Accounts: Account information about different types of User Accounts activity events included in the User Accounts application's activity reports.
- SAML: SAML activity events included in the SAML activity report.
- Alerts: Alerts from the [Alert Center API beta version](http:// https://developers.google.com/admin-sdk/alertcenter/guides), which is still subject to change.
- Emails: Collects email data (not emails reports). All message details except email headers and email content (
payload.body,payload.parts, andsnippet).
Note
For more information about the events collected from the various Google Reports, see Google Workspace Reports API Documentation.
For all options selected, except Emails, you must specify the Service Account Email. This is the email account of the user with access to the Admin SDK Reports API that you prepared your service account to impersonate.
When selecting Emails, configure the following.
- Audit Email Account: Specify the email address for the compliance mailbox that you set up.
d. Test the connection settings.
To test the connection, you must select one or more log types. Cortex XSIAM then tests the connection settings for the selected log types.
e. If successful, Enable Google Workspace log collection.
Data visualization and analysis
When Cortex XSIAM begins receiving logs, the app creates a new dataset for the different types of data that you are collecting, which you can use to initiate XQL Search queries. For example queries, refer to the in-app XQL Library.
For all logs, Cortex XSIAM can generate Cortex XSIAM issues for Correlation Rules only, when relevant from Google Workspace logs.
For the different types of data you can collect using the Google Workspace data collector, the following table lists the different datasets, vendors, and products automatically configured, and whether the data is normalized.
| Data type | Dataset | Vendor | Product | Normalized data |
|---|---|---|---|---|
| Google Chrome | google_workspace_chrome_raw |
Workspace Chrome | — | |
| Admin console | google_workspace_admin_console_raw |
Workspace Admin Console | When relevant, Cortex XSIAM normalizes Admin Console audit logs into authentication stories. All SaaS audit logs are collected in a dataset called saas_audit_logs and specific relevant events are collected in the authentication_story preset for the xdr_data dataset. |
|
| Google Chat | google_workspace_chat_raw |
Workspace Chat | — | |
| Enterprise groups | google_workspace_enterprise_groups_raw |
Workspace Enterprise Groups | When relevant, Cortex XSIAM normalizes Enterprise Group audit logs into authentication stories. All SaaS audit logs are collected in a dataset called saas_audit_logs and specific relevant events are collected in the authentication_story preset for the xdr_data dataset. |
|
| Login | google_workspace_login_raw |
Workspace Login | When relevant, Cortex XSIAM normalizes Login audit logs into authentication stories. All SaaS audit logs are collected in a dataset called saas_audit_logs and specific relevant events are collected in the authentication_story preset for the xdr_data dataset. |
|
| Rules | google_workspace_rules_raw |
Workspace Rules | When relevant, Cortex XSIAM normalizes Rules audit logs into authentication stories. All SaaS audit logs are collected in a dataset called saas_audit_logs and specific relevant events are collected in the authentication_story preset for the xdr_data dataset. |
|
| Google Drive | google_workspace_drive_raw |
Workspace Drive | When relevant, Cortex XSIAM normalizes Google drive audit logs into authentication stories. All SaaS audit logs are collected in a dataset called saas_audit_logs and specific relevant events are collected in the authentication_story preset for the xdr_data dataset. |
|
| Token | google_workspace_token_raw |
Workspace Token | When relevant, Cortex XSIAM normalizes Token audit logs into authentication stories. All SaaS audit logs are collected in a dataset called saas_audit_logs and specific relevant events are collected in the authentication_story preset for the xdr_data dataset. |
|
| User accounts | google_workspace_user_accounts_raw |
Workspace User Accounts | — | |
| SAML | google_workspace_saml_raw |
Workspace SAML | When relevant, Cortex XSIAM normalizes SAML audit logs into authentication stories. All SaaS audit logs are collected in a dataset called saas_audit_logs and specific relevant events are collected in the authentication_story preset for the xdr_data dataset. |
|
| Alerts | google_workspace_alerts_raw |
Workspace Alerts | — | |
| Emails | google_gmail_raw |
Gmail | — |
Google Workspace connector
Secure sensitive data, monitor identity risks, and ensure compliance across your Google Workspace environment.
This connector includes the following capabilities and sub-capabilities (if applicable):
- Automation and Remediation: Run automation and remediation actions against Google Drive. This capability is available with any active Cortex AgentiX or Cortex XSIAM license.
- Data Security: Scan and protect Google Workspace data across Drive, Gmail, and shared resources. This capability is available with any active Cortex XSIAM, Cortex Cloud Posture Security, Cortex Cloud Runtime Security, or Cortex Data Security license.
- Identity Posture: Maintain visibility and control over Google Workspace identities, including users, groups, roles, and privileges. This capability is available with any active Cortex XSIAM, Cortex Cloud Posture Security, Cortex Cloud Runtime Security, or Cortex Data Security license.
- Groups: Ingest user groups from Google Workspace. This sub-capability is available with any active Cortex XSIAM, Cortex Cloud Posture Security, Cortex Cloud Runtime Security, or Cortex Data Security license.
- Privileges: Ingest privileges from Google Workspace. This sub-capability is available with any active Cortex XSIAM, Cortex Cloud Posture Security, Cortex Cloud Runtime Security, or Cortex Data Security license.
- Roles: Ingest roles from Google Workspace. This sub-capability is available with any active Cortex XSIAM, Cortex Cloud Posture Security, Cortex Cloud Runtime Security, or Cortex Data Security license.
- Users: Ingest users from Google Workspace. This sub-capability is available with any active Cortex XSIAM, Cortex Cloud Posture Security, Cortex Cloud Runtime Security, or Cortex Data Security license.
To configure this connector, follow these steps:
Prerequisites
Create a service account and generate a JSON key in the Google Cloud Console. Cortex Cloud uses this service account to authenticate and access Google Workspace resources.
1. Enable the Google Drive API
- Sign in to the Google Cloud Console with an account that has the following administrative privileges: Users → user → Admin Roles and privileges → Role=Super Admin.
- From the project selector, select an existing project or create a new project.
- Go to APIs & Services > Library.
- Search for Google Drive API.
- Select Google Drive API, and click Enable.
2. Create a Service Account and Generate a JSON Key
- Log in to
https://console.cloud.google.com/using the super admin user credentials. - Go to APIs & Services > Credentials.
- Click Create Credentials, and select Service Account.
-
Enter a descriptive name for the service account.
Note: The Service account ID is generated automatically based on the service account name.
- Click Create and Continue, and then click Done.
- Locate the newly created service account and open its details.
- Select the Keys tab.
- Select Add Key > Create new key.
- Select JSON, and click Create.
- Copy the Client Id and download the generated JSON key file and securely store it on your local machine.
- Navigate to APIs & Services -> Enabled APIs & services.
- Click + Enable APIs and services.
- Search for Admin SDK API and enable it.
3. Configure Domain wide Delegation permissions
- Navigate to
https://admin.google.com/. - Navigate to Security -> Access and data control -> API controls.
- Click on MANAGE DOMAIN WIDE DELEGATION.
- Click on Add new.
- Provide the new Service Account UniqueId created above, add all the below scopes, and click AUTHORIZE:
-
Scopes required by Identity and Data Security:
https://www.googleapis.com/auth/admin.directory.customer.readonlyhttps://www.googleapis.com/auth/admin.directory.user.readonlyhttps://www.googleapis.com/auth/admin.directory.group.readonlyhttps://www.googleapis.com/auth/admin.directory.group.member.readonlyhttps://www.googleapis.com/auth/admin.directory.rolemanagement.readonlyhttps://www.googleapis.com/auth/drivehttps://www.googleapis.com/auth/admin.directory.user.readonly -
Scopes required by Logs Ingestion:
https://www.googleapis.com/auth/admin.reports.audit.readonlyhttps://www.googleapis.com/auth/admin.reports.usage.readonly
-
4. Configure the Google Workspace logs and data Ingestion
Before configuring Google Workspace, enable the Google Workspace logs ingestion to collect the Management Activity logs required for workspace scanning.
For detailed configuration steps, see Configure the Google workspace logs ingestion.
How to configure the Google Workspace connector
Task 1. Select services
- In Cortex Cloud, navigate to Settings → Data Sources & Integrations.
- Click + Add new.
- On the Add Data Source page, search for Google Workspace, hover over it, and click Add.
Capabilities tab
- Enter a unique name for the new connector instance.
- Select Data Security and Identity Posture.
- Click Next.
Connection tab
- On the Connection tab, locate the Google Workspace Admin Email field.
- Enter your Google Workspace administrator email address.
- Click Apply.
- Upload the JSON credentials file that you generated earlier.
- Click Test to validate the connection.
- If the connection is successful, the status displays a green Verified indicator.
- Click Next.
Summary tab
- On the Summary tab, verify that all selected capabilities display a Connected status.
- If validation succeeds, the wizard displays a Verification Success message.
- Click Create Instance to create the Google Workspace connector.
Task 2. (Optional) Post verification
After the configuration is complete, verify asset discovery and data security findings.
1. Verify Discovered Assets
- Go to Inventory > All Assets.
- Filter the asset list by setting Provider to Google Workspace.
- Verify that Cortex discovers the following supported asset types:
- Google Personal Drive: Individual user drives that contain personal files, documents, and private folder structures.
- Google Shared Drive: Organization-owned shared drives used to store collaborative documents and project content.
2. Verify Security and Policy Findings
- Select an asset to open its details panel.
- Click the Overview tab to review general metadata, file counts, and finding details.
- Go to Findings to review detected security findings, including:
- Sensitive Data Exposure: PII, credit card numbers (PCI), Social Security numbers (SSNs), or proprietary source code detected in Google Docs, Sheets, Slides, or PDF attachments.
- External and Public Sharing Risks: Files shared publicly through links, such as Anyone with the link, or files shared with external third-party email domains.
- Orphaned or Unowned File Risks: Files owned by deleted or suspended user accounts.
Google Workspace Automation and Collection
Important
This connector is only available for tenants that onboarded after July 26, 2026. For tenants that onboarded before this date, use Marketplace to access the standalone integration. For more information, see Marketplace.
Automate and collect across Google Workspace: manage users, groups, roles, and devices in the Admin console; fetch security alerts and audit logs; send and process Gmail messages; work with Calendar, Docs, and Sheets; and support archiving and eDiscovery with Google Vault.
This connector includes the following sub-capabilities (Marketplace integrations link to PAN DEV for more information):
- G Suite Security Alert Center: This sub-capability is available with any active Cortex XSIAM or Cortex AgentiX license.
- Gmail: This sub-capability is available with any active Cortex XSIAM, Cortex Cloud Posture Security, Cortex Cloud Runtime Security, Cortex XDR, or Cortex AgentiX license.
- Gmail Single User: This sub-capability is available with any active Cortex XSIAM, Cortex Cloud Posture Security, Cortex Cloud Runtime Security, Cortex XDR, or Cortex AgentiX license.
- GoogleCalendar: This sub-capability is available with any active Cortex XSIAM or Cortex AgentiX license.
- GoogleDocs: This sub-capability is available with any active Cortex XSIAM or Cortex AgentiX license.
- GoogleDrive: This sub-capability is available with any active Cortex XSIAM or Cortex AgentiX license.
- GoogleSheets: This sub-capability is available with any active Cortex XSIAM, Cortex Cloud Posture Security, or Cortex AgentiX license.
- google-vault: This sub-capability is available with any active Cortex XSIAM or Cortex AgentiX license.
- GSuiteAdmin: This sub-capability is available with any active Cortex XSIAM, Cortex Cloud, Cortex Cloud Runtime Security, Cortex XDR, or Cortex AgentiX license.
- GSuiteAuditor: This sub-capability is available with any active Cortex XSIAM or Cortex AgentiX license.
To configure this connector, follow the steps outlined in the configuration wizard.
GraphQL
Here are the articles in this section:
GraphQL
Important
This connector is only available for tenants that onboarded after July 26, 2026. For tenants that onboarded before this date, use Marketplace to access the standalone integration. For more information, see Marketplace.
This connector is available with any active Cortex XSIAM or Cortex AgentiX license.
Generic GraphQL client to interact with any GraphQL server API.
This connector includes the following sub-capabilities (Marketplace integrations link to PAN DEV for more information):
- GraphQL: The Generic GraphQL client can interact with any GraphQL server API.
To configure this connector, follow the steps outlined in the configuration wizard.
Grouped Example Connector
Grouped Example Connector
Important
This connector is only available for tenants that onboarded after July 26, 2026. For tenants that onboarded before this date, use Marketplace to access the standalone integration. For more information, see Marketplace.
POC of Grouped Connectors / view_groups. Four mocked Microsoft-themed XSIAM sub-capabilities (EWS O365, EWS v2, Office 365 Feed, Microsoft Teams) wired to exercise: settings.grouped, split connection/configurations view_groups registries, per-handler auth_options view_group pinning, one profile shared across multiple capabilities, multiple profiles bound to one sub-capability, two integrations under the same capability with duplicated field names per view_group, integration-shared params across two sub-capabilities, per-integration engine/proxy/trust-any-cert in connection general_configurations, and per-integration integrationLogLevel with serializer rewrites. Appendix G + I carve-outs honored for Microsoft Teams. Every vendor / pack / capability mapping here is mocked.
This connector includes the following sub-capabilities (Marketplace integrations link to PAN DEV for more information):
- EWS O365: The new EWS O365 integration uses OAuth 2.0 protocol and can be used with Exchange Online and Office 365 (mail).
- EWS v2: Exchange Web Services and Office 365 (mail).
- Fetch Issues:
- Microsoft Teams: Send messages and notifications to your team members.
- Office 365 Feed:
- Threat Intelligence and Enrichment:
To configure this connector, follow the steps outlined in the configuration wizard.
GRR
Here are the articles in this section:
GRR
Important
This connector is only available for tenants that onboarded after July 26, 2026. For tenants that onboarded before this date, use Marketplace to access the standalone integration. For more information, see Marketplace.
This connector is available with any active Cortex XSIAM or Cortex AgentiX license.
Use the GRR integration to manage and communicate with the clients connected to your GRR server. This integration was integrated and tested with GRR Rapid Response v3.2.3.2.
This connector includes the following sub-capabilities (Marketplace integrations link to PAN DEV for more information):
- GRR: Use GRR Rapid Response framework.
To configure this connector, follow the steps outlined in the configuration wizard.
Grafana
Here are the articles in this section:
Grafana
Important
This connector is only available for tenants that onboarded after July 26, 2026. For tenants that onboarded before this date, use Marketplace to access the standalone integration. For more information, see Marketplace.
This connector is available with any active Cortex XSIAM or Cortex AgentiX license.
Grafana alerting service. Manage alerts and monitoring data from Grafana Labs: fetch alerts, get/pause/unpause alerts, manage users, teams, and organizations, list dashboards, and create annotations.
This connector includes the following sub-capabilities (Marketplace integrations link to PAN DEV for more information):
- Grafana: Grafana alerting service.
To configure this connector, follow the steps outlined in the configuration wizard.
Halcyon
Halcyon
Important
This connector is only available for tenants that onboarded after July 26, 2026. For tenants that onboarded before this date, use Marketplace to access the standalone integration. For more information, see Marketplace.
This connector is available with any active Cortex XSIAM license.
Halcyon is a device management platform that helps organizations monitor, control, and secure their network of devices. This integration fetches security alerts and operational events from the Halcyon platform and ingests them into Cortex XSIAM.
This connector includes the following sub-capabilities (Marketplace integrations link to PAN DEV for more information):
- Halcyon: Halcyon is a device management platform that helps organizations monitor, control, and secure their network of devices. It provides centralized tools for overseeing hardware and software inventory, deploying updates, enforcing security policies, and ensuring compliance across device environments.
To configure this connector, follow the steps outlined in the configuration wizard.
Harbor
Here are the articles in this section:
Connect Harbor registry
Cortex XSIAM allows you to scan and secure your container images from vulnerabilities, malware, and secrets after you authenticate and connect your Harbor registry account.
License type: This feature is included with a Cortex XSIAM Premium license. It is also included with any other Cortex XSIAM product that has the Cloud Posture Security or the Cloud Runtime Security add-on.
How to connect Harbor
Follow the wizard to use the Harbor connector in Cortex XSIAM to scan and secure container images.
- Navigate to Settings → Data Sources & Integrations.
- On the Add Data Sources or Integrations page, click + Add New, search for Harbor, then hover over it and click Add.
- The Instance Name is automatically populated. You can change it to a more meaningful name.
-
Choose the Scan Mode, and then follow the steps for that mode to configure the connection.
Cloud Scan
Security scanning is performed in the Cortex cloud environment when you select this mode.
-
Select the appropriate Cloud Provider and Region for the Cortex environment to use for registry scanning.
As a best practice, choose the region closest to your registry deployment to achieve the best scanning throughput and potentially reduce cloud costs.
- (Optional) Enable Allow access by IP’s to specify a static IP address for the scanner to use. Make sure the static IP is allowed through your firewall so the scanner can access the registry during the scanning process.
-
Enter the Registry URL.
Use the base URL of the Harbor registry. For example:
https://harbor.yourdomain.comhttps://harbor.yourdomain.com:8443(with a specific port)Alternatively, if you are using a CA certificate, enter the server IP address instead of the registry URL. For example:
https://35.209.190.220https://35.210.190.225:8084(with a custom port) -
Under Authentication Method, enter the Username and Password of the registry that you want to connect.
If you have configured a robot account for automated access, use the robot account’s username and secret/token as authentication credentials.
For example:
docker login harbor.example.com -u 'robot$<your-robot-account-name>' -p '<your-robot-token>' - (Optional) Expand Show advanced settings and then enter a custom CA certificate in PEM format for Cortex to validate the Harbor registry. Ensure that the Custom CA certificate that you use is not revoked by the issuing authority.
- Select Next.
Scan with Outpost
Security scanning is done on infrastructure deployed to a cloud account that you own. This mode requires additional cloud provider permissions and may incur extra costs.
Prerequisite
Ensure an Outpost is connected to your tenant.
-
Choose a Cloud Provider to initialize registry scanning.
Note
If you choose Azure as the Cloud Provider, you must also select the Tenant Id. The Tenant Id is required to approve Cortex as an enterprise application in your Azure tenant.
-
Choose Outpost account to use for this instance. If no Outposts are shown, you can Create a new one. For more details, see Outposts.
Note
If you choose Azure as the cloud provider, only Outposts associated with the selected tenant ID are displayed.
- Select the Region where the registry is hosted.
- (Optional) Enable Allow access by IPs if you want to specify a static IP address for the scanner to use. Make sure the static IP is allowed through your firewall so that the scanner can access the registry during the scanning process.
-
Enter the Registry URL.
Use the base URL of the Harbor registry. For example:
https://harbor.yourdomain.comhttps://harbor.yourdomain.com:8443(with a specific port)Alternatively, if you are using a CA certificate, enter the server IP address instead of the registry URL. For example:
https://35.209.190.220https://35.209.190.220:8084(with a custom port) -
Under Authentication Method, enter the Username and Password of the registry that you want to connect.
If you have configured a robot account for automated access, use the robot account’s username and secret/token as authentication credentials.
For example:
docker login harbor.example.com -u 'robot$<your-robot-account-name>' -p '<your-robot-token>' - (Optional) Expand Show advanced settings and then enter a custom CA certificate in PEM format for Cortex to validate the Harbor registry. Ensure that the Custom CA certificate that you use is not revoked by the issuing authority.
- Select Next.
Scan with Broker VM
Security scanning in private networks is performed using broker VM infrastructure when you select this mode.
Prerequisite
Ensure one of the following is configured:
- Choose a Scan with Broker VM mode to initiate registry scanning. You can select either a standalone Broker VM or a High Availability (HA) Cluster.
-
Select Applicable Broker VMs.
Choose the appropriate Broker VM or Cluster from the list configured in your tenant.
Note
- The list of Broker VMs displays only VMs that support registry scanning.
- The list of high-availability Clusters displays only clusters that contain at least one VM supporting registry scanning.
- The registry scanning status for each VM appears in brackets if it was previously activated for that specific VM.
If the list does not display any Broker VMs or clusters, Add New Broker VM or Add New Cluster. For more details, see Set up and configure Broker VM.
-
Enter the Registry URL.
Use the base URL of the Harbor registry. For example:
https://harbor.yourdomain.comhttps://harbor.yourdomain.com:8443(with a specific port)Alternatively, if you are using a CA certificate, enter the server IP address instead of the registry URL. For example:
https://35.209.190.220https://35.210.190.225:8443(with a custom port) -
Under Authentication Method, enter the Username and Password of the registry that you want to connect.
If you have configured a robot account for automated access, use the robot account’s username and secret/token as authentication credentials.
For example:
docker login harbor.example.com -u 'robot$<your-robot-account-name>' -p '<your-robot-token>' - (Optional) Expand Show advanced settings and then enter a custom CA certificate in PEM format for Cortex to validate the Harbor registry. Ensure that the Custom CA certificate that you use is not revoked by the issuing authority.
- Select Next.
-
- In the Initial Scan Configuration, set your scanning process to focus on recently added or modified container images and exclude older ones that do not align with your current scanning objectives. This setting helps avoid unnecessary scans. Choose one of the following options:
- All: Scans all container images, including all versions (tags), in all discovered repositories.
- Latest Tag: Scans only images tagged 'latest' in all discovered repositories.
- Days Modified: Scans container images that have been created in the last few days. You can select a range of up to 90 days for the scan.
-
Select Save.
When the Harbor data source is saved successfully, a new data connector is created, and the initial discovery scan begins. The connection process may take up to 15 minutes.
- To check connector status and scan results, follow these steps:
- Navigate to Settings → Data Sources & Integrations.
- Find the Harbor instance from the list of 3rd Party Data Sources connectors, or use Search.
- In the Harbor instance row, select View Details. The Harbor Instances page appears.
- On the Harbor Instances page, you can filter results by any heading and value.
-
Select an instance name to open the details pane. The details pane contains the following granular information:
Instance Details Description Status Shows the status of the connector: Connected, Error, Warning, Disabled, or Pending. Applet Status on Broker VM Shows the status of the Registry Scanner applet on the Broker VM page. This status is visible only when the Scan with Broker VM mode is selected. Repositories Shows the number of scanned repositories in the registry. Scan Mode Shows the selected scan mode for the data connector, such as Cloud Scan, Scan with Outpost, or Scan with Broker VM. Security Capabilities Shows a breakdown of the security capabilities enabled on the instance and their individual statuses. For example, select Registry Scanning when it shows a warning or error status to see the open errors and issues that contributed to the status.
-
Next Steps.
- After the scan is complete, you can view the scanned images on the Container Images Inventory page. For more details, see Container Images assets.
- If you have selected the Scan with Broker VM option, then a Registry Scanner applet is created on the selected Broker VM or Cluster. For details, see Verify Registry Scanner connection.
Manage a Harbor connector
After successfully adding a connector, you can modify the connector settings and configure the scanning scope to control which images are scanned in the connected registry.
To manage the connector, follow these steps:
- Navigate to Settings → Data Sources & Integrations.
- Find the Harbor data source from the list of data sources, or use the filter to search.
-
Select the Harbor row. A pane opens with a list of integration instances and their details.
You can create a new instance by selecting Add Instance and following the onboarding wizard to define the settings.
-
Right click an instance to perform actions on it as follows:
Action Instructions Edit Edit the Harbor instance.
Note
- If you selected Scan with Broker VM mode, you can't change to a different scan mode (such as Cloud Discovery or Scan with Outpost) when you edit the instance.
- When editing an instance configured for Scan with Broker VM, you must re-enter your authentication credentials, including Username, Password, and CA certificate.
Exclude/Include images Define conditions to automatically exclude or include specific images while scanning. Conditions can be based on Repository or Tags. These conditions apply automatically to newly discovered images in the account. Delete Removes the connector. Disable Stops image scanning for the connector without deleting it.
Harness
Here are the articles in this section:
Harness
The capabilities and sub-capabilities listed for this connector are available with any active Cortex Cloud Posture Security license.
This connector includes the following capabilities and sub-capabilities (if applicable):
- SaaS Posture Configuration Monitoring: Detect, monitor and alert on settings of your SaaS application.
- saas-posture-config-remediation: Help remediate the misconfigured security settings of your SaaS application.
To configure this connector, follow the steps outlined in the configuration wizard.
HashiCorp
Here are the articles in this section:
HashiCorp
Important
This connector is only available for tenants that onboarded after July 26, 2026. For tenants that onboarded before this date, use Marketplace to access the standalone integration. For more information, see Marketplace.
This connector is available with any active Cortex XSIAM or Cortex AgentiX license.
Secure, store, and tightly control access to tokens, passwords, certificates, and encryption keys for protecting secrets and other sensitive data using HashiCorp Vault. HashiCorp Terraform provides Infrastructure as Code (IaC) automation to provision and manage resources in any cloud or data center.
This connector includes the following sub-capabilities (Marketplace integrations link to PAN DEV for more information):
- HashiCorp Vault: Manage Secrets and Protect Sensitive Data through HashiCorp Vault.
- HashicorpTerraform: Hashicorp Terraform provide infrastructure automation to provision and manage resources in any cloud or data center with Terraform.
To configure this connector, follow the steps outlined in the configuration wizard.
Have I Been Pwnd
Here are the articles in this section:
Have I Been Pwnd
Important
This connector is only available for tenants that onboarded after July 26, 2026. For tenants that onboarded before this date, use Marketplace to access the standalone integration. For more information, see Marketplace.
This connector is available with any active Cortex XSIAM or Cortex AgentiX license.
Uses the Have I Been Pwned? service to check whether email addresses, domains, or usernames were compromised in previous breaches. Uses API v3.
This connector includes the following sub-capabilities (Marketplace integrations link to PAN DEV for more information):
To configure this connector, follow the steps outlined in the configuration wizard.
HCL BigFix
HCL BigFix
Important
This connector is only available for tenants that onboarded after July 26, 2026. For tenants that onboarded before this date, use Marketplace to access the standalone integration. For more information, see Marketplace.
This connector is available with any active Cortex XSIAM or Cortex AgentiX license.
Use the BigFix integration to manage patching processes.
This connector includes the following sub-capabilities (Marketplace integrations link to PAN DEV for more information):
- BigFix: HCL BigFix Patch provides an automated, simplified patching process that is administered from a single console.
To configure this connector, follow the steps outlined in the configuration wizard.
HPE Aruba
Here are the articles in this section:
HPE Aruba
Important
This connector is only available for tenants that onboarded after July 26, 2026. For tenants that onboarded before this date, use Marketplace to access the standalone integration. For more information, see Marketplace.
HPE Aruba Central provides a centralized platform for managing and monitoring network infrastructure, including event collection and audit log management for network changes, user activities, and security events. HPE Aruba ClearPass Policy Manager provides role and device-based network access control for employees, contractors, and guests across any multi-vendor wired, wireless, and VPN infrastructure.
This connector includes the following sub-capabilities (Marketplace integrations link to PAN DEV for more information):
- HPEArubaCentralEventCollector: This is the Aruba Central event collector integration for Cortex XSIAM. This sub-capability is available with any active Cortex XSIAM license.
- HPEArubaClearPass: Aruba ClearPass Policy Manager provides role and device-based network access control for employees, contractors, and guests across any multi-vendor wired, wireless, and VPN infrastructure. This sub-capability is available with any active Cortex XSIAM or Cortex AgentiX license.
To configure this connector, follow the steps outlined in the configuration wizard.
Hostio Solutions
Hostio Solutions
Important
This connector is only available for tenants that onboarded after July 26, 2026. For tenants that onboarded before this date, use Marketplace to access the standalone integration. For more information, see Marketplace.
This connector is available with any active Cortex XSIAM or Cortex AgentiX license.
Enrich domains using the Host.io API. Host.io collects data about every known domain name, letting you retrieve information about any given domain, including a list of domains associated with a specific field, the domain's rank based on popularity, and the name of the server where the domain exists.
This connector includes the following sub-capabilities (Marketplace integrations link to PAN DEV for more information):
- HostIo: Use the HostIo integration to enrich domains using the Host.io API.
To configure this connector, follow the steps outlined in the configuration wizard.
HTTP log collector
You can configure collecting any vendor logs over HTTP with a Custom - HTTP based Collector in a Raw, JSON, CEF, or LEEF format.
| Collection Method | Description |
|---|---|
| Custom - HTTP based Collector (standard data source) overview | Forward any vendor logs over HTTP in a Raw, JSON, CEF, or LEEF format to Cortex XSIAM using the Custom - HTTP data source. |
| Link to standard data source instructions | Set up an HTTP log collector to receive logs |
Set up an HTTP log collector to receive logs
In addition to logs from supported vendors, you can set up a custom HTTP log collector to receive logs in Raw, JSON, CEF, or LEEF format. The HTTP Log Collector can ingest up to 80,000 events per sec.
When Cortex XSIAM begins receiving logs from the third-party source, Cortex XSIAM automatically parses the logs and creates a dataset with the name <Vendor>_< Product>_raw. You can then use XQL Search queries to view logs and create new Correlation rules.
To set up an HTTP log collector to receive logs from an external source.
-
Create an HTTP Log collector in Cortex XSIAM.
a. Navigate to Settings → Data Sources & Integrations.
b. On the Data Sources & Integrations page, click + Add New, search for HTTP, then hover over it and click Add.
c. Specify a descriptive Name for your HTTP log collection configuration.
d. Select the data object Compression, either gzip or uncompressed.
e. Select the Log Format as Raw, JSON, CEF, or LEEF.
Cortex XSIAM supports logs in single line format or multiline format. For a JSON format, multiline logs are collected automatically when the Log Format is configured as JSON. When configuring a Raw format, you must also define the Multiline Parsing Regex as explained below.
Note
The Vendor and Product defaults to Auto-Detect when the Log Format is set to CEF or LEEF.
For a Log Format set to CEF or LEEF, Cortex XSIAM reads events row by row to look for the Vendor and Product configured in the logs. When the values are populated in the event log row, Cortex XSIAM uses these values even if you specified a value in the Vendor and Product fields in the HTTP collector settings. However, when the values are blank in the event log row, Cortex XSIAM uses the Vendor and Product that you specified in the HTTP collector settings. If you did not specify a Vendor or Product in the HTTP collector settings, and the values are blank in the event log row, the values for both fields are set to unknown.
f. Specify the Vendor and Product for the type of logs you are ingesting.
g. (Optional) Specify the Multiline Parsing Regex for logs with multilines.
This option is only displayed when the Log Format is set to Raw, so you can set the regular expression that identifies when the multiline event starts in logs with multilines. It is assumed that when a new event begins, the previous one has ended.
h. Save & Generate Token.
Click the copy icon next to the key and record it somewhere safe. You will need to provide this key when you configure your HTTP POST request and define the
api_key. If you forget to record the key and close the window you will need to generate a new key and repeat this process. Click Done when finished. -
Send data to your Cortex XSIAM HTTP log collector.
a. Send an HTTP POST request to the URL for your HTTP Log Collector.
You can view a sample curl or python request on an HTTP collector instance by selecting View Example.
Here is a CURL example:
curl -X POST https://api-{tenant external URL}/logs/v1/event -H 'Authorization: {api_key}' -H 'Content-Type: text/plain' -d '{"example1": "test", "timestamp": 1609100113039} {"example2": [12321,546456,45687,1]}'
Python 3 example:
import requests def test_http_collector(api_key): headers = { "Authorization": api_key, "Content-Type": "text/plain" } # Note: the logs must be separated by a new line body = "{'example1': 'test', 'timestamp': 1609100113039}" \ "{'example2': [12321,546456,45687,1]}" res = requests.post(url="https://api-{tenant external URL}/logs/v1/event", headers=headers, data=body) return res
b. Substitute the values specific to your configuration.
url: You can copy the URL for your HTTP log collector from the Custom Collectors page. For example:https://api-{tenant external URL}/logs/v1/event.Authorization: Paste theapi_keyyou previously recorded for your HTTP log collector, which is defined in the header.Content-Type: Depending on the data object format you selected during setup, this will beapplication/jsonfor JSON format ortext/plainfor Text format. This is defined as part of the header.Body: The body contains the records you want to send to Cortex XSIAM. Separate records with a\n(new line) delimiter. The request body can contain up to 10 Mib records, but 1 Mib is recommended. In the case of a curl command, the records are contained in the-d ‘<records>’parameter.
Note
Each record cannot exceed 5 MB in size.
c. Review the possible success and failure code responses to your HTTP Post requests.
The following table provides the various success and failure code responses to your HTTP Post requests, which can help you troubleshoot any problems with your HTTP Collector configuration.
Success/failure response code Description Output code displayed (if applicable) 200 Success code that indicates there are no errors and the request was successful. { "error": "false"}401 Unauthorized error code that indicates either an incorrect authorization token is being used or that the HTTP Collector is deleted/disabled. 404 Error code 404 page not found that indicates a wrong URL. 413 Error code indicating the payload is too large as the request size limit is 10 MB. 500 Error code indicating the request was not able to be processed due to an incorrect log format between the request and the HTTP collector configuration. { "error": "error processing request, error: failed to process the request"}429 Error code indicating too many requests as the rate limit is 400 requests per second per customer per endpoint. -
Monitor your HTTP Log Collection integration.
You can return to the Settings → Data Sources & Integrations page to monitor the status of your HTTP Log Collection configuration. For each instance, Cortex XSIAM displays the number of logs received in the last hour, day, and week. You can also use the Data Ingestion Dashboard to view general statistics about your data ingestion configurations.
- After Cortex XSIAM begins receiving logs, use the XQL Search to search your logs.
IBM
Here are the articles in this section:
IBM Storage Scale
Important
This connector is only available for tenants that onboarded after July 26, 2026. For tenants that onboarded before this date, use Marketplace to access the standalone integration. For more information, see Marketplace.
This connector is available with any active Cortex XSIAM license.
IBM Storage Scale (formerly IBM Spectrum Scale, originally GPFS) is a high-performance, software-defined parallel file system for managing massive amounts of unstructured data across storage types, locations, and cloud environments. This connector collects Command Line Interface (CLI) audit log records from the IBM Storage Scale API, using a concurrent fetching mechanism to efficiently ingest large volumes of data from enterprise-level storage environments.
This connector includes the following sub-capabilities (Marketplace integrations link to PAN DEV for more information):
- IBM Storage Scale: Collects Command Line Interface (CLI) audit log records from IBM Storage Scale.
To configure this connector, follow the steps outlined in the configuration wizard.
IBM QRadar
Important
This connector is only available for tenants that onboarded after July 26, 2026. For tenants that onboarded before this date, use Marketplace to access the standalone integration. For more information, see Marketplace.
Integrate with IBM QRadar to detect, prioritize, and respond to threats across the enterprise. IBM Security QRadar SOAR provides case management for continual issue-response improvement, while IBM QRadar v3 (SIEM) aggregates and parses logs, fetches offenses with their enriched data as issues, and lets you run QRadar actions from the platform.
This connector includes the following sub-capabilities (Marketplace integrations link to PAN DEV for more information):
- IBM Resilient Systems: Case management that enables visibility across your tools for continual IR improvement. This sub-capability is available with any active Cortex XSIAM or Cortex AgentiX license.
- QRadar v3: IBM QRadar SIEM helps security teams accurately detect and prioritize threats across the enterprise, supports API versions 10.1 and above. Provides intelligent insights that enable teams to respond quickly to reduce the impact of incidents. This sub-capability is available with any active Cortex XSIAM, Cortex Cloud Posture Security, Cortex Cloud, Cortex Cloud Runtime Security, Cortex XDR, or Cortex AgentiX license.
To configure this connector, follow the steps outlined in the configuration wizard.
IBM Security
Important
This connector is only available for tenants that onboarded after July 26, 2026. For tenants that onboarded before this date, use Marketplace to access the standalone integration. For more information, see Marketplace.
Integrate with IBM Security products. IBM MaaS360 is a mobile device management solution for monitoring and managing smartphones, tablets, and other mobile devices. IBM Security Guardium is a data security platform providing visibility and protection for sensitive data across databases, data warehouses, big data platforms, and cloud environments. IBM Security Verify secures and manages user identity and access, and collects security events across your organization's network. IBM X-Force Exchange provides threat intelligence about applications, IP addresses, URLs, and hashes.
This connector includes the following sub-capabilities (Marketplace integrations link to PAN DEV for more information):
- IBMMaaS360Security: This sub-capability is available with any active Cortex XSIAM license.
- IBMSecurityGuardium: Collect events from IBM Guardium Data Security Center. This sub-capability is available with any active Cortex XSIAM license.
- IBMSecurityVerify: IBM Security Verify provides a secure and scalable solution for collecting and managing security events from IBM Security Verify, offering advanced threat detection and response capabilities for protecting identities, applications, and data. This sub-capability is available with any active Cortex XSIAM license.
- XFE_v2: IBM X-Force Exchange lets you receive threat intelligence about applications, IP addresses, URLs and hashes. This sub-capability is available with any active Cortex XSIAM or Cortex AgentiX license.
To configure this connector, follow the steps outlined in the configuration wizard.
iManage
iManage
Important
This connector is only available for tenants that onboarded after July 26, 2026. For tenants that onboarded before this date, use Marketplace to access the standalone integration. For more information, see Marketplace.
This connector is available with any active Cortex XSIAM license.
iManage Threat Manager uses machine learning and user behavior analytics to detect unusual user behavior, prevent data loss, and ensure compliance, protecting privileged information against internal and external threat actors. Fetch and manage security alerts from iManage Threat Manager.
This connector includes the following sub-capabilities (Marketplace integrations link to PAN DEV for more information):
- iManageThreatManager: iManage Threat Manager protects privileged information against internal and external threat actors using machine learning and user behavior analytics.
To configure this connector, follow the steps outlined in the configuration wizard.
Imperva
Here are the articles in this section:
Imperva
Important
This connector is only available for tenants that onboarded after July 26, 2026. For tenants that onboarded before this date, use Marketplace to access the standalone integration. For more information, see Marketplace.
This connector is available with any active Cortex XSIAM or Cortex AgentiX license.
Integrate with Imperva security products. Imperva Skyfence is a Cloud Access Security Broker (CASB) that provides visibility and control over cloud apps. Imperva WAF (SecureSphere) protects web applications from cyber attacks. Imperva Incapsula (Cloud WAF) manages sites and IPs.
This connector includes the following sub-capabilities:
- Imperva Skyfence: Provides visibility and control over cloud apps.
- Imperva WAF: Manages IP groups and web security policies.
- Incapsula: Manages sites and IPs.
Follow the configuration wizard to configure this connector.
InfoArmor
Here are the articles in this section:
InfoArmor
Important
This connector is only available for tenants that onboarded after July 26, 2026. For tenants that onboarded before this date, use Marketplace to access the standalone integration. For more information, see Marketplace.
This connector is available with any active Cortex XSIAM or Cortex AgentiX license.
VigilanteATI provides advanced threat intelligence. InfoArmor’s VigilanteATI platform and cyber threat services extend your IT security team.
- InfoArmor VigilanteATI: Provides advanced threat intelligence.
Follow the configuration wizard to configure this connector.
Infoblox
Infoblox
Important
This connector is only available for tenants that onboarded after July 26, 2026. For tenants that onboarded before this date, use Marketplace to access the standalone integration. For more information, see Marketplace.
This connector is available with any active Cortex XSIAM license.
Infoblox BloxOne Threat Defense is a hybrid cybersecurity solution that leverages DNS as the first line of defense to detect and block cyber threats. This connector collects Threat Defense events, sharing threat intelligence, automated indicator enrichment, and DNS-based security controls.
This connector includes the following sub-capabilities (Marketplace integrations link to PAN DEV for more information):
- Infoblox BloxOne Threat Defense Event Collector: BloxOne Threat Defense is a hybrid cybersecurity solution that leverages DNS as the first line of defense to detect and block cyber threats.
To configure this connector, follow the steps outlined in the configuration wizard.
Intellum
Intellum
Important
This connector is only available for tenants that onboarded after July 26, 2026. For tenants that onboarded before this date, use Marketplace to access the standalone integration. For more information, see Marketplace.
This connector is available with any active Cortex XSIAM, Cortex XDR, or Cortex AgentiX license.
Manage the identity lifecycle of users in Intellum ExceedLMS. Use this connector as part of the Identity Lifecycle Management premium pack to create, update, enable, and disable users. Tested with version v2 of ExceedLMS.
This connector includes the following sub-capabilities (Marketplace integrations link to PAN DEV for more information):
To configure this connector, follow the steps outlined in the configuration wizard.
Intercom
Here are the articles in this section:
Intercom
The capabilities and sub-capabilities listed for this connector are available with any active Cortex XSIAM or Cortex Cloud Posture Security license.
This connector includes the following capabilities and sub-capabilities (if applicable):
- SaaS Posture Configuration Monitoring: Detect, monitor and alert on settings of your SAAS application.
- saas-posture-config-remediation: Help remediate the misconfigured security settings of your SAAS application.
To configure this connector, follow the steps outlined in the configuration wizard.
IPInfo.io
IPInfo.io
Important
This connector is only available for tenants that onboarded after July 26, 2026. For tenants that onboarded before this date, use Marketplace to access the standalone integration. For more information, see Marketplace.
This connector is available with any active Cortex XSIAM or Cortex AgentiX license.
Use the IPinfo.io API to get data about an IP address. IPinfo v2 lets you set source reliability and enriches data with IP-hostname relationships.
This connector includes the following sub-capabilities (Marketplace integrations link to PAN DEV for more information):
- ipinfo_v2: Use the IPinfo.io API to get data about an IP address.
To configure this connector, follow the steps outlined in the configuration wizard.
IPstack
IPstack
Important
This connector is only available for tenants that onboarded after July 26, 2026. For tenants that onboarded before this date, use Marketplace to access the standalone integration. For more information, see Marketplace.
This connector is available with any active Cortex XSIAM or Cortex AgentiX license.
One of the leading IP to geolocation APIs and global IP database services.
This connector includes the following sub-capabilities (Marketplace integrations link to PAN DEV for more information):
- Ipstack: One of the leading IP to geolocation APIs and global IP database services.
To configure this connector, follow the steps outlined in the configuration wizard.
Ironscales
Ironscales
Important
This connector is only available for tenants that onboarded after July 26, 2026. For tenants that onboarded before this date, use Marketplace to access the standalone integration. For more information, see Marketplace.
This connector is available with any active Cortex XSIAM license.
IRONSCALES is an AI-powered email security platform that detects, remediates, and prevents phishing and BEC attacks while training users through integrated awareness tools. Use this connector to collect Ironscales email security event log messages, including XDM mapping for key event types.
This connector includes the following sub-capabilities (Marketplace integrations link to PAN DEV for more information):
- Ironscales Event Collector: Use this integration to fetch email security incidents from Ironscales as XSIAM events.
To configure this connector, follow the steps outlined in the configuration wizard.
Ivanti
Ivanti
Important
This connector is only available for tenants that onboarded after July 26, 2026. For tenants that onboarded before this date, use Marketplace to access the standalone integration. For more information, see Marketplace.
This connector is available with any active Cortex XSIAM or Cortex AgentiX license.
Integrate with Ivanti IT service management products. Cherwell is a cloud-based IT service management solution where you can create, read, update, and delete business objects, together with attachments and relations operations. Ivanti Heat is the Ivanti Heat service manager.
This connector includes the following sub-capabilities (Marketplace integrations link to PAN DEV for more information):
- Cherwell: Cloud-based IT service management solution.
- Ivanti Heat: Use the Ivanti Heat integration to manage issues and create Cortex XSOAR incidents from Ivanti Heat.
To configure this connector, follow the steps outlined in the configuration wizard.
iZOOlogic
iZOOlogic
Important
This connector is only available for tenants that onboarded after July 26, 2026. For tenants that onboarded before this date, use Marketplace to access the standalone integration. For more information, see Marketplace.
This connector is available with any active Cortex XSIAM, Cortex Cloud Posture Security with the Application Security Posture Management (ASPM) module, Cortex Cloud, Cortex Cloud Runtime Security, Cortex XDR, or Cortex AgentiX license with the Attack Surface Management (ASM), Exposure Management, or Threat Intel Management (TIM) add-on.
iZOOlogic is a brand protection and threat management platform. This connector fetches and manages issues from iZOOlogic, enabling automated ingestion, issue creation, and advanced filtering across threat types including phishing, brand abuse, malware, and more.
This connector includes the following sub-capabilities (Marketplace integrations link to PAN DEV for more information):
- iZOOlogic
To configure this connector, follow the steps outlined in the configuration wizard.
Jamf
Jamf
Important
This connector is only available for tenants that onboarded after July 26, 2026. For tenants that onboarded before this date, use Marketplace to access the standalone integration. For more information, see Marketplace.
Enterprise Mobility Management (EMM) for Apple devices (Mac, iPhone, Apple TV, iPad) with Jamf Pro, used to control configurations via policies, install and uninstall applications, lock devices, run smart group searches, and more. Also fetches audit logs, alert events, and computer assets from Jamf Protect.
This connector includes the following sub-capabilities (Marketplace integrations link to PAN DEV for more information):
- Jamf Protect Event Collector: Use this integration to fetch audit logs events, alerts events and computer assets from Jamf Protect to Cortex XSIAM. This sub-capability is available with any active Cortex XSIAM license.
- jamf v2: Enterprise Mobility Management (EMM) for Apple devices (Mac, iPhone, Apple TV, iPad). Can be used to control various configurations via different policies, install and uninstall applications, lock devices, smart groups searches, and more. This sub-capability is available with any active Cortex XSIAM or Cortex AgentiX license.
To configure this connector, follow the steps outlined in the configuration wizard.
Jamf Pro
The capabilities and sub-capabilities listed for this connector are available with any active Cortex XSIAM or Cortex Cloud Posture Security license.
This connector includes the following capabilities and sub-capabilities (if applicable):
- Security Posture: Detect, monitor and alert on settings of your SaaS application.
- saas-posture-config-remediation: Help remediate the misconfigured security settings of your SaaS application.
To configure this connector, follow the steps outlined in the configuration wizard.
JFrog
Here are the articles in this section:
Connect JFrog container registry
Cortex XSIAM allows you to scan and secure your container images from vulnerabilities, malware, and secrets after you authenticate and connect your JFrog account. This process ensures robust artifact management and enhanced security.
License type: This feature is included with a Cortex XSIAM Premium license. It is also included with any other Cortex XSIAM product that has the Cloud Posture Security or the Cloud Runtime Security add-on.
How to connect JFrog
Follow the wizard to connect your JFrog Container Registry with Cortex XSIAM.
- Navigate to Settings → Data Sources & Integrations.
- On the Add Data Sources or Integrations page, click + Add New, search for JFrog, then hover over it and click Add.
-
Select Image scanning to continue scanning your container images.
If you want to enable Software Composition Analysis (SCA) scanning for your private packages, then select Package resolution for code scanning and refer to JFrog Artifactory for more details.
- The Instance Name is automatically populated. You can change it to a more meaningful name.
- Choose the Scan Mode, and then follow the steps provided for that mode to configure the connection.
Cloud Scan
Security scanning is done in the Cortex XSIAM environment when you select this mode.
-
Select the appropriate Cloud Provider and Region for the Cortex environment to use for registry scanning.
As a best practice, choose the region closest to your registry deployment to achieve the best scanning throughput and potentially reduce cloud costs.
- (Optional) Enable Allow access by IPs to specify a static IP address for the scanner to use. Make sure the static IP is allowed through your firewall so the scanner can access the registry during the scanning process.
-
Choose the relevant Account Type for JFrog deployments:
JFrog Cloud (Saas)
-
Enter your JFrog Account Name.
For example, the scanner connects to
https://myaccount.jfrog.io, where<myaccount>is your actual account name. -
Under Authentication Method, enter your JFrog account credentials (Username and Password) for authentication.
JFrog Self-Hosted
-
Enter the JFrog Artifactory URL as the Registry URL.
For example,
https://artifactory.example.com/artifactory, where<artifactory.example.com>is your server's domain or IP address. - Under Authentication Method, enter your JFrog user credentials (Username and Password) for authentication.
- (Optional) Expand Show Advanced Settings, and then enter the CA certificate in PEM format for Cortex to validate the JFrog Artifactory registry.
-
- Select Next.
Scan with Outpost
Security scanning is done on infrastructure deployed to a cloud account that you own. This mode requires additional cloud provider permissions and may incur extra costs.
Prerequisite
Ensure an Outpost is connected to your tenant.
-
Choose a Cloud Provider to initialize registry scanning.
Note
If you choose Azure as the Cloud Provider, you must also select the Tenant Id. The Tenant Id is required to approve Cortex as an enterprise application in your Azure tenant.
-
Choose Outpost account to use for this instance. If no Outposts are shown, you can Create a new one. For more details, see Outposts.
Note
If you choose Azure as the cloud provider, only Outposts associated with the selected tenant ID are displayed.
- Select the Region where the registry is hosted.
- (Optional) Enable Allow access by IPs to specify a static IP address for the scanner to use. Make sure the static IP is allowed through your firewall so the scanner can access the registry during the scanning process.
-
Choose the relevant Account Type for JFrog deployments:
JFrog Cloud (Saas)
-
Enter your JFrog Account Name.
For example, the scanner connects to
https://myaccount.jfrog.io, where<myaccount>is your actual account name. -
Under Authentication Method, enter your JFrog account credentials (Username and Password) for authentication.
JFrog Self-Hosted
-
Enter the JFrog Artifactory URL as the Registry URL.
For example,
https://artifactory.example.com/artifactory, where<artifactory.example.com>is your server's domain or IP address. - Under Authentication Method, enter your JFrog user credentials (Username and Password) for authentication.
- (Optional) Expand Show Advanced Settings, and then enter the CA certificate in PEM format for Cortex to validate the JFrog Artifactory registry.
-
- Select Next.
Scan with Broker VM
Security scanning in private networks is performed using broker VM infrastructure when you select this mode.
Prerequisite
Ensure one of the following is configured:
- Choose a Scan with Broker VM mode to initiate registry scanning. You can select either a standalone Broker VM or a High Availability (HA) Cluster.
-
Select Applicable Broker VMs.
Choose the appropriate Broker VM or Cluster from the list configured in your tenant.
Note
- The list of Broker VMs displays only VMs that support registry scanning.
- The list of high-availability Clusters displays only clusters that contain at least one VM supporting registry scanning.
- The registry scanning status for each VM appears in brackets if it was previously activated for that specific VM.
If the list does not display any Broker VMs or clusters, Add New Broker VM or Add New Cluster. For more details, see Set up and configure Broker VM.
-
Choose the relevant Account Type for JFrog deployments:
JFrog Cloud (Saas)
-
Enter your JFrog Account Name.
For example, the scanner connects to
https://myaccount.jfrog.io, where<myaccount>is your actual account name. -
Under Authentication Method, enter your JFrog account credentials (Username and Password) for authentication.
JFrog Self-Hosted
-
Enter the JFrog Artifactory URL as the Registry URL.
For example,
https://artifactory.example.com/artifactory, where<artifactory.example.com>is your server's domain or IP address. - Under Authentication Method, enter your JFrog user credentials (Username and Password) for authentication.
- (Optional) Expand Show Advanced Settings.
- Select Use insecure connection to pull images if you want to allow image pull from the registry over an HTTP connection instead of HTTPS.
- Enter the CA certificate in PEM format for Cortex to validate the JFrog Artifactory registry.
-
- Select Next.
6. In the Initial Scan Configuration, set your scanning process to focus on recently added or modified container images and exclude older ones that do not align with your current scanning objectives. This setting helps avoid unnecessary scans. Choose one of the following options:
- All: Scans all container images, including all versions (tags), in all discovered repositories.
- Latest Tag: Scans only images tagged 'latest' in all discovered repositories.
- Days Modified: Scans container images that have been created in the last few days. You can select a range of up to 90 days for the scan.
-
Select Save.
When the JFrog data source is saved successfully, a new data connector is created, and the initial discovery scan is started. The connection process may take up to 15 minutes.
- To check connector status and scan results, follow these steps:
- Navigate to Settings → Data Sources & Integrations.
- Find the JFrog Artifactory instance from the list of 3rd Party Data Sources connectors, or use Search.
- In the JFrog Artifactory instance row, select View Details. The JFrog Artifactory Instances page appears.
- On the JFrog Artifactory Instances page, you can filter results by any heading and value.
-
Select an instance name to open the details pane. The details pane contains the following granular information:
Instance Details Description Status Shows the status of the connector: Connected, Error, Warning, Disabled, or Pending. Applet Status on Broker VM Shows the status of the Registry Scanner applet on the Broker VM page. This status is visible only when the Scan with Broker VM mode is selected. Repositories Shows the number of scanned repositories in the registry. Scan Mode Shows the selected scan mode for the data connector, such as Cloud Scan, Scan with Outpost, or Scan with Broker VM. Security Capabilities Shows a breakdown of the security capabilities enabled on the instance and their individual statuses. For example, select Registry Scanning when it shows a warning or error status to see the open errors and issues that contributed to the status.
- Next Steps.
- After the scan is complete, you can view the list of scanned images on the Container Images Inventory page. For more details, see Container Image assets.
-
If you have selected the Scan with Broker VM option, then a Registry Scanner applet is created on the selected Broker VM or Cluster. For details, see Verify Registry Scanner connection.
Manage a JFrog connector
After you add a JFrog connector, you can modify the connector settings and configure the scanning scope to control which images are scanned in the connected registry.
To manage the connector, follow these steps:
- Select Settings → Data Sources & Integrations.
- Find the JFrog integration from the list of data sources, or use the filter to search.
-
Select the JFrog row. A pane opens with a list of integration instances and their details.
You can create a new instance by selecting Add Instance and following the onboarding wizard to define the settings.
-
Right click an instance to perform actions on it as follows:
Action Instructions Edit Edit the JFrog Artifactory instance.
Note
- If you selected Scan with Broker VM mode, you can't change to a different scan mode (such as Cloud Discovery or Scan with Outpost) when you edit the instance.
- When editing an instance configured for Scan with Broker VM, you must re-enter your authentication credentials, including Username, Password, and CA certificate.
Exclude/Include images Define conditions to automatically exclude or include specific images while scanning. Conditions can be based on Repository or Tags. These conditions apply automatically to newly discovered images in the account. Delete Removes the connector. Disable Stops image scanning for the connector without deleting it.
Joe Security
Joe Security
Important
This connector is only available for tenants that onboarded after July 26, 2026. For tenants that onboarded before this date, use Marketplace to access the standalone integration. For more information, see Marketplace.
This connector is available with any active Cortex XSIAM or Cortex AgentiX license.
Access the full set of possibilities the Joe Sandbox Cloud provides via RESTful Web API v2 to detonate and analyze suspicious files and URLs and enrich indicators.
This connector includes the following sub-capabilities (Marketplace integrations link to PAN DEV for more information):
- JoeSecurityV2: Access the full set of possibilities the JoeSandbox Cloud provides via the RESTful Web API v2.
To configure this connector, follow the steps outlined in the configuration wizard.
JumpCloud
Here are the articles in this section:
JumpCloud
The capabilities and sub-capabilities listed for this connector are available with any active Cortex XSIAM or Cortex Cloud Posture Security license.
This connector includes the following capabilities and sub-capabilities (if applicable):
- Security Posture: Detect, monitor and alert on settings of your SAAS application.
- saas-posture-config-remediation: Help remediate the misconfigured security settings of your SAAS application.
To configure this connector, follow the steps outlined in the configuration wizard.
JSONWhoIs.com
JSONWhoIs.com
Important
This connector is only available for tenants that onboarded after July 26, 2026. For tenants that onboarded before this date, use Marketplace to access the standalone integration. For more information, see Marketplace.
This connector is available with any active Cortex XSIAM or Cortex AgentiX license.
Execute queries on URLs and IP addresses, and get information for domains. Use the JsonWhoIs integration to enrich domain indicators.
This connector includes the following sub-capabilities (Marketplace integrations link to PAN DEV for more information):
- JsonWhoIs: Provides data enrichment for domains and IP addresses.
To configure this connector, follow the steps outlined in the configuration wizard.
Kafka
You can configure collecting Kafka data using a Broker VM Kafka Collector applet applet or connector (onboarded after July 26, 2026):
| Collection Method | Description |
|---|---|
| Kafka Collector applet overview | Enables you to monitor and collect events from Topics on self-managed on-prem Kafka clusters directly to your log repository for query and visualization purposes. The applet supports Kafka setups with no authentication, with SSL authentication, and SASL SSL authentication. |
| Link to Kafka Collector applet instructions | Activate Apache Kafka Collector |
| Link to connector (onboarded after July 26, 2026) | Kafka |
Kafka
Important
This connector is only available for tenants that onboarded after July 26, 2026. For tenants that onboarded before this date, use Marketplace to access the standalone integration. For more information, see Marketplace.
This connector is available with any active Cortex XSIAM or Cortex AgentiX license.
Kafka is an open-source distributed streaming platform. Use this connector to manage messages and partitions, and fetch Kafka messages to create issues.
- KafkaV3: Kafka integration.
Follow the configuration wizard to configure this connector.
Kaspersky
Here are the articles in this section:
Kaspersky
Important
This connector is only available for tenants that onboarded after July 26, 2026. For tenants that onboarded before this date, use Marketplace to access the standalone integration. For more information, see Marketplace.
This connector is available with any active Cortex XSIAM or Cortex AgentiX license.
Use the Kaspersky administration console to manage endpoints, administration groups, host and software details, and policies. This beta connector supports a subset of endpoint and API use cases.
- Kaspersky Security Center: Manages endpoints and groups.
Follow the configuration wizard to configure this connector.
Keeper Security
Keeper Security
Important
This connector is only available for tenants that onboarded after July 26, 2026. For tenants that onboarded before this date, use Marketplace to access the standalone integration. For more information, see Marketplace.
This connector is available with any active Cortex XSIAM license.
Access the Keeper Security Admin Console to track and manage multiple Keeper Security products. Fetches audit logs from the Keeper Security Admin Console as events, with XDM mapping for key event types.
This connector includes the following sub-capabilities (Marketplace integrations link to PAN DEV for more information):
- KeeperSecurity: Use this integration to fetch audit logs from Keeper Security Admin Console as XSIAM events.
To configure this connector, follow the steps outlined in the configuration wizard.
KnowBe4
Here are the articles in this section:
KnowB4
Important
This connector is only available for tenants that onboarded after July 26, 2026. For tenants that onboarded before this date, use Marketplace to access the standalone integration. For more information, see Marketplace.
This connector is available with any active Cortex XSIAM license.
KnowBe4 KMSAT provides security awareness training and simulated phishing data. Use the connector to exchange external data with the KnowBe4 console for automation, playbooks, and reports.
- KnowBe4 KMSAT Event Collector: Collects KnowBe4 KMSAT data.
Follow the configuration wizard to configure this connector.
Koi
Here are the articles in this section:
Koi
Important
This connector is only available for tenants that onboarded after July 26, 2026. For tenants that onboarded before this date, use Marketplace to access the standalone integration. For more information, see Marketplace.
This connector is available with any active Cortex XSIAM, Cortex Cloud Posture Security with the Application Security Posture Management (ASPM) module, Cortex Cloud, Cortex Cloud Runtime Security, Cortex XDR, or Cortex AgentiX license with the Attack Surface Management (ASM), Exposure Management, or Threat Intel Management (TIM) add-on.
KOI provides visibility and control over browser extensions, SaaS applications, and web-based threats. This connector ingests KOI alerts and audit logs for centralized monitoring, correlation, and threat analysis.
- KOI: KOI endpoint security platform integration.
Follow the configuration wizard to configure this connector.
Koodous
Here are the articles in this section:
Koodous
Important
This connector is only available for tenants that onboarded after July 26, 2026. For tenants that onboarded before this date, use Marketplace to access the standalone integration. For more information, see Marketplace.
This connector is available with any active Cortex XSIAM or Cortex AgentiX license.
Check Android app samples (APK) against the Koodous API.
This connector includes the following sub-capabilities (Marketplace integrations link to PAN DEV for more information):
- Koodous: Check Android app samples (APK) against Koodous API.
To configure this connector, follow the steps outlined in the configuration wizard.
Kubernetes
You can configure collecting Kubernetes data using a standard data source with the Onboard Kubernetes wizard:
| Collection Method | Description |
|---|---|
| Standard data source overview | The Kubernetes onboarding wizard is designed to facilitate the seamless setup of Kubernetes data into Cortex XSIAM and deploys your Kubernetes Connector. |
| Link to standard data source instructions | <p>Onboard the Kubernetes Connector </p><p>Other relevant topic:</p><ul><li>What's new in Kubernetes Connector?</li><li>Supported Kubernetes distributions</li></ul> |
Onboard the Kubernetes connector
License
This feature is included with a Cortex XSIAM Premium license. It is also included with any other Cortex XSIAM license that has the Cloud Runtime Security add-on.
Follow this wizard to deploy your Kubernetes Connector. The Kubernetes onboarding wizard is designed to facilitate the seamless setup of Kubernetes data into Cortex XSIAM. The guided experience requires minimal user input; simply select the capabilities that fit your needs and download the custom installer file. For full control of the setup, you can use the advanced settings. Based on the onboarding settings, Cortex XSIAM then creates a custom installer file for running in your Kubernetes environment. This file, once executed in your Kubernetes environment, grants Cortex XSIAM the necessary permissions to collect the data. The installer file must be executed in your Kubernetes environment to complete the onboarding process. The connector then appears in Kubernetes Connectors.
- Navigate to Settings → Data Sources & Integrations.
- On the Add Data Sources & Integrations page, click Create Integration, search for Kubernetes, then hover over it and click Add Another Instance.
- In the Kubernetes Connect onboarding wizard, enable the solutions that fit your needs:
- Posture Management: (Enabled by default) A lightweight posture management solution for continuous discovery, policy enforcement, and proactive scanning of vulnerabilities, secrets, malware, compliance, and misconfigurations.
- Realtime Protection: A solution that monitors workloads in real time to detect and block malicious activity, instantly preventing attacks as they happen.
-
(Optional) Click Edit to configure advanced settings and then click Apply Changes:
- Posture Management:
Setting Notes Scan Cadence (Hours) Define how often to scan (from every one to 24 hours). Default is 12 hours. Policy Enforcement by the Admission Controller Select to allow enforcement policies to be configured, ensuring that only compliant resources are admitted into the cluster. Registry Scanning (OpenShift Only) <p>Select this option to scan OpenShift Platform Registry images for vulnerabilities, malware, and exposed secrets.
Select the scanning configuration option to enable security checks for your images:</p><ul><li>All (Default) Scans all container images, including all versions (tags), in all discovered repositories.</li><li>Latest tag: Scans only images tagged 'latest' in all discovered repositories.</li><li>Day modified: Scans container images created or modified in the last few days. You can select a range of up to 90 days for the scan. The default is set to 7.</li></ul><p>Refer to OpenShift container registry for information on the instances that were automatically created by the Kubernetes deployment.OpenShift container registry</p>- Realtime Protection:
Note
This option is not supported for Fargate.
Note
Enabling Realtime Protection installs the agent on your Kubernetes clusters as a DaemonSet.
Setting Notes Node Selector <p>Enter node labels to have the agent run on nodes that match the node labels. Ensure that you use the key:valueformat.
Note
Duplicate keys are not allowed.</p>Run on all nodes (Including Master)/Run only on master node Select one of the options. Endpoint tags Select endpoint tags to assign to agents during installation. You can refer to the full list of tags under All endpoints after the agent installation is complete. Deployment Platform <p>Select the Kubernetes deployment platform:</p><ul><li>Standard</li><li>Bottlerocket OS</li><li>Google GCOS</li><li>OpenShift</li></ul> - (Optional) Click Edit Profile to customize the Kubernetes Connector's profile:
| Setting | Notes |
|---|---|
| Profile Name | A profile name is automatically generated, including the date and time of creation. You can manually change the profile name. |
| Version | <p>Lists the most up-to-date KSPM connector bundle versions available:</p><ul><li>2.0.- Current series with private registry support and on-demand scanning</li><li>1.4. - Legacy series</li></ul> |
| Cluster Resource Identifier | <p>(Optional) Enter the Kubernetes cluster resource identifier. If you do not specify the resource identifier, the installer will identify the cluster on its own. Note For Fargate, you must provide the cluster resource identifier. The format of the identifier is arn:aws:eks:<region>:<account-id>:cluster/<cluster-name>.</p> |
| Namespace | <p>Enter the name for the Kubernetes namespace. The default is "panw". To ensure proper data parsing in an AWS Fargate environment, a Fargate Profile must be explicitly configured for the namespace where the connector is installed (typically panw) and for the kube-system namespace if the cluster is fully Fargate-based. Because the system identifies Fargate clusters by scanning for active workloads during deployment, a Fargate profile that contains no running pods will not be recognized as such. Furthermore, since this detection occurs at installation, any transition from EC2 to Fargate requires an agent update to trigger a new scan and ensure the environment is correctly identified and monitored.</p> |
| Proxy Gateway | <p>Enable this option if network traffic between Cortex XSIAM and your Kubernetes cluster must route through a proxy gateway. Enter the following details:</p><ul><li>Proxy IP: The full IP address and port number for your HTTP proxy server. For example: 192.168.1.1:8080</li><li>Authentication: Select None or Basic. Enter the username and password for a proxy user account that has permission to pass traffic to the Kubernetes cluster.Note Basic authentication is only supported in Posture Management. If deploying Realtime Protection, select None .</li></ul> |
| Auto Upgrade | <p>Enable Auto Upgrade to ensure the Kubernetes Connector and its installed capabilities are automatically updated to a newer version when available. This minimizes manual maintenance and ensures continuous access to the latest features and security patches. Select the Upgrade Strategy:</p><ul><li>Latest Available Version (GA): Automatically upgrade to the newest version as soon as it is released to gain immediate access to all new features.</li><li>One release before the latest one (N-1): Maintain a policy to always remain one version behind the latest available release.</li></ul><div data-gb-custom-block data-tag="hint" data-style="info" class="hint hint-info"><p>Note</p><p>If you install the latest version but select the N-1 strategy, this policy will take effect starting from the next upgrade cycle (it will not immediately downgrade your current installation). If you choose an older version and keep the latest strategy, the latest version will be installed.</p></div><p>Select Advanced to customize the upgrade schedule. Define whether to be upgraded immediately or to delay the upgrade by a specified number of days. You can then specify the preferred day and time for the upgrade to be applied.</p> |
- Click Generate.
- To complete the onboarding of the Kubernetes Connector, follow the steps under How do I install?
- Verify the deployment succeeded when you see Status: Deployed. When the Kubernetes Connector is deployed, the initial discovery scan is started, and the connector appears in Data Sources & Integrations → Kubernetes → Kubernetes Connectors.
What's new in Kubernetes connector
This topic describes the changes, additions, known issues, and fixes for each version of the Kubernetes Connector. If Auto Upgrade is enabled in your Kubernetes Connector, you will automatically enjoy the latest released features without having to manually upgrade to the new version.
Kubernetes Connector releases
Cortex XSIAM supports the following current Kubernetes Connector versions. Click the link to view the new features, addressed issues, and known issues per release.
| Release version | Release notes | Release date |
|---|---|---|
| 2.2 | Kubernetes Connector version 2.2 | July 26, 2026 |
| 2.0 | Kubernetes Connector version 2.0 | May 3, 2026 |
| 1.4 | Kubernetes Connector version 1.4 | Jan 11, 2026 |
| 1.3 | Kubernetes Connector version 1.3 | Nov 9, 2025 |
| 1.2 | Kubernetes Connector version 1.2 | July 20, 2025 |
Kubernetes Connector version 2.2
New features
The following section describes the new features introduced in Kubernetes Connector version 2.2.
| Feature | Description |
|---|---|
| Introducing Kubernetes Pods in Cortex Cloud | <p>Protect Kubernetes Pods from misconfigurations. Kubernetes Pods deployed directly, or modified by other webhooks after their controller was approved, previously bypassed all compliance and image-trust checks. We now provide complete Kubernetes Pod support across inventory tracking, detailed asset visibility, compliance scanning, admission control prevention, and comprehensive container inspection. This closes critical security gaps identified by customers running workloads directly as pods instead of through controllers. • Pods in Cortex Cloud inventory: Cortex Cloud now provides a dedicated asset page for Kubernetes Pods in the inventory. The Kubernetes Pods page includes a relationship graph that shows how a pod connects to related Kubernetes resources. Pods are now available on Search Graph as well for discovery and investigation. • Containers table: Added a new Containers tab for Kubernetes Pod Group assets in Cortex Cloud Inventory, providing complete visibility into pod composition and container details. Use the Kubernetes Pod to investigate the security posture of individual pods and the containers that run in each pod. • Collection & Modeling: Implemented pod collection in the inventory with performance optimization for large clusters and pod-to-runtime-image relationships for complete asset tracking. This supports both K8s Connector agent and K8s Agentless deployments. • Compliance & Rules: Added Kubernetes Pod support to the compliance views, including system-rule validation for pod-scoped rego rules. This enables compliance checks on pods alongside traditional workload controllers. Custom compliance rules now support pods. • Prevention & Admission Control: Kubernetes Pods are now supported as part of CWP rules and policies, enabling the admission controller to block non-compliant pods and prevent misconfigurations at creation time.</p><p>NOTE: A Kubernetes Pod Group asset represents all the identical pod replicas of a Kubernetes workload in a single unique inventory asset. The uniqueness is derived by the Kubernetes workload owner unique identifier.</p> |
| Cluster deployment method visibility | Understand how your clusters are being connected and scanned by Cortex Cloud. The cluster inventory now displays the deployment method (Agentless, Connector or None) for each cluster, along with connectivity status. This gives you immediate visibility into your scanning infrastructure and helps you identify which clusters are using agentless scanning versus connector-based approaches and which clusters are not connected at all. |
| Agentless Kubernetes security for GCP and Azure | Automatically onboard and secure all Kubernetes clusters across your GCP and Azure accounts without manual deployment. Monitor cluster inventory, vulnerabilities, malware, secrets, and misconfigurations, automatically discovering new clusters as they are added to your account. |
Kubernetes Connector version 2.0
New features
The following section describes the new features introduced in Kubernetes Connector version 2.0.
| Feature | Description |
|---|---|
| Agentless Kubernetes security | Expanded Agentless Kubernetes security helps eliminate security blind spots and reduces deployment friction by delivering visibility into inventory, compliance, and runtime images across AWS Kubernetes and containers. |
| Unified Kubernetes cluster management | Manage your infrastructure from a single, streamlined interface. You can now access all controls directly from the Kubernetes Clusters page instead of navigating legacy connectivity screens. We consolidated these tools into a unified view to simplify your workflow and remove unnecessary navigation steps. |
| Enhanced security and deployment for Kubernetes Connectors | <p>Minimize your attack surface by applying stricter security controls to your Kubernetes connectors. Recent updates include:</p><ul><li>Private registry support: You can now pull images directly from private container registries.</li><li>GitOps integration: The standalone installer now fully supports GitOps workflows.</li><li>Least privilege enforcement: Restrict connector management to specific namespaces rather than the entire cluster. We have narrowed the access scope and removed unnecessary secret creation permissions to better protect your environment.</li></ul> |
| Tag Kubernetes endpoints instantly | Automate your security deployment. Our new tag support for Kubernetes lets you seamlessly associate XDR security profiles with specific connectors during configuration. |
| Enhanced KSPM Graph | We've introduced several design improvements to the KSPM Graph, focused on streamlining your user experience. You can now more intuitively explore the relationships between your workloads, nodes, and cloud resources to seamlessly map and manage your cluster topology and security posture. |
| Maintain system availability | Maintain system availability during unexpected disruptions. You can now choose whether to allow or block requests if the admission controller is unreachable. We added a Failure Policy setting to give you full control over your environment's stability. |
| On-demand Kubernetes cluster scans | Secure your environment instantly. You no longer have to wait for scheduled cycles to evaluate newly deployed resources, including your inventory, containers, and nodes. We added a "Request Scan" button and API support so you can trigger on-demand cluster scans and see results in minutes. |
| Optimized resource usage | Optimize system performance by eliminating redundant security scans. Your devices run more efficiently because the XDR agent automatically disables Adaptive Vulnerability Assessment (AVA) when a KSPM connector is deployed. The KSPM posture module now handles the AVA scan directly to save local resources. |
Known limitations
Refer to KSPM limitations and system components for known limitations.
Kubernetes Connector version 1.4
New features
The following section describes the new features introduced in Kubernetes Connector version 1.4.
| Feature | Description |
|---|---|
| Secure OpenShift with container image scanning | Strengthen your software supply chain by identifying vulnerabilities earlier in the development lifecycle. Cortex Cloud KSPM now offers direct integration with the OpenShift Internal Registry, allowing you to automatically scan and secure images as soon as they are pushed to the registry . By leveraging the existing Kubernetes connector, you can now extend your security coverage to images stored in the registry. |
| Interactive KSPM Graph (Beta) | Visualize your Kubernetes security posture across supported Kubernetes clusters using the new KSPM Graph. It provides an interactive visualization that maps relationships across your clusters, specifically illustrating Workload-to-Image relationships within Kubernetes Namespaces. It overlays critical security context, such as misconfigurations and detected vulnerabilities, directly onto the graph topology. This allows security and operations teams to quickly identify asset dependencies, correlate risk, and efficiently prioritize where to focus their response. |
| Container image security scanning | Cortex Cloud expands its security coverage beyond agentless and agent-based scans with a Kubernetes-native container image and container drift scanning capability. Powered by the lightweight KSPM connector, it provides consistent detection of misconfigurations, vulnerabilities, malware, and exposed secrets across Kubernetes environments, managed or on-prem, where agentless disk scanning is not available. |
| KSPM support for AWS EKS Fargate clusters | Gain comprehensive security visibility into container images, inventory, and compliance reporting for your nodeless clusters. We now support deploying the Kubernetes Connector directly onto AWS EKS Fargate environments. |
| KSPM support for Rancher | Simplify security and gain central visibility across all your Rancher-managed Kubernetes clusters. The Kubernetes Connector now supports K3s, RKE, and RKE2 clusters. This allows you to unify security posture management, asset inventory, and compliance reporting for your Rancher-managed clusters alongside all other supported cloud and on-premises environments, ensuring consistent security policy enforcement across your entire infrastructure. |
| Simplified navigation for Kubernetes Security | KSPM now has a dedicated navigation section under Modules. |
Known limitations
Refer to KSPM limitations and system components for known limitations.
Kubernetes Connector version 1.3
New features
The following section describes the new features introduced in Kubernetes Connector version 1.3.
| Feature | Description |
|---|---|
| Unified Kubernetes Onboarding | Streamlined Kubernetes onboarding process in a single, easy-to-use wizard. Now you can discover all available security capabilities based on your license, configure everything in one flow, and deploy your entire solution with one consolidated installer. |
| Kubernetes Connector | Supports AKS, EKS, GKE, managed OpenShift, self-managed Kubernetes vanilla clusters, and self-managed OpenShift with a Kubernetes Native installation method of Helm Installer. For more details, see Supported Kubernetes distributions. |
| KSPM Dashboard | A visual overview of your Kubernetes security posture. It includes inventory insights, protection coverage, most vulnerable clusters, malware and secrets detected, and more. |
| Compliance standards | Enjoy out-of-the-box CIS compliance standards for Kubernetes environments (CIS EKS, CIS GKE, CIS AKS, CIS OpenShift, and CIS Kubernetes). |
| Secrets, malware, and vulnerabilities | Generate secret, malware, and vulnerabilities posture issues by declaring policies on Kubernetes clusters |
Known limitations
The following table describes known limitations in the Kubernetes Connector release.
| Feature | Description |
|---|---|
| Connector onboarding and cluster identifier | <p>The Kubernetes Connector automatically calculates the Kubernetes cluster cloud identifier by using the metadata service (for EKS and GKE) and cluster resources (for AKS).</p><ul><li>For EKS and GKE, the metadata service must be enabled.</li></ul> |
Kubernetes Connector version 1.2
New features
The following section describes the new features introduced in Kubernetes Connector version 1.2.
| Feature | Description |
|---|---|
| Kubernetes Connector Onboarding | Supports AKS, EKS, GKE, managed OpenShift, and self-managed Kubernetes Vanilla clusters, with a Kubernetes Native installation method of Helm Installer. |
| KSPM Dashboard | A visual overview of your Kubernetes security posture. It includes inventory insights, protection coverage, riskiest clusters, and more. |
| Compliance standards | Enjoy out-of-the-box CIS compliance standards for Kubernetes environments (CIS EKS, CIS GKE, CIS AKS, CIS OpenShift, and CIS Kubernetes). |
| Secrets, malware, and vulnerabilities | Generate secret, malware, and vulnerabilities posture issues by declaring policies on Kubernetes clusters |
| AWS WAF Detection | Detect the presence of AWS WAF protecting Internet-exposed assets |
Known limitations
The following table describes known limitations in the Kubernetes Connector release.
| Feature | Description |
|---|---|
| Connector onboarding and cluster identifier | <p>The Kubernetes Connector automatically calculates the Kubernetes cluster cloud identifier by using the metadata service (for EKS and GKE) and cluster resources (for AKS).</p><ul><li>For EKS and GKE, the metadata service must be enabled.</li></ul> |
Supported Kubernetes distributions
The following are the supported Kubernetes platform versions for the Kubernetes connector (Posture Management). The table shows the latest version that is supported. We support n-3 versions of each supported Kubernetes environment.
| Kubernetes environment | Notes |
|---|---|
| Managed clusters | <ul><li><p>Amazon Elastic Kubernetes Service (EKS)</p><div data-gb-custom-block data-tag="hint" data-style="info" class="hint hint-info"><p>Note</p><p>Does not include EKS AutoMode.</p></div></li><li>Microsoft Azure Kubernetes Service (AKS)</li><li><p>Google Kubernetes Engine (GKE)</p><div data-gb-custom-block data-tag="hint" data-style="info" class="hint hint-info"><p>Note</p><p>Does not include Autopilot.</p></div></li></ul> |
| Managed OpenShift | <p>Managed OpenShift clusters are supported:</p><ul><li>Red Hat OpenShift Container Platform (OCP)- Self-hosted: 4.21.8 (Kubernetes 1.34.5)</li><li>Red Hat OpenShift Container Platform (OCP)- ROSA (AWS): 4.20.15 (Kubernetes 1.33.5)</li><li>Red Hat OpenShift Container Platform (OCP)- ARO (Azure): 4.20.15 (Kubernetes 1.33.6)</li></ul> |
| Self-Managed | <p>We support every CNCF-certified Kubernetes solution. We've tested our solution on:</p><ul><li>Self-managed vanilla/on-premise Kubernetes clusters.</li><li>Self-managed OpenShift Kubernetes clusters.</li><li>Rancher Distributions (RKE and RKE2).</li></ul> |
Refer to the Kubernetes platforms supported page for the latest versions.
Kustomer
Here are the articles in this section:
Kustomer
The capabilities and sub-capabilities listed for this connector are available with any active Cortex XSIAM or Cortex Cloud Posture Security license.
This connector includes the following capabilities and sub-capabilities (if applicable):
- Security posture: Detect, monitor and alert on settings of your SaaS application.
saas-posture-config-remediation: Help remediate the misconfigured security settings of your SaaS application.
To configure this connector, follow the steps outlined in the configuration wizard.
LastPass
Here are the articles in this section:
LastPass
The capabilities and sub-capabilities listed for this connector are available with any active Cortex XSIAM or Cortex Cloud Posture Security license.
This connector includes the following capabilities and sub-capabilities (if applicable):
- Security Posture: Detect, monitor and alert on settings of your SAAS application.
- saas-posture-config-remediation: Help remediate the misconfigured security settings of your SAAS application.
To configure this connector, follow the steps outlined in the configuration wizard.
Lastline
Here are the articles in this section:
Lastline
Important
This connector is only available for tenants that onboarded after July 26, 2026. For tenants that onboarded before this date, use Marketplace to access the standalone integration. For more information, see Marketplace.
This connector is available with any active Cortex XSIAM or Cortex AgentiX license.
Provides threat analysts and issue response teams with the advanced malware isolation and inspection environment needed to safely execute advanced malware samples and understand their behavior. Detonate both files and URLs.
This connector includes the following sub-capabilities (Marketplace integrations link to PAN DEV for more information):
- Lastline v2: Use the Lastline v2 integration to provide threat analysts and incident response teams with the advanced malware isolation and inspection environment needed to safely execute advanced malware samples, and understand their behavior.
To configure this connector, follow the steps outlined in the configuration wizard.
LevelBlue
LevelBlue
Important
This connector is only available for tenants that onboarded after July 26, 2026. For tenants that onboarded before this date, use Marketplace to access the standalone integration. For more information, see Marketplace.
This connector is available with any active Cortex XSIAM or Cortex AgentiX license.
Trustwave Secure Email Gateway (SEG) is a secure messaging solution that protects businesses and users from email-borne threats, including phishing, blended threats, and spam. It also delivers improved policy enforcement and data leakage prevention.
This connector includes the following sub-capabilities (Marketplace integrations link to PAN DEV for more information):
To configure this connector, follow the steps outlined in the configuration wizard.
LogRhythm
LogRhythm
Important
This connector is only available for tenants that onboarded after July 26, 2026. For tenants that onboarded before this date, use Marketplace to access the standalone integration. For more information, see Marketplace.
This connector is available with any active Cortex XSIAM or Cortex AgentiX license.
Integrate with LogRhythm using its REST API to deliver security operations across your enterprise IT environment. Execute queries on logs, get host information, add new hosts and update host status, and query and update alarms. Retrieve case summaries, create new cases, or update the properties of a case; manage tags and lists; and fetch cases and alarms as issues.
This connector includes the following sub-capabilities (Marketplace integrations link to PAN DEV for more information):
- LogRhythmRest: LogRhythm security intelligence.
- LogRhythmRest V2: LogRhythm security intelligence.
To configure this connector, follow the steps outlined in the configuration wizard.
LOLBAS
LOLBAS
Important
This connector is only available for tenants that onboarded after July 26, 2026. For tenants that onboarded before this date, use Marketplace to access the standalone integration. For more information, see Marketplace.
This connector is available with any active Cortex XSIAM, Cortex XDR, or Cortex AgentiX license.
Import Living Off The Land Binaries, Scripts and Libraries (LOLBAS) into the Threat Intelligence Management (TIM) module for security investigations and threat hunting activities. "Living off the land binaries" describes malware or hacking techniques that abuse legitimate tools and processes already present on a system to blend in with normal activity and avoid detection. The LOLBAS project documents binaries, scripts, and libraries that can be used for these techniques.
This connector includes the following sub-capabilities (Marketplace integrations link to PAN DEV for more information):
To configure this connector, follow the steps outlined in the configuration wizard.
Lookout
Lookout
Important
This connector is only available for tenants that onboarded after July 26, 2026. For tenants that onboarded before this date, use Marketplace to access the standalone integration. For more information, see Marketplace.
This connector is available with any active Cortex XSIAM or Cortex AgentiX license.
Lookout Mobile Endpoint Security (MES) protects mobile devices from threats such as phishing, malware, network attacks, and device vulnerabilities using AI-driven threat intelligence. Use this connector to automatically collect events from Lookout Mobile Endpoint Security. This integration was integrated and tested with version v2 of the Mobile Risk API.
This connector includes the following sub-capabilities (Marketplace integrations link to PAN DEV for more information):
- LookoutMobileEndpointSecurity: Lookout Mobile Endpoint Security (MES) provides visibility and protection against mobile threats with AI-driven mobile security dataset.
To configure this connector, follow the steps outlined in the configuration wizard.
Lumu
Here are the articles in this section:
Lumu
Important
This connector is only available for tenants that onboarded after July 26, 2026. For tenants that onboarded before this date, use Marketplace to access the standalone integration. For more information, see Marketplace.
This connector is available with any active Cortex XSIAM or Cortex AgentiX license.
Analyze suspicious hashes, URLs, domains, and IP addresses with Maltiverse. Enrich indicators, retrieve reputation data, and calculate reputation scores across different IOC types.
This connector includes the following sub-capabilities (Marketplace integrations link to PAN DEV for more information):
- Maltiverse: Use the Maltiverse integration to analyze suspicious hashes, URLs, domains and IP addresses.
To configure this connector, follow the steps outlined in the configuration wizard.
Mail Utilities
Here are the articles in this section:
Mail Utilities
Important
This connector is only available for tenants that onboarded after July 26, 2026. For tenants that onboarded before this date, use Marketplace to access the standalone integration. For more information, see Marketplace.
Mail Utilities lets you listen to a mailbox and spawn an issue from received email, and send emails including rich HTML and embedded files. It includes the Mail Listener v2 and MailListener - POP3 integrations for fetching mail, and the Mail Sender (New) integration for sending mail.
This connector includes the following sub-capabilities (Marketplace integrations link to PAN DEV for more information):
- Mail Listener v2: Listens to a mailbox and enables incident triggering via e-mail. This sub-capability is available with any active Cortex XSIAM or Cortex AgentiX license.
- Mail Sender (New): Send emails implemented in Python with embedded image support. This sub-capability is available with any active Cortex XSIAM, Cortex Cloud Posture Security, Cortex Cloud, Cortex Cloud Runtime Security, Cortex XDR, or Cortex AgentiX license.
- MailListener - POP3: Listen to a mailbox, enable incident triggering via e-mail. This sub-capability is available with any active Cortex XSIAM or Cortex AgentiX license.
To configure this connector, follow the steps outlined in the configuration wizard.
Majestic
Here are the articles in this section:
Majestic
Important
This connector is only available for tenants that onboarded after July 26, 2026. For tenants that onboarded before this date, use Marketplace to access the standalone integration. For more information, see Marketplace.
This connector is available with any active Cortex XSIAM or Cortex AgentiX license.
This feed integration ingests the top most common web site addresses as 'good' indicators from the Majestic Million feed.
This connector includes the following sub-capabilities (Marketplace integrations link to PAN DEV for more information):
- Majestic Million: Free search and download of the top million websites.
To configure this connector, follow the steps outlined in the configuration wizard.
ManageEngine
Here are the articles in this section:
ManageEngine
Important
This connector is only available for tenants that onboarded after July 26, 2026. For tenants that onboarded before this date, use Marketplace to access the standalone integration. For more information, see Marketplace.
Integrate with Zoho Corporation products. ManageEngine Endpoint Central is a unified endpoint management (UEM) platform that manages and secures servers, desktops, laptops, and mobile devices from a single console, and serves as an event collector for audit logs. Service Desk Plus is an IT service management (ITSM) solution for fetching and managing service desk requests.
This connector includes the following sub-capabilities (Marketplace integrations link to PAN DEV for more information):
- ManageEngine: This sub-capability is available with any active Cortex XSIAM license.
- ServiceDeskPlus: Use this integration to manage on-premises and cloud Service Desk Plus requests. The integration allows you to create, update, and delete requests, assign groups and technicians to requests, and link/unlink requests and modify their resolution. This sub-capability is available with any active Cortex XSIAM or Cortex AgentiX license.
To configure this connector, follow the steps outlined in the configuration wizard.
Mattermost
Here are the articles in this section:
Mattermost
Important
This connector is only available for tenants that onboarded after July 26, 2026. For tenants that onboarded before this date, use Marketplace to access the standalone integration. For more information, see Marketplace.
This connector is available with any active Cortex XSIAM or Cortex AgentiX license.
Mattermost is an open-source, self-hostable online chat service with file sharing, search, and integrations, designed as an internal chat for organizations and companies. This connector integrates with Mattermost to send messages and notifications, and to mirror investigations.
This connector includes the following sub-capabilities (Marketplace integrations link to PAN DEV for more information):
- MattermostV2: Mattermost is an open-source, self-hostable online chat service with file sharing, search, and integrations. It is designed as an internal chat for organizations and companies.
To configure this connector, follow the steps outlined in the configuration wizard.
MaxMind
Here are the articles in this section:
MaxMind
Important\
This connector is only available for tenants that onboarded after July 26, 2026. For tenants that onboarded before this date, use Marketplace to access the standalone integration. For more information, see Marketplace.
This connector is available with any active Cortex XSIAM or Cortex AgentiX license.
The MaxMind GeoIP2 integration allows you to query the MaxMind API service and retrieve a JSON of all details.
This connector includes the following sub-capabilities (Marketplace integrations link to PAN DEV for more information):
- MaxMind GeoIP2: Enriches IP addresses.
To configure this connector, follow the steps outlined in the configuration wizard.
Menlo Security
Here are the articles in this section:
Menlo Security
Important
This connector is only available for tenants that onboarded after July 26, 2026. For tenants that onboarded before this date, use Marketplace to access the standalone integration. For more information, see Marketplace.
This connector is available with any active Cortex XSIAM license.
The cloud-based Menlo Security Isolation Platform (MSIP) eliminates the possibility of malware reaching user devices via compromised or malicious web sites, email, or documents. This integration collects logs from the MSIP Logging API and sends them to Cortex.
This connector includes the following sub-capabilities (Marketplace integrations link to PAN DEV for more information):
- Menlo Security: Collects web, email, audit, SMTP, attachment, DLP, HEAT, firewall, bandwidth, auth flows, and Menlo Security Client logs from the Menlo Security Isolation Platform (MSIP).
To configure this connector, follow the steps outlined in the configuration wizard.
Meta
Here are the articles in this section:
Meta
This connector is only available for tenants that onboarded after July 26, 2026. For tenants that onboarded before this date, use Marketplace to access the standalone integration. For more information, see Marketplace.
This connector is available with any active Cortex XSIAM or Cortex AgentiX license.
Receive threat intelligence about applications, IP addresses, URLs, and hashes from Meta's ThreatExchange, a service by Facebook.
This connector includes the following sub-capabilities (Marketplace integrations link to PAN DEV for more information):
- ThreatExchange v2: Receive threat intelligence about applications, IP addresses, URLs, and hashes. A service by Facebook.
To configure this connector, follow the steps outlined in the configuration wizard.
Mimecast
Here are the articles in this section:
Mimecast
Important
This connector is only available for tenants that onboarded after July 26, 2026. For tenants that onboarded before this date, use Marketplace to access the standalone integration. For more information, see Marketplace.
The Mimecast platform offers protection against email threats and data leaks while preventing service downtime through email archiving and uptime services. Use this connector to fetch Audit and SIEM events with the Mimecast Event Collector v2, and to run automation and fetch issues with Mimecast v2.
This connector includes the following sub-capabilities (Marketplace integrations link to PAN DEV for more information):
- Mimecast Event Collector v2: Use the Mimecast Event Collector v2 integration to fetch Audit events and SIEM logs for various SIEM event types, using API 2.0 with OAuth2 authentication. This sub-capability is available with any active Cortex XSIAM license.
- MimecastV2: Mimecast unified email management offers cloud email services for email security, continuity and archiving emails. Please read detailed instructions in order to understand how to set the integration's parameters. This sub-capability is available with any active Cortex XSIAM or Cortex AgentiX license.
To configure this connector, follow the steps outlined in the configuration wizard.
Microsoft
Here are the articles in this section:
- azure-devops
- azure-event-hub
- azure-firewall
- azure-network-watcher
- microsoft-azure
- microsoft-copilot-studio
- microsoft-defender-for-endpoint-events
- microsoft-entra-id
- microsoft-office-365
- microsoft-office-365-email
- microsoft-365-posture
- microsoft-teams
- azure-log-analytics
- azure-services
- azure-waf
- microsoft-active-directory
- microsoft-identity
- microsoft-intune
- microsoft-security-automation-and-collection
- microsoft-windows-tools
- m365-automation-and-collection
Azure DevOps
Important
This connector is only available for tenants that onboarded after July 26, 2026. For tenants that onboarded before this date, use Marketplace to access the standalone integration. For more information, see Marketplace.
This connector is available with any active Cortex XSIAM or Cortex AgentiX license.
Manage Git repositories in Azure DevOps Services. Integration capabilities include retrieving, creating, and updating pull requests, running pipelines, and retrieving Git information. Microsoft Azure DevOps Server provides version control, reporting, requirements management, project management, automated builds, testing, and release management capabilities across the entire application lifecycle.
This connector includes the following sub-capabilities (Marketplace integrations link to PAN DEV for more information):
- AzureDevOps: Manage Git repositories in Azure DevOps Services. Integration capabilities include retrieving, creating, and updating pull requests. Run pipelines and retrieve Git information.
To configure this connector, follow the steps outlined in the configuration wizard.
Azure Event Hub
You can configure collecting Azure Event Hub logs using a standard data source or content pack (onboarded prior to July 26, 2026):
| Collection Method | Description |
|---|---|
| Standard data source overview | Forward different types of logs to Cortex XSIAM from Azure Event Hub using the Microsoft Azure Event Hub data source. |
| Link to standard data source instructions | <p>The following types of logs can be ingested from Azure Event Hub:</p><ul><li>Activity logs</li><li>Microsoft Entra ID Activity logs and Microsoft Entra ID Sign-in logs</li><li>Resource logs, including AKS audit logs</li></ul><p>For more information, see Ingest logs from Microsoft Azure Event Hub.</p> |
| Link to content pack details (onboarded prior to July 26, 2026) | Azure Logs: Use this content pack to ingest and normalize various Azure logs to the Cortex Data Model (XDM) schema, including Azure Entra ID events ingested via the Office 365 data source, and Azure Logs ingested via the Microsoft Azure Event Hub data source. It includes modeling and parsing rules for log normalization. |
Ingest logs from Microsoft Azure Event Hub
Cortex XSIAM can ingest different types of data from Microsoft Azure Event Hub using the Microsoft Azure Event Hub data collector. To receive logs from Azure Event Hub, you must configure the settings in Cortex XSIAM based on your Microsoft Azure Event Hub configuration. After you set up data collection, Cortex XSIAM begins receiving new logs and data from the source.
When Cortex XSIAM begins receiving logs, the app creates a new dataset (MSFT_Azure_raw) that you can use to initiate XQL Search queries. For example, queries refer to the in-app XQL Library. For enhanced cloud protection, you can also configure Cortex XSIAM to normalize Azure Event Hub audit logs, including Azure Kubernetes Service (AKS) audit logs, with other Cortex XSIAM authentication stories across all cloud providers using the same format, which you can query with XQL Search using the cloud_audit_logs dataset. For logs that you do not configure Cortex XSIAM to normalize, you can change the default dataset. Cortex XSIAM can also generate Cortex XSIAM issues (Analytics, IOC, BIOC, and Correlation Rules) when relevant from Azure Event Hub logs. While Correlation Rules issues are generated on non-normalized and normalized logs, Analytics, IOC, and BIOC issues are only raised on normalized logs.
Enhanced cloud protection provides:
- Normalization of cloud logs
- Cloud logs stitching
- Enrichment with cloud data
- Detection based on cloud analytics
- Cloud-tailored investigations
Warning
- Misconfiguration of Event Hub resources could cause ingestion delays.
- In an existing Event Hub integration, do not change the mapping to a different Event Hub.
- Do not use the same Event Hub for more than two purposes.
The following table provides a brief description of the different types of Azure audit logs you can collect.
Note
For more information on Azure Event Hub audit logs, see Overview of Azure platform logs.
| Type of data | Description |
|---|---|
| Activity logs | <p>Retrieves events related to the operations on each Azure resource in the subscription from the outside in addition to updates on Service Health events.</p><div data-gb-custom-block data-tag="hint" data-style="info" class="hint hint-info"><p>Note These logs are from the management plane.</p></div> |
| Microsoft Entra ID Activity logs and Microsoft Entra ID Sign-in logs | <p>Contain the history of sign-in activity and audit trail of changes made in Microsoft Entra ID (formerly Azure AD) for a particular tenant.</p><div data-gb-custom-block data-tag="hint" data-style="info" class="hint hint-info"><p> Note Even though you can collect Microsoft Entra ID Activity logs and Microsoft Entra ID Sign-in logs using the Azure Event Hub data collector, we recommend using the Microsoft Office 365 data collector, because it is easier to configure. Do not configure both collectors for the same log types. Doing so creates duplicate data in Cortex XSIAM. </p></div> |
| Resource logs, including AKS audit logs | <p>Retrieves events related to operations that were performed within an Azure resource.</p><div data-gb-custom-block data-tag="hint" data-style="info" class="hint hint-info"><p>Note These logs are from the data plane.</p></div> |
Prerequisite
Ensure that you do the following tasks before you begin configuring data collection from Azure Event Hub.
- Before you set up an Azure Event Hub, calculate the quantity of data that you expect to send to Cortex XSIAM, taking into account potential data spikes and potential increases in data ingestion, because partitions cannot be modified after creation. Use this information to ascertain the optimal number of partitions and Throughput Units (for Azure Basic or Standard) or Processing Units (for Azure Premium). Configure your Event Hub accordingly.
- Create an Azure Event Hub. We recommend using a dedicated Azure Event Hub for this Cortex XSIAM integration. For more information, see Quickstart: Create an event hub using Azure portal.
- Each partition can support a throughput of up to 1 MB/s.
- Ensure the format for the logs you want collected from the Azure Event Hub is either JSON or raw.
Configure the Azure Event Hub collection in Cortex XSIAM:
- In the Microsoft Azure console, open the Event Hubs page, and select the Azure Event Hub that you created for collection in Cortex XSIAM.
- Record the following parameters from your configured event hub, which you will need when configuring data collection in Cortex XSIAM.
- Your event hub’s consumer group.
- Select Entities → Event Hubs, and select your event hub.
- Select Entities → Consumer groups, and select your event hub.
- In the Consumer group table, copy the applicable value listed in the Name column for your Cortex XSIAM data collection configuration.
- Your event hub’s connection string for the designated policy.
- Select Settings → Shared access policies.
- In the Shared access policies table, select the applicable policy.
- Copy the Connection string-primary key.
- Your storage account connection string required for partitions lease management and checkpointing in Cortex XSIAM.
- Open the Storage accounts page, and either create a new storage account or select an existing one, which will contain the storage account connection string.
- Select Security + networking → Access keys, and click Show keys.
- Copy the applicable Connection string.
-
Configure diagnostic settings for the relevant log types you want to collect and then direct these diagnostic settings to the designated Azure Event Hub.
- Open the Microsoft Azure console.
-
Your navigation is dependent on the type of logs you want to configure.
Log type Navigation path Activity logs Select Azure services → Activity log → Export Activity Logs, and +Add diagnostic setting. Microsoft Entra ID Activity logs and Microsoft Entra ID Sign-in logs <p>1. Select Azure services → Azure Active Directory.
2. Select Monitoring → Diagnostic settings, and +Add diagnostic setting.</p>Resource logs, including AKS audit logs <p>1. Search for Monitor, and select Settings → Diagnostic settings.
2. From your list of available resources, select the resource that you want to configure for log collection, and then select +Add diagnostic setting.</p><div data-gb-custom-block data-tag="hint" data-style="info" class="hint hint-info"><p>Note</p><p>For every resource that you want to configure, you'll have to repeat this step, or use Azure policy for a general configuration.</p></div>
c. Set the following parameters:
- Diagnostic setting name: Specify a name for your Diagnostic setting.
-
Logs Categories/Metrics: The options listed are dependent on the type of logs you want to configure. For Activity logs and Microsoft Entra ID logs and Microsoft Entra ID Sign-in logs, the option is called Logs Categories, and for Resource logs it's called Metrics.
Log type Log categories/metrics Activity logs <p>Select from the list of applicable Activity log categories, the ones that you want to configure your designated resource to collect. We recommend selecting all of the options.</p><ul><li>Administrative</li><li>Security</li><li>ServiceHealth</li><li>Alert</li><li>Recommendation</li><li>Policy</li><li>Autoscale</li><li>ResourceHealth</li></ul> Microsoft Entra ID Activity logs and Microsoft Entra ID Sign-in logs <p>Select from the list of applicable Microsoft Entra ID Activity and Microsoft Entra ID Sign-in Logs Categories, the ones that you want to configure your designated resource to collect. You can select any of the following categories to collect these types of Microsoft Entra ID logs.</p><ul><li><p>Microsoft Entra ID Activity logs:</p><ul><li>AuditLogs</li></ul></li><li><p>Microsoft Entra ID Sign-in logs:</p><ul><li>SignInLogs</li><li>NonInteractiveUserSignInLogs</li><li>ServicePrincipalSignInLogs</li><li>ManagedIdentitySignInLogs</li><li>ADFSSignInLogs</li></ul></li></ul><div data-gb-custom-block data-tag="hint" data-style="info" class="hint hint-info"><p>Note</p><p>There are additional log categories displayed. We recommend selecting all the available options.</p></div> Resource logs, including AKS audit logs The list displayed is dependent on the resource that you selected. We recommend selecting all the options available for the resource. - Destination details: Select Stream to event hub, where additional parameters are displayed that you need to configure. Ensure that you set the following parameters using the same settings for the Azure Event Hub that you created for the collection.
- Subscription: Select the applicable Subscription for the Azure Event Hub.
- Event hub namespace: Select the applicable Subscription for the Azure Event Hub.
- (Optional) Event hub name: Specify the name of your Azure Event Hub.
- Event hub policy: Select the applicable Event hub policy for your Azure Event Hub.
d. Save your settings.
-
Configure the Azure Event Hub collection in Cortex XSIAM.
- Navigate to Settings → Data Sources & Integrations.
- On the Data Sources & Integrations page, click + Add New, search for Azure Event Hub, then hover over it and click Add.
- Set these parameters:
- Name: Specify a descriptive name for your log collection configuration.
- Event Hub Connection String: Specify your event hub’s connection string for the designated policy.
- Storage Account Connection String: Specify your storage account’s connection string for the designated policy.
- Consumer Group: Specify your event hub’s consumer group.
-
Log Format: Select the log format for the logs collected from the Azure Event Hub as Raw, JSON, CEF, LEEF, Cisco-asa, or Corelight.
Note
When you Normalize and enrich audit logs, the log format is automatically configured. As a result, the Log Format option is removed and is no longer available to configure (default).
-
Vendor and Product: Specify the Vendor and Product for the type of logs you are ingesting. The Vendor and Product are used to define the name of your Cortex Query Language (XQL) dataset (
<vendor>_<product>_raw). The Vendor and Product values vary depending on the Log Format selected. To uniquely identify the log source, consider changing the values if the values are configurable.Note
When you Normalize and enrich audit logs, the Vendor and Product fields are automatically configured, so these fields are removed as available options (default).
- Normalize and enrich audit logs: (Optional) For enhanced cloud protection, you can Normalize and enrich audit logs by selecting the checkbox (default). If selected, Cortex XSIAM normalizes and enriches Azure Event Hub audit logs with other Cortex XSIAM authentication stories across all cloud providers using the same format. You can query this normalized data with XQL Search using the
cloud_audit_logsdataset.
- Click Test to validate access, and then click Enable. When events start to come in, a green check mark appears underneath the Azure Event Hub configuration with the amount of data received.
Azure Firewall
Important
This connector is only available for tenants that onboarded after July 26, 2026. For tenants that onboarded before this date, use Marketplace to access the standalone integration. For more information, see Marketplace.
This connector is available with any active Cortex XSIAM or Cortex AgentiX license.
Azure Firewall is a cloud-native and intelligent network firewall security service that provides breed threat protection for cloud workloads running in Azure. It's a fully stateful, firewall as a service, with built-in high availability and unrestricted cloud scalability.
This connector includes the following sub-capabilities (Marketplace integrations link to PAN DEV for more information):
- Azure Firewall: Azure Firewall is a cloud-native and intelligent network firewall security service that provides breed threat protection for cloud workloads running in Azure. It's a fully stateful, firewall as a service, with built-in high availability and unrestricted cloud scalability.
To configure this connector, follow the steps outlined in the configuration wizard.
Azure Network Watcher
You can configure collecting Azure Network Watcher logs using a standard data source:
| Collection Method | Description |
|---|---|
| Standard data source overview | Forward different types of flow logs to Cortex XSIAM from Azure Network Watcher using the Azure Network Watcher data source. |
| Link to standard data source instructions | <p>The following types of flow logs can be ingested from Azure Network Watcher:</p><ul><li>Network security group (NSG) flow logs</li><li>Virtual network (VNet) flow logs</li></ul><p>For more information, see Ingest network flow logs from Microsoft Azure Network Watcher.</p> |
Ingest network flow logs from Microsoft Azure Network Watcher
To receive network security group (NSG) or Virtual network (VNet) flow logs from Azure Network Watcher, you must configure data collection from Microsoft Azure Network Watcher using an Azure Function provided by Cortex XSIAM. This Azure Function requires a token that is generated when you configure your Azure Network Watcher Collector in Cortex XSIAM. After you have configured the Cortex XSIAM collector and successfully deployed the Azure Function to your Azure account, Cortex XSIAM will start receiving and ingesting network flow logs from Azure Network Watcher.
The Azure Network Watcher Collector is deployed using an ARM template. During deployment, the template retrieves keys using the listKeys function, and your app can bind to the blob storage using the connection string generated from those keys. After deployment, this binding works without the need to provide any connection string manually, because the keys were already retrieved and injected during deployment.
In addition to the user-specified storage account that captures the log blobs, the template also creates a secondary, internal storage account for internal operations related to the function app. This internal storage account is used by the function app for operations such as storing function state, and intermediate processing. To enhance security, public network access is disabled, and the account is restricted to private endpoints only. This additional internal storage account allows the function app to securely store data without relying on the user-specified storage account for internal processes. This separation enhances data security and isolation between user-facing storage and internal application operations. VNet integration is required only for the internal storage account's internal operations. The user-specified storage account used for NSG or VNet flow logs does not require VNet integration.
When Cortex XSIAM begins receiving logs, the app creates a new dataset (MSFT_Azure_raw) that you can use to initiate XQL Search queries. For example queries, refer to the in-app XQL Library. For enhanced cloud protection, you can also configure Cortex XSIAM to ingest network flow logs as Cortex XSIAM network connection stories, which you can query with XQL Search using the xdr_data dataset with the preset called network_story. Cortex XSIAM can also generate Cortex XSIAM issues (Analytics, Correlation Rules, IOC, and BIOC) when relevant from Azure Network Watcher flow logs. While Correlation Rules issues are raised on non-normalized and normalized logs, Analytics, IOC, and BIOC issues are only generated on normalized logs.
Enhanced cloud protection provides:
- Normalization of cloud logs
- Cloud logs stitching
- Enrichment with cloud data
- Detection based on cloud analytics
- Cloud-tailored investigations
Prerequisite
- For NSG:
- Ensure that your NSG flow logs in Azure Network Watcher conform to the requirements as outlined in Microsoft documentation. For more information, see Introduction to flow logging for network security groups.
- Enable NSG flow logs in the Microsoft Azure Portal.
- For VNet:
- Ensure that your VNet flow logs in Azure Network Watcher conform to the requirements as outlined in Microsoft documentation. For more information, see Introduction to flow logging for virtual networks.
- Enable VNet flow logs in the Microsoft Azure Portal.
- Ensure that you have an Azure subscription with user role permissions to deploy ARM templates and create the required resources.\
ThelistKeysfunction in an Azure Resource Manager (ARM) template retrieves the storage account keys, and it requires special permissions to execute. Specifically, the user or identity running the ARM template needs the following permission:Microsoft.Storage/storageAccounts/listKeys/action. If the user or service principal running the ARM template has the necessary user role (such as Owner or Storage Account Contributor), permission is implicitly granted for the template to retrieve the storage account keys. - Perform this procedure in the order shown below, because you need to save a token and a URL from Cortex XSIAM in earlier steps, and use them in Azure in later steps.
- Configure the Azure Network Watcher collection in Cortex XSIAM.
- Navigate to Settings → Data Sources & Integrations.
- On the Data Sources & Integrations page, click + Add New, search for Azure Network Watcher, then hover over it and click Add.
- Set these parameters:
- Name: Specify a meaningful name for your log collection configuration.
- Enhanced Cloud Protection: (Optional) For enhanced cloud protection, you can normalize and enrich flow logs by selecting the Use flow logs in analytics checkbox. If selected, Cortex XSIAM ingests network flow logs as Cortex XSIAM network connection stories, which you can query with XQL Search using the
xdr_datadataset with the preset callednetwork_story.
-
Click Save & Generate Token. The token is displayed in a popup.
Click the copy icon next to the key and save the copy of this token somewhere safe. You will need to provide this token when you configure the Azure Function and set the Cortex Access Token value. If you forget to record the token and close the window, you will need to generate a new one and repeat this process. When you are finished, click Done to close the window.
- On the Integrations page for the Azure Network Watch Collector that you created, click the Copy API URL icon and save a copy of the URL somewhere safe. You will need to provide this URL when you configure the Azure Function and set the Cortex Http Endpoint value.
- Configure the Azure Function provided by Cortex XSIAM.
- Do one of the following, depending on the flow log type:
- For NSG, open this Azure Function provided by Cortex XSIAM.
- For VNet, open this Azure Function provided by Cortex XSIAM.
- Click Deploy to Azure.
- Log in to Azure, and if necessary, complete authentication procedures.
- Set these parameters, where some fields are mandatory to set and others may already be populated for you.
- Subscription: Specify the Azure subscription that you want to use for the App Configuration. If your account has only one subscription, it is automatically selected.
- Resource group: Specify or create a resource group for your App Configuration store resource.
- Region: Specify the Azure region that you want to use.
- Unique Name: Enter a unique name for the function app. The name that you provide will be concatenated to some of the resource names, to make it easier to locate the related resources later on. The name must only contain alphanumeric characters (letters and numbers, no special symbols) and must contain no more than 10 characters.
- Cortex Access Token: Cortex HTTP authorization key that you recorded when you configured the Azure Network Watcher collection in Cortex XSIAM in an earlier step.
- Target Storage Account Resource Group: Specify the name of the Azure Resource Group where the target Azure Storage Account (specified in the Target Storage Account Name field) is located.
- Target Storage Account Name: Enter the name of the Azure Storage Account that was created during the NSG or VNet flow logs setup in Azure Network Watcher, where the log blobs are being stored.
-
Target Container Name: This field should be left empty for most use cases.
For NSG, the default value
insights-logs-networksecuritygroupfloweventis the name that is automatically created for the container during configuration of the network watcher.For VNet, the default value
insights-logs-flowlogfloweventis the name that is automatically created for the container during configuration of the network watcher. - Location: The region where all the resources will be deployed (leave blank to use the same region as the resource group).
- Cortex Http Endpoint: Specify the API URL that you recorded when you configured the Azure Network Watcher collection in Cortex XSIAM.
- Remote Package: The URL of the remote package ZIP file containing the Azure Function code. Keep the default value, unless instructed otherwise.
- Click Review + Create to confirm your settings for the Azure Function.
- Click Create. It can take a few minutes until the deployment is complete.
- Do one of the following, depending on the flow log type:
Note
In addition to your storage account, the template automatically creates another storage account that is required by the function app for internal use only. The internal storage account name is prefixed with cortex and is followed by a unique suffix based on the resource group, storage account, and container names.
After events start to come in, a green check mark appears underneath the Azure Network Watcher configuration that you created in Cortex XSIAM, and the amount of data received is displayed.
Microsoft Azure
Follow a wizard to onboard your Microsoft Azure environment. The Azure onboarding wizard is designed to facilitate the seamless setup of Azure data into Cortex XSIAM.
| Collection Method | Description |
|---|---|
| Link to full configuration Cloud Service Provider (CSP) onboarding data source instructions for Cortex XSIAM Premium license. | Onboard Microsoft Azure |
| Link to basic configuration Cloud Service Provider (CSP) onboarding data source instructions for Cortex XSIAM NG SIEM, Cortex XSIAM Enterprise license, and Cortex XSIAM Enterprise+ licenses. | How to onboard Microsoft Azure |
Microsoft Copilot Studio
The capabilities and sub-capabilities listed for this connector are available with any active Cortex Cloud Posture Security license.
This connector includes the following capabilities and sub-capabilities (if applicable):
- Agent Security Scanning
agent-activity-scan: Agent Activity Monitoring
To configure this connector, follow the steps outlined in the configuration wizard.
Microsoft Defender for Endpoint Events
You can configure collecting Microsoft Defender for Endpoints raw EDR event data using a Standard Collector or with a content pack integration (onboarded prior to July 26, 2026):
| Collection Method | Description |
|---|---|
| Standard Collector overview | Forward raw EDR event data from Microsoft Defender for Endpoint Events, streamed to Azure Event Hubs to Cortex XSIAM using the Microsoft Defender for Endpoint Events data source. |
| Link to Standard Collector instructions | Ingest raw EDR events from Microsoft Defender for Endpoint |
| Links to content pack/ integration details (onboarded prior to July 26, 2026) | <p>The Microsoft Defender for Endpoint content pack provides a unified platform within Cortex XSIAM to deliver preventative protection, post-breach detection, automated investigation, and response for endpoints across Windows, macOS, Linux, Android, iOS, and network devices. It contains the following integrations:</p><ul><li>Microsoft Defender for Endpoint: Use this integration to connect to the MDE platform and import events as Cortex XSIAM issues to facilitate investigation and remediation actions. It includes playbooks, an automation script, and commands that perform endpoint investigation and response, collect indicator and file statistics, and retrieve authentication and permission details. You can run the commands from the CLI, as part of an automation, or in a playbook. After you successfully execute a command, a DBot message appears in the War Room with the command details.</li><li>Microsoft Defender for Endpoint Alerts (deprecated): Use the Office 365 data source instead (Standard Collector).</li></ul> |
Ingest raw EDR events from Microsoft Defender for Endpoint
Cortex XSIAM enables ingestion of raw EDR event data from Microsoft Defender for Endpoint Events, streamed to Azure Event Hubs. In addition to all standard SIEM capabilities, this integration unlocks some advanced Cortex XSIAM features, enabling comprehensive analysis of data from all sources, enhanced detection and response, and deeper visibility into Microsoft Defender for Endpoint data.
Key benefits include:
- Querying all raw event data received from Microsoft Defender for Endpoint using XQL.
- Querying critical modeled and unified EDR data via the
xdr_datadataset. - Enriching case and issue investigations with relevant context.
- Grouping issues with issues from other sources to accelerate the scoping process of cases, and to cut investigation time.
- Leveraging the data for analytics-based detection.
- Utilizing the data for rule-based detection, including correlation rules, BIOC, and IOC.
- Leveraging the data within playbooks for case response.
When Cortex XSIAM begins receiving EDR events from Microsoft Defender for Endpoint Events, it automatically creates a new dataset labeled msft_defender_raw, allowing you to query all Microsoft Defender for Endpoint Events using XQL. For example XQL queries, refer to the in-app XQL Library.
In addition, Cortex XSIAM parses and maps critical data into the xdr_data dataset and XDM data model, enabling unified querying and investigation across all supported EDR vendors' data, and unlocking key benefits like stitching and advanced analytics. While mapped data from all supported EDR vendors, including Microsoft Defender for Endpoint Events, will be available in the xdr_data dataset, it's important to note that third-party EDR data present some limitations.
Third-party agents, including Microsoft Defender for Endpoint Events, typically provide less data compared to our native agents, and do not include the same level of optimization for causality analysis and cloud-based analytics. Furthermore, external EDR rate limits and filters might restrict the availability of critical data required for comprehensive analytics. As a result, only a subset of our analytics-based detectors will function with third-party EDR data.
We are continuously enhancing our support and using advanced techniques to enrich missing third-party data, while somehow replicating some proprietary functionalities available with our agents. This approach maximizes value for our customers using third-party EDRs within existing constraints. However, it’s important to recognize that the level of comprehensiveness achieved with our native agents cannot be matched, as much of the logic happens on the agent itself. These capabilities are unique, and are not found in typical SIEMs. Many of them, along with their underlying logic, are patented by Palo Alto Networks. Therefore, they should be regarded as added value beyond standard SIEM functionalities for customers who are not using our agents.
The generic Cortex XSIAM Azure Event Hub collector does not offer full functionality for EDR data (such as stitching), and is therefore not suitable for EDR data ingestion.
Task 1: Configure Microsoft Defender for Endpoint Events to stream raw data to Microsoft Azure Event Hub
Ensure that you do the following tasks before you begin configuring data collection.
- Create an Azure Event Hub. For more information, see Quickstart: Create an event hub using Azure portal.
- Create a resource group (optional if you already have a resource group configured).
- Create an Event Hubs namespace.
- Create an event hub within the namespace. On the Settings → Networking page → Public Access tab, ensure that you add Palo Alto Networks IP addresses to the Firewall allow list. Set Exception to Yes.
- Ensure that you keep a copy of the Event Hub resource ID and the Event Hub name for use in the following procedures. To get your Event Hubs resource ID, go to your Azure Event Hub namespace page on Azure's Properties tab, and copy the text under Resource ID.
- Create a storage account.
- Ensure that you have Microsoft Defender user credentials to sign in as a Security Administrator.
-
Refer to this topic for additional information: Enable access to required PANW resources
The IP addresses that should be used are the ones under: To Collect 3rd Party Data from Customer's SaaS and Cloud resources.
- It might be necessary to set the firewall on the Event Hub, but it could also be necessary to configure it on the storage account firewall.
-
Enable raw data streaming:
- Sign in to the Microsoft Defender portal as a Security Administrator.
- Go to the data export settings page in the Microsoft Defender portal: System → Settings → Windows Defender XDR → Streaming API.
- Click +Add.
- In the Name box, enter a name for your new data streaming settings.
- Select Forward events to Event Hub.
- In the Event-Hub Resource ID box, enter the Event Hub resource ID that you prepared in advance.
- In the Event-Hub box, enter the Event Hub name that you prepared in advance.
- For Event Types, select the event types that you want to stream.
If you select all event types and leave Event-Hub name empty, an event hub will be created for each category in the selected namespace. If you are not using a Dedicated Event Hubs ClusterEvent Hub, namespaces have a limit of 10 Event Hubs.
- Click Submit.
- Verify that the events that you selected are streaming by going to your Event Hubs namespace, Settings → Networking. Select the Event Hub name and the Consumer group, and then under Advanced properties, click View events. Check the Event body.
- In the Microsoft Azure console, open the Event Hubs page, and select the Azure Event Hub that you created for collection of Microsoft Defender logs.
- Save a copy of the following parameters from your configured event hub, because you will need them when configuring data collection in Cortex XSIAM:
- Your event hub’s consumer group:
- Select Entities → Event Hubs, and select your event hub.
- Select Entities → Consumer groups, and select your event hub.
- In the Consumer group table, copy the applicable value listed in the Name column for your Cortex XSIAM data collection configuration.
- Your event hub’s connection string for the designated policy:
- Select Settings → Shared access policies.
- In the Shared access policies table, select the applicable policy.
- Copy the Connection string-primary key.
- Your storage account connection string required for partitions lease management and checkpointing in Cortex XSIAM:
- Open the Storage accounts page, and either create a new storage account or select an existing one, which will contain the storage account connection string.
- Select Security + networking → Access keys, and click Show keys.
- Copy the applicable Connection string.
- Your event hub’s consumer group:
Task 2: Configure the Microsoft Defender for Endpoint Events collector in Cortex XSIAM
- Navigate to Settings → Data Sources & Integrations.
- On the Data Sources & Integrations page, click + Add New, search for Microsoft Defender for Endpoint Events, then hover over it and click Add.
- Set these parameters:
- Name: Specify a unique descriptive name for your log collection configuration. You cannot change this name later.
- Event Hub Connection String: Specify your event hub’s connection string for the designated policy.
- Storage Account Connection String: Specify your storage account’s connection string for the designated policy.
- Consumer Group: Specify your event hub’s consumer group.
-
Click Test to validate access, and then click Save.
When events start to come in, a green check mark appears beneath the Microsoft Defender for Endpoint configuration, with the amount of data received.
Microsoft Entra ID
Monitor identity risks and secure identity configurations across your Microsoft Entra ID environment.
This connector includes the following capabilities and sub-capabilities (if applicable):
- Identity Posture: Maintain visibility and control over Microsoft Entra ID identities, including users, groups, roles, and granular permissions. This capability is available with any active Cortex XSIAM, Cortex Cloud Posture Security, Cortex Cloud Runtime Security, or Cortex Data Security license.
- Security Posture: Detect, monitor and alert on settings of your Microsoft Entra ID tenant. This capability is available with any active Cortex XSIAM or Cortex Cloud Posture Security license.
- saas-posture-config-remediation: Help remediate the misconfigured security settings of your Microsoft Entra ID tenant. This sub-capability is available with any active Cortex XSIAM or Cortex Cloud Posture Security license.
To configure this connector, follow the steps outlined in the configuration wizard.
Microsoft Office 365
You can configure collecting Microsoft Office 365 logs and data using a Standard Collector, content pack integration (onboarded prior to July 26, 2026), or connectors:
| Collection Method | Description |
|---|---|
| Standard Collector overview | Forward logs and data to Cortex XSIAM from Microsoft Office 365 Management Activity API and Microsoft Graph API using the Office 365 data source. |
| Link to Standard Collector instructions | <p>The following types of logs and data can be ingested from Microsoft Office 365 Management Activity API and Microsoft Graph API:</p><ul><li><p>Microsoft Office 365 audit events from Management Activity API</p><ul><li>Microsoft Entra ID (Azure AD)</li><li>Exchange Online</li><li>SharePoint Online</li><li>DLP</li><li>General</li></ul></li><li>Microsoft Entra ID (Azure AD) authentication and audit events from Microsoft Graph API</li><li><p>Microsoft 365 alerts from Microsoft Graph Security API are available for different products:</p><ul><li>Microsoft Graph Security API v1</li><li>Microsoft Graph Security API v2</li></ul></li></ul><p>For more information, see Ingest logs from Microsoft Office 365.</p> |
| Links to content pack/integration details (onboarded prior to July 26, 2026) | <ul><li><p>The Microsoft Exchange Online content pack integrates with Exchange Online and Office 365 mail services to enable monitoring, searching, content retrieval, deletion of emails, and management of tenant allow/block lists. The content items in this pack include several playbooks focused on searching and deleting content, automations like GetEWSFolder and CreateCertificate, and the following integrations:</p><ul><li>EWS O365: Use this integration to retrieve information on emails and activities in a target mailbox and perform operations such as deleting emails and attachments, moving email items, handling mail sending and replying including inline images, and retrieving out-of-office status information.</li><li>O365 - Security And Compliance - Content Search v2: Use this integration to manage security and compliance content search across organizational assets including emails, SharePoint sites, and OneDrives, and to perform actions like previewing and deleting emails. It includes the capability to delete an email for all recipients using the o365-sc-email-security-search-and-delete-email-office-365-quick-action command.</li><li>EWS Extension Online Powershell v3: Use this integration to retrieve information about mailboxes and users in your organization, and to retrieve and modify tenant allow/block lists. It includes commands that retrieve information about mailboxes and users, display client access settings, retrieve permissions, list recipient objects, and manage tenant allow/block list entries (add, remove, list, count). It also includes commands to enable or disable mail flow rules and mail forwarding, and to list message trace details.</li></ul></li><li><p>The Microsoft Graph API content pack provides the capability to interact with Microsoft APIs that do not have dedicated integrations in Cortex XSIAM, such as Mail Single-User. It includes the following integration:</p><ul><li>Microsoft Graph API: Use this integration to interact with various Microsoft APIs, such as Mail Single-User, that currently lack dedicated integrations in Cortex XSIAM. It includes commands that facilitate making specific API requests (msgraph-api-request which supports headers), managing the authentication process by generating login URLs (msgraph-api-generate-login-url) to support the OAuth consent dialog, and resetting the authentication context if needed (msgraph-api-auth-reset)</li></ul></li></ul> |
| Link to connector details | <ul><li>Microsoft 365</li><li>Microsoft365</li><li>Microsoft 365 Copilot</li><li>Microsoft Graph (onboarded after July 26, 2026)</li></ul> |
Ingest logs from Microsoft Office 365
Important
Migration Advisory: Microsoft Graph Security API v1 to v2
Microsoft will retire the Legacy Alerts (v1) API endpoint in April 2026. To avoid service interruption, instances currently using the legacy Alerts (v1) option must manually transition to the v2 GA endpoint by selecting the Alerts → Security Alerts V2 option.
- Schema impact: Moving from v1 to v2 involves schema changes. While all out-of-the-box content is compatible, you must manually review and adjust custom correlation rules, parsing rules, and dashboards to align with the v2 schema.
Note
- Ingesting Microsoft Entra ID (formerly known as Azure AD) authentication and audit events from Microsoft Graph API requires a Microsoft Azure Premium 1 or Premium 2 license. Alternatively, if the directory type is Azure AD B2C, the sign-in reports are accessible through the API without any additional license requirement.
- To ingest email logs and data from Microsoft Office 365, use the dedicated data collector. For more information, see Ingest logs and data from Microsoft 365.
Cortex XSIAM can ingest the following logs and data from Microsoft Office 365 Management Activity API and Microsoft Graph API using the Office 365 data collector. Alerts are collected with a delay of 5 minutes. If your organization requires collection that is closer to real-time collection, we recommend using the Microsoft Azure Event Hub integration instead. For more information, see Ingest logs from Microsoft Azure Event Hub.
To ingest email logs and data from Microsoft Office 365, use the dedicated data collector. For more information, see Ingest logs and data from Microsoft 365.
-
Microsoft Office 365 audit events from Management Activity API, which provides information about various user, administrator, system, and policy actions and events from Office 365, Microsoft Entra ID (formerly known as Azure AD) and MDO activity logs.
Note
When auditing is turned off from the default setting, you need to first turn on auditing for your organization to collect Microsoft Office 365 audit events from the Management Activity API. Log duplication of up to 5% in Microsoft products is considered normal. In some cases, such as login to a portal using MFA, two log entries are recorded by design.
-
Microsoft Entra ID (Azure AD) authentication and audit events from Microsoft Graph API.
When collecting Azure AD Authentication Logs, Cortex XSIAM also collects by default all sign-in event types from a beta version of Microsoft Graph API, which is still subject to change. In addition to classic interactive user sign-ins, selecting this option allows you to collect.
- Non-interactive user sign-ins.
- Service principal sign-ins.
- Managed Identities for Azure resource sign-ins.
Note
To address Azure reporting latency, there is a 10-minute latency period for Cortex XSIAM to receive Azure AD logs.
-
Microsoft 365 alerts from Microsoft Graph Security API are available for different products.
-
Microsoft Graph Security API v1: Alerts from various products (including Microsoft Defender for Cloud and Microsoft Entra ID Protection) are available via this endpoint.
Important
Microsoft has deprecated the Legacy Alerts (v1) API in April 2026. To avoid service interruption, you must migrate to the v2 endpoint before this date.
- Microsoft Defender for Cloud, Azure Active Directory Identity Protection, Microsoft Defender for Cloud Apps, Microsoft Defender for Endpoint, Microsoft Defender for Identity, Microsoft 365, Azure Information Protection, and Azure Sentinel.
-
Microsoft Graph Security API v2 (GA): This endpoint provides a unified alerts API for Microsoft 365 Defender, Microsoft Defender for Identity, and Microsoft Purview Data Loss Prevention.
- Microsoft 365 Defender unified alerts API, which serves alerts from Microsoft 365 Defender, Microsoft Defender for Endpoint, Microsoft Defender for Office 365, Microsoft Defender for Identity, Microsoft Defender for Cloud Apps, and Microsoft Purview Data Loss Prevention (including any future new signals integrated into M365D).
To view alerts from the various products via the Microsoft Graph Security API versions, you need to ensure that you've set up the applicable licenses in Office 365. The table below lists the various licenses required for the different Microsoft Defender products. For more information on other Microsoft product licenses, see the Microsoft documentation.
Product Standalone license E3 license E3 + Security add-on license E5 license E5 Security license E5 Compliance license Microsoft Defender for Endpoint Plan 1 ✓ ✓ ✓ — — — Microsoft Defender for Endpoint Plan 2 — — ✓ ✓ ✓ — Microsoft Defender for Identity — — ✓ ✓ ✓ — Microsoft Defender for Office 365 Plan 1 ✓ — — — — — Microsoft Defender for Office 365 Plan 2 ✓ — ✓ ✓ ✓ — Microsoft Defender for Cloud Apps — — ✓ ✓ ✓ ✓
-
Note
For more information, see the Office 365 Management Activity API schema.
To receive logs from Microsoft Office 365, you must first configure the Data Sources & Integrations settings in Cortex XSIAM. After you set up data collection, Cortex XSIAM begins receiving new logs and data from the source.
When Cortex XSIAM begins receiving logs, the app creates a new dataset for the different types of logs and data that you are collecting, which you can use to initiate XQL Search queries. For example queries, refer to the in-app XQL Library. For all Microsoft Office 365 logs, Cortex XSIAM can also generate Cortex XSIAM issues (Analytics, IOC, BIOC, and Correlation Rules), when relevant, from Office 365 logs. While Correlation Rules issues are generated on non-normalized and normalized logs, Analytics, IOC, and BIOC issues are only generated on normalized logs.
For the different types of data you can collect using the Office 365 data collector, the following table lists the different datasets, vendors, and products automatically configured, and whether the data is normalized.
| Data type | Dataset | Vendor | Product | Normalized data |
|---|---|---|---|---|
| Microsoft Office 365 audit events from Management Activity API | ||||
| <ul><li>Microsoft Entra ID (Azure AD)</li></ul> | msft_o365_azure_ad_raw |
msft |
O365 Azure AD |
— |
| <ul><li>Exchange Online</li></ul> | msft_o365_exchange_online_raw |
msft |
O365 Exchange Online |
Cortex XSIAM supports normalizing Exchange Online audit logs into stories, which are collected in a dataset called saas_audit_logs*. |
| <ul><li>SharePoint Online</li></ul> | msft_o365_sharepoint_online_raw |
msft |
O365 Sharepoint Online |
Cortex XSIAM supports normalizing SharePoint Online audit logs into stories, which are collected in a dataset called saas_audit_logs*. |
| <ul><li>DLP</li></ul> | msft_o365_dlp_raw |
msft |
O365 DLP |
— |
| <ul><li>General</li></ul> | msft_o365_general_raw |
msft |
O365 General |
Cortex XSIAM supports normalizing General audit logs into stories, which are collected in a dataset called saas_audit_logs*. |
| Microsoft Entra ID (Azure AD) authentication events from Microsoft Graph API | msft_azure_ad_raw |
msft |
Azure AD |
When relevant, Cortex XSIAM normalizes Azure AD authentication logs and Azure AD Sign-in logs to authentication stories. |
| Microsoft Entra ID (Azure AD) audit events from Microsoft Graph API | msft_azure_ad_audit_raw |
msft |
Azure AD Audit |
When relevant, Cortex XSIAM normalizes Azure AD audit logs to cloud audit logs stories. |
| Alerts from Microsoft Graph Security API v1 and v2 | msft_graph_security_alerts_raw |
msft |
Security Alerts |
— |
*Note
For the saas_audit_logs dataset, the Vendor is saas and Product is Audit Logs.
Note
In FedRAMP environments, Azure sign-in logs are not supported, due to vendor technical constraints.
How to set up the Office 365 integration
-
From the Microsoft Entra ID console (formerly Azure AD console), create an app for Cortex XSIAM with the applicable API permissions for the logs and data you want to collect as detailed in the following table:\
Required Azure AD / Entra ID API permissions\
\
When registering the app for Cortex XSIAM in the Microsoft Entra ID console, you must assign the permissions listed below.Important
All permissions listed below must be granted as Application Permissions, not Delegated permissions.
| Log type and data | API/Permission name |
|---|---|
| Microsoft Office 365 audit events from Management Activity API | |
| Azure AD | Office 365 Management APIs → ActivityFeed.Read |
| Exchange Online | Office 365 Management APIs → ActivityFeed.Read |
| Sharepoint Online | Office 365 Management APIs → ActivityFeed.Read |
| DLP | Office 365 Management APIs → ActivityFeed.ReadDlp |
| General | Office 365 Management APIs → ActivityFeed.Read |
| Azure AD authentication and audit events from Microsoft Graph API | <ul><li>Microsoft Graph → AuditLog.Read.All</li><li>Microsoft Graph → Directory.Read.All</li></ul> |
| Alerts from Microsoft Graph Security API v1 and v2 | <ul><li>Microsoft Graph → SecurityAlert.Read.All</li><li>Microsoft Graph → SecurityEvents.Read.All</li></ul> |
For more information on Microsoft Azure, see the following instructions in the Microsoft documentation portal.
- Navigate to Settings → Data Sources & Integrations.
- On the Data Sources & Integrations page, click + Add New, search for Office 365, then hover over it and click Add.
-
Integrate the applicable Microsoft Entra ID (Azure AD) service with Cortex XSIAM.
a. Specify the Tenant Domain of your Microsoft Entra ID tenant.
b. Obtain the Application Client ID and Secret for your Microsoft Entra ID (Azure AD) service from the Microsoft Entra ID console, and specify the values in Cortex XSIAM. These values enable Cortex XSIAM to authenticate with your Microsoft Entra ID (Azure AD) service.
c. Select the types of logs that you want to receive from Office 365.\
The following options are available.- Office 365 Management Activity API
- Cloud Environment: select the cloud environment used by your organization:
- Enterprise: Default option for non-US Government tenants
- GCC: US Government Compliant Cloud tenants
- GCC High: US Government Compliant Cloud High tenants
- DoD: US Department of Defense tenants
- Azure AD: Includes subset of Azure AD audit events and Azure AD authentication events. There can be significant overlap between these and the Azure AD Authentication Logs originating from Microsoft Graph API. ### Note Use this option when you don’t want to grant permissions for Azure AD Authentication and Azure AD Audit.
- Exchange Online: Includes audit logs on Azure Exchange mailboxes and Exchange admin activities on the Office 365 Exchange.
- Sharepoint Online: Includes audit events on Sharepoint and OneDrive activities.
- DLP: Includes Microsoft 365 DLP events for Exchange, Sharepoint, and OneDrive.
- General: Includes audit logs for various Microsoft 365 applications, such as Power BI and Microsoft Forms.
- Cloud Environment: select the cloud environment used by your organization:
- Microsoft Graph API
- Cloud Environment: select the cloud environment used by your organization:
- Global Service: Default option for non-US Government tenants
- Government L4: US Government Layer 4 tenants
- Government L5 (DOD): US Government Layer 5 tenants
- Azure AD Authentication Logs: Collects interactive sign-in events using the Microsoft Graph API. These logs are part of Microsoft Entra ID (formerly Azure AD) and are found under Microsoft Entra sign-in logs.Collect all sign-in event types: When enabled, this option switches the collection to a beta version of the Microsoft Graph API.This beta API may experience instability, collection lags, and temporary data gaps. For production environments, we recommend using the Azure Event Hub collector instead of this nested option to ensure consistent data delivery. This setting should be used for non-production or evaluation purposes only. In addition to classic interactive user sign-ins, this option expands Azure AD Sign-in logs to include: -Non-interactive user sign-ins. -Service principal sign-ins. -Managed Identities for Azure resource sign-ins.
- Azure AD Audit Logs: Azure AD Audit logs includes different categories, such as User Management, Group Management and Application Management.
- Alerts: When this checkbox is selected, define how alerts are collected by selecting one of the following options:
- Security Alerts V2 (Default): Alerts are collected via the v2 GA endpoint.
- Microsoft 365 Defender unified alerts API, which serves alerts from Microsoft 365 Defender, Microsoft Defender for Endpoint, Microsoft Defender for Office 365, Microsoft Defender for Identity, Microsoft Defender for Cloud Apps, and Microsoft Purview Data Loss Prevention (including any future new signals integrated into M365D).
- Legacy Alerts (Deprecated): Alerts are collected via the deprecated Legacy Microsoft Graph Security API v1.
- Microsoft Defender for Cloud, Azure Active Directory Identity Protection, Microsoft Defender for Cloud Apps, Microsoft Defender for Endpoint, Microsoft Defender for Identity, Microsoft 365, Azure Information Protection, and Azure Sentinel.
- Security Alerts V2 (Default): Alerts are collected via the v2 GA endpoint.
- Emails: Deprecated. Use the dedicated email collector instead. For more information, see Ingest logs and data from Microsoft 365.
- Cloud Environment: select the cloud environment used by your organization:
d. Click Test to test the connection settings. To test the connection, you must select one or more log types. Cortex XSIAM then tests the connection settings for the selected log types.
e. If successful, click Enable to enable Office 365 log collection.
- Office 365 Management Activity API
Microsoft 365 (new)
Secure sensitive data, monitor configurations, and track identity risks across your Microsoft 365 environment, including OneDrive, SharePoint, Teams, and Entra ID.
This connector includes the following capabilities and sub-capabilities (if applicable):
- Automation and Remediation: Run automated workflows and remediation actions across Microsoft 365 services using Microsoft Graph. This capability is available with any active Cortex AgentiX, Cortex Cloud Runtime Security, Cortex XSIAM, Cortex XDR, or Cortex Cloud license.
- Data Security: Scan and protect data across the selected services. This capability is available with any active Cortex XSIAM, Cortex Cloud Posture Security, Cortex Cloud Runtime Security, or Cortex Data Security license.
- Identity Posture: Maintain visibility and control over Microsoft Entra ID identities, including users, groups, roles, and granular permissions. This capability is available with any active Cortex XSIAM, Cortex Cloud Posture Security, Cortex Cloud Runtime Security, or Cortex Data Security license.
- Security Posture: Detect, monitor and alert on security settings across the selected services. This capability is available with any active Cortex XSIAM or Cortex Cloud Posture Security license.
- saas-posture-config-remediation: Help remediate the misconfigured security settings across the selected services. This sub-capability is available with any active Cortex XSIAM or Cortex Cloud Posture Security license.
To configure this connector, follow these steps:
Prerequisite
1. Global Administrator access to the Azure portal
Sign in to the Microsoft Azure portal as a Global Administrator. Use the Create a Microsoft Entra ID page to obtain the following values:
- Tenant ID: Directory ID for your Microsoft 365 tenant.
- Client ID: Application ID generated during app registration.
- Client Secret: Client secret generated for the registered application.
2. Configure the Office 365
Before configuring Microsoft 365, configure the Office 365 to collect the Microsoft 365 Management Activity logs required for SharePoint Online and OneDrive scanning.
For detailed configuration steps, see Configure the Microsoft Office 365.
Note
This prerequisite is not required when configuring Microsoft Teams.
How to configure the Microsoft 365 connector
Task 1. Select services
- In Cortex Cloud, navigate to Settings → Data Sources & Integrations.
- Click + Add new.
- On the Add Data Source page, search for Microsoft 365 (New), hover over it, The new Microsoft 365 connector has the description: Multi-service security integration for Microsoft 365 including OneDrive, SharePoint, Teams, and Entra ID. Click Add.
- In the wizard, select the Microsoft 365 services that you want to configure, such as:
- OneDrive for Business
- SharePoint Online
-
Microsoft Teams.
For detailed configuration steps for Microsoft Teams connector, see Microsoft Teams.
Note
Select one or more services based on your requirements. You can onboard all three services or select only the services you need.
5. Click Next.
Capabilities tab
- Enter a unique name for the new connector instance.
- Review the available capabilities and select Data Security to enable scanning and inventory collection across the selected repositories.
- (Optional) Enable Automation and Remediation if you plan to use automated labelling with Microsoft Purview Information Protection (MIP).
Note
Identity Posture is automatically enabled when Data Security is selected and cannot be disabled during setup. Identity Posture is required for user and group validation and cross-tenant exposure analysis.
- Click Next.
Connection tab
- On the Connection page, enter the Tenant ID and click Apply.
- After the Tenant ID is validated, enter the Client ID and Client Secret in their respective fields.
- Click Test to validate the connection settings.
- If the connection is successful, the wizard displays a green Verified status indicator.
Note
If validation fails because of incorrect field values, close the wizard and restart the workflow. The current wizard session cannot be reused after a validation failure.
5. Click Next to proceed.
Summary tab
- On the Summary page, verify that each selected capability displays a Connected status.
- If validation succeeds, the wizard displays a Verification Success message.
- Click Create Instance to create the Microsoft 365 connector.
Task 2. (Optional) Post verification
After onboarding is complete, verify asset discovery and data security findings.
1. Verify discovered assets
- Go to Inventory > All Assets.
- Filter the asset list by setting Provider to Microsoft 365.
- Verify that Cortex discovers the following supported asset types:
- Microsoft OneDrive: Individual user cloud storage environments provisioned within the Microsoft 365 organization.
- Microsoft Document Library: Document containers, document sets, and file repositories hosted in OneDrive and SharePoint.
- Microsoft SharePoint Site: Root and sub-level team sites, communication sites, and site collections that contain collaborative files and permissions.
- Microsoft Teams Workspace: Mapped to Active Directory (AAD) Groups containing Public, Private, or Shared Channels.
- Microsoft Personal Workspace: Captures 1-on-1 Direct Messages (DMs) and multi-user Group Chats.
2. Verify policy findings
- Select a OneDrive or other supported asset to open the details panel.
- Review the Overview tab for asset health and other details.
- Go to Findings to review detected security findings, including:
- Sensitive Content Detections: Sensitive data matches, such as financial data, health records, credentials, API tokens, credit card numbers, and personally identifiable information (PII), detected in files stored in OneDrive and SharePoint or in Microsoft Teams chat messages and conversations.
- Insecure Sharing and External Exposure: Files and folders exposed through anonymous access links, such as Anyone with the link, organization-wide shared links, or external guest user access in OneDrive and SharePoint. This also includes sensitive information shared in Microsoft Teams chats or conversations with external users or guest users.
- Misconfigured Permissions and Excessive Exposure: Overly permissive access controls, broken permission inheritance, or unrestricted access to sensitive OneDrive folders, SharePoint sites, and document libraries.
Note
- Any user addition to or removal from a Microsoft Teams group chat may take up to 6 hours to be reflected.
- ACLs for messages sent before a user is added to or removed from a Microsoft Teams group chat are not updated to reflect the membership change.
- After onboarding a connector, Cortex Cloud may take 24 hours to 7 days to fully process the data and generate findings. If you attempt to re-onboard the same connector using the same credentials during this transition period, previously generated findings and other data may temporarily reappear.
Create a Microsoft Entra ID
To integrate Microsoft 365 services with Cortex Cloud for Data Security and Posture Management, you must create a Microsoft Entra ID service principal (formerly Azure AD). The service principal requires specific Microsoft Graph API permissions based on the capabilities you plan to enable.
Prerequisites
- Global Administrator access to the Microsoft Entra admin center or Azure portal.
- Access to the Microsoft 365 tenant that you want to onboard.
Task 1. Create a Service Principal
- Sign in to the Microsoft Entra admin center or the Azure portal as a Global Administrator.
- Navigate to App registrations > New registration.
- Enter a descriptive name for the application, such as
Cortex-Cloud-Integration. - For Supported account types drop down, select Single Tenant Only [Your Organisation].
- Click Register.
- On the Overview page, note the following values:
- Application (client) ID
- Directory (tenant) ID
- Navigate to Certificates & secrets > New client secret.
- Create a client secret.
- Copy the Secret Value and store it.
Task 2. Configure API Permissions
Add the required Microsoft Graph application permissions based on the Cortex Cloud capabilities you plan to enable.
To add a permission:
- In the application registration, go to API permissions.
- Click Add a permission.
- Select Microsoft Graph.
- Select Application permissions.
- Search for and select the required permissions listed in the following sections. Click on Add permissions once all the required permissions are added to the list.
Microsoft 365 Data Security
These permissions are required to scan files for sensitive content across SharePoint and OneDrive repositories.
| Permission |
|---|
SensitivityLabels.Read.All |
Files.Read.All |
User.Read.All |
Sites.Read.All |
Microsoft 365 and Entra ID Identity Posture
These permissions are required for user and group validation and for computing cross-tenant exposure scopes.
| Permission |
|---|
User.Read.All |
Group.Read.All |
Application.Read.All |
RoleManagement.Read.Directory |
AuditLog.Read.All |
Microsoft 365 Automation and Remediation
These permissions are required for automated remediation actions.
| Permissions |
|---|
Files.ReadWrite.All |
Sites.ReadWrite.All |
InformationProtectionPolicy.Read.All |
Microsoft Teams Data Security Permissions
These permissions are required for scanning sensitive data in Microsoft Teams channels and messages.
| Permissions |
|---|
Chat.Read.All |
Chat.ReadWrite.All |
ChatMessage.Read.All |
Group.Read.All |
Team.ReadBasic.All |
TeamMember.Read.All |
User.Read.All |
Channel.ReadBasic.All |
ChannelMessage.Read.All |
ChannelMember.Read.All |
Task 3. Grant Admin Consent
After adding all required API permissions:
- On the API permissions page, click Grant admin consent for [Your Organization].
- Confirm the consent request.
- Verify that the status of all required permissions changes to Granted.
After completing these steps, use the Directory (tenant) ID, Application (client) ID, and Client Secret when configuring the Microsoft 365 connector in Cortex Cloud.
Microsoft365 (legacy)
Important
We recommend using the new Microsoft 365 connector for the latest capabilities. For more information about how to migrate, see Migrate to the new Microsoft 365 connector.
This connector includes the following capabilities and sub-capabilities (if applicable):
- Data Security: Scan and protect Microsoft 365 data across OneDrive and SharePoint. This capability is available with any active Cortex XSIAM, Cortex Cloud Posture Security, Cortex Cloud Runtime Security, or Cortex Data Security license.
- Security Posture: Detect, monitor and alert on settings of your SaaS application. This capability is available with any active Cortex XSIAM or Cortex Cloud Posture Security license.
- saas-posture-config-remediation: Help remediate the misconfigured security settings of your SaaS application. This sub-capability is available with any active Cortex XSIAM or Cortex Cloud Posture Security license.
To configure this connector, follow the steps outlined in the configuration wizard.
Migrate to new Microsoft 365 connector
Migrate from the legacy Microsoft365 connector to the new Microsoft 365 connector to take advantage of improved performance, enhanced remediation capabilities, and unified Microsoft 365 configuration.
Why migrate?
By upgrading to the new connector, you benefit from:
- Faster and more efficient scanning with improved performance and reliability.
- Enhanced remediation capabilities, including:
- Delete
- Change public sharing
- Quarantine
- Microsoft Information Protection (MIP) label write support, enabling automatic application of sensitivity labels directly from Cortex Cloud.
- Unified Microsoft 365, providing holistic security across identities, AI agents, security configurations, and Microsoft 365 applications such as Microsoft Teams, SharePoint, and OneDrive through a single configuration experience.
Migration steps
Task 1. Remove the existing Microsoft365 Connector
- Remove your existing Microsoft 365 connector to prepare for the migration.
- Note: Removing the connector clears the Microsoft 365 assets and objects previously discovered by the existing connector from the Data Security inventory. No data is deleted from your Microsoft 365 environment. The new connector automatically rediscovers and repopulates these assets during ingestion.
- Wait approximately 24 hours for the cleanup process to complete before proceeding to the next step.
Task 2. Install the new Microsoft 365 Connector
Install the new Microsoft 365 connector by following the configuration guide. For more information, see Microsoft 365.
Task 3. Monitor Data Ingestion
The new connector begins ingesting existing and new Microsoft 365 data using Microsoft APIs. Depending on the size of your environment, the initial synchronization may take a few days to several weeks. We recommend monitoring the ingestion progress with the Palo Alto Networks team until your environment reaches full coverage.
Microsoft 365 Copilot
The capabilities and sub-capabilities listed for this connector are available with any active Cortex Cloud Posture Security license.
This connector includes the following capabilities and sub-capabilities (if applicable):
- Agent Security Scanning
To configure this connector, follow the steps outlined in the configuration wizard.
Microsoft Graph
Important
This connector is only available for tenants that onboarded after July 26, 2026. For tenants that onboarded before this date, use Marketplace to access the standalone integration. For more information, see Marketplace.
Integrate with Microsoft products through the Microsoft Graph API and Microsoft Endpoint Manager (Intune). Use the Microsoft Graph API to interact with Microsoft APIs that do not have dedicated connectors, and use Microsoft Endpoint Manager (Intune) for cloud-based mobile device and operating system management.
This connector includes the following sub-capabilities (Marketplace integrations link to PAN DEV for more information):
- Microsoft Graph API: Use the Microsoft Graph API integration to interact with Microsoft APIs that do not have dedicated integrations in Cortex XSIAM, for example, Mail Single-User, etc. This sub-capability is available with any active Cortex XSIAM, Cortex Cloud Posture Security, Cortex Cloud, Cortex Cloud Runtime Security, Cortex XDR, or Cortex AgentiX license.
- Microsoft Graph Device Management: Microsoft Intune is a Microsoft cloud-based management solution that provides for mobile device and operating system management. This sub-capability is available with any active Cortex XSIAM, Cortex Cloud, Cortex Cloud Runtime Security, Cortex XDR, or Cortex AgentiX license.
To configure this connector, follow the steps outlined in the configuration wizard.
Microsoft Office 365 (email)
You can configure collecting Microsoft Office 365 email metadata using a Standard Collector:
| Collection Method | Description |
|---|---|
| Standard Collector overview | Forward email metadata through Microsoft Graph API to Cortex XSIAM from Microsoft Office 365 using the Microsoft 365 data source. |
| Link to Standard Collector instructions | Ingest logs and data from Microsoft 365 |
Ingest logs and data from Microsoft 365
The Microsoft 365 email collector fetches email metadata through Microsoft Graph API, using an authorized app. A compliance mailbox is not required.
License
Email content visibility and licensing: Email subjects and bodies are stored in an encrypted format to ensure data privacy. To view this content or generate alerts for it, an Email Security module license is required.
- Without the license: Sensitive email content (subject, body, and attachments) remains encrypted and is not accessible for viewing or threat hunting.
- With the license: When the module detects a suspicious or malicious email, it automatically creates an issue and decrypts the subject, body, and attachments. This decrypted content is then made available as an artifact within the issue for investigation.
Note: For other logs from Microsoft Office 365, use the Office 365 data collector. For more information, see Ingest logs from Microsoft Office 365.
Prerequisite
- A user account with the Microsoft Azure Account Administrator role is required to set up a new Microsoft 365 email collector.
- The following Microsoft Graph API permissions are required:
- Mailbox access (read-write)
- Read and write mail in all mailboxes
- Read contacts in all mailboxes
- Read all user mailbox settings
- User information, groups, and directory data (read-only)
- Read directory data
- Read all groups
- Read all users' full profiles
- Mailbox access (read-write)
Scoping
You can narrow down the scope of ingested mailboxes by:
- Microsoft 365 Group
- Distribution List
- Mail-enabled Security Group
- Mail-enabled Users
Datasets
The Microsoft 365 collector provides a comprehensive data stream by ingesting information into the following nine datasets. These are categorized by their default availability and licensing requirements:
Standard datasets
These datasets are collected as part of the standard Microsoft 365 connector configuration:
msft_o365_emails_raw: Metadata and logs for email traffic.msft_o365_users_raw: Information regarding user accounts and identities.msft_o365_groups_raw: Data related to Office 365 groups and distribution lists.msft_o365_devices_raw: Details on devices registered within the M365 environment.msft_o365_mailboxes_raw: Configuration and status logs for individual mailboxes.msft_o365_rules_raw: Logs for mail flow, transport, and inbox rules.msft_o365_contacts_raw: Organizational and user-defined contact information.
Licensed security datasets
The following datasets are specialized and require the Email Security module license to be active:
msft_o365_protected_emails_raw- requires the Email Security module license.o365_email_threat_submission_policies- requires the Email Security module license.
Data encryption and privacy
Cortex XSIAM prioritizes data privacy while maintaining security visibility. The following rules apply to ingested email data:
- Storage and encryption: Cortex XSIAM stores email metadata as plain text, but the email subject and body are always encrypted.
- Retention policy: The email body is temporarily saved for 48 hours and is then automatically deleted.
- Automated analysis: Analytical detectors automatically scan both raw metadata and encrypted content to identify threats.
- Decryption for investigation: When an issue is created for a malicious email, the raw email (including decrypted subject and body) is attached to the issue as an artifact for review.
- Threat hunting constraints: You cannot perform threat hunting based on the email subject or body content. Only metadata, such as Date, From, or To, is available for Cortex Query Language(XQL) threat hunting queries.
How to configure Microsoft 365 collection
- Navigate to the data source.
- Select Settings → Data Sources & Integrations, click + Add New, search for Microsoft 365, then hover over it and click Add.
- Perform permissions verification.
- In the wizard, review the required items on the Permissions page, and then click Next.
- Authorize.
- Click OK to confirm you understand that API authorization consent is required.
- Perform Microsoft sign-in.
- Select the Microsoft account for collection.
- Click Next.
- Enter your credentials for the Microsoft account and click Sign in.
- If you are asked to perform authentication using your organization's authentication tools, do so.
- Accept permissions.
- Review the list of of permissions requested by the collector and click Accept.
- Define the scope.
- On the Scope page, select one of the following:
- Entire organization: Emails will be collected from all mailboxes in your organization.
- Specific groups: Enter the email addresses of group names, such as Microsoft 365 Groups, Mail-enabled Security Groups, Distribution Lists, or Mail-enabled Users.
- Click Next.
- On the Scope page, select one of the following:
- Finalize the details and create the integration instance.
- On the Details page, enter a meaningful instance name, and click Next.
- On the Summary page, check your configurations, and then click Create.
Verification
Once the configuration is complete, a green check mark will appear below the Microsoft 365 configuration, and the console will display the amount of data received. You can now run queries against the datasets listed above.
Microsoft 365 (Posture)
You can configure collecting Microsoft 365 (Posture) logs using a Cloud Posture and Runtime Security data source or connector:
| Collection Method | Description |
|---|---|
| Cloud Posture and Runtime Security data source overview | Forward Microsoft 365 (Postrure) logs to Cortex XSIAM using the Microsoft 365 data source. |
| Link to Cloud Posture and Runtime Security data source instructions | How to onboard Microsoft 365 |
| Link to connector details | <p>• Microsoft 365 • Microsoft365 • Microsoft Entra ID</p> |
How to onboard Microsoft 365
This feature is included with a Cortex XSIAM Premium license. It is also included with any other Cortex XSIAM license that has the Cloud Posture Security or Cloud Runtime Security add-on.
You can add Microsoft 365 as a third-party data source in Cortex XSIAM.
- You have generated a Globally Unique Identifier (GUID), also known as a Universally Unique Identifier (UUID). You will need this ID for the tenant you want to use for the Microsoft 365 instance.
- In order to use Microsoft 365, you must be registered with Microsoft Azure.
Configuration
- Navigate to Settings → Data Sources & Integrations.
- On the Data Sources & Integrations page, click + Add New.
- On the Add Data Sources or Integrations page, search for Microsoft 365, then hover over it and click Add.
- On the Microsoft 365 integration instance settings page, do the following:
- In the Display Name field, enter a name for your Microsoft 365 integration instance.
- In the Tenant ID field, enter a tenant ID.
- In the Region list, select a region.
- Click Next.
Authorization
- On the Microsoft 365 Instance screen, if you are an administrator, click the click to authorize link.
- If you do not have administrator permissions, follow the instructions on screen and click Close.
The Microsoft 365 instance should now appear on the Data Sources screen under 3rd Party Data Sources.
Microsoft Teams
This connector includes the following capabilities and sub-capabilities (if applicable):
- Data Security: Scan and protect Microsoft Teams data across channel messages, chats, and shared files. This capability is available with any active Cortex XSIAM, Cortex Cloud Posture Security, Cortex Cloud Runtime Security, or Cortex Data Security license.
- Security Posture: Detect, monitor and alert on settings of your Microsoft Teams application. This capability is available with any active Cortex XSIAM or Cortex Cloud Posture Security license.
- saas-posture-config-remediation: Help remediate the misconfigured security settings of your Microsoft Teams application. This sub-capability is available with any active Cortex XSIAM or Cortex Cloud Posture Security license.
To configure this connector, follow these steps:
Prerequisite
Global Administrator access to the Azure portal
Sign in to the Microsoft Azure portal as a Global Administrator. Use the Create a Microsoft Entra ID page to obtain the following values:
- Tenant ID: Directory ID for your Microsoft Teams tenant.
- Client ID: Application ID generated during app registration.
- Client Secret: Client secret generated for the registered application.
How to configure the Microsoft Teams connector
Task 1. Select services
- In Cortex Cloud, navigate to Settings → Data Sources & Integrations.
- Click + Add new.
-
On the Add Data Source page, search for Microsoft Teams, hover over it, The new Microsoft Teams connector has the description: Microsoft Teams integration for data security across channel messages, chats, and shared files Microsoft Teams integration for security posture management. - Click Add.
Capabilities tab
- Enter a unique name for the new connector instance.
- Data Security will get auto select to scan and protect Microsoft Teams data across channel messages, chats and shared files.
- Click Next.
Connection tab
- On the Connection page, enter the Tenant ID and click Apply.
- After the Tenant ID is validated, enter the Client ID and Client Secret in their respective fields.
- Click Test to validate the connection settings.
- If the connection is successful, the wizard displays a green Verified status indicator.
Note
If validation fails because of incorrect field values, close the wizard and restart the workflow. The current wizard session cannot be reused after a validation failure.
5. Click Next to proceed.
Summary tab
- On the Summary page, verify that each selected capability displays a Connected status.
- If validation succeeds, the wizard displays a Verification Success message.
- Click Create Instance to create the Microsoft Teams connector.
Task 2. (Optional) Post verification
After onboarding is complete, verify asset discovery and data security findings.
1. Verify discovered assets
- Go to Inventory > All Assets.
- Filter the asset list by setting Provider to Microsoft Teams.
- Verify that Cortex discovers the following supported asset types:
- Microsoft Teams Workspace: Mapped to Active Directory (AAD) Groups containing Public, Private, or Shared Channels.
2. Verify policy findings
- Select a OneDrive or other supported asset to open the details panel.
- Review the Overview tab for asset health and other details.
- Go to Findings to review detected security findings, including:
- Sensitive Content Detections: Sensitive data matches, such as financial data, health records, credentials, API tokens, credit card numbers, and personally identifiable information (PII), detected in files stored in Microsoft Teams chat messages and conversations.
- Insecure Sharing and External Exposure: includes sensitive information shared in Microsoft Teams chats or conversations with external users or guest users.
Note
- Any user addition to or removal from a Microsoft Teams group chat may take up to 6 hours to be reflected.
- ACLs for messages sent before a user is added to or removed from a Microsoft Teams group chat are not updated to reflect the membership change.
- After onboarding a connector, Cortex Cloud may take 24 hours to 7 days to fully process the data and generate findings. If you attempt to re-onboard the same connector using the same credentials during this transition period, previously generated findings and other data may temporarily reappear.
Azure Log Analytics
Important
This connector is only available for tenants that onboarded after July 26, 2026. For tenants that onboarded before this date, use Marketplace to access the standalone integration. For more information, see Marketplace.
This connector is available with any active Cortex XSIAM, Cortex Cloud Posture Security, or Cortex AgentiX license.
Log Analytics is a service that helps you collect and analyze data generated by resources in your cloud and on-premises environments.
This connector includes the following sub-capabilities (Marketplace integrations link to PAN DEV for more information):
- Azure Log Analytics: Log Analytics is a service that helps you collect and analyze data generated by resources in your cloud and on-premises environments.
To configure this connector, follow the steps outlined in the configuration wizard.
Azure Services
Important
This connector is only available for tenants that onboarded after July 26, 2026. For tenants that onboarded before this date, use Marketplace to access the standalone integration. For more information, see Marketplace.
Integrate with Microsoft Azure services. Create and manage Azure Virtual Machines (Azure Compute), deploy and manage containerized applications with Azure Kubernetes Services (AKS), filter network traffic with Azure Network Security Groups, manage auditing and threat policies for Azure SQL, deploy and manage storage accounts, blob services, containers, file shares, tables, and queues (Azure Storage), query resources at scale with Azure Resource Graph, collect and analyze data in Azure Data Explorer clusters, and safeguard and manage cryptographic keys and secrets with Azure Key Vault.
This connector includes the following sub-capabilities (Marketplace integrations link to PAN DEV for more information):
- Azure Compute v2: Create and Manage Azure Virtual Machines. This sub-capability is available with any active Cortex XSIAM or Cortex AgentiX license.
- Azure Kubernetes Services: Deploy and manage containerized applications with a fully managed Kubernetes service. This sub-capability is available with any active Cortex XSIAM or Cortex AgentiX license.
- Azure Network Security Groups: Azure network security groups are used to filter network traffic to and from Azure resources in an Azure virtual network. This sub-capability is available with any active Cortex XSIAM or Cortex AgentiX license.
- Azure Resource Graph: Azure Resource Graph integration is designed to allow for executing Azure Resource Graph commands, like querying resource data. This sub-capability is available with any active Cortex XSIAM, Cortex Cloud Posture Security, or Cortex AgentiX license.
- Azure SQL Management: Microsoft Azure SQL Management Integration manages the Auditing and Threat Policies for Azure SQL. This sub-capability is available with any active Cortex XSIAM or Cortex AgentiX license.
- Azure Storage: Deploy and manage storage accounts and blob services. This sub-capability is available with any active Cortex XSIAM or Cortex AgentiX license.
- Azure Storage Container: Create and Manage Azure Storage Container services. This sub-capability is available with any active Cortex XSIAM or Cortex AgentiX license.
- Azure Storage FileShare: Create and Manage Azure FileShare Files and Directories. This sub-capability is available with any active Cortex XSIAM or Cortex AgentiX license.
- Azure Storage Queue: Create and Manage Azure Storage Queues and Messages. This sub-capability is available with any active Cortex XSIAM or Cortex AgentiX license.
- Azure Storage Table: Create and Manage Azure Storage Tables and Entities. This sub-capability is available with any active Cortex XSIAM or Cortex AgentiX license.
- AzureDataExplorer: Use the Azure Data Explorer integration to collect and analyze data inside Azure Data Explorer clusters, and to manage search queries. This sub-capability is available with any active Cortex XSIAM or Cortex AgentiX license.
- AzureKeyVault: Use the Azure Key Vault integration to safeguard and manage cryptographic keys and secrets used by cloud applications and services. This sub-capability is available with any active Cortex XSIAM, Cortex Cloud Posture Security, or Cortex AgentiX license.
To configure this connector, follow the steps outlined in the configuration wizard.
Azure WAF
Important
This connector is only available for tenants that onboarded after July 26, 2026. For tenants that onboarded before this date, use Marketplace to access the standalone integration. For more information, see Marketplace.
This connector is available with any active Cortex XSIAM or Cortex AgentiX license.
Azure Web Application Firewall (WAF) provides centralized protection of your web applications from common web exploits and vulnerabilities, such as SQL injection and cross-site scripting. It operates as an application-level firewall and integrates with Azure services like Azure Application Gateway, Azure Front Door, and Azure CDN. This connector lets you control policies configured in the Azure Firewall management platform — add, delete, or update policies, and get details of a specific policy or a list of policies.
This connector includes the following sub-capabilities (Marketplace integrations link to PAN DEV for more information):
- AzureWAF: The Azure WAF (Web Application Firewall) integration provides centralized protection for web applications against common exploits and vulnerabilities. It lets you control policies configured in the Azure Firewall management platform.
To configure this connector, follow the steps outlined in the configuration wizard.
Microsoft Active Directory
Important
This connector is only available for tenants that onboarded after July 26, 2026. For tenants that onboarded before this date, use Marketplace to access the standalone integration. For more information, see Marketplace.
This connector is available with any active Cortex XSIAM, Cortex Cloud Posture Security, Cortex Cloud, Cortex Cloud Runtime Security, Cortex XDR, or Cortex AgentiX license.
Access and manage Active Directory users, contacts, and computers. Run Active Directory queries, manage users, and add or remove users and computers from groups.
Follow the configuration wizard to configure this connector.
Microsoft Identity
Important
This connector is only available for tenants that onboarded after July 26, 2026. For tenants that onboarded before this date, use Marketplace to access the standalone integration. For more information, see Marketplace.
Manage Microsoft Entra ID (formerly Azure Active Directory) identity resources — users, groups, applications and service principals, directory roles, conditional access, and risky users — and ingest Azure public IP address and endpoint indicator feeds. Fetches Microsoft Entra ID Protection risk detections as issues and enables automation and remediation across the Microsoft Graph and Azure APIs.
This connector includes the following sub-capabilities (Marketplace integrations link to PAN DEV for more information):
- Azure AD Connect Health Feed: Use the Microsoft Azure AD Connect Health Feed integration to get indicators from the feed. This sub-capability is available with any active Cortex XSIAM or Cortex AgentiX license.
- AzureFeed: This sub-capability is available with any active Cortex XSIAM or Cortex AgentiX license.
- AzureRiskyUsers: Azure Risky Users provides access to all at-risk users and risk detections in the Azure AD environment. This sub-capability is available with any active Cortex XSIAM, Cortex Cloud Posture Security, Cortex Cloud, Cortex Cloud Runtime Security, Cortex XDR, or Cortex AgentiX license.
- Microsoft Graph Groups: Entra ID Groups integration (formely Azure Active Directory Groups) enables you to create and manage different types of groups and group functionality according to your requirements. This sub-capability is available with any active Cortex XSIAM, Cortex Cloud Posture Security, Cortex Cloud, Cortex Cloud Runtime Security, Cortex XDR, or Cortex AgentiX license.
- Microsoft Graph User: The Entra ID Users integration (formerly Azure Active Directory Users) is a Unified gateway to security insights - all from a unified Microsoft Graph User API. This sub-capability is available with any active Cortex XSIAM, Cortex Cloud Posture Security, Cortex Cloud, Cortex Cloud Runtime Security, Cortex XDR, or Cortex AgentiX license.
- MicrosoftGraphApplications: Use the Entra ID Applications integration (formerly Azure Active Directory Applications) to manage authorized applications. This sub-capability is available with any active Cortex XSIAM, Cortex Cloud Posture Security, Cortex Cloud, Cortex Cloud Runtime Security, Cortex XDR, or Cortex AgentiX license.
- MicrosoftGraphIdentityandAccess: Use the Entra ID Identity And Access integration to manage roles and members (formerly Azure Active Directory Identity And Access). This sub-capability is available with any active Cortex XSIAM, Cortex Cloud Posture Security, Cortex Cloud, Cortex Cloud Runtime Security, Cortex XDR, or Cortex AgentiX license.
To configure this connector, follow the steps outlined in the configuration wizard.
Microsoft Intune
Important
This connector is only available for tenants that onboarded after July 26, 2026. For tenants that onboarded before this date, use Marketplace to access the standalone integration. For more information, see Marketplace.
This connector is available with any active Cortex XSIAM or Cortex AgentiX license.
Microsoft Intune Feed collects the public IP addresses, domains, and URLs that function as endpoints for Microsoft Intune and delivers them as an indicator feed. It automates scraping this endpoint data, which Microsoft publishes as HTML rather than through a REST API, so IT and Security teams can validate the indicators before using them in enforcement points such as firewalls and proxies.
This connector includes the following sub-capabilities (Marketplace integrations link to PAN DEV for more information):
To configure this connector, follow the steps outlined in the configuration wizard.
Microsoft Security Automation and Collection
Important
This connector is only available for tenants that onboarded after July 26, 2026. For tenants that onboarded before this date, use Marketplace to access the standalone integration. For more information, see Marketplace.
Integrate with Microsoft products.
This connector includes the following sub-capabilities (Marketplace integrations link to PAN DEV for more information):
- Azure Security Center v2: Unified security management and advanced threat protection across hybrid cloud workloads. This sub-capability is available with any active Cortex XSIAM or Cortex AgentiX license.
- Azure Sentinel: Microsoft Sentinel is a scalable, cloud-native solution that provides: Security information and event management (SIEM) Security orchestration, automation, and response (SOAR). This sub-capability is available with any active Cortex XSIAM or Cortex AgentiX license.
- Microsoft 365 Defender: Microsoft 365 Defender is a unified pre- and post-breach enterprise defense suite that natively coordinates detection, prevention, investigation, and response across endpoints, identities, email, and applications to provide integrated protection against sophisticated attacks. This sub-capability is available with any active Cortex XSIAM, Cortex Cloud, Cortex Cloud Runtime Security, Cortex XDR, or Cortex AgentiX license.
- Microsoft Defender Advanced Threat Protection: Microsoft Defender for Endpoint (previously Microsoft Defender Advanced Threat Protection (ATP)) is a unified platform for preventative protection, post-breach detection, automated investigation, and response. This sub-capability is available with any active Cortex XSIAM or Cortex AgentiX license.
- Microsoft Defender for Cloud Apps Event Collector: This sub-capability is available with any active Cortex XSIAM license.
- Microsoft Defender for Cloud Event Collector: XSIAM collector for Microsoft Defender for Cloud alerts. This sub-capability is available with any active Cortex XSIAM license.
- Microsoft Graph: This sub-capability is available with any active Cortex XSIAM, Cortex Cloud Posture Security, Cortex Cloud, Cortex Cloud Runtime Security, Cortex XDR, or Cortex AgentiX license.
- MicrosoftCloudAppSecurity: Microsoft Cloud App Security is a multimode Cloud Access Security Broker (CASB). It provides rich visibility, control over data travel, and sophisticated analytics to identify and combat cyber threats across all your cloud services. Use the integration to view and resolve alerts, view activities, view files, and view user accounts. This sub-capability is available with any active Cortex XSIAM or Cortex AgentiX license.
- MicrosoftDefenderThreatIntelligence: Use the Microsoft Defender Threat Intelligence integration to query enriched threat intelligence data such as articles, threat actor profiles, WHOIS records, and host-related infrastructure. This sub-capability is available with any active Cortex XSIAM or Cortex AgentiX license.
- O365 Defender SafeLinks: Provides URL scanning and rewriting of inbound email messages in mail flow, and time-of-click verification of URLs and links in email messages and other locations. This sub-capability is available with any active Cortex XSIAM, Cortex Cloud, Cortex Cloud Runtime Security, Cortex XDR, or Cortex AgentiX license.
To configure this connector, follow the steps outlined in the configuration wizard.
Microsoft Windows Tools
Important
This connector is only available for tenants that onboarded after July 26, 2026. For tenants that onboarded before this date, use Marketplace to access the standalone integration. For more information, see Marketplace.
This connector is available with any active Cortex XSIAM or Cortex AgentiX license.
Connect to Windows hosts to run scripts and commands remotely for tasks such as acquiring forensic data, gathering information, and remediating hosts. Uses PowerShell Remoting (built on the Windows Management Framework and Windows Remote Management) and the pywinrm library to create remote sessions and execute processes or PowerShell scripts.
This connector includes the following sub-capabilities (Marketplace integrations link to PAN DEV for more information):
- PowerShell Remoting: PowerShell Remoting is a comprehensive built-in remoting subsystem that is a part of Microsoft's native Windows management framework (WMF) and Windows remote management (WinRM).\
This feature allows you to handle most remoting tasks in any configuration you might encounter by creating a remote PowerShell session to Windows hosts and executing commands in the created session.\
The integration includes out-of-the-box commands which supports agentless forensics for remote hosts. - Windows Remote Management: Uses the Python pywinrm library and commands to execute either a process or using Powershell scripts.
To configure this connector, follow the steps outlined in the configuration wizard.
M365 Automation and Collection
Important
This connector is only available for tenants that onboarded after July 26, 2026. For tenants that onboarded before this date, use Marketplace to access the standalone integration. For more information, see Marketplace.
Automate and collect across Microsoft 365 and Office 365 services, including Exchange Online mail (EWS and Microsoft Graph), Outlook calendars, Microsoft Teams messaging and management, the Microsoft Management Activity (O365/Azure) audit feed, unified audit-log policy and compliance search, message trace, endpoint configuration management, and the Office 365 IP/URL feed. Send messages and notifications, manage mailboxes and teams, search and remediate email, and fetch issues, indicators, and logs from your M365 tenant.
This connector includes the following sub-capabilities (Marketplace integrations link to PAN DEV for more information):
- EWS Extension Online Powershell v3: This sub-capability is available with any active Cortex XSIAM, Cortex Cloud Posture Security, Cortex Cloud, Cortex Cloud Runtime Security, Cortex XDR, or Cortex AgentiX license.
- EWS v2: Exchange Web Services and Office 365 (mail). This sub-capability is available with any active Cortex XSIAM, Cortex Cloud Posture Security, Cortex Cloud, Cortex Cloud Runtime Security, Cortex XDR, or Cortex AgentiX license.
- EWSO365: The new EWS O365 integration uses OAuth 2.0 protocol and can be used with Exchange Online and Office 365 (mail). This sub-capability is available with any active Cortex XSIAM, Cortex Cloud Posture Security, Cortex Cloud, Cortex Cloud Runtime Security, Cortex XDR, or Cortex AgentiX license.
- Microsoft Endpoint Configuration Manager: This sub-capability is available with any active Cortex XSIAM or Cortex AgentiX license.
- Microsoft Graph Calendar: O365 Outlook Calendar enables you to create and manage different calendars and events according to your requirements. This sub-capability is available with any active Cortex XSIAM, Cortex Cloud, Cortex Cloud Runtime Security, Cortex XDR, or Cortex AgentiX license.
- Microsoft Graph Mail Single User: This sub-capability is available with any active Cortex XSIAM, Cortex Cloud, Cortex Cloud Runtime Security, Cortex XDR, or Cortex AgentiX license.
- Microsoft Management Activity API (O365 Azure Events): This sub-capability is available with any active Cortex XSIAM, Cortex Cloud Posture Security, or Cortex AgentiX license.
- Microsoft Teams: Send messages and notifications to your team members. This sub-capability is available with any active Cortex XSIAM, Cortex Cloud Posture Security, Cortex Cloud, Cortex Cloud Runtime Security, Cortex XDR, or Cortex AgentiX license.
- Microsoft Teams Management: Manage teams and members in Microsoft Teams. This sub-capability is available with any active Cortex XSIAM, Cortex Cloud Posture Security, Cortex Cloud, Cortex Cloud Runtime Security, Cortex XDR, or Cortex AgentiX license.
- Microsoft Teams via Webhook: This sub-capability is available with any active Cortex XSIAM, Cortex Cloud Posture Security, Cortex Cloud, Cortex Cloud Runtime Security, Cortex XDR, or Cortex AgentiX license.
- Microsoft_Graph_Files: Use the O365 File Management (Onedrive/Sharepoint/Teams) integration to enable your app to get authorized access to files in OneDrive, SharePoint, and MS Teams across your entire organization. This integration requires admin consent. This sub-capability is available with any active Cortex XSIAM, Cortex Cloud, Cortex Cloud Runtime Security, Cortex XDR, or Cortex AgentiX license.
- MicrosoftGraphMail: Microsoft Graph lets your app get authorized access to a user's Outlook mail data in a personal or organization account. This sub-capability is available with any active Cortex XSIAM, Cortex Cloud, Cortex Cloud Runtime Security, Cortex XDR, or Cortex AgentiX license.
- MicrosoftPolicyAndComplianceAuditLog: Use the integration to get logs from the O365 service. This sub-capability is available with any active Cortex XSIAM, Cortex Cloud Posture Security, or Cortex AgentiX license.
- O365 Message Trace: This sub-capability is available with any active Cortex XSIAM license.
- Office 365 Feed: This sub-capability is available with any active Cortex XSIAM or Cortex AgentiX license.
To configure this connector, follow the steps outlined in the configuration wizard.
MISP
Here are the articles in this section:
MISP
Important
This connector is only available for tenants that onboarded after July 26, 2026. For tenants that onboarded before this date, use Marketplace to access the standalone integration. For more information, see Marketplace.
This connector is available with any active Cortex XSIAM or Cortex AgentiX license.
MISP (Malware Information Sharing Platform) is an open-source threat intelligence and threat sharing platform. This connector retrieves and ingests threat actor information from the MISP threat actor galaxy, ingests feeds into Cortex Threat Intel Management (TIM) via an MISP instance, and enriches indicators using data from an MISP instance.
This connector includes the following sub-capabilities (Marketplace integrations link to PAN DEV for more information):
- FeedMISPThreatActors: Fetches the MISP threat actor galaxy and builds it into Threat Actor indicators in Cortex Threat Intel Management (TIM).
- MISP Feed:
- MISP V3: Malware information sharing platform and threat sharing.
To configure this connector, follow the steps outlined in the configuration wizard.
MITRE
Here are the articles in this section:
MITRE
Important
This connector is only available for tenants that onboarded after July 26, 2026. For tenants that onboarded before this date, use Marketplace to access the standalone integration. For more information, see Marketplace.
This connector is available with any active Cortex XSIAM or Cortex AgentiX license.
MITRE ATT&CK is a globally-accessible knowledge base of adversary tactics and techniques based on real-world observations of cyber security threats. Use the MITRE ATT&CK Feed to fetch indicators from MITRE ATT&CK in STIX format — techniques and sub-techniques as Attack Patterns, groups as Intrusion Sets, software as Tools or Malware, and mitigations as Courses of Action.
This connector includes the following sub-capabilities (Marketplace integrations link to PAN DEV for more information):
To configure this connector, follow the steps outlined in the configuration wizard.
Monday
Here are the articles in this section:
Monday
Important
This connector is only available for tenants that onboarded after July 26, 2026. For tenants that onboarded before this date, use Marketplace to access the standalone integration. For more information, see Marketplace.
This connector is available with any active Cortex XSIAM, Cortex Cloud, or Cortex Cloud Runtime Security license.
Monday.com is a work operating system that powers teams to run projects and workflows with confidence. Collect activity logs and audit logs from Monday.com for threat detection and compliance monitoring in Cortex XSIAM.
This connector includes the following sub-capabilities (Marketplace integrations link to PAN DEV for more information):
- MondayEventCollector: Collects Monday.com audit logs and activity events for Cortex XSIAM using OAuth 2.0 authentication.
To configure this connector, follow the steps outlined in the configuration wizard.
Monday.com
The capabilities and sub-capabilities listed for this connector are available with any active Cortex XSIAM or Cortex Cloud Posture Security license.
This connector includes the following capabilities and sub-capabilities (if applicable):
- Security Posture: Detect, monitor and alert on settings of your SaaS application.
- saas-posture-config-remediation: Help remediate the misconfigured security settings of your SaaS application.
To configure this connector, follow the steps outlined in the configuration wizard.
MongoDB
Here are the articles in this section:
How to onboard MongoDB Atlas (Posture)
Overview
Integrate Cloud Security with your MongoDB Atlas account to gain comprehensive visibility into any data and posture risk existing in your MongoDB Atlas environment. This integration enables automated scanning of all assets in MongoDB Atlas, including data classification and risk assessment.
Prerequisites
- You are an administrator.
- You have the following information:
- Organization ID
- Service account client ID
- Service account client secret
- You have created a service principal and granted it permissions.
Add configuration details
- Go to Settings > Data Sources & Integrations and then on the Data Sources & Integrations screen, click + Add New.
- On the Add Data Sources or Integrations page, click Show More > Database and then click on the MongoDB Atlas (Posture) card and then click Add.\
Alternatively, you can enter “Mongo” in the Search Sources filter field, and then click on the MongoDB Atlas (Posture) card > Add as mentioned above. - In the MongoDB Atlas (Posture) Instance screen, enter the following:
- Display Name
- MongoDB Atlas Organization ID
- Client ID
- Client Secret
- Optional: If your MongoDB Atlas account is protected by network policies, turn on the toggle, then select the required regions for each cloud provider (AWS, Azure, GCP).
- Click Next.
Establish a connection
- In the IP List, select the IPs from the regions that you had selected that you want to whitelist. A tooltip shows the selected regions for the cloud platforms you are using.
- A script is generated that needs to be run in the MongoDB Atlas account.
Set up your MongoDB Atlas connection
- Open your MongoDB console in a new tab.
- Copy or download the script provided in step 2 above and run it in the MongoDB CLI.
- Proceed to verifying the connection.
Verify the connection
- Click Verify Connection.\
NOTE: Keep the screen open for the duration of the connection verification. - Once you see the Instance Created Successfully message on the screen, you can click Close.
- You can now go back to the Data Sources & Integrations screen and MongoDB Atlas (Posture) should appear in the list with relevant details such as Vendor and Instances Status. To see more details, click on the row and a pane opens with further account details such as connection status and more.
MongoDB
Important
This connector is only available for tenants that onboarded after July 26, 2026. For tenants that onboarded before this date, use Marketplace to access the standalone integration. For more information, see Marketplace.
Connect to MongoDB to search and query entries, manipulate key/value pairs, and write log data to MongoDB collections. Also fetch and manage alerts and events from MongoDB Atlas, the fully managed cloud database service.
This connector includes the following sub-capabilities (Marketplace integrations link to PAN DEV for more information):
- MongoDB: Use the MongoDB integration to search and query entries in your MongoDB. This sub-capability is available with any active Cortex XSIAM or Cortex AgentiX license.
- MongoDB Key Value Store: Manipulates key/value pairs according to an incident utilizing the MongoDB collection. This sub-capability is available with any active Cortex XSIAM or Cortex AgentiX license.
- MongoDB Log: Writes log data to a MongoDB collection. This sub-capability is available with any active Cortex XSIAM or Cortex AgentiX license.
- MongoDBAtlasEventCollector: MongoDB Atlas is an integration that supports fetching and managing alerts and events within Cortex XSIAM. This sub-capability is available with any active Cortex XSIAM license.
To configure this connector, follow the steps outlined in the configuration wizard.
MongoDB Atlas
The capabilities and sub-capabilities listed for this connector are available with any active Cortex XSIAM, Cortex Cloud Posture Security, Cortex Cloud Runtime Security, or Cortex Data Security license.
Secure configurations and monitor identity risks across your MongoDB Atlas environment.
This connector includes the following capabilities and sub-capabilities (if applicable):
- Identity Posture: Maintain visibility and control over MongoDB Atlas identities, including users, groups, roles, and privileges.
- SaaS Posture Configuration Monitoring: Detect, monitor and alert on settings of your SaaS application.
- saas-posture-config-remediation: Help remediate the misconfigured security settings of your SaaS application.
To configure this connector, follow the steps outlined in the configuration wizard.
MuleSoft
Here are the articles in this section:
MuleSoft
The capabilities and sub-capabilities listed for this connector are available with any active Cortex XSIAM or Cortex Cloud Posture Security license.
This connector includes the following capabilities and sub-capabilities (if applicable):
- SaaS Posture Configuration Monitoring: Detect, monitor and alert on settings of your SAAS application.
- saas-posture-config-remediation: Help remediate the misconfigured security settings of your SAAS application.
To configure this connector, follow the steps outlined in the configuration wizard.
Mural
Here are the articles in this section:
Mural
The capabilities and sub-capabilities listed for this connector are available with any active Cortex XSIAM or Cortex Cloud Posture Security license.
This connector includes the following capabilities and sub-capabilities (if applicable):
- SaaS Posture Configuration Monitoring: Detect, monitor and alert on settings of your SAAS application.
- saas-posture-config-remediation: Help remediate the misconfigured security settings of your SAAS application.
To configure this connector, follow the steps outlined in the configuration wizard.
MxToolBox
Here are the articles in this section:
MxToolBox
Important
This connector is only available for tenants that onboarded after July 26, 2026. For tenants that onboarded before this date, use Marketplace to access the standalone integration. For more information, see Marketplace.
This connector is available with any active Cortex XSIAM or Cortex AgentiX license.
Use MXToolbox to check for website and server issues. MXToolbox monitors and analyzes server systems around the world, and can be queried for threat intelligence information.
This connector includes the following sub-capabilities (Marketplace integrations link to PAN DEV for more information):
- MxToolBox: All of your MX record, DNS, blacklist and SMTP diagnostics in one integrated tool.
To configure this connector, follow the steps outlined in the configuration wizard.
NetBox
Here are the articles in this section:
NetBox
Important
This connector is only available for tenants that onboarded after July 26, 2026. For tenants that onboarded before this date, use Marketplace to access the standalone integration. For more information, see Marketplace.
This connector is available with any active Cortex XSIAM license.
Collect events automatically from NetBox, the network source of truth for infrastructure. You can also use the netbox-get-events command to manually collect events.
This connector includes the following sub-capabilities (Marketplace integrations link to PAN DEV for more information):
- NetBox Event Collector: NetBox event collector integration for Cortex XSIAM.
To configure this connector, follow the steps outlined in the configuration wizard.
Netcraft
Here are the articles in this section:
Netcraft
Important
This connector is only available for tenants that onboarded after July 26, 2026. For tenants that onboarded before this date, use Marketplace to access the standalone integration. For more information, see Marketplace.
This connector is available with any active Cortex XSIAM or Cortex AgentiX license.
Netcraft protects organizations against cybercrime threats such as phishing, fraud, and malware. This connector integrates Netcraft's takedown, submission, and screenshot management services to report suspicious URLs, emails, and files, obtain their screenshots, and track takedowns.
This connector includes the following sub-capabilities (Marketplace integrations link to PAN DEV for more information):
To configure this connector, follow the steps outlined in the configuration wizard.
Netmiko
Here are the articles in this section:
Netmiko
Important
This connector is only available for tenants that onboarded after July 26, 2026. For tenants that onboarded before this date, use Marketplace to access the standalone integration. For more information, see Marketplace.
This connector is available with any active Cortex XSIAM or Cortex AgentiX license.
Netmiko provides SSH-based access to network devices, servers, and other appliances that support this method of configuration. For a complete list of supported platforms, see Netmiko Platforms.md on GitHub.
This connector includes the following sub-capabilities (Marketplace integrations link to PAN DEV for more information):
- Netmiko: Multi-vendor library to simplify SSH connections to network devices. Utilizes the Python library Netmiko for connections. Supports SSH Key authentication and username / password.
To configure this connector, follow the steps outlined in the configuration wizard.
NetQuest
Here are the articles in this section:
NetQuest
Important
This connector is only available for tenants that onboarded after July 26, 2026. For tenants that onboarded before this date, use Marketplace to access the standalone integration. For more information, see Marketplace.
This connector is available with any active Cortex XSIAM or Cortex AgentiX license.
NetQuest's products are high-capacity service nodes that help security teams access and analyze network traffic. Powerful packet and flow processing features assist security tools in detecting and mitigating security threats as cost effectively as possible.
This connector includes the following sub-capabilities (Marketplace integrations link to PAN DEV for more information):
- NetQuestOMX: NetQuest's products are high-capacity service nodes that help security teams access and analyze network traffic. Powerful packet and flow processing features assist security tools in detecting and mitigating security threats as cost effectively as possible.
To configure this connector, follow the steps outlined in the configuration wizard.
Netskope
Here are the articles in this section:
Netskope
Important
This connector is only available for tenants that onboarded after July 26, 2026. For tenants that onboarded before this date, use Marketplace to access the standalone integration. For more information, see Marketplace.
Integrate with Netskope to retrieve alerts and events, collect events extracted from SaaS traffic and logs, and manage quarantine files, URL lists, and hash lists. With the Netskope API you can proactively respond to security threats, enforce web access policies, and administer your Netskope environment.
This connector includes the following sub-capabilities (Marketplace integrations link to PAN DEV for more information):
- netskope_api_v2: Netskope API v2 provides a powerful interface for managing and monitoring Netskope deployments. It enables users to retrieve alerts and events, manage URL lists, and control clients. With Netskope API v2, organizations can proactively respond to security threats, enforce web access policies, and efficiently administer their Netskope environment. This sub-capability is available with any active Cortex XSIAM or Cortex AgentiX license.
- NetskopeAPIv1: Get alerts and events, manage quarantine files as well as URL and hash lists using Netskope API v1. This sub-capability is available with any active Cortex XSIAM or Cortex AgentiX license.
- NetskopeEventCollector_v2: Netskope Event Collector v2 integration. This sub-capability is available with any active Cortex XSIAM license.
To configure this connector, follow the steps outlined in the configuration wizard.
Nintex Workflow Cloud
Here are the articles in this section:
Nintex Workflow Cloud
The capabilities and sub-capabilities listed for this connector are available with any active Cortex XSIAM or Cortex Cloud Posture Security license.
This connector includes the following capabilities and sub-capabilities (if applicable):
- SaaS Posture Configuration Monitoring: Detect, monitor and alert on settings of your SAAS application.
- saas-posture-config-remediation: Help remediate the misconfigured security settings of your SAAS application.
To configure this connector, follow the steps outlined in the configuration wizard.
NIST
Here are the articles in this section:
NIST
Important
This connector is only available for tenants that onboarded after July 26, 2026. For tenants that onboarded before this date, use Marketplace to access the standalone integration. For more information, see Marketplace.
This connector is available with any active Cortex XSIAM or Cortex AgentiX license.
CVE feed from the NIST National Vulnerability Database (NVD). Use this feed to create a feed of CVEs from NIST, using v2 of the NVD API and supporting the latest CVSS - Common Vulnerability Scoring System standard.
This connector includes the following sub-capabilities (Marketplace integrations link to PAN DEV for more information):
-
FeedNVDv2: This feed pulls CVE information from the NIST National Vulnerability Database using v2.0 of the API.
By default, CVEs with a REJECTED status are excluded. Enable 'Include Rejected CVEs' to ingest them.
This integration/feed deprecates the original National Vulnerability Database Feed integraiton as v1.0 of the API is being sunsetted in 2023.
To configure this connector, follow the steps outlined in the configuration wizard.
nmap
Here are the articles in this section:
nmap
Important
This connector is only available for tenants that onboarded after July 26, 2026. For tenants that onboarded before this date, use Marketplace to access the standalone integration. For more information, see Marketplace.
This connector is available with any active Cortex XSIAM or Cortex AgentiX license.
Nmap scans your network and discovers everything connected to it, along with a wide variety of information about what's connected, what services each host is operating, and so on. It helps you protect your network by allowing you to quickly spot security vulnerabilities in your systems. Runs nmap scans with the given parameters.
This connector includes the following sub-capabilities (Marketplace integrations link to PAN DEV for more information):
- nmap: Run nmap scans with the given parameters.
To configure this connector, follow the steps outlined in the configuration wizard.
NAVEX
Here are the articles in this section:
NAVEX
Important
This connector is only available for tenants that onboarded after July 26, 2026. For tenants that onboarded before this date, use Marketplace to access the standalone integration. For more information, see Marketplace.
This connector is available with any active Cortex XSIAM or Cortex AgentiX license.
Use the LockPath KeyLight integration to manage GRC tickets in the Keylight platform. Fetch records from a component as issues and manage tickets in NAVEX Global's Lockpath KeyLight.
This connector includes the following sub-capabilities (Marketplace integrations link to PAN DEV for more information):
- Lockpath KeyLight v2: Use the LockPath KeyLight integration to manage GRC tickets in the Keylight platform.
To configure this connector, follow the steps outlined in the configuration wizard.
Nutanix
Here are the articles in this section:
Nutanix
Important
This connector is only available for tenants that onboarded after July 26, 2026. For tenants that onboarded before this date, use Marketplace to access the standalone integration. For more information, see Marketplace.
This connector is available with any active Cortex XSIAM or Cortex AgentiX license.
Nutanix Hypervisor abstracts and isolates the VMs and their programs from the underlying server hardware, enabling a more efficient use of physical resources, simpler maintenance and operations, and reduced costs. This integration was integrated and tested with version v2 of Nutanix.
This connector includes the following sub-capabilities (Marketplace integrations link to PAN DEV for more information):
- Nutanix Hypervisor: Nutanix Hypervisor abstracts and isolates the VMs and their programs from the underlying server hardware, enabling a more efficient use of physical resources, simpler maintenance and operations, and reduced costs.
To configure this connector, follow the steps outlined in the configuration wizard.
Okta
You can configure collecting Okta logs and data using a Standard Collector, content pack integration (onboarded prior to July 26, 2026), or connectors:
| Collection Method | Description |
|---|---|
| Standard Collector overview | Forward logs and data to Cortex XSIAM from Okta using the Okta data source. |
| Link to Standard Collector instructions | <p>The following types of logs can be ingested from Okta:</p><ul><li>Activity logs</li></ul><p>For more information, see Ingest logs and data from Okta.</p> |
| Link to content pack/integration details (onboarded prior to July 26, 2026) | <p>The Okta content pack integrates with Okta's cloud-based identity management service to provide identity-centric visibility, enrichment, and automated response capabilities against threats. It contains automations, classifiers, modeling rules, parsing rules, playbooks, and scripts. It also includes the following integrations:</p><ul><li>Okta IAM: Use this integration to interact with Okta's Identity Access Management service for executing CRUD operations related to employee lifecycle processes. It supports commands for selected features, such as those related to the Preference Center.</li><li>Okta v2: Use this integration to integrate with Okta's cloud-based identity management service. It includes commands such as okta-expire-password, which can optionally revoke existing sessions and require a password change at next login, and supports updating network zones and getting user information by email.</li><li>Okta Event Collector: Use this integration to collect event logs for authentication and Audit provided by the Okta admin API. It supports fetching events and includes commands related to date parsing.</li></ul> |
| Link to connectors | <ul><li>Okta Automation and Collection (onboarded after July 26, 2026)</li><li>Okta connector</li></ul> |
Ingest logs and data from Okta
Product availability and licensing
The options available in the UI depend on your specific product license:
| Feature | Cloud Posture Security | Cloud Runtime Security | Cortex XDR Cloud | Cortex XSIAM NG SIEM, Cortex XSIAM Enterprise, and Cortex XSIAM Premium | Cortex XSIAM Enterprise Plus |
|---|---|---|---|---|---|
| Collect Logs | Enabled | Enabled with Data Collection add-on | Enabled with Data Collection add-on | Enabled | Enabled |
| Collect Configuration | Enabled | Enabled | Enabled with Cloud Posture Security or Cloud Runtime Security add-on | Enabled with Cloud Posture Security or Cloud Runtime Security add-on | Disabled |
Prerequisite
Administrator privileges: Your Okta user must have a role capable of creating API tokens, such as Read-only Administrator, Super Administrator, or Organization Administrator. For more information, see the Okta Administrators Documentation.
To receive logs and configuration data from Okta, configure the Data Sources & Integrations settings in Cortex XSIAM. Once enabled, the system immediately begins ingesting activity logs activity logs and identity configuration metadata, according to your configuration settings.
Activity logs are searchable in the okta_sso_raw dataset and normalized to xdr_data or saas_audit_logs.
API rate limits and monitoring
The Okta API enforces concurrent rate limits. To prevent service disruption:
- The Okta data collector includes a mechanism that automatically reduces the amount of requests whenever an error is received from the Okta API indicating that too many requests have already been sent.
- To ensure you are notified when this occurs, an alert is displayed in the Notification Area and a record is added to the Management Audit Logs.
How to configure the Okta collection?
Step 1: Configure Okta for integration
Perform these steps in your Okta Admin Console to prepare for the connection.
- Identify your Okta Domain:
- From the Okta Dashboard, click the down arrow under your name in the top-right corner.
- Copy the Org URL, such as
https://example.okta.com, and save it for the Okta Domain field in Cortex XSIAM.
For more information, see the Okta Documentation.
- Obtain your authentication token in Okta:
- Select Security → API → Tokens, and click Create token.
- Set the following parameters for the token:
- What do you want your token to be named?: Specify the name for your token, which is used for tracking API calls.
- API calls made with this token must originate from: Select Any IP.
- Click Create token. You may need to login to Okta again using your MFA administrator credentials.
- Your token is successfully created. Copy the Token Value and record it immediately. You will need this for the TOKEN field in Cortex XSIAM. Once you close the dialog box by clicking Ok, got it, you won't be able to access the token again and will have to create a new one if you didn't record it.
Step 2: Configure the Okta Collector in Cortex XSIAM
- Select Settings → Data Sources & Integrations.
- On the Data Sources & Integrations page, click + Add New, search for Okta, then hover over it and click Add.
- Integrate the Okta authentication service with Cortex XSIAM:
- Enter the Okta Domain (Org URL) and Token obtained in Step 1.
- Collect Logs: Select this option to ingest activity logs.
- (Optional) Define an Event Filter to configure collection for events of your choosing.
- All events are collected by default unless you define an Okta API Filter expression, such as
filter=eventType eq “user.session.start”. - For Okta information to be woven into authentication stories,
“user.authentication.sso”events must be collected.
- All events are collected by default unless you define an Okta API Filter expression, such as
- Collect Configuration: This option is disabled and can't be configured.
- Test the connection.
- Click Enable.
Step 3. Accessing the data
Data is routed differently depending on which collection option is enabled:
- Activity Data (using Collect Logs)
- XQL: Searchable using the
okta_sso_rawdataset. - Normalization: Depending on the event type, data is normalized to either
xdr_dataorsaas_audit_logsdatasets.
- XQL: Searchable using the
- Configuration data (using Collect Configuration)
Okta Automation and Collection
Important
This connector is only available for tenants that onboarded after July 26, 2026. For tenants that onboarded before this date, use Marketplace to access the standalone integration. For more information, see Marketplace.
Okta integrates with Cortex to help security teams understand and respond to identity threats as they emerge. It provides visibility into each user's groups, roles, and application access to streamline investigations, and enables identity-centric response actions such as suspending accounts, forcing password resets, and prompting step-up authentication. The connector also collects Okta authentication and audit logs, Okta Advanced Server Access (ASA) audit events, and Okta Auth0 logs, and supports Identity Access Management (IAM) CRUD operations for employee lifecycle processes.
This connector includes the following sub-capabilities (Marketplace integrations link to PAN DEV for more information):
- Okta Event Collector: Collects the events log for authentication and Audit provided by Okta admin API. This sub-capability is available with any active Cortex XSIAM license.
- Okta IAM: Integrate with Okta's Identity Access Management service to execute CRUD operations to employee lifecycle processes. This sub-capability is available with any active Cortex XSIAM, Cortex Cloud Posture Security, Cortex Cloud, Cortex Cloud Runtime Security, Cortex XDR, or Cortex AgentiX license.
- Okta v2: Integration with Okta's cloud-based identity management service. This sub-capability is available with any active Cortex XSIAM, Cortex Cloud Posture Security, Cortex Cloud, Cortex Cloud Runtime Security, Cortex XDR, or Cortex AgentiX license.
- OktaASA: Okta Advanced Server Access integration for Cortex XSIAM allows you to fetch logs of a wide range of configuration, enrollment, authentication, and authorization events that occur within the product and on your servers. This sub-capability is available with any active Cortex XSIAM license.
- OktaAuth0EventCollector: Okta Auth0 logs event collector integration for Cortex XSIAM. This sub-capability is available with any active Cortex XSIAM license.
To configure this connector, follow the steps outlined in the configuration wizard.
Okta connector
Secure identity configurations, monitor identity risks, and respond to threats across your Okta environment.
This connector includes the following capabilities and sub-capabilities (if applicable):
- Identity Prevention: Trigger multi-factor authentication (MFA) challenges for users and anomalous access attempts identified by your Conditional Access Policy. This capability is available with any active Cortex Identity Threat license.
- Security Posture: Detect, monitor and alert on settings of your SaaS application. This capability is available with any active Cortex XSIAM or Cortex Cloud Posture Security license.
- saas-posture-config-remediation: Help remediate the misconfigured security settings of your SaaS application. This sub-capability is available with any active Cortex XSIAM or Cortex Cloud Posture Security license.
To configure this connector, follow the steps outlined in the configuration wizard.
OneLogin
You can configure collecting OneLogin logs and data using a Standard Collector, content pack integration (onboarded prior to July 26, 2026), or connector (onboarded after July 26, 2026):
| Collection Method | Description |
|---|---|
| Standard Collector overview | Forward logs and data to Cortex XSIAM from OneLogin via the OneLogin REST APIs using the OneLogin data source. |
| Link to Standard Collector instructions | <p>The following types of data can be ingested from OneLogin:</p><ul><li><p>Log collection</p><ul><li>Events: User logins, administrative operations, provisioning, and a list of all OneLogin event types</li></ul></li><li><p>Directory</p><ul><li>Users: Lists of users.</li><li>Groups: Lists of groups.</li><li>Apps: Lists of apps.</li></ul></li></ul><p>For more information, see Ingest logs and data from OneLogin.</p> |
| Link to content pack/integration details (onboarded prior to July 26, 2026) | <p>The OneLogin content pack provides capabilities for simple customer authentication and streamlined workforce identity operations utilizing APIs. It includes one modeling rule for data normalization and the following integration:</p><ul><li>OneLogin Event Collector: Use this integration to gather simple customer authentication and streamlined workforce identity operations with the onelogin-get-events command.</li></ul> |
| Link to connector (onboarded after July 26, 2026) | OneLogin |
Ingest logs and data from OneLogin
Cortex XSIAM can ingest different types of data from OneLogin accounts using the OneLogin data collector.
To receive logs and data from OneLogin via the OneLogin REST APIs, you must configure the Data Sources & Integrations settings in Cortex XSIAM based on your OneLogin credentials. After you set up data collection, Cortex XSIAM begins receiving new logs and data from the source.
When Cortex XSIAM begins receiving logs, the app creates a new dataset for the different types of data collected and normalizes the ingested data into authentication stories, where specific relevant events are collected in the authentication_story preset for the xdr_data dataset. You can search these datasets using XQL Search queries. For all logs, Cortex XSIAM can generate Cortex XSIAM issues (Analytics, Correlation Rules, IOC, and BIOC), when relevant from OneLogin logs. While Correlation Rules issues are generated on non-normalized and normalized logs, Analytics, IOC, and BIOC issues are only generated on normalized logs.
The following table provides a description of the different types of data you can collect, the collection method and fetch interval for the data collected, and the name of the dataset to use in Cortex Query Language (XQL) queries.
| Data type | Description | Collection method | Fetch interval | Dataset name |
|---|---|---|---|---|
| Log collection | ||||
| Events | User logins, administrative operations, provisioning, and a list of all OneLogin event types | Appends data | 30 seconds | onelogin_events_raw |
| Directory | ||||
| Users | Lists of users | Overwrites data | 10 minutes | onelogin_users_raw |
| Groups | Lists of groups | Overwrites data | 10 minutes | onelogin_groups_raw |
| Apps | Lists of apps | Overwrites data | 10 minutes | onelogin_apps_raw |
Before you configure Cortex XSIAM data collection from OneLogin, make sure you have the following.
- An Advanced OneLogin account.
- Owner or administrator permissions in your OneLogin account which enable Cortex XSIAM to access the OneLogin account and generate the OAuth 2.0 access token.
- A Cortex XSIAM user account with permissions to Read Log Collections, for example an Instance Administrator.
Configure Cortex XSIAM to receive logs and data from OneLogin.
- Log in to OneLogin as an account owner or administrator.
- Under Administration → Developers → API Credentials, Create a New Credential with scope Read All.
- In the credential details page, copy the Client ID and the Client Secret, and save them somewhere safe. You will need to provide these keys when you configure the OneLogin data collector in Cortex XSIAM .
- Navigate to Settings → Data Sources & Integrations.
- On the Data Sources & Integrations page, click + Add New, search for OneLogin, then hover over it and click Add.
- Configure the following parameters.
- Domain: Specify the domain of the OneLogin instance. The domain name must be in the format
https://<subdomain-name>.onelogin.com. - Name: Specify a descriptive and unique name for the configuration.
- Client ID: Specify the Client ID for the OneLogin API credential pair.
- Secret: Specify the Client Secret for the OneLogin API credential pair.
- Collect: Select the types of data to collect. By default, all the options are selected.
- Log Collection
-
Events: Retrieves user logins, administrative operations, provisioning, and OneLogin event types. After normalization, the event types are enriched with the event name and description.
Note
Event data is collected every 30 seconds.
-
- Directory
- Users: Retrieves lists of users.
- Groups: Retrieves lists of groups.
-
Apps: Retrieves lists of apps.
Note
Inventory data snapshots are collected every 10 minutes.
- Log Collection
- Domain: Specify the domain of the OneLogin instance. The domain name must be in the format
- Test the connection settings. If successful, Enable the OneLogin log collection.
When events start to come in, a green check mark appears underneath the OneLogin configuration.
OneLogin
Important
This connector is only available for tenants that onboarded after July 26, 2026. For tenants that onboarded before this date, use Marketplace to access the standalone integration. For more information, see Marketplace.
This connector is available with any active Cortex XSIAM license.
OneLogin provides simple customer authentication and streamlined workforce identity operations. Collect events from the OneLogin API into Cortex.
This connector includes the following sub-capabilities (Marketplace integrations link to PAN DEV for more information):
- OneLogin Event Collector: Simple customer authentication and streamlined workforce identity operations.
To configure this connector, follow the steps outlined in the configuration wizard.
OpenAI
Here are the articles in this section:
OpenAI
Important
This connector is only available for tenants that onboarded after July 26, 2026. For tenants that onboarded before this date, use Marketplace to access the standalone integration. For more information, see Marketplace.
This connector is available with any active Cortex XSIAM or Cortex AgentiX license.
Integrate with OpenAI to interact with GPT models through the Chat Completions endpoint and collect OpenAI Audit logs and ChatGPT Compliance logs as events in Cortex.
This connector includes the following sub-capabilities (Marketplace integrations link to PAN DEV for more information):
- OpenAi ChatGPT v3: Designed to assist security professionals with security investigations, threat hunting, and anomaly detection, leveraging OpenAI GPT models' natural language conversational capabilities.
To configure this connector, follow the steps outlined in the configuration wizard.
OpenCVE
OpenCVE
Important
This connector is only available for tenants that onboarded after July 26, 2026. For tenants that onboarded before this date, use Marketplace to access the standalone integration. For more information, see Marketplace.
This connector is available with any active Cortex XSIAM or Cortex AgentiX license.
OpenCVE is a platform used to locally import the list of CVEs and perform searches on it (by vendors, products, CVSS, CWE...). Users subscribe to vendors or products, and OpenCVE alerts them when a new CVE is created or when an update is done in an existing CVE.
This connector includes the following sub-capabilities (Marketplace integrations link to PAN DEV for more information):
- OpenCVE: Searches for CVE information using OpenCVE.
To configure this connector, follow the steps outlined in the configuration wizard.
OpenLDAP
Here are the articles in this section:
OpenLDAP
Important
This connector is only available for tenants that onboarded after July 26, 2026. For tenants that onboarded before this date, use Marketplace to access the standalone integration. For more information, see Marketplace.
This connector is available with any active Cortex XSIAM or Cortex AgentiX license.
Use your OpenLDAP or Active Directory user authentication settings to log in to Cortex XSOAR. Users log in with their OpenLDAP or Active Directory username and password, and their permissions are set according to the groups and mapping defined in AD Roles Mapping. For connecting to the LDAP server with a TLS connection, it is recommended to use this integration instead of the Active Directory Authentication server integration.
This connector includes the following sub-capabilities (Marketplace integrations link to PAN DEV for more information):
- OpenLDAP: Authenticate using OpenLDAP or Active Directory.
To configure this connector, follow the steps outlined in the configuration wizard.
OpenPhish
OpenPhish
Important
This connector is only available for tenants that onboarded after July 26, 2026. For tenants that onboarded before this date, use Marketplace to access the standalone integration. For more information, see Marketplace.
This connector is available with any active Cortex XSIAM or Cortex AgentiX license.
OpenPhish uses proprietary Artificial Intelligence algorithms to automatically identify zero-day phishing sites and provide comprehensive, actionable, real-time threat intelligence.
This connector includes the following sub-capabilities (Marketplace integrations link to PAN DEV for more information):
- OpenPhish_v2: OpenPhish uses proprietary Artificial Intelligence algorithms to automatically identify zero-day phishing sites and provide comprehensive, actionable, real-time threat intelligence.
To configure this connector, follow the steps outlined in the configuration wizard.
OpenText
Here are the articles in this section:
OpenText EnCase Endpoint Security
Important
This connector is only available for tenants that onboarded after July 26, 2026. For tenants that onboarded before this date, use Marketplace to access the standalone integration. For more information, see Marketplace.
This connector is available with any active Cortex XSIAM or Cortex AgentiX license.
The EnCase Endpoint Security product includes the Enterprise Service Bus (ESB), which is a RESTful API allowing partner products to request scans of specified endpoints.
This connector includes the following sub-capabilities (Marketplace integrations link to PAN DEV for more information):
- Guidance Encase Endpoint: Use the Enterprise Service Bus (ESB) to request scans of specified endpoints.
To configure this connector, follow the steps outlined in the configuration wizard.
OpenText Service Manager
Important
This connector is only available for tenants that onboarded after July 26, 2026. For tenants that onboarded before this date, use Marketplace to access the standalone integration. For more information, see Marketplace.
This connector is available with any active Cortex XSIAM or Cortex AgentiX license.
Service Manager By Micro Focus (Formerly HPE Software).
This connector includes the following sub-capabilities (Marketplace integrations link to PAN DEV for more information):
- Service Manager: Service Manager By Micro Focus (Formerly HPE Software).
To configure this connector, follow the steps outlined in the configuration wizard.
OpenText Vertica
Important
This connector is only available for tenants that onboarded after July 26, 2026. For tenants that onboarded before this date, use Marketplace to access the standalone integration. For more information, see Marketplace.
This connector is available with any active Cortex XSIAM or Cortex AgentiX license.
Connect to an OpenText Vertica database to run SQL queries against your data. This integration was integrated and tested with Vertica v4.1.
This connector includes the following sub-capabilities (Marketplace integrations link to PAN DEV for more information):
- Vertica: Analytic database management software.
To configure this connector, follow the steps outlined in the configuration wizard.
OPSWAT
Here are the articles in this section:
OPSWAT MetaDefender
Important
This connector is only available for tenants that onboarded after July 26, 2026. For tenants that onboarded before this date, use Marketplace to access the standalone integration. For more information, see Marketplace.
This connector is available with any active Cortex XSIAM or Cortex AgentiX license.
OPSWAT MetaDefender is a multi-scanning engine that uses 30+ anti-malware engines to scan files for threats, significantly increasing malware detection.
This connector includes the following sub-capabilities (Marketplace integrations link to PAN DEV for more information):
- OPSWAT-Metadefender V2: multi-scanning engine uses 30+ anti-malware engines to scan files for threats, significantly increasing malware detection.
To configure this connector, follow the steps outlined in the configuration wizard.
Oracle
Here are the articles in this section:
Oracle Cloud Infrastructure
Follow a wizard to onboard your Oracle Cloud Infrastructure (OCI) environment. The OCI onboarding wizard is designed to facilitate the seamless setup of OCI data into Cortex XSIAM.
| Collection Method | Description |
|---|---|
| Link to full configuration Cloud Service Provider (CSP) onboarding data source instructions for Cortex XSIAM Premium license. | Onboard Oracle Cloud Infrastructure |
| Link to basic configuration Cloud Service Provider (CSP) onboarding data source instructions for Cortex XSIAM NG SIEM, Cortex XSIAM Enterprise license, and Cortex XSIAM Enterprise+ licenses. | How to onboard Oracle Cloud Infrastructure with foundational configuration |
Oracle
Important
This connector is only available for tenants that onboarded after July 26, 2026. For tenants that onboarded before this date, use Marketplace to access the standalone integration. For more information, see Marketplace.
Integrate with Oracle Cloud Infrastructure to fetch audit log events for security audits, tracking usage and changes to resources, and helping ensure compliance. Integrate with Oracle Identity Access Management to run CRUD (create, read, update, and delete) operations for employee lifecycle processes.
This connector includes the following sub-capabilities (Marketplace integrations link to PAN DEV for more information):
- OracleCloudInfrastructureEventCollector: Collects audit log events from Oracle Cloud Infrastructure resources. This sub-capability is available with any active Cortex XSIAM or Cortex Cloud Posture Security license.
- OracleIAM: Integrate with Oracle's services to execute CRUD and Group operations for employee lifecycle processes. This sub-capability is available with any active Cortex XSIAM, Cortex Cloud Posture Security, or Cortex AgentiX license.
To configure this connector, follow the steps outlined in the configuration wizard.
Orca Security
Here are the articles in this section:
Orca Security
Important
This connector is only available for tenants that onboarded after July 26, 2026. For tenants that onboarded before this date, use Marketplace to access the standalone integration. For more information, see Marketplace.
This connector is available with any active Cortex XSIAM license.
The Orca Security connector combines the deep and contextual alert findings of Orca with Cortex analytic capabilities. Import Orca alerts regarding vulnerabilities, malware, misconfigurations, lateral movement risk, authentication risk, and insecure high-risk data, with real-time threat detection as alerts are pushed from Orca. For more information, visit Orca Security.
This connector includes the following sub-capabilities (Marketplace integrations link to PAN DEV for more information):
- Orca Event Collector: Orca Security event collector integration for Cortex XSIAM.
To configure this connector, follow the steps outlined in the configuration wizard.
PacketMail.net
PacketMail.net
Important
This connector is only available for tenants that onboarded after July 26, 2026. For tenants that onboarded before this date, use Marketplace to access the standalone integration. For more information, see Marketplace.
This connector is available with any active Cortex XSIAM or Cortex AgentiX license.
Integrate with Wireless Innovation products.
This connector includes the following sub-capabilities (Marketplace integrations link to PAN DEV for more information):
- PacketMail: Intel look up for IPS.
To configure this connector, follow the steps outlined in the configuration wizard.
PacketSled
PacketSled
Important
This connector is only available for tenants that onboarded after July 26, 2026. For tenants that onboarded before this date, use Marketplace to access the standalone integration. For more information, see Marketplace.
This connector is available with any active Cortex XSIAM or Cortex AgentiX license.
Access the PacketSled playbook and command query to enumerate sensors, enumerate hosts that have issues, and retrieve metadata, files, and full packet capture (PCAP) artifacts from the PacketSled API for an investigation, based on the perspective of a user or a host.
This connector includes the following sub-capabilities (Marketplace integrations link to PAN DEV for more information):
- Packetsled: Packetsled Network Security API commands.
To configure this connector, follow the steps outlined in the configuration wizard.
PagerDuty
PagerDuty Automation and Collection
Important
This connector is only available for tenants that onboarded after July 26, 2026. For tenants that onboarded before this date, use Marketplace to access the standalone integration. For more information, see Marketplace.
Use PagerDuty to manage schedules and on-call users via PagerDuty API v2. Use Rundeck for runbook automation for issue management, business continuity, and self-service operations — enabling you to install software on a list of machines or perform tasks periodically.
This connector includes the following sub-capabilities (Marketplace integrations link to PAN DEV for more information):
- PagerDuty v2: This sub-capability is available with any active Cortex XSIAM, Cortex Cloud Posture Security, Cortex Cloud, Cortex Cloud Runtime Security, Cortex XDR, or Cortex AgentiX license.
- Rundeck: Rundeck is a runbook automation for incident management, business continuity, and self-service operations. The integration enables you to install software on a list of machines or perform a task periodically. It can be used when there is a new attack and you want to perform an update of the software to block the attack. This sub-capability is available with any active Cortex XSIAM or Cortex AgentiX license.
To configure this connector, follow the steps outlined in the configuration wizard.
PagerDuty
The capabilities and sub-capabilities listed for this connector are available with any active Cortex XSIAM or Cortex Cloud Posture Security license.
This connector includes the following capabilities and sub-capabilities (if applicable):
- Security Posture: Detect, monitor and alert on settings of your SaaS application.
saas-posture-config-remediation: Help remediate the misconfigured security settings of your SaaS application.
To configure this connector, follow the steps outlined in the configuration wizard.
PAT Helpdesk Advanced
PAT Helpdesk Advanced
Important
This connector is only available for tenants that onboarded after July 26, 2026. For tenants that onboarded before this date, use Marketplace to access the standalone integration. For more information, see Marketplace.
This connector is available with any active Cortex XSIAM or Cortex AgentiX license.
Improve the effectiveness of your service provision and resources, and the quality of your IT department. This integration was integrated and tested with version 11.2.3 of PAT Helpdesk Advanced.
This connector includes the following sub-capabilities (Marketplace integrations link to PAN DEV for more information):
- PATHelpdeskAdvanced: Improve the effectiveness of your service provision and resources, and the quality of your IT department.
To configure this connector, follow the steps outlined in the configuration wizard.
PhishLabs
PhishLabs
Important
This connector is only available for tenants that onboarded after July 26, 2026. For tenants that onboarded before this date, use Marketplace to access the standalone integration. For more information, see Marketplace.
This connector is available with any active Cortex XSIAM or Cortex AgentiX license.
PhishLabs (Fortra) provides 24/7 detection and rapid mitigation of email-based and digital risks. The IOC feed retrieves malicious indicators from the PhishLabs global feed and email-based issues from the user feed. Digital Risk Protection (DRP) delivers proactive detection and mitigation of digital risks across email, domain, social media, mobile, dark, deep, and open web vectors. PhishLabs EIR protects against threats that reach employee inboxes past your email security stack.
This connector includes the following sub-capabilities (Marketplace integrations link to PAN DEV for more information):
- PhishLabs IOC: Get indicators of compromise from PhishLabs.
- PhishLabs IOC DRP: Retrieves Digital Risk cases Protection from PhishLabs.
- PhishLabs IOC EIR: Get Email Incident Reports from PhishLabs.
To configure this connector, follow the steps outlined in the configuration wizard.
Ping Identity
Here are the articles in this section:
PingFederate
You can configure collecting PingFederate authentication logs using a Broker VM Syslog Collector applet:
| PingFederate vendor | Description |
|---|---|
| Syslog Collector applet overview | Forward authentication logs from PingFederate to Cortex XSIAM using the Broker VM Syslog Collector applet in a CEF format. |
| Link to Syslog Collector applet instructions | Ingest authentication logs from PingFederate |
PingOne
You can configure collecting PingOne authentication logs and data using a standard collector, content pack integration (onboarded prior to July 26, 2026), or connector:
| PingOne vendor | Description |
|---|---|
| Standard collector overview | Forward authentication logs and data to Cortex XSIAM from PingOne for Enterprise using the PingOne data source. |
| Link to standard collector instructions | Ingest authentication logs and data from PingOne |
| Link to content pack/integration details (onboarded prior to July 26, 2026) | <p>The PingIdentity content pack provides capabilities to utilize PingOne's cloud identity and access management services for various triggering events. It includes the following integration:</p><ul><li>PingOne (Partner Contribution): Use this integration to integrate with the PingOne Management API. It includes commands to unlock, create, delete, and update users.</li></ul> |
| Link to connector | Ping Identity |
Ingest authentication logs and data from PingOne
To receive authentication logs and data from PingOne for Enterprise, you must first set up a Poll subscription in PingOne and then configure the Collection Integrations settings in Cortex XSIAM. After you set up collection integration, Cortex XSIAM immediately begins receiving new authentication logs and data from the source. These logs and data are then searchable in Cortex XSIAM.
-
Set up PingOne for Enterprise to send logs and data.
To set up the integration, you must have an account for the PingOne management dashboard and access to create a subscription for SSO logs.
From the PingOne Dashboard:
- Set up a Poll subscription.
- Select Reporting → Subscriptions → Add Subscription.
- Enter a NAME for the subscription.
- Select Poll as the subscription type.
- Leave the remaining defaults and select Done.
- Identify your account ID and subscription ID.
-
Select the subscription you just set up and note the part of the poll URL between
/reports/and/poll-subscriptions. This is your PingOne account ID.For example:
https://admin-api.pingone.com/v3/reports/1234567890asdfghjk-123456-zxcvbn/poll-subscriptions/***-0912348765-4567-98012***/eventsIn this URL, the account ID is
1234567890asdfghjk-123456-zxcvbn. -
Next, note the part of the poll URL between
/poll-subscriptions/and/events. This is your subscription ID.In the example above, the subscription ID is
***-0912348765-4567-98012***.
-
- Set up a Poll subscription.
- Navigate to Settings → Data Sources & Integrations.
- On the Data Sources & Integrations page, click + Add New, search for PingOne, then hover over and click Add.
- Connect Cortex XSIAM to your PingOne for Enterprise authentication service.
- Enter your PingOne ACCOUNT ID.
- Enter your PingOne SUBSCRIPTION ID.
- Enter your PingOne USER NAME.
- Enter your PingOne PASSWORD.
- Test the connection settings.
- If successful, Enable PingOne authentication log collection.
After configuration is complete, Cortex XSIAM begins receiving information from the authentication service. From the Integrations page, you can view the log collection summary.
- To search for specific authentication logs or data, you can Create an Authentication Query or Create an XQL Query.
Ping Identity
The capabilities and sub-capabilities listed for this connector are available with any active Cortex XSIAM or Cortex Cloud Posture Security license.
This connector includes the following capabilities and sub-capabilities (if applicable):
- Security Posture: Detect, monitor and alert on settings of your SaaS application.
- saas-posture-config-remediation: Help remediate the misconfigured security settings of your SaaS application.
To configure this connector, follow the steps outlined in the configuration wizard.
Pipedrive
Here are the articles in this section:
Pipedrive
The capabilities and sub-capabilities listed for this connector are available with any active Cortex XSIAM or Cortex Cloud Posture Security license.
This connector includes the following capabilities and sub-capabilities (if applicable):
- Security Posture: Detect, monitor and alert on settings of your SAAS application.
- saas-posture-config-remediation: Help remediate the misconfigured security settings of your SAAS application.
To configure this connector, follow the steps outlined in the configuration wizard.
Pipl
Pipl
Important
This connector is only available for tenants that onboarded after July 26, 2026. For tenants that onboarded before this date, use Marketplace to access the standalone integration. For more information, see Marketplace.
This connector is available with any active Cortex XSIAM or Cortex AgentiX license.
Pipl provides a reputation for email addresses and identity solutions.
This connector includes the following sub-capabilities (Marketplace integrations link to PAN DEV for more information):
- Pipl: Get contact, social, and professional information about people.
To configure this connector, follow the steps outlined in the configuration wizard.
Plainview
Plainview
Important
This connector is only available for tenants that onboarded after July 26, 2026. For tenants that onboarded before this date, use Marketplace to access the standalone integration. For more information, see Marketplace.
This connector is available with any active Cortex XSIAM, Cortex XDR, or Cortex AgentiX license.
Integrate with Clarizen's Identity Access Management (IAM) service to execute CRUD operations in the employee lifecycle processes. Create, update, get, and disable users in Clarizen from Cortex. For more information, refer to the Identity Lifecycle Management article.
This connector includes the following sub-capabilities (Marketplace integrations link to PAN DEV for more information):
- Clarizen IAM: IAM integration for Clarizen. Handles user account auto-provisioning to Clarizen.
To configure this connector, follow the steps outlined in the configuration wizard.
Proofpoint
Here are the articles in this section:
Proofpoint Targeted Attack Protection
You can configure collecting Proofpoint Targeted Attack Protection (TAP) logs using a Standard Collector, content pack integration (onboarded prior to July 26, 2026), or connector (onboarded after July 26, 2026):
| Collection Method | Description |
|---|---|
| Standard Collector overview | Forward logs from Proofpoint Targeted Attack Protection to Cortex XSIAM using the Proofpoint Targeted Attack Protection data source. |
| Link to Standard Collector instructions | Ingest logs from Proofpoint Targeted Attack Protection |
| Link to content pack/integration details (onboarded prior to July 26, 2026) | <p>The Proofpoint TAP content pack protects against phishing and malicious email attacks and provides enriched visibility and automated response capabilities for events detected by the Proofpoint Targeted Attack Protection service. It contains automations, classifiers, dashboards, issue fields, issue types, layouts, modeling rules, parsing rules, playbooks, and reports. It also includes the following integration:</p><ul><li>Proofpoint TAP v2: Use this integration to protect against and provide additional visibility into phishing and other malicious email attacks. It includes commands that fetch events for clicks and messages related to known threats, return forensics evidence, fetch lists of campaign IDs, and fetch details for campaigns.</li></ul> |
| Link to connector (onboarded after July 26, 2026) | Proofpoint |
Ingest logs from Proofpoint Targeted Attack Protection
To receive logs from Proofpoint Targeted Attack Protection (TAP), you must first configure TAP service credentials in the TAP dashboard, and then the Collection Integrations settings in Cortex XSIAM based on your Proofpoint TAP configuration. After you set up data collection, Cortex XSIAM begins receiving new logs and data from the source.
When Cortex XSIAM begins receiving logs, the app creates a new dataset (proofpoint_tap_raw) that you can use to initiate XQL Search queries. For example queries, refer to the in-app XQL Library.
Configure the Proofpoint TAP collection in Cortex XSIAM.
-
Generate TAP Service Credentials in Proofpoint TAP.
TAP service credentials can be generated in the TAP Dashboard, where you will receive a Proofpoint Service Principal for authentication and Proofpoint API Secret for authentication. Record these credentials as you will need to provide them when configuring the Proofpoint Targeted Attack Protection data collector in Cortex XSIAM. For more information on generating TAP service credentials, see Generate TAP Service Credentials.
- Configure the Proofpoint TAP collection in Cortex XSIAM.
- Navigate to Settings → Data Sources & Integrations.
- On the Data Sources & Integrations page, click + Add New, search for Proofpoint Targeted Attack Protection, then hover over it and click Add.
- Set these parameters:
- Name: Specify a descriptive name for your log collection configuration.
- Proofpoint Endpoint: All Proofpoint endpoints are available on the
tap-api-v2.proofpoint.comhost. You can leave the default configuration or specify another host. - Service Principal: Specify the Proofpoint Service Principal for authentication. TAP service credentials can be generated in the TAP Dashboard.
- API Secret: Specify the Proofpoint API Secret for authentication. TAP service credentials can be generated in the TAP Dashboard.
-
Click Test to validate access, and then click Enable.
Once events start to come in, a green check mark appears underneath the Proofpoint Targeted Attack Protection configuration with the amount of data received.
-
(Optional) Manage your Proofpoint Targeted Attack Protection data collector.
After you enable the Proofpoint Targeted Attack Protection data collector, you can make additional changes as needed.
You can perform any of the following:
- Edit the Proofpoint Targeted Attack Protection data collector settings.
- Disable the Proofpoint Targeted Attack Protection data collector.
- Delete the Proofpoint Targeted Attack Protection data collector.
Proofpoint
Important
This connector is only available for tenants that onboarded after July 26, 2026. For tenants that onboarded before this date, use Marketplace to access the standalone integration. For more information, see Marketplace.
Proofpoint is an email security and threat protection platform that guards against phishing, malware, and advanced email attacks. It includes Targeted Attack Protection (TAP), Threat Response for automated issue response, Protection Server for email gateway management, Cloud Threat Response, Browser Isolation, and URL phishing validation via IsItPhishing.
This connector includes the following sub-capabilities (Marketplace integrations link to PAN DEV for more information):
- IsItPhishing: Collaborative web service that provides validation on whether a URL is a phishing page or not by analyzing the content of the webpage. This sub-capability is available with any active Cortex XSIAM or Cortex AgentiX license.
- Proofpoint Cloud Threat Response: Fetches Proofpoint Cloud Threat Response (CTR) incidents into Cortex XSIAM for case management, and exposes commands to list and retrieve incident details. This sub-capability is available with any active Cortex XSIAM or Cortex AgentiX license.
- Proofpoint Email Security Event Collector: Collects events for Proofpoint Email Security using the streaming API. This sub-capability is available with any active Cortex XSIAM license.
- Proofpoint Protection Server v2: Proofpoint email security appliance. This sub-capability is available with any active Cortex XSIAM or Cortex AgentiX license.
- Proofpoint TAP v2: Use the Proofpoint Targeted Attack Protection (TAP) integration to protect against and provide additional visibility into phishing and other malicious email attacks. This sub-capability is available with any active Cortex XSIAM or Cortex AgentiX license.
- Proofpoint Threat Protection: Threat Protection APIs are REST APIs that allow Proofpoint On Demand customers to retrieve, add, update or delete certain PoD configurations. This sub-capability is available with any active Cortex XSIAM or Cortex AgentiX license.
- Proofpoint Threat Response: Use the Proofpoint Threat Response integration to orchestrate and automate incident response. This sub-capability is available with any active Cortex XSIAM or Cortex AgentiX license.
- ProofpointIsolationEventCollector: Proofpoint Isolation is an integration that supports fetching Browser and Email Isolation logs events. This sub-capability is available with any active Cortex XSIAM license.
- ProofpointThreatResponseEventCollector: Use the Proofpoint Threat Response integration to orchestrate and automate incident response. This sub-capability is available with any active Cortex XSIAM license.
To configure this connector, follow the steps outlined in the configuration wizard.
ProtectWise
ProtectWise
Important
This connector is only available for tenants that onboarded after July 26, 2026. For tenants that onboarded before this date, use Marketplace to access the standalone integration. For more information, see Marketplace.
This connector is available with any active Cortex XSIAM or Cortex AgentiX license.
ProtectWise provides network security threat detection and response. When integrated, event data is received as a continuous stream that can be handled by the platform.
This connector includes the following sub-capabilities (Marketplace integrations link to PAN DEV for more information):
- ProtectWise: Cloud based Security Network DVR.
To configure this connector, follow the steps outlined in the configuration wizard.
Qualtrics
Here are the articles in this section:
Qualtrics
The capabilities and sub-capabilities listed for this connector are available with any active Cortex XSIAM or Cortex Cloud Posture Security license.
This connector includes the following capabilities and sub-capabilities (if applicable):
- Security Posture: Detect, monitor and alert on settings of your SaaS application.
saas-posture-config-remediation: Help remediate the misconfigured security settings of your SaaS application.
To configure this connector, follow the steps outlined in the configuration wizard.
Qualys
Here are the articles in this section:
Qualys
Important
This connector is only available for tenants that onboarded after July 26, 2026. For tenants that onboarded before this date, use Marketplace to access the standalone integration. For more information, see Marketplace.
Qualys detects vulnerabilities and policy compliance across your network assets. Qualys VMDR lets you create, run, fetch and manage reports, launch and manage vulnerability and compliance scans, and manage the host assets you want to scan for vulnerabilities and compliance. Qualys FIM (File Integrity Monitoring) logs and tracks file changes across global IT systems.
This connector includes the following sub-capabilities (Marketplace integrations link to PAN DEV for more information):
- qualys_fim: Log and track file changes across global IT systems. This sub-capability is available with any active Cortex XSIAM or Cortex AgentiX license.
- QualysV2: Qualys Vulnerability Management lets you create, run, manage reports and to fetch Activity Logs, Assets and Vulnerabilities, launch and manage vulnerability and compliance scans, and manage the host assets you want to scan for vulnerabilities and compliance. This sub-capability is available with any active Cortex XSIAM or Cortex AgentiX license with the Exposure Management add-on.
To configure this connector, follow the steps outlined in the configuration wizard.
Quest KACE
Here are the articles in this section:
Quest KACE
Important
This connector is only available for tenants that onboarded after July 26, 2026. For tenants that onboarded before this date, use Marketplace to access the standalone integration. For more information, see Marketplace.
This connector is available with any active Cortex XSIAM or Cortex AgentiX license.
Integrate with the Quest KACE Systems Management Appliance to manage tickets and fetch issues. This is a beta integration, tested with QuestKace version v10.0.290.
This connector includes the following sub-capabilities (Marketplace integrations link to PAN DEV for more information):
- QuestKace: Use the Comprehensive Quest KACE solution to Provision, manage, secure, and service all network-connected devices.
To configure this connector, follow the steps outlined in the configuration wizard.
Radware
Radware
Important
This connector is only available for tenants that onboarded after July 26, 2026. For tenants that onboarded before this date, use Marketplace to access the standalone integration. For more information, see Marketplace.
This connector is available with any active Cortex XSIAM license.
Radware Cloud DDoS Protection Service provides a robust, multi-layered defense using advanced behavioral algorithms for swift detection and mitigation of volumetric and sophisticated application-layer DDoS threats. The service is delivered globally via a high-capacity scrubbing network, offering flexible deployment models including Always-On, On-Demand, and Hybrid. Use this connector to automate application and asset creation and day-to-day management, and to retrieve up-to-date data about Security Events and Operational Alerts.
This connector includes the following sub-capabilities (Marketplace integrations link to PAN DEV for more information):
- Radware Cloud DDoS Protection Services: Radware Cloud Service provides customers and partners with the ability to programmatically perform service-related actions.
To configure this connector, follow the steps outlined in the configuration wizard.
Rapid7
Rapid7
Important
This connector is only available for tenants that onboarded after July 26, 2026. For tenants that onboarded before this date, use Marketplace to access the standalone integration. For more information, see Marketplace.
Rapid7 InsightIDR is a cloud-based SIEM that provides real-time alerting and investigation tools for detection and response, authentication monitoring, and endpoint visibility. Rapid7 InsightVM (Nexpose) provides vulnerability management, assessment, and response, prioritizing risk across vulnerabilities, configurations, and controls. Rapid7 AppSec manages application vulnerabilities and scans.
This connector includes the following sub-capabilities (Marketplace integrations link to PAN DEV for more information):
- Rapid7 InsightIDR: Rapid7’s InsightIDR is your security center for incident detection and response, authentication monitoring, and endpoint visibility. Together, these form Extended Detection and Response (XDR). InsightIDR identifies unauthorized access from external and internal threats and highlights suspicious activity so you don’t have to weed through thousands of data streams. This sub-capability is available with any active Cortex XSIAM or Cortex AgentiX license.
- Rapid7 Nexpose: Vulnerability management solution to help reduce threat exposure. This sub-capability is available with any active Cortex XSIAM or Cortex AgentiX license with the Exposure Management add-on.
- rapid7appsec: Rapid7 AppSec integration allows the management of applications vulnerabilities and scans. This sub-capability is available with any active Cortex XSIAM or Cortex AgentiX license.
To configure this connector, follow the steps outlined in the configuration wizard.
Razor Group
Razor Group
Important
This connector is only available for tenants that onboarded after July 26, 2026. For tenants that onboarded before this date, use Marketplace to access the standalone integration. For more information, see Marketplace.
This connector is available with any active Cortex XSIAM or Cortex AgentiX license.
Perch Security is a crowd-sourced threat and intelligence feed which also provides network security. Use the integration to manage alerts, indicators, and communities.
This connector includes the following sub-capabilities (Marketplace integrations link to PAN DEV for more information):
- Perch: Perch is a co-managed threat detection and response platform.
To configure this connector, follow the steps outlined in the configuration wizard.
Recorded Future
Recorded Future
Important
This connector is only available for tenants that onboarded after July 26, 2026. For tenants that onboarded before this date, use Marketplace to access the standalone integration. For more information, see Marketplace.
Ingest threat intelligence from Recorded Future. The RiskList Feed downloads lists of IP addresses, domains, URLs, CVEs, or file hashes with known risk associations, including risk scores and supporting evidence, while the Event Collector fetches alerts from Recorded Future.
This connector includes the following sub-capabilities (Marketplace integrations link to PAN DEV for more information):
- Recorded Future Feed: This sub-capability is available with any active Cortex XSIAM or Cortex AgentiX license.
- RecordedFutureEventCollector: This integration fetches alerts from Recorded Future. This sub-capability is available with any active Cortex XSIAM license.
To configure this connector, follow the steps outlined in the configuration wizard.
Red Hat
Red Hat Ansible
Important
This connector is only available for tenants that onboarded after July 26, 2026. For tenants that onboarded before this date, use Marketplace to access the standalone integration. For more information, see Marketplace.
This connector is available with any active Cortex XSIAM or Cortex AgentiX license.
Red Hat Ansible is an IT automation tool for configuring systems, deploying software, and orchestrating advanced IT tasks. This connector groups Ansible-powered integrations that manage a wide range of targets directly from Cortex — Linux and Windows hosts, Cisco IOS/NXOS network devices, Kubernetes, VMware, DNS records, certificates (ACME/OpenSSL), public clouds (Azure, Alibaba Cloud, Hetzner Cloud), and Ansible Automation Platform. The Ansible engine is self-contained and pre-configured, exposing Ansible modules as commands so you can use them without needing to know Ansible.
This connector includes the following sub-capabilities (Marketplace integrations link to PAN DEV for more information):
- AnsibleACME: Control Automatic Certificate Management Environment on Linux hosts.
- AnsibleAlibabaCloud: Manage Alibaba Cloud Elastic Compute Instances.
- AnsibleAzure: Manage Azure resources.
- AnsibleCiscoIOS: Cisco IOS Platform management over SSH.
- AnsibleCiscoNXOS: Cisco NX-OS Platform management over SSH.
- AnsibleDNS: Manage DNS records using NSUpdate.
- AnsibleHCloud: Manage your Hetzner Cloud environment.
- AnsibleKubernetes: Manage Kubernetes.
- AnsibleLinux: Agentlesss Linux host management over SSH.
- AnsibleMicrosoftWindows: Agentless Windows host management over WinRM.
- AnsibleOpenSSL: Control OpenSSL on a remote Linux hosts.
- AnsibleTower: Scale IT automation, manage complex deployments, and speed productivity.
- AnsibleVMware: Manage VMware vSphere Server, Guests, and ESXi Hosts.
To configure this connector, follow the steps outlined in the configuration wizard.
Redis Labs
Here are the articles in this section:
Redis Labs
The capabilities and sub-capabilities listed for this connector are available with any active Cortex XSIAM or Cortex Cloud Posture Security license.
This connector includes the following capabilities and sub-capabilities (if applicable):
- SaaS Posture Configuration Monitoring: Detect, monitor and alert on settings of your SAAS application.
- saas-posture-config-remediation: Help remediate the misconfigured security settings of your SAAS application.
To configure this connector, follow the steps outlined in the configuration wizard.
Redmine
Redmine
Important
This connector is only available for tenants that onboarded after July 26, 2026. For tenants that onboarded before this date, use Marketplace to access the standalone integration. For more information, see Marketplace.
This connector is available with any active Cortex XSIAM or Cortex AgentiX license.
Redmine is a flexible, open-source project management and issue tracking web application. Written using the Ruby on Rails framework, it is cross-platform and cross-database, and provides a web-based platform for managing projects, tracking tasks, and handling various project-related activities.
This connector includes the following sub-capabilities (Marketplace integrations link to PAN DEV for more information):
- Redmine: A project management and issue tracking system that provides a web-based platform for managing projects, tracking tasks, and handling various types of project-related activities.
To configure this connector, follow the steps outlined in the configuration wizard.
ReliaQuest
ReliaQuest
Important
This connector is only available for tenants that onboarded after July 26, 2026. For tenants that onboarded before this date, use Marketplace to access the standalone integration. For more information, see Marketplace.
ReliaQuest GreyMatter DRP (Digital Shadows) minimizes digital risk by identifying unwanted exposure and protecting against external threats. The award-winning SearchLight solution provides ongoing monitoring of a customer's unique assets and exposure across the open, deep, and dark web, enabling clients to detect data loss, brand impersonation, infrastructure risks, cyber threats, and much more.
This connector includes the following sub-capabilities (Marketplace integrations link to PAN DEV for more information):
- ReliaQuest GreyMatter DRP Event Collector: ReliaQuest GreyMatter DRP Event Collector monitors and manages an organization's digital risk across the widest range of data sources within the open, deep, and dark web. This sub-capability is available with any active Cortex XSIAM license.
- ReliaQuest GreyMatter DRP Incidents: ReliaQuest GreyMatter DR monitors and manages an organization's digital risk across the widest range of data sources within the open, deep, and dark web. This sub-capability is available with any active Cortex XSIAM or Cortex AgentiX license.
To configure this connector, follow the steps outlined in the configuration wizard.
RemoteAccess
RemoteAccess
Important
This connector is only available for tenants that onboarded after July 26, 2026. For tenants that onboarded before this date, use Marketplace to access the standalone integration. For more information, see Marketplace.
This connector is available with any active Cortex XSIAM or Cortex AgentiX license.
Access and run commands on a terminal in a remote location over SSH. Transfer files between the platform and a remote machine, and execute commands on the remote machine.
This connector includes the following sub-capabilities (Marketplace integrations link to PAN DEV for more information):
- RemoteAccess v2: This integration transfers files between Cortex XSOAR and a remote machine and executes commands on the remote machine.
To configure this connector, follow the steps outlined in the configuration wizard.
Retarus
Retarus
Important
This connector is only available for tenants that onboarded after July 26, 2026. For tenants that onboarded before this date, use Marketplace to access the standalone integration. For more information, see Marketplace.
This connector is available with any active Cortex XSIAM or Cortex AgentiX license.
Retarus Secure Email Gateway is a fully managed cloud service that provides comprehensive, multi-layered security for organizations. It filters all inbound and outbound traffic to defend against threats like malware, ransomware, and phishing using advanced sandboxing technology.
This connector includes the following sub-capabilities (Marketplace integrations link to PAN DEV for more information):
- Retarus Secure Email Gateway: Integrate Retarus Secure Email Gateway to seamlessly fetch events from Secure Email Gateway by Retarus and enhance email security.
To configure this connector, follow the steps outlined in the configuration wizard.
RSA
RSA
Important
This connector is only available for tenants that onboarded after July 26, 2026. For tenants that onboarded before this date, use Marketplace to access the standalone integration. For more information, see Marketplace.
This connector is available with any active Cortex XSIAM or Cortex AgentiX license.
RSA connectors integrate RSA security products with Cortex. The RSA Archer GRC platform provides a common foundation for managing policies, controls, risks, assessments, and deficiencies across lines of business. RSA NetWitness Endpoint provides deep visibility beyond basic endpoint security solutions by monitoring and collecting activity across all of your endpoints, on and off your network. RSA NetWitness Security Analytics is a distributed and modular system that collects packet data and log data from the network infrastructure.
This connector includes the following sub-capabilities (Marketplace integrations link to PAN DEV for more information):
- RSA Archer v2:
- RSA NetWitness Endpoint: RSA NetWitness Endpoint provides deep visibility beyond basic endpoint security solutions by monitoring and collecting activity across all of your endpoints on and off your network. The RSA Demisto integration provides access to information about endpoints, modules and indicators.
- RSA NetWitness Security Analytics: RSA Security Analytics, compatible with prior to v11. A distributed and modular system that enables highly flexible deployment architectures that scale with the needs of the organization. Security Analytics allows administrators to collect two types of data from the network infrastructure, packet data and log data.
To configure this connector, follow the steps outlined in the configuration wizard.
RTIR
RTIR
Important
This connector is only available for tenants that onboarded after July 26, 2026. For tenants that onboarded before this date, use Marketplace to access the standalone integration. For more information, see Marketplace.
This connector is available with any active Cortex XSIAM or Cortex AgentiX license.
Use the RTIR (Request Tracker for IR) integration to manage tickets: create, search, edit, resolve, and comment on tickets, and retrieve ticket data, history, and attachments. Tested with RTIR v4.4.2 using the SDK python-rtir v1.0.11.
This connector includes the following sub-capabilities (Marketplace integrations link to PAN DEV for more information):
- RTIR: Request Tracker for Incident Response is a ticketing system which provides pre-configured queues and workflows designed for incident response teams.
To configure this connector, follow the steps outlined in the configuration wizard.
runZero
runZero
Important
This connector is only available for tenants that onboarded after July 26, 2026. For tenants that onboarded before this date, use Marketplace to access the standalone integration. For more information, see Marketplace.
This connector is available with any active Cortex XSIAM license.
RunZero is a network discovery and asset inventory platform that uncovers every network in use and identifies every device connected, without credentials. Use this connector to collect events automatically from RunZero.
This connector includes the following sub-capabilities (Marketplace integrations link to PAN DEV for more information):
- RunZero Event Collector: This is the RunZero event collector integration for XSIAM.
To configure this connector, follow the steps outlined in the configuration wizard.
Salesforce
You can configure collecting Salesforce logs and data using a standard collector, content pack integration (onboarded prior to July 26, 2026), or connector:
| Collection Method | Description |
|---|---|
| Standard collector overview | <p>Ingests Audit Trail and Security Monitoring event logs, including:</p><ul><li>Login history</li><li>Setup audit trail</li><li>Flow Execution events</li><li>Transaction Security events</li><li>Content Distribution events</li><li>Package Install events</li></ul> |
| Link to standard collector | Ingest logs and data from Salesforce |
| Link to content pack/integration details (onboarded prior to July 26, 2026) | <p>Includes the:</p><ul><li>SalesforceV2 content pack, which provides CRM services and automations and contains the Salesforce v2 (Community Contribution) integration.</li><li>Salesforce Fusion content pack, which executes CRUD operations for employee lifecycle processes and contains the Salesforce Fusion IAM integration.</li></ul> |
| Link to connector | <p>Salesforce connector: Uses the Salesforce content pack to provide full CRM services for data security, automation and remediation, security posture, and identity posture. Includes the following integrations:</p><ul><li>Salesforce IAM: Performs Identity Lifecycle Management operations.</li><li>Salesforce: Provides CRM services.</li></ul> |
Ingest logs and data from Salesforce
Cortex XSIAM supports the collection of Salesforce near-real-time (NRT) events, Setup Audit Trail, Content Metadata, Accounts, event log files, and snapshots. This integration improves threat detection accuracy and eliminates duplicate alerts by ensuring critical multi-event alerts are captured in near-real-time rather than relying on hourly or daily log files.
Collection methods
The Salesforce data collector utilizes two primary methods for data ingestion:
- Streaming (Default): Collects Salesforce near "Real-Time Events" via streaming or SOQL queries. Events are generated in near-real-time and collected every minute.
- Dataset:
salesforce_realtime_raw
- Dataset:
- Batch (Legacy): Collects Salesforce
EventLogFiles. Files are generated every hour or 24 hours and collected by Cortex XSIAM every 30 seconds.- Dataset:
salesforce_eventlogfiles_raw
- Dataset:
Note
Both methods collect the Setup Audit Trail from Salesforce.
Important
Existing customers keep in mind: Changing your collection method updates the log schema, which will impact existing correlation rules. While it is strongly recommended to use NRT security logs for improved detection, you can keep both methods enabled in parallel during a transition period to ensure continuous protection while you update your rules.
Existing customers keep in mind: Changing your collection method updates the log schema, which will impact existing correlation rules. While it is strongly recommended to use NRT security logs for improved detection, you can keep both methods enabled in parallel during a transition period to ensure continuous protection while you update your rules.
Supported data types
Cortex XSIAM collects various data types from Salesforce. Use the table below to understand what is collected and where to find more information.
| Data Category | Included Objects / Description | More Information |
|---|---|---|
| Real-time events | High-speed security events (such as ApiEvent, ReportAnomalyEvent). |
For more information, see Real-Time Event Monitoring Objects. |
| Setup Audit Trail | Tracks recent configuration changes made by administrators. | For more information, see SetupAuditTrail. |
| Event log files | Legacy batch logs generated hourly or daily. | For more information, see EventLogFile. |
| Content metadata | "Document", "ContentFolder", "Attachment", "ContentDistribution" |
For more information, see Salesforce Objects. |
| Accounts | Account objects |
For more information, see Salesforce Objects. |
| Snapshots | ConnectedApplication, PermissionSet, Profile, Group, GroupMember, User, UserRole, TenantSecurityLogin, TenantSecurityUserPerm, UserAccountTeamMember |
For more information, see Salesforce Objects. |
Prerequisite
- Cortex XSIAM:
- To manage collection integration in Cortex XSIAM, requires View/Edit RBAC permissions for Log Collections and Data Sources (under Configurations → Data Collection).
- Salesforce:
- Edition: Professional (with API access), Enterprise, or higher.
- License: A Salesforce Shield license is required to avoid limited data fetching and errors. For more information, see Salesforce Shield.
- To use the client credentials flow required for Salesforce–Cortex XSIAM integration, you must create a connected app for Cortex XSIAM in Salesforce, and configure its OAuth settings and access policies, as described in this procedure. The connected app must be created by a Full System Admin.
-
Ensure your organization has a Salesforce Shield license.
For more information, see Salesforce Shield.
For more information, see Event Monitoring Introduction.
Ensure that you have the required licenses. If these prerequisites are not met, fetching of security and NRT event data will be severely limited, and errors will be generated.
- In Setup → Event Monitoring Settings, ensure that Generate event log files is enabled.
- In Setup, verify that there are event log files in the Event Log File Browser.
- In Setup → Permissions Sets, verify that there is a permission set called Event Monitoring.
- Near-real-time event settings: You must manually toggle each desired event, such as
ApiEventandReportAnomalyEvent, to Enabled under Setup → Event Monitoring Settings. - Legacy Batch access: If collecting
EventLogFiles, ensure Generate event log files is enabled under Setup → Event Monitoring Settings; in Setup, verify that files exist in the Event Log File Browser, and in Setup → Permissions Sets verify a permission set named Event Monitoring exists. -
Administrative access: To use the client credentials flow required for the Salesforce and Cortex XSIAM integration, a Full System Admin must create an External Client App in Salesforce and configure its OAuth settings and access policies as described in the configuration tasks below.
For more detailed reference information, see the following:
- Create an External Client App
- Configure an External Client App for the OAuth 2.0 Client Credentials Flow
Unlike other data collector setups, in this case, the setup includes obtaining an OAuth 2.0 code from Salesforce, and this code is only valid for 15 minutes. Therefore, make sure that you enable the data collector within 15 minutes of obtaining the authorization code.
How to configure the Salesforce data source
Perform the following procedures in the order that they appear, below.
Task 1. Configure Salesforce External Client App
Salesforce is deprecating "Connected Apps"; it is recommended to use an External Client App.
- In Salesforce on the Setup page, search for App Manager and click New External Client App.
- Provide a name (such as
panw_cortex_integration), and your email address (used to retrieve the Consumer Key and Consumer Secret). - Under API (enable OAuth settings), select Enable OAuth.
- Enter the following Callback URLs on separate lines (replacing
{tenant external URL}with your tenant name):https://login.salesforce.com/services/oauth2/callbackhttps://{tenant external URL}.paloaltonetworks.com/configuration/data-sources
- Select these OAuth Scopes:
Manage user data via APIs (api)andPerform requests at any time (refresh_token, offline_access). - Enable only these checkboxes after OAuth Scopes: Require Secret for Web Server Flow, Require Secret for Refresh Token Flow, and Enable Client Credentials Flow. For more information, see Salesforce Client Credentials Flow.
- Click Save, then Continue.
Task 2. Retrieve credentials
Consumer Key will be used for client_id, and Consumer Secret will be used for client_secret in OAuth 2.0.
- On the Setup page, search for External Client App Manager.
- Find your application (the one that you defined for Cortex XSIAM), click the arrow button in the last column, and select Edit Settings.
- In the OAuth Settings area, click Consumer Key and Secret.
- Go back to the Salesforce Verify Your Identity page, paste the code received via email in the
Verification Codebox, and click Verify. One of the following will happen:- The Consumer Key and Consumer Secret will be sent to the email address that you configured earlier for the Cortex XSIAM External Client App.
- On the Salesforce External Client App Name page, the Consumer Details area will display the Consumer Key and Consumer Secret, and you will be able to copy them from here when required in the following procedures.
Task 3. Configure the refresh token expiration policy
- On the Setup page, search for External Client App Manager.
- Find your application (the one that you defined for Cortex XSIAM), click the arrow button in the last column, and select Edit Policies.
- In the OAuth Policies area:
- Under Plugin Policies - Permitted Users, select All users can self-authorize.
- Set the refresh token policy to Expire refresh token if not used for specific time (recommended). For example, select this option and set it for 7 days.
Task 4. Configure OAuth 2.0
Configure the OAuth 2.0 application to call the Salesforce API using client_id (Consumer Key) and client_secret (Consumer Secret). For more information, see Configure an External Client App OAuth 2.0 Client Credentials Flow.
Task 5. Configure Cortex XSIAM
- In Cortex XSIAM, create a Salesforce data collector instance:
- Navigate to Settings → Data Sources & Integrations.
- On the Data Sources & Integrations page, click Add Data Source, search for and select Salesforce, and click Connect.
- Enter a unique Name for the instance, the Salesforce Domain Name, and the Consumer Key (
client_id) and the Consumer Secret (client_secret) credentials obtained earlier in this workflow. For example, the domain could be the API URL from which logs are received, such ashttps://MyDomainName.my.salesforce.com/services/data/vXX.X/resource/. -
(Optional) Clear unwanted data types (Content metadata (default), Accounts, and Event Log Files). When these options are cleared, only these data types will be omitted from collection. All other data will be collected as usual.\
Selecting Event Log Files enables Batch mode instead of near-real-time.
-
Click Enable.
A popup which redirects you to your Salesforce instance appears, to get OAuth 2.0 authorization credentials and access.
-
Click OK.
In Salesforce, a new tab appears.
- Enter your username and password, and Log In.
-
When you are asked to allow access, select Allow.
A Salesforce data collection instance is created, and an authorization token is created and returned to Cortex XSIAM. Data collection begins.
Task 6. (Optional) Edit or test existing Salesforce collector settings
You can edit and test an existing collector instance after a successful initial connection between Salesforce and Cortex XSIAM. Do this by right-clicking and selecting Edit for the collector instance. The log collection window will be displayed, where you can make changes or test, by clicking Test.
Important
If a “connected application” for Cortex XSIAM data collection already exists, you are not required to migrate to an “External Client App”, but since Connected Applications are deprecated by Salesforce, it is recommended to migrate.
Troubleshooting
If the authorization token is not created and sent to Cortex XSIAM after the 15-minute timeout period, an authorization failure error will be returned. To retry:
- In Cortex XSIAM, right click the collector instance and select Edit.
- The log collection window will display again, allowing you to edit settings and retry getting the authorization code.
Salesforce connector
Cortex XSIAM provides different methods for connecting to your Salesforce instance. Your choice depends on whether you need to ingest security event logs for monitoring, use the guided wizard setup for integrated services, or deploy specific legacy content packs for niche workflows.
Product availability and licensing
Secure configurations, monitor identity risks, and automate threat remediation across your Salesforce environment.
This connector includes the following capabilities and sub-capabilities (if applicable):
- Automation and Remediation: Automate identity lifecycle management including user provisioning, updates, and access control. This capability is available with any active Cortex AgentiX, Cortex Cloud Runtime Security, Cortex XSIAM, Cortex XDR, or Cortex Cloud license.\
Requires the following OAuth scopes:- Access and manage your data (api) Required for all standard operations on Cases, Users, Indicators, and Custom Objects (Fusion). Covers REST API queries and searches.
- Access and manage your Chatter data (chatter_api) Required specifically for SOC playbooks that post comments and thread replies to the Salesforce Chatter feed.
- Perform requests on your behalf at any time (refresh_token) Essential for background automation. Allows Cortex XSIAM to rotate expired tokens and stay connected 24/7 without manual login.
- Data Security: Scan and protect Salesforce data including files, attachments, and records. This capability is available with any active Cortex XSIAM, Cortex Cloud Posture Security, Cortex Cloud Runtime Security, or Cortex Data Security license.
- Identity Posture: Maintain visibility and control over Salesforce identities, including users, groups, roles, and granular permissions. This capability is available with any active Cortex XSIAM, Cortex Cloud Posture Security, Cortex Cloud Runtime Security, or Cortex Data Security license.
- Security Posture: Detect, monitor and alert on settings of your SaaS application. This capability is available with any active Cortex XSIAM or Cortex Cloud Posture Security license.
- saas-posture-config-remediation: Help remediate the misconfigured security settings of your SaaS application. This sub-capability is available with any active Cortex XSIAM or Cortex Cloud Posture Security license.
Cortex XSIAM can ingest identity metadata, login history, audit trails, and security monitoring events from Salesforce via capabilities to help you secure user identities, monitor for real-time threats, and automate issue response. To simplify setup, a wizard enables you to select specific capabilities based on your operational needs. The wizard then automatically identifies and provisions the underlying integrations required to support these capabilities.
The following table outlines the capabilities currently available in the wizard and the integrations it uses for each.
| Capability | Functionality | Use Cases | Underlying Integrations Used |
|---|---|---|---|
| Automation and Remediation | Execute automations and commands across Salesforce and its Identity Access Management (IAM) services. |
|
|
| Data Security | Scan and protect Salesforce data including files, attachments, and records. |
| N/A |
| Identity Posture | Maintain visibility and control over SaaS-based identities, including users, groups, roles, and granular permissions. | N/A | |
| Security Posture | Detect, monitor, and alert on your cloud application settings. |
| N/A |
Prerequisite
Cortex XSIAM
- RBAC permissions: Requires View/Edit permissions for Log Collections, Data Sources, and Integrations (under Configurations & Data Collections).
- Content packs: Ensure the Salesforce and Base content packs are installed or updated to the latest version.
- Store credentials (optional): You can configure vault credentials to securely manage and reuse authentication data across multiple integrations under Settings → Configurations → Integrations → Credentials.
- Gateway permissions: Requires Account Admin or Instance Administrator permissions for configuring egress settings in the Cortex Gateway to allow communication with your Salesforce Domain URL.
Salesforce
Salesforce requirements depend on the capabilities you use:
Security Posture prerequisites
- Requires the following permissions enabled in Salesforce:
- API Enabled
- Enable Chatter
- Modify All Data
- Query All Files
-
View All Users, Manage Users, and Monitor Login History: These can be added by creating/modifying a Permission Set or enabling them via the user's Profile.
Note
Manage Users is only required if User Sharing is not enabled.
- (Optional) Ensure the region-specific IP addresses are added to the allowed list on your NGFW or Prisma Access tenant.
Automation and Remediation prerequisites
Requires the Full System Admin permission enabled in Salesforce.
How to configure the Salesforce connector
Perform the following procedures in the order that they appear, below.
Task 1. Configure the Salesforce External Client App
Salesforce is deprecating "Connected Apps"; it is recommended to use an External Client App.
- In Salesforce, on the Setup page, search for App Manager and click New External Client App.
- Provide a name (such as
panw_cortex_integration), and your email address (used to retrieve the Consumer Key and Consumer Secret). - Under API (enable OAuth settings), select Enable OAuth.
- Enter the following Callback URLs on separate lines (replacing
{tenant external URL}with your tenant name):https://login.salesforce.com/services/oauth2/callbackhttps://{tenant external URL}.paloaltonetworks.com/configuration/data-sources
- Select these OAuth Scopes:
Access and manage your Chatter data (chatter_api)Manage user data via APIs (api)Perform requests at any time (refresh_token, offline_access)
- Enable only these checkboxes after OAuth Scopes: Require Secret for Web Server Flow, Require Secret for Refresh Token Flow, and Enable Client Credentials Flow. For more information, see Salesforce Client Credentials Flow.
- Click Save, then Continue.
Task 2. Retrieve credentials
Consumer Key will be used for client_id, and Consumer Secret will be used for client_secret in OAuth 2.0.
- On the Setup page, search for External Client App Manager.
- Find your application (the one that you defined for Cortex XSIAM), click the arrow button in the last column, and select Edit Settings.
- In the OAuth Settings area, click Consumer Key and Secret.
- Go back to the Salesforce Verify Your Identity page, paste the code received via email in the
Verification Codebox, and click Verify. One of the following will happen:- The Consumer Key and Consumer Secret will be sent to the email address that you configured earlier for the Cortex XSIAM External Client App.
- On the Salesforce External Client App Name page, the Consumer Details area will display the Consumer Key and Consumer Secret, and you will be able to copy them from here when required in the following procedures.
Task 3. Configure the refresh token expiration policy
- On the Setup page, search for External Client App Manager.
- Find your application (the one that you defined for Cortex XSIAM), click the arrow button in the last column, and select Edit Policies.
- In the OAuth Policies area:
- Under Plugin Policies - Permitted Users, select All users can self-authorize.
- Set the refresh token policy to Expire refresh token if not used for specific time (recommended). For example, select this option and set it for 7 days.
Task 4. Configure OAuth 2.0
Configure the OAuth 2.0 application to call the Salesforce.com API with one of the following flows:
- Client credentials flow: For more information, see Configure an External Client App OAuth 2.0 Client Credentials Flow.
- Web server flow: For more information, see OAuth 2.0 Web Server Flow.
Task 5. Configure egress in Cortex Gateway
An Account Admin or Instance Administrator must configure egress settings in the Cortex Gateway to allow communication with your Salesforce Domain URL. For more information, see Egress Configurations.
- Log in to the Cortex Gateway with Account Admin or Instance Administrator permissions and click Permission Management.
- From the side menu, select Egress Configurations.
- In the TENANT dropdown, select the tenant where you are configuring the Salesforce integration.
- Click +Path to initiate a new path request.
- In the New Path dialog box, configure the following:
- Requester: In the dropdown, select the requester from the list of users.
- Flow: In the dropdown, select the appropriate data service option for a generic webhook/host out (or Salesforce if it is explicitly listed).
-
Path: Enter the domain name or host of your Salesforce instance (for example, your-company.my.salesforce.com).
Do not include https:// or trailing slashes.
- Click Add to create the path. Once the status of the path shows as Approved in the Egress Configuration table, Cortex XSIAM can successfully authenticate and execute commands against your Salesforce environment.
Task 6. Configure Cortex XSIAM
- In Cortex XSIAM, navigate to Settings → Data Sources & Integrations.
- Click + Add new.
- In the Add Data Source page, search for Salesforce.
- Under Recommended, hover over the new Salesforce integration and click Add Instance to launch the Salesforce wizard.\
The new Salesforce connector has the description: Salesforce CRM services for identity management, automation, remediation and SaaS Posture Security. - Set up your Salesforce instance by following the wizard steps in the following tabs.
Capabilities tab
Configure the following.
- Instance name: Enter a unique name for your instance.
- Select capabilities: Choose the required instance functionality:
-
Data Security: Scan and protect Salesforce data including files, attachments, and records.
Note
To select this capability, you must first select the Identity Posture capability.
- Automation and Remediation: Enables executing commands, running automated workflows, managing cases, updating Chatter, or executing access control and CRUD (create, read, update, delete) operations across Salesforce and its IAM services. This capability includes commands for automation and remediation.
- Security Posture: Detect, monitor and alert on settings of your SaaS application. It includes a sub-capability to remediate misconfigured security settings.
- Identity Posture: Maintain visibility and control over SaaS-based identities, including users, groups, roles, and granular permissions.
-
- Click Next.
Connection tab
Enter credentials to securely authorize the connection.
- Domain URL: Copy the URL from your browser's address bar while logged into Salesforce and paste it into this field. This must be identical to the domain URL defined in the Cortex Gateway egress configuration in the Path field as explained in Task 5. If you did not configure egress in Cortex Gateway, you will get an error during verification. You can continue with instance configuration without verifying and set up egress at a later point.
- Click Apply.
Important
You cannot proceed with the authentication configuration until you provide a domain URL and click Apply.When you click Apply, the instance is connected to a unique URL in Salesforce, and it cannot be changed. To change it, you need to exit the wizard and start over.
- Select Recommended or Advanced.
- Recommended applies the suggested authentication method for all capabilities.
- Advanced enables configuring unique credentials for each capability individually.
- Authenticate using OAuth 2.0 client credentials, vault credentials, or OAuth 2.0 web server.
- For more information about the client credentials flow, see Configure an External Client App OAuth 2.0 Client Credentials Flow.
- To use stored credentials, click Select credentials and choose a saved Credential from the drop down.
- For more information about the web server flow, see OAuth 2.0 Web Server Flow.
- Click Done for each authentication method.
Configuration tab
Configure the following.
- Under Automation and remediation:
- Allow creating users, Allow updating users, Allow enabling users, and Allow disabling users: Toggle these specific user permissions on or off. You can also choose to automatically create a user if they are not found during an update command.
- Default Locale SID Key: Choose how dates, times, numbers, and currency are displayed throughout the application based on your geographic region. The default is en_US.
- Default Email Encoding Key: Sets the standard used to display characters in your outgoing emails. This ensures that special characters, symbols, and different languages appear correctly for your recipients. The default is ISO-8859-1.
- Integration Log Level: Possible values are Off (default), Debug, and Verbose.
- Under Security Posture:
- Sync Interval: Defines how often the system checks your cloud environment for security risks, misconfigurations, and compliance updates. More frequent syncs may impact API rate limits. The default is every 15 minutes.
- Application Tag: Assigns a category to your cloud resources based on their operational purpose. This helps you filter security alerts and apply different compliance policies to specific environments. The default is None.
Summary tab
A confirmation message shows that your Salesforce instance is successfully connected, with a list of relevant capabilities and sub capabilities statuses.
Once you confirm the summary details, click Save instance.
Task 6. (Optional) Edit or test existing Salesforce instance settings
You can edit and test an existing instance after a successful initial connection between Salesforce and Cortex XSIAM. Do this by clicking Test.
Important
If a “connected application” for Cortex XSIAM data collection already exists, there is no obligation to migrate to an “External Client App” - but as Connected Applications are deprecated by Salesforce, it is recommended to migrate.
Automation and remediation commands
Once the wizard configuration is complete and the connection is established, you can use the following commands in your playbooks or the War Room:
- General Salesforce and record operations
salesforce-search-records: Search for specific Salesforce records.salesforce-get-object/salesforce-create-object: Read or create Salesforce objects.salesforce-get-org: Returns organization details based on a case number.
- Case management
salesforce-create-case: Create a new case using a subject and status.salesforce-get-case/salesforce-get-case-information: Retrieve detailed information about a specific case.salesforce-post-casecomment/salesforce-get-casecomment: Post or return comments on a specific case.
- Chatter operations
salesforce-add-comment-to-chatter: Add a comment or link to a Chatter subject.salesforce-push-comment-threads: Add a comment directly to a specific Chatter thread.
- Identity and Access Management (IAM) operations
iam-create-user: Create a new active user profile.iam-update-user: Update existing user profile data.iam-get-user: Retrieve a single user resource via identifier or case number.iam-disable-user: Disable an active employee user profile - Security Posture: (Cloud Posture license only) Enables detecting, monitoring, and alerting on your cloud application settings.
SailPoint
SailPoint
Important
This connector is only available for tenants that onboarded after July 26, 2026. For tenants that onboarded before this date, use Marketplace to access the standalone integration. For more information, see Marketplace..
This connector is available with any active Cortex XSIAM license.
SailPoint Identity Security takes the complexity out of identity, making it intuitive for IT staff to configure and manage while enabling business users with the access they need. This connector collects events from SailPoint IdentityNow to drive identity-aware security practices.
This connector includes the following sub-capabilities (Marketplace integrations link to PAN DEV for more information):
- SailPointIdentityNowEventCollector: This is the SailPoint IdentityNow event collector integration for Cortex XSIAM.
To configure this connector, follow the steps outlined in the configuration wizard.
Samhaus
Samhaus
Important
This connector is only available for tenants that onboarded after July 26, 2026. For tenants that onboarded before this date, use Marketplace to access the standalone integration. For more information, see Marketplace.
This connector is available with any active Cortex XSIAM or Cortex AgentiX license.
Use the Spamhaus feed integration to fetch indicators from the Spamhaus Project feed.
This connector includes the following sub-capabilities (Marketplace integrations link to PAN DEV for more information):
To configure this connector, follow the steps outlined in the configuration wizard.
SANS DShield
SANS DShield
Important
This connector is only available for tenants that onboarded after July 26, 2026. For tenants that onboarded before this date, use Marketplace to access the standalone integration. For more information, see Marketplace.
This connector is available with any active Cortex XSIAM or Cortex AgentiX license.
Fetches a feed from DShield summarizing the top 20 attacking class C (/24) subnets over the last three days. The number of 'attacks' indicates the number of targets reporting scans from a subnet.
This connector includes the following sub-capabilities (Marketplace integrations link to PAN DEV for more information):
To configure this connector, follow the steps outlined in the configuration wizard.
SAP
SAP
Important
This connector is only available for tenants that onboarded after July 26, 2026. For tenants that onboarded before this date, use Marketplace to access the standalone integration. For more information, see Marketplace.
Integrate with SAP services to manage employee lifecycle identity operations and to collect audit log events for security monitoring and compliance. SAP - IAM executes get and disable operations for employee lifecycle processes, SAP BTP (Business Technology Platform) collects audit log events from SAP's cloud platform, and SAP Cloud for Customer (C4C) collects audit events from SAP's CRM solution via the OData Analytics API.
This connector includes the following sub-capabilities (Marketplace integrations link to PAN DEV for more information):
- SAPBTP: SAP Business Technology Platform (BTP) is a cloud platform for building, integrating, and extending enterprise applications with data, analytics, AI, and automation. This sub-capability is available with any active Cortex XSIAM license.
- SAPCloudForCustomerC4C: Integrates with SAP Cloud for Customer (C4C) and collects audit events via its OData Analytics API to boost security monitoring and compliance. This sub-capability is available with any active Cortex XSIAM license.
- SAP-IAM: Integrate with SAP's services to execute CRUD operations for employee lifecycle processes. This sub-capability is available with any active Cortex XSIAM or Cortex AgentiX license.
To configure this connector, follow the steps outlined in the configuration wizard.
SAP Ariba
The capabilities and sub-capabilities listed for this connector are available with any active Cortex XSIAM or Cortex Cloud Posture Security license.
This connector includes the following capabilities and sub-capabilities (if applicable):
- Security Posture: Detect, monitor and alert on settings of your SaaS application.
- saas-posture-config-remediation: Help remediate the misconfigured security settings of your SaaS application.
To configure this connector, follow the steps outlined in the configuration wizard.
Saviynt
Saviynt
Important
This connector is only available for tenants that onboarded after July 26, 2026. For tenants that onboarded before this date, use Marketplace to access the standalone integration. For more information, see Marketplace.
This connector is available with any active Cortex XSIAM license.
Saviynt Enterprise Identity Cloud (EIC) is an AI-driven, cloud-native identity security platform that unifies Identity Governance and Administration (IGA). It manages and secures user and non-human access across hybrid IT environments to help organizations reduce risk and meet compliance mandates. This connector collects Saviynt EIC audit logs.
This connector includes the following sub-capabilities (Marketplace integrations link to PAN DEV for more information):
- SaviyntEICEventCollector: Collector for Saviynt Enterprise Identity Cloud (EIC) audit logs using Analytics Runtime Control V2.
To configure this connector, follow the steps outlined in the configuration wizard.
SecurityScorecard
SecurityScorecard
Important
This connector is only available for tenants that onboarded after July 26, 2026. For tenants that onboarded before this date, use Marketplace to access the standalone integration. For more information, see Marketplace.
This connector is available with any active Cortex XSIAM license.
SecurityScorecard provides security ratings and risk assessments for organizations by continuously monitoring their external attack surface, evaluating domains across security factors such as network security, DNS health, patching cadence, and endpoint security. This connector collects history events from SecurityScorecard for security monitoring and compliance in Cortex XSIAM.
This connector includes the following sub-capabilities (Marketplace integrations link to PAN DEV for more information):
- SecurityScorecardEventCollector: This integration collects history events from SecurityScorecard for Cortex XSIAM.
To configure this connector, follow the steps outlined in the configuration wizard.
Securonix
Securonix
Important
This connector is only available for tenants that onboarded after July 26, 2026. For tenants that onboarded before this date, use Marketplace to access the standalone integration. For more information, see Marketplace.
This connector is available with any active Cortex XSIAM or Cortex AgentiX license.
A threat intelligence platform that collects and interprets intelligence data from open sources and manages indicator scoring, types, and attributes.
This connector includes the following sub-capabilities (Marketplace integrations link to PAN DEV for more information):
- ThreatQ v2: A threat intelligence platform that collects and interprets intelligence data from open sources and manages indicator scoring, types, and attributes.
To configure this connector, follow the steps outlined in the configuration wizard.
Sentry
Here are the articles in this section:
Sentry
The capabilities and sub-capabilities listed for this connector are available with any active Cortex XSIAM or Cortex Cloud Posture Security license.
This connector includes the following capabilities and sub-capabilities (if applicable):
- Security Posture: Detect, monitor and alert on settings of your SAAS application.
- saas-posture-config-remediation: Help remediate the misconfigured security settings of your SAAS application.
To configure this connector, follow the steps outlined in the configuration wizard.
SentinelOne
Here are the articles in this section:
SentinelOne DeepVisibility
You can configure collecting SentinelOne DeepVisibility raw EDR event data using a Standard Collector, content pack integration (onboarded prior to July 26, 2026), or connector (onboarded after July 26, 2026):
| Collection Method | Description |
|---|---|
| Standard Collector overview | Forward raw EDR event data from SentinelOne DeepVisibility to Cortex XSIAM, streamed via Cloud Funnel to Amazon S3 using the SentinelOne - Deep Visibility data source. |
| Link to Standard Collector instructions | Ingest raw EDR events from SentinelOne DeepVisibility |
| Links to content pack/integration instructions (onboarded prior to July 26, 2026) | <p>The SentinelOne content pack provides capabilities for endpoint protection, allowing users to receive alerts, manage protection policies, search processes, and execute remediation actions on endpoints. The SentinelOne pack contains classifiers, issue fields, issue types, layouts, modeling rules, and playbooks. It also includes the following integrations:</p><ul><li>SentinelOne Activity and Alerts: Use this integration to fetch activities, threats, and issues from SentinelOne using the sentinelone-get-events command.</li><li>SentinelOne v2 (Partner Contribution): Use this integration to send requests to your management server and get responses with data pulled from agents or from the management database. It includes commands to connect, disconnect, shut down, and uninstall agents as well as get agent, threat, and site information.</li></ul> |
| Link to connector (onboarded after July 26, 2026) | SentinelOne |
Ingest raw EDR events from SentinelOne DeepVisibility
Cortex XSIAM enables ingestion of raw EDR event data from SentinelOne DeepVisibility, streamed via Cloud Funnel to Amazon S3. In addition to all standard SIEM capabilities, this integration unlocks some advanced Cortex XSIAM features, enabling comprehensive analysis of data from all sources, enhanced detection and response, and deeper visibility into SentinelOne data.
Key benefits include:
- Querying all raw event data received from SentinelOne using XQL.
- Querying critical modeled and unified EDR data via the
xdr_datadataset. - Enriching case and issue investigations with relevant context.
- Grouping issues with issues from other sources to accelerate the scoping process of cases, and to cut investigation time.
- Leveraging the data for analytics-based detection.
- Utilizing the data for rule-based detection, including correlation rules, BIOC, and IOC.
- Leveraging the data within playbooks for case response.
When Cortex XSIAM begins receiving EDR events from SentinelOne, it automatically creates a new dataset labeled sentinelone_deep_visibility_raw, allowing you to query all SentinelOne events using XQL. For example XQL queries, refer to the in-app XQL Library.
In addition, Cortex XSIAM parses and maps critical data into the xdr_data dataset and XDM data model, enabling unified querying and investigation across all supported EDR vendors' data and unlocking key benefits like stitching and advanced analytics. While mapped data from all supported EDR vendors, including SentinelOne DeepVisibility, will be available in the xdr_data dataset, it's important to note that third-party EDR data present some limitations.
Third-party agents, including SentinelOne, typically provide less data compared to our native agents, and do not include the same level of optimization for causality analysis and cloud-based analytics. Furthermore, external EDR rate limits and filters might restrict the availability of critical data required for comprehensive analytics. As a result, only a subset of our analytics-based detectors will function with third-party EDR data.
We are continuously enhancing our support and using advanced techniques to enrich missing third-party data, while somehow replicating some proprietary functionalities available with our agents. This approach maximizes value for our customers using third-party EDRs within existing constraints. However, it’s important to recognize that the level of comprehensiveness achieved with our native agents cannot be matched, as much of the logic happens on the agent itself. These capabilities are unique, and are not found in typical SIEMs. Many of them, along with their underlying logic, are patented by Palo Alto Networks. Therefore, they should be regarded as added value beyond standard SIEM functionalities for customers who are not using our agents.
- The SentinelOne DeepVisibility logs that will be collected by your dedicated Amazon S3 bucket must adhere to the following guidelines:
- Each log file must use the 1 log per line format as multi-line format is not supported.
- The log format must be compressed as gzip or uncompressed.
- For best performance, we recommend limiting each file size to up to 50 MB (compressed).
- The minimum AWS permissions required for an Amazon S3 bucket and Amazon Simple Queue Service (SQS) are:
- Amazon S3 bucket:
GetObject - SQS:
ChangeMessageVisibility,ReceiveMessage, andDeleteMessage
- Amazon S3 bucket:
- Determine how you want to provide access to Cortex XSIAM to your logs and to perform API operations. You have the following options:
- Designate an AWS IAM user, where you will need to know the Account ID for the user and have the relevant permissions to create an access key/id for the relevant IAM user. If you do not have a designated AWS IAM user configured yet, instructions for this are included in the following procedures.
-
Create an assumed role in AWS to delegate permissions to a Cortex XSIAM AWS service. This role grants Cortex XSIAM access to your flow logs. This is the Assumed Role option mentioned later in the procedures that follow. To create an assumed role for Cortex XSIAM, see Create an assumed role.
For more information about assumed roles, see Creating a role to delegate permissions to an AWS service.
- To collect Amazon S3 logs that use server-side encryption (SSE), the user role must have an IAM policy that states that Cortex XSIAM has kms:Decrypt permissions. With this permission, Amazon S3 automatically detects if a bucket is encrypted and decrypts it. If you want to collect encrypted logs from different accounts, you must have the decrypt permissions for the user role also in the key policy for the master account Key Management Service (KMS). For more information, see Allowing users in other accounts to use a KMS key.
Task 1: Configure an Amazon S3 bucket
Task A: Create a dedicated Amazon S3 bucket to store SentinelOne DeepVisibility EDR data
This step provides general guidelines. For more information, see Creating a bucket using the Amazon S3 Console.
It is your responsibility to define a retention policy for your Amazon S3 bucket by creating a Lifecycle rule on the Management tab. We recommend setting the retention policy to at least 7 days to ensure that the data is retrieved under all circumstances.
- Log in to the AWS Management Console and navigate to the S3 Service.
- Create a new S3 bucket:
- Click Create bucket.
- For Bucket Name, enter a unique name for the bucket (for example,
xsiam-s1-edr-data). - Choose an appropriate AWS Region.
- Set Block all public access to Enabled.
- Click Create bucket.
- Set up the Bucket policy:
- Click the Permissions tab of your new bucket.
-
Under Bucket policy, click Edit and add the following policy to allow SentinelOne DeepVisibility to write data there.
Replace
your-sentinelone-account-idwith the relevant value for your environment; replacexsiam-s1-edr-datawith the name of your new bucket.{ "Version": "2012-10-17", "Statement": [ { "Effect": "Allow", "Principal": { "AWS": "your-sentinelone-account-id" }, "Action": "s3:PutObject", "Resource": "arn:aws:s3:::xsiam-s1-edr-data/*" } ] }
Task B: Configure an Amazon Simple Queue Service (SQS) and grant it permission to receive messages from S3
Ensure that you create your Amazon S3 bucket and Amazon SQS queue in the same region.
- In the Amazon SQS Console, click Create Queue.
- Configure the following settings, where the default settings should be configured unless otherwise indicated.
- Type: Select Standard queue (default).
- Name: Specify a descriptive name for your SQS queue.
- Configuration section: Keep the default settings for the various fields.
-
Access policy → Choose method: Select Advanced and update the Access policy code in the editor window to enable your Amazon S3 bucket to publish event notification messages to your SQS queue. Use this sample code as a guide for defining the
“Statement”with the following definitions.“Resource”: Keep the automatically generated ARN for the SQS queue that is set in the code, which uses the format“arn:sns:Region:account-id:topic-name”.You can retrieve your bucket’s ARN by opening the Amazon S3 Console in a browser window. In the Buckets section, select the bucket that you created for collecting the Amazon S3 flow logs, click Copy ARN, and paste the ARN in the field.
For more information on granting permissions to publish messages to an SQS queue, see Granting permissions to publish event notification messages to a destination.
{ "Version": "2012-10-17", "Statement": [ { "Effect": "Allow", "Principal": { "Service": "s3.amazonaws.com" }, "Action": "SQS:SendMessage", "Resource": "[Leave automatically generated ARN for the SQS queue defined by AWS]", "Condition": { "ArnLike": { "aws:SourceArn": "[ARN of your Amazon S3 bucket]" } } } ] }
- Dead-letter queue section: We recommend that you configure a queue for sending undeliverable messages by selecting Enabled, and then in the Choose queue field selecting the queue to send the messages. You may need to create a new queue for this, if you do not already have one set up. For more information, see Amazon SQS dead-letter queues.
-
Click Create queue.
When the SQS is created, a message indicating that the queue was successfully configured is displayed at the top of the page.
Task C: Configure an event notification to your Amazon SQS whenever a file is written to your Amazon S3 bucket
- Open the Amazon S3 Console and in the Properties tab of your Amazon S3 bucket, scroll down to the Event notifications section, and click Create event notification.
- Configure the following settings:
- Event name: Specify a descriptive name for your event notification containing up to 255 characters.
- Prefix: Do not set a prefix, because the Amazon S3 bucket is meant to be a dedicated bucket for collecting only network flow logs.
- Event types: Select All object create events for the type of event notifications that you want to receive.
- Destination: Select SQS queue to send notifications to an SQS queue to be read by a server.
-
Specify SQS queue: You can either select Choose from your SQS queues and then select the SQS queue, or select Enter SQS queue ARN and specify the ARN in the SQS queue field.
You can retrieve your SQS queue ARN by opening another instance of the AWS Management Console in a browser window, opening the Amazon SQS Console, and selecting the Amazon SQS that you created. In the Details section, under ARN, click the copy icon ()), and paste the ARN in the field.
-
Click Save changes.
When the event notification is created, a message indicating that the event notification was successfully created is displayed at the top of the page.
If you receive an error when trying to save your changes, check that the permissions are set up correctly, and fix them if necessary.
Task D: Configure authentication\authorization if you have not done so yet
For Assumed Role, follow these instructions: Create an assumed role, and then return to this page to Configure SentinelOne DeepVisibility.
For IAM access key:
- Create an IAM Policy that grants permissions for SQS and S3:
- In the AWS Console, navigate to the IAM service, and click Policies.
- Click Create policy.
- Select the JSON policy editor.
-
Use this sample code as a guide for defining the “Statement” with the following definitions:
{ "Version": "2012-10-17", "Statement": [ { "Sid": "S3ReadAccess", "Effect": "Allow", "Action": [ "s3:GetObject", "s3:ListBucket" ], "Resource": [ "[ARN for the S3 Bucket Name defined by AWS]", #example: "arn:aws:s3:::bucketname/xsiam-s1-edr-data/" "[ARN for the S3 Bucket path defined by AWS]" #example: "arn:aws:s3:::bucketname/xsiam-s1-edr-data/*" ] }, { "Sid": "SQSReceiveAccess", "Effect": "Allow", "Action": [ "sqs:ReceiveMessage", "sqs:GetQueueAttributes" ], "Resource": "[ARN for the SQS queue defined by AWS]" } ] }
- Click Next.
- For Policy name, enter a name.
- Click Create policy.
- Create an IAM User:
- In the AWS Console, navigate to the IAM service, and click Users.
- Click Create user.
- For User name, enter a name (for example,
cortex-xsiam-s3). - Attach the IAM Policy that you created in Step 1.
- Click Next.
- Click Create user.
-
Configure access keys for the AWS IAM User:
It is the responsibility of your organization to ensure that the user who creates the access key is assigned the relevant permissions. Otherwise, this can cause the process to fail with errors.
- Open the AWS IAM Console, and in the navigation pane, select Access management → Users.
- Select the User name of the AWS IAM user.
- Select the Security credentials tab, scroll down to the Access keys section, and click Create access key.
-
Click the copy icon next to the Access key ID and Secret access key keys, where you must click Show secret access key to see the secret key, and save a copy of them somewhere safe before closing the window. You will need to provide these keys when you edit the Access policy of the SQS queue, and when setting the AWS Client ID and AWS Client Secret in Cortex XSIAM. If you forget to record the keys and close the window, you will need to generate new keys and repeat this process.
For more information, see Managing access keys for IAM users.
- Update the Access policy of your Amazon SQS queue:
- In the Amazon SQS Console, select the SQS queue that you created when you configured an Amazon Simple Queue Service (SQS).
- Select the Access policy tab, and click Edit to edit the Access policy code in the editor window, to enable the IAM user to perform operations on the Amazon SQS with the permissions
SQS:ChangeMessageVisibility,SQS:DeleteMessage, andSQS:ReceiveMessage. Use this sample code as a guide for defining the“Sid”: “__receiver_statement”with the following definitions.“aws:SourceArn”: Specify the ARN of the AWS IAM user. You can retrieve the User ARN from the Security credentials tab, which you accessed when you configured access keys for the AWS API user.-
“Resource”: Keep the automatically generated ARN for the SQS queue that is set in the code, which uses the format“arn:sns:Region:account-id:topic-name”.For more information on granting permissions to publish messages to an SQS queue, see Granting permissions to publish event notification messages to a destination.
{ "Version": "2012-10-17", "Statement": [ { "Effect": "Allow", "Principal": { "Service": "s3.amazonaws.com" }, "Action": "SQS:SendMessage", "Resource": "[Leave automatically generated ARN for the SQS queue defined by AWS]", "Condition": { "ArnLike": { "aws:SourceArn": "[ARN of your Amazon S3 bucket]" } } }, { "Sid": "__receiver_statement", "Effect": "Allow", "Principal": { "AWS": "[Add the ARN for the AWS IAM user]" }, "Action": [ "SQS:ChangeMessageVisibility", "SQS:DeleteMessage", "SQS:ReceiveMessage" ], "Resource": "[Leave automatically generated ARN for the SQS queue defined by AWS]" } ] }
- Click Save.
Task 2: Configure SentinelOne DeepVisibility
- In SentinelOne DeepVisibility, select Configure → Policy & Settings and in the Singularity Data Lake section, click Cloud Funnel.
- For Cloud Provider, select AWS (Amazon Web Services).
- For S3 Bucket Name, enter the name of the Amazon S3 bucket that you created for SentinelOne DeepVisibility log ingestion.
- For Telemetry Streaming, select Enable.
- In the Query Filters box, create a query that includes the agents that should send data to the S3 bucket.
- To validate the query, click Validate.
- For Fields to include, ensure that all fields are selected.
- Click Save.
Task 3: Configure ingestion into Cortex XSIAM
- Navigate to Settings → Data Sources & Integrations.
- On the Data Sources & Integrations page, click + Add New, search for
SentinelOne - Deep Visibility, then hover over it and click Add. - Use the toggle to select either Access Key or Assumed Role.
- Set these parameters, depending on your choice in the previous step:
- For the Access Key option:
- Name: Specify a descriptive name for your log collection configuration. This name must be unique in your environment.
- SQS URL: Specify the SQS URL that you received for the AWS S3 queue when you configured the Amazon Simple Queue Service (SQS), as explained above.
- AWS Client ID: Specify the Client ID that you received when you configured the AWS IAM user, as explained above.
- AWS Client Secret: Specify the Secret that you received when you configured the AWS IAM user, as explained above.
- For the Assumed Role option:
- Name: Specify a descriptive name for your log collection configuration. This name must be unique in your environment.
- SQS URL: Specify the SQS URL that you received for the AWS S3 queue when you configured the Amazon Simple Queue Service (SQS), as explained above.
- Role ARN: Specify the role ARN that you received when you created the assumed role.
- External Id: Specify the External ID that you received when you created the assumed role.
- For the Access Key option:
-
Click Test to validate access, and then click Enable.
After events start to come in, a green check mark appears below the SentinelOne - DeepVisibility configuration, along with the amount of data received.
SentinelOne
Important
This connector is only available for tenants that onboarded after July 26, 2026. For tenants that onboarded before this date, use Marketplace to access the standalone integration. For more information, see Marketplace.
This connector is available with any active Cortex XSIAM license.
Integrate with SentinelOne for endpoint protection. Fetch activities, threats, and alerts from SentinelOne, and use SentinelOne to receive alerts from endpoints, search for processes, block endpoints, and manage the endpoint protection policy.
This connector includes the following sub-capabilities (Marketplace integrations link to PAN DEV for more information):
- SentinelOneEventCollector: This integration fetches activities, threats, and alerts from SentinelOne.
To configure this connector, follow the steps outlined in the configuration wizard.
ServiceNow
Here are the articles in this section:
ServiceNow CDMB
You can configure collecting data from the ServiceNow CMDB database using a Standard Collector or connector (onboarded after July 26, 2026):
| Collection Method | Description |
|---|---|
| Standard Collector overview | Forward logs from the ServiceNow CMDB database to Cortex XSIAM using the ServiceNow CMDB data source. |
| Link to Standard Collector instructions | Ingest data from ServiceNow CMDB |
| Link to connector (onboarded after July 26, 2026) | ServiceNow Automation and Collection |
Ingest data from ServiceNow CMDB
To receive data from the ServiceNow CMDB database, you must first configure data collection from ServiceNow CMDB. ServiceNow CMDB is a logical representations of assets, services, and the relationships between them that comprise the infrastructure of an organization. It is built as a series of connected tables that contain all the assets and business services controlled by a company and its configurations. You can configure the Collection Integration settings in Cortex XSIAM for the ServiceNow CMDB database, which includes selecting the specific tables containing the data that you want to collect, in the ServiceNow CMDB Collector. You can select from the list of default tables and also specify custom tables. By default, the ServiceNow CMDB Collector is configured to collect data from the following tables, which you can always change depending on your system requirements.
cmdb_cicmdb_ci_computercmdb_rel_cicmdb_ci_application_software
When Cortex XSIAM begins receiving data, the app automatically creates a ServiceNow CMDB dataset for each table using the format servicenow_cmdb_<table name>_raw. You can then use XQL Search queries to view the data and create new Correlation Rules.
You can only configure a single ServiceNow CMDB Collector, which is automatically configured every 6 hours, to reload the data from the configured tables and replace the existing data. You can always use the Sync Now option to reload the data and replace the existing data whenever you want.
Complete the following task before you begin configuring Cortex XSIAM to receive data from ServiceNow CMDB.
- Create a ServiceNow CMDB user with SNOW credentials, who is designated to access the tables from ServiceNow CMDB for data collection in Cortex XSIAM. Record the credentials for this user as you will need them when configuring the ServiceNow CMDB Collector in Cortex XSIAM.
Configure Cortex XSIAM to receive data from ServiceNow CMDB:
- Navigate to Settings → Data Sources & Integrations.
- On the Data Sources & Integrations page, click + Add New, search for ServiceNow CMDB, then hover over it and click Add.
- Set the following parameters.
- Domain: Specify your ServiceNow CMDB domain URL.
- User Name: Specify the username for your ServiceNow CMDB user designated in Cortex XSIAM.
- Password: Specify the password for your ServiceNow CMDB user designated in Cortex XSIAM.
- Tables: You can do any of the following actions to configure the tables whose data is collected from ServiceNow CMDB.
- Select the tables from the list of default ServiceNow CMDB tables that you want to collect from. After each table selection, select to add the table to the tables already listed below for data collection.
- Specify any custom tables that you want to configure for data collection.
- From the default list of tables already configured, you can delete any of them by hovering over the table and selecting the X icon.
-
Click Test to validate access, and then click Enable.
After events start to come in, a green check mark appears underneath the ServiceNow CMDB Collector configuration with the data and time that the data was last synced.
-
(Optional) Manage your ServiceNow CMDB Collector.
After you enable the ServiceNow CMDB Collector, you can make additional changes as needed. To modify a configuration, select any of the following options:
- Edit the ServiceNow CMDB Collector settings.
- Disable the ServiceNow CMDB Collector.
- Delete the ServiceNow CMDB Collector.
- Sync Now to get the latest data from the tables configured. The data is replaced automatically every 6 hours, but you can always get the latest data as needed.
- After Cortex XSIAM begins receiving data from ServiceNow CMDB, you can use the XQL Search to search for logs in the new datasets, where each dataset name is based on the table name using the format
servicenow_cmdb_<table name>_raw.
ServiceNow Automation and Collection
Important
This connector is only available for tenants that onboarded after July 26, 2026. For tenants that onboarded before this date, use Marketplace to access the standalone integration. For more information, see Marketplace.
ServiceNow is an IT service management platform that helps streamline security-related service management and IT operations. It provides a service-centric CMDB that proactively analyzes service-impacting changes, identifies issues, and eliminates outages. Cortex integrates with ServiceNow to create, update, query, and delete tickets and table records, perform Identity Lifecycle Management, collect audit and syslog events, and connect to ServiceNow MCP servers for agentic AI workflows.
This connector includes the following sub-capabilities (Marketplace integrations link to PAN DEV for more information):
- ServiceNow CMDB: ServiceNow CMDB is a service-centric foundation that proactively analyzes service-impacting changes, identifies issues, and eliminates outages. This sub-capability is available with any active Cortex XSIAM, Cortex Cloud Posture Security, Cortex Cloud, Cortex Cloud Runtime Security, Cortex XDR, or Cortex AgentiX license.
- ServiceNow Event Collector: Use this integration to fetch audits, syslog transactions, cases, and outbound HTTP logs from ServiceNow as Cortex XSIAM events. This sub-capability is available with any active Cortex XSIAM license.
- ServiceNow IAM: Integrate with ServiceNow's services to execute CRUD operations for employee lifecycle processes. This sub-capability is available with any active Cortex XSIAM, Cortex Cloud Posture Security, Cortex Cloud, Cortex Cloud Runtime Security, Cortex XDR, or Cortex AgentiX license.
- ServiceNow MCP: Use this integration to connect securely with a ServiceNow Model Context Protocol (MCP) server and access its tools in real time. This sub-capability is available with any active Cortex XSIAM, Cortex Cloud Posture Security, Cortex Cloud, Cortex Cloud Runtime Security, Cortex XDR, or Cortex AgentiX license with the Attack Surface Management (ASM) or Exposure Management add-on.
- ServiceNow v2: Use The ServiceNow IT Service Management (ITSM) solution to modernize the way you manage and deliver services to your users. This sub-capability is available with any active Cortex XSIAM, Cortex Cloud Posture Security, Cortex Cloud, Cortex Cloud Runtime Security, Cortex XDR, or Cortex AgentiX license.
To configure this connector, follow the steps outlined in the configuration wizard.
ServiceNow
Secure configurations, monitor identity risks, and manage agent security across your ServiceNow environment.
This connector includes the following capabilities and sub-capabilities (if applicable):
- Agent Security Scanning: This capability is available with any active Cortex Cloud Posture Security license.
- agent-activity-scan: Agent Activity Monitoring. This sub-capability is available with any active Cortex Cloud Posture Security license.
- Identity Posture: Maintain visibility and control over ServiceNow identities, including users, groups and roles. This capability is available with any active Cortex XSIAM, Cortex Cloud Posture Security, Cortex Cloud Runtime Security, or Cortex Data Security license.
- Groups: Ingest groups from ServiceNow. This sub-capability is available with any active Cortex XSIAM, Cortex Cloud Posture Security, Cortex Cloud Runtime Security, or Cortex Data Security license.
- Roles: Ingest roles from ServiceNow. This sub-capability is available with any active Cortex XSIAM, Cortex Cloud Posture Security, Cortex Cloud Runtime Security, or Cortex Data Security license.
- Users: Ingest users from ServiceNow. This sub-capability is available with any active Cortex XSIAM, Cortex Cloud Posture Security, Cortex Cloud Runtime Security, or Cortex Data Security license.
- Security Posture: Detect, monitor and alert on settings of your SAAS application. This capability is available with any active Cortex XSIAM or Cortex Cloud Posture Security license.
- saas-posture-config-remediation: Help remediate the misconfigured security settings of your SAAS application. This sub-capability is available with any active Cortex XSIAM or Cortex Cloud Posture Security license.
To configure this connector, follow the steps outlined in the configuration wizard.
Shopify
Here are the articles in this section:
Shopify
The capabilities and sub-capabilities listed for this connector are available with any active Cortex XSIAM or Cortex Cloud Posture Security license.
This connector includes the following capabilities and sub-capabilities (if applicable):
- SaaS Posture Configuration Monitoring: Detect, monitor and alert on settings of your SAAS application.
- saas-posture-config-remediation: Help remediate the misconfigured security settings of your SAAS application.
To configure this connector, follow the steps outlined in the configuration wizard.
Shodan
Shodan
Important
This connector is only available for tenants that onboarded after July 26, 2026. For tenants that onboarded before this date, use Marketplace to access the standalone integration. For more information, see Marketplace.
This connector is available with any active Cortex XSIAM or Cortex AgentiX license.
Shodan is a search engine for Internet-connected devices. Unlike traditional search engines that index websites, Shodan indexes information about devices connected to the internet, such as servers, routers, webcams, and other IoT devices.
This connector includes the following sub-capabilities (Marketplace integrations link to PAN DEV for more information):
- Shodan_v2: A search engine used for searching Internet-connected devices.
To configure this connector, follow the steps outlined in the configuration wizard.
Skyhigh Security
Skyhigh Security
Important
This connector is only available for tenants that onboarded after July 26, 2026. For tenants that onboarded before this date, use Marketplace to access the standalone integration. For more information, see Marketplace.
This connector is available with any active Cortex XSIAM or Cortex AgentiX license.
Skyhigh Security is a cloud-based, multi-tenant service that enables Cloud Discovery and Risk Monitoring, Cloud Usage Analytics, and Cloud Access and Control. Skyhigh Secure Web Gateway (SWG) is a cloud-native web security solution that provides layered protection from threats and data loss with integrated RBI, CASB, and DLP capabilities, and lets you manage its block and allow lists.
This connector includes the following sub-capabilities (Marketplace integrations link to PAN DEV for more information):
- Skyhigh Secure Web Gateway (On Prem): Manages the block and allow lists within Skyhigh Secure Web Gateway.
- Skyhigh Security: Skyhigh Security is a cloud-based, multi-tenant service that enables Cloud Discovery and Risk Monitoring, Cloud Usage Analytics, Cloud Access and Control.
To configure this connector, follow the steps outlined in the configuration wizard.
Slack
Slack Automation and Collection
Important
This connector is only available for tenants that onboarded after July 26, 2026. For tenants that onboarded before this date, use Marketplace to access the standalone integration. For more information, see Marketplace.
Send messages and notifications to your Slack team and integrate with Slack's services to execute create, read, update, and delete operations for employee lifecycle processes. Collect and model Slack audit logs in Cortex, and interact with the Cortex Agentic Assistant directly from Slack.
This connector includes the following sub-capabilities (Marketplace integrations link to PAN DEV for more information):
- Slack Event Collector: Slack logs event collector integration for XSIAM. This sub-capability is available with any active Cortex XSIAM license.
- Slack IAM: Integrate with Slack's services to execute CRUD operations for employee lifecycle processes. This sub-capability is available with any active Cortex XSIAM or Cortex AgentiX license.
- SlackV3: Send messages and notifications to your Slack team. This sub-capability is available with any active Cortex XSIAM, Cortex Cloud Posture Security, Cortex Cloud, Cortex Cloud Runtime Security, Cortex XDR, or Cortex AgentiX license.
To configure this connector, follow the steps outlined in the configuration wizard.
Slack Enterprise
Secure configurations and monitor identity risks in Slack Enterprise.
This connector includes the following capabilities and sub-capabilities, if applicable:
- Identity Posture: Maintain visibility and control over Slack identities, including users, groups and roles. This capability is available with any active Cortex XSIAM, Cortex Cloud Posture Security, Cortex Cloud Runtime Security, or Cortex Data Security license.
- SaaS Posture Configuration Monitoring: Detect, monitor and alert on settings of your SAAS application. This capability is available with any active Cortex XSIAM or Cortex Cloud Posture Security license.
- saas-posture-config-remediation: Help remediate the misconfigured security settings of your SAAS application. This sub-capability is available with any active Cortex XSIAM or Cortex Cloud Posture Security license.
To configure this connector, follow the steps outlined in the configuration wizard.
SMB
SMB
Important
This connector is only available for tenants that onboarded after July 26, 2026. For tenants that onboarded before this date, use Marketplace to access the standalone integration. For more information, see Marketplace.
This connector is available with any active Cortex XSIAM, Cortex Cloud Posture Security, Cortex Cloud, Cortex Cloud Runtime Security, Cortex XDR, or Cortex AgentiX license.
Manage files and directories on an SMB server. Supports the SMB2 and SMB3 protocols.
This connector includes the following sub-capabilities (Marketplace integrations link to PAN DEV for more information):
To configure this connector, follow the steps outlined in the configuration wizard.
SMIME Messaging
SMIME Messaging
Important
This connector is only available for tenants that onboarded after July 26, 2026. For tenants that onboarded before this date, use Marketplace to access the standalone integration. For more information, see Marketplace.
This connector is available with any active Cortex XSIAM or Cortex AgentiX license.
Use the S/MIME (Secure Multipurpose Internet Mail Extensions) integration to send and receive secure MIME data. Send S/MIME-signed, encrypted, or signed-and-encrypted messages, and decrypt or verify S/MIME messages.
This connector includes the following sub-capabilities (Marketplace integrations link to PAN DEV for more information):
- SMIME Messaging: Use the S/MIME (Secure Multipurpose Internet Mail Extensions) integration to send and receive secure MIME data.
To configure this connector, follow the steps outlined in the configuration wizard.
Snowflake
You can configure collecting Snowflake data using a Cloud Posture and Runtime Security data source or connector (onboarded after July 26, 2026):
| Collection Method | Description |
|---|---|
| Cloud Posture and Runtime Security data source overview | Forward Snowflake data to Cortex XSIAM using the Snowflake data source. |
| Link to Cloud Posture and Runtime Security data source instructions | How to onboard Snowflake |
| Link to connector (onboarded after July 26, 2026) | Snowflake Automation and Collection |
How to onboard Snowflake
This feature is included with a Cortex XSIAM Premium license. It is also included with any other Cortex XSIAM license that has the Cloud Posture Security or Cloud Runtime Security add-on.
Integrate Cortex Cloud Data Security with your Snowflake account to gain comprehensive visibility into any data and posture risk existing in your Snowflake environment. This integration enables automated scanning of all assets in Snowflake, including data classification and risk assessment.
You can add Snowflake as a third-party data source in Cortex Cloud Data Security .
- In order to use Snowflake, you must be registered with one of these cloud providers: Amazon AWS, Microsoft Azure, or Google Cloud Platform (GCP).
- Ensure you have the necessary account permissions to onboard. It is recommended to use
Account Adminas the role for the onboarding.
Configuration Step
- Navigate to Settings → Data Sources & Integrations.
- On the Data Sources & Integrations page, click + Add New.
- On the Add Data Sources or Integrations page, search for Snowflake, then hover over it and click Add.
-
On the New Data Source Snowflake integration instance settings page, do the following:
- Enter a display name for your Snowflake integration instance.
- Enter a Data Sharing Account Identifier.
The account identifier can be found using the user information at the bottom left. Hover over the account you wish to onboard and select the copy option at the top right. The account identifier is usually of the format:
(organization).[account]- (Optional) If you have a Snowflake account that is protected by a network policy, turn on the My Snowflake account is protected by network policies toggle button. The network policies are related to the IP allow list.
- Select a cloud platform and choose a region.
- (Optional) If you want to use an existing user:
- Click Show advance settings and then turn on the Use an existing user toggle button.
- Enter the user name and the login name.
- Click Next.
Establish Connection Step
- Open your Snowflake console in a new tab.
- Using the copy or download icons, copy or download the script in the Generated script text box and paste it into a new worksheet in Snowflake.
- Select the entire script and select Run all.
- Once the script runs without errors, come back to the Snowflake screen and click Verify Connection to check if the instance is detected.
Verify Connection Step
- A success or failure message appears on the screen.
- If a success message appears, you can do the following:
- View the instance's information in the Snowflake Posture instances.
- View the assets in Asset Inventory, once the first scan is complete.
Delete a Snowflake instance
- Navigate to Settings → Data Sources & Integrations.
- On the Data Sources & Integrations page, select the Snowflake integration or filter to search for it and then select it.
- On the Snowflake page, right click the row of the integration instance you want to delete.
-
From the drop down menu, select Settings and from the integration instance settings page select the Delete checkbox and then click Delete.
The Snowflake instance is now removed, including all previous scans.
Snowflake Automation and Collection
Important
This connector is only available for tenants that onboarded after July 26, 2026. For tenants that onboarded before this date, use Marketplace to access the standalone integration. For more information, see Marketplace.
This sub-capability is available with any active Cortex XSIAM or Cortex AgentiX license.
integrate with Snowflake products.
This connector includes the following sub-capabilities (Marketplace integrations link to PAN DEV for more information):
- Snowflake: Analytic data warehouse provided as Software-as-a-Service.
To configure this connector, follow the steps outlined in the configuration wizard.
SolarWinds
SolarWinds
Important
This connector is only available for tenants that onboarded after July 26, 2026. For tenants that onboarded before this date, use Marketplace to access the standalone integration. For more information, see Marketplace.
This connector is available with any active Cortex XSIAM or Cortex AgentiX license.
The SolarWinds integration interacts with the SWIS API to fetch alerts and events, and provides commands to retrieve lists of alerts and events. It requires installation of the SolarWinds Orion Platform, which consolidates the full suite of monitoring capabilities into one platform.
This connector includes the following sub-capabilities (Marketplace integrations link to PAN DEV for more information):
- SolarWinds: The SolarWinds integration interacts with the SWIS API to allow you to fetch alerts and events. It also provides commands to retrieve lists of alerts and events.
To configure this connector, follow the steps outlined in the configuration wizard.
Sonatype Nexus
Here are the articles in this section:
Connect Sonatype Nexus registry
Configure Cortex XSIAM to scan your Nexus Registry. This allows Cortex to list all container registries or images, and secure them from vulnerabilities, malware, and secrets.
License type: This feature is included with a Cortex XSIAM Premium license. It is also included with any other Cortex XSIAM product that has the Cloud Posture Security or the Cloud Runtime Security add-on.
How to connect Nexus registry
Follow the wizard to use the Sonatype Nexus registry connector in Cortex XSIAM.
- Navigate to Settings → Data Sources & Integrations.
- On the Add Data Sources or Integrations page, click + Add New, search for Sonatype, then hover over it and click Add.
- The Instance Name is automatically populated. You can change it to a more meaningful name.
- Choose the Scan Mode, and then follow the steps for that mode to configure the connection.
Cloud Scan
Security scanning is done in the Cortex XSIAM environment when you select this mode.
-
Select the appropriate Cloud Provider and Region for the Cortex environment to use for registry scanning.
As a best practice, choose the region closest to your registry deployment to achieve the best scanning throughput and potentially reduce cloud costs
- (Optional) Enable Allow access by IP’s to specify a static IP address for the scanner to use. Make sure the static IP is allowed through your firewall so the scanner can access the registry during the scanning process.
-
Enter the Registry URL.
Enter the hostname, or Fully Qualified Domain Name (FQDN), and the connector port for the Nexus registry’s login server in the following format:
https://
<hostname>:<connector_port>,<hostname>— unique name assigned when the Nexus registry was created<connector_port>— https connector for the specific Nexus repository.For example:
https://ec2-100-25-223-135.compute-1.amazonaws.com:8083https://35.209.190.220:8084If you are using a CA certificate, enter the server IP address instead of the registry url.
- Under Authentication Method, enter the Username and Password of the registry that you want to connect.
- (Optional) Expand Show advanced settings and then enter a custom CA certificate in PEM format for Cortex to validate the Nexus registry.
- Select Next.
Scan with Outpost
Security scanning is done on infrastructure deployed to a cloud account that you own. This mode requires additional cloud provider permissions and may incur extra costs.
Prerequisite
Ensure an Outpost is connected to your tenant.
-
Choose a Cloud Provider to initialize registry scanning.
Note
If you choose Azure as the Cloud Provider, you must also select the Tenant Id. The Tenant Id is required to approve Cortex as an enterprise application in your Azure tenant.
-
Choose Outpost account to use for this instance. If no Outposts are shown, you can Create a new one. For more details, see Outposts.
Note
If you choose Azure as the cloud provider, only Outposts associated with the selected tenant ID are displayed.
- Select the Region where the registry is hosted.
- (Optional) Enable Allow access by IPs to specify a static IP address for the scanner to use. Make sure the static IP is allowed through your firewall so the scanner can access the registry during the scanning process.
-
Enter the Registry URL.
Enter the hostname, or Fully Qualified Domain Name (FQDN), and the connector port for the Nexus registry’s login server in the following format:
<https://<hostname>:<connector_port>.<hostname>— unique name assigned when the registry was created.<connector_port>— https connector for the specific Nexus repository.For example:
https://ec2-100-25-223-135.compute-1.amazonaws.com:8083https://35.209.190.220:8084If you are using a CA certificate, enter the server IP address instead of the registry URL.
- Under Authentication Method, enter the Username and Password of the registry that you want to connect.
- (Optional) Expand Show advanced settings and then enter a custom CA certificate in PEM format for Cortex to validate the Nexus registry.
- Select Next.
Scan with Broker VM
Security scanning in private networks is performed using broker VM infrastructure when you select this mode.
Prerequisite
Ensure one of the following is configured:
- Choose a Scan with Broker VM mode to initiate registry scanning. You can select either a standalone Broker VM or a High Availability (HA) Cluster.
-
Select Applicable Broker VMs.
Choose the appropriate Broker VM or Cluster from the list configured in your tenant.
Note
- The list of Broker VMs displays only VMs that support registry scanning.
- The list of high-availability Clusters displays only clusters that contain at least one VM supporting registry scanning.
- The registry scanning status for each VM appears in brackets if it was previously activated for that specific VM.
If the list does not display any Broker VMs or clusters, Add New Broker VM or Add New Cluster. For more details, see Set up and configure Broker VM.
-
Enter the Registry URL.
Enter the hostname, or Fully Qualified Domain Name (FQDN), and the connector port for the Nexus registry’s login server in the following format:
<https://<hostname>:<connector_port>.<hostname>— unique name assigned when the registry was created.<connector_port>— https connector for the specific Nexus repository.For example:
https://ec2-100-25-223-135.compute-1.amazonaws.com:8083https://35.209.190.220:8084If you are using a CA certificate, enter the server IP address instead of the registry URL.
- Under Authentication Method, enter the Username and Password of the registry that you want to connect.
- (Optional) Expand Show advanced settings and then enter a custom CA certificate in PEM format for Cortex to validate the Nexus registry.
-
Select Next.
- In the Initial Scan Configuration, set your scanning process to focus on recently added or modified container images and exclude older ones that do not align with your current scanning objectives. This setting helps avoid unnecessary scans. Choose one of the following options:
- All: Scans all container images, including all versions (tags), in all discovered repositories.
- Latest Tag: Scans only images tagged 'latest' in all discovered repositories.
- Days Modified: Scans container images that have been created in the last few days. You can select a range of up to 90 days for the scan.
-
Select Save.
When the Sonatype data source is saved successfully, a new data connector is created, and the initial discovery scan begins. The connection process may take up to 15 minutes.
- To check the connector status and scan results, follow these steps:
- Go to Settings → Data Sources & Integrations.
- Find the Sonatype instance from the list of 3rd Party Data Sources connectors, or use Search.
- In the Sonatype instance row, select View Details. The Sonatype Instances page appears.
- On the Sonatype Instances page, you can filter results by any heading and value.
-
Select an instance name to open the details pane. The details pane contains the following granular information:
Instance Details Description Status Shows the status of the connector: Connected, Error, Warning, Disabled, or Pending. Applet Status on Broker VM Shows the status of the Registry Scanner applet on the Broker VM page. This status is visible only when the Scan with Broker VM mode is selected. Repositories Shows the number of scanned repositories in the registry. Scan Mode Shows the selected scan mode for the data connector, such as Cloud Scan, Scan with Outpost, or Scan with Broker VM. Security Capabilities Shows a breakdown of the security capabilities enabled on the instance and their individual statuses. For example, select Registry Scanning when it shows a warning or error status to see the open errors and issues that contributed to the status.
-
Next Steps.
- After the scan is complete, you can view the list of scanned images on the Container Images Inventory page. For more details, see Container Image assets.
- If you have selected the Scan with Broker VM option, then a Registry Scanner applet is created on the selected Broker VM or Cluster. For details, see Verify Registry Scanner connection.
Manage a Sonatype connector
After you add a Sonatype connector, you can modify the connector settings and configure the scanning scope to control which images are scanned in the connected registry.
To manage the connector, follow these steps:
- Navigate to Settings → Data Sources & Integrations.
- Select the Sonatype data source from the list of data sources, or filter to search.
-
Select the Sonatype row. A pane opens with a list of integration instances and their details.
You can create a new instance by selecting Add Instance and following the onboarding wizard to define the settings.
-
Right click an instance to perform actions on it as follows:
Action Instructions Edit Edit the Sonatype instance.
Note
- If you selected Scan with Broker VM mode, you can't change to a different scan mode (such as Cloud Discovery or Scan with Outpost) when you edit the instance.
- When editing an instance configured for Scan with Broker VM, you must re-enter your authentication credentials, including Username, Password, and CA certificate.
Exclude/Include images Define conditions to automatically exclude or include specific images while scanning. Conditions can be based on Repository or Tags. These conditions apply automatically to newly discovered images in the account. Delete Removes the connector. Disable Stops image scanning for the connector without deleting it.
Sophos
Sophos
Important
This connector is only available for tenants that onboarded after July 26, 2026. For tenants that onboarded before this date, use Marketplace to access the standalone integration. For more information, see Marketplace.
This connector is available with any active Cortex XSIAM or Cortex AgentiX license.
Sophos Central is a cloud-based management platform for Sophos' cybersecurity solutions, providing centralized control and real-time visibility over endpoint, mobile, email, web, and firewall protection from a single interface. Sophos Firewall is an on-premise firewall that lets you manage your firewall, respond to threats, and monitor what's happening on your network.
This connector includes the following sub-capabilities (Marketplace integrations link to PAN DEV for more information):
- Sophos Central: The unified console for managing Sophos products.
- sophos_firewall:
To configure this connector, follow the steps outlined in the configuration wizard.
Splunk
Splunk Automation and Collection
Important
This connector is only available for tenants that onboarded after July 26, 2026. For tenants that onboarded before this date, use Marketplace to access the standalone integration. For more information, see Marketplace.
Run queries on Splunk servers and fetch events from both Splunk Enterprise Security (ES) and non-ES environments. SplunkPy fetches notable events (for Splunk ES up to 8.1) and SplunkPy v2 fetches Findings and Investigations (for Splunk ES 8.2 and higher), enriching them with Asset, Identity, and Drilldown data and supporting bi-directional mirroring between Splunk and Cortex.
This connector includes the following sub-capabilities (Marketplace integrations link to PAN DEV for more information):
- SplunkPy: Run queries on Splunk and fetch Notable Events (Splunk ES versions up to 8.2). This sub-capability is available with any active Cortex XSIAM, Cortex Cloud Posture Security, or Cortex AgentiX license.
- SplunkPy v2: Run queries on Splunk and fetch Splunk ES Findings and Investigations (Splunk ES 8.2+). This sub-capability is available with any active Cortex XSIAM, Cortex Cloud Posture Security, or Cortex AgentiX license.
- SplunkPyPreRelease: Runs queries on Splunk servers. This sub-capability is available with any active Cortex XSIAM or Cortex AgentiX license.
To configure this connector, follow the steps outlined in the configuration wizard.
Splunk
The capabilities and sub-capabilities listed for this connector are available with any active Cortex XSIAM or Cortex Cloud Posture Security license.
This connector includes the following capabilities and sub-capabilities (if applicable):
- Security Posture: Detect, monitor and alert on settings of your SaaS application.
- saas-posture-config-remediation: Help remediate the misconfigured security settings of your SaaS application.
To configure this connector, follow the steps outlined in the configuration wizard.
Sublime Security
Sublime Security
Important
This connector is only available for tenants that onboarded after July 26, 2026. For tenants that onboarded before this date, use Marketplace to access the standalone integration. For more information, see Marketplace.
This connector is available with any active Cortex XSIAM or Cortex AgentiX license.
EmailRep.io provides the reputation and reports for email addresses.
This connector includes the following sub-capabilities (Marketplace integrations link to PAN DEV for more information):
- EmailRepIO: Provides email address reputation and reports.
To configure this connector, follow the steps outlined in the configuration wizard.
Sumo Logic
Sumo Logic Automation and Collection
Important
This connector is only available for tenants that onboarded after July 26, 2026. For tenants that onboarded before this date, use Marketplace to access the standalone integration. For more information, see Marketplace.
This sub-capability is available with any active Cortex XSIAM or Cortex AgentiX license.
Use the SumoLogic integration to search for and return SumoLogic records.
This connector includes the following sub-capabilities (Marketplace integrations link to PAN DEV for more information):
- SumoLogic: Cloud-based service for logs & metrics management.
To configure this connector, follow the steps outlined in the configuration wizard.
Sumo Logic
The capabilities and sub-capabilities listed for this connector are available with any active Cortex XSIAM or Cortex Cloud Posture Security license.
This connector includes the following capabilities and sub-capabilities (if applicable):
- Security Posture: Detect, monitor and alert on settings of your SaaS application.
- saas-posture-config-remediation: Help remediate the misconfigured security settings of your SaaS application.
To configure this connector, follow the steps outlined in the configuration wizard.
SysAid
SysAid
Important
This connector is only available for tenants that onboarded after July 26, 2026. For tenants that onboarded before this date, use Marketplace to access the standalone integration. For more information, see Marketplace.
This connector is available with any active Cortex XSIAM or Cortex AgentiX license.
SysAid is a robust IT management system designed to meet all of the needs of an IT department. Fetch service records, list and search assets and users, and list, search, update, close, create, and delete service records.
This connector includes the following sub-capabilities (Marketplace integrations link to PAN DEV for more information):
- SysAid: SysAid is a robust IT management system designed to meet all of the needs of an IT department.
To configure this connector, follow the steps outlined in the configuration wizard.
Syslog Sender
Syslog Sender
Important
This connector is only available for tenants that onboarded after July 26, 2026. For tenants that onboarded before this date, use Marketplace to access the standalone integration. For more information, see Marketplace.
This connector is available with any active Cortex XSIAM or Cortex AgentiX license.
Use the Syslog Sender integration to send messages in RFC 5424 message format and mirror investigation War Room entries to Syslog.
This connector includes the following sub-capabilities (Marketplace integrations link to PAN DEV for more information):
- Syslog Sender: Use the Syslog Sender integration to send messages and mirror incident War Room entries to Syslog.
To configure this connector, follow the steps outlined in the configuration wizard.
Tanium
Tanium
Important
This connector is only available for tenants that onboarded after July 26, 2026. For tenants that onboarded before this date, use Marketplace to access the standalone integration. For more information, see Marketplace.
This connector is available with any active Cortex XSIAM or Cortex AgentiX license.
Integrate with Tanium to hunt, detect, investigate, and remediate threats and vulnerabilities across your endpoints. Manage questions, actions, saved questions, packages, and sensor information through the Tanium REST API, and manage endpoint processes, evidence, alerts, files, snapshots, and connections with Tanium Threat Response.
This connector includes the following sub-capabilities (Marketplace integrations link to PAN DEV for more information):
- Tanium Threat Response: Use the Tanium Threat Response integration to manage endpoints processes, evidence, alerts, files, snapshots, and connections. This Integration works with Tanium Threat Response version below 3.0.159. In order to use Tanium Threat Response version 3.0.159 and above, use Tanium Threat Response V2 Integration.
- Tanium Threat Response v2: Use the Tanium Threat Response integration to manage endpoint processes, evidence, alerts, files, snapshots, and connections. This integration works with Tanium Threat Response version 3.0.159 and above.
- Tanium v2: Tanium endpoint security and systems management, filters out [current results unavailable] when returning question results.
To configure this connector, follow the steps outlined in the configuration wizard.
TAXII
TAXII
Important
This connector is only available for tenants that onboarded after July 26, 2026. For tenants that onboarded before this date, use Marketplace to access the standalone integration. For more information, see Marketplace.
This connector is available with any active Cortex XSIAM or Cortex AgentiX license.
TAXII connectors for exchanging cyber threat intelligence. Ingest indicators from TAXII 1.x and TAXII 2.0/2.1 servers (TAXII Feed and TAXII 2 Feed), and serve system indicators as an outbound feed over TAXII or TAXII2 (TAXII Server and TAXII2 Server).
This connector includes the following sub-capabilities (Marketplace integrations link to PAN DEV for more information):
- TAXII 2 Feed
- TAXII Server: This integration provides TAXII Services for system indicators (Outbound feed).
- TAXII2 Server: This integration provides TAXII2 Services for system indicators (Outbound feed).
- TAXIIFeed
To configure this connector, follow the steps outlined in the configuration wizard.
TeamViewer
TeamViewer
Important
This connector is only available for tenants that onboarded after July 26, 2026. For tenants that onboarded before this date, use Marketplace to access the standalone integration. For more information, see Marketplace.
This sub-capability is available with any active Cortex XSIAM license.
TeamViewer is a remote access and remote control computer software, allowing maintenance of computers and other devices. Use this integration to collect events automatically from TeamViewer.
This connector includes the following sub-capabilities (Marketplace integrations link to PAN DEV for more information):
- TeamViewer Event Collector: TeamViewer event collector integration for Cortex XSIAM.
To configure this connector, follow the steps outlined in the configuration wizard.
Telegram
Telegram
Important
This connector is only available for tenants that onboarded after July 26, 2026. For tenants that onboarded before this date, use Marketplace to access the standalone integration. For more information, see Marketplace.
This connector is available with any active Cortex XSIAM or Cortex AgentiX license.
Integrate with Telegram to run automation and remediation commands. This is a beta connector, which lets you implement and test pre-release software; it might contain bugs and receive non-backward compatible updates during the beta phase.
This connector includes the following sub-capabilities (Marketplace integrations link to PAN DEV for more information):
To configure this connector, follow the steps outlined in the configuration wizard.
Tenable
Tenable
Important
This connector is only available for tenants that onboarded after July 26, 2026. For tenants that onboarded before this date, use Marketplace to access the standalone integration. For more information, see Marketplace.
Tenable vulnerability management for auditors and security analysts. Nessus is a vulnerability scanner by Tenable Network Security. Tenable Vulnerability Management (formerly Tenable.io) is a comprehensive asset-centric solution that accurately tracks resources while accommodating dynamic assets such as cloud, mobile devices, containers, and web applications. Tenable.sc gives you a real-time, continuous assessment of your security posture so you can find and fix vulnerabilities faster.
This connector includes the following sub-capabilities (Marketplace integrations link to PAN DEV for more information):
- Nessus: Vulnerability scanner for auditors and security analysts by Tenable Network Security. This sub-capability is available with any active Cortex XSIAM or Cortex AgentiX license.
- Tenable.io: A comprehensive asset-centric solution to accurately track resources while accommodating dynamic assets such as cloud, mobile devices, containers, and web applications. This sub-capability is available with any active Cortex XSIAM or Cortex AgentiX license with the Exposure Management add-on.
- Tenable.sc: With Tenable.sc (formerly SecurityCenter) you get a real-time, continuous assessment of your security posture so you can find and fix vulnerabilities faster. This sub-capability is available with any active Cortex XSIAM or Cortex AgentiX license with the Exposure Management add-on.
To configure this connector, follow the steps outlined in the configuration wizard.
Terraform
Here are the articles in this section:
Terraform
The capabilities and sub-capabilities listed for this connector are available with any active Cortex XSIAM or Cortex Cloud Posture Security license.
This connector includes the following capabilities and sub-capabilities (if applicable):
- SaaS Posture Configuration Monitoring: Detect, monitor and alert on settings of your SAAS application.
saas-posture-config-remediation: Help remediate the misconfigured security settings of your SAAS application.
To configure this connector, follow the steps outlined in the configuration wizard.
Thales
Thales
Important
This connector is only available for tenants that onboarded after July 26, 2026. For tenants that onboarded before this date, use Marketplace to access the standalone integration. For more information, see Marketplace.
This connector is available with any active Cortex XSIAM license.
SafeNet Trusted Access prevents data breaches, helps with compliance with regulations, and supports migration to the cloud in a simple and secure fashion. Retrieve access, authentication, and audit logs and store them for investigation and response.
This connector includes the following sub-capabilities (Marketplace integrations link to PAN DEV for more information):
- SafeNetTrustedAccessEventCollector: Retrieve access, authentication, and audit logs and store them on a Security Information and Event Management (SIEM) system, local repository, or syslog file server. You can retrieve the logs only for the tenant that is associated with the API key, or for a direct or delegated child of that tenant.
To configure this connector, follow the steps outlined in the configuration wizard.
TheHive
TheHive
Important
This connector is only available for tenants that onboarded after July 26, 2026. For tenants that onboarded before this date, use Marketplace to access the standalone integration. For more information, see Marketplace.
This connector is available with any active Cortex XSIAM or Cortex AgentiX license.
TheHive Project is an open source and free Security Issue Response Platform designed to make life easier for SOCs, CSIRTs, CERTs and any information security practitioner dealing with security issues that need to be investigated and acted upon swiftly.
This connector includes the following sub-capabilities (Marketplace integrations link to PAN DEV for more information):
- TheHive Project: Integration with The Hive Project Security Incident Response Platform.
To configure this connector, follow the steps outlined in the configuration wizard.
Thinkst Canary
Thinkst Canary
Important
This connector is only available for tenants that onboarded after July 26, 2026. For tenants that onboarded before this date, use Marketplace to access the standalone integration. For more information, see Marketplace.
This connector is available with any active Cortex XSIAM or Cortex AgentiX license.
By presenting itself as an apparently benign and legitimate service, a Thinkst Canary draws the attention of unwanted activity. When someone trips one of the Canary's triggers, an alert is sent to notify the responsible parties so that action can be taken before valuable systems in your network are compromised. Fetch alerts from CanaryTools as issues and acknowledge them, get information about registered Canaries and Canary Tokens, and add IP addresses to the allow list.
This connector includes the following sub-capabilities (Marketplace integrations link to PAN DEV for more information):
- Thinkst Canary: By presenting itself as an apparently benign and legitimate service(s), the Canary draws the attention of unwanted activity. When someone trips one of the Canary's triggers, an alert is sent to notify the responsible parties so that action can be taken before valubale systems in your network are compromised.
To configure this connector, follow the steps outlined in the configuration wizard.
ThreatConnect
ThreatConnect
Important
This connector is only available for tenants that onboarded after July 26, 2026. For tenants that onboarded before this date, use Marketplace to access the standalone integration. For more information, see Marketplace.
This connector is available with any active Cortex XSIAM or Cortex AgentiX license.
ThreatConnect is an intelligence-driven security operations solution with intelligence, automation, analytics, and workflows. It fetches threat intelligence indicators from ThreatConnect (filterable by indicator owner) and fetches issues using the ThreatConnect v3 REST API.
This connector includes the following sub-capabilities (Marketplace integrations link to PAN DEV for more information):
- ThreatConnect Feed:
- ThreatConnect v3: ThreatConnect's integration is a intelligence-driven security operations solution with intelligence, automation, analytics, and workflows.
To configure this connector, follow the steps outlined in the configuration wizard.
ThreatMiner.org
ThreatMiner.org
Important
This connector is only available for tenants that onboarded after July 26, 2026. For tenants that onboarded before this date, use Marketplace to access the standalone integration. For more information, see Marketplace.
This connector is available with any active Cortex XSIAM or Cortex AgentiX license.
ThreatMiner is a threat intelligence portal for data mining threat intelligence, enriching indicators such as domains, IP addresses, and file hashes with related intelligence.
This connector includes the following sub-capabilities (Marketplace integrations link to PAN DEV for more information):
- ThreatMiner: Data Mining for Threat Intelligence.
To configure this connector, follow the steps outlined in the configuration wizard.
ThreatX
ThreatX
Important
This connector is only available for tenants that onboarded after July 26, 2026. For tenants that onboarded before this date, use Marketplace to access the standalone integration. For more information, see Marketplace.
This connector is available with any active Cortex XSIAM or Cortex AgentiX license.
Use the ThreatX integration to enrich intel and automate enforcement actions on the ThreatX Next Gen WAF. Add and remove CIDR ranges and IP addresses to block lists or the allow list, gather Entity metadata for intel enrichment and DBot scoring, and set Entity notes for SOC integration or further automation.
This connector includes the following sub-capabilities (Marketplace integrations link to PAN DEV for more information):
- ThreatX: The ThreatX integration allows automated enforcement and intel gathering actions.
To configure this connector, follow the steps outlined in the configuration wizard.
Tidy
Tidy
Important
This connector is only available for tenants that onboarded after July 26, 2026. For tenants that onboarded before this date, use Marketplace to access the standalone integration. For more information, see Marketplace.
This connector is available with any active Cortex XSIAM or Cortex AgentiX license.
Tidy reduces the on-boarding process for new recruits to a matter of minutes. It uses Ansible to connect to a new recruit's laptop over SSH and execute predefined commands, letting you build role-based playbooks that install languages, programs, and tools and configure the machine for onboarding.
This connector includes the following sub-capabilities (Marketplace integrations link to PAN DEV for more information):
- Tidy: Tidy integration handle endpoints environment installation.
To configure this connector, follow the steps outlined in the configuration wizard.
TOPdesk
TOPdesk
Important
This connector is only available for tenants that onboarded after July 26, 2026. For tenants that onboarded before this date, use Marketplace to access the standalone integration. For more information, see Marketplace.
This connector is available with any active Cortex XSIAM or Cortex AgentiX license.
TOPdesk's Enterprise Service Management software (ESM) lets your service teams join forces and process requests from a single platform. Connect to the TOPdesk portal to get information from the portal, as well as create and update issues.
This connector includes the following sub-capabilities (Marketplace integrations link to PAN DEV for more information):
- TOPdesk: TOPdesk's Enterprise Service Management software (ESM) lets your service teams join forces and process requests from a single platform.
To configure this connector, follow the steps outlined in the configuration wizard.
Tor Exit Adress
Tor Exit Adress
Important
This connector is only available for tenants that onboarded after July 26, 2026. For tenants that onboarded before this date, use Marketplace to access the standalone integration. For more information, see Marketplace.
This connector is available with any active Cortex XSIAM or Cortex AgentiX license.
Tor is free software and an open network that helps you defend against traffic analysis, a form of network surveillance that threatens personal freedom and privacy, confidential business activities and relationships, and state security. This feed fetches Tor exit address indicators.
This connector includes the following sub-capabilities (Marketplace integrations link to PAN DEV for more information):
To configure this connector, follow the steps outlined in the configuration wizard.
Trellix
Here are the articles in this section:
Trellix Database Security
Important
This connector is only available for tenants that onboarded after July 26, 2026. For tenants that onboarded before this date, use Marketplace to access the standalone integration. For more information, see Marketplace.
This connector is available with any active Cortex XSIAM or Cortex AgentiX license.
Use the McAfee Database Activity Monitoring (DAM) integration to fetch Alerts (issues) and query Alerts. This integration was integrated and developed with version 4.6.x of McAfee DAM.
This connector includes the following sub-capabilities (Marketplace integrations link to PAN DEV for more information):
- McAfeeDAM: McAfee Database Activity Monitoring.
To configure this connector, follow the steps outlined in the configuration wizard.
Trellix Email Security (ETP)
Important
This connector is only available for tenants that onboarded after July 26, 2026. For tenants that onboarded before this date, use Marketplace to access the standalone integration. For more information, see Marketplace.
Trellix Email Security - Cloud is a cloud-based platform that protects against advanced email attacks. Use this connector to import messages as issues, search for messages with specific attributes, retrieve alert data, and fetch Alert, Email Trace, and Activity Log events for investigation and threat hunting.
This connector includes the following sub-capabilities (Marketplace integrations link to PAN DEV for more information):
- FireEye ETP: Trellix Email Security - Cloud is a cloud-based platform that protects against advanced email attacks. This sub-capability is available with any active Cortex XSIAM or Cortex AgentiX license.
- FireEye ETP Event Collector: Use this integration to fetch email security incidents from Trellix Email Security - Cloud as Cortex XSIAM events. This sub-capability is available with any active Cortex XSIAM license.
To configure this connector, follow the steps outlined in the configuration wizard.
Trellix Email Security
Important
This connector is only available for tenants that onboarded after July 26, 2026. For tenants that onboarded before this date, use Marketplace to access the standalone integration. For more information, see Marketplace.
This connector is available with any active Cortex XSIAM or Cortex AgentiX license.
Integrate with Trellix (FireEye) email and network security products. FireEye Email Security (EX) protects against breaches caused by advanced email attacks, and FireEye Network Security (NX) detects and stops advanced, targeted, and other evasive attacks hiding in internet traffic.
This connector includes the following sub-capabilities (Marketplace integrations link to PAN DEV for more information):
- FireEye Email Security:
- FireEyeNX: FireEye Network Security is an effective cyber threat protection solution that helps organizations minimize the risk of costly breaches by accurately detecting and immediately stopping advanced, targeted, and other evasive attacks hiding in internet traffic.
To configure this connector, follow the steps outlined in the configuration wizard.
Trellix Endpoint (HX)
Important
This connector is only available for tenants that onboarded after July 26, 2026. For tenants that onboarded before this date, use Marketplace to access the standalone integration. For more information, see Marketplace.
FireEye Endpoint Security (HX) is an integrated solution that detects what others miss and protects endpoints against known and unknown threats. It provides access to information about endpoints, acquisitions, alerts, indicators, and containment, and collects FireEye HX audit events into Cortex.
This connector includes the following sub-capabilities (Marketplace integrations link to PAN DEV for more information):
- FireEye HX Event Collector: Palo Alto Networks FireEye HX Event Collector integration for XSIAM. This sub-capability is available with any active Cortex XSIAM license.
- FireEyeHX v2: FireEye Endpoint Security is an integrated solution that detects and protects endpoints against known and unknown threats. This integration provides access to information about endpoints, acquisitions, alerts, indicators, and containment. You can extract critical data and effectively operate the security operations automated playbook. This sub-capability is available with any active Cortex XSIAM or Cortex AgentiX license.
To configure this connector, follow the steps outlined in the configuration wizard.
Trellix ePO
Important
This connector is only available for tenants that onboarded after July 26, 2026. For tenants that onboarded before this date, use Marketplace to access the standalone integration. For more information, see Marketplace.
This connector is available with any active Cortex XSIAM or Cortex AgentiX license.
Integrate with Trellix (McAfee) ePolicy Orchestrator products. Enhance protection from network edge to endpoint with McAfee Advanced Threat Defense, run queries and receive alarms from McAfee ESM, get file reputations and the systems that reference files from McAfee Threat Intelligence Exchange (TIE), and manage McAfee ePO.
This connector includes the following sub-capabilities (Marketplace integrations link to PAN DEV for more information):
- McAfee Advanced Threat Defense: Integrated advanced threat detection: Enhancing protection from network edge to endpoint.
- McAfee ePO v2:
- McAfee ESM v2: This integration runs queries and receives alarms from McAfee Enterprise Security Manager (ESM). Supports version 10 and above.
- McAfee Threat Intelligence Exchange V2:
To configure this connector, follow the steps outlined in the configuration wizard.
Trellix Network
Important
This connector is only available for tenants that onboarded after July 26, 2026. For tenants that onboarded before this date, use Marketplace to access the standalone integration. For more information, see Marketplace.
This connector is available with any active Cortex XSIAM or Cortex AgentiX license.
Trellix Network (formerly FireEye) network security. FireEye Central Management (CM Series) is the threat intelligence hub that shares intelligence across the FireEye ecosystem to detect and prevent cyber attacks. FireEye Helix provides next-generation SIEM, orchestration, and threat intelligence for alert management, search, analysis, investigation, and reporting. McAfee Network Security Manager gives real-time visibility and control over McAfee intrusion prevention systems deployed across your network. FireEye (AX Series) submits malware objects and URLs for analysis.
This connector includes the following sub-capabilities (Marketplace integrations link to PAN DEV for more information):
- fireeye: Perform malware dynamic analysis.
- FireEye Central Management:
- FireEyeHelix: FireEye Helix is a security operations platform. FireEye Helix integrates security tools and augments them with next-generation SIEM, orchestration and threat intelligence tools such as alert management, search, analysis, investigations and reporting.
- McAfeeNSMv2: McAfee Network Security Manager gives you real-time visibility and control over all McAfee intrusion prevention systems deployed across your network.
To configure this connector, follow the steps outlined in the configuration wizard.
Trellix Sandbox
Important
This connector is only available for tenants that onboarded after July 26, 2026. For tenants that onboarded before this date, use Marketplace to access the standalone integration. For more information, see Marketplace.
This connector is available with any active Cortex XSIAM or Cortex AgentiX license.
Use the McAfee DXL integration to connect and optimize security actions across multiple vendor products.
This connector includes the following sub-capabilities (Marketplace integrations link to PAN DEV for more information):
- McAfee DXL: McAfee DXL client.
To configure this connector, follow the steps outlined in the configuration wizard.
Trellix SIEM
Important
This connector is only available for tenants that onboarded after July 26, 2026. For tenants that onboarded before this date, use Marketplace to access the standalone integration. For more information, see Marketplace.
This connector is available with any active Cortex XSIAM or Cortex AgentiX license.
Connect to McAfee Active Response (MAR) to capture and monitor events, files, host flows, process objects, context, and system state changes that may be indicators of attack (IoAs) or attack components lying dormant.
This connector includes the following sub-capabilities (Marketplace integrations link to PAN DEV for more information):
To configure this connector, follow the steps outlined in the configuration wizard.
Trellix Threat Intel
Important
This connector is only available for tenants that onboarded after July 26, 2026. For tenants that onboarded before this date, use Marketplace to access the standalone integration. For more information, see Marketplace.
This connector is available with any active Cortex XSIAM or Cortex AgentiX license.
FireEye iSIGHT is a cybersecurity intelligence platform that provides organizations with comprehensive threat intelligence and analysis. It offers real-time monitoring and detection of emerging cyber threats, allowing businesses to proactively defend against attacks. Fetch indicators and reports from the FireEye Intelligence Feed.
This connector includes the following sub-capabilities (Marketplace integrations link to PAN DEV for more information):
- FireEye iSIGHT: FireEye cyber threat intelligence.
- FireEyeFeed:
To configure this connector, follow the steps outlined in the configuration wizard.
TrendAI
TrendAI
Important
This connector is only available for tenants that onboarded after July 26, 2026. For tenants that onboarded before this date, use Marketplace to access the standalone integration. For more information, see Marketplace.
Trend Micro security products for endpoint, server, cloud, email, and extended detection and response (XDR). Manage Apex One agents and User-Defined Suspicious Objects, administer Deep Security computers, firewall rules, and policies, protect cloud applications with Cloud App Security, analyze samples with Deep Discovery Analyzer, and collect logs and events from Trend Micro Email Security and Trend Vision One.
This connector includes the following sub-capabilities (Marketplace integrations link to PAN DEV for more information):
- Trend Micro Apex: Trend Micro Apex One central automation to manage agents and User-Defined Suspicious Objects. This sub-capability is available with any active Cortex XSIAM or Cortex AgentiX license.
- Trend Micro Deep Discovery Analyzer: This sub-capability is available with any active Cortex XSIAM or Cortex AgentiX license.
- Trend Micro Deep Security: Cloud Security Protection. This sub-capability is available with any active Cortex XSIAM or Cortex AgentiX license.
- Trend Micro Email Security Event Collector: Palo Alto Networks Trend Micro Email Security Event Collector integration for XSIAM. This sub-capability is available with any active Cortex XSIAM license.
- TrendMicro Cloud App Security: This sub-capability is available with any active Cortex XSIAM or Cortex AgentiX license.
- TrendMicroVisionOneEventCollector: Palo Alto Networks Trend Micro Vision One Event Collector integration for Cortex XSIAM collects the Workbench, Observed Attack Techniques, Search Detections and Audit logs. This sub-capability is available with any active Cortex XSIAM license.
To configure this connector, follow the steps outlined in the configuration wizard.
Twilio
Twilio
Important
This connector is only available for tenants that onboarded after July 26, 2026. For tenants that onboarded before this date, use Marketplace to access the standalone integration. For more information, see Marketplace.
Integrate with Twilio to send SMS text messages, and with Twilio SendGrid, a cloud-based email delivery platform, to collect email activity events such as deliveries, opens, clicks, bounces, and spam reports for analysis in Cortex.
This connector includes the following sub-capabilities (Marketplace integrations link to PAN DEV for more information):
- Twilio: Send SMS notifications. This sub-capability is available with any active Cortex XSIAM or Cortex AgentiX license.
- Twilio SendGrid: Twilio SendGrid is a cloud-based email delivery platform that provides email activity tracking and analytics. This sub-capability is available with any active Cortex XSIAM license.
To configure this connector, follow the steps outlined in the configuration wizard.
Uptycs
Uptycs
Important
This connector is only available for tenants that onboarded after July 26, 2026. For tenants that onboarded before this date, use Marketplace to access the standalone integration. For more information, see Marketplace.
This connector is available with any active Cortex XSIAM license.
Uptycs is a cloud-native security analytics platform that provides unified visibility across endpoints, cloud workloads, and containers. Use this connector to collect events and security alerts from the Uptycs platform for centralized monitoring and case response.
This connector includes the following sub-capabilities (Marketplace integrations link to PAN DEV for more information):
- UptycsEventCollector: Uptycs is a cloud-native security analytics platform that provides visibility, threat detection, and compliance across endpoints and cloud workloads.
To configure this connector, follow the steps outlined in the configuration wizard.
Vectra
Here are the articles in this section:
Vectra
Important
This connector is only available for tenants that onboarded after July 26, 2026. For tenants that onboarded before this date, use Marketplace to access the standalone integration. For more information, see Marketplace.
This connector is available with any active Cortex XSIAM license.
Vectra is the leading AI-driven threat detection and response platform for the enterprise. It detects advanced attacker behaviors across hybrid and multi-cloud environments, giving security teams high-fidelity signal and rich context to prioritize, investigate, and respond to threats in real time. Learn more at Vectra Website.
This connector includes the following sub-capabilities (Marketplace integrations link to PAN DEV for more information):
- VectraAIEventCollector: Collects Vectra Detections and Audits into XSIAM Events.
To configure this connector, follow the steps outlined in the configuration wizard.
Versa Networks
Versa Networks
Important
This connector is only available for tenants that onboarded after July 26, 2026. For tenants that onboarded before this date, use Marketplace to access the standalone integration. For more information, see Marketplace.
This connector is available with any active Cortex XSIAM or Cortex AgentiX license.
Versa Director is a virtualization and service creation platform that simplifies the design, automation, and delivery of SASE services. It provides the management, monitoring, and orchestration capabilities needed to deliver the networking and security capabilities within Versa SASE.
This connector includes the following sub-capabilities (Marketplace integrations link to PAN DEV for more information):
- VersaDirector: Versa Director is a virtualization and service creation platform that simplifies the design, automation, and delivery of SASE services. Versa Director provides the essential management, monitoring, and orchestration capabilities needed to deliver all of the networking and security capabilities within Versa SASE.
To configure this connector, follow the steps outlined in the configuration wizard.
VMware
VMware Automation and Collection
Important
This connector is only available for tenants that onboarded after July 26, 2026. For tenants that onboarded before this date, use Marketplace to access the standalone integration. For more information, see Marketplace.
This sub-capability is available with any active Cortex XSIAM or Cortex AgentiX license.
Manage VMware products: administer virtual machines and ESXi hosts through vCenter, hunt and respond to endpoint threats with Carbon Black EDR, and search and manage enrolled devices with Workspace ONE UEM (AirWatch MDM).
This connector includes the following sub-capabilities (Marketplace integrations link to PAN DEV for more information):
- VMware: VMware vCenter server is a centralized management application that lets you manage virtual machines and ESXi hosts centrally.
- VMware Carbon Black EDR v2:
- VMware Workspace ONE UEM (AirWatch MDM):
To configure this connector, follow the steps outlined in the configuration wizard.
VMWare
The capabilities and sub-capabilities listed for this connector are available with any active Cortex XSIAM or Cortex Cloud Posture Security license.
This connector includes the following capabilities and sub-capabilities (if applicable):
- Security Posture: Detect, monitor and alert on settings of your SaaS application.
- saas-posture-config-remediation: Help remediate the misconfigured security settings of your SaaS application.
To configure this connector, follow the steps outlined in the configuration wizard.
VulnDB
VulnDB
Important
This connector is only available for tenants that onboarded after July 26, 2026. For tenants that onboarded before this date, use Marketplace to access the standalone integration. For more information, see Marketplace.
This connector is available with any active Cortex XSIAM or Cortex AgentiX license.
Use the VulnDB integration to get information about security vulnerabilities for various products, including operating systems and applications.
This connector includes the following sub-capabilities (Marketplace integrations link to PAN DEV for more information):
- VulnDB: Lists all of the security vulnerabilities for various products (OS,Applications) etc).
To configure this connector, follow the steps outlined in the configuration wizard.
WhatsMyBrowser.org
WhatsMyBrowser.org
Important
This connector is only available for tenants that onboarded after July 26, 2026. For tenants that onboarded before this date, use Marketplace to access the standalone integration. For more information, see Marketplace.
This connector is available with any active Cortex XSIAM or Cortex AgentiX license.
The User Agent Parse API from WhatIsMyBrowser lets you send a User Agent String and receive a detailed response describing as much as possible about the string. WhatIsMyBrowser parses user agent strings and gives insight into known user agents, including whether a user agent string is known to be malicious.
This connector includes the following sub-capabilities (Marketplace integrations link to PAN DEV for more information):
To configure this connector, follow the steps outlined in the configuration wizard.
Whois
Whois
Important
This connector is only available for tenants that onboarded after July 26, 2026. For tenants that onboarded before this date, use Marketplace to access the standalone integration. For more information, see Marketplace.
This connector is available with any active Cortex XSIAM or Cortex AgentiX license.
Whois is an open source tool and protocol for querying details about a domain, including the registrant that owns the domain name, the registrar who registered it, the creation date, and other domain metadata. Use the Whois integration to get enriched data for domains and IPs.
This connector includes the following sub-capabilities (Marketplace integrations link to PAN DEV for more information):
- Whois: Provides data enrichment for domains.
To configure this connector, follow the steps outlined in the configuration wizard.
WithSecure
WithSecure
Important
This connector is only available for tenants that onboarded after July 26, 2026. For tenants that onboarded before this date, use Marketplace to access the standalone integration. For more information, see Marketplace.
This connector is available with any active Cortex XSIAM license.
WithSecure Endpoint Protection is a cloud-based platform that provides effective endpoint protection against ransomware and advanced attacks.
This connector includes the following sub-capabilities (Marketplace integrations link to PAN DEV for more information):
- WithSecureEventCollector: WithSecure event collector integration for Cortex XSIAM.
To configure this connector, follow the steps outlined in the configuration wizard.
Workday
You can configure collecting Workday report data using a standard collector, content pack integration (onboarded prior to July 26, 2026), or connector:
| Collection Method | Description |
|---|---|
| Standard collector overview | Forward Workday report data to Cortex XSIAM using the Workday data source. |
| Link to standard collector instructions | Ingest report data from Workday |
| Links to content pack/integration details (onboarded prior to July 26, 2026) | <p>The Workday content pack provides solutions for financial management, human resources, and planning, specifically supporting the collection and modeling of user activity audit logs and sign-on events. It contains classifiers, modeling rules, and parsing rules, as well as the following integrations:</p><ul><li>Workday Event Collector: Use this integration containing the workday-get-activity-logging command to get activity logs from Workday. It requires the Workday Parsing Rule and Workday Modeling Rule for parsing and modeling ingested data.</li><li>Workday: Use this integration containing the workday-list-workers command to return information for specific workers.</li><li>Workday IAM: Use this integration containing the workday-iam-get-full-report command to return report entries from Workday. It is part of the part of the IAM premium pack.</li><li>Workday Sign On Event Collector: Use this integration containing the workday-get-sign-on-events command to get sign-on logs from Workday. This command is used for developing/debugging and is to be used with caution, as it can create events, leading to events duplication and exceeding the API request limitation.</li></ul> |
| Link to connector | <ul><li>Workday Automation and Collection (onboarded after July 26, 2026)</li><li>Workday</li></ul> |
Ingest report data from Workday
To receive Workday report data, you must first configure data collection from Workday using a Workday custom report to ingest the appropriate data. This is configured by setting up a Workday Collector in Cortex XSIAM and configuring report data collection via this Workday custom report that you set up.
As soon as Cortex XSIAM begins receiving data, the app automatically creates a Workday Cortex Query Language (XQL) dataset (workday_workday_raw). You can then use XQL Search queries to view the data and create new Correlation Rules. In addition, Cortex XSIAM adds the Workday fields next to each user in the Key Assets list on the Cases page, and in the User node in the Causality View of Identity Analytics issues.
Note
Any user with permissions to view issues and cases can view the Workday data.
You can only configure a single Workday Collector, which is automatically configured to run the report every 6 hours. You can always use the Sync Now option to run the report whenever you want.
Prerequisite
- Create an Integration System User that is designated to access the custom report from Workday for data collection in Cortex XSIAM.
- Create an Integration System Security Group for the Integration System User created in Step 1 for accessing the report. When setting this group ensure to define the following:
- Type of Tenanted Security Group: Select either Integration System Security Group (Constrained) or Integration System Security Group (Unconstrained) depending on how your data is configured. For more information, see the Workday documentation.
- Integration System User: Select the user that you defined in step 1 for accessing the custom report.
- Create the Workday credentials for the Integration System User created in Step 1 so that the username and password can be used to access the report in Cortex XSIAM. Record these credentials as you will need them when configuring the Workday Collector in Cortex XSIAM.
Note
For more information on completing any of the prerequisite steps, see the Workday documentation.
Configure Cortex XSIAM to receive report data from Workday:
- Configure a Workday custom report to use for data collection.
- Log in to the Workday Resource Center.
- In the search field, specify Create Custom Report to open the wizard.
- Configure the following Create Custom Report settings:
- Report Name: Specify the name of the report.
- Report Details section:
- Report Type: Select Advanced. When you select this option, the Enable As Web Service checkbox is displayed.
- Enable As Web Service: Select this checkbox, so that you will be able to generate a URL of the report to configure in Cortex XSIAM.
- Data Source section:
- Optimized for Performance: Select whether the data should be optimized for performance. The way this checkbox is configured determines the Data Source options available to choose from.
- Date Source: Select the applicable data source containing the data that is used to configure data collection from Workday to Cortex XSIAM.
-
Click OK, and configure the following Additional Info settings. The Additional Info table in the Columns tab is where you can perform the following.
- For the incident and card views in Cortex XSIAM, map the required fields from the Data Source configured by selecting the applicable Field that you want to map to the Cortex XSIAM field name required for data collection in the Column Heading Override XML Alias column.
- (Optional) You can map any additional fields from the Data Source configured that you want to be able to query in XQL Search using the
workday_workday_rawdataset. This is configured by selecting the applicable Field and leaving the default field name that is displayed in the Column Heading Override XML Alias column. This default field name is what is used in XQL Search and the dataset to view and query the data.
Note
The Business Object changes depending on the Data Source selected.
For the incident and card views in Cortex XSIAM, map the following fields in the table by selecting the applicable Field that contains the data representing the Cortex XSIAM field name as provided below that should be added to the Column Heading Override XML Alias. For example, for
full_name, select the applicable Field from the Business Object defined that contains the full name of the user and in the Column Heading Override XML Alias specifyfull_nameto map the set Field to the Cortex XSIAM field name.Note
Cortex XSIAM uses a structured schema when integrating Workday data. To get the best Analytics results, specify all the fields marked with an asterisk from the recommended schema.
workday_user_id*full_name*workday_manager_user_id*manager*worker_type*position_title*department*private_email_address*business_email_address*employment_start_date*employment_end_datephone_numbermailing_address
e. (Optional) Filter out any employees that you do not want included in the Filter tab.
f. Share access to the report with the designated Integration System User that you created by setting the following settings in the Share tab:
- Report Definition Sharing Options: Select Share with specific authorized groups and users.
- Authorized Users: Select the designated Integration System User that you created for accessing the custom report.
g. Ensure that the following Web Services Options settings in the Advanced tab are configured. Here is an example of the configured settings, where the Web Service API Version and Namespace are automatically populated and dependent on your report.\
h. (Optional) Test the report to ensure all the fields are populated.\
\
i. Get the URL for the report.- In the related actions menu, select Actions → Web Service → View URLs.
- Click OK.
- Scroll down to the JSON section.
- Hover over the JSON link and click the icon, which open a new tab in your browser with the URL for the report. You need to use the designated user credentials to open the report.
- Copy the URL for the report and record them somewhere as this URL needs to be provided when setting up the Workday Collector in Cortex XSIAM.
j. Complete the report by clicking Done.
-
Configure the Workday collection in Cortex XSIAM.
a. Navigate to Settings → Data Sources & Integrations.
b. On the Data Sources & Integrations page, click + Add New, search for Workday, then hover over it and click Add.
c. Set the following parameters.
- Name: Specify the name for the Workday Collector that is displayed in Cortex XSIAM.
- URL: Specify the URL of the custom report you configured in Workday.
- User Name: Specify the username for the designated Integration System User that you created for accessing the custom report in Workday.
- Password: Specify the password for the designated Integration System User that you created for accessing the custom report in Workday.
d. Click Test to validate access, and then click Enable.
A notification appears confirming that the Workday Collector was saved successfully, and closes on its own after a few seconds.
Once report data starts to come in, a green check mark appears underneath the Workday Collector configuration with the data and time that the data was last synced.
-
(Optional) Manage your Workday Collector.
After you enable the Workday Collector, you can make additional changes as needed. To modify a configuration, select any of the following options.
- Edit the Workday Collector settings.
- Disable the Workday Collector.
- Delete the Workday Collector.
- Sync Now to run the report to get the latest report data. The report is run automatically every 6 hours, but you can always get the latest data as needed.
- After Cortex XSIAM begins receiving report data from Workday, you can use the XQL Search to search for logs in the new dataset (
workday_workday_raw).
Workday Automation and Collection
Important
This connector is only available for tenants that onboarded after July 26, 2026. For tenants that onboarded before this date, use Marketplace to access the standalone integration. For more information, see Marketplace.
Workday offers enterprise-level software solutions for financial management, human resources, and planning. Automate actions in Workday, fetch Workday reports to create corresponding issues as part of identity lifecycle management, and collect user activity and sign-on events from Workday.
This connector includes the following sub-capabilities (Marketplace integrations link to PAN DEV for more information):
- Workday: Workday offers enterprise-level software solutions for financial management, human resources, and planning. This sub-capability is available with any active Cortex XSIAM, Cortex Cloud Posture Security, or Cortex AgentiX license.
- Workday Event Collector: Use Workday Event Collector integration to get activity loggings from Workday. This sub-capability is available with any active Cortex XSIAM license.
- Workday IAM: Use the Workday IAM Integration as part of the IAM premium pack. This sub-capability is available with any active Cortex XSIAM, Cortex Cloud Posture Security, or Cortex AgentiX license.
- Workday Sign On Event Collector: Use the Workday Sign On Event Collector integration to get sign on logs from Workday. This sub-capability is available with any active Cortex XSIAM license.
- Workday_IAM_Event_Generator: This sub-capability is available with any active Cortex XSIAM, Cortex Cloud Posture Security, or Cortex AgentiX license.
- WorkdaySignonEventGenerator: Generates mock sign on events for Workday Signon Event Collector. Use these for testing and development. This sub-capability is available with any active Cortex XSIAM, Cortex Cloud Posture Security, or Cortex AgentiX license.
To configure this connector, follow the steps outlined in the configuration wizard.
Workday
The capabilities and sub-capabilities listed for this connector are available with any active Cortex XSIAM or Cortex Cloud Posture Security license.
This connector includes the following capabilities and sub-capabilities (if applicable):
- Security Posture: Detect, monitor and alert on settings of your SaaS application.
saas-posture-config-remediation: Help remediate the misconfigured security settings of your SaaS application.
To configure this connector, follow the steps outlined in the configuration wizard.
X
X Automation and Remediation
Important
This connector is only available for tenants that onboarded after July 26, 2026. For tenants that onboarded before this date, use Marketplace to access the standalone integration. For more information, see Marketplace.
This connector is available with any active Cortex XSIAM or Cortex AgentiX license.
The Twitter (X) integration enables cybersecurity researchers and SOC teams to harness Twitter to enhance their security operations, providing access to searching recent Tweets (within the last 7 days) and user information using the Twitter v2 API. Teams can automate searching to detect potential threats, gather intelligence on cyber attacks, monitor brand reputation, track threat actors, and detect fraudulent accounts impersonating their company.
This connector includes the following sub-capabilities (Marketplace integrations link to PAN DEV for more information):
- Twitter v2: Twitter integration provides access to searching recent Tweets (in last 7 days) and user information using the Twitter v2 API.
To configure this connector, follow the steps outlined in the configuration wizard.
YouTrack
Here are the articles in this section:
YouTrack
The capabilities and sub-capabilities listed for this connector are available with any active Cortex XSIAM or Cortex Cloud Posture Security license.
This connector includes the following capabilities and sub-capabilities (if applicable):
- Security Posture: Detect, monitor and alert on settings of your SAAS application.
- saas-posture-config-remediation: Help remediate the misconfigured security settings of your SAAS application.
To configure this connector, follow the steps outlined in the configuration wizard.
Zendesk
Here are the articles in this section:
Zendesk
Important
This connector is only available for tenants that onboarded after July 26, 2026. For tenants that onboarded before this date, use Marketplace to access the standalone integration. For more information, see Marketplace.
This connector is available with any active Cortex XSIAM, Cortex Cloud, Cortex Cloud Runtime Security, Cortex XDR, or Cortex AgentiX license.
Integrate with Zendesk to perform operations related to users, tickets, attachments, and more. Search and query users or tickets, create and update tickets, retrieve ticket details including comments and attachments, add comments, and manage Zendesk users to streamline customer support and issue management workflows.
This connector includes the following sub-capabilities (Marketplace integrations link to PAN DEV for more information):
- Zendesk v2: IT service management.
To configure this connector, follow the steps outlined in the configuration wizard.
Zero Networks
Here are the articles in this section:
Zero Networks
Important
This connector is only available for tenants that onboarded after July 26, 2026. For tenants that onboarded before this date, use Marketplace to access the standalone integration. For more information, see Marketplace.
This connector is available with any active Cortex XSIAM license.
Zero Networks Segment is a security platform that automatically enforces zero trust policies across an organization's network. It dynamically segments and controls access to network resources, ensuring that only authorized users and devices can communicate, thereby reducing the attack surface and mitigating potential threats.
This connector includes the following sub-capabilities (Marketplace integrations link to PAN DEV for more information):
- ZeroNetworksSegmentEventCollector: Integrates with Zero Networks Segment API to fetch and process audit and network events.
To configure this connector, follow the steps outlined in the configuration wizard.
Zimperium
Here are the articles in this section:
Zimperium
Important
This connector is only available for tenants that onboarded after July 26, 2026. For tenants that onboarded before this date, use Marketplace to access the standalone integration. For more information, see Marketplace.
This connector is available with any active Cortex XSIAM or Cortex AgentiX license.
Zimperium is a mobile security platform that generates alerts based on anomalous or unauthorized activities detected on a user's mobile device. Fetch and investigate mobile security alerts, and query for events, devices, and users.
This connector includes the following sub-capabilities (Marketplace integrations link to PAN DEV for more information):
- Zimperium: Fetch and investigate mobile security alerts, generated based on anomalous or unauthorized activities detected on a user's mobile device.
- Zimperium v2: Fetch and investigate mobile security alerts, generated based on anomalous or unauthorized activities detected on a user's mobile device. Compatible with Zimperium 5.X API version.
To configure this connector, follow the steps outlined in the configuration wizard.
Zoom
Here are the articles in this section:
Zoom
Important
This connector is only available for tenants that onboarded after July 26, 2026. For tenants that onboarded before this date, use Marketplace to access the standalone integration. For more information, see Marketplace.
Zoom lets users create and join virtual meeting rooms to communicate over video and audio, share screens and files, and chat. This connector manages Zoom users and meetings, provisions users via IAM, collects operation logs and activity reports, interacts with the Zoom Mail API, and fetches Zoom endpoint IP ranges as an indicator feed.
This connector includes the following sub-capabilities (Marketplace integrations link to PAN DEV for more information):
- Zoom: Use the Zoom integration to manage your Zoom users and meetings. This sub-capability is available with any active Cortex XSIAM, Cortex XDR, or Cortex AgentiX license.
- Zoom Feed: This sub-capability is available with any active Cortex XSIAM or Cortex AgentiX license.
- Zoom Mail: Enables interaction with the Zoom Mail API. This sub-capability is available with any active Cortex XSIAM or Cortex AgentiX license.
- Zoom_IAM: An Identity and Access Management integration template. This sub-capability is available with any active Cortex XSIAM or Cortex AgentiX license.
- ZoomEventCollector: This is the Zoom event collector integration for Cortex XSIAM. This sub-capability is available with any active Cortex XSIAM license.
To configure this connector, follow the steps outlined in the configuration wizard.
Zscaler
Here are the articles in this section:
Zscaler Internet Access
You can configure collecting Zscaler Internet Access logs using a Broker VM Syslog Collector applet, content pack integration (onboarded prior to July 26, 2026), or connector (onboarded after July 26, 2026):
| Collection Method | Description |
|---|---|
| Syslog Collector applet overview | Forward firewall and network logs to Cortex XSIAM from Zscaler Internet Access using the Broker VM Syslog Collector applet in a CEF format. |
| Link to Syslog Collector applet instructions | Ingest logs from Zscaler Internet Access |
| Links to content pack/integration details (onboarded prior to July 26, 2026) | <p>The Zscaler Internet Access content pack provides Cloud security features, including managing URL and IP address policies, managing categories, sandbox reporting, and ingestion and normalization of Zscaler Internet Access (ZIA) logs into Cortex XSIAM via both VM-based NSS Feed and Cloud NSS Feed methods. It contains the Zscaler Internet Access Modeling Rule, the Zscaler ZIA Parsing Rule, and the Block Domain - Zscaler playbook. It also includes the following integration:</p><ul><li>Zscaler Internet Access: Use this integration to manage URL and IP address allow lists and block lists, manage and update categories, retrieve Sandbox reports, and manage IP destination groups within a Zscaler session. It includes commands for blacklisting and unblacklisting URLs and IPs, managing categories (adding/removing URLs and IPs), retrieving categories, listing, creating, editing, and deleting IP destination groups, manually logging in and logging out, and activating configuration changes in Zscaler.</li></ul> |
| Link to connector (onboarded after July 26, 2026) | Zscaler |
Zscaler Private Access
You can configure collecting Zscaler Private Access logs using a Broker VM Syslog Collector applet or with a content pack integration (onboarded after July 26, 2026):
| Collection Method | Description |
|---|---|
| Syslog Collector applet overview | If you use Zscaler Private Access (ZPA) in your network as an alternative to VPNs, you can forward your network logs to Cortex XSIAM from Zscaler Private Access using the Broker VM Syslog Collector applet in a LEEF format. |
| Link to Syslog Collector applet instructions | Ingest logs from Zscaler Private Access |
| Link to content pack/integration instructions (onboarded after July 26, 2026) | The ZscalerZPA content pack provides data modeling capabilities for event logs ingested from the Zscaler Private Access (ZPA) service, which enables secure access to internal applications and services. It includes the Zscaler Private Access Modeling Rule. Event collection relies on configuring the generic Syslog Collector on the Broker VM. |
Zscaler
Important
This connector is only available for tenants that onboarded after July 26, 2026. For tenants that onboarded before this date, use Marketplace to access the standalone integration. For more information, see Marketplace.
Zscaler is a cloud security solution built for performance and flexible scalability. This connector manages URL and IP address allow lists and block lists, categories, IP destination groups, and Sandbox reports, and it can also collect Zscaler Internet Access (ZIA) logs. It includes Red Canary, which collects and standardizes endpoint data to help teams detect, analyze, and respond to security issues.
This connector includes the following sub-capabilities (Marketplace integrations link to PAN DEV for more information):
- RedCanary: Red Canary collects endpoint data using Carbon Black Response and CrowdStrike Falcon. The collected data is standardized into a common schema which allows teams to detect, analyze and respond to security incidents. This sub-capability is available with any active Cortex XSIAM or Cortex AgentiX license.
- Zscaler: Zscaler is a cloud security solution built for performance and flexible scalability. This integration enables you to manage URL and IP address allow lists and block lists, manage and update categories, get Sandbox reports, create, manage, and update IP destination groups and manually log in, log out, and activate changes in a Zscaler session. This sub-capability is available with any active Cortex XSIAM or Cortex AgentiX license.
- ZscalerZIdentity: Zscaler Internet Access via ZIdentity OAuth 2.0. Provides URL/IP/domain classification, denylist and allowlist management, URL category management, sandbox reporting, user and group management, and IP destination group management using OAuth 2.0 client credentials authentication through ZIdentity. This sub-capability is available with any active Cortex XSIAM, Cortex Cloud, Cortex Cloud Runtime Security, Cortex XDR, or Cortex AgentiX license.
To configure this connector, follow the steps outlined in the configuration wizard.
Connectors
Connectors represent the new, strategic approach for integrating third-party services and data sources into Cortex XSIAM. A connector consolidates all of a vendor's security capabilities, such as log collection, automation and remediation, and posture management, into a single, uniquely named entry with a guided configuration wizard.
Benefits of the unified connector experience
This unified approach provides several key benefits:
- Security-capability-driven setup: If a connector wizard is available for your tenant, you can disregard the manual configuration steps on the Cortex Developer Docs for Marketplace (PAN DEV) site. Yet, you should still refer to PAN DEV for specific information related to the integration (now referred to as a sub-capability in the new connector world), such as:
- Fetched incidents data
- Commands
- Other specific technical details related to the integration
- Selective capability onboarding: For vendors with multiple services (such as Microsoft 365 or Google Workspace), you can choose to enable the full suite at once or select individual sub-capabilities (integrations) as needed. Additional capabilities can be enabled later without disrupting your existing configuration.
- Wizard-driven setup: The configuration wizard dynamically adjusts its steps based on the specific capabilities you choose to enable for that vendor.
- Centralized vault credentials: Authenticate your connectors directly with stored vault credentials instead of manually entering credentials, extending standard platform security across all capabilities.\
You can configure and save vault credentials under Settings → Configurations → Integrations → Credentials.
The connector configuration experience
The configuration workflow depends on your onboarding date and the specific connector you are enabling. The transition to the unified experience is designed to support both existing and new customers within a single guide. Each connector topic specifies the license supported and whether it is available to all customers or only to those who received Cortex XSIAM starting July 26, 2026.
- New customers (onboarded after July 26, 2026): You will see the updated connector experience across the entire catalog.
- Existing customers (onboarded before July 26, 2026): You have immediate access to a subset of the unified catalog. For other Marketplace integrations, you will continue to use the legacy implementation until those specific connectors are enabled for your tenant.
Connector wizard
When using a unified connector, you follow a guided wizard within Cortex XSIAM.
- Security-capability-driven setup: If a connector wizard is available for your tenant, you can disregard the manual configuration steps on the Palo Alto Networks Developer (PAN DEV) site.
- PAN DEV technical reference: While the wizard handles the setup process, you should still refer to the Cortex Developer Docs for Marketplace (PAN DEV) for specific technical information related to the service (sub-capability), such as:
- Fetched Incidents Data
- Available Commands
- Other integration-specific data schemas and required fields not provided in the wizard.
Legacy Marketplace implementation
For integrations that are not yet available as a unified connector for your tenant, you will continue to use the legacy implementation. Additionally, partner-managed and community-contributed integrations remain outside the unified connector framework and must be managed as standalone integrations via Marketplace. These do not feature a configuration wizard and require following the setup instructions on the Cortex Developer Docs for Marketplace (PAN DEV) site for all configuration steps. For more information, see Marketplace.
Connectivity and capabilities
Unified connectors group vendor functionality into specific security capabilities. Depending on the connector selected, the wizard will present options based on the following possible capabilities:
- Automation and Remediation: Run automated actions and remediation commands against the connected service.
- Fetch Issues: Fetch issues and incidents from the connected service for investigation and response.
- Log Collection: Collect and ingest logs and events from the connected service.
- Threat Intelligence and Enrichment: Ingest threat intelligence and enrich indicators using data from the connected service.
- Fetch Assets and Vulnerabilities: Fetch assets and vulnerabilities from the connected service into the Unified Asset Inventory.
- Fetch Secrets: Retrieve secrets and credentials from the connected service.
- Security Posture: Detect, monitor, and alert on the security settings and configurations of your SaaS applications.
- Data Security: Scan and protect sensitive data, including files, attachments, and records within the service.
- Identity Posture: Maintain visibility and control over SaaS-based identities, including users, groups, roles, and granular permissions.
- Agent Security Scanning: Monitor and assess the security posture and activity of agents within the service environment.
For connectors that support multiple services or complex configurations, these capabilities may be further divided into sub-capabilities. For example, a single connector might allow you to independently enable "Users" and "Groups" under the Identity Posture capability.
Access to specific connectors and their individual sub-capabilities is determined by your tenant license and onboarding date.
Connectors are configured by navigating to Settings → Data Sources & Integrations → + Add New.
Marketplace integrations not supported via connectors
The following Marketplace integrations remain outside the unified connector framework and must be managed as standalone integrations via the Marketplace. For these integrations, use the existing Marketplace configuration and documentation:
| Integration Name | Category |
|---|---|
| AWS-SNS-Listener | Infrastructure |
| Core REST API | System / API |
| Cortex Core - IOC | System |
| Cortex Core - IR | System |
| Generic Export Indicators Service | Networking |
| Generic Webhook | Utility |
| Image OCR | Utility |
| Microsoft Teams | Collaboration |
| Palo Alto Networks WildFire Reports | Security |
| Rasterize | Utility |
| TAXII Feed | Threat Intel |
| TAXII2 Server | Threat Intel |
| XQL Query Engine | Analytics |
| Zoom | Collaboration |
Standard data sources
Standard data sources are built-in ingestion mechanisms in Cortex XSIAM primarily focused on ingesting raw logs and security events. While Cortex XSIAM is introducing a unified Connector approach, many third-party services and file-based ingestions continue to use standard data sources for core security analysis and normalization.
These data sources (also called data collectors) typically utilize direct API connections or file collection tools to bring telemetry into the platform.
Configuration experience
Standard data sources are configured using the Data Source Onboarder. Unlike the multi-capability connector wizard, the onboarder is focused on a specific stream of data, such as Okta logs or Amazon S3 files.
Key Features
- Direct ingestion: Connect directly to vendor APIs to fetch logs.
- Parsing and normalization: Automatically maps incoming raw data to the Cortex Data Model (XDM).
- Streamlined Setup: Focused exclusively on data collection without additional components like automation or posture management.
When to use standard data sources
In the current Vendor Catalog, you may see a choice between a connector and a standard data source for the same vendor.
- Existing tenants: If a unified connector is not yet available for a specific integration in your account, use the standard data source.
- New tenants: Always prioritize using the uniquely named connector for a vendor. Standard data sources should only be used if a connector does not yet exist for that specific vendor or if you only require a specific raw log stream not currently bundled in a connector.
Configuration
Standard data sources are configured by navigating to Settings → Data Sources & Integrations → + Add New.
Select your desired vendor and look for the entry labeled as a data source or collector. The UI will launch the Data Source Onboarder to guide you through the setup steps.
Cloud service provider (CSP) onboarding
Onboard your cloud service provider (CSP) from the Data Source page. Cortex XSIAM provides a unified, normalized asset inventory for cloud assets. This capability provides deeper visibility into all your assets and superior context for incident investigation.
Cortex XSIAM currently supports onboarding the following cloud service providers (CSPs):
- Amazon Web Services (AWS)
- Microsoft Azure
- Google Cloud Platform (GCP)
- Oracle Cloud Infrastructure (OCI)
- Alibaba Cloud
The onboarding process has two main phases: configuring your template in Cortex XSIAM and deploying it in your CSP environment. This topic describes the high-level process of these two phases and the considerations you should have in mind before you start onboarding.
Phase 1: Cortex CSP onboarding wizard
In this phase, you use the Cortex XSIAM onboarding wizard to define the scope of your CSP environment and choose which security features you want to enable. Based on your selections, Cortex XSIAM generates a ready-to-deploy configuration template in a format compatible with your CSP.
Step 1: Select the cloud partition
Choose the cloud partition that matches your environment. This option is available only in supported environments. Support varies by provider:
- AWS: Choose Commercial (standard regions) or Government (GovCloud).
- Azure: Choose Commercial (standard regions) or Government.
- Alibaba Cloud, GCP, OCI: Currently only standard regions are supported.
Step 2: Define the scope
Select the monitoring scope for your organization. Leverage your CSP hierarchy to onboard accounts individually or manage them collectively through a single administrative root (e.g., an OU, Folder, or Management Group). The available scope options vary by CSP:
| Scope level | AWS | GCP | Azure | Alibaba Cloud | OCI |
|---|---|---|---|---|---|
| Entire organization | Organization | Organization | Tenant and Entra ID-only | — | Tenancy |
| Group of accounts | Organizational unit (OU) | Folder | Management Group | — | — |
| Single account | Account | Project | Subscription | Account | — |
Alibaba Cloud: Currently only single account onboarding is supported. You must create a separate cloud instance for each Alibaba Cloud account.
OCI: Currently only tenancy-level (organization) onboarding is supported. Single compartment or compartment group onboarding is not supported.
Note: You cannot expand the scope of a cloud instance after deployment. For example, if you deploy at the single account scope, you must create a new cloud instance to use the organization scope. We recommend that you start with the broadest anticipated scope and use account exclusions to narrow it.
Step 3: Select the scan mode
Cortex XSIAM supports two scan modes:
- Cloud scan (recommended): The scanning takes place within the Cortex XSIAM environment. No additional setup is needed.
- Outpost scan: The scanning is performed on infrastructure deployed to a CSP account owned by you. The CSP account should be a dedicated account for the outpost, free from other resources. Each CSP account can host only one outpost. This mode requires additional cloud provider permissions and may incur additional cloud costs.
Alibaba Cloud and OCI: Outpost scanning is not supported. Use cloud scan mode for these CSPs.
Step 4: Select the deployment method
Before you begin onboarding your CSP environment, decide whether to provision resources automatically using Infrastructure as Code (IaC) or manually.
IaC automatically provisions all required cloud resources and permissions using an IaC template. If you want full control over the onboarding process including role and resource creation, select the manual deployment method. Refer to the manual onboarding documentation for your specific CSP.
Note: Manual onboarding is available for AWS, Azure, and GCP.
Step 5: Apply region or account filters (optional)
If you do not want to cover your entire environment, you can limit the scope by including or excluding specific regions, accounts, or organization units/folders/management groups. Exclusions apply to asset discovery and to all Cortex XSIAM scanning capabilities that operate on discovered assets. Excluded accounts are not scanned and do not appear in the asset inventory, scan results, or alerts. Excluded accounts remain visible on the Cloud Instances page, marked as excluded, so you can review or re-include them at any time.
Organizational unit, folder, and management group filters let you include or exclude entire branches of your cloud hierarchy in a single step. These filters are recursive, so selecting or excluding an organizational unit, folder, or management group applies to all accounts beneath it. For example, excluding one organizational unit that contains 170 accounts excludes all 170 accounts with a single selection.
You can apply both an organizational unit/folder/management group filter and an account filter at the same time, but both must use the same mode. They must either both include or both exclude,. as mixing modes is not supported. When both filters are active:
- Both set to include: Cortex XSIAM monitors all accounts under the included organizational units, folders, or management groups, plus any individually included accounts.
- Both set to exlude: Cortex XSIAM excludes any account that is either under an excluded organizational unit, folder, or management group, or in the excluded accounts list.
Excluding an account, organizational unit, folder, management group, or region does not remove any onboarding resources that were already deployed, and does not prevent data sources that operate at the parent scope (such as audit log collection) from continuing to collect data. The exact behavior of exclusions varies by cloud service provider. The behavior of exclusions during multi-account deployments varies by CSP:
- AWS: The CloudFormation StackSet deploys IAM roles to all accounts within the selected organization or organizational unit scope, even if you exclude specific accounts or organizational units from scanning. Exclusions only prevent Cortex XSIAM from scanning or discovering the account; exclusions do not prevent role deployment. Additionally, audit log collection applies to all accounts in scope; exclusions do not apply to log collection.
- Azure: When deploying at the tenant or management group scope, Azure Policy definitions are applied across all subscriptions in scope. Excluded subscriptions and management groups are not scanned or discovered by Cortex XSIAM, but the policy definition may still be present.
- GCP: When deploying at the organization or folder scope, the Terraform template provisions resources across all projects in scope. Excluded projects and folders are not scanned or discovered by Cortex XSIAM.
- OCI: Tenancy-level deployment applies to all compartments. Compartment-level exclusions prevent scanning but the identity policy is applied at the tenancy level. Organizational unit filtering is not supported for OCI.
- Alibaba Cloud: Not applicable (single account scope only).
Step 6: Enable security capabilities
Select which security capabilities Cortex XSIAM should activate for your connected accounts. Your selections determine the contents of the authentication template generated at the end of this wizard.
Every template includes the following:
- Base deployment: The CSP-specific resources that enable Cortex XSIAM to connect to your environment, discover the accounts in scope, and register them, along with the deployment logic that reports status back to Cortex XSIAM.
- Asset discovery and cloud security posture management (CSPM): The resources and permissions required to inventory your cloud resources and evaluate their configuration against security best practices and compliance benchmarks. Asset discovery and CSPM are always enabled.
All other security capabilities are optional. For each additional capability you enable, the template adds only the resources and permissions that capability requires on top of the base deployment. Capabilities that aren't selected don't appear in the template, so the footprint stays minimal and aligned with least-privilege.
The list of available security capabilities depends on the CSP and changes over time as new capabilities are added. See the onboarding topic for your CSP for the current list of supported capabilities for your provider. You can revisit your selection later by re-running the wizard and redeploying.
Step 7: Add custom tags (optional)
You can apply key-value tags to all resources that the template creates in your CSP environment. This is useful for cost tracking, organizational labeling, or compliance purposes. By default, the managed_by: paloaltonetworks tag is added to all resources and cannot be edited or removed.
Step 8: Configure audit log collection (optional)
Audit logs record activity in your CSP environment. When audit log collection is enabled, Cortex XSIAM uses the log data for:
- Real-time threat detection: Alert on suspicious sign-ins, privilege changes, unusual API activity, and other identity- and activity-based threats.
- Faster asset discovery: Reflect changes to your cloud resources (new, modified, or deleted) in your inventory in near-real-time, rather than waiting for the next periodic scan.
- Investigation context: Maintain a continuous activity timeline that supports forensics, compliance reporting, and incident response.
For CSPs that support custom log collection, you can choose how Cortex XSIAM collects audit logs:
- Custom (user defined): If you already have audit log infrastructure in place, you can configure Cortex XSIAM to use your existing setup.
- Automated: Cortex XSIAM sets up everything needed to collect audit logs on your behalf, including the log trail, storage, and notifications.
Alibaba Cloud and OCI: Audit log collection options may be limited compared to AWS, GCP, and Azure. Refer to the CSP-specific onboarding documentation for details.
Step 9: Template generation
Once you complete your selections, Cortex XSIAM generates a customized configuration template tailored to your choices. The template format depends on your CSP.
A pending cloud instance is created when you complete the onboarding wizard and click Save, but before the generated authentication template is deployed in your CSP. A single pending instance can produce multiple cloud instances that share the same onboarding configuration. Pending instances are automatically removed after 30 days. You can view them under Cloud Instances by clearing any default status filters.
Phase 2: Deploy the template in your CSP
After your authentication template is ready, deploy it in your CSP environment to provision the resources Cortex XSIAM needs to connect.:
What happens during deployment
The authentication template automatically provisions everything Cortex XSIAM needs to connect to your environment:
- Secure access role: Grants Cortex XSIAM read-only access to your cloud resources.
- Security permissions: Scoped to the security capabilities you selected during onboarding.
- Audit log infrastructure: The log collection pipeline, storage, and notification setup, which is provisioned only if you selected the Automated option.
- Secure notification channel: Reports deployment details back to Cortex XSIAM over HTTPS.
After deployment completes, Cortex XSIAM registers the account and the account appears as Connected in Cortex XSIAM.
Deployment methods, resource names, and supported options vary by CSP. Refer to the CSP-specific onboarding documentation for step-by-step instructions.
Connecting multiple accounts
When deploying to an entire organization or a group of accounts, the process follows these general steps:
- The template creates the secure access role and a notification mechanism in the management or root account.
- The notification mechanism executes and sends organization details to Cortex XSIAM.
- The template creates a deployment set in the management account to propagate roles to member accounts.
- The deployment set deploys the secure access role to each member account.
- Cortex XSIAM discovers member accounts as the role for each account becomes available.
- All accounts appear as Connected in Cortex XSIAM.
The multi-account deployment mechanism varies by CSP:
Phase 3: Post-deployment
After deployment completes, all included accounts display a status of Connected in Cortex XSIAM. A Connected status means Cortex XSIAM has established trust with your CSP and is starting work. A Connected status does not mean that every resource has been discovered yet.
What happens after deployment
After deployment completes, all included accounts display a status of Connected in Cortex XSIAM. Note that a Connected status means Cortex XSIAM has established trust with your CSP and is starting work. A Connected status does not mean that every resource has been discovered yet.
The following table describes the post-deployment activities:
| Activity | What it does | Typical timing |
|---|---|---|
| Connection health checks | Validates that the access role works and that Cortex XSIAM has the permissions it needs. | Starts after deployment. Timing depends on the number of accounts. |
| Account enumeration | For organization-scope onboarding, discovers all member accounts, subscriptions, or projects within the connected scope. | Scales with organization size. |
| Initial resource discovery | Inventories all cloud resources across the connected accounts. The first full discovery is the most time-consuming activity. | Scales with organization size. |
| Security scanning | The capabilities you enabled (CSPM, vulnerability scanning, DSPM, and others) begin evaluating resources as Cortex XSIAM discovers them. | Begins as resources are inventoried. Full coverage follows the discovery curve. |
| Audit log ingestion | If you enabled audit logs in step 8, log streaming starts and powers near-real-time updates and threat detection. | Shortly after deployment. |
Discovery and initial scanning
Discovery starts immediately when your account reaches Connected status and continues in the background. Cortex XSIAM works through your environment and begins posture evaluation as resources are inventoried.
Discovery time scales with the size of your environment. The more accounts, regions, and resources you have, the longer the initial pass takes.
What you see as discovery progresses
- Account status: Your account status remains Connected throughout, with health indicators showing that the connection is active.
- Resource count: The discovered resources count grows steadily as Cortex XSIAM works across your environment.
- Security findings: Findings begin appearing in real time as resources are inventoried. You don't need to wait for full discovery to complete before reviewing results.
- Threat detection: If audit log collection is enabled, near-real-time threat detection is active from the start.
If something needs your attention
- Connection health indicator: The connection health indicator flags any permission, network, or quota issues so you can resolve them quickly.
- Unexpected behavior: If your dashboard does not reflect expected progress, contact support for diagnostic assistance.
Authentication template and pending instance expiration
Templates and pending cloud instances have expiration windows. If you don't deploy within the expected time frame, you may need to regenerate the template or restart the onboarding process. Refer to the CSP-specific onboarding documentation for details on expiration timing and recovery steps.
Understand CSP onboarding tiers and licensing
The cloud service provider (CSP) onboarding wizard is designed to facilitate the seamless setup of CSP data into Cortex XSIAM. Depending on your specific Cortex XSIAM license, you will have access to either the comprehensive onboarding experience or foundational onboarding.
The scope of security capabilities available depends directly on your license:
| Onboarding tier | Supported licenses | Key capabilities |
|---|---|---|
| Comprehensive onboarding | Included with a Cortex XSIAM Premium license. It is also included with Cortex XSIAM NG SIEM and Cortex XSIAM Enterprise Cortex XSIAM license that has the Cloud Runtime Security or Cloud Posture Security add-ons. | Provides comprehensive security features including the asset discovery and cloud security posture management. It also supports cloud infrastructure entitlement management and agentless disk scanning. Additional features include AI security posture management and data security posture management. |
| Foundational onboarding | Included with Cortex XSIAM NG SIEM, Cortex XSIAM Enterprise, and Cortex XSIAM Enterprise+ licenses. | Allows Cortex XSIAM to discover cloud assets and collect audit logs. It also supports XSIAM analytics and automation. |
Get started with CSP onboarding
Select your CSP and your license tier to view the step-by-step onboarding instructions:
- Alibaba Cloud:
- Amazon Web Services (AWS):
- Microsoft Azure:
- Google Cloud Platform (GCP):
- Oracle Cloud Infrastructure (OCI)
Amazon Web Services cloud onboarding
Cortex XSIAM onboarding is the process of connecting your Amazon Web Services (AWS) cloud environment to Cortex XSIAM so it can continuously monitor, scan, and protect your cloud resources. This process establishes secure, least-privilege access for comprehensive security monitoring and threat detection. You gain visibility into your cloud infrastructure and can choose to enable security capabilities such as vulnerability scanning, data protection, and compliance monitoring.
The onboarding process provisions the infrastructure in your AWS environment required to monitor, secure, and analyze your cloud resources. The sections below describe the available capabilities, the resources created, the security model, and the step-by-step onboarding process.
AWS security capabilities and deployment planning
Plan your deployment by selecting the appropriate security capabilities. The onboarding process deploys all selected capabilities using a single CloudFormation template that adds specific functionality to your Cortex XSIAM integration.
Core capability (Discovery)
Discovery is a mandatory capability that is deployed automatically when you onboard an AWS account to Cortex XSIAM. Use this capability to discover and monitor AWS resources. When you onboard using a CloudFormation template, the template provisions the CortexPlatformRole AWS role along with a short-lived helper function that registers the deployment with Cortex XSIAM..
Logging capabilities
The Audit Logs capability collects AWS CloudTrail logs for security analysis and event-driven Asset Inventory. Across all collection modes, Cortex XSIAM provisions the cortex-logs-ingestion-access-* IAM role to grant Cortex XSIAM read access to the target Amazon S3 bucket. (For custom Control Tower deployments, this is the name specified in the CloudTrailReadRoleName parameter, which defaults to cortex-logs-ingestion-access-* and is editable.) Three collection modes are available depending on your AWS scope:
- Custom (BYOB) audit log collection: Designed for single-account setups or standard organizations where all resources reside in a single AWS account. Use your existing S3 bucket and CloudTrail trail. Cortex XSIAM provisions the notification pipeline (SQS queue and SNS topic) and connects to your bucket to ingest logs.
Does Custom (BYOB) require an organization CloudTrail trail?
No. Custom (BYOB) collection does not create or manage a CloudTrail trail because you bring your own. Cortex XSIAM has no requirement on the trail's scope: an organization trail, a multi-region trail, or multiple independent regional or per-account trails are all supported, provided that:
- Every trail you want ingested delivers its log files to the single S3 bucket you name in
CloudTrailLogsBucket. - That bucket's notification pipeline (either via CloudTrail's native SNS delivery notification or via an S3 event notification) sends new-object events to the single SNS topic you name in
CloudTrailSnsArn. - The stack is deployed in the same region as that SNS topic and bucket.
- All objects in that bucket are encrypted with at most one customer-managed KMS key (the one you supply as
CloudTrailKmsArn), or with SSE-S3 / no encryption.
A common pattern for organization-scope connectors is to set up an organizational trail that delivers logs from all member accounts to a single central S3 bucket. For account-scope or organizational unit-scope connectors, per-account trails in each member account delivering to a central bucket are also supported. If your organization uses AWS Control Tower, use Custom Control Tower (BYOB) instead.
- Custom Control Tower (BYOB) audit log collection: Designed for AWS organizations governed by AWS Control Tower. Because Control Tower centralizes log storage by placing the S3 bucket in a dedicated logging account and the SNS topic in a dedicated Audit account, this deployment uses a multi-account architecture:
- IAM role deployment: Provisioned in the log archive account.
- SQS queue deployment: Provisioned in the account holding the SNS topic to enable local event subscription and message queuing.
- Cortex automated log collection: Cortex XSIAM provisions and manages all required AWS resources (S3 bucket, CloudTrail trail, encryption, and notifications) on your behalf.
In all modes, the supporting infrastructure is deployed in a single AWS region - the region where you launch onboarding. The CloudTrail trail itself is multi-region and captures events from all AWS regions. For Custom (BYOB) mode, regional coverage matches your existing trail's configuration. For full details on deployment modes, ingestion flow, and data security, see Audit Log Collection Architecture.
| Collection mode | Resources created | Purpose |
|---|---|---|
| Custom (BYOB) | SQS Queue, SNS Subscription, SQS Queue Policy | <p>Connect to a customer-managed S3 bucket and CloudTrail trail.</p><p>Event notifications flow through customer-owned SQS/SNS resources.</p> |
| Custom Control Tower (BYOB) | SQS Queue, SNS Subscription, SQS Queue Policy, IAM Role (cortex-logs-ingestion-access-*, deployed into the Log Archive account via StackSet) |
Connect to the centralized S3 bucket managed by AWS Control Tower in the logging account. The IAM role is deployed cross-account into the logging account; the SQS queue is created in the management account where the Control Tower SNS topic resides. |
| Automated | S3 Bucket, S3 Bucket Policy, KMS Key, CloudTrail Trail, SNS Topic, SNS Topic Policy, SNS Subscription, SQS Queue, SQS Queue Policy, Lambda Function | Cortex XSIAM provisions the S3 bucket, CloudTrail trail, and encryption key, then collects CloudTrail logs automatically. |
Scanning capabilities
The following table details the scanning capabilities available during cloud onboarding. The table specifies the IAM roles and resources created and the purpose of each capability. Use this reference to understand the infrastructure footprint and coverage of each scanning capability deployed by Cortex XSIAM. All scanning capabilities operate across all AWS regions in the onboarded account.
| Capability | Purpose | Resources created |
|---|---|---|
| Agentless Disk Scanning (ADS) | Agentless disk scanning for vulnerabilities. | Custom managed policy Cortex-ADS-Policy added to CortexPlatformRole |
| Outpost Scanner | Enables data security, registry and serverless scanning. | CortexPlatformScannerRole IAM Role |
| Data Security Scanning (DSPM) | Data classification and sensitive data discovery. | Managed policy Cortex-DSPM-Policy attached to CortexPlatformRole; inline Cortex-DSPM-Scanner-Policy embedded in CortexPlatformScannerRole. Adds export.rds.amazonaws.com as a trusted service on CortexPlatformRole. |
| Registry Scanning | Container image vulnerability scanning. | ECRAccessPolicy Inline policy added to CortexPlatformScannerRole |
| Serverless Scanning | Lambda function vulnerability scanning. | LAMBDAAccessPolicy Inline policy added to CortexPlatformScannerRole |
| Kubernetes Security Posture Scanning | Kubernetes posture and configuration scanning on EKS. | Managed policy (CortexK8sSecurityPolicy) added to CortexPlatformRole |
Automation capabilities
The Automation module extends AWS cloud instances with automated remediation and active response capabilities. When enabled, it provisions a managed IAM policy (Cortex-Automation-Policy) and attaches it to the existing CortexPlatformRole. This policy grants Cortex XSIAM the permissions required to execute automated actions across AWS services such as EC2, S3, IAM, RDS, Lambda, and others. The capability applies globally across all scopes (Account, Organization, and Organizational Unit) and does not require region-specific configuration.
All actions are granted on `Resource: "*"`, so each permission applies to every resource of the affected service in every AWS region of the onboarded account. Review the full action list with your security team and enable the Automation capability only in accounts where Cortex XSIAM is authorized to perform automated remediation. For accounts intended only for monitoring, leave this capability disabled.
\
\
AWS resource inventory
The onboarding process creates AWS resources in the onboarding account (the management account for Organization or Organizational Unit scope). The exact set of resources depends on the onboarding scope and the security capabilities selected during the process. The resources fall into three categories: base resources (created for every cloud instance), scanning resources (created based on selected capabilities), and log collection resources (created when audit log collection is enabled).
Base resources
The following tables detail the AWS resources created as part of every cloud instance, according to scope.
Account onboarding scope
The following resources are created as part of every cloud instance, regardless of which security capabilities are enabled.
| Resource type | Resource name | Purpose |
|---|---|---|
| AWS::IAM::Role | CortexPlatformRole | Primary IAM role assumed by Cortex XSIAM using sts:AssumeRole. Attached: ReadOnlyAccess, AmazonMemoryDBReadOnlyAccess, SecurityAudit, AmazonSQSReadOnlyAccess, AWSOrganizationsReadOnlyAccess. Trust policy: principal = OutpostRoleArn with mandatory sts:ExternalId condition. Optional add-on capabilities (Discovery, ADS, DSPM, Kubernetes, Automation) attach additional policies to this role. |
| AWS::IAM::Role | CortexTemplateCustomLambdaExecutionRole | Execution role for the custom Lambda function. Attached managed policy: AWSLambdaBasicExecutionRole. |
| Custom::PublishRoleDetail | (CloudFormation-generated name) | CloudFormation custom resource that triggers the Lambda function to report stack outputs back to Cortex (ephemeral). |
| AWS::Lambda::Function | (CloudFormation-generated name) | To complete the handshake, this Lambda function sends the CloudFormation Identifiers (role ARN, account ID, external ID) back to the Cortex XSIAM platform via HTTPS PUT. For Org and OU scopes, it also sends two identifiers: the AWS Organization ID, and the targeting scope ID - the Organization root ID for Org scope, or the Organizational Unit (OU) ID for OU scope. |
Organization and organizational unit (OU) onboarding scopes
The following resources are in addition to the resources created for account scope when onboarding at the organization or organizational unit (OU) scope.
| Resource type | Resource name | Purpose |
|---|---|---|
| AWS::CloudFormation::StackSet | CortexPlatformCloudRoleStackSetMember | Service-managed StackSet that deploys CortexPlatformRole (and CortexPlatformScannerRole if any scanner capability is enabled) plus selected scanning policies to every member account in the target OU. Automatic deployment onboards new accounts and removes stacks from offboarded ones. |
Scope differences
Organization and OU onboarding scopes follow the same workflow and create the same resources. In both cases, you launch the CloudFormation template from your AWS Organization management account. This is required by AWS for any deployment that targets multiple member accounts.The only difference between the two scopes is which accounts receive the Cortex XSIAM resources:
- Organization scope: Deploys Cortex XSIAM resources to every account in your AWS Organization, including any accounts you add later.
- OU scope: Deploys Cortex XSIAM resources only to the accounts inside a specific OU that you choose, plus any sub-OUs nested underneath it
In both cases, the AWS Organization management account also receives Cortex XSIAM resources because it hosts the audit-log collection infrastructure that Cortex XSIAM needs to access. Two smaller differences also apply:
- AWS organization metadata access: Organization scope grants Cortex Cloud read-only access to your AWS Organizations metadata (organization ID, account list) so it can identify which organization you have onboarded. OU scope does not grant this access.
- CloudTrail audit logs: If you enable audit log collection, both scopes provision the collection infrastructure in the management account. With organization scope, CloudTrail is configured as an organization trail, meaning a single trail in the management account captures events from every member account automatically.
Scanning and automation resources
For organization and OU scopes, the CortexPlatformRole, the CortexPlatformScannerRole, and all selected capability policies are propagated to every member account using the member account StackSet. The onboarding helper function, handshake resource, and audit log resources are created only in the management account.
| Resource type | Resource name | Purpose | Relevant security capabilities |
| AWS::IAM::Role | CortexPlatformScannerRole | IAM role for scanner operations. Attached managed policy: ReadOnlyAccess. Trust policy allows scanner identity ARNs populated dynamically from outpost resources data. | Any of the following: DSPM, serverless scanning, registry scanning |
| AWS::IAM::ManagedPolicy | Cortex-DISCOVERY-Policy | Managed policy attached to CortexPlatformRole. Grants read access to additional AWS services not covered by ReadOnlyAccess. | Always included |
| AWS::IAM::ManagedPolicy | Cortex-ADS-Policy | Managed policy Cortex-ADS-Policy attached to CortexPlatformRole. Grants EC2 snapshot operations plus KMS support. Write actions are gated by the managed_by: paloaltonetworks tag condition. | Agentless disk scanning |
| AWS::IAM::ManagedPolicy | Cortex-DSPM-Policy | Managed policy Cortex-DSPM-Policy attached to CortexPlatformRole. Grants permissions for data classification and sensitive-data discovery. Includes a scoped iam:PassRole to rds.amazonaws.com for snapshot-export workflows. Adds export.rds.amazonaws.com as a trusted service on the role's trust policy, and creates an inline policy Cortex-DSPM-Scanner-Policy on CortexPlatformScannerRole. | DSPM |
| Inline policy | Cortex-DSPM-Scanner-Policy | Inline policy on CortexPlatformScannerRole. Grants the permissions that actually read customer data for sensitive data classification. | DSPM |
| AWS::IAM::ManagedPolicy | Cortex-Automation-Policy | Managed policy Cortex-Automation-Policy attached to CortexPlatformRole. Grants permissions across a broad range of AWS services for automated remediation, active response, and enrichment. Statements are scoped by action; resources are *. | Automation |
| AWS::IAM::ManagedPolicy | Cortex-K8s-Security-Policy | Managed policy Cortex-K8s-Security-Policy attached to CortexPlatformRole. Grants scoped EKS access-entry management, all conditioned on the managed_by: paloaltonetworks tag. Bound Kubernetes permission is the AWS-managed AmazonEKSAdminViewPolicy (read-only Kubernetes API access) | Kubernetes security |
| Inline policy | ECRAccessPolicy | Inline policy on CortexPlatformScannerRole. Grants three ECR actions (BatchGetImage, GetDownloadUrlForLayer, GetAuthorizationToken) for container image pull. | Registry scanning |
| Inline policy | LAMBDAAccessPolicy | Inline policy on CortexPlatformScannerRole. Grants three Lambda read actions (GetFunction, GetFunctionConfiguration, GetLayerVersion) for serverless code retrieval | Serverless scanning |
Log collection resources
The following resources are deployed in the onboarding account (the management account for organization or OU scope). Log collection resources are never propagated to member accounts via the StackSet. In automated log collection mode, Cortex XSIAM provisions the resources listed below. In custom (BYOB) log collection mode, only four resources are created: the SQS queue, SNS subscription to your existing topic, queue policy, and the cortex-logs-ingestion-access-* IAM role.
Automated log collection resources
| Resource type | Resource name | Purpose |
| AWS::KMS::Key | CloudTrailKMSKey | Customer Managed Key (CMK) that encrypts CloudTrail logs at rest. The key policy grants the AWS account root full access (kms:), allows the CloudTrail service to encrypt new log objects (kms:GenerateDataKey and kms:Encrypt), and allows kms:Decrypt, kms:ReEncrypt, kms:GenerateDataKey*, and kms:DescribeKey for any IAM principal in the AWS account. This lets authorized roles such as the audit log reader role (default name: cortex-logs-ingestion-access-*) decrypt the logs. |
| AWS::S3::Bucket | CloudTrailLogsBucket | S3 bucket (default name pattern: cortex-ct-logs-${AWS::AccountId}, with a tenant suffix appended at template generation) for storing CloudTrail logs. KMS-encrypted with a 7-day lifecycle expiration policy |
| AWS::S3::BucketPolicy | CloudTrailLogsBucketPolicy | Bucket policy that grants the CloudTrail service permission to write log files to the bucket (s3:PutObject with the bucket-owner-full-control ACL condition) and to read the bucket ACL (s3:GetBucketAcl). All other access is governed by IAM policies in the AWS account. |
| AWS::SQS::Queue | CloudTrailLogsQueue | SQS queue (default name pattern: cortex-ct-logs-queue-${AWS::AccountId}, with a tenant suffix appended at template generation) for receiving SNS notifications about new CloudTrail log files. |
| AWS::SNS::Topic | CloudTrailSNSTopic | SNS topic (default name pattern: cortex-ct-logs-notification-${AWS::AccountId}, with a tenant suffix appended at template generation) for CloudTrail log delivery notifications. It receives S3 event notifications and forwards the notifications to the SQS queue. |
| AWS::SNS::TopicPolicy | CloudTrailSNSTopicPolicy | Enables the CloudTrail service to publish notifications to the SNS topic. |
| AWS::SNS::Subscription | CloudTrailSNSTopicSubscription | Subscribes the SQS queue to the SNS topic for message delivery. |
| AWS::SQS::QueuePolicy | SNSPolicy | Enables the SNS topic to send messages to the SQS queue. |
| AWS::IAM::Role | CloudTrailReadRole | Enables Cortex XSIAM to read logs from S3 and poll SQS. Trust policy uses Google web identity federation (Federated: accounts.google.com) with sts:AssumeRoleWithWebIdentity, scoped to a specific audience and Google service-account identifier so that only Cortex XSIAM's collector can assume the role.. Inline policy grants S3 read on the logs bucket, SQS receive/delete/get-attributes on the queue, and KMS decrypt. |
| AWS::IAM::Role | EmptyBucketLambdaExecutionRole | Execution role for the Lambda function that empties the S3 bucket during stack deletion.Inline policy grants S3 list and delete on the logs bucket. |
| AWS::Lambda::Function | EmptyBucketLambda | Lambda function that empties the S3 bucket on CloudFormation stack deletion to enable clean removal. |
| Custom::EmptyBucketDetails | EmptyBucketCustomResource | CloudFormation custom resource that triggers Bucket cleanup function during stack deletion to clean up the S3 bucket (ephemeral). CloudFormation custom resource that triggers during stack deletion to clean up the S3 bucket (ephemeral). |
| AWS::CloudTrail::Trail | CloudTrail | Creates a multi-region CloudTrail trail (default name pattern: cortex-trail-${AWS::AccountId}, with a tenant suffix appended at template generation). Captures management events only (IncludeManagementEvents: true); data events such as S3 object access or Lambda invocations are not collected by default. Global service events are included (IncludeGlobalServiceEvents: true). |
Custom (BYOB) log collection
When custom (BYOB) log collection is configured, you provide the existing S3 bucket and CloudTrail trail in your account. Cortex XSIAM provisions the following four resources: CloudTrailReadRole (cortex-logs-ingestion-access), CloudTrail logs queue (cortex-ct-logs-queue-byob-<AccountId>), SNS-to-SQS subscription, and the Queue policy for the CloudTrail logs queue.
Custom Control Tower (BYOB) log collection
Custom Control Tower (BYOB) audit log collection is designed for AWS organizations where CloudTrail is provisioned and managed through an AWS Control Tower landing zone. When Control Tower manages your organization's CloudTrail setup, it centralizes all audit logs in a dedicated logging account, a separate AWS account that Control Tower provisions specifically to store logs from across the organization. Because the S3 bucket resides in this logging account rather than in the management account and the SNS topic resides in a designated audt account, the standard custom (BYOB) log collection setup cannot subscribe to the SNS topic across account boundaries without additional configuration.
The custom Control Tower (BYOB) option handles this automatically. Cortex XSIAM deploys the IAM role into the logging account and creates the SQS queue in the account where the Control Tower SNS topic resides, enabling seamless cross-account log ingestion without requiring manual IAM trust configuration.
When custom Control Tower log collection is configured for an AWS organization, Cortex Cloud provisions the following resources. The SQS queue, SNS subscription, and queue policy are provisioned in the same account that hosts the customer's CloudTrail SNS topic.
| Resource type | Resource name | Account | Purpose |
|---|---|---|---|
AWS::SQS::Queue | cortex-ct-logs-byoct-<tenant-id> | Customer's SNS topic account | Receives SNS notifications from the Control Tower-provisioned SNS topic about new CloudTrail log files |
AWS::SNS::Subscription | (inline) | Customer's SNS topic account | Subscribes the SQS queue to the customer-provided Control Tower SNS topic |
AWS::SQS::QueuePolicy | SNSPolicy | Customer's SNS topic account | Allows the Control Tower SNS topic to send messages to the SQS queue |
AWS::IAM::Role | cortex-logs-ingestion-access-<resource-suffix> | Logging account | Grants Cortex XSIAM read access to the centralized S3 bucket and SQS queue using Google OIDC federation (accounts.google.com). Inline policy grants: s3:GetObject, s3:ListBucket on the Control Tower S3 bucket; sqs:ReceiveMessage, sqs:DeleteMessage, sqs:GetQueueAttributes, sqs:ChangeMessageVisibility on the SQS queue; kms:Decrypt on the KMS ARN (if provided). |
Cortex XSIAM does not create: a new S3 bucket, CloudTrail trail, SNS topic, or KMS key. These already exist in the Control Tower environment and are managed by AWS.
Naming convention for Cortex XSIAM-managed AWS resources
All resources created during the onboarding deployment follow a deterministic naming pattern: Cortex<resource>-<scan-mode>-<scope>-<tenant-id>. The two IAM roles created in every deployment are:
- CortexPlatformRole-<scan-mode>-<scope>-<tenant-id>: The primary access role Cortex XSIAM uses to read and protect your AWS environment.
- CortexPlatformScannerRole-<scan-mode>-<scope>-<tenant-id>: The role used by Cortex XSIAM scanners (DSPM, registry, serverless) for data-plane reads.
Where:
- <scan-mode> is m for cloud scan or o for outpost scan.
- <scope> is a for account scope or o for organization/OU-scope deployments. The scope is fixed at template generation time.
- <tenant-id> is the unique numeric identifier of your Cortex XSIAM tenant.
Most Cortex XSIAM-managed resources are tagged managed_by=paloaltonetworks for inventory and lifecycle tracking. Resources that do not support AWS tagging (such as S3 bucket policies, SNS subscriptions, and SQS queue policies) are not tagged but are managed under the parent resource's lifecycle. The same naming pattern applies to audit-log resources (cortex-ct-logs-…), KMS keys, and SQS queues created by the stack.
Because role names are deterministic, you cannot deploy two cloud instances of the same scope and the same scan mode into the same AWS account.
Audit log resource naming: Custom vs Control Tower BYOB
The two custom audit log collection modes create resources with different names and in different accounts:
- Custom (BYOB): The SQS queue is named
cortex-ct-logs-queue-byob-<AccountId>and the IAM role is namedcortex-logs-ingestion-access-<resource-suffix>. Both resources are created in the management account. - Custom Control Tower (BYOB): The SQS queue is named
cortex-ct-logs-byoct-<tenant-id>. The IAM role is namedcortex-logs-ingestion-access-ingestion-access-<resource-suffix>and is deployed into the dedicated logging account.
AWS security model and authentication
Cortex XSIAM implements a defense-in-depth security model built on the principle of least privilege. Every permission granted to Cortex XSIAM is scoped to a specific security capability and has a clear purpose. This section describes the security principles, authentication mechanisms, and operational safeguards that protect your AWS environment.
Security principles
- Minimal permissions by default: Cortex XSIAM operates with the minimum permissions necessary for each capability. Discovery and posture assessment rely on read-only access wherever possible. Additional permissions are only provisioned when you explicitly enable optional capabilities such as agentless disk scanning or data security posture management.
- Capability-scoped write access: Each optional capability uses a dedicated policy that is attached only when the capability is enabled. Operations that require limited write access, such as creating temporary resources during analysis, do not modify existing customer assets.
- Permission transparency and health monitoring: Cortex XSIAM continuously validates that all required permissions remain granted. Every entitlement is mapped to a purpose description so you understand why each permission is required. Missing or revoked permissions are displayed as health status warnings in the connector dashboard.
Authentication mechanisms
Cortex XSIAM eliminates the risk of leaked credentials by strictly avoiding static IAM Access Keys, instead relying on temporary, short-lived tokens provided by the AWS Security Token Service (STS). Three isolated identity flows ensure that discovery, scanning, and logging operations remain functionally and cryptographically separated.
- Discovery and scan flows: These flows use cross-account AssumeRole calls. These calls include a mandatory sts:ExternalId condition to prevent "confused deputy" attacks, ensuring only your specific Cortex XSIAM tenant can access your roles.
- Audit logs flow: Employs OIDC Federation through AssumeRoleWithWebIdentity. AWS natively validates Google-signed OIDC tokens from Cortex (GCP), which facilitates a secure identity handshake without the need for manual Identity Provider (IdP) management.
- Cloud-native identity and trust: Deployment uses cloud-provider-native security mechanisms for identity validation and access control. All permissions and resources are provisioned through customer-reviewed Infrastructure-as-Code templates to ensure transparency.
The following table maps each capability to the customer-side IAM role and the Cortex-side identity used for authentication:
| Capability | Customer account IAM role assumed | Cortex XSIAM principal that assumes the role |
|---|---|---|
| Discovery, ADS, Kubernetes Security, Automation, DSPM (platform-level actions) | CortexPlatformRole | role/gcp_saas_role |
| DSPM (data scanning) | CortexPlatformScannerRole | role/dspm_scanner |
| Registry scanning | CortexPlatformScannerRole | role/registry_scanner |
| Serverless scanning | CortexPlatformScannerRole | role/scanner_of_serverless |
| Audit log collection | cortex-logs-ingestion-access-* |
Cortex XSIAM log collector (via Google OIDC: accounts.google.com with a specific audience and Google service-account ID) |
Cortex XSIAM and AWS audit log collection architecture
Cortex XSIAM collects AWS CloudTrail logs for security analysis using an event-driven, cross-cloud architecture. When audit log collection is enabled, a CloudFormation stack deploys AWS resources that capture CloudTrail events and make them available for Cortex XSIAM to ingest into your dedicated single-tenant log storage (a Google Cloud Storage bucket in Cortex XSIAM's GCP backend).
Cortex XSIAM supports collection across three organizational scopes: single account, organizational unit (OU), and full organization. It operates in both Commercial and GovCloud AWS partitions. For the complete list of resources created, see Log collection resources.
If you configure custom (BYOB) audit log collection using an existing S3 bucket, ensure that you deploy the stack in the same region as your S3 bucket. The SNS topic and SQS queue created by the stack must reside in the same region as the bucket for S3 event notifications to function.
Event-driven ingestion flow
The following stages describe the event-driven ingestion flow for CloudTrail logs:
- CloudTrail writes gzip-compressed JSON log files to the designated S3 bucket. The trail is multi-region, so it captures activity from every AWS region, and also includes global service events from non-regional services such as IAM, STS, and CloudFront.
- CloudTrail publishes a log file delivery notification directly to the SNS topic. The notification contains the S3 bucket name and the list of new S3 object keys.
- The SNS topic fans the notification out to its subscribers.
- The SQS queue receives the notification and stores the S3 path pointer to the new log file.
- Cortex XSIAM polls the SQS queue for new log notifications using sqs:ReceiveMessage, authenticating via the CloudTrailReadRole assumed through Google OIDC federation.
- Cortex extracts the S3 path from the SQS message and downloads the specific log files using s3:GetObject.
- Cortex decrypts the logs using the KMS key. The gzip-compressed content is then decompressed.
- Cortex forwards the processed logs to your dedicated Cortex single tenant (GCS bucket).
- Cortex deletes the processed SQS message using sqs:DeleteMessage.
- The Cortex XSIAM instance processes the logs for security analysis.
Data security for audit logs
In automated log collection mode, CloudTrail logs are retained in the S3 bucket for seven days (per the bucket's lifecycle expiration rule), and then automatically deleted. In custom (BYOB) and custom Control Tower log collection mode, you manage the S3 bucket lifecycle and retention. In all modes, forwarded log files are stored in your dedicated single-tenant Cortex XSIAM log storage bucket. CloudTrail log files at rest in the customer's S3 bucket are encrypted using the CloudTrail logs CMK (a customer-managed KMS key in your AWS account).
S3 Object Ownership requirement (Custom Control Tower
For Custom Control Tower (BYOB) log collection, the S3 bucket storing the CloudTrail log files must have Object Ownership set to Bucket owner enforced (ACLs disabled). This ensures the logging account owns all uploaded log objects, which is required for the s3:GetObject permission on the cortex-logs-ingestion-access-* IAM role to take effect.
Without the correct object ownership setting, log files uploaded to the centralized logging bucket may not be owned by the bucket owner account, which would result in Cortex XSIAM being unable to read them even with the correct IAM permissions configured.
Verify that your Control Tower Log Archive S3 bucket has Object Ownership → Bucket owner enforced enabled before deploying the Cortex XSIAM stack. For more information, see Controlling ownership of objects and disabling ACLs for your bucket in the AWS documentation.
Key Management Service (KMS) considerations
CloudTrail log files are encrypted at rest in the customer's S3 bucket. How the KMS key is provisioned depends on the deployment mode:
| Aspect | Automated log collection | Custom (BYOB) log collection | Custom Control Tower log collection |
|---|---|---|---|
| KMS key creation | Cortex XSIAM creates a new Customer Managed Key (CMK) via CloudFormation. | No KMS key is created. The customer supplies the optional CloudTrailKmsArn parameter at deployment time. |
No KMS key is created. The customer supplies the optional CloudTrailKmsArn parameter at deployment time. |
| Key policy | The Cortex XSIAM-created CMK uses the standard account-root key policy, which delegates access management to IAM. The CloudTrailReadRole role's inline IAM policy (provisioned by the same template) grants kms:Decrypt on the CMK, so no customer key-policy edits are required. |
The customer's KMS key policy must explicitly allow the cortex-logs-ingestion-access-* role to perform kms:Decrypt. |
The KMS key used by Control Tower resides in the management account, while the Cortex IAM role is deployed into the logging account. Because the key and the role are in different accounts, the KMS key policy in the management account must explicitly allow the cortex-logs-ingestion-access-* role (in the logging account) to perform kms:Decrypt. See Grant cross-account KMS key access. |
| Role permission | The audit log reader role inline policy includes kms:Decrypt on the Cortex XSIAM-created CMK. |
If CloudTrailKmsArn is provided, the role inline policy includes kms:Decrypt scoped to that ARN. If left empty, the kms:Decrypt statement is omitted entirely. |
If CloudTrailKmsArn is provided, the role inline policy includes kms:Decrypt scoped to that ARN. If left empty, the kms:Decrypt statement is omitted entirely. |
| Unencrypted/SSE-S3 buckets | Not applicable (Cortex XSIAM always creates an encrypted bucket). | If the bucket uses SSE-S3 or no encryption, leave the CloudTrailKmsArn parameter empty. |
If the bucket uses SSE-S3 or no encryption, leave the CloudTrailKmsArn parameter empty. |
You must use a customer-managed KMS key (CMK), not an AWS-managed or AWS-owned key. CloudTrail requires a symmetric CMK for trail encryption, and the audit log reader role must be granted kms:Decrypt through the key policy, which is only configurable on customer-managed keys.
One KMS key per bucket
The template accepts a single CloudTrailKmsArn and grants kms:Decrypt on that one key. If the objects in your bucket are encrypted under more than one customer-managed key (for example, each source account encrypts with its own key before delivery), Cortex XSIAM will fail to decrypt the objects protected by the keys you did not specify. Ensure the destination bucket re-encrypts all delivered objects under a single bucket-level CMK, or uses SSE-S3 (in which case leave CloudTrailKmsArn empty).
Note: Custom Control Tower (BYOB) log collection with KMS encryption
If you provide a CloudTrailKmsArn and the KMS key resides in a different account than the Log Archive account, a manual step is required. The Cortex CloudFormation template automatically grants kms:Decrypt to the cortex-logs-ingestion-access-<resource-suffix> role on the IAM side, but AWS also requires the KMS key resource policy to explicitly allow access from the Log Archive account. You must manually add this statement to the KMS key policy to complete the cross-account handshake. For the full procedure, see grant-cross-account-kms-key-access-for-control-tower-byob-log-collection.
The bucket cleanup function lifecycle
The bucket cleanup function automates the cleanup of AWS resources to ensure a successful stack deletion. This function empties the Cortex XSIAM CloudTrail log bucket during the CloudFormation stack deletion process. Because AWS prevents you from deleting S3 buckets that are not empty, this function ensures automated cleanup without manual intervention.
The bucket cleanup function operates only during the deletion of the CloudFormation stack. For security, the function has permissions to delete objects only from the specific CloudTrail bucket and cannot access or delete objects from other S3 buckets.
This resource only exists in automated log collection mode, because Cortex XSIAM only creates and owns the S3 bucket in that mode. In BYOB mode, the customer owns and manages their own bucket and its lifecycle.
Onboard Amazon Web Services
Use the cloud onboarding wizard to integrate an Amazon Web Services (AWS) environment with Cortex XSIAM. The onboarding wizard requires minimal configuration to set up the integration. To complete the minimum configuration, define the scope of the AWS accounts and specify the scan mode. Alternatively, configure the advanced settings for full control of the onboarding process.
Cortex XSIAM generates an authentication template based on the configuration settings. The template establishes trust with AWS and creates the required resources. For account scope, you can choose to deploy the template using CloudFormation or Terraform. For organization and organizational unit scope, CloudFormation is used. Execute the template to complete the onboarding process. Executing the template notifies Cortex XSIAM of the execution details. Cortex XSIAM then creates a new cloud instance.
Prerequisites for onboarding AWS
Before you begin onboarding AWS to Cortex XSIAM, ensure that you have the necessary permissions, credentials, and configuration details.
Permissions and credentials
Ensure that you have the following permissions and credentials:
- In Cortex XSIAM, you must have a Cortex XSIAM role with Data Sources - View & Edit permissions to add/configure cloud accounts in Cortex XSIAM. This role is included in the following built-in roles: Instance Administrator, Security Admin, and IT Admin.
Required IAM permissions in AWS
Before deploying CloudFormation stacks, ensure the user or role performing the onboarding has the necessary IAM permissions.
Required permissions for onboarding AWS account scope
Use the following template to create a dedicated role with the permissions required for onboarding AWS to Cortex XSIAM:
{ "Version": "2012-10-17", "Statement": [ { "Sid": "CortexCloudOnboarding", "Effect": "Allow", "Action": [ "iam:GetRole", "iam:UpdateAssumeRolePolicy", "iam:GetPolicyVersion", "iam:GetPolicy", "iam:UpdateRoleDescription", "iam:DeletePolicy", "iam:ListRoles", "iam:CreateRole", "iam:DeleteRole", "iam:AttachRolePolicy", "iam:PutRolePolicy", "iam:CreatePolicy", "iam:PassRole", "iam:CreateServiceLinkedRole", "iam:DetachRolePolicy", "iam:ListPolicyVersions", "iam:DeleteRolePolicy", "iam:UpdateRole", "iam:DeleteServiceLinkedRole", "iam:ListRolePolicies", "iam:GetRolePolicy", "iam:DeletePolicyVersion", "iam:SetDefaultPolicyVersion", "lambda:*", "kms:*", "s3:*", "sqs:*", "sns:*", "cloudtrail:*", "cloudformation:*" ], "Resource": "*" } ] }
Additional permissions required for serverless function scanning
To enable serverless function scanning, grant the following permissions in your AWS account for scanning outposts and accessing logs:
{ "Version": "2012-10-17", "Statement": [ { "Effect": "Allow", "Action": [ "lambda:GetFunction", "lambda:GetFunctionConfiguration", "lambda:GetLayerVersion", "iam:GetRole" ], "Resource": "*" } ] }
How to onboard Amazon Web Services
License type
This feature is included with a Cortex XSIAM Premium license. It is also included with any other Cortex XSIAM license that has the Cloud Runtime Security or Cloud Posture Security add-ons.
For Cortex XSIAM NG SIEM, Cortex XSIAM Enterprise, and Cortex XSIAM Enterprise+ licenses, see How to onboard Amazon Web Services with foundational configuration.
After completing the prerequisites, follow these instructions to onboard your Amazon Web Services (AWS) environment to Cortex XSIAM.
Access the AWS onboarding wizard in Cortex XSIAM:
- In Cortex XSIAM, select Settings → Data Sources & Integrations.
- On the Data Sources & Integrations page, click + Add New.
- On the Add Data Sources or Integrations page, search for Amazon Web Services (AWS), then hover over it and click Add.
Select the AWS environment
- In the AWS onboarding wizard, select the type of AWS environment:
- Government: AWS GovCloud environments for compatibility with FedRAMP-certified tenants.
- Commercial: (Default) Standard cloud deployment typically used for private and public sector organizations that do not require isolated government-specific infrastructure.
Select the scope
- Select the scope for this cloud instance:
- Organization: (Default) A collection of AWS accounts that are managed centrally.
- Organizational Unit: A group of AWS accounts within an organization. An organizational unit can also contain other organizational units.
- Account: A single AWS account.
Choose the scan mode
- Specify the scanning infrastructure for your cloud instance by selecting one of the following scan modes:
- Cloud Scan: (Recommended) Security scanning is performed in the Cortex XSIAM cloud environment.
-
Scan with Outpost: Security scanning is performed on infrastructure deployed to a cloud account owned by you. If you select this option, choose the outpost account to use for this instance.
Note
Scanning with an outpost may require additional AWS permissions and may incur additional CSP costs.
Configure advanced settings (optional)
-
Click Show advanced settings to define the following advanced settings:
- Instance Name: Enter a unique instance name or leave it empty to be automatically populated. The automatic naming convention is
AWS- or `AWS-`<organizationID>. Cortex XSIAM does not prevent you from reusing instance names, but it is best practice to use a unique name for every cloud instance. - Deployment Method: Select whether you want to onboard with a Cortex-generated IaC template or to perform a manual deployment:
- Infrastructure as Code: (Recommended) Automatically provisions all required cloud resources and permissions using an IaC template.
- Manual: Select this option if your organization requires manual provisioning to meet internal security and compliance policies. If you choose to onboard manually, follow the manual onboarding instructions.
- Scope Modifications: Use these settings to fine-tune your AWS scope, you can modify the scope by including or excluding specific regions. If you selected a Government environment, only AWS GovCloud regions are displayed. Additionally, if you selected an organization or organizational unit as the scope, you can modify the scope by including or excluding specific organizational units or accounts. For more details, see Apply region or account filters.
- Additional Security Capabilities: Choose which security capabilities you want to benefit from. Some security capabilities are enabled by default and can be modified. Adding security capability typically requires additional cloud provider permissions. For detailed information on the permissions required, see Cloud service provider permissions.
- Data security posture management: An agentless data security scanner that discovers, classifies, protects, and governs sensitive data. DSPM is not currently available in AWS GovCloud environments.
- Registry scanning: A container registry scanner that scans registry images for vulnerabilities, malware, and secrets. For more details, see Configure registry scanning for cloud accounts.
- Serverless functions scanning: Implement serverless scanning to detect and remediate vulnerabilities within serverless functions during the development lifecycle. Seamless integration into CI/CD pipelines enables automated security scans for a continuously secure pre-production environment.
- Automation: Use automation to pre-configure a list of integrations and associated commands to automate security issue responses. Commands can be utilized individually or as part of custom playbooks for issue remediation.
- Log Level: (Optional - for Automation only) Configure the automation integration logging level. Possible values are:
- Off (Default)
- Debug
- Verbose
- Log Level: (Optional - for Automation only) Configure the automation integration logging level. Possible values are:
- Agentless disk scanning: (Recommended) Implement agentless disk scanning to remotely detect and remediate vulnerabilities during the development lifecycle.
- Kubernetes security: Implement Kubernetes security to scan and assess Kubernetes cluster configurations, workloads, and security controls to identify misconfigurations, compliance violations, and security risks. This option detects issues in RBAC policies, network policies, pod security standards, container image security, and resource constraints. Keeping this enabled is strongly recommended to maintain continuous visibility into the cluster's security posture and to prevent undetected configuration gaps.
- Cloud Tags: Define tags and tag values to be added to any new resource created by Cortex XSIAM in AWS. Note: The
managed_by = paloaltonetworkstag is automatically added to all resources. This tag is mandatory. You cannot edit or remove this tag. -
Log Collection Configuration: To maximize security coverage, include the collection of audit logs using CloudTrail. Select the collection method:
- Automated: Select this option to have Cortex XSIAM provisions CloudTrail, S3, SQS, SNS, and KMS key resources in your AWS environment to collect audit logs.
- Collect data events: You can choose to collect data events, which captures S3 object-level and Lambda invocation events for enhanced visibility.
- Cost considerations: Data events can generate high volumes in active environments (millions of events per day for busy S3 buckets). We recommend you review your CloudTrail pricing and expected event volume before enabling.
- Custom: (Default) Use this option to use an existing Amazon S3 bucket for storing your CloudTrail logs.
- When you deploy the authentication template, you will enter the following details: S3 bucket name, SNS topic ARN, KMS key ARN (optional, if bucket is encrypted). For CloudFormation, these are entered as stack parameters. For Terraform, you are prompted for these values when you run terraform apply.
- Cortex XSIAM creates the SQS queue, the
cortex-logs-ingestion-access-*IAM role, and the S3-to-SNS-to-SQS event notification infrastructure. - After you deploy the authentication template, you must configure the S3 bucket event notification to send to the Cortex XSIAM-created SQS queue.
- Custom Control Tower: Select this option if your AWS Organization is managed by AWS Control Tower and uses a centralized Log Archive account where CloudTrail logs are stored in a dedicated account separate from the management account. This option is only available for organization scope and uses service-managed StackSets to deploy the IAM role into the Log Archive account and the SQS queue into the account where the Control Tower SNS topic resides.
- When you deploy the authentication template in CloudFormation, you will enter the following details: S3 bucket name (the centralized Control Tower bucket in the Log Archive account), SNS topic ARN (the Control Tower-provisioned
aws-controltower-AllConfigNotificationstopic), KMS key ARN (optional), logging account ID (the AWS account ID of the Log Archive account), logging account OU ID (the OU ID of the organizational unit that directly contains the Log Archive account), and the SNS topic OU ID (the OU ID of the organizational unit that directly contains the account where the SNS topic resides). - Cortex XSIAM deploys the IAM role into the Log Archive account and creates the SQS queue in the same account that hosts the customer's CloudTrail SNS topic.
- When you deploy the authentication template in CloudFormation, you will enter the following details: S3 bucket name (the centralized Control Tower bucket in the Log Archive account), SNS topic ARN (the Control Tower-provisioned
Important
It is critical to ensure that your KMS key region and SNS topic region are the exact same as the AWS region where you are deploying the authentication template. For custom Control Tower (BYOB), deploy the stack in the same region as your Control Tower home region, where the SNS topic resides.
- Automated: Select this option to have Cortex XSIAM provisions CloudTrail, S3, SQS, SNS, and KMS key resources in your AWS environment to collect audit logs.
-
Upload unknown files to WildFire: Use this option to upload unknown files scanned during registry image scans to WildFire for detonation analysis.
This option expands malware detection by allowing WildFire to analyze new samples found in your registry images. When a detonation result returns a malicious verdict, the system re-evaluates the relevant registry image and creates a malware finding.

Notes
- The file types sent for WildFire analysis depend on the platform type. WildFire accepts files up to 300 MB in size.
- This setting applies only to registry image scans and is enabled by default for new AWS instances. For existing instances, this setting is disabled by default to preserve current behavior. You can enable it at any time by editing the instance configuration.
- Your cloud provider may charge standard outbound data transfer (egress) fees when scanning with an Outpost.
- Instance Name: Enter a unique instance name or leave it empty to be automatically populated. The automatic naming convention is
Save the configuration
- Click Save. Cortex XSIAM generates an authentication template based on the settings you configured in the AWS onboarding wizard. Cortex XSIAM creates an instance in the pending state. For details on pending instances, see Pending cloud instances.
Deploy the template
To complete the process, deploy the authentication template using one of the following methods:
-
Automated: (Recommended) Click Execute in AWS to be redirected to AWS CloudFormation to create the stack. Before you select Automated, verify that you are logged into the correct AWS account in your browser. For account scope, it is the account you are onboarding. For organization or OU scope, it is the management account. Deploying to the wrong account will cause deployment failures or create resources in the wrong location.
You are redirected to the AWS CloudFormation console with the pre-populated template. Click through the wizard to create the stack.
- Generate template: Download one of the setup files and deploy it in your AWS account:
- Click CloudFormation to download the CloudFormation template file.
- Click Terraform (account scope only) to download the Terraform template archive.
- Deploy the template in AWS.
Deploy the authentication template in AWS
To connect your AWS account to Cortex XSIAM, you must deploy an authentication template. The deployment method you use depends on the template type you downloaded from the AWS onboarding wizard.
When you select to manually deploy the authentication template, you must connect to AWS Management Console to create a stack using the template file.
- In AWS Management Console, navigate to CloudFormation.
- On the Stacks page, click Create stack, and then select With new resources (standard).
- On the Create stack page, in Prerequisite - Prepare template, select Choose an existing template.
- In Specify template, select Upload a template file, then click Choose file and upload the template downloaded from Cortex XSIAM. Click Next.
- In the Specify stack details page, enter a Stack name.
- In Parameters, review the values pre-populated by Cortex XSIAM: ExternalID, OutpostRoleArn, and CortexPlatformRoleName. If you have enabled custom Control Tower audit log collection, the following pre-populated values are also displayed: SqsQueueName and CloudTrailReadRoleName. Do not change these values. The ExternalID is unique to your Cortex XSIAM tenant and acts as a shared secret in the role's trust policy. Replacing it will prevent Cortex XSIAM from assuming the role.
- In Parameters, if you have enabled custom log collection, enter the following details:
CloudTrailKmsArn: (Optional) The ARN of the AWS KMS key used to encrypt the CloudTrail log files, if using.CloudTrailLogBucket: The name of the Amazon S3 bucket where CloudTrail stores the log files.CloudTrailSnsArn: The ARN of the Amazon SNS topic that CloudTrail uses to send notifications when new log files are delivered.LoggingAccountId: (Only for custom Control Tower BYOB) The AWS Account ID of the dedicated AWS Control Tower logging account where the centralized S3 bucket resides.SnsTopicOuId: (Only for custom Control Tower BYOB) OU containing the SNS topic account.LoggingAccountOuId: (Only for custom Control Tower BYOB) OU containing the Log Archive account.OrganizationalUnitId: (Only for organization or organizational unit scope) Organizational root ID.
- Click Next and Next again.
- In Review, in the Capabilities section, acknowledge that CloudFormation might create IAM resources with custom names and click Submit. (This is required because the template creates the IAM roles Cortex XSIAM uses to access your account.) The stack is complete when it appears in the Stacks list with status of CREATE_COMPLETE.
When the template is successfully uploaded to AWS and the stack creation is complete, a Lambda function notifies Cortex XSIAM and the cloud instance will appear as Connected. The initial discovery scan is then started. When the scan is complete, you can view the discovered assets in Asset Inventory.
Downloading a Terraform template is only available for AWS account scope.
Prerequisites
Before you begin, ensure you have:
- Write permissions to your target AWS account.
- Installed Terraform on your local machine. You can download Terraform from the official Terraform website and follow the installation instructions for your operating system.
- Installed and configured the AWS CLI on your local machine with active credentials for your target AWS account.
- Reviewed the introduction to Terraform for Cloud service provider (CSP) onboarding to understand the underlying logic of how Terraform interacts with your cloud environment.
- Open your local terminal (Command prompt, PowerShell, or Terminal).
-
Log in to your AWS account using the AWS CLI:
aws login
- Create a directory on your local machine to store and run the Terraform code. If you have more than one AWS connector, you need a separate directory for each one:
mkdir -p ~/terraform/aws-connector-1
- Navigate to the directory you created and extract the Terraform files. Ensure all necessary Terraform files are present (
main.tf,template_params.tfvars, etc).
You must not delete or move the Terraform files from this folder. It will prevent you from being able to edit your cloud instance in the future.
cd ~/terraform/aws-connector-1 tar -xzvf <your_template>.tar.gz
- Initialize Terraform in your project directory:
terraform init
- Apply your Terraform configuration using the downloaded parameter file. :
terraform apply --var-file=template_params.tfvars
- If you selected custom audit log collection, Terraform prompts for:
cloud_trail_logs_bucket: The name of the Amazon S3 bucket where CloudTrail stores the log files.cloud_trail_sns_arn: The ARN of the Amazon SNS topic that CloudTrail uses to send notifications when new log files are delivered.cloud_trail_kms_arn: (Optional) The ARN of the AWS KMS key used to encrypt the CloudTrail log files, if using.
When the template is successfully deployed, a Lambda function notifies Cortex XSIAM and the cloud instance will appear as Connected. The initial discovery scan is then started. When the scan is complete, you can view the discovered assets in Asset Inventory.
Post-deployment: Custom (BYOB) and Control Tower audit log collection
If you selected Custom (BYOB) or Custom Control Tower audit log collection, link your existing CloudTrail notification pipeline to the SQS queue created by the template. The SQS queue receives messages by subscribing to the SNS topic, which acts as the intermediary. You can route these notifications using either of the following methods:
- CloudTrail → SNS: (Recommended) If your CloudTrail trail is already configured to publish delivery notifications to an SNS topic, the Cortex-created SQS queue subscribes to that topic automatically via the SNS subscription resource in the template. No additional S3 configuration is needed.
- S3 → SNS: If your S3 bucket is not yet connected to an SNS topic, configure an S3 event notification on the bucket to send
s3:ObjectCreated:*events to the SNS topic named in theCloudTrailSnsArnparameter. The SNS topic then fans out to the SQS queue.
The CloudFormation stack creates the SQS queue in your account. You must manually configure your S3 bucket to send event notifications to it.
- In the AWS CloudFormation console, open the stack and select the Outputs tab.
- Note the
sqs_urloutput value. - Derive the SQS queue ARN from the URL (format:
arn:aws:sqs:<region>:<account-id>:<queue-name>), or retrieve it from the AWS SQS console. - Confirm which notification route applies to your setup:
- If your CloudTrail trail already publishes to the SNS topic you provided as
CloudTrailSnsArn: No additional configuration is needed. The template's SNS subscription connects the topic to the SQS queue automatically. - If your S3 bucket does not yet send notifications to the SNS topic: In the AWS Management Console, navigate to your S3 bucket. Under Properties → Event notifications, add a notification with event type
s3:ObjectCreated:*and destination set to the SNS topic ARN you provided asCloudTrailSnsArn. Save the notification configuration.
- If your CloudTrail trail already publishes to the SNS topic you provided as
The Control Tower BYOB CloudFormation stack deploys the SQS queue and SNS subscription automatically via CloudFormation StackSets into the account where your SNS topic resides. No manual S3 event notification configuration is required. The SNS-to-SQS subscription is created by the StackSet.
After the stack completes, you can verify the following in the AWS Management Console:
- In the SNS topic account, confirm that the SQS queue named
<SqsQueueName>(the value you entered in the wizard) exists and has an active subscription to your CloudTrail SNS topic. - In the logging account, confirm that the IAM role named
<CloudTrailReadRoleName>(the value you entered in the wizard) exists and has the correct trust policy and S3 read permissions. - In Cortex XSIAM, verify that the cloud instance transitions from Pending to Connected.
Important
If you are using Control Tower for audit log collection and you choose to encrypt your logs with a KMS key, you must grant cross-account KMS key access.
The Terraform template creates the SQS queue in your account. You must manually configure your S3 bucket to send event notifications to it.
- In the
terraform applyoutput, note thesqs_urlvalue. - Derive the SQS queue ARN from the URL (format:
arn:aws:sqs:<region>:<account-id>:<queue-name>), or retrieve it from the AWS SQS console. - Confirm which notification route applies to your setup:
- If your CloudTrail trail already publishes to the SNS topic you provided as
cloud_trail_sns_arn: No additional configuration is needed. - If your S3 bucket does not yet send notifications to the SNS topic: In the AWS Management Console, navigate to your S3 bucket. Under Properties → Event notifications, add a notification with event type
s3:ObjectCreated:*and destination set to the SNS topic ARN you provided ascloud_trail_sns_arn. Save the notification configuration.
- If your CloudTrail trail already publishes to the SNS topic you provided as
Troubleshooting custom audit log collection
Use this section to diagnose issues with custom (BYOB) audit log collection after deploying the authentication template. The most common causes of failure are:
- S3 event notifications not configured or misconfigured: For Terraform and standard CloudFormation deployments, you must ensure your CloudTrail trail publishes delivery notifications to the SNS topic you provided, or configure your S3 bucket to send
s3:ObjectCreated:*events to that SNS topic. The SNS topic fans out to the SQS queue created by the template. If neither route is configured, or the wrong SNS topic ARN is used, logs will not reach Cortex XSIAM. - Cross-region resources: The S3 bucket, SNS topic, SQS queue, and authentication template deployment must all be in the same AWS region. Cross-region configurations are not supported.
- KMS key policy not updated: (Only relevant for Custom Control Tower audit log collection) If your S3 bucket is encrypted with a customer-managed KMS key, you must manually update the KMS key policy to allow the Cortex log-collector IAM role to call
kms:Decrypt. This cannot be done automatically by the template. - Instance remains in Pending state: This indicates the template deployed successfully but the notification to Cortex XSIAM did not complete. You can connect the instance manually from the Cortex XSIAM pending instances panel. See Manually connect a cloud instance for more details.
Select the tab for your deployment method for specific troubleshooting steps.
| Symptom | Likely cause | Resolution |
|---|---|---|
| Stack creation fails with IAM permission errors | AWS credentials lack required CloudFormation or IAM permissions | Ensure your AWS credentials have permissions to create CloudFormation stacks, IAM roles, SQS queues, and the resources required by your selected capabilities. |
CloudTrailSnsArn parameter rejected | SNS ARN format is incorrect | The ARN must match arn:(aws|aws-us-gov):sns:<region>:<account-id>:<topic-name>. |
CloudTrailKmsArn parameter rejected | KMS ARN format is incorrect | The ARN must match arn:(aws|aws-us-gov):kms:<region>:<account-id>:key/<uuid>. Leave the field empty if no KMS key is used. |
| Instance remains in Pending state after stack creation | Lambda notification to Cortex XSIAM failed | Check the Lambda function logs in CloudWatch for errors. If the notification failed, connect the instance manually: select the pending instance, click Connect manually, and provide the CortexPlatformRole ARN and External ID shown in the CloudFormation stack Outputs tab. |
| Logs not appearing in Cortex XSIAM after stack creation | Notification pipeline not connected: CloudTrail is not publishing to the SNS topic, or the S3 bucket is not sending event notifications to the SNS topic | Confirm that either your CloudTrail trail is configured to publish delivery notifications to the SNS topic ARN you provided as CloudTrailSnsArn, or your S3 bucket has an event notification configured to send s3:ObjectCreated:* events to that SNS topic. The SNS topic fans out to the SQS queue. Ensure the S3 bucket, SNS topic, and CloudFormation stack are all in the same AWS region. |
| KMS decryption errors in Cortex XSIAM | KMS key policy does not allow the CortexLogsReadRole to call kms:Decrypt | Update the KMS key policy to allow kms:Decrypt for the CortexLogsReadRole-* IAM role created by the stack. This must be done manually after the stack is deployed. |
| Symptom | Likely cause | Resolution |
|---|---|---|
StackSet operation fails with OPERATION_NOT_FOUND or permission errors |
AWS Organizations service-managed StackSets not enabled, or the management account does not have trusted access enabled for CloudFormation | In AWS Organizations, enable trusted access for AWS CloudFormation StackSets. See the AWS documentation. |
| SQS queue not created in the SNS topic account | SnsTopicOuId does not contain the account where the SNS topic resides |
Verify that the OU ID entered for SnsTopicOuId is the OU that directly contains the SNS topic account. The StackSet uses AccountFilterType: INTERSECTION and will not deploy if the account is not in the specified OU. |
| IAM role not created in the logging account | LoggingAccountOuId does not contain the logging account |
Verify that the OU ID entered for LoggingAccountOuId is the OU that directly contains the logging account where the S3 bucket resides. |
LoggingAccountId parameter rejected |
Account ID format is incorrect | The value must be a 12-digit AWS account ID with no hyphens or spaces. |
LoggingAccountOuId or SnsTopicOuId parameter rejected |
OU ID format is incorrect | The value must match the format ou-<root-id>-<ou-id> (for example, ou-ab12-cd34ef56). |
SqsQueueName parameter rejected |
Queue name contains invalid characters or exceeds 80 characters | Queue names may only contain alphanumeric characters, hyphens, and underscores, and must be 80 characters or fewer. |
| Logs not appearing in Cortex XSIAM after stack creation | SNS-to-SQS subscription not active, or S3 event notification not forwarding to SNS | In the SNS topic account, verify the SQS queue exists and has an active subscription to the CloudTrail SNS topic. Confirm that the S3 bucket is configured to send s3:ObjectCreated:* event notifications to the SNS topic (not directly to SQS — the SNS topic fans out to the SQS queue). |
| KMS decryption errors in Cortex XSIAM | KMS key policy does not allow the CloudTrailReadRoleName role in the logging account to call kms:Decrypt |
Update the KMS key policy in the logging account to allow kms:Decrypt for the IAM role named <CloudTrailReadRoleName>. This must be done manually after the StackSet deploys the role. |
| Symptom | Likely cause | Resolution |
|---|---|---|
terraform init fails with provider download errors |
No outbound internet access to the Terraform registry | Ensure outbound HTTPS access to registry.terraform.io and releases.hashicorp.com is allowed from your local machine. |
terraform apply fails with IAM permission errors |
AWS credentials lack required permissions | Ensure your AWS credentials have permissions to create IAM roles, policies, and the resources required by your selected capabilities. |
cloud_trail_sns_arn validation error |
SNS ARN format is incorrect | The ARN must match arn:(aws\|aws-us-gov):sns:<region>:<account-id>:<topic-name>. |
cloud_trail_kms_arn validation error |
KMS ARN format is incorrect | The ARN must match arn:(aws\|aws-us-gov):kms:<region>:<account-id>:key/<uuid>. Leave the field empty if no KMS key is used. |
| Tag validation errors during apply | Custom tags contain invalid characters | AWS tag keys and values may only contain Unicode letters, digits, whitespace, and the following symbols: _ . : / = + - @. Remove any other characters from your custom tags in the onboarding wizard. |
| Instance remains in Pending state after apply | Notification to Cortex XSIAM failed | The notification requires outbound HTTPS access to *.storage.googleapis.com. If the notification failed, connect the instance manually: select the pending instance, click Connect manually, and provide the CortexPlatformRole ARN and External ID shown in the Terraform output. |
| Logs not appearing in Cortex XSIAM after S3 event notification is configured | SQS queue ARN entered incorrectly in S3 event notification | Verify the ARN in the S3 bucket event notification matches the sqs_url output from terraform apply. Ensure the S3 bucket, SNS topic, and SQS queue are all in the same AWS region. |
Grant cross-account KMS key access for Control Tower BYOB log collection
This procedure is required if you are using custom Control Tower (BYOB) log collection and you choose to encrypt your logs with a KMS key.
When a KMS key and the accessing IAM role reside in different AWS accounts, AWS requires a two-way trust handshake to authorize access:
- IAM side (Automated): The Cortex XSIAM CloudFormation template automatically attaches
kms:Decryptpermissions for your specified key ARN to thecortex-logs-ingestion-access-*role in the Log Archive account. - KMS key policy side (Manual): You must update the KMS key's resource policy to explicitly trust and allow the Cortex XSIAM IAM role in the Log Archive account to perform the
kms:Decryptaction.
Prerequisites
Before you begin, retrieve and note the following values:
- Logging account ID: The 12-digit AWS account ID of your logging account where the Cortex IAM role is deployed.
- Cortex role name: The exact name of the IAM role created by the Cortex XSIAM CloudFormation template in the Log Archive account (e.g.,
cortex-logs-ingestion-access-*). You can retrieve this from the Outputs tab of the deployed CloudFormation stack. - KMS key ID or ARN: The identifier of the KMS key used to encrypt your Control Tower S3 bucket.
- Sign in to the AWS Management Console of the Management account where the KMS key resides.
- Navigate to Key Management Service (KMS) > Customer managed keys.
- Select the KMS key used to encrypt your Control Tower S3 bucket.
- Select the Key policy tab, then click Edit.
- In the JSON editor, locate the closing bracket (
]) of theStatementarray. -
Append a comma (
,) to the statement immediately preceding the closing bracket, then paste the following block:{ "Sid": "AllowCortexCrossAccountKmsDecrypt", "Effect": "Allow", "Principal": { "AWS": "arn:aws:iam::<LOGGING_ACCOUNT_ID>:role/<cortex-logs-ingestion-access-*>" }, "Action": "kms:Decrypt", "Resource": "*" }
Where:
<LOGGING_ACCOUNT_ID>is your 12-digit Log Archive account ID.<cortex-logs-ingestion-access-*>is the full name of your Cortex XSIAM IAM role.
- Click Save changes.
Verify connection
Once the key policy is updated, verify that Cortex XSIAM can successfully decrypt and ingest the logs:
- Log in to Cortex XSIAM.
- Navigate to Settings > Data Sources & Integrations > Cloud Accounts.
- Locate your cloud instance and verify that the Audit Log status indicator is green.
Troubleshooting: If the status indicator remains red, verify that both the Log Archive account ID and the Cortex IAM role name in your KMS key policy statement match the values listed in your CloudFormation stack outputs exactly.
AWS post-deployment verification
After you have deployed the authentication template in Amazon Web Services (AWS), verify that it was successfully deployed. In Cortex XSIAM, select Data Sources & Integrations → Cloud Accounts. Verify the following:
- The original cloud instance remains in "Pending" state. For more details on pending instances, see Understand pending instances.
- A new cloud instance appears in the cloud accounts list (separate from the pending instance).
- The new cloud instance shows status "Connected".
- The discovery scan starts automatically for every discovered account.
- Assets appear in the Asset Inventory as discovery progresses.
Troubleshooting AWS onboarding
If no new cloud instance appears:
- Check the CloudFormation stack status in the AWS console. The status should be CREATE_COMPLETE.
- Check the Lambda execution logs in AWS CloudWatch for errors. If the Lambda notification to Cortex XSIAM is not executed, Cortex XSIAM does not create a new cloud instance in Connected stated.
- You can Manually connect an instance to create the instance from the pending cloud instance.
Microsoft Azure cloud onboarding
Cortex XSIAM cloud onboarding is the process of connecting your Microsoft Azure cloud environment to Cortex XSIAM so it can continuously monitor, scan, and protect your cloud resources. This process establishes secure, least-privilege access for comprehensive security monitoring and threat detection. You gain visibility into your cloud infrastructure and can choose to enable security capabilities such as vulnerability scanning, data protection, and compliance monitoring.
The onboarding process provisions the infrastructure in your Microsoft Azure environment required to monitor, secure, and analyze your cloud resources. The sections below describe the available capabilities, the resources created, the security model, and the step-by-step onboarding process.
Onboard Microsoft Azure
Use the cloud onboarding wizard to integrate a Microsoft Azure environment with Cortex XSIAM. The onboarding wizard requires minimal configuration to set up the integration. To complete the minimum configuration, define the scope of the Microsoft Azure accounts and specify the scan mode. Alternatively, configure the advanced settings for full control of the onboarding process.
Cortex XSIAM generates a Terraform or ARM authentication template based on the configuration settings. The authentication template establishes trust with Microsoft Azure. The authentication template also grants required permissions to Cortex XSIAM. Execute the authentication template in Microsoft Azure to complete the onboarding process. Executing the authentication template notifies Cortex XSIAM of the execution details. Cortex XSIAM then creates a new cloud instance.
Onboard Microsoft Entra ID only
You can onboard Microsoft Entra ID independently of a full tenant-level onboarding. When you select the Onboard Microsoft Entra ID only option during onboarding with Tenant scope, Cortex XSIAM connects to Entra ID to unlock identity-based capabilities, including Cloud Infrastructure Entitlement Management (CIEM), identity posture assessment, and Entra ID sign-in log ingestion. This approach enables identity visibility without requiring Cortex XSIAM to scan or manage the broader Azure tenant environment.
When you onboard Entra ID only, Cortex XSIAM operates in collection-only mode. Scan mode selection and scope modification are not available for this configuration. Both Terraform and ARM authentication templates are supported, and manual onboarding is also available. Cortex XSIAM generates the appropriate authentication template based on your selection, and you execute it in Microsoft Azure to complete the onboarding process.
If you enable audit log collection with Entra ID-only onboarding using automated collection, Cortex XSIAM ingests sign-in and activity log categories including: SignInLogs, AuditLogs, NonInteractiveUserSignInLogs, ServicePrincipalSignInLogs, ManagedIdentitySignInLogs, ProvisioningLogs, ADFSSignInLogs, and MicrosoftGraphActivityLogs. Administrative category logs are excluded from automated collection. If you configure custom diagnostic settings, log ingestion follows your specified configuration.
You can later expand an Entra ID-only configuration to full tenant scope by editing the onboarding configuration. This approach lets you to begin with identity-focused onboarding and transition to comprehensive tenant coverage as requirements evolve.
About the Cortex XSIAM service principal
A service principal is an identity that an application uses to authenticate and interact with Azure resources. When Cortex XSIAM connects to your Azure tenant, Cortex XSIAM uses a service principal as its runtime identity in that tenant.
Cortex XSIAM uses the service principal to:
- Authenticate to your Azure tenant without requiring interactive user sign-in during ongoing operations.
- Perform the role assignments and resource provisioning defined in the authentication template you execute during onboarding.
- Operate within the custom roles and scoped permissions you grant, following the principle of least privilege.
When you onboard an Azure tenant for the first time, Cortex XSIAM checks automatically whether the Cortex service principal already exists in your tenant when you enter your tenant ID in the onboarding wizard. If the Cortex service principal does not yet exist in your tenant, you must create it before you can proceed with onboarding. Cortex XSIAM displays the Azure CLI command to run in the onboarding wizard. The user who runs this command must have the Application Administrator built-in Entra ID role. The Application Administrator role is required only to create the Cortex service principal. After the service principal exists in your tenant, you do not need this role to complete the rest of the onboarding process.
Prerequisites for onboarding Azure
Permissions
Before you begin to onboard Microsoft Azure to Cortex XSIAM, ensure that you have the necessary permissions:
- In Cortex XSIAM, you must have a Cortex XSIAM role with Data Sources - View & Edit permissions (to add/configure cloud accounts in Cortex XSIAM). This role is included in the following built-in roles: Instance Administrator, Security Admin, and IT Admin.
- In Microsoft Azure, you must have an admin user with the required permissions.
Additional prerequisites
Before you begin onboarding Microsoft Azure, ensure that:
- You have a Microsoft Azure subscription.
- You obtain the tenant ID and subscription ID. You can view these in the Microsoft Azure Portal in Management groups.
Custom (user-defined) audit log collection
If you are configuring custom (user-defined) audit log collection using an existing Event Hub, ensure that:
- You have the Event Hub name, Event Hub namespace, and Event Hub resource group name.
- The namespace and Event Hub belong to the specific Azure subscription being onboarded. Cross-subscription or centralized logging is not currently supported.
Required Azure permissions for Cortex XSIAM onboarding
This section lists all Azure permissions required for Cortex XSIAM onboarding using custom roles (least-privilege). It covers both the Terraform (TF) and ARM (onboard.sh) provisioning methods. The specific permissions required depend on your target scope (subscription, management group, or tenant) and whether audit log collection is enabled.
Global permission prerequisites for creating service principal
When onboarding an Azure tenant to Cortex XSIAM, the onboarding wizard automatically checks for the Cortex service principal when you enter your Azure tenant ID. If the service principal is missing, the wizard provides a command to register it manually, establishing Cortex XSIAM's primary runtime identity within your Azure tenant so you can proceed with onboarding. The user who runs the command to create the service principal must have the Application Administrator built-in Entra ID role.
Overview of required Azure permissions by onboarding scope
Find your target scope below to see the required roles you need to assign or create.
| Onboarding scope | Base permissions required | Additional permissions required if audit log collection is enabled |
| Subscription | Create the Basic Subscription custom role (using the permissions listed below) and assign it at the target subscription. | Create the Audit Log Collection custom role (using the permissions listed below) and assign it at the target subscription. |
| Management group |
| Create the Audit Log Collection custom role (using the permissions listed below) and assign it at the target management group. |
| Tenant |
|
|
Basic Subscription custom role permissions
These permissions must be included in a custom Azure role assigned at the subscription level.
Microsoft.Resources/deploymentScripts/delete Microsoft.Resources/deploymentScripts/logs/read Microsoft.Resources/deploymentScripts/read Microsoft.Resources/deploymentScripts/write Microsoft.Resources/deployments/delete Microsoft.Resources/deployments/operations/read Microsoft.Resources/deployments/operationstatuses/read Microsoft.Resources/deployments/read Microsoft.Resources/deployments/validate/action Microsoft.Resources/deployments/whatIf/action Microsoft.Resources/deployments/write Microsoft.Resources/subscriptions/resourceGroups/delete Microsoft.Resources/subscriptions/resourceGroups/read Microsoft.Resources/subscriptions/resourceGroups/write Microsoft.Authorization/roleAssignments/delete Microsoft.Authorization/roleAssignments/read Microsoft.Authorization/roleAssignments/write Microsoft.Authorization/roleDefinitions/delete Microsoft.Authorization/roleDefinitions/read Microsoft.Authorization/roleDefinitions/write Microsoft.ContainerInstance/containerGroups/delete Microsoft.ContainerInstance/containerGroups/read Microsoft.ContainerInstance/containerGroups/write Microsoft.ManagedIdentity/userAssignedIdentities/assign/action Microsoft.ManagedIdentity/userAssignedIdentities/delete Microsoft.ManagedIdentity/userAssignedIdentities/federatedIdentityCredentials/delete Microsoft.ManagedIdentity/userAssignedIdentities/federatedIdentityCredentials/read Microsoft.ManagedIdentity/userAssignedIdentities/federatedIdentityCredentials/write Microsoft.ManagedIdentity/userAssignedIdentities/read Microsoft.ManagedIdentity/userAssignedIdentities/write
Basic Management Group custom role permissions
These permissions must be included in a custom Azure role assigned at the management group level. Assign this role in addition to the basic subscription layer.
Microsoft.Management/managementGroups/read Microsoft.Authorization/policyAssignments/delete Microsoft.Authorization/policyAssignments/read Microsoft.Authorization/policyAssignments/write Microsoft.Authorization/policyDefinitions/delete Microsoft.Authorization/policyDefinitions/read Microsoft.Authorization/policyDefinitions/write Microsoft.Compute/galleries/write Microsoft.Compute/galleries/read Microsoft.Resources/deploymentStacks/validate/action Microsoft.Resources/deploymentStacks/write Microsoft.Resources/deploymentStacks/read Microsoft.Resources/deploymentStacks/delete Microsoft.Resources/deploymentStacks/exportTemplate/action Microsoft.Resources/deploymentStacks/manageDenySetting/action Microsoft.Resources/deploymentStacksWhatIfResults/read Microsoft.Resources/deploymentStacksWhatIfResults/write Microsoft.Resources/deploymentStacksWhatIfResults/delete Microsoft.Resources/deploymentStacksWhatIfResults/whatIf/action
Audit Log Collection custom role permissions
These permissions must be included in a custom Azure role assigned at the target scope. Assign this role in addition to the previous roles according to the scope being onboarded.
Microsoft.EventHub/namespaces/authorizationRules/delete Microsoft.EventHub/namespaces/authorizationRules/listKeys/action Microsoft.EventHub/namespaces/authorizationRules/read Microsoft.EventHub/namespaces/authorizationRules/write Microsoft.EventHub/namespaces/delete Microsoft.EventHub/namespaces/eventhubs/consumergroups/delete Microsoft.EventHub/namespaces/eventhubs/consumergroups/read Microsoft.EventHub/namespaces/eventhubs/consumergroups/write Microsoft.EventHub/namespaces/eventhubs/delete Microsoft.EventHub/namespaces/eventhubs/read Microsoft.EventHub/namespaces/eventhubs/write Microsoft.EventHub/namespaces/networkRuleSets/read Microsoft.EventHub/namespaces/read Microsoft.EventHub/namespaces/write Microsoft.Insights/diagnosticSettings/delete Microsoft.Insights/diagnosticSettings/read Microsoft.Insights/diagnosticSettings/write Microsoft.PolicyInsights/remediations/delete Microsoft.PolicyInsights/remediations/read Microsoft.PolicyInsights/remediations/write Microsoft.Storage/storageAccounts/blobServices/containers/delete Microsoft.Storage/storageAccounts/blobServices/containers/read Microsoft.Storage/storageAccounts/blobServices/containers/write Microsoft.Storage/storageAccounts/blobServices/read Microsoft.Storage/storageAccounts/delete Microsoft.Storage/storageAccounts/fileServices/read Microsoft.Storage/storageAccounts/listKeys/action Microsoft.Storage/storageAccounts/read Microsoft.Storage/storageAccounts/write microsoft.aadiam/diagnosticsettings/delete microsoft.aadiam/diagnosticsettings/read microsoft.aadiam/diagnosticsettings/write Microsoft.EventHub/namespaces/networkRuleSets/write Microsoft.Storage/storageAccounts/blobServices/write Microsoft.EventHub/namespaces/eventhubs/authorizationRules/read Microsoft.EventHub/namespaces/eventhubs/authorizationRules/write Microsoft.EventHub/namespaces/eventhubs/authorizationRules/listKeys/action microsoft.directory/servicePrincipals/delete
Audit log collection in a tenant scope: Entra ID role requirement
This section applies when audit log collection is enabled and the onboarding is done at the tenant scope.
The microsoft.aadiam/diagnosticSettings permissions family at the tenant level is required for provisioning relevant resources required for audit log collection. The onboarding user must have the Security Administrator Entra ID role (or Global Administrator) in order to create, update, and delete the Azure diagnostic settings.
For more information, see Microsoft documentation.
How to onboard Microsoft Azure
This feature is included with a Cortex XSIAM Premium license. It is also included with any other Cortex XSIAM license that has the Cloud Runtime Security or Cloud Posture Security add-ons.
For Cortex XSIAM NG SIEM, Cortex XSIAM Enterprise, and Cortex XSIAM Enterprise+ licenses, see How to onboard Microsoft Azure with foundational configuration.
After completing the prerequisites, follow these instructions to onboard your Microsoft Azure environment to Cortex XSIAM.
Access the Azure onboarding wizard in Cortex XSIAM
- In Cortex XSIAM, select Settings → Data Sources & Integrations.
- On the Data Sources & Integrations page, click + Add New.
- On the Add Data Sources or Integrations page, search for Microsoft Azure, then hover over it and click Add.
Select the Microsoft Azure environment
- In the Microsoft Azure onboarding wizard, select the type of Microsoft Azure environment:
- Government: Microsoft Azure Government environments for compatibility with FedRAMP-certified tenants.
- Commercial: (Default) Standard cloud deployment typically used for private and public sector organizations that do not require isolated government-specific infrastructure.
Select the scope
- Select the scope for this cloud instance:
- Tenant: (Default) A specific instance of Azure Active Directory, which can contain several subscriptions.
- Management Group: A collection of Microsoft Azure subscriptions.
- Subscription: A collection of Microsoft Azure resources associated with a specific Microsoft Azure tenant.
- When you select Tenant, you have the option to select Onboard Microsoft Entra ID only. For more details on this option, see Onboard Microsoft Entra ID only.
Choose the scan mode
This option is not available when you are onboarding Microsoft Entra ID only.
- Specify the scanning infrastructure for your cloud instance by selecting one of the following scan modes:
- Cloud Scan: (Recommended) Security scanning is performed in the Cortex XSIAM cloud environment.
-
Scan with Outpost: Security scanning is performed on infrastructure deployed to a cloud account owned by you. If you select this option, choose the outpost account to use for this instance or create a new outpost. For more information on outposts, see Outposts.
Note
Scanning with an outpost may require additional Azure permissions and may incur additional CSP costs.
Verify the service principal in your Azure tenant
Before Cortex XSIAM can proceed with onboarding, the Cortex XSIAM service principal must be present in your Azure tenant. Cortex XSIAM checks the status of the service principal automatically when you enter your tenant ID.
-
Enter your Azure tenant ID in the Tenant ID field.
Cortex XSIAM checks whether the Cortex XSIAM service principal already exists in your tenant and displays one of the following results:
- Service principal found (green checkmark): The Cortex XSIAM service principal is already registered in your tenant. Click Next to continue with the onboarding wizard.
- Service principal not found: The Cortex service principal does not yet exist in your tenant. Cortex XSIAM displays the Azure CLI command you must run to create it.
-
If the Cortex service principal is not found, copy the Azure CLI command displayed in the wizard and run it in your terminal or in Azure Cloud Shell:
az ad sp create --id <cortex-tenant-id>
The user who runs this command must hold the Application Administrator Entra ID role.
-
After the command completes successfully, return to the Cortex XSIAM onboarding wizard and click Verify to verify that the Cortex service principal is now present in your tenant.
Cortex XSIAM performs a live verification of each tenant's approval status against Azure each time the list is displayed. If a previously approved tenant no longer shows a green checkmark, the Cortex XSIAM service principal may have been removed from the Azure tenant. Run the Azure CLI command again to re-create the service principal, then click Validate.
Configure advanced settings (optional)
- Click Show advanced settings to define the following advanced settings:
- Instance Name: Enter a unique instance name or leave it empty to be automatically populated. The automatic naming convention is
Azure-<tenantID>orAzure-<subscriptionID>. Cortex XSIAM does not prevent you from reusing instance names, but it is best practice to use a unique name for every cloud instance. - Deployment Method: Select whether you want to onboard with a Cortex-generated IaC template or to perform a manual deployment:
- Infrastructure as Code: (Recommended) Automatically provisions all required cloud resources and permissions using an IaC template.
- Manual: Select this option if your organization requires manual provisioning to meet internal security and compliance policies. If you choose to onboard manually, follow the manual onboarding instructions.
- Scope Modifications: Use these settings to fine-tune your Microsoft Azure scope. You can modify the scope by including or excluding specific regions. If you selected a Government environment, only Microsoft Azure Government regions are displayed. Additionally, if you selected a tenant or management group as the scope, you can modify the scope by including or excluding specific management groups or subscriptions. For more details, see Apply region or account filters. Scope modifications are not available when you are onboarding Microsoft Entra ID only.
- Additional Security Capabilities: Choose which security capabilities you want to benefit from. Some security capabilities are enabled by default and can be modified. Adding security capability typically requires additional cloud provider permissions. For detailed information on the permissions required, see Cloud service provider permissions. When you are onboarding Microsoft Entra ID only, only XSIAM analytics is supported as an additional security capability.
- Data security posture management: An agentless data security scanner that discovers, classifies, protects, and governs sensitive data. DSPM is not currently available in Microsoft Azure Government environments.
- Registry scanning: A container registry scanner that scans registry images for vulnerabilities, malware, and secrets. For more details, see Configure registry scanning for cloud accounts.
-
Serverless functions scanning: Implement serverless scanning to detect and remediate vulnerabilities within serverless functions during the development lifecycle. Seamless integration into CI/CD pipelines enables automated security scans for a continuously secure pre-production environment.
- Allow connection to private serverless functions: (Optional - only available with outpost scan) When serverless scanning runs from the outpost environment, it uses a dynamic IP address. Azure Functions with IP-based network restrictions will block the scanner. Enabling this option assigns a fixed IP address that can be whitelisted.
Enabling this feature requires additional permissions. Download and run the Terraform template again to apply the permissions required to scan private serverless resources. Private serverless resources are resources that are accessible only through private networks and aren’t publicly accessible.
- Automation: Use automation to pre-configure a list of integrations and associated commands to automate security issue responses. Commands can be utilized individually or as part of custom playbooks for issue remediation.
- Log Level: (Optional - for Automation only) Configure the automation integration logging level. Possible values are:
- Off (Default)
- Debug
- Verbose
- Log Level: (Optional - for Automation only) Configure the automation integration logging level. Possible values are:
- Agentless disk scanning: (Recommended) Implement agentless disk scanning to remotely detect and remediate vulnerabilities during the development lifecycle.
- Cloud Tags: Define tags and tag values to be added to any new resource created by Cortex XSIAM in Microsoft Azure. Note: The
managed_by = paloaltonetworkstag is automatically added to all resources. This tag is mandatory. You cannot edit or remove this tag.
- Instance Name: Enter a unique instance name or leave it empty to be automatically populated. The automatic naming convention is
- Log Collection Configuration: To maximize security coverage, include the collection of audit logs using Event Hub. Select the collection method:
- Automated collection: Cortex XSIAM provisions the resource group, Event Hub namespace, Event Hub, consumer group, storage account, user-assigned managed identity (UAMI), federated identity credential, diagnostic settings, and role assignment resources in your Azure environment to collect audit logs.
- Tenant/management group scope: A single diagnostic setting is created at the management group scope. Azure natively propagates Activity Logs from all child subscriptions through this management group-level setting and no per-subscription diagnostic setting is created. An Azure policy definition is also deployed to create the Cortex resource group in each child subscription.
- Cost considerations: Event Hub pricing is based on throughput units and ingress/egress. High-volume environments with many subscriptions can generate significant event throughput. We recommend you review your Azure Event Hubs pricing and expected event volume before enabling.
-
Custom (user defined): Select this option to use an existing Event Hub for storing your audit logs.
- When you deploy the authentication template in ARM, you will enter the following details: Event Hub name, Event Hub namespace, Event Hub resource group name.
- Cortex XSIAM creates the user-assigned managed identity (UAMI), federated identity credential, role assignments, and consumer group.
- After you deploy the stack in ARM, you must ensure that your existing Event Hub has the appropriate diagnostic settings configured to stream Azure Activity Logs.
Important
It is critical to ensure that your namespace and Event Hub belong to the specific Azure subscription being onboarded. Cross-subscription or centralized logging is not currently supported.
- Automated collection: Cortex XSIAM provisions the resource group, Event Hub namespace, Event Hub, consumer group, storage account, user-assigned managed identity (UAMI), federated identity credential, diagnostic settings, and role assignment resources in your Azure environment to collect audit logs.
- Upload unknown files to WildFire: Use this option to upload unknown files scanned during registry image scans to WildFire for detonation analysis.\
This option expands malware detection by allowing WildFire to analyze new samples found in your registry images. When a detonation result returns a malicious verdict, the system re-evaluates the relevant registry image and creates a malware finding.
Notes
- The file types sent for WildFire analysis depend on the platform type. WildFire accepts files up to 300 MB in size.
- This setting applies only to registry image scans and is enabled by default for new Azure instances. For existing instances, this setting is disabled by default to preserve the current behavior. You can enable it at any time by editing the instance configuration.
- Your cloud provider may charge standard outbound data transfer (egress) fees when scanning with an Outpost.
Save the configuration and download the template
- Click Save. Cortex XSIAM generates a Terraform or ARM authentication template based on the settings you configured in the Microsoft Azure onboarding wizard. Cortex XSIAM creates an instance in the pending state. For details on pending instances, see Pending cloud instances.
-
Download the authentication template:
- For onboarding Azure tenants and management groups, click one of the following:
-
Download Terraform to download a Terraform file and proceed to Finalize onboarding by applying the Terraform template's configuration.
To onboard all subscriptions within a management group or tenant, our authentication template uses Azure Resource Management (ARM) templates internally. The ARM templates are encoded with base64 and located inside the
template_params.tfvarsfile as thepolicy_templatevariable. -
Azure Resource Manager to download a
tar.gzfile and proceed to Finalize onboarding of tenants and management groups by deploying the Microsoft Azure Resource Manager (ARM) template.
-
- For onboarding Azure subscriptions, click one of the following:
- Download Terraform to download a Terraform file and proceed to Finalize onboarding by applying the Terraform template's configuration.
- Azure Resource Manager to download a JSON file and proceed to Finalize onboarding of subscriptions by deploying the Microsoft Azure Resource Manager (ARM) template.
The authentication template is reusable and can be executed as many times as you want to create new cloud instances with the settings you defined in the Microsoft Azure onboarding wizard. The Terraform authentication template is valid for seven days from when it was created.
- For onboarding Azure tenants and management groups, click one of the following:
- Click Close.
Finalize Microsoft Azure onboarding by executing the authentication template
While onboarding Microsoft Azure with the onboarding wizard, you have to choose one of the following options for executing an authentication template: Download Terraform or Azure Resource Manager.
After running the wizard, you finalize the onboarding by executing the template to provision the resources for subscriptions, management groups, and tenants in your cloud environment.
After the template is successfully executed, the initial discovery scan starts. When the scan completes, view your cloud assets in Asset Inventory.
Finalize onboarding by applying the Terraform template's configuration
If you selected the Download Terraform option in the Microsoft Azure onboarding wizard, execute the template with the CLI. You decide, based on your own use case, how you would like to perform the CLI commands, for example, locally or in CloudShell.
Prerequisites
Before you begin, ensure you have:
- An Azure subscription.
- A user with the required permissions for the relevant scope (subscription, management group, tenant). We recommend you create a dedicated role.
- Tenant ID and subscription ID. You can view these in Microsoft Azure Portal in Management groups.
- Installed Terraform on your local machine. You can download Terraform from the official Terraform website and follow the installation instructions for your operating system.
- Review the Introduction to Terraform for Cloud service provider (CSP) onboarding to get familiar with how Cortex works with Terraform for cloud onboarding.
- Installed the Azure CLI tool.
- In your local terminal, log in to your Azure account using the Azure CLI:
az login
- Create a directory on your local machine to store and run the Terraform code. If you have more than one Azure connector, you need a separate directory for each one:
mkdir -p ~/terraform/azure-connector-1
- Navigate to the directory you created and extract the Terraform files. Ensure all necessary Terraform files are present (main.tf, template_params.tfvars, and so on).
Do not delete or move the Terraform files from this folder. It will prevent you from being able to edit your cloud instance in the future.
cd ~/terraform/azure-connector-1 tar -xzvf <your_template>.tar.gz.
- Initialize Terraform in your project directory:
terraform init
- Apply your Terraform configuration using the downloaded parameter file:
terraform apply --var-file=template_params.tfvars
- When the CLI prompts you for a Group ID, enter the management group ID or the root tenant ID where you want to create Cortex XSIAM resources.
- When the CLI prompts you for a Subscription ID, enter the subscription ID where you want to create Cortex XSIAM resources. (This subscription is typically a subscription that the security team manages.)
- When prompted, review the actions the Terraform will perform and approve them by entering yes.
The Terraform template is executed.
Finalize onboarding of subscriptions by deploying the Microsoft Azure Resource Manager (ARM) template
If you selected the Azure Resource Manager option in the Microsoft Azure onboarding wizard to onboard subscriptions, deploy the template with the CLI. You decide, based on your use case, how you would like to perform the CLI commands, for example, locally or in CloudShell.
Prerequisites
Before you begin, ensure you have:
- An Azure subscription.
- A user with the required permissions for the relevant scope (subscription, management group, tenant). We recommend you create a dedicated role.
- Tenant ID and subscription ID. You can view these in Microsoft Azure Portal in Management groups.
- Installed the Azure CLI tool.
- Authorization to create management group policies.
- In your local terminal or CloudShell, log in to your Azure account using the Azure CLI:
az login
- Deploy the template file.
az deployment sub create \ --location <LOCATION> \ --subscription <SUBSCRIPTION_ID> \ --template-file <JSON_TEMPLATE>
where:
- <LOCATION> is the location of the management group, such as eastus or westus.
- <SUBSCRIPTION_ID> is the ID of the subscription you want to onboard.
- <JSON_TEMPLATE> is the JSON template file that you downloaded at the end of the onboarding wizard.
To verify the deployment was successful, check the Azure Portal under the "Deployments" section of the targeted subscription.
Finalize onboarding of tenants and management groups by deploying the Microsoft Azure Resource Manager (ARM) template
If you selected the Azure Resource Manager option in the Microsoft Azure onboarding wizard to onboard tenants or management groups, deploy the template with the CLI using Bash in CloudShell.
Prerequisites
Before you begin, ensure you have:
- An Azure subscription.
- A user with the required permissions for the relevant scope (subscription, management group, tenant). We recommend you create a dedicated role.
- Tenant ID and subscription ID. You can view these in Microsoft Azure Portal in Management groups.
- Installed the Azure CLI tool.
- Authorization to create management group policies.
- To prepare for deployment, execute the following commands in a Bash-compliant terminal, such as the Bash environment in Azure Cloud Shell:
-
Step Command Create a folder on your local machine to store the tarfile. If you have more than one Azure connector, you need a separate directory for each one.mkdir -p ~/azure-connector-1Navigate to the directory you created and extract the files. cd ~/azure-connector-1 tar -xzvf <your_template>.tar.gz.
-
-
Deploy the template file:
bash onboard.shWhen prompted, enter the following values:
- The Azure region where you want the resources to be created, such as
eastusorwestus. - The ID of the management group or tenant that you want to onboard.
- The ID of the subscription where the deployment script will run.
To verify the deployment was successful, check the Azure Portal under the Deployments section of the targeted management group, or tenant.
- The Azure region where you want the resources to be created, such as
Microsoft Azure offboarding overview
When you delete an Azure cloud instance from Cortex XSIAM, the cloud instance is removed from the platform. However, the Azure resources created during onboarding, including role assignments, role definitions, diagnostic settings, deployment stacks, resource groups, and managed identities, remain in your Azure environment until you explicitly clean them up.
The offboarding method depends on two factors:
- The scope at which the cloud instance was onboarded (subscription, management group, tenant, or tenant with Entra ID only).
- The template type used during onboarding (ARM or Terraform).
Use the table below to identify the correct offboarding procedure for your Microsoft Azure cloud instance.
| Onboarding scope | Template type | Procedure |
|---|---|---|
| All scopes | Terraform | Offboard Terraform-based Azure deployments (all scopes) |
| Subscription | ARM | Offboard Azure subscription (ARM) |
| Management group or tenant | ARM | Offboard Azure management group or tenant scope (ARM) |
| Tenant (Entra ID only) | ARM | Offboard Azure tenant with Entra ID only |
Offboard Terraform-based Azure deployments (all scopes)
Follow this procedure to offboard all Terraform-based Microsoft Azure scopes (subscription, management group, or tenant) and cleanly decommission all Cortex XSIAM resources from Microsoft Azure. Fo
Prerequisites
Before you begin, ensure you meet the following requirements:
Tooling requirements
- Bash (version \(\ge\) 4.0)
- Azure CLI (version \(\ge\) 2.61)
- jq (JSON processor)
- Terraform CLI (initialized in your Cortex deployment directory)
Required Azure permissions
The authenticated session must be run by a user or service principal with the Owner role assigned at the management group scope. This is required to delete policy resources, role assignments, role definitions, and resource groups across all child subscriptions.
Authentication
Run the following command in your terminal to authenticate with the correct Azure tenant:
az login --tenant <tenant-id>
How to offboard Microsoft Azure
-
In the same Terraform directory used to deploy, run the destruction command. This removes all core Terraform-managed resources, including the deployment stack, onboarding resource group, managed identity, and diagnostic settings:
terraform destroy
-
Review the destruction plan carefully, then enter
yesto confirm the removal.
1. Identify ext_resource_suffix
Important
This step must be performed before destroying any resources. Once terraform destroy is executed, the Terraform state is cleared, and this value cannot be recovered without contacting Palo Alto Networks support.
-
In your local terminal within the directory containing your Cortex XSIAM Terraform configuration and run the following command to retrieve the unique resource suffix:
terraform output ext_resource_suffix
-
Copy and save the output string. It is referred to as
<ext-value>in the steps below.
2. Run terraform destory
This removes all core Terraform-managed resources, including the deployment stack, onboarding resource group, managed identity, diagnostic settings, and Graph API roles.
-
In the same Terraform directory used in Step 1, run the destruction command:
terraform destroy
-
Review the destruction plan carefully, then enter
yesto confirm the removal.
3. Run offboard_policy_deployment.sh
Certain policy-deployed resources are created per-subscription by a deployIfNotExists policy and exist outside the Terraform lifecycle, so terraform destroy cannot remove them. The offboard_policy_deployment.sh script must be executed to finalize the offboarding.
For your reference, the following flags are used in the script:
| Flag | Description |
--management-group-id <id> | Required. Scope-specific values for
|
--ext-resource-suffix <ext-value> | Required. The suffix value saved from Step 1. |
--no-dry-run | Action Flag. By default, the script runs in read-only mode. You must pass this flag to execute actual resource deletions. |
--yes or -y | Automation Flag. Skips the interactive confirmation prompt. (Required for CI/CD pipelines, ignored in dry-run mode). |
-
First run a dry-run to preview the planned deletions and ensure your permissions are correct:
bash offboard_policy_deployment.sh \ --management-group-id <mg-id> \ --ext-resource-suffix <ext-value>
- Review the script output and confirm that all targeted resources were removed. The script runs a post-deletion verification phase automatically. A final summary is printed to the terminal indicating the outcome of each phase.\
If the script exits with a non-zero code or reports leftover resources in the verification phase, it is usually due to transient Azure API delays. You can safely re-run the script with--no-dry-runto trigger another cleanup and verification sweep. -
After reviewing the dry-run output, run the script with
--no-dry-runto delete the resources:bash offboard_policy_deployment.sh \ --management-group-id <mg-id> \ --ext-resource-suffix <ext-value> \ --no-dry-run
Offboard Azure subscription (ARM)
Follow this procedure to offboard a Microsoft Azure subscription scope from Cortex XSIAM and cleanly decommission all Cortex XSIAM resources from Microsoft Azure. This method is only for cloud instances that were onboarded using the Azure Resource Manager (ARM) method.
Prerequisites
Before you begin, ensure you meet the following requirements.
Tooling requirements
- Azure CLI (version ≥ 2.61)
- jq (JSON processor)
- Bash (version ≥ 4.0)
Required Azure permissions
The authenticated session must be run by a user or service principal with the Owner role assigned at the subscription scope. This is required to delete role assignments, role definitions, diagnostic settings, and the Cortex resource group.
Authentication
Run the following command in your terminal to authenticate:
az login
How to offboard an Azure subscription scope - ARM method
Locate your offboarding bundle
Locate the offboarding bundle provided by Cortex XSIAM. Navigate to the directory containing these files before proceeding. The bundle contains the following files, which must all be present in the same directory:
| File | Description |
|---|---|
connectors_azure_arm-<id>.json | The original ARM deployment template used during onboarding |
parameters.sh | Connector-specific parameters, including resource_suffix |
offboard_subscription_arm.sh | Interactive offboarding script |
Run the offboarding script
Important
The script must be run from the directory containing parameters.sh. Running it from any other directory will cause it to exit with an error.
Execute the offboarding script:
bash offboard_subscription_arm.sh
The script is interactive and guides you through each step. When prompted, provide the following inputs:
- Subscription ID: Enter the Azure subscription ID to offboard, or press Enter to use the currently active subscription.
- Execution mode: Select one of the following:
[1] plan— Dry run. Lists all role definitions, role assignments, diagnostic settings, and the resource group that would be deleted, along with their current status in Azure. No changes are made. After the plan is shown, you are offered the option to proceed with the action.[2] action— Executes the cleanup immediately, deleting all identified resources.
Review the plan output
If you selected plan mode, review the output carefully. Each resource is listed with one of the following statuses:
EXISTS: The resource is present in Azure and will be deleted when you run the action.DOESN'T EXIST: The resource has already been removed.
If all resources show DOESN'T EXIST, the subscription has already been fully offboarded. The script will offer to delete the ARM deployment records and exit.
If any resources show EXISTS, confirm the plan and enter y when prompted to proceed with the action.
Confirm resource deletion
When the action runs, the script deletes the following resources in order:
- Custom role assignments created by the ARM template
- Custom role definitions created by the ARM template
- Diagnostic settings created by the template
- The Cortex resource group (
cortex-<resource_suffix>)
Review the script output and confirm that all targeted resources are removed.
Verification
After the action completes, the script automatically waits 10 seconds and then runs a verification check to confirm that all resources have been deleted. This verification runs up to three times. If any resources are still detected on a given attempt, the script re-runs the cleanup before verifying again.
You will see one of the following final messages:
Verification passed. Offboarding complete.: This means that all resources have been successfully removed.❌ Verification failed after 3 attempt(s). N issue(s) remain.: This means that some resources could not be deleted. Inspect the specific resource IDs shown in the verification output and re-run the script manually.
If verification passes, the script prompts you to optionally delete the ARM deployment records from Azure. Enter y to remove them or N to retain them.
Troubleshooting
No resource group found, but a failed deployment exists
If the Cortex resource group is not found, the script checks for a failed ARM deployment. If a failed deployment is detected, it identifies any orphaned role definitions and role assignments that were created before the failure, shows a plan of what would be deleted, and prompts you to confirm cleanup. After cleanup, you are offered the option to delete the failed deployment record.
Verification fails after the action
The script automatically re-runs the cleanup and re-verifies up to three times. Transient Azure API delays are the most common cause. If issues persist after three attempts, inspect the remaining resources using the IDs shown in the verification output and re-run the script with mode [2] action to trigger another cleanup sweep.
Offboard Azure management group or tenant scope (ARM)
Follow this procedure to offboard a Microsoft Azure Management Group or Tenant scope from Cortex XSIAM and cleanly decommission all deployed resources.
Important
This offboarding script is designed for environments onboarded with BASE template version 1.4.18 or later. If your onboarding was deployed with an older BASE template version, this script may not fully remove all provisioned resources and could leave orphaned artifacts. Please verify your onboarding template version before proceeding.
Prerequisites
Before you begin, ensure you meet the following requirements:
Tooling requirements
- Bash (version \(\ge\) 4.0)
- Azure CLI (version \(\ge\) 2.61)
- jq (JSON processor)
Working directory
You must run the offboarding script from the same directory where the files parameters.sh and graphAPIRoles.json are located. These files are packaged with the onboarding template:
parameters.sh: Contains configuration parameters (such asresource_suffix,tenant_id, andcustomer_object_id) which the script auto-loads at startup.graphAPIRoles.json: Defines the Microsoft Graph app role assignments to remove.
Required Azure permissions
The authenticated session must be run by a user or service principal with the following roles:
- Global Administrator: Required for managing Entra ID diagnostic settings and service principal operations.
- Owner: Required at the management group scope for deleting deployment stacks, policy resources, role assignments, role definitions, and resource groups.
Authentication
Run the following command in your terminal to authenticate with the correct Azure tenant:
az login --tenant <tenant-id>
How to offboard Microsoft Azure MG or tenant scope - ARM method
Gather required values
Before running the offboarding script, collect the following values:
| Variable | Description | Where to find it |
|---|---|---|
<mg-id> | The management group ID being offboarded. | Azure portal > Management groups, or run az account management-group list -o table. |
<tenant-root-mg-id> | The tenant-root management group ID (for tenant scope only). Typically matches your Azure tenant ID. | Azure portal > Management groups > the top-level group, or run az account management-group list -o table. |
<sub-id> | The subscription ID hosting the Cortex onboarding resource group (cortex-onboarding-<resource_suffix>). | Azure portal > Subscriptions, or run az account list -o table. |
Locate your offboarding bundle
Navigate to the directory containing these files before proceeding. The bundle contains the following files, which must all be present in the same directory:
| File | Description |
|---|---|
parameters.sh | Connector-specific parameters, including resource_suffix, tenant_id, and customer_object_id. Auto-loaded by the script at startup. |
graphAPIRoles.json | Defines which Microsoft Graph app role assignments to remove. |
offboard_mg_tenant.sh | Interactive offboarding script. |
Understand the offboarding phases
The script executes the following phases in a fixed order. In dry-run mode, each phase lists the resources it would delete without making any changes. In action mode, each phase deletes the identified resources and the final phase verifies that all resources have been removed.
| Script phase | What it does |
|---|---|
diagnostics | Deletes the management group diagnostic setting. For tenant scope, also deletes the Entra ID diagnostic setting. |
stack | Deletes the deployment stack cortex-policy-<resource_suffix> at management group scope. |
onboarding-rg | Deletes the onboarding resource group cortex-onboarding-<resource_suffix>, which cascades deletion of the managed identity. |
graph-api-roles | Removes Microsoft Graph app role assignments from the customer service principal. |
policy | Deletes per-subscription policy-deployed resources across all child subscriptions: role assignments, role definitions, and the policy resource group. |
verify | Confirms all targeted resources are gone. Skipped in dry-run mode. |
Run the offboard_mg_tenant.sh script in dry-run mode
First, run the script in dry-run mode (the default) to preview all resources that would be deleted and verify your permissions are correct. No changes are made during a dry run.
For management group scope, run:
bash offboard_mg_tenant.sh \ --scope management_group \ --management-group-id <mg-id> \ --subscription-id <sub-id>
For tenant scope run:
bash offboard_mg_tenant.sh \ --scope tenant \ --management-group-id <tenant-root-mg-id> \ --subscription-id <sub-id>
Review the dry-run output carefully and confirm that the listed resources are correct before proceeding.
Run the offboarding cleanup
After reviewing the dry-run output, run the script with --no-dry-run to delete the resources.
For a management group scope connector:
bash offboard_mg_tenant.sh \ --scope management_group \ --management-group-id <mg-id> \ --subscription-id <sub-id> \ --no-dry-run
For a tenant scope connector:
bash offboard_mg_tenant.sh \ --scope tenant \ --management-group-id <tenant-root-mg-id> \ --subscription-id <sub-id> \ --no-dry-run
Verification and troubleshooting
Review the script output and confirm that all targeted resources were removed:
- Success: You will see a final confirmation message in your terminal indicating that cleanup is complete (Exit Code
0). - Leftover Resources: If the script times out or detects that any policy-deployed resources still remain, it will log the specific failed resources in the console output and exit with code
30. This is usually due to transient Azure API replication delays. You can safely re-run the cleanup script with the--no-dry-runflag to trigger another verification and cleanup sweep. See #reference-script-exit-codes for the exit code details.
Troubleshooting
The deployment stack was already deleted
If the deployment stack was deleted manually or in a prior partial run, the script cannot auto-resolve the extResourceSuffix and exits with code 10. The value of <ext-value> is printed in the logs when you run the offboard script. Pass the --ext-resource-suffix flag with that value to resume:
bash offboard_mg_tenant.sh \ --scope <tenant|management_group> \ --management-group-id <mg-id> \ --subscription-id <sub-id> \ --ext-resource-suffix <ext-value> \ --no-dry-run
Verification fails after the action
The script automatically re-runs the cleanup and re-verifies up to three times. Transient Azure API delays are the most common cause. If issues persist after three attempts, inspect the remaining resources using the IDs shown in the verification output and re-run the script with --no-dry-run to trigger another cleanup sweep.
Reference: Script exit codes
Use the following exit codes to understand the script results:
| Code | Meaning |
|---|---|
0 | Success, dry-run completed, or nothing to delete |
10 | Preflight failure (missing flag, authentication error, or extResourceSuffix unresolvable. Pass --ext-resource-suffix) |
21–25 | Single phase failure (diagnostics / stack / onboarding-rg / graph-api-roles / policy) |
30 | Verification found leftover resources |
40 | Two or more phases failed |
130 | Interrupted (SIGINT) |
Offboard Azure tenant with Entra ID only
Follow this procedure to offboard a Microsoft Azure tenant that was onboarded with the Entra ID-only option and cleanly decommission all deployed resources.
Important
This offboarding script is designed for environments onboarded with BASE template version 1.0.10 or later. If your onboarding was deployed with an older BASE template version, this script may not fully remove all provisioned resources and could leave orphaned artifacts. Please verify your onboarding template version before proceeding.
Prerequisites
Before you begin, ensure you meet the following requirements:
Tooling Requirements
- Bash (version \(\ge\) 4.0)
- Azure CLI (version \(\ge\) 2.61)
- jq (JSON processor)
Working directory
You must run the offboarding script from the same directory where the files parameters.sh and graphAPIRoles.json are located. These files are packaged with the onboarding template:
parameters.sh: Contains configuration parameters (such asresource_suffix,tenant_id, andcustomer_object_id) which the script auto-loads at startup.graphAPIRoles.json: Defines the Microsoft Graph app role assignments to remove.
Required Azure permissions
The authenticated session must be run by a user or service principal with the following roles:
- Global Administrator: Required for managing Entra ID diagnostic settings and service principal operations.
- Owner: Required at the management group scope for deleting deployment stacks, role assignments, role definitions, and resource groups.
Authentication
Run the following command in your terminal to authenticate with the correct Azure tenant:
az login --tenant <tenant-id>
How to offboard Microsoft Azure with Entra ID only
Make the script executable
Set the execution permissions for the script within your working directory. In your local terminal within the directory containing your onboarding templates and configuration files, run:
chmod +x offboard_entra_id_only.sh
Run the offboard_entra_id_only.sh script
Run the offboarding script to clean up all deployed infrastructure. For your reference, the following flags are used in the script:
| Flag | Description |
--management-group-id <mg-id> | Required. Management group ID. Typically this is the tenant-root MG. |
--subscription-id <sub-id> | Required. The specific subscription hosting the onboarding resource group. |
--resource-suffix <rs> | The resource suffix from onboarding. This is automatically loaded from ./parameters.sh if present in the working directory. |
--no-dry-run | Action Flag. By default, the script runs in dry-run (read-only) mode. You must pass this flag to perform actual resource deletions. |
--yes or -y | Automation Flag. Skips the interactive confirmation prompt before a destructive run. |
--ext-resource-suffix <ext> | Override Flag. Overrides the automatic resolution of the extResourceSuffix. Required if the deployment stack has already been deleted and auto-resolution fails. |
-
First run a dry-run to preview the planned deletions and ensure your permissions are correct:
./offboard_entra_id_only.sh \ --management-group-id <mg-id> \ --subscription-id <sub-id>
-
After reviewing the dry-run output, run the script with
--no-dry-runto delete the resources:./offboard_entra_id_only.sh \ --management-group-id <mg-id> \ --subscription-id <sub-id> \ --no-dry-run
Verification and troubleshooting
Review the script output and confirm that all targeted resources were removed:
- Success: You will see a final confirmation message in your terminal indicating that cleanup is complete (Exit Code
0). - Leftover Resources: If the script times out or detects that any policy-deployed resources still remain, it will log the specific failed resources in the console output and exit with code
30. This is usually due to transient Azure API replication delays. You can safely re-run the cleanup script with the--no-dry-runflag to trigger another verification and cleanup sweep. See #reference-script-exit-codes for the exit code details.
Reference: Script exit codes
Use the following exit codes to understand the script results:
| Exit Code | Meaning |
0 | Success: Dry-run completed, or resources successfully deleted. |
10 | Preflight failure: Missing flags, authentication error, or extResourceSuffix unresolvable (pass --ext-resource-suffix). |
21 | Phase 1 (diagnostics) failure. |
22 | Phase 2 (stack) failure. |
23 | Phase 3 (onboarding RG) failure. (Note: Deletion is automatically skipped if a managed identity is found inside the Resource Group, indicating it is shared with a full tenant onboarding). |
24 | Phase 4 (graph-api-roles) failure. |
30 | Phase 5 (verify) failure: Leftover resources were detected. |
40 | Multiple failures: Two or more deletion phases failed. |
130 | Execution interrupted (SIGINT). |
Google Cloud Platform onboarding
Cortex XSIAM onboarding is the process of connecting your Google Cloud Platform (GCP) cloud environment to Cortex XSIAM so it can continuously monitor, scan, and protect your cloud resources. This process establishes secure, least-privilege access for comprehensive security monitoring and threat detection. You gain visibility into your cloud infrastructure and can choose to enable security capabilities such as vulnerability scanning, data protection, and compliance monitoring.
The onboarding process provisions the infrastructure in your GCP environment required to monitor, secure, and analyze your cloud resources. The sections below describe the available capabilities, the resources created, the security model, and the step-by-step onboarding process.
Onboard Google Cloud Platform
Use the cloud onboarding wizard to integrate a Google Cloud Platform (GCP) environment with Cortex XSIAM. The onboarding wizard requires minimal configuration to set up the integration. To complete the minimum configuration, define the scope of the GCP environment you are onboarding and specify the scan mode. Alternatively, configure the advanced settings for full control of the onboarding process.
Cortex XSIAM generates a Terraform authentication template based on the configuration settings. The authentication template establishes trust with GCP. The authentication template also grants required permissions to Cortex XSIAM. Execute the authentication template in GCP to complete the onboarding process. Executing the authentication template notifies Cortex XSIAM of the execution details. Cortex XSIAM then creates a new cloud instance.
Prerequisites for onboarding GCP
Permissions
Before you begin to onboard GCP to Cortex XSIAM, ensure that you have the necessary permissions:
- In Cortex XSIAM, you must have a Cortex XSIAM role with Data Sources - View & Edit permissions (to add/configure cloud accounts in Cortex XSIAM). This role is included in the following built-in roles: Instance Administrator, Security Admin, and IT Admin.
- In GCP, you must have access to Google Cloud console and an admin user with the required GCP permissions.
Required APIs
Ensure you have enabled the following APIs in the GCP project you are onboarding:
- Cloud Resource Manager API
- Identity and Access Management (IAM) API
- Cloud Pub/Sub API (if audit logs are enabled)
If you plan on enabling Automation as an additional security capability, enable the following APIs:
Required admin GCP permissions for Cortex XSIAM onboarding
Use the following template to create a dedicated role with the permissions required for onboarding GCP to Cortex XSIAM:
{ "title": "CortexCloudOnboarding", "description": "Custom role with permissions required for onboarding Cortex XSIAM", "stage": "GA", "includedPermissions": [ "iam.roles.create", "iam.roles.delete", "iam.roles.get", "iam.roles.list", "iam.roles.update", "iam.serviceAccounts.create", "iam.serviceAccounts.delete", "iam.serviceAccounts.get", "iam.serviceAccounts.getIamPolicy", "iam.serviceAccounts.list", "iam.serviceAccounts.setIamPolicy", "iam.serviceAccounts.update", "logging.sinks.create", "logging.sinks.delete", "logging.sinks.get", "logging.sinks.update", "pubsub.subscriptions.create", "pubsub.subscriptions.delete", "pubsub.subscriptions.getIamPolicy", "pubsub.subscriptions.setIamPolicy", "pubsub.subscriptions.update", "pubsub.topics.create", "pubsub.topics.delete", "pubsub.topics.getIamPolicy", "pubsub.topics.setIamPolicy", "pubsub.topics.update", "resourcemanager.folders.get", "resourcemanager.folders.getIamPolicy", "resourcemanager.folders.list", "resourcemanager.folders.setIamPolicy", "resourcemanager.organizations.get", "resourcemanager.organizations.getIamPolicy", "resourcemanager.organizations.setIamPolicy", "resourcemanager.projects.get", "resourcemanager.projects.getIamPolicy", "resourcemanager.projects.list", "resourcemanager.projects.setIamPolicy" ] }
How to onboard Google Cloud Platform
After completing the prerequisites, follow these instructions to onboard your Google Cloud Platform (GCP) environment to Cortex XSIAM.
Access the GCP onboarding wizard in Cortex XSIAM:
- In Cortex XSIAM, select Settings → Data Sources & Integrations.
- On the Data Sources & Integrations page, click + Add New.
- On the Add Data Sources or Integrations page, search for Google Cloud Platform (GCP), then hover over it and click Add.
Select the GCP environment
- In the GCP onboarding wizard, select the type of GCP environment:
- Government: GCP GovCloud environments for compatibility with FedRAMP-certified tenants.
- Commercial: (Default) Standard cloud deployment typically used for private and public sector organizations that do not require isolated government-specific infrastructure.
Select the scope
- Select the scope for this cloud instance:
- Organization: (Default) A collection of GCP projects that are managed centrally.
- Folder: A GCP folder can contain projects, folders, or a combination of both projects and folders.
- Project: A specific GCP project.
Choose the scan mode
- Specify the scanning infrastructure for your cloud instance by selecting one of the following scan modes:
- Cloud Scan: (Recommended) Security scanning is performed in the Cortex XSIAM cloud environment.
-
Scan with Outpost: Security scanning is performed on infrastructure deployed to a cloud account owned by you. If you select this option, choose the outpost account to use for this instance.
Note
Scanning with an outpost may require additional GCP permissions and may incur additional CSP costs.
Configure advanced settings (optional)
-
Click Show advanced settings to define the following advanced settings:
- Instance Name: Enter a unique instance name or leave it empty to be automatically populated. The automatic naming convention is
GCP- or `GCP-`<organizationID>. Cortex XSIAM does not prevent you from reusing instance names, but it is best practice to use a unique name for every cloud instance. - Deployment Method: Select whether you want to onboard with a Cortex-generated IaC template or to perform a manual deployment:
- Infrastructure as Code: (Recommended) Automatically provisions all required cloud resources and permissions using an IaC template.
- Manual: Select this option if your organization requires manual provisioning to meet internal security and compliance policies. If you choose to onboard manually, follow the manual onboarding instructions.
- Scope Modifications: Use these settings to fine-tune your GCP scope. You can modify the scope by including or excluding specific regions. Additionally, if you selected an organization or folder as the scope, you can modify the scope by including or excluding specific folders or projects. For more details, see Apply region or account filters.
- Additional Security Capabilities: Choose which security capabilities you want to benefit from. Some security capabilities are enabled by default and can be modified. Adding security capability typically requires additional cloud provider permissions. For detailed information on the permissions required, see Cloud service provider permissions.
- Data security posture management: An agentless data security scanner that discovers, classifies, protects, and governs sensitive data.
- Registry scanning: A container registry scanner that scans registry images for vulnerabilities, malware, and secrets. For more details, see Configure registry scanning for cloud accounts.
- Serverless functions scanning: Implement serverless scanning to detect and remediate vulnerabilities within serverless functions during the development lifecycle. Seamless integration into CI/CD pipelines enables automated security scans for a continuously secure pre-production environment.
- Automation: Use automation to pre-configure a list of integrations and associated commands to automate security issue responses. Commands can be utilized individually or as part of custom playbooks for issue remediation.
- Log Level: (Optional - for Automation only) Configure the automation integration logging level. Possible values are:
- Off (Default)
- Debug
- Verbose
- Log Level: (Optional - for Automation only) Configure the automation integration logging level. Possible values are:
- Agentless disk scanning: (Recommended) Implement agentless disk scanning to remotely detect and remediate vulnerabilities during the development lifecycle.
- Cloud Tags: Define tags and tag values to be added to any new resource created by Cortex XSIAM in GCP. Note: The
managed_by = paloaltonetworkstag is automatically added to all resources. This tag is mandatory. You cannot edit or remove this tag. - Log Collection Configuration: To maximize security coverage, include the collection of audit logs (GCP Pub/Sub). This may require additional cloud service provider permissions. For detailed information on the permissions required, see Cloud service provider permissions.
-
Connect to GCP Workspace: Gain a comprehensive view of your Google Workspace identities and security. This provides you with detailed information on your users, groups, and organizational units, and collects security event logs to help you detect threats, improve your security posture, and meet compliance requirements.
Note
If you want to connect to your GCP Workspace, you must first complete onboarding with the option disabled. Once the GCP cloud instance is created, perform the steps detailed in Connect Google Workspace with your GCP cloud instance.
- Upload unknown files to WildFire: Use this option to upload unknown files scanned during registry image scans to WildFire for detonation analysis. This option expands malware detection by allowing WildFire to analyze new samples found in your registry images. When a detonation result returns a malicious verdict, the system re-evaluates the relevant registry image and creates a malware finding.
Notes
- The file types sent for WildFire analysis depend on the platform type. WildFire accepts files up to 300 MB in size.
- This setting applies only to registry image scans and is enabled by default for new GCP instances. For existing instances, this setting is disabled by default to preserve the current behavior. You can enable it at any time by editing the instance configuration.
- Your cloud provider may charge standard outbound data transfer (egress) fees when scanning with an Outpost.
- Instance Name: Enter a unique instance name or leave it empty to be automatically populated. The automatic naming convention is
Save the configuration and download the template
- Click Save. Cortex XSIAM generates a Terraform authentication template based on the settings you configured in the GCP onboarding wizard. Cortex XSIAM creates an instance in the pending state. For details on pending instances, see Pending cloud instances.
-
Click Download Terraform to download the template file and then click Close.
The Terraform authentication template is reusable and can be applied as many times as you want to create new instances with the settings you defined in the GCP onboarding wizard. The Terraform authentication template is valid for seven days from when it was created.
Next step: Deploy the Terraform authentication template in GCP.
How to onboard GCP with foundational configuration
Follow the foundational configuration GCP onboarding wizard to enable audit log collection and asset discovery, and Cortex XSIAM creates a custom authentication template to be deployed in GCP.
LICENSE TYPE:
Onboarding Google Cloud Platform (GCP) using the foundational configuration is included with Cortex XSIAM NG SIEM, Cortex XSIAM Enterprise, and Cortex XSIAM Enterprise+ licenses. For more details on the CSP onboarding tiers and licensing, see Understand CSP onboarding tiers and licensing.
This procedure describes foundational onboarding, which includes support of asset discovery and audit log collection. For the procedure describing comprehensive onboarding, see How to onboard Google Cloud Platform.
After completing the prerequisites, follow these instructions to onboard your Microsoft Azure environment to Cortex XSIAM.
Access the Azure onboarding wizard in Cortex XSIAM:
- In Cortex XSIAM, select Settings → Data Sources & Integrations.
- On the Data Sources & Integrations page, click + Add New.
- On the Add Data Sources or Integrations page, search for Google Cloud Platform (GCP), then hover over it and click Add.
Select the scope
Select the scope for this cloud instance:
- Organization: (Default) A collection of GCP projects that are managed centrally.
- Folder: A GCP folder can contain projects, folders, or a combination of both projects and folders.
- Project: A specific GCP project.
Configure advanced settings (optional)
Click Show advanced settings to define the following advanced settings:
- Instance Name: Enter a unique instance name or leave it empty to be automatically populated. The automatic naming convention is
GCP-<projectID>or GCP-<organizationID>. Cortex XSIAM does not prevent you from reusing instance names, but it is best practice to use a unique name for every cloud instance. - Scope Modifications: Use these settings to fine-tune your GCP scope. You can modify the scope by including or excluding specific regions. Additionally, if you selected an organization or folder as the scope, you can modify the scope by including or excluding specific projects or folders. For more details, see Apply region or account filters.
- Additional Security Capabilities: Choose which security capabilities you want to benefit from. Some security capabilities are enabled by default and can be modified. Adding security capability typically requires additional cloud provider permissions. For detailed information on the permissions required, see Cloud service provider permissions.
- Automation: Use automation to pre-configure a list of integrations and associated commands to automate security issue responses. Commands can be utilized individually or as part of custom playbooks for issue remediation.
- Cloud Tags: Define tags and tag values to be added to any new resource created by Cortex XSIAM in GCP. Note: The
managed_by = paloaltonetworkstag is automatically added to all resources. This tag is mandatory. You cannot edit or remove this tag. - Log Collection Configuration: To maximize security coverage, include the collection of audit logs using GCP Pub/Sub.
- Additional Security Capabilities: Choose which security capabilities you want to benefit from. Some security capabilities are enabled by default and can be modified. Adding security capability typically requires additional cloud provider permissions. For detailed information on the permissions required, see Cloud service provider permissions.
Save the configuration and download the template
- Click Save. Cortex XSIAM generates a Terraform authentication template based on the settings you configured in the GCP onboarding wizard. Cortex XSIAM creates an instance in the pending state. For details on pending instances, see Pending cloud instances.
-
Click Download Terraform to download the template file and then click Close.
The Terraform authentication template is reusable and can be applied as many times as you want to create new instances with the settings you defined in the GCP onboarding wizard. The Terraform authentication template is valid for seven days from when it was created.
Next step: Deploy the Terraform authentication template in GCP.
Deploy the Terraform authentication template in GCP
When you have downloaded the Terraform template file in the onboarding wizard, you must connect to Google Cloud Console to create a stack using the template file.
Prerequisites
Before you begin, ensure you have:
- A GCP account.
- Permission to create the required resources in Google Cloud Deployment Manager.
- Installed Terraform on your local machine. You can download Terraform from the official Terraform website and follow the installation instructions for your operating system.
- Installed the GCP gcloud CLI tool.
- Reviewed the introduction to Terraform for Cloud service provider (CSP) onboarding to understand the underlying logic of how Terraform interacts with your cloud environment.
- Open your local terminal (Command prompt, PowerShell, or Terminal).
-
Log in to your GCP account using the gcloud CLI:
gcloud auth login
- Create a directory on your local machine to store and run the Terraform code. If you have more than one GCP connector, you need a separate directory for each one:
mkdir -p ~/terraform/gcp-connector-1
- Navigate to the directory you created and extract the Terraform files. Ensure all necessary Terraform files are present (
main.tf,template_params.tfvars, etc).
You must not delete or move the Terraform files from this folder. It will prevent you from being able to edit your cloud instance in the future.
cd ~/terraform/gcp-connector-1 tar -xzvf <your_template>.tar.gz
- Initialize Terraform in your project directory:
terraform init
- Apply your Terraform configuration using the downloaded parameter file. When prompted, enter the project ID if you configured one in the onboarding wizard:
terraform apply --var-file=template_params.tfvars
The Terraform template is deployed.
When the template is successfully uploaded to GCP, the initial discovery scan is started. When the scan is complete, you can view your cloud assets in Asset Inventory.
Connect Google Workspace with your GCP cloud instance
To gain full visibility into GCP permissions and identity relationships, highlight risks, and offer proper remediation, Cortex XSIAM must ingest user, group, and group membership data from your Google Workspace. You need to create a custom role in Google Workspace, assign it specific privileges, and then assign your Cortex XSIAM service account to this newly created role.
Prerequisite
Ensure you have the Super Admin role in Google Workspace.
1. Create a Cortex XSIAM role in Google Workspace
- Log in to your Google Admin Console.
- In the left menu, select Account → Admin roles.
- Click Create new role.
- In the Role info page, enter a name for the role, such as
cortex-cloud-security-role. - (Optional) Enter a description.
- Click Continue.
- In the Select Privileges page, in the Privilege Name list, under Admin API, select the following privileges:
- Organization Units > Read (This automatically selects the Organizational Units > Read permission. Leave it selected.)
- Users > Read
- Groups > Read
- Click Continue and then click Create Role.
2. Assign the Cortex XSIAM service account to the created role
- In Cortex XSIAM, navigate to Settings → Data Sources & Integrations and select Google Cloud Platform (GCP) → View details.
- Identify the GCP cloud instance and click the instance name to open the details pane for that instance.
- In the details pane, click the more options icon at the top right corner and then select Authorization Details.
- Copy the value of Cortex discovery role.
- Log in to your Google Admin Console.
- In the left menu, select Account → Admin roles.
- Select the role created previously and click Assign role.
- Click Assign service accounts and paste the value of the Cortex discovery role. Click Add.
- Click Assign role.
Your Cortex XSIAM service account has been successfully granted the necessary permissions in Google Workspace to ingest user, group, and group membership data. It may take several hours for the results to appear in Cortex XSIAM, depending on the size of your cloud estate.
3. Enable Google Workspace in your GCP cloud instance
Prerequisites
- Ensure you have the organization ID of the Google Workspace you want to connect:
- Log in to your Google Admin Console. and navigate to Account → Account settings → Profile. Next to Customer ID is your organization ID.
- Ensure the organization ID you want to connect meets one of the following requirements:
- It must already be defined within your Domain Restricted Principles policy.
- It is the Workspace organization ID to which the GCP organization you have onboarded in this cloud instance belongs.
- In Cortex XSIAM, navigate to Settings → Data Sources & Integrations and select Google Cloud Platform (GCP) → View details.
- Identify the GCP cloud instance and click Configuration at the right end of the cloud instance row.
- In the Google Cloud Provider (GCP) onboarding wizard, click Show advanced settings.
- Under Discovery Enhancements, select Connect to GCP Workspace.
- Enter the organization ID of your Google Workspace. You can enter more than one organization ID.
- Click Save.
You have successfully enabled the Google Workspace in your GCP cloud instance.
Monitor GCP resources inside service perimeters
A service perimeter can provide an additional layer of security for your GCP projects. It serves as a fortified boundary around your Google Cloud resources. While resources inside the perimeter can communicate freely, the perimeter is designed to prevent unauthorized communication to Google Cloud services beyond its confines.
To enable Cortex XSIAM to scan assets and resources within your GCP perimeter, you must authorize Cortex XSIAM's identities to access the perimeter from within GCP. If you have a perimeter set up in your GCP project and you have not authorized Cortex XSIAM's identities to scan the perimeter, you will receive the following error:
Request is prohibited by organization's policy. vpcServiceControlsUniqueIdentifier: {{<GCP-perimeter-ID>}}
Note
Each GCP cloud instance is assigned a scope within GCP. If the scope, whether it be organization, folder, or project, includes any projects with a service perimeter, this procedure must be performed for that cloud instance to authorize Cortex XSIAM to scan the resources in the perimeter.
Obtain Cortex XSIAM identity details
- In your Cortex XSIAM tenant, select Settings → Data Sources & Integrations.
- Hover over the Google Cloud Platform (GCP) row and select View Details.
- In the Cloud Instances page, identify the GCP instance with the perimeter, right-click it and select Details.
- In the details pane, click the more options icon and select Authorization Details.
- The authorization values that you need to add as approved identities in GCP are listed in the Authorization Details dialog box.
Add Cortex XSIAM authorization values to GCP perimeter
- Log into Google Cloud Platform Console.
- Navigate to VPC Service Controls.
- In the list of perimeters, select the perimeter to which you want to grant access to Cortex XSIAM.
- In the Service perimeter details screen, click Edit.
- In the Edit service perimeter screen, select Ingress policy.
- In the Ingress rules pane, click Add an ingress rule.
- Enter a Title for the ingress rule.
- In the From section, under Identities, select Select identities & groups.
- Click Add identities. In the Add identities pane, under Search identities, paste Cortex discovery role from Cortex XSIAM's Authorization Details dialog box. If there are more authorized values, paste each of them under Search identities. Click Add identities.
- In the To section, under Resources, select Select projects.
- Click Add projects. In the Add projects pane, select the relevant projects.
- Under Operations or IAM roles, select All operations.
- Click Next to add an egress rule.
- In the Egress rules pane, click Add an egress rule.
- Enter a Title for the egress rule.
- In the From section, under Identities, select Select identities & groups.
- Click Add identities. In the Add identities pane, under Search identities, paste Cortex discovery role from Cortex XSIAM's Authorization Details dialog box. If there are more authorized values, paste each of them under Search identities. Click Add identities.
- In the To section, under Resources, select Select projects.
- Click Add projects. In the Add projects pane, select the relevant projects.
- Click Save. Confirm the changes and click Confirm.
The Cortex XSIAM authorization values have been added as approved identities in GCP.
Oracle Cloud Infrastructure cloud onboarding
Cortex XSIAM onboarding is the process of connecting your Oracle Cloud Infrastructure (OCI) cloud environment to Cortex XSIAM so it can continuously monitor and protect your cloud resources. This process establishes secure, least-privilege access using API Key authentication with an RSA key pair. Cortex XSIAM stores a reference to the private key and uses it to sign API requests to your OCI tenancy. You gain visibility into your cloud infrastructure through resource discovery, IAM permission analysis, and identity security monitoring.
The onboarding process provisions the infrastructure in your OCI tenancy required to monitor and analyze your cloud resources. The sections below describe the available capabilities, the resources created, the security model, and the step-by-step onboarding process.
Onboard Oracle Cloud Infrastructure
Use the cloud onboarding wizard to integrate an Oracle Cloud Infrastructure (OCI) environment with Cortex XSIAM. The onboarding wizard requires minimal configuration to set up the integration. OCI onboarding operates at the tenancy (organization) scope and uses Cortex XSIAM-managed scanning. Optionally, configure the advanced settings to enable additional security capabilities such as agentless disk scanning and registry scanning, or to refine the compartment scope.
Cortex XSIAM generates a Terraform authentication template based on the configuration settings. The authentication template creates an IAM policy, an IAM group, and supporting identity resources in your OCI tenancy that grant Cortex XSIAM the required permissions. Execute the authentication template in OCI to complete the onboarding process. Executing the authentication template notifies Cortex XSIAM of the execution details. Cortex XSIAM then creates a new cloud instance.
Prerequisites for onboarding OCI
Permissions
Before you begin to onboard Oracle Cloud Infrastructure (OCI) to Cortex XSIAM, ensure that you have the necessary permissions:
- In Cortex XSIAM, you must have a Cortex XSIAM role with Data Sources - View & Edit permissions (to add/configure cloud accounts in Cortex XSIAM). This role is included in the following built-in roles: Instance Administrator, Security Admin, and IT Admin.
- In OCI, your credentials must include permissions for the following:
- Creation of identity groups (for more information, refer to Managing Groups)
- Policies (for more information, refer to How Policies Work)
- Tag namespaces in the root compartment (for more information, refer to Tags and Tag Namespace Concepts)
Additional prerequisites
Before you begin onboarding OCI, ensure that:
- You have access to the Oracle Cloud Infrastructure console.
- If you plan to enable audit log collection, you must first configure the OCI connector for log collection.
- If you want to use bucket replication, see Object Storage Replication
Configure the OCI connector for log collection
In order to enable audit log collection in Cortex XSIAM, you must first create an OCI service connector. For more details, see Creating a Connector with a Logging Source. After you have created the OCI service connector, you can proceed to Onboard Oracle Cloud Infrastructure and enable collection of audit logs.
- Log in to the OCI Console. Open the navigation menu and go to Analytics and AI → Connector Hub.
- On the Connectors page, click Create connector.
- On the Create Connector page, enter a descriptive name for the new connector (for example,
CortexCloud_Log_Exporter). Click Create connector. - Select the Compartment where you want to store the new connector resource.
- Set the Source service to Logging.
- Set the Target service to Object Storage. This is the storage bucket that Cortex XSIAM will read from.
- Under Configure target, configure the storage bucket to send the log data to:
- Compartment: Select the compartment that contains the bucket that you want to use.
- Bucket: Select the name of the bucket that you want to send the data to.
- Object Name Prefix: (Optional) Enter a prefix value.
- Show additional options: (Optional) Click this link to enter values for batch size (in MBs) and batch time (in milliseconds).
- (Optional) Add one or more tags to the connector. Select Show Advanced Options to show the Add Tags section.
- Click Create. When the connector is ready, the connector's details page opens.
How to onboard Oracle Cloud Infrastructure
License type
This feature is included with a Cortex XSIAM Premium license. It is also included with any other Cortex XSIAM license that has the Cloud Runtime Security or Cloud Posture Security add-ons.
For Cortex XSIAM NG SIEM, Cortex XSIAM Enterprise, and Cortex XSIAM Enterprise+ licenses, see How to onboard Oracle Cloud Infrastructure with foundational configuration .
After completing the prerequisites, follow these instructions to onboard your Oracle Cloud Infrastructure (OCI) environment to Cortex XSIAM.
Access the OCI onboarding wizard in Cortex XSIAM:
- In Cortex XSIAM, select Settings → Data Sources & Integrations.
- On the Data Sources & Integrations page, click + Add New.
- On the Add Data Sources or Integrations page, search for Oracle Cloud Infrastructure, then hover over it and click Add.
Set the instance name (optional)
-
In Instance Name, enter a unique instance name.
If you don't enter a name, Cortex XSIAM applies the default name,
OCI-<TENANCY_OCID>. Cortex XSIAM does not prevent you from reusing instance names, but it is best practice to use a unique name for every cloud instance.
Configure advanced settings (optional)
- Click Show advanced settings to define the following advanced settings:
-
Scope Modifications: You can modify the scope by including or excluding specific Compartments. If you choose to include specific compartments, only the specified compartments and their sub-compartments will be included. This setting will affect future sub-compartments added to your OCI environment after onboarding. If you choose to exclude specific compartments, this setting will also affect their sub-compartments.
Note: The root compartment is always onboarded, and only the sub-compartment scope can be modified.
Excluded compartments are not visible in Cortex XSIAM.
- Additional Security Capabilities: Choose which security capabilities you want to benefit from. Some security capabilities are enabled by default and can be modified. Adding security capability typically requires additional cloud provider permissions. For detailed information on the permissions required, see Cloud service provider permissions.
- Data security posture management: An agentless data security scanner that discovers, classifies, protects, and governs sensitive data.
- Registry scanning: A container registry scanner that scans registry images for vulnerabilities, malware, and secrets. For more details, see Configure registry scanning for cloud accounts.
- Serverless functions scanning: Implement serverless scanning to detect and remediate vulnerabilities within serverless functions during the development lifecycle. Seamless integration into CI/CD pipelines enables automated security scans for a continuously secure pre-production environment.
- Agentless disk scanning: (Recommended) Implement agentless disk scanning to remotely detect and remediate vulnerabilities during the development lifecycle.
- Cloud Tags: Define tags and tag values to be added to any new resource created by Cortex XSIAM in OCI. Note: The
managed_by = paloaltonetworkstag is automatically added to all resources. This tag is mandatory. You cannot edit or remove this tag. - Log Collection Configuration: To maximize security coverage, enable the collection of audit logs. This may require additional cloud service provider permissions. For detailed information on the permissions required, see Cloud service provider permissions. Enter the following details for each preexisting OCI storage bucket that you intend to use for log collection:
- Region: The geographic OCI region where the bucket is located. For example, "us-phoenix-1".
- Bucket Name: The name of the OCI storage bucket.
- Compartment OCID: The Oracle Cloud Identifier (OCID) of the compartment that contains the bucket.
-
Save the configuration and download the authentication template
- Click Save. Cortex XSIAM generates a Terraform authentication template based on the settings you configured in the OCI onboarding wizard. Cortex XSIAM creates an instance in the pending state. For details on pending instances, see pending-cloud-instances.
-
Download the OCI authentication template by clicking Download Terraform.
The Terraform authentication template is reusable and can be executed as many times as you want to create new instances with the settings you defined in the wizard. The Terraform authentication template is valid for seven days from when it was created.
- Click Close.
Next step: Deploy the Terraform authentication template in OCI.
How to onboard Oracle Cloud Infrastructure with foundational configuration
Onboarding Oracle Cloud Infrastructure (OCI) using the foundational configuration is included with Cortex XSIAM NG SIEM, Cortex XSIAM Enterprise, and Cortex XSIAM Enterprise+ licenses. For more details on the CSP onboarding tiers and licensing, see Understand CSP onboarding tiers and licensing.
This procedure describes foundational onboarding, which includes support of asset discovery and audit log collection. For the procedure describing comprehensive onboarding, see How to onboard Oracle Cloud Infrastructure.
After completing the prerequisites, follow these instructions to onboard your Oracle Cloud Infrastructure (OCI) environment to Cortex XSIAM.
Access the OCI onboarding wizard in Cortex XSIAM
- In Cortex XSIAM, select Settings → Data Sources & Integrations.
- On the Data Sources & Integrations page, click + Add New.
- On the Add Data Sources or Integrations page, search for Oracle Cloud Infrastructure, then hover over it and click Add.
Set the instance name (optional)
-
In Instance Name, enter a unique instance name.
If you don't enter a name, Cortex XSIAM applies the default name,
OCI-<TENANCY_OCID>. Cortex XSIAM does not prevent you from reusing instance names, but it is best practice to use a unique name for every cloud instance.
Configure advanced settings (optional)
- Click Show advanced settings to define the following advanced settings:
-
Scope Modifications: You can modify the scope by including or excluding specific Compartments. If you choose to include specific compartments, only the specified compartments and their sub-compartments will be included. This setting will affect future sub-compartments added to your OCI environment after onboarding. If you choose to exclude specific compartments, this setting will also affect their sub-compartments.
Note: The root compartment is always onboarded, and only the sub-compartment scope can be modified.
Excluded compartments are not visible in Cortex XSIAM.
- Cloud Tags: Define tags and tag values to be added to any new resource created by Cortex XSIAM in OCI. Note: The
managed_by = paloaltonetworkstag is automatically added to all resources. This tag is mandatory. You cannot edit or remove this tag. - Log Collection Configuration: To maximize security coverage, enable the collection of audit logs. This may require additional cloud service provider permissions. For detailed information on the permissions required, see Cloud service provider permissions. Enter the following details for each preexisting OCI storage bucket that you intend to use for log collection:
- Region: The geographic OCI region where the bucket is located. For example, "us-phoenix-1".
- Bucket Name: The name of the OCI storage bucket.
- Compartment OCID: The Oracle Cloud Identifier (OCID) of the compartment that contains the bucket.
-
Save the configuration and download the authentication template
- Click Save. Cortex XSIAM generates a Terraform authentication template based on the settings you configured in the OCI onboarding wizard. Cortex XSIAM creates an instance in the pending state. For details on pending instances, see Pending cloud instances.
-
Download the OCI authentication template by clicking Download Terraform.
The Terraform authentication template is reusable and can be executed as many times as you want to create new instances with the settings you defined in the wizard. The Terraform authentication template is valid for seven days from when it was created.
- Click Close.
Deploy the Terraform authentication template in OCI
When you have downloaded the Terraform template file in the onboarding wizard, you must connect to Oracle Cloud Infrastructure (OCI) CLI tool to deploy the template file. For more information about the OCI CLI tool, refer Oracle documentation. to create a stack using the template file.
Prerequisite
Prerequisites
Before you begin, ensure you have:
- An Oracle Cloud Infrastructure account and the tenancy OCID.
- Permission to deploy a custom template and create its resources in OCI.
- Installed Terraform on your local machine. You can download Terraform from the official Terraform website and follow the installation instructions for your operating system.
- Installed the OCI CLI tool, and authenticated with a key pair or token-based credentials.
- Reviewed the introduction to Terraform for Cloud service provider (CSP) onboarding to understand the underlying logic of how Terraform interacts with your cloud environment.
- Log in to OCI and open Cloud Shell.
-
Create a directory on your local machine to store and run the Terraform code. If you have more than one OCI connector, you need a separate directory for each one. For example:
mkdir -p ~/terraform/oci-connector-1
-
Navigate to the directory you created and extract the Terraform files. Ensure all necessary Terraform files are present (
main.tf,template_params.tfvars, and so on). For example:cd ~/terraform/oci-connector-1 tar -xzvf <your_template>.tar.gz.
-
Initialize Terraform in your project directory:
terraform init
It might take several seconds until the initialization is complete.
-
Apply your Terraform configuration using the downloaded parameter file. When prompted to enter a value, enter the tenancy OCID.
terraform apply --var-file=template_params.tfvars
-
When prompted, review the actions the Terraform will perform, and approve them by entering
yes.The Terraform template is deployed.
-
Since non-default domains are bound to a specific home region, you must manually enable replication to interact with domain resources across different geographical regions. To enable replication:
- Open the Oracle Cloud Console and log in.
- Open the main navigation menu and select Identity & Security → Identity → Domains.
- Select the name of the Identity Domain created by the Terraform script you downloaded from Cortex XSIAM.
- On the domain details page, go to the region section and click the Actions menu (three dots) for the target region you need to collect resources from.
- Select Enable replication and confirm.
Replication may take up to 60 minutes depending on the complexity of your identity setup.
Once the status changes from Enabling to Enabled, the domain is ready to handle identities in that specific region.
When the template is successfully uploaded to OCI, the initial discovery scan is started. When the scan is complete, you can view your cloud assets in Asset Inventory.
Alibaba Cloud cloud onboarding
Cortex XSIAM onboarding is the process of connecting your Alibaba Cloud cloud environment to Cortex XSIAM so it can continuously monitor and protect your cloud resources. This process establishes secure, least-privilege access using OIDC-based Workload Identity Federation, so no static credentials are stored or exchanged. You gain visibility into your cloud infrastructure through resource discovery and IAM permission analysis.
The onboarding process provisions the infrastructure in your Alibaba Cloud account required to monitor and analyze your cloud resources. The sections below describe the available capabilities, the resources created, the security model, and the step-by-step onboarding process.
Alibaba security capabilities and deployment planning
Security capabilities and deployment planning
Plan your deployment by reviewing the security capabilities available for Alibaba Cloud. The onboarding process deploys the capabilities using a single Terraform connector template. Alibaba Cloud onboarding currently supports two capabilities: Discovery and Permissions. No additional capabilities (such as agentless disk scanning, data security, audit logs, registry scanning, serverless scanning, or automation) are currently supported.
Core capabilities (Discovery and Permissions)
The Discovery and Permissions capabilities are mandatory and are deployed automatically when you onboard an Alibaba Cloud account to Cortex XSIAM. Discovery inventories cloud resources across supported services, while Permissions analyzes IAM configurations and monitors access policies.
| Module | Identity created | Resources created | Purpose | Regional scope |
|---|---|---|---|---|
| Discovery | CortexPlatformRole (RAM role) | RAM Role, Custom Policy, Policy Attachment, OIDC Provider | Read-only discovery and inventory of Alibaba Cloud resources across ECS, OSS, VPC, RDS, SLB, CEN, ActionTrail, and NAS. | All supported internal regions. |
| Permissions | CortexPlatformRole (RAM role) | RAM Role, Custom Policy, Policy Attachment, OIDC Provider | IAM permission analysis and monitoring across RAM users, roles, groups, and policies. | Global (RAM is a global service). |
Read-only permissions by service
The Terraform template provisions a custom RAM policy with 46 read-only permissions grouped by Alibaba Cloud service:
| Service | Permissions |
|---|---|
| ECS | DescribeInstances, DescribeDisks, DescribeInstanceRamRole, DescribeSecurityGroups, DescribeSecurityGroupAttribute |
| OSS | ListBuckets, GetBucketInfo, GetBucketLogging, GetBucketVersioning |
| RAM | ListUsers, ListRoles, ListGroups, ListPolicies, GetPolicy, GetPolicyVersion, ListPoliciesForUser, ListPoliciesForRole, ListPoliciesForGroup, GetLoginProfile, GetUserMFAInfo, ListAccessKeys, GetPasswordPolicy |
| RDS | DescribeDBInstances, DescribeDBInstanceIPArrayList, DescribeDBInstanceSSL, DescribeDBInstanceEncryptionKey, DescribeDBInstanceTDE, DescribeDBInstanceAttribute |
| VPC | DescribeVpcs, DescribeFlowLogs, DescribeVpnConnections, DescribeVpnConnection, DescribeSslVpnServers |
| SLB | DescribeLoadBalancers, DescribeLoadBalancerAttribute, DescribeVServerGroups, DescribeMasterSlaveServerGroups, DescribeCACertificates, ListTLSCipherPolicies, DescribeLoadBalancerHTTPSListenerAttribute |
| ActionTrail | DescribeTrails, GetTrailStatus |
| CEN | DescribeCens, DescribeCenInterRegionBandwidthLimits |
| NAS | DescribeFileSystems |
Alibaba Cloud resource inventory
The onboarding process creates resources in the customer's Alibaba Cloud account using the Terraform authentication template. All resources are created at the account level.
| Resource type | Resource name | Purpose |
|---|---|---|
| alicloud_ram_role | CortexPlatformRole | RAM role that Cortex XSIAM assumes via OIDC federation. Configured with a trust policy that accepts GCP OIDC tokens with the configured audience. |
| alicloud_ram_policy | Custom Policy | RAM policy with 46 read-only permissions across ECS, OSS, RAM, RDS, VPC, SLB, ActionTrail, CEN, and NAS services. |
| alicloud_ram_role_policy_attachment | Policy Attachment | Attaches the custom read-only policy to the CortexPlatformRole. |
| (OIDC Provider) | OIDC Identity Provider | Alibaba Cloud OIDC identity provider that trusts GCP OIDC tokens issued by Cortex XSIAM with the audience alibaba-cortex-wif-<tenantID>. |
Alibaba Cloud security model and authentication
Cortex XSIAM implements a defense-in-depth security model built on the principle of least privilege. Every permission granted to Cortex XSIAM is read-only and has a clear purpose. This section describes the security principles, authentication mechanisms, and operational safeguards that protect your Alibaba Cloud environment.
Security principles
- No static credentials: Cortex XSIAM never stores or exchanges static access keys. Authentication relies entirely on OIDC-based Workload Identity Federation with short-lived temporary credentials.
- Minimal permissions by default: Cortex XSIAM operates with the minimum read-only permissions scoped to specific Alibaba Cloud services. No write permissions are provisioned. The permission set cannot be expanded through the onboarding process.
- Permission transparency: Every permissions is mapped to a specific Alibaba Cloud API action. The complete permission set is visible in the Terraform authentication template before deployment, allowing security review prior to granting access.
- Cloud-native identity and trust: Authentication uses Alibaba Cloud's native OIDC provider and STS service. All permissions and resources are provisioned through a customer-reviewed Terraform template to ensure transparency.
Authentication mechanisms
Cortex XSIAM uses a single OIDC-based identity flow for all operations (discovery and permissions analysis). Alibaba Cloud onboarding uses one identity for all access. The authentication flow works as follows:
- The Cortex Service Account in the Cortex-managed GCP project obtains a GCP ID token with the audience
alibaba-cortex-wif-<tenantID>. - The token is presented to the OIDC Identity Provider in the customer's Alibaba Cloud account.
- The OIDC provider validates the token and Cortex XSIAM calls Alibaba Cloud STS
AssumeRoleWithOIDCatsts.<region>.aliyuncs.com. - STS issues temporary credentials with a session name of
Cortex-WIF-Sessionand a maximum session duration of 55 minutes (3300 seconds). - Cortex XSIAM uses the temporary credentials to assume the CortexPlatformRole and perform read-only discovery and permissions analysis.
Security considerations
Cortex XSIAM incorporates the following security considerations to protect your Alibaba Cloud environment:
- No persistent credentials: OIDC tokens have a maximum expiry of 1 hour (3600 seconds) and STS sessions expire after 55 minutes (3300 seconds). Credentials are never stored. Instead, they are obtained on demand and discarded after use.
- Single identity, minimal blast radius: A single RAM role with read-only permissions limits the blast radius. Compromising the role grants no write access to any Alibaba Cloud resource.
- Auditability: All Cortex XSIAM operations are logged in Alibaba Cloud ActionTrail under the session name Cortex-WIF-Session. SOC teams can monitor and audit all Cortex access patterns independently.
- Operational control: The CortexPlatformRole can be disabled or deleted at any time in the Alibaba Cloud console to immediately revoke Cortex XSIAM access.
Onboard Alibaba Cloud
Use the cloud onboarding wizard to integrate an Alibaba Cloud environment with Cortex XSIAM. The onboarding wizard requires minimal configuration to set up the integration. You can optionally define the scope of the Alibaba regions and have tags automatically added to any new resources created by Cortex XSIAM.
Cortex XSIAM generates a Terraform authentication template based on the configuration settings. The authentication template grants required permissions to Cortex XSIAM. Execute the authentication template in Alibaba Cloud and then manually connect the cloud instance to complete the onboarding process.
Prerequisites for onboarding Alibaba Cloud
Permissions
Before you begin to onboard Alibaba Cloud to Cortex XSIAM, ensure that you have the necessary permissions:
- In Cortex XSIAM, you must have a Cortex XSIAM role with Data Sources - View & Edit permissions (to add/configure cloud accounts in Cortex XSIAM). This role is included in the following built-in roles: Instance Administrator, Security Admin, and IT Admin.
- In Alibaba Cloud, your credentials must have the necessary RAM permissions to deploy templates, manage roles and policies, as well as perform create and update operations for OIDC.
Additional prerequisites
Before you begin onboarding Alibaba Cloud, ensure that:
- You have added an OIDC provider for Cortex XSIAM in Alibaba Cloud.
- You have the Alibaba Cloud account ID of the account you want to onboard.
- You are logged into the Alibaba Cloud account.
- If you are onboarding your first Alibaba Cloud account, you must first request manual provisioning of the cloud scanning environment. Open a customer support ticket to have the cloud scan environment created and ensure that the environment is ready for you to start onboarding. (Attempting to onboard Alibaba Cloud without first having the cloud scanning environment created will result in the following UI error: "No valid outpost scan env ALIBABA_CLOUD".)
Required RAM permissions in Alibaba Cloud
Before onboarding Alibaba Cloud to Cortex XSIAM, ensure the user or role performing the onboarding has the necessary RAM permissions.
Required permissions for onboarding Alibaba Cloud account scope
Use the following template to create a custom policy with the permissions required for onboarding an Alibaba Cloud account to Cortex Cloud. The custom policy can be created in Alibaba Cloud RAM Console at Permissions → Policies → Create Policy → Script and attach the policy to the RAM user or role that will run the Terraform apply.
{ "Version": "1", "Statement": [ { "Effect": "Allow", "Action": [ "ram:CreateRole", "ram:GetRole", "ram:UpdateRole", "ram:DeleteRole", "ram:ListRoles", "ram:CreatePolicy", "ram:GetPolicy", "ram:GetPolicyVersion", "ram:DeletePolicy", "ram:ListPolicies", "ram:ListPolicyVersions", "ram:CreatePolicyVersion", "ram:DeletePolicyVersion", "ram:SetDefaultPolicyVersion", "ram:AttachPolicyToRole", "ram:DetachPolicyFromRole", "ram:ListPoliciesForRole", "sts:GetCallerIdentity" ], "Resource": "*" } ] }
Add Cortex XSIAM as an OIDC provider in Alibaba Cloud
In order to establish trust between Cortex XSIAM and Alibaba Cloud, you must add an OpenID Connect (OIDC) provider. If you already have an existing OIDC provider for accounts.google.com, you can add Cortex XSIAM as an audience to the existing provider. Otherwise, create a new OIDC provider.
Add the audience to an existing OIDC provider
- In Alibaba Cloud Console, navigate to RAM → Integrations → SSO.
- In SSO, select the OIDC tab.
- In the list of IdPs, identify the existing entry for GCP (
accounts.google.com) and click it. - Under Client ID, click Add.
- Enter alibaba-cortex-wif- as the audience value for the new client ID where corresponds to the Cortex XSIAM Project ID. Save the changes.
Create a new OIDC provider
Before you begin, obtain the Cortex XSIAM Project ID of your tenant by clicking on the User menu and then selecting About.
- In Alibaba Cloud Console, navigate to RAM → Integrations → SSO.
- In SSO, select the OIDC tab.
- Click Create IdP.
- In Create IdP, enter the IdP Name. For example,
CortexGCPProvider. - In Issuer URL, enter the GCP IdP URL:
https://accounts.google.com. - In Client ID, enter:
alibaba-cortex-wif-<accountID>where<accountID>corresponds to the Cortex XSIAM Project ID. - In Fingerprint, click Auto-add to automatically retrieve and add the signing certificate fingerprint for
accounts.google.com. - (cn-hongkong accounts only) In Fingerprint, click Add and enter the following SHA1 fingerprint:
932bed339aa69212c89375b79304b475490b89a0. - Click Add Fingerprint.
- Save the changes.
How to onboard Alibaba Cloud
License type
This feature is included with a Cortex XSIAM Premium license. It is also included with any other Cortex XSIAM license that has the Cloud Runtime Security or Cloud Posture Security add-ons.
After completing the prerequisites, follow these instructions to onboard your Alibaba Cloud environment to Cortex XSIAM.
Access the Alibaba Cloud onboarding wizard in Cortex XSIAM:
- In Cortex XSIAM, select Settings → Data Sources & Integrations.
- On the Data Sources & Integrations page, click + Add New.
- On the Add Data Sources or Integrations page, search for Alibaba Cloud, then hover over it and click Add.
Enter an instance name
- Enter a unique instance name or leave it empty to be automatically populated. The automatic naming convention is
ALIBABA-``. Cortex XSIAM does not prevent you from reusing instance names, but it is best practice to use a unique name for every cloud instance.
Configure advanced settings (optional)
- Click Show advanced settings to define the following advanced settings:
- Scope Modifications: Use these settings to fine-tune your Alibaba Cloud scope, you can modify the scope by including or excluding specific regions.
- Cloud Tags: Define tags and tag values to be added to any new resource created by Cortex XSIAM in Alibaba Cloud. Note: The
managed_by = paloaltonetworkstag is automatically added to all resources. This tag is mandatory. You cannot edit or remove this tag.
Save the configuration
- Click Save. Cortex XSIAM generates a Terraform authentication template based on the settings you configured in the Alibaba Cloud onboarding wizard.
Note: If the following error appears, contact support: "Validation failed: No valid managed outpost found for cloud provider ALIBABA_CLOUD".
- Click Download Terraform to download the Terraform authentication template.
The Terraform authentication template is downloaded. To complete the process, deploy the Terraform authentication template in Alibaba Cloud.
Deploy the authentication template
Prerequisites
Before you begin, ensure you have:
- Installed Terraform on your local machine. You can download Terraform from the official Terraform website and follow the installation instructions for your operating system.
- Installed the Alibaba Cloud CLI tool.
- Log in to your Alibaba Cloud console and open Cloud Shell.
-
Create a directory on your local machine to store and run the Terraform code. If you have more than one Alibaba Cloud cloud instance, you need a separate directory for each one:
mkdir -p ~/terraform/alibaba-cloud-connector-1
-
Navigate to the directory you created and extract the Terraform files from the compressed archive you downloaded previously. Ensure all necessary Terraform files are present (main.tf, template_params.tfvars, and so on).
Important
Do not delete or move the Terraform files from this folder. It will prevent you from being able to edit your cloud instance in the future.
cd ~/terraform/alibaba-cloud-connector-1 tar -xzvf <your_template>.tar.gz.
-
Initialize Terraform in your project directory:
terraform init
-
Apply your Terraform configuration using the downloaded parameter file:
terraform apply --var-file=template_params.tfvars
- When prompted, review the actions the Terraform will perform and approve them by entering yes.
The Terraform template is deployed. To complete the onboarding of your Alibaba Cloud environment, proceed to manually connect the pending cloud instance.
Alibaba Cloud post-deployment verification
After you have deployed the authentication template in Alibaba Cloud, verify that it was successfully deployed. InCortex Cloud, select Data Sources & Integrations → Cloud Accounts. Verify the following:
- The original cloud instance remains in "Pending" state. For more details on pending instances, see Understand pending instances.
- A new cloud instance appears in the cloud accounts list (separate from the pending instance).
- The new cloud instance shows status "Connected".
- The discovery scan starts automatically for every discovered account.
- Assets appear in the Asset Inventory as discovery progresses.
Troubleshooting Alibaba Cloud onboarding
If no new cloud instance appears, ensure you manually connect the cloud instance to create the instance from the pending cloud instance.
Outpost onboarding
License type: This feature is included with a Cortex XSIAM Premium license. It is also included with any other Cortex XSIAM product that has the Cloud Runtime Security add-on.
An outpost is a dedicated set of infrastructure resources that extends the reach of Cortex XSIAM into your environment. It serves as a secure, localized point for scanning assets across cloud providers and on-premises workloads.
By establishing a trusted relationship between Palo Alto Networks and your environment, the outpost allows for deep security analysis, such as identifying vulnerabilities or classifying sensitive data, while ensuring that your live workloads remain unaffected. This architecture helps you maintain strict data residency and compliance by performing scans locally within a demarcated area of your network.
Important: Outpost scan is an alternative to the recommended standard cloud scan. Cloud scan is recommended because it is fully managed by Palo Alto Networks and incurs minimal compute costs for your organization. Outpost scan is an advanced deployment model reserved for specific data residency or architectural requirements.
Basic, standard outposts are the recommended deployment path for most organizations. Cortex XSIAM generates a Terraform template tailored to the values you enter in the outpost creation wizard, and you run that template in your CSP account to provision every resource the outpost needs, such as VPC or VNet, subnets, storage, secret vault, IAM roles or service accounts, scanner managed identities, and the trust relationship back to Cortex XSIAM.
This approach gives you the fastest, most consistent path to coverage while keeping the number of manual steps low. Cortex owns the resource definitions, naming conventions, and network topology, and you own the CSP account they run in.
What outposts include
A standard outpost deployment covers the full outpost lifecycle end to end:
- Provisioning. Cortex-generated Terraform creates all outpost infrastructure in your CSP account, including networking, storage, secret vault, IAM roles, scanner managed identities, and optionally, for Azure, the Entra ID app registration and its federated identity credentials.
- Trust establishment. The template configures the trust relationship between your CSP account and Cortex XSIAM automatically, using federated identity credentials rather than long-lived secrets.
- Registration. Once the Terraform apply completes for both the outpost and the CSP onboarding overall, your cloud environment sends a registration callback to Cortex XSIAM, and the outpost transitions from Pending to Connected.
- Ongoing scanning. After the outpost reaches Connected, Cortex schedules scans against the resources you onboard.
What's Next?
- Review outpost fundamentals
- Plan your outpost
- Create your outpost
Outpost fundamentals and planning
License type: This feature is included with a Cortex XSIAM Premium license. It is also included with any other Cortex XSIAM product that has the Cloud Runtime Security add-on.
This topic explains the fundamentals for planning and deploying outpost infrastructure.
Important: While outposts provide maximum control over the scanning environment, cloud scan mode is the recommended default for most organizations.
When to choose outpost scan
Cloud scan offers lower operational overhead, faster onboarding, and Palo Alto Networks assumes most of the associated cloud compute costs.
Outpost scan mode should typically only be reserved for specific architectural requirements or strict data residency constraints.
If you determine you do need outpost scanning, consider the following differences between the scan modes, which might impact your decision.
| Cloud Scan (Recommended) | Outpost Scan |
|---|---|
| Configure a managed outpost when there is sufficient trust between you and Cortex XSIAM. Cortex accesses your environment more extensively and with less mediation. | <p>Choose to deploy and manage your own outpost: </p><ul><li>If you operate in a high-regulated market with a healthy “mistrust” of vendors.</li><li>For compliance with certain regulations for which Cortex XSIAM is not compliant “out of the box.”</li></ul><p>In these cases, you might prefer to keep your data within your own network boundary.</p> |
| Most of the cloud resources involved are charged to Palo Alto Networks instead of to you, so scan costs are reduced. | This mode requires additional cloud provider permissions and may incur additional cloud costs. |
| Cortex-managed outposts require zero management from you. | Outposts incur some additional maintenance overhead. This includes securing the outpost, managing the necessary IAM roles and permissions, upgrading versions, and adjusting cloud provider quotas to meet workload demands. Actively manage your capacity and quotas to meet the workload requirements. |
| For DSPM, your actual data is accessible to Palo Alto Networks, not just metadata. Rest assured, your data are deleted after scanners have completed. Zero trust security is used to secure your data in Palo Alto Networks-owned accounts. | For DSPM, only metadata is accessible to Palo Alto Networks, not your actual data. |
| DSPM on SaaS (such as for Snowflake and Office 365) is currently supported only for cloud scan. | DSPM on SaaS (such as for Snowflake and Office 365) is not supported for outpost scan. |
| Organizations cannot enforce strict Entra ID governance on outposts using the BYOA deployment model. | Organizations with strict Entra ID governance requirements can deploy outposts using the BYOA model. |
Outpost security concepts and component handling
This section presents outpost-related concepts and a high-level overview of how outposts perform scanning on your resources and data without putting them at risk. For a deeper understanding, contact your Palo Alto Networks representative.
| Concept | Description |
|---|---|
| Trust model | Cortex XSIAM interacts with your environment via dedicated IAM roles within the outpost. This establishes a secure trust relationship that adheres to the principle of least privilege. |
| Data security and residency | Outposts utilize a regionally symmetric architecture, processing data locally within the same cloud region and provider where it resides. Only metadata is ever sent back to Cortex XSIAM. |
| Scan operations | Scanning is performed by task-specific, ephemeral VMs built from hardened and continuously patched images. These instances are automatically terminated and all temporary resources are purged immediately after a scan completes. |
| Secure orchestration storage (such as buckets) | Scanner VMs operate in isolated private subnets without direct internet or Cortex XSIAM access. They communicate exclusively through encrypted, cloud-native storage used for operational data and scan results, never raw customer data. |
| Temporary processing storage (such as artifact buckets) | For specific scans where direct data sharing is restricted, data is temporarily placed in encrypted regional storage for analysis. Cortex XSIAM has no read permissions on this storage, and all data is deleted immediately after the job finishes. |
| Scanner isolation | Each scanner VM is purpose-built with a strictly defined set of permissions and network access tailored to its specific job. This ensures complete compartmentalization between different scan types. |
| Data encryption | Security is enforced through universal encryption at rest and in transit. Advanced egress filtering locks down external traffic to verified destinations, and secrets are managed via your own cloud-native secret management service. |
Deployment criteria for a standard outpost
A basic, standard outpost is suitable for your organization if the following conditions apply to your environment:
- Your organization is comfortable running Cortex-generated Terraform in your CSP account.
- Default naming conventions, network topology, and resource configurations meet your governance requirements.
- You do not need to pre-create tenant-level identities, use your own VPC or VNet, or route egress through your own proxy.
Notes:
- Azure Entra ID app registration is supported.
- For custom outpost configurations, contact your Palo Alto Network representative for available options.
Outpost planning
Before creating outposts, we recommend you become familiar with how outposts work and then plan accordingly. For example, some points to consider include:
- A dedicated account is required for the outpost account. Make sure the dedicated account is free from other resources.
- Each cloud account (AWS account, Azure subscription, GCP project) can host only one outpost.
- An individual outpost instance is strictly bound to a single Cortex XSIAM tenant and cannot be used to scan resources belonging to a different tenant or organization.
- Using an outpost requires additional cloud provider permissions and may incur additional cloud costs.
- Familiarize yourself with the needed permissions and resources expected to be added to the outpost during creation.
For exact implementation details, contact your Palo Alto Networks representative.
Notes:
- Before you create your outpost, verify that your internet connection is active. An active internet connection is necessary for the notification to be sent to Cortex XSIAM to create the new outpost.
- (Azure) Due to limitations in Terraform, the Azure subscription name cannot contain blanks. Take this into account while onboarding.
What's next?
- Create your outpost
- View and manage existing outposts by navigating to Settings → Data Sources & Integrations → Outposts
Outpost creation workflow
License type: This feature is included with a Cortex XSIAM Premium license. It is also included with any other Cortex XSIAM product that has the Cloud Runtime Security add-on.
This page describes the overall flow for creating outposts for different CSPs.
Important: While outposts provide maximum control over the scanning environment, cloud scan mode is the recommended default for most organizations. For details, see When to choose outpost scan.
Creating an outpost comprises the following phases:
Phase 1: Planning
Determine if an outpost infrastructure meets your security needs.
Review Outpost fundamentals and planning to determine your outpost configuration.
Phase 2: Creating the outpost
Create your outpost running the outpost creation wizard in Cortex XSIAM to create an outpost authentication Terraform template. This template establishes trust with the CSP and grant the necessary permissions to Cortex XSIAM.
At this stage, the outpost is in Pending status.
Phase 3: Deploying the outpost
Deploy your outpost by executing a Terraform template in the CSP.
At this stage, the outpost is still in Pending status.
Phase 4: Onboarding the CSP
Run (or resume) the CSP onboarding wizard in Cortex to generate an authentication template for the relevant CSP.
Execute the authentication template in the CSP to onboard and ingest its data sources, using the outpost you created.
At this stage, the outpost is in Connected status.
Working with standard outposts
License type: This feature is included with a Cortex XSIAM Premium license. It is also included with any other Cortex XSIAM product that has the Cloud Runtime Security add-on.
Standard outposts are the recommended deployment path for most organizations. Cortex XSIAM generates a Terraform template tailored to the values you enter in the outpost creation wizard, and you run that template in your CSP account to provision every resource the outpost needs, such as VPC or VNet, subnets, storage, secret vault, IAM roles or service accounts, scanner managed identities, and the trust relationship back to Cortex XSIAM.
This approach gives you the fastest, most consistent path to coverage while keeping the number of manual steps low. Cortex owns the resource definitions, naming conventions, and network topology, while you own the CSP account they run in.
What standard outposts include
A standard outpost deployment covers the full outpost lifecycle end to end:
- Provisioning. Cortex-generated Terraform creates all outpost infrastructure in your CSP account, including networking, storage, secret vault, IAM roles, scanner managed identities, and (for Azure) the Entra ID app registration and its federated identity credentials.
- Trust establishment. The template configures the trust relationship between your CSP account and Cortex XSIAM automatically, using federated identity credentials rather than long-lived secrets.
- Registration. Once the Terraform apply completes for both the outpost and then the CSP onboarding, your cloud environment sends a registration callback to Cortex XSIAM, and the outpost transitions from Pending to Connected.
- Ongoing scanning. After the outpost reaches Connected, Cortex schedules scans against the resources you onboard.
Outpost deployment criteria
A standard outpost is suitable for your organization if the following conditions apply to your environment:
- Your organization is comfortable running Cortex-generated Terraform in your CSP account.
- Default naming conventions, network topology, and resource configurations meet your governance requirements.
- You do not need to use your own VPC or VNet, or route egress through your own proxy.
Notes:
- Azure Entra ID app registration is supported with standard outposts.
- For alternative, custom outpost deployment options, contact your Palo Alto Networks representative.
What's next?
Create a standard outpost
License type: This feature is included with a Cortex XSIAM Premium license. It is also included with any other Cortex XSIAM product that has the Cloud Runtime Security add-on.
Create an outpost to deploy a Cortex XSIAM outpost using infrastructure that Cortex XSIAM creates for a fast, consistent deployment with minimal manual configuration.
Step 1. Plan and prepare
Review the fundamentals and prerequisites before starting.
Notes:
- Before you create your outpost, verify that your internet connection is active. An active internet connection is necessary for the notification to be sent to Cortex XSIAM to create the new outpost.
- (Azure) Due to limitations in Terraform, the Azure subscription name cannot contain blanks. Take this into account while onboarding.
Step 2. Define the outpost with the outpost creation wizard
Start the outpost creation wizard:
- In Cortex XSIAM, navigate to Settings → Data Sources & Integrations → Outposts.
- Click New Outpost.
Tip: Alternatively, while onboarding your Cortex XSIAM with the cloud service provider (CSP) onboarding wizard, the wizard prompts you to choose a scan mode: Cloud scan or Outpost scan. When choosing Outpost scan, you have the opportunity to create your outpost. To start the cloud service provider (CSP) onboarding wizard, navigate to Settings → Data Sources & Integrations → Add New.
Perform the steps according to your CSP.
AWS
- Choose AWS.
- If you are using a FedRAMP-certified (Government) Cortex XSIAM tenant, you are able to choose between the following environments:
- Commercial: (Default) Standard cloud deployment typically used for private and public sector organizations that do not require isolated government-specific infrastructure.
- Government: AWS GovCloud environments for compatibility with FedRAMP-certified tenants.
- Enter the AWS account instance name.
- (Optional) Define tags and tag values to be added to any new resource created by Cortex in the cloud environment. Click Next.
- Click Download Terraform to download the Terraform template file.
Azure
When creating an outpost for a specific Azure subscription, the outpost account must be in the same Azure organization as the monitored subscriptions.
Important: If you want to deploy a Cortex XSIAM Azure outpost using your own pre-created Entra ID app registration, follow the instructions for Bringing your own Azure app (BYOA). This type of outpost is designed for organizations with strict governance policies that require control over Entra ID tenant-level resources.
- Choose Azure.
- If you are using a FedRAMP-certified (Government) Cortex XSIAM tenant, you are able to choose between the following environments:
- Commercial: (Default) Standard cloud deployment typically used for private and public sector organizations that do not require isolated government-specific infrastructure.
- Government: Microsoft Azure Government environments for compatibility with FedRAMP-certified tenants.
- Enter the instance name and the tenant ID of the Azure tenant in which you want to establish the outpost.\
\
Note: Due to limitations in Terraform, the Azure subscription name cannot contain blanks. - (Optional) Define tags and tag values to be added to any new resource created by Cortex in the cloud environment. Click Next.
- If you are deploying the outpost with your own pre-created Entra ID app registration:
- Click Show advanced settings and toggle Bring Your Own App (BYOA) on.
- Skip to the instructions for bringing your own Azure app (BYOA), without performing the steps here.
- Click Download Terraform to download the Terraform template file.
GCP
- Choose GCP.
- If you are using a FedRAMP-certified (Government) Cortex XSIAM tenant, you are able to choose between the following environments:
- Commercial: (Default) Standard cloud deployment typically used for private and public sector organizations that do not require isolated government-specific infrastructure.
- Government: GCP Assured Workloads for compatibility with FedRAMP-certified tenants.
- Enter the project ID of the GCP project.
- (Optional) Define tags and tag values to be added to any new resource created by Cortex in the cloud environment. Click Next.
- Click Download Terraform to download the Terraform template file.
Step 3. Execute the template in the CSP to deploy the outpost
In the previous step, you downloaded the Terraform template file in the outpost creation wizard.
Now, you log in to your CSP and execute the Terraform template file.
Perform the steps according to your CSP.
AWS
- Prerequisites: Before you begin, ensure you have:
- An AWS account.
- Permission to create a stack and its resources in AWS.
- Installed Terraform on your local machine. You can download Terraform from the official Terraform website and follow the installation instructions for your operating system.
- Installed the AWS CLI tool and configured your profile with the
aws configure ssowizard.
- Open your local terminal (Command prompt, PowerShell, or Terminal).
-
Log in to your AWS account using the AWS CLI:
aws sso login --profile <my-profile>
<my-profile>is the profile you configured with theaws configure ssowizard. -
Create a directory on your local machine to store and run the Terraform code. If you are creating more than one outpost, you need a separate directory for each one:
mkdir -p ~/terraform/aws-outpost-1
-
Navigate to the directory you created and extract the Terraform files.
cd ~/terraform/aws-outpost-1 tar -xzvf <your_template>.tar.gz
-
Initialize Terraform in your project directory:
terraform init
-
Apply your Terraform configuration using the downloaded parameter file. When prompted, enter the subscription ID:
terraform apply --var-file=template_params.tfvars
- When prompted, review the actions Terraform will perform and approve them by entering yes.
The Terraform template is deployed, and your outpost is created in pending status.
To view all outposts and their details, navigate to Settings → Data Data Sources & Integrations → Outposts.
Azure
Important: If you are deploying the outpost with your own pre-created Entra ID app registration, and you are ready to execute the template in Azure, skip to the instructions for deploying your own Azure app (BYOA), without performing the steps here.
- Prerequisites: Before you begin, ensure you have:
- An active Azure subscription.
- Installed the Azure CLI tool.
- Permission to deploy a custom template and create its resources in Microsoft Azure ("Owner" or "Contributor" on the designated outpost subscription scope, and Active Directory "Cloud Application Administrator" or "Application Administrator" privileged roles).
- Installed Terraform 1.9.4 or above on your local machine. You can download Terraform from the official Terraform website and follow the installation instructions for your operating system.
- A static egress IP assigned to the machine running this Terraform. This is used to configure the Azure Storage IP whitelist (Recommended). Without this, future runs of this Terraform may fail on Azure storage configurations.
- Open your local terminal (Command Prompt, PowerShell, or Terminal).
-
Log in to your Azure account using the Azure CLI:
az login
-
If prompted, select the subscription_id of the designated subscription, or run:
az account set --subscription <subscription_id>
Where
<subscription_id>is the subscription ID of the designated subscription. -
Create a directory on your local machine to store and run the Terraform code. If you are creating more than one outpost, you need a separate directory for each one:
mkdir -p ~/terraform/azure-outpost-1
-
Navigate to the directory you created and extract the Terraform files.
cd ~/terraform/azure-outpost-1 tar -xzvf <your_template>.tar.gz
-
Initialize Terraform in your project directory:
terraform init
-
Apply your Terraform configuration using the downloaded parameter file. When prompted, enter the subscription ID:
terraform apply --var-file=template_params.tfvars
- When prompted for
var.storaage_account_ip_whitelist, you can leave it empty to enable access from any public IP to the storage accounts. We recommend you to limit access to selected IPs. To limit access, enter a comma-separated list of public IP addresses, including your local machine's egress IP (to enable the completion of the Terraform run). For example:8.8.8.8, 8.8.4.4 - Review the actions Terraform will perform and approve them by entering yes.
-
It is important to create a backup of the Terraform state file using one of the following methods:
Back up the
terraform.tfstateandterraform.tfstate.backupfiles or use Terraform backend to save the state.- Create copies of the
terraform.tfstateandterraform.tfstate.backupfiles. These can then be moved to the working folder to allow Terraform to upgrade or destroy the created resources as necessary.
- Create copies of the
- Ensure you're using a backend block in your Terraform configuration. For more information, see the Backend block configuration overview.
The Terraform template is deployed, and your outpost is created in pending status.
To view all outposts and their details, navigate to Settings → Data Sources & Integrations → Outposts.
GCP
- Prerequisites: Before you begin, ensure you have:
- A GCP account
- Permission to create the required resources in Google Cloud Deployment Manager
- Installed Terraform on your local machine. You can download Terraform from the official Terraform website and follow the installation instructions for your operating system.
- Installed the GCP gcloud CLI tool
- Open your local terminal (Command Prompt, PowerShell, or Terminal).
-
Log in to your GCP account using the gcloud CLI:
gcloud auth login
-
Create a directory on your local machine to store and run the Terraform code. If you are creating more than one outpost, you need a separate directory for each one:
mkdir -p ~/terraform/gcp-outpost-1
-
Navigate to the directory you created and extract the Terraform files.
cd ~/terraform/gcp-outpost-1 tar -xzvf <your_template>.tar.gz
-
Initialize Terraform in your project directory:
terraform init
-
Apply your Terraform configuration using the downloaded parameter file. When prompted, enter the project ID:
terraform apply --var-file=template_params.tfvars
- When prompted, review the actions Terraform will perform and approve them by entering yes.
The Terraform template is deployed, and your outpost is created in pending status.
To view all outposts and their details, navigate to Settings → Data Sources & Integrations → Outposts.
Step 4. Verify the outpost
After executing the Terraform:
- Check FICs: In the Azure portal, go to your App Registration → Certificates & secrets → Federated credentials. You should see federated identity credentials created by Cortex.
- Check Cortex XSIAM: The outpost should appear as Pending in the Cortex XSIAM Outposts page at Settings → Data Sources & Integrations → Outposts.
The necessary permissions are granted and a notification is sent to Cortex XSIAM with the execution details.
What's next?
Start (or continue) the CSP onboarding by running and executing the CSP onboarding wizard to generate an authentication template for the relevant CSP (AWS, GCP, Azure).
Working with Bringing your own Azure app (BYOA) outposts
License type: This feature is included with a Cortex XSIAM Premium license. It is also included with any other Cortex XSIAM product that has the Cloud Runtime Security add-on.
Use the Bring Your Own App (BYOA) custom outpost to deploy a Cortex XSIAM Azure outpost using your own pre-created Entra ID app registration. This type of outpost is designed for organizations with strict governance policies that require control over Entra ID tenant-level resources.
Important! Once deployed, the outpost mode cannot be changed. If you deploy with BYOA, you cannot switch to a non-BYOA outpost deployment later (or vice versa). Choose your mode before deployment.
How BYOA outposts differ from standard outposts
With a standard Azure outpost without BYOA, Cortex generates the app registration and its federated identity credentials in your tenant during Terraform apply, using tenant-scoped Application.ReadWrite.All.
With BYOA:
- You (not Cortex) own the app registration in your Entra ID directory.
- The Terraform runner holds only object-scoped ownership on that one app registration, not any tenant-wide permission.
- Cortex never writes to your tenant beyond that single app registration.
Who provides what?
The following table presents what your provide vs. what Cortex creates for you.
| You create (once) | Cortex creates during Terraform apply |
|---|---|
| The Entra ID app registration and its service principal | All federated identity credentials on your app registration |
| Optionally, the scanner managed identities (UAMIs) | All outpost infrastructure (storage, networking, scanner VMs) |
| Ownership of the app registration for the Terraform runner | Scanner-managed identities (unless you provide your own) |
Work flow
The following work flow presents a high-level order of tasks to configure and work with Azure BYOA outposts:
- Check and meet the prerequisites.
- Create the app registration and service principal in your Entra ID tenant, either with a shell script Palo Alto Networks provides or in the Azure portal. Save the IDs for use in the next task.
- Run the Create Outpost wizard to define the outpost using BYOA app registration IDs and download the Terraform. Deploy the outpost by executing the downloaded Terraform. You define the app registration IDs, and Cortex handles everything else, such as Federated Identity Credentials (FICs), managed identities, infrastructure, and role assignments.
- Verify the outpost.
- After outpost deployment, BYOA covers only the app-registration side of the outpost.
What's next?
Task 1: Meet the prerequisites for Azure BYOA outposts
This page lists the prerequisites and permission requirements for deploying an Azure outpost in Bring Your Own App registration (BYOA) mode.
Complete the checks below before you start the deployment procedure, whether you use the recommended shell script or the manual Azure portal path.
Important: Before you begin, ensure that you have Cortex XSIAM console access with the outpost creation entitlement.
Step 1. Recognize the identities involved in BYOA outpost deployment
The following distinct identities are involved in BYOA deployment.
- App Registration Creator: The user that initially sets up the app registration and service principal (either by running a script or manually using the Azure portal).\
\
Ensure the identity that runs the setup script or performs the manual Azure portal steps holds theApplication Developerrole (or higher) on the tenant. - Terraform Runner Identity: The Azure identity that deploys the outpost by executing
terraform apply, and the same identity used for all future outpost upgrades. This can be either a user account (for example, an administrator signed in viaaz login) or a service principal that an authorized user impersonates. In either case, the identity must have the required permissions to create and manage the outpost's Azure resources.\
\
Ensure you have the object ID of the Terraform Runner Identity that executesterraform apply. You can retrieve the ID by running this command:az ad sp show --id <client-id> --query id -o tsv
Tip: Confusing which permissions are needed by which identity is the most common cause of deployment failure.
Step 2. Meet the tooling and account prerequisites
Confirm that the tooling and account requirements below are in place before you start any BYOA deployment path.
- Azure CLI: Version 2.x or later (for the recommended shell script approach), or Azure Portal access (for manual setup)
- Terraform: Version specified in the outpost bundle
- Cortex XSIAM account: Active account with Azure Outpost entitlement
- Azure subscription: A dedicated Azure subscription for the outpost. The subscription should not contain other workloads and should be free of other resources.
- Entra ID tenant: Identify the Entra ID tenant where you want the app registration to live. This is the "home tenant" that hosts (or trusts) the Azure subscriptions Cortex XSIAM scans. Do not create the app registration in a separate monitored-workload tenant, because Cortex authenticates from the home tenant into the monitored subscription.
Step 3. Set permissions by identity
The permissions your identities need differ by role and by lifecycle stage. Review the tables below to confirm that the App Registration Creator has the setup-time permissions and that the Terraform Runner Identity has the persistent deploy-and-upgrade permissions.
App Registration Creator permissions
The following permissions are needed only during initial setup. You can revoke the access that these permissions grant after setup.
| Role / permission | Scope | Why needed |
|---|---|---|
| <p>Application Developer (primary)</p><p>OR Application Administrator (as required only for adding a service principal as an owner of the app registration)</p><p> OR</p><p>Global Administrator (sufficient but overprivileged)</p> |
Entra ID tenant | <p>Create the app registration and service principal.</p><p>Add owners</p> |
| Privileged Role Administrator (optional) | Entra ID tenant | <p>Required only if granting the optional Application.Read.All admin consent for Entra ID app inventory.The optional Application.Read.All admin consent enables Cortex's Entra ID application inventory feature, which discovers and displays all app registrations and enterprise applications in your Entra ID tenant so you can see which applications have access to your Azure resources and detect over-privileged or unused apps. If you do not need this inventory, skip the Privileged Role Administrator role. The outpost itself deploys and scans normally without it.</p> |
Terraform Runner Identity permissions
The following permissions are persistent and must remain in place for the life of the outpost. They are relevant during deployment and when upgrading.
| Role / permission | Scope | Why needed |
|---|---|---|
| Owner of the BYO App Registration | Object-scoped (one AppReg only) | Add and/or remove federated identity credentials (FICs). Granted automatically by the setup script via --tf-runner-object-id <GUID>. |
| Contributor (or Owner, which also includes User Access Administrator) | Azure subscription | Provision outpost infrastructure: UAMIs, storage, networking, scanner VMs |
| User Access Administrator (or Owner, which also includes Contributor) | Azure subscription | Create role assignments between UAMIs and scanned resources |
Note: BYOA mode leverages a least-privilege security model by eliminating the need for tenant-level Microsoft Graph permissions. The Terraform runner service principal modifies the app registration and writes federated identity credentials strictly through direct object ownership. This ownership-based approach ensures secure resource isolation, keeping the app registration strictly scoped to its own environment so it does not read or enumerate other tenant applications. By relying on ownership rather than directory permissions, BYOA bypasses the need for tenant-level admin consent (such as Application.ReadWrite.OwnedBy), offering a highly secure alternative to the Application.ReadWrite.All permission used by standard outposts.
What's next?
If you encounter issues, review the outpost troubleshooting topic.
Proceed to Task 2: Create the app registration for the Azure BYOA outpost.
Task 2: Create the app registration for the Azure BYOA outpost
This page describes how to create the Azure Entra ID app registration that a Bring Your Own App (BYOA) outpost uses to authenticate into your monitored Azure subscription. Complete this task after you confirm the prerequisites and before you deploy the outpost.
Create the app registration using one of the following methods:
- With a shell script (recommended): A helper script runs the required Azure CLI commands in a single command, adds the Terraform runner as an owner of the app registration, and optionally creates the scanner managed identities in a resource group you control. Use this method when you can run bash on your workstation and want the fastest, least error-prone path.
- Manually in the Azure portal: You click through the Microsoft Entra ID blade to create the app registration, copy its identifiers, and add the Terraform runner as an owner. Use this method when you cannot run the shell script (for example, in a portal-only environment) or when your organization requires a visual audit trail of each step. The manual method does not create scanner-managed identities, so Cortex creates them for you during outpost deployment.
With a shell script (recommended)
Start with this task to deploy a Cortex XSIAM Azure outpost using your own pre-created Entra ID app registration (BYOA).
Run a helper shell script called setup-byo-app-registration.sh that creates the app registration, creates its service principal, and grants the Terraform runner the ownership it needs to attach federated identity credentials later.
Note: This approach is the preferred alternative to creating the app registration manually in the Azure portal because it completes the required actions in a single command and prevents the most common deployment failures.
Shell script step 1: Decide what the script provisions
What you decide to provision determines the prerequisites, the script arguments, and the items you will need to provide to the Cortex XSIAM wizard. Choose between:
- App registration only. The script creates the app registration and its service principal. Cortex creates the scanner managed identities (UAMIs) for you during outpost deployment. This is the default and the right choice for most organizations.
- App registration and scanner managed identities. The script creates the app registration and its service principal, and also creates scanner UAMIs (agentless, DSMP, registry, serverless, and proxy) in a resource group that you specify. The script grants the Terraform runner the role assignment it needs to attach the UAMI federated identity credentials. Choose this configuration when your governance policies require that managed identities live in a customer-owned resource group with your own naming conventions, instead of in a Cortex-created resource group.
Later, when running the script, you determine what to provision by adding or omitting certain command flags and arguments.
Shell script step 2: Before you begin
Before you run the script, confirm that the prerequisites are met. Skipping any of these prerequisites causes the script to fail or causes a later terraform apply to fail.
Always required
These prerequisites are required whenever you run the script, regardless of what you are provisioning.
- Azure CLI: Version 2.x or later, installed on your workstation. The script runs on macOS, Linux, and Windows (via Git Bash or WSL2).
- Entra ID role: The identity that runs the script must hold the built-in
Application Developerrole on the tenant where the app registration lives. By default any user can register applications, but if your tenant has disabled user registration, an administrator must grant you this role. -
Terraform runner object ID: The object ID (a GUID) of the identity that runs
terraform applyfor this outpost. This is almost always a service principal, not a human user. You will retrieve the object ID in Step 3.Note: Do not confuse the object ID with the client ID. They are both GUIDs, both are returned by the Azure CLI, and they are not interchangeable.
- Entra ID tenant: The tenant where you want the app registration to live. This is usually your home tenant, not the tenant that hosts the monitored subscription. The script creates the app registration in whichever tenant your Azure CLI session is signed in to, so signing in to the correct tenant when you perform Step 4 is critical.
Also required when creating scanner managed identities
These permissions are required when you also use the script to create scanner managed identities.
- Azure RBAC roles: The identity that runs the script must hold either
Owneron the target subscription, orContributorplusUser Access Administratoron the target subscription, or the equivalent least-privilege combination on a pre-created resource group. For the least-privilege option, see the script'sREADME.md. - Subscription, resource group, and region: The Azure subscription ID where the UAMIs go, the name of the resource group to hold them (the script creates the group if it does not exist), and the Azure region for that resource group (for example,
australiaeastoreastus).
Shell script step 3: Look up the Terraform runner object ID (terminal, Azure CLI)
The script needs the object ID of the identity that runs terraform apply so that it can add that identity as an owner of the new app registration. Open a terminal and run one of the commands below, depending on whether the runner is a service principal or your own user account.
For a service principal (the typical production case):
az ad sp show --id <sp-client-id> --query id -o tsv
For your own user account (testing only):
az ad signed-in-user show --query id -o tsv
Copy the GUID that the command returns. This is the value you will pass to the script in Step 5 as the --tf-runner-object-id argument.
Shell script step 4: Sign in to the correct Entra ID tenant (terminal, Azure CLI)
The script creates the app registration in whichever tenant your Azure CLI session is currently signed in to, so you must sign in to the tenant where the app registration is meant to live. This is usually your home tenant, not the monitored subscription's tenant. If you are also creating scanner managed identities, the same tenant must host the target subscription.
In the same terminal, run:
az login --tenant <your-tenant-id>
After the browser flow completes, verify that the active session is on the correct tenant:
az account show --query tenantId -o tsv
If you are also creating scanner managed identities, set the active subscription to the one where the UAMIs go:
az account set --subscription <uami-subscription-id>
Shell script step 5: Run the helper shell script (terminal)
The helper shell script is called setup-byo-app-registration.sh and can be copied/pasted from The shell script for Azure app registration. A detailed technical reference in the format of a README is also available at that link.
Run the script with the arguments for the provisioning you choose. Use the form for app registration only, or the form for app registration plus scanner managed identities. The script prints progress messages to the terminal as each action completes.
Change into the directory where you created the script, such as:
cd <customer_managed>/app_registration/
To create the app registration only
Pass the required arguments: A unique display name for the new app registration, and the Terraform runner object ID you retrieved in Step 3.
./setup-byo-app-registration.sh \ --app-name <app-display-name> \ --tf-runner-object-id <tf-runner-object-id>
For example:
./setup-byo-app-registration.sh \ --app-name cortex-scan-platform-my-subscription \ --tf-runner-object-id 12345678-1234-1234-1234-123456789abc
The script:
- Creates a multi-tenant app registration.
- Creates its service principal.
- Adds the Terraform runner as an owner of the app registration. This is the production path. Without it, the
terraform applyfails on the first FIC create with HTTP 403: "Insufficient privileges." - Adds the currently-signed-in user as Owner (best-effort for interactive portal debugging).
To also create the scanner managed identities
Pass the same required arguments as for the app-registration-only form, plus the --add-uamis flag and additional required arguments that tell the script where to create the UAMIs.
./setup-byo-app-registration.sh \ --app-name <app-display-name> \ --tf-runner-object-id <tf-runner-object-id> \ --add-uamis \ --uami-subscription <uami-subscription-id> \ --uami-resource-group <uami-resource-group-name> \ --uami-location <azure-region>
For example:
./setup-byo-app-registration.sh \ --app-name cortex-scan-platform-my-subscription \ --tf-runner-object-id 12345678-1234-1234-1234-123456789abc \ --add-uamis \ --uami-subscription 3ee44654-9e52-41a0-82ca-f5d5956452d6 \ --uami-resource-group cortex-outpost-rg \ --uami-location australiaeast
The script does everything the app-registration-only form does, and then:
- Creates the scanner UAMIs in your resource group.
- Grants the Terraform runner
Managed Identity Contributoron that resource group. - Grants the new app registration's service principal
Managed Identity Operatoron the same resource group. The second role grant is what allows Cortex's scanner dispatcher to attach your UAMIs to scanner VMs at scan time.
Note: Adding scanner managed identities also activates the Bring Your Own Scanner Managed Identities toggle in the Cortex XSIAM wizard, which you will encounter when deploying the outpost.
Optional argument for scanner managed identities
When you create scanner managed identities, you can also pass an optional argument to customize the UAMI names.
| Argument | Default | What it does |
|---|---|---|
--uami-name-prefix <PREFIX> |
cortex |
Sets the prefix for UAMI names. Each UAMI is named <prefix>-<role>, for example cortex-agentless or myorg-dspm. |
If the script fails
If any step fails, the script automatically rolls back everything it created in this run, so that you can fix the issue and rerun the script from a clean state.
For full details on flags, rollback behavior, manual rollback after a successful run, and troubleshooting, see:
- Outpost troubleshooting.
- The
README.mdfile that ships in the same directory as the script. The readme contains full details on flags, rollback behavior, manual rollback after a successful run, and additional troubleshooting.
Shell script step 6: Copy the script output (terminal, editor)
When the script finishes, it prints a block of IDs to the terminal. In this step, you copy these IDs, which you will paste into the Bring Your Own Scanner Managed Identities section of the Cortex XSIAM outpost creation wizard when you deploy the outpost in the next task, Task 3. Keep the terminal output open, or save the lines to a temporary file, until you complete the next task.
These IDs from the link between your new app registration (and UAMIs, if you created them) and the outpost.
| Returned ID | Corresponding outpost creation wizard field | When returned |
|---|---|---|
customer_app_client_id | Application (Client) ID | Yes |
customer_sp_object_id | Service Principal Object ID | Yes |
customer_uami_agentless_id | Agentless Disk Scanner Resource ID | Returned if you created scanner managed identities |
customer_uami_dspm_id | DSPM Scanner Resource ID | Returned if you created scanner managed identities |
customer_uami_registry_id | Registry Scanner Resource ID | Returned if you created scanner managed identities |
customer_uami_serverless_id | Serverless Scanner Resource ID | Returned if you created scanner managed identities |
customer_uami_proxy_id | Egress Proxy Resource ID | Returned if you created scanner managed identities |
What's next, after creating the app registration with the script?
Your app registration is ready to use, along with your scanner managed identities if you created them.
Proceed to Task 3 to map the IDs to, and deploy, the outpost.
Manually in the Azure portal
This task is the manual alternative to the shell helper script approach, Create app registration and scanner identities with a shell script. You create the app registration, capture its identifiers, and add the Terraform runner as an owner by working through the Azure portal screens.
Note: The shell script is the preferred path because it completes the same actions in a single command and prevents the most common deployment failures, but this manual procedure is available when you cannot or do not want to run the script.
The manual procedure creates only the app registration and its service principal. It does not create scanner managed identities (UAMIs). Later, when you deploy the outpost, Cortex creates the scanner managed identities for you.
Note: To provide your own scanner managed identities, use the shell script approach and add the --add-uamis flag instead of this manual task.
Manual step 1: Before you begin
Confirm the prerequisites before you start. Skipping any of these causes the procedure to fail or causes a later terraform apply to fail.
- Azure portal access: A signed-in session for the Entra ID tenant where the app registration lives. This is usually your home tenant, not the monitored subscription's tenant.
- Correct Entra ID tenant: Before you open the portal, confirm which Entra ID tenant hosts the app registration. This is usually your home tenant, not the tenant that hosts the monitored subscription. If you sign in to the wrong tenant, you create the app registration in the wrong place, and the values you copy in Step 3 will not work with the Cortex XSIAM wizard.
- Entra ID role: Your account must hold the built-in
Application Developerrole on that tenant. By default any user can register applications, but if your tenant has disabled user registration, an administrator must grant you this role. Adding a service principal as an owner of the new app registration also requires theApplication Administratorrole on the tenant. - Terraform Runner Identity: The service principal that runs
terraform applyfor this outpost must already exist in the same tenant. You add it as an owner of the new app registration in Step 5.
Note: Third-party interfaces are subject to change. The screenshots provided in this topic might differ slightly from your current software version.
Manual step 2. Create the app registration (Azure portal)
The app registration is the Entra ID identity that Cortex uses to authenticate into your monitored Azure subscription. You create it from the Microsoft Entra ID blade in the Azure portal.
Note: Portal screens, field labels, and navigation paths reflect the cloud service provider's interface at the time of publication. Consult your cloud service provider's documentation for up-to-date instructions.
- Sign in to the Azure portal.
- Navigate to Microsoft Entra ID > App registrations. Confirm that the tenant selector in the top-right of the portal shows the correct Entra ID tenant. Click + New registration.
- Configure the new registration with the following values:
- Name: Choose a unique display name for the app registration, for example
cortex-cloud-outpost-primary. - Supported account types: Select Accounts in any organizational directory (Any Microsoft Entra ID directory - Multitenant). Multi-tenant is required because the app registration consents into the monitored tenant, which may be different from the home tenant. Choosing single-tenant here causes the Terraform plan to fail later with a
sign_in_audience must be 'AzureADMultipleOrgs'error. - Redirect URI: Leave this field blank. Cortex configures the redirect URI automatically during deployment.
- Name: Choose a unique display name for the app registration, for example
- Click Register.
Manual step 3: Copy the application (client) ID (Azure portal)
The application (client) ID is the value that Cortex uses to identify your app registration. You provide it to the Cortex XSIAM wizard and to the Terraform variables file in the next subtask.
On the Overview page of your new app registration, locate the Application (client) ID value. Copy it and save it in a temporary location. This value is your customer_app_client_id.
Manual step 4: Copy the service principal object ID (Azure portal)
The service principal object ID is a separate identifier from the application (client) ID. Both are GUIDs, both are returned by the Azure portal, and they are not interchangeable. Cortex needs both values in the next subtask.
On the Overview page of your app registration, in the Essentials section, click the Managed application in local directory link. The portal navigates to the Enterprise application view for the same identity.
On the Properties page of the enterprise application, locate the Object ID value.
Copy it and save it next to the application (client) ID. This value is your customer_sp_object_id.
Manual step 5: Add the Terraform runner as an owner of the app registration (Azure portal)
The Terraform runner needs to attach federated identity credentials to the app registration during terraform apply. Only owners of an app registration can attach federated identity credentials, so grant ownership now to avoid an HTTP 403 failure later.
Navigate back to Microsoft Entra ID > App registrations, and open your new app registration.
In the left navigation, select Owners, and then click Add owners.
In the search box, type the name or object ID of the Terraform Runner Identity. The service principal must be the same one that runs terraform apply for this outpost. Almost always this is a service principal, not a human user. If you select the wrong identity, the first federated identity credential creation fails at terraform apply time with an HTTP 403 / "Insufficient privileges" error.
Select the service principal in the search results, and click Select.
Manual step 6: Record the values (editor)
In this step, you copy these IDs, which you will paste into the Bring Your Own Scanner Managed Identities section of the Cortex XSIAM outpost creation wizard when you deploy the outpost in the next task, Task 3. Keep the terminal output open, or save the lines to a temporary file, until you complete the next task.
These IDs from the link between your new app registration (and UAMIs, if you created them) and the outpost.
| ID | Where to find this value | Where you use it next | Corresponding erraform variable (for reference only) |
|---|---|---|---|
| Tenant | Available on the app registration Overview page as Directory (tenant) ID, or under Microsoft Entra ID > Overview. | The Tenant ID field in the outpost creation wizard. | |
| App Client | The Application (client) ID field on the app registration Overview page. | The Application (Client) ID field in the outpost creation wizard | customer_app_client_id |
| Service Principal Object | The Object ID field on the enterprise application Properties page. | The Service Principal Object ID field in the outpost creation wizard | customer_sp_object_id |
| Agentless Disk Scanner | If you created scanner managed identities, navigate to Managed Identities > [Your Agentless identity] > Overview. | The Agentless Disk Scanner Resource ID field in the outpost creation wizard | customer_uami_agentless_id |
| DSPM Scanner | If you created scanner managed identities, navigate to Managed Identities > [Your DSPM identity] > Overview. | The DSPM Scanner Resource ID field in the outpost creation wizard | customer_uami_dspm_id |
| Registry Scanner | If you created scanner managed identities, navigate to Managed Identities > [Your Registry identity] > Overview. | The Registry Scanner Resource ID field in the outpost creation wizard | customer_uami_registry_id |
| Serverless Scanner | If you created scanner managed identities, navigate to Managed Identities > [Your Serverless identity] > Overview. | The Serverless Scanner Resource ID field in the outpost creation wizard | customer_uami_serverless_id |
| Egress Proxy | If you created scanner managed identities, navigate to Managed Identities > [Your Egress Proxy identity] > Overview. | The Egress Proxy Resource ID field in the outpost creation wizard | customer_uami_proxy_id |
What's next, after creating the app registration manually?
Your app registration is ready to use.
Continue to Task 3 to deploy the outpost by pasting the values from Step 6 into the wizard and running terraform apply .
Task 3: Deploy the Azure BYOA outpost
While creating the Azure BYOA outpost, you supply the relevant BYOA IDs to Cortex. This topic provides the instructions for deploying the outpost with the advanced BYOA settings.
Step 1. Create the Azure BYOA outpost in Cortex
- In Cortex XSIAM, navigate to Settings → Data Sources & Integrations → Outposts.
- Click New Outpost.
- In Cortex XSIAM, choose Azure.
- If you are using a FedRAMP-certified (Government) Cortex XSIAM tenant, you are able to choose between the following environments:
- Commercial: (Default) Standard cloud deployment typically used for private and public sector organizations that do not require isolated government-specific infrastructure.
- Government: Microsoft Azure Government environments for compatibility with FedRAMP-certified tenants.
- Enter the instance name and the Entra tenant ID of the Azure tenant in which you want to establish the outpost. The Entra tenant ID is validated automatically.\
\
Note: Due to limitations in Terraform, the Azure subscription name cannot contain blanks. - Click Show advanced settings and toggle Bring Your Own App (BYOA) on.
- Enter the following IDs:
- Tenant ID: Your Entra ID tenant ID, which is validated automatically.
- Application (client) ID: The Azure application ID, which you retrieved while creating and configuring the app registration in Task 2, either:
- Using the
customer_app_client_idvalue outputted by the helper shell script's output. - Manually, in the Azure portal's Register an application > Overview page.
- Using the
- Service Principal Object ID: The app's service principal object ID This you defined while creating and configuring the app registration in Task 2, either:
- Using the
customer_sp_object_idvalue outputted by the helper shell script's output. - Manually, in the Azure portal's Microsoft Entra ID → App registrations → <your AppReg> → Owners → Add owners page. You can find the value in the app registration's Overview page's Object ID field.
- Using the
- If you also created the scanner managed identities, enable the Bring Your Own Scanner Managed Identities toggle in the wizard and paste the UAMI resource IDs that you saved in Task 2 (either using the helper shell script's output or manually in the Azure portal).
- (Optional) Define tags and tag values to be added to any new resource created by Cortex in the cloud environment. Click Next.
- Click Download Terraform to download the Terraform template file.
Step 2. Execute the template in Azure to deploy the outpost
In the previous step, you downloaded the Terraform template file in the outpost creation wizard.
Now, you log in to your CSP and execute the Terraform template file.
Follow the instructions for deploying standard Azure outposts.
To view outposts and their details, navigate to Settings → Data Sources & Integrations → Outposts.
What's next?
Proceed to Task 4: Verify the BYOA outpost deployment.
Task 4: Verify the BYOA outpost deployment
This page lists the checks necessary for verifying that deployment is valid.
After running the Terraform and it completes successfully:
- Check FICs: In the Azure Portal, go to your App Registration → Certificates & secrets → Federated credentials. You should see federated identity credentials created by Cortex.
- Check Cortex XSIAM: The outpost should appear in the Cortex XSIAM console with status Connected.
- Check scanning: Cortex begins discovery and scanning after Azure has been onboarded. Confirm that the first scan starts automatically after deployment. The initial scan may take some time to begin. If no scan has started after a reasonable interval, you might need to re-download the outpost Terraform files and try again.
What's next?
Continue with Cortex XSIAM CSP onboarding.
The shell script for Azure app registration
The script described and included on this page is an example of how to provision the Azure resources that the Bring Your Own App (BYOA) feature needs. You can run it as-is, or treat it as a reference and create the equivalent resources by hand or via your own IaC.
The script creates the Entra-side identities and delegates the minimum Azure RBAC the Terraform runner needs, so that the subsequent terraform apply can attach all Federated Identity Credentials (FICs) without ever holding a client secret or any Entra-level powers of its own.
README-style details
The script supports the following modes:
| Mode | Flag | What it creates | What it delegates to the Terraform runner |
|---|---|---|---|
| A, app registration only | (default) | App registration and service principal | Ownership of the app registration |
| B, app registration and scanner identities | --add-uamis | All of Mode A, and the scanner User-Assigned Managed Identities (UAMIs) (agentless, dspm, registry, serverless, proxy) in a customer-owned resource group | App registration ownership and Managed Identity Contributor on the UAMI resource group |
Mode B additionally grants the BYO app registration's service principal the Managed Identity Operator role on the UAMI resource group, which Cortex's scanner-dispatcher needs at scan time to attach BYO UAMIs to scanner workload VMs. Without it, scans won't complete and stay stuck in Azure error 403 LinkedAuthorizationFailed).
The script prints a tfvars-style block to stdout; you wll paste those values into the Cortex outpost onboarding UI to continue the deployment.
Principals and permissions
The BYOA flow involves several principals with deliberately disjoint, least-privilege permission sets. There is no special "admin" role, whoever runs this script just needs the permissions listed below. The following table maps each principal to what it needs, who grants it, and at which scope.
| Principal | Permissions needed | Granted by | Scope |
|---|---|---|---|
Terraform runner (human or CI service principal, the one running terraform apply) | Entra: Owner of this one app registration. Mode B also: Managed Identity Contributor on this one UAMI resource group. Sub: Whatever the outpost Terraform itself needs (typically Contributor on the monitored sub, out of scope for this script). | This script (--tf-runner-object-id) | The one app registration and, in Mode B, the one UAMI resource group |
| BYO app registration / service principal (non-human, created by this script) | Sub: Read and scan roles on the monitored sub (granted via the Cortex onboarding URL, out of scope for this script). Mode B also: Managed Identity Operator on the UAMI resource group (so the scanner-dispatcher can attach BYO UAMIs to scanner VMs). | This script grants Managed Identity Operator (Mode B only). Sub-level scan roles are granted via the onboarding URL after terraform apply. | UAMI resource group (this script) and monitored sub (onboarding URL) |
| Scanner UAMIs (non-human, created by this script in Mode B) | Sub: Workload roles on the monitored sub (granted by the outpost Terraform later, not by this script). FIC trust is set up by terraform apply. | terraform apply (FICs) and outpost Terraform modules (workload roles) | Monitored sub and resource groups |
Who runs this script vs. who runs Terraform
The following activities happen, possibly by different identities (they may be the same identity):
| Running this script | Terraform runner (terraform apply) |
| Mode A needs: Entra: Application Developer (or equivalent, see below) | Mode A gets: Owner on the app registration (granted by this script) |
| Mode B also needs: Azure RBAC on the UAMI resource group: Contributor and User Access Administrator (or Owner) | Mode B also gets: Managed Identity Contributor on the UAMI resource group (granted by this script) |
Why the split exists
The split reflects a least-privilege model that keeps powerful roles out of long-lived automation identities.
You typically don't want the Terraform runner (especially a CI service principal stored in a pipeline secret store) to hold tenant-wide Application Developer or sub-wide User Access Administrator. Those are powerful, broad roles. So the model is:
- The person running this script holds the powerful, tenant- or sub-scoped permissions, but only briefly, to run it once.
- The script translates those into narrow, resource-scoped grants on the Terraform runner: Owner of one app registration, Managed Identity Contributor on one resource group.
- The Terraform runner can then attach all FICs at
terraform applytime, and reuse the same RBAC for every subsequentapplyordestroy, without ever needing to be re-elevated.
The --tf-runner-object-id flag is the linchpin: It's how the script delegates app-registration ownership (and in Mode B, UAMI resource group write) to the Terraform runner. Get this wrong (wrong GUID, wrong tenant, wrong kind of ID) and terraform apply will fail with Insufficient privileges on the FIC resources. See Troubleshooting.
How to identify each principal
Use the following commands to look up the object ID for each principal type.
| Principal | How to look it up |
|---|---|
| Terraform runner (user) | az ad signed-in-user show --query id -o tsv (run as that user) |
| Terraform runner (CI service principal) | az ad sp show --id <sp-client-id> --query id -o tsv |
| BYO app registration service principal (after running this script) | az ad sp show --id <customer_app_client_id> --query id -o tsv (returns customer_sp_object_id) |
| Scanner UAMIs (after running this script in Mode B) | az identity show --name <prefix>-<role> --resource-group <RG> --query id -o tsv |
Note: object_id is not client_id. Both are GUIDs, both come back from az, and they are not interchangeable. The script validates the Terraform-runner GUID resolves to a real User or service principal in the current tenant and prints tf-runner resolved as: user|service principal on success. If you see does not resolve to any user or service principal in this Azure AD tenant, you almost certainly pasted a client_id or logged into the wrong tenant.
Prerequisites
Before running the script, ensure the following tooling and identifiers are available.
- Azure CLI (
az), logged in (az login) against the app registration's home tenant (usually the customer tenant, not necessarily the monitored-subscription tenant). For Mode B that tenant must also home the target subscription. - POSIX
sh: macOS, Linux, or Windows via Git Bash or WSL2. - object_id: The GUID of the identity that will run
terraform apply. See Usage below for how to look it up.
Required permissions
The permissions the script-runner needs depend on the mode you invoke.
Mode A (app registration only):
| Layer | Role | Why |
|---|---|---|
| Entra | Application Developer (cf1c38e5-3621-4004-a7cb-879624dced7c) | Create app registrations and own or manage the ones you created. Covers az ad app create, az ad sp create, and az ad app owner add. |
| Azure RBAC | None | This mode never calls ARM. |
By default, any user can register applications, unless the tenant has set Microsoft Entra ID > User settings > Users can register applications to No. If so, an admin (Cloud Application Administrator, Application Administrator, or Global Administrator) must either flip the toggle, assign you Application Developer, or run the script for you.
Adding a service principal (vs. a user) as app registration Owner may additionally require the script-runner to hold the Application Administrator directory role.
Mode B (--add-uamis), all of Mode A, and one of:
- Easy: Contributor and User Access Administrator at subscription scope (or just Owner, which includes both).
- Least-privilege:
- Pre-create the UAMI resource group out-of-band.
- Grant the script-runner Managed Identity Contributor on that resource group.
- Grant the script-runner User Access Administrator on that resource group (so the script can grant the Terraform runner Managed Identity Contributor on the same resource group).
The Terraform-runner identity itself needs no special tenant-wide permissions. Being an Owner of this one app registration (Mode A) and Managed Identity Contributor on this one resource group (Mode B) is enough for it to attach all FICs.
What the script grants, and why
The script makes the following permission grants. Each is the minimum needed for a later stage of the BYOA flow to work, nothing is granted "just in case". Below is what each grant is, who receives it, and the concrete failure you'd hit without it.
| Grant | Recipient | Scope | Why it's needed | Symptom if missing |
|---|---|---|---|---|
| App registration ownership | Terraform runner | The one app registration | Owners of an app registration can add and remove credentials on it. The Terraform runner attaches Federated Identity Credentials (FICs) to the app registration at apply time, federating Cortex's GCP service account into the app registration so Cortex can authenticate without a client secret. Only an Owner, or a directory admin, may write FICs. | terraform apply fails with Insufficient privileges when creating the azuread_application_federated_identity_credential resources. |
| Managed Identity Contributor (Mode B) | Terraform runner | The UAMI resource group | Each scanner UAMI needs a self-FIC, a federated credential on the UAMI itself, trusting Cortex's GCP service account. Writing a FIC onto a UAMI is a write operation on the UAMI resource, which this role grants. This is what lets the Terraform runner attach the UAMI FICs without being a sub-Owner. | terraform apply fails with AuthorizationFailed on the UAMI FIC or write operations. |
| Managed Identity Operator (Mode B) | BYO app registration's service principal | The UAMI resource group | At scan time, not apply time, Cortex's scanner-dispatcher, acting as the BYO app registration service principal, creates scanner workload VMs with a UAMI attached. Azure validates "may this principal attach this identity?" via Microsoft.ManagedIdentity/userAssignedIdentities/assign/action, which is exactly what Managed Identity Operator grants. For Cortex-managed UAMIs this is implicit. For BYO UAMIs in a customer-owned resource group it must be granted explicitly. | Scans get stuck in error state with Azure 403 LinkedAuthorizationFailed on .../userAssignedIdentities/assign/action. |
Why these specific grants and not broader roles:
- App registration ownership instead of a directory role (for example, Application Administrator): Ownership is scoped to one app registration, so the Terraform runner can manage credentials on that single app and nothing else in the directory.
- Managed Identity Contributor instead of Contributor or Owner on the resource group: It grants UAMI CRUD (enough to write the self-FICs) but not unrelated resource or role-assignment powers.
- Managed Identity Operator instead of Contributor on the resource group: It grants only the
assign/actionthe scanner-dispatcher needs to attach UAMIs to VMs, not the ability to modify the UAMIs themselves.
What the script does not grant: No Microsoft Graph application permissions on the home tenant (the app registration never authenticates to itself), no admin consent on the monitored tenant (done later via the Cortex onboarding flow), and no sub-level scan or workload roles on the app registration or UAMIs (those are granted by the outpost Terraform or onboarding flow, not here).
Usage
Run the script with the arguments that match the mode you want, as shown below.
Look up the object_id (not the client_id) of the Terraform runner:
# User identity az ad signed-in-user show --query id -o tsv # Service principal (CI/CD) az ad sp show --id <sp-client-id> --query id -o tsv
Mode A, app registration only
This mode creates the app registration and its service principal, and adds the Terraform runner as Owner.
./setup-byo-app-registration.sh \ --app-name <APP_DISPLAY_NAME> \ --tf-runner-object-id <GUID> \ [--copy-to-clipboard]
Example:
./setup-byo-app-registration.sh \ --app-name cortex-scan-platform-my-subscription \ --tf-runner-object-id 12345678-1234-1234-1234-123456789abc
Mode B, app registration and scanner identities
This mode does everything Mode A does, and additionally creates the scanner UAMIs in a customer-owned resource group and grants the roles Mode B requires.
./setup-byo-app-registration.sh \ --app-name <APP_DISPLAY_NAME> \ --tf-runner-object-id <GUID> \ --add-uamis \ --uami-subscription <SUB-ID> \ --uami-resource-group <RG-NAME> \ --uami-location <REGION> \ [--uami-name-prefix <PREFIX>] \ [--copy-to-clipboard]
Example:
./setup-byo-app-registration.sh \ --app-name cortex-scan-platform-my-subscription \ --tf-runner-object-id 12345678-1234-1234-1234-123456789abc \ --add-uamis \ --uami-subscription 3ee44654-9e52-41a0-82ca-f5d5956452d6 \ --uami-resource-group cortex-outpost-rg \ --uami-location australiaeast
Flags
The following flags are supported.
| Flag | Description |
|---|---|
--app-name <NAME> | Required. Display name of the new app registration. Must be unique in the tenant. |
--tf-runner-object-id <GUID> | Required. Object ID of the user or service principal that will run terraform apply. Added as Owner of the app registration. With --add-uamis, also granted Managed Identity Contributor on the UAMI resource group. |
--add-uamis | Enable Mode B. Requires --uami-subscription, --uami-resource-group, and --uami-location. |
--uami-subscription <GUID> | Mode B. Azure subscription ID where the UAMIs will be created. |
--uami-resource-group <NAME> | Mode B. Resource group that will hold the UAMIs. Created if it doesn't exist. |
--uami-location <REGION> | Mode B. Azure region for the resource group and UAMIs, for example australiaeast or eastus. |
--uami-name-prefix <PREFIX> | Mode B, optional. Prefix for UAMI names. Default: cortex. Each UAMI is named <prefix>-<role>, for example cortex-agentless. |
--copy-to-clipboard | Also copy the tfvars output to the system clipboard. Auto-detects pbcopy, wl-copy, xclip, xsel, or clip.exe. |
--rollback --app-client-id <APP_ID> [--uami-* ...] | Manually delete a previously created app registration and service principal, and Mode B UAMIs. See Rollback. |
-h, --help | Show usage. |
Output
The script separates data from diagnostics so that its output can be piped or redirected.
The tfvars lines are written to stdout; all diagnostics go to stderr, so the output is pipe-safe.
Mode A:
app_registration_mode = "customer_managed" customer_app_client_id = "<APP_ID>" customer_sp_object_id = "<SP_OBJECT_ID>"
Mode B:
app_registration_mode = "customer_managed" customer_app_client_id = "<APP_ID>" customer_sp_object_id = "<SP_OBJECT_ID>" uami_mode = "customer_managed" customer_uami_agentless_id = "<UAMI_ARM_ID>" customer_uami_dspm_id = "<UAMI_ARM_ID>" customer_uami_registry_id = "<UAMI_ARM_ID>" customer_uami_serverless_id = "<UAMI_ARM_ID>" customer_uami_proxy_id = "<UAMI_ARM_ID>"
Paste these values into the Cortex outpost onboarding UI to continue the deployment. The UI drives the Terraform run that attaches the Federated Identity Credentials.
In Mode B, Terraform creates all Federated Identity Credentials (on the app registration and as UAMI self-FICs). No manual az federated-credential create commands are required.
Once the deployment completes, follow the Cortex onboarding flow to grant admin consent in the monitored tenant.
Rollback
The script supports both automatic rollback on failure and a manual rollback path.
On failure the script auto-rolls-back: An EXIT trap removes anything it created in this run (role assignments, UAMIs, app registration, in reverse order).
Manually, after a successful run:
# Mode A ./setup-byo-app-registration.sh --rollback --app-client-id <APP_ID> # Mode B (also deletes the scanner UAMIs; the resource group itself is # left intact since it may pre-exist and be shared with other workloads) ./setup-byo-app-registration.sh --rollback \ --app-client-id <APP_ID> \ --uami-subscription <SUB> \ --uami-resource-group <RG> \ --uami-name-prefix <PREFIX> # only if you used a non-default prefix
Note: If you've already run terraform apply, run terraform destroy first, otherwise the app registration or UAMIs disappear while Terraform still tracks FICs on them, causing drift on the next plan.
However, keep in mind that terraform destroy can fail if ephemeral scan resources (VMs, disks, snapshots, NICs) remain in the outpost resource group. If this occurs, manually delete the lingering resources (or the entire resource group) in the Azure portal, rerun terraform destroy, and follow the cleanup steps in the outpost module README. Additionally, to prevent accidental deletion, always keep your customer-created User-Assigned Managed Identities (UAMIs) in a separate, customer-owned resource group; any UAMIs placed in the outpost resource group will be wiped during destruction.
Troubleshooting
The following sections cover the non-obvious, BYO-specific failures. Generic issues (az not installed, not logged in, etc.) are clear from the script's own error output.
does not resolve to any user or service principal in this Azure AD tenant
The GUID is well-formed but doesn't match anything in the current tenant. Either:
- You're logged into the wrong tenant,
az login --tenant <tenant-id>and retry, or - You pasted the wrong kind of GUID (for example,
client_idinstead ofobject_id, or a subscription, tenant, or managed-identity resource ID). Re-derive with the lookup commands in Usage.
Insufficient privileges on az ad app create
Tenant policy "Users can register applications = No". See Required permissions, the script cannot work around this.
Insufficient privileges on az ad app owner add
You're trying to add a service principal as Owner and lack the Application Administrator role. Either add a user instead, or have an Application Administrator run it for you. The script's EXIT trap will roll the app registration back so you can retry cleanly.
failed to grant 'Managed Identity Contributor' to TF runner (Mode B)
You lack User Access Administrator (or Owner) on the UAMI resource group or subscription, those are the only roles that can create role assignments. Either:
- Have a sub-Owner run the script, or
- Pre-grant the script-runner User Access Administrator on the (pre-created) UAMI resource group and use the least-privilege option in Required permissions.
The EXIT trap will roll back the UAMIs and app registration so you can retry cleanly.
failed to grant 'Managed Identity Operator' to BYO AppReg SP (Mode B)
Same root cause as above (missing User Access Administrator). Without this role grant, scans will later fail with 403 LinkedAuthorizationFailed on Microsoft.ManagedIdentity/userAssignedIdentities/assign/action, the script fails-fast here on purpose rather than leaving you to discover it at scan-time.
terraform apply later fails with Insufficient privileges on FIC resources
The Terraform-runner is not actually an Owner of the app registration. Verify and fix:
az ad app owner list --id <customer_app_client_id> --query "[].id" -o tsv az ad app owner add --id <customer_app_client_id> --owner-object-id <tf-runner-object-id>
terraform apply later fails with AuthorizationFailed on UAMI write (Mode B)
The Terraform-runner doesn't have Managed Identity Contributor on the UAMI resource group. Verify and fix:
RG_SCOPE="/subscriptions/<SUB>/resourceGroups/<RG>"
az role assignment list --assignee <tf-runner-object-id> --scope "$RG_SCOPE" -o table
az role assignment create \
--assignee-object-id <tf-runner-object-id> \
--assignee-principal-type {User|ServicePrincipal} \
--role e40ec5ca-96e0-45a2-b4ff-59039f2c2b59 \
--scope "$RG_SCOPE"
terraform plan fails with sign_in_audience must be 'AzureADMultipleOrgs'
The app registration was created single-tenant (for example, via the Portal with defaults). The postcondition in data-azuread-customer.tf blocks the plan. Recreate with this script (which defaults to multi-tenant):
./setup-byo-app-registration.sh --rollback --app-client-id <APP_ID> ./setup-byo-app-registration.sh --app-name <NAME> --tf-runner-object-id <GUID>
terraform plan fails with customer_sp_object_id ... is the SP of a different AppReg
You pasted the wrong service principal object ID into tfvars. The postcondition in data-azuread-customer.tf detects this. Get the correct one:
az ad sp show --id <customer_app_client_id> --query id -o tsv
Scan tasks stuck in error with 403 LinkedAuthorizationFailed (Mode B)
The BYO app registration service principal is missing Managed Identity Operator on the UAMI resource group. This script grants it automatically in Mode B. If you created UAMIs manually (without --add-uamis), grant it yourself:
RG_SCOPE="/subscriptions/<SUB>/resourceGroups/<RG>" az role assignment create \ --assignee-object-id <customer_sp_object_id> \ --assignee-principal-type ServicePrincipal \ --role f1a07417-d97a-45cb-824c-7a7467783830 \ --scope "$RG_SCOPE"
Re-running with the same --app-name fails at az ad app create
Display names must be unique per tenant. The script is not idempotent, use --rollback first, then re-run.
Notes
The following notes describe security-relevant properties of what the script produces.
- No client secret is created. Auth from both Cortex (GCP service account) and Azure UAMIs into the app registration uses Federated Identity Credentials.
- The app registration is multi-tenant (
AzureADMultipleOrgs). Required because it consents into the monitored tenant, which may be different from the home tenant. - The Terraform runner becomes an Owner of only this one app registration, least privilege; it can manage credentials on this app registration but nothing else in the directory. With
--add-uamis, the same principle applies to the UAMI resource group: Managed Identity Contributor is scoped to the single resource group. - The script does not grant admin consent on the monitored tenant, that happens via the Cortex onboarding URL after
terraform apply. - The script does not request or grant any Microsoft Graph permissions on the app registration's home tenant. The app registration never authenticates to itself.
- Mode B resource-group handling: If the resource group already exists, it's reused as-is (the script only ensures it exists at the requested location). Rollback never deletes the resource group, only the UAMIs and role assignments it created.
A sample shell script
You can use this sample setup-byo-app-registration.sh script as a basis to set up the app registration for your Azure BYOA outpost.
Important! Because if you modify this script to suit your organization's needs, Palo Alto Networks won't be able to offer additional support.
#!/bin/sh # ------------------------------------------------------------------------------ # BYO App Registration Setup Script (+ optional UAMI provisioning) # # Creates an Azure AD App Registration and Service Principal for the # customer-managed (BYO) outpost deployment flow, and adds the Terraform # runner identity as an owner of the AppReg so it can attach Federated # Identity Credentials via Terraform. # # Optional --add-uamis mode ALSO creates the 5 scanner UAMIs and grants the # TF runner 'Managed Identity Contributor' on the UAMI resource group, which # is the permission TF needs at `terraform apply` time to attach UAMI self-FICs. # This consolidates what used to be two scripts (setup-byo-app-registration.sh # + setup-byo-uamis.sh) into a single AD-admin entry-point, and removes 9 # manual `az federated-credential create` steps from the customer workflow. # # Note: this script does NOT request or grant any Microsoft Graph permissions # on the AppReg's home tenant. The AppReg never authenticates to itself - # Federated Identity Credentials are added by the Terraform runner acting as # an *owner* of the AppReg. Admin consent against the *monitored* tenant # (where the AppReg actually scans resources) is granted separately via the # Cortex onboarding URL after `terraform apply`. # # Portability: written to POSIX sh - runs on macOS, Linux (bash/dash/ash), # and Windows via WSL or Git Bash. # # ────────────────────────────────────────────────────────────────────────────── # SEPARATION OF DUTIES # ────────────────────────────────────────────────────────────────────────────── # This script is designed for an AD-admin persona to run ONCE; afterwards a # separate TF-runner persona (often a CI service principal) does the # subscription-scoped `terraform apply`. The two personas may or may not be # the same human / SP. # # AD admin (this script) TF runner (`terraform apply`) # ---------------------------------------- -------------------------------- # - Entra: Application Developer - Owner on the AppReg (granted # - (with --add-uamis only): by this script) # Azure RBAC Contributor on the sub OR - (with --add-uamis only) # 'Managed Identity Contributor' on a Managed Identity Contributor # pre-created RG + 'User Access on the UAMI RG (granted by # Administrator' to grant the role this script) # assignment to the TF runner # # The --tf-runner-object-id flag is the linchpin: it's what the AD admin uses # to *delegate* the AppReg-ownership + UAMI-RG-write permissions to the TF # runner so the TF runner can attach all 9 FICs at apply time without any # Entra-level powers of its own. # # ────────────────────────────────────────────────────────────────────────────── # REQUIRED PERMISSIONS # ────────────────────────────────────────────────────────────────────────────── # Mode A — AppReg only (default, NO --add-uamis): # - Entra role: 'Application Developer' (built-in, # cf1c38e5-3621-4004-a7cb-879624dced7c) on the tenant. # Grants exactly: create AppRegs + own / manage the ones # you created. Sufficient for all three AppReg-side # operations (az ad app create, az ad sp create, # az ad app owner add). # - Azure RBAC: None. This mode never calls ARM. # - Admin consent: Not required at this stage. This script intentionally # does NOT grant any Microsoft Graph application # permissions on the AppReg's home tenant. Admin consent # against the *monitored* tenant is granted later via the # Cortex onboarding URL, not here. # # Mode B — AppReg + UAMIs (--add-uamis): # All of Mode A, plus Azure RBAC for the UAMI side. Choose ONE of: # # Easy option: # 'Contributor' at subscription scope. Covers RG creation + UAMI CRUD, # but NOT role assignment - that always needs 'User Access Administrator' # (or 'Owner'). So pair Contributor with 'User Access Administrator' # at the same scope, OR use 'Owner' (which includes both). # # Least-privilege option: # 1. Pre-create the UAMI resource group out-of-band. # 2. Grant the AD admin 'Managed Identity Contributor' on that RG. # 3. Grant the AD admin 'User Access Administrator' on that RG (so the # script can grant the TF runner 'Managed Identity Contributor' on # the same RG). # # ────────────────────────────────────────────────────────────────────────────── # PREREQUISITES # ────────────────────────────────────────────────────────────────────────────── # - Azure CLI (az) installed and authenticated (az login) against the *Entra # tenant* where the AppReg will live. (For --add-uamis, that tenant must # also be the one homing the target subscription.) # - The logged-in identity must be allowed to create App Registrations in # that tenant. By default this is any user; if the tenant has set # "Users can register applications = No", an admin must grant the built-in # Entra role 'Application Developer' (see "Required permissions" above). # - You know the object_id of the identity (user or service principal) that # will execute `terraform apply`. Look it up with: # User: az ad signed-in-user show --query id -o tsv # Service Principal: az ad sp show --id <sp-client-id> --query id -o tsv # # Usage (Mode A — AppReg only): # ./setup-byo-app-registration.sh \ # --app-name <app-display-name> \ # --tf-runner-object-id <object-id> # # Usage (Mode B — AppReg + UAMIs): # ./setup-byo-app-registration.sh \ # --app-name <app-display-name> \ # --tf-runner-object-id <object-id> \ # --add-uamis \ # --uami-subscription <SUB-ID> \ # --uami-resource-group <RG-NAME> \ # --uami-location <REGION> \ # [--uami-name-prefix <PREFIX>] # # Examples: # # Mode A # ./setup-byo-app-registration.sh \ # --app-name cortex-scan-platform-my-subscription \ # --tf-runner-object-id 12345678-1234-1234-1234-123456789abc # # # Mode B (with UAMIs) # ./setup-byo-app-registration.sh \ # --app-name cortex-scan-platform-my-subscription \ # --tf-runner-object-id 12345678-1234-1234-1234-123456789abc \ # --add-uamis \ # --uami-subscription 3ee44654-9e52-41a0-82ca-f5d5956452d6 \ # --uami-resource-group cortex-outpost-rg \ # --uami-location australiaeast # # Windows users: run via Git Bash (recommended) or WSL2: # - Git Bash: open "Git Bash" terminal, cd to the script directory, run as above # - WSL2: open WSL terminal, install Azure CLI for Linux, then run as above # # After running, copy the output values into template_params.tfvars and run # the main Terraform apply. # ------------------------------------------------------------------------------ set -eu # Built-in Azure role definition IDs (using IDs rather than display names avoids # issues with localised role names on tenants in non-EN languages). # # Managed Identity Contributor — granted to the TF runner so it can attach the # 5 UAMI self-FICs at `terraform apply` time. MIC_ROLE_ID="e40ec5ca-96e0-45a2-b4ff-59039f2c2b59" # Managed Identity Operator — granted to the BYO AppReg's Service Principal so # the Cortex scanner-dispatcher can attach BYO UAMIs to scanner workload VMs at # scan time. Without this, scan_task gets stuck in 'error' state with Azure # 403 LinkedAuthorizationFailed on # 'Microsoft.ManagedIdentity/userAssignedIdentities/assign/action'. MIO_ROLE_ID="f1a07417-d97a-45cb-824c-7a7467783830" ROLES="agentless dspm registry serverless proxy" # -- Rollback bookkeeping ----------------------------------------------------- # Track which resources we've created so we can undo them if any later step # fails (set -e + EXIT trap). Variables are populated as creation succeeds. CREATED_APP_ID="" CREATED_SP_OBJ_ID="" # Newline-separated list of created UAMI ARM IDs, newest first (so iteration # order = reverse-creation order for the rollback trap). CREATED_UAMIS="" # Role assignments we granted (so we can undo them on rollback). Newline- # separated triples "scope|principal|role|principal-type", newest first so # rollback iteration order = reverse-grant order. Empty when --add-uamis is # not used or before any grants succeed. GRANTED_RAS="" ROLLBACK_DISABLED=0 rollback() { # Skip on success path (set ROLLBACK_DISABLED=1 before exit) and skip when # nothing was actually created yet (failed arg parsing, --help, etc.). [ "$ROLLBACK_DISABLED" -eq 1 ] && return 0 if [ -z "$CREATED_APP_ID" ] && [ -z "$CREATED_UAMIS" ] && [ -z "$GRANTED_RAS" ]; then return 0 fi echo >&2 "" echo >&2 "---------------------------------------------------------" echo >&2 "WARNING: Script failed - rolling back partial state ..." # Reverse-creation order: # 1. Role assignments (granted last in --add-uamis flow). May be multiple # (Managed Identity Contributor on TF runner + Managed Identity Operator # on BYO AppReg SP). Iterate newest-first. if [ -n "$GRANTED_RAS" ]; then printf '%s\n' "$GRANTED_RAS" | while IFS='|' read -r ra_scope ra_principal ra_role ra_ptype; do [ -z "$ra_scope" ] && continue echo >&2 " Removing role assignment ($ra_role for $ra_principal on $ra_scope) ..." if az role assignment delete \ --assignee-object-id "$ra_principal" \ --assignee-principal-type "$ra_ptype" \ --role "$ra_role" \ --scope "$ra_scope" 2>/dev/null; then echo >&2 " - removed" else # Retry without the principal-type hint (slower but more permissive). if az role assignment delete \ --assignee "$ra_principal" \ --role "$ra_role" \ --scope "$ra_scope" 2>/dev/null; then echo >&2 " - removed" else echo >&2 " WARNING: could not remove role assignment - clean up manually:" echo >&2 " az role assignment delete --assignee $ra_principal --role '$ra_role' --scope $ra_scope" fi fi done fi # 2. UAMIs (created mid-flow in --add-uamis). Iterate newest-first. if [ -n "$CREATED_UAMIS" ]; then printf '%s\n' "$CREATED_UAMIS" | while IFS= read -r uami_id; do [ -z "$uami_id" ] && continue uami_name=${uami_id##*/} echo >&2 " Deleting UAMI ${uami_name} ..." if az identity delete --ids "$uami_id" 2>/dev/null; then echo >&2 " - deleted" else echo >&2 " WARNING: could not delete $uami_id - clean up manually:" echo >&2 " az identity delete --ids $uami_id" fi done fi # 3. App Registration (created first). Deletion cascades to SP + owner edits. if [ -n "$CREATED_APP_ID" ]; then echo >&2 " Deleting App Registration $CREATED_APP_ID ..." if az ad app delete --id "$CREATED_APP_ID" 2>/dev/null; then echo >&2 " - deleted" else echo >&2 " WARNING: could not delete App Registration $CREATED_APP_ID - clean up manually:" echo >&2 " az ad app delete --id $CREATED_APP_ID" [ -n "$CREATED_SP_OBJ_ID" ] && \ echo >&2 " az ad sp delete --id $CREATED_SP_OBJ_ID" fi fi echo >&2 "---------------------------------------------------------" } trap rollback EXIT # -- Helpers ------------------------------------------------------------------ # Validate a string is a GUID (8-4-4-4-12 hex pattern). POSIX has no =~ regex; # use a case-glob with explicit hex character classes. guid_is_valid() { # shellcheck disable=SC2254 # globbing is intentional for POSIX pattern match case "$1" in [0-9a-fA-F][0-9a-fA-F][0-9a-fA-F][0-9a-fA-F][0-9a-fA-F][0-9a-fA-F][0-9a-fA-F][0-9a-fA-F]-[0-9a-fA-F][0-9a-fA-F][0-9a-fA-F][0-9a-fA-F]-[0-9a-fA-F][0-9a-fA-F][0-9a-fA-F][0-9a-fA-F]-[0-9a-fA-F][0-9a-fA-F][0-9a-fA-F][0-9a-fA-F]-[0-9a-fA-F][0-9a-fA-F][0-9a-fA-F][0-9a-fA-F][0-9a-fA-F][0-9a-fA-F][0-9a-fA-F][0-9a-fA-F][0-9a-fA-F][0-9a-fA-F][0-9a-fA-F][0-9a-fA-F]) return 0 ;; *) return 1 ;; esac } # Per-role UAMI ARM IDs, populated as each `az identity create` succeeds. ID_AGENTLESS="" ID_DSPM="" ID_REGISTRY="" ID_SERVERLESS="" ID_PROXY="" get_id_for_role() { case "$1" in agentless) printf '%s\n' "$ID_AGENTLESS" ;; dspm) printf '%s\n' "$ID_DSPM" ;; registry) printf '%s\n' "$ID_REGISTRY" ;; serverless) printf '%s\n' "$ID_SERVERLESS" ;; proxy) printf '%s\n' "$ID_PROXY" ;; *) echo >&2 "INTERNAL: unknown role '$1'"; return 1 ;; esac } set_id_for_role() { case "$1" in agentless) ID_AGENTLESS="$2" ;; dspm) ID_DSPM="$2" ;; registry) ID_REGISTRY="$2" ;; serverless) ID_SERVERLESS="$2" ;; proxy) ID_PROXY="$2" ;; *) echo >&2 "INTERNAL: unknown role '$1'"; return 1 ;; esac } usage() { cat >&2 <<'USAGE' Usage: setup-byo-app-registration.sh [OPTIONS] Required options: --app-name <NAME> Display name of the new App Registration. --tf-runner-object-id <GUID> Azure AD object_id (GUID) of the user OR service principal that will run 'terraform apply'. Added as owner of the AppReg so it can attach Federated Identity Credentials. With --add-uamis, ALSO granted 'Managed Identity Contributor' on the UAMI resource group so TF can attach UAMI self-FICs. Other options: --copy-to-clipboard Also copy the tfvars output to the system clipboard. Off by default - values are printed to stdout regardless. -h, --help Show this help and exit. UAMI options (all four required together when --add-uamis is set): --add-uamis In addition to the AppReg, create the 5 scanner UAMIs (agentless, dspm, registry, serverless, proxy) and grant the TF runner 'Managed Identity Contributor' on the UAMI resource group. Sets uami_mode=customer_managed in output. --uami-subscription <GUID> Azure subscription ID where the UAMIs will be created. --uami-resource-group <NAME> Resource group that will hold the UAMIs. Will be created if it does not already exist. --uami-location <REGION> Azure region for the resource group / UAMIs. Example: australiaeast, eastus. --uami-name-prefix <PREFIX> Prefix for UAMI names. Default: cortex Each UAMI is named <prefix>-<role>, e.g. cortex-agentless. Look up the tf-runner object_id with: User: az ad signed-in-user show --query id -o tsv Service Principal: az ad sp show --id <sp-client-id> --query id -o tsv Examples: # AppReg only setup-byo-app-registration.sh \ --app-name cortex-scan-platform-my-subscription \ --tf-runner-object-id 12345678-1234-1234-1234-123456789abc # AppReg + UAMIs (single AD-admin entrypoint, zero manual FIC steps) setup-byo-app-registration.sh \ --app-name cortex-scan-platform-my-subscription \ --tf-runner-object-id 12345678-1234-1234-1234-123456789abc \ --add-uamis \ --uami-subscription 3ee44654-9e52-41a0-82ca-f5d5956452d6 \ --uami-resource-group cortex-outpost-rg \ --uami-location australiaeast Rollback (deletes AppReg, and if --add-uamis was used also delete the UAMIs): setup-byo-app-registration.sh --rollback --app-client-id <APP_ID> \ [--uami-subscription <SUB> --uami-resource-group <RG> --uami-name-prefix <PREFIX>] USAGE } # -- Pre-flight: dependency checks -------------------------------------------- # Fail fast with actionable errors before doing anything else. if ! command -v az >/dev/null 2>&1; then echo >&2 "ERROR: Azure CLI 'az' not found in PATH." echo >&2 " Install instructions: https://learn.microsoft.com/cli/azure/install-azure-cli" exit 1 fi # Verify az login was performed against *some* tenant - actual tenant correctness # is checked later via the tf-runner identity lookup. if ! az account show >/dev/null 2>&1; then echo >&2 "ERROR: Not logged in to Azure CLI. Run 'az login' against the tenant where the AppReg will live, then retry." exit 1 fi APP_NAME="" TF_RUNNER_OBJECT_ID="" COPY_TO_CLIPBOARD=0 # UAMI-mode inputs ADD_UAMIS=0 UAMI_SUBSCRIPTION="" UAMI_RESOURCE_GROUP="" UAMI_LOCATION="" UAMI_NAME_PREFIX="cortex" # -- Manual rollback mode ----------------------------------------------------- # Triggered via `--rollback` as the FIRST argument. Tears down a previous run's # AppReg (deletion cascades to SP) and, if UAMI args are supplied, deletes the # 5 UAMIs too. Idempotent - missing resources are treated as success. if [ "${1:-}" = "--rollback" ]; then ROLLBACK_DISABLED=1 # disable EXIT trap; we handle errors manually below shift RB_APP_ID="" RB_SUB="" RB_RG="" RB_PREFIX="cortex" while [ "$#" -gt 0 ]; do case "$1" in --app-client-id) [ "$#" -ge 2 ] || { echo >&2 "ERROR: --app-client-id requires a value"; exit 1; } RB_APP_ID="$2"; shift 2 ;; --uami-subscription) [ "$#" -ge 2 ] || { echo >&2 "ERROR: --uami-subscription requires a value"; exit 1; } RB_SUB="$2"; shift 2 ;; --uami-resource-group) [ "$#" -ge 2 ] || { echo >&2 "ERROR: --uami-resource-group requires a value"; exit 1; } RB_RG="$2"; shift 2 ;; --uami-name-prefix) [ "$#" -ge 2 ] || { echo >&2 "ERROR: --uami-name-prefix requires a value"; exit 1; } RB_PREFIX="$2"; shift 2 ;; *) echo >&2 "ERROR: Unknown rollback argument: '$1'" echo >&2 "Usage: setup-byo-app-registration.sh --rollback --app-client-id <APP_ID> [--uami-subscription <SUB> --uami-resource-group <RG> --uami-name-prefix <PREFIX>]" exit 1 ;; esac done if [ -z "$RB_APP_ID" ]; then echo >&2 "ERROR: --rollback requires --app-client-id <APP_ID>" echo >&2 "Find it in template_params.tfvars (customer_app_client_id) or the script's previous output." exit 1 fi rb_failed=0 # Tear down UAMIs first if requested (reverse-creation order). RG is left in # place because it may have been pre-existing and shared with other workloads. if [ -n "$RB_SUB" ] || [ -n "$RB_RG" ]; then if [ -z "$RB_SUB" ] || [ -z "$RB_RG" ]; then echo >&2 "ERROR: --rollback UAMI cleanup requires BOTH --uami-subscription and --uami-resource-group." exit 1 fi if ! guid_is_valid "$RB_SUB"; then echo >&2 "ERROR: --uami-subscription is not a valid GUID: '$RB_SUB'" exit 1 fi echo >&2 "Selecting subscription $RB_SUB ..." az account set --subscription "$RB_SUB" for role in $ROLES; do uami_name="${RB_PREFIX}-${role}" echo >&2 "Deleting UAMI '$uami_name' ..." if az identity delete --name "$uami_name" --resource-group "$RB_RG" 2>/dev/null; then echo >&2 " - deleted" else if az identity show --name "$uami_name" --resource-group "$RB_RG" >/dev/null 2>&1; then echo >&2 " WARNING: failed to delete (UAMI exists but delete errored) - clean up manually:" echo >&2 " az identity delete --name $uami_name --resource-group $RB_RG" rb_failed=1 else echo >&2 " - already absent" fi fi done fi echo >&2 "Deleting App Registration $RB_APP_ID (and its Service Principal) ..." if az ad app delete --id "$RB_APP_ID"; then echo >&2 "OK: App Registration and Service Principal deleted." else echo >&2 "ERROR: Rollback failed - App Registration may not exist or you lack permissions to delete it." rb_failed=1 fi if [ "$rb_failed" -eq 1 ]; then echo >&2 "ERROR: Rollback completed with errors - see messages above." exit 1 fi echo >&2 "OK: Rollback complete." exit 0 fi # Parse named flags. Reject positional args and unknown flags to prevent confusion. while [ "$#" -gt 0 ]; do case "$1" in --app-name) [ "$#" -ge 2 ] || { echo >&2 "ERROR: --app-name requires a value"; usage; exit 1; } APP_NAME="$2"; shift 2 ;; --tf-runner-object-id) [ "$#" -ge 2 ] || { echo >&2 "ERROR: --tf-runner-object-id requires a value"; usage; exit 1; } TF_RUNNER_OBJECT_ID="$2"; shift 2 ;; --copy-to-clipboard) COPY_TO_CLIPBOARD=1; shift ;; --add-uamis) ADD_UAMIS=1; shift ;; --uami-subscription) [ "$#" -ge 2 ] || { echo >&2 "ERROR: --uami-subscription requires a value"; usage; exit 1; } UAMI_SUBSCRIPTION="$2"; shift 2 ;; --uami-resource-group) [ "$#" -ge 2 ] || { echo >&2 "ERROR: --uami-resource-group requires a value"; usage; exit 1; } UAMI_RESOURCE_GROUP="$2"; shift 2 ;; --uami-location) [ "$#" -ge 2 ] || { echo >&2 "ERROR: --uami-location requires a value"; usage; exit 1; } UAMI_LOCATION="$2"; shift 2 ;; --uami-name-prefix) [ "$#" -ge 2 ] || { echo >&2 "ERROR: --uami-name-prefix requires a value"; usage; exit 1; } UAMI_NAME_PREFIX="$2"; shift 2 ;; -h|--help) usage; exit 0 ;; *) echo >&2 "ERROR: Unknown argument: '$1'" usage; exit 1 ;; esac done if [ -z "$APP_NAME" ] || [ -z "$TF_RUNNER_OBJECT_ID" ]; then echo >&2 "ERROR: Missing required option(s):" [ -z "$APP_NAME" ] && echo >&2 " --app-name" [ -z "$TF_RUNNER_OBJECT_ID" ] && echo >&2 " --tf-runner-object-id" echo >&2 "" usage exit 1 fi if ! guid_is_valid "$TF_RUNNER_OBJECT_ID"; then echo >&2 "ERROR: --tf-runner-object-id is not a valid GUID: '$TF_RUNNER_OBJECT_ID'" echo >&2 " Expected format: 12345678-1234-1234-1234-123456789abc" exit 1 fi # -- UAMI-mode arg validation ------------------------------------------------- if [ "$ADD_UAMIS" -eq 1 ]; then if [ -z "$UAMI_SUBSCRIPTION" ] || [ -z "$UAMI_RESOURCE_GROUP" ] || [ -z "$UAMI_LOCATION" ]; then echo >&2 "ERROR: --add-uamis requires --uami-subscription, --uami-resource-group, and --uami-location." [ -z "$UAMI_SUBSCRIPTION" ] && echo >&2 " --uami-subscription is missing" [ -z "$UAMI_RESOURCE_GROUP" ] && echo >&2 " --uami-resource-group is missing" [ -z "$UAMI_LOCATION" ] && echo >&2 " --uami-location is missing" echo >&2 "" usage exit 1 fi if ! guid_is_valid "$UAMI_SUBSCRIPTION"; then echo >&2 "ERROR: --uami-subscription is not a valid GUID: '$UAMI_SUBSCRIPTION'" exit 1 fi else # Catch the silent-failure mode where someone passes UAMI args but forgets # the --add-uamis switch. if [ -n "$UAMI_SUBSCRIPTION$UAMI_RESOURCE_GROUP$UAMI_LOCATION" ]; then echo >&2 "ERROR: --uami-* options require --add-uamis to also be set." exit 1 fi fi # -- Pre-flight: verify tf-runner identity exists in Azure AD ----------------- # Cheap fail-fast check - avoids creating an AppReg + SP and then discovering at the # 'az ad app owner add' step that the supplied object_id doesn't resolve to anyone. # A GUID-shaped object_id can be either a User or a Service Principal; either is valid. echo >&2 "Verifying tf-runner identity exists in Azure AD ..." TF_RUNNER_KIND="" if az ad user show --id "$TF_RUNNER_OBJECT_ID" --query id -o tsv >/dev/null 2>&1; then TF_RUNNER_KIND="user" elif az ad sp show --id "$TF_RUNNER_OBJECT_ID" --query id -o tsv >/dev/null 2>&1; then TF_RUNNER_KIND="service principal" else echo >&2 "ERROR: --tf-runner-object-id '$TF_RUNNER_OBJECT_ID' does not resolve to any user or service principal in this Azure AD tenant." echo >&2 " Verify the object_id with one of:" echo >&2 " az ad user show --id $TF_RUNNER_OBJECT_ID --query id -o tsv" echo >&2 " az ad sp show --id $TF_RUNNER_OBJECT_ID --query id -o tsv" echo >&2 " Make sure 'az login' was done against the correct tenant (the tenant where the AppReg will live)." exit 1 fi echo >&2 " - tf-runner resolved as: $TF_RUNNER_KIND" # -- Step 1: Create App Registration ------------------------------------------ echo >&2 "Creating App Registration: $APP_NAME ..." APP_ID=$(az ad app create \ --display-name "$APP_NAME" \ --sign-in-audience AzureADMultipleOrgs \ --query appId -o tsv) CREATED_APP_ID="$APP_ID" # record so the EXIT trap can roll back if a later step fails # -- Step 2: Create Service Principal ----------------------------------------- echo >&2 "Creating Service Principal ..." SP_OBJ_ID=$(az ad sp create --id "$APP_ID" --query id -o tsv) CREATED_SP_OBJ_ID="$SP_OBJ_ID" # -- Step 3: Add the TF runner as owner of the AppReg ------------------------- # Required so the runner can later add FICs via Terraform. Fail loudly if this # step fails - silent failure here causes a confusing 'Insufficient privileges' # error during `terraform apply`, far away from the root cause. # az ad app owner add accepts the AppReg's client_id (--id) - no need to look up object_id. echo >&2 "Adding TF runner ($TF_RUNNER_OBJECT_ID) as App Registration owner ..." az ad app owner add --id "$APP_ID" --owner-object-id "$TF_RUNNER_OBJECT_ID" # -- Step 4 (--add-uamis only): create UAMIs + delegate RBAC to TF runner ----- if [ "$ADD_UAMIS" -eq 1 ]; then echo >&2 "" echo >&2 "Selecting subscription $UAMI_SUBSCRIPTION ..." az account set --subscription "$UAMI_SUBSCRIPTION" echo >&2 "Ensuring resource group '$UAMI_RESOURCE_GROUP' exists in '$UAMI_LOCATION' ..." az group create --name "$UAMI_RESOURCE_GROUP" --location "$UAMI_LOCATION" --output none for role in $ROLES; do uami_name="${UAMI_NAME_PREFIX}-${role}" echo >&2 "Creating UAMI '$uami_name' ..." uami_id=$(az identity create \ --name "$uami_name" \ --resource-group "$UAMI_RESOURCE_GROUP" \ --location "$UAMI_LOCATION" \ --query id -o tsv) set_id_for_role "$role" "$uami_id" # Prepend so newest is first (rollback iterates top-down). if [ -z "$CREATED_UAMIS" ]; then CREATED_UAMIS="$uami_id" else CREATED_UAMIS="$uami_id $CREATED_UAMIS" fi done # -- Step 5: Grant TF runner 'Managed Identity Contributor' on UAMI RG ------ # This is the linchpin that lets a separate-persona TF runner attach the 5 # UAMI self-FICs at `terraform apply` time without needing any Entra power. # The role grant is idempotent (`az role assignment create` returns 0 even if # the assignment already exists) but we still record it for rollback. RG_SCOPE="/subscriptions/${UAMI_SUBSCRIPTION}/resourceGroups/${UAMI_RESOURCE_GROUP}" TF_RUNNER_PTYPE=$([ "$TF_RUNNER_KIND" = "user" ] && echo User || echo ServicePrincipal) echo >&2 "" echo >&2 "Granting TF runner ($TF_RUNNER_OBJECT_ID) 'Managed Identity Contributor' on $RG_SCOPE ..." if az role assignment create \ --assignee-object-id "$TF_RUNNER_OBJECT_ID" \ --assignee-principal-type "$TF_RUNNER_PTYPE" \ --role "$MIC_ROLE_ID" \ --scope "$RG_SCOPE" \ --output none 2>/dev/null; then # Prepend so newest is first (rollback iterates top-down). GRANTED_RAS="${RG_SCOPE}|${TF_RUNNER_OBJECT_ID}|${MIC_ROLE_ID}|${TF_RUNNER_PTYPE}" echo >&2 " - granted" else # Re-run without --output none to surface the real error to the caller. echo >&2 "ERROR: failed to grant 'Managed Identity Contributor' to TF runner. Re-running to show the error:" az role assignment create \ --assignee-object-id "$TF_RUNNER_OBJECT_ID" \ --assignee-principal-type "$TF_RUNNER_PTYPE" \ --role "$MIC_ROLE_ID" \ --scope "$RG_SCOPE" || true echo >&2 " You need 'User Access Administrator' or 'Owner' on the RG/subscription to grant role assignments." exit 1 fi # -- Step 6: Grant BYO AppReg SP 'Managed Identity Operator' on UAMI RG ----- # Required at scan-time, NOT apply-time: the Cortex scanner-dispatcher (acting # as the BYO AppReg SP) calls Microsoft.Compute/virtualMachines/write with the # scanner UAMI attached, which Azure validates via # Microsoft.ManagedIdentity/userAssignedIdentities/assign/action on the UAMI's # parent scope. For cortex-managed UAMIs in the outpost-owned RG, the SP gets # this implicitly through custom role definitions; for BYO UAMIs in a # customer-owned RG, it must be granted explicitly here. echo >&2 "Granting BYO AppReg SP ($SP_OBJ_ID) 'Managed Identity Operator' on $RG_SCOPE ..." if az role assignment create \ --assignee-object-id "$SP_OBJ_ID" \ --assignee-principal-type ServicePrincipal \ --role "$MIO_ROLE_ID" \ --scope "$RG_SCOPE" \ --output none 2>/dev/null; then # Prepend so newest is first (rollback iterates top-down). GRANTED_RAS="${RG_SCOPE}|${SP_OBJ_ID}|${MIO_ROLE_ID}|ServicePrincipal ${GRANTED_RAS}" echo >&2 " - granted" else echo >&2 "ERROR: failed to grant 'Managed Identity Operator' to BYO AppReg SP. Re-running to show the error:" az role assignment create \ --assignee-object-id "$SP_OBJ_ID" \ --assignee-principal-type ServicePrincipal \ --role "$MIO_ROLE_ID" \ --scope "$RG_SCOPE" || true echo >&2 " You need 'User Access Administrator' or 'Owner' on the RG/subscription to grant role assignments." exit 1 fi fi # All steps succeeded - disable the EXIT-trap rollback. ROLLBACK_DISABLED=1 # -- Output ------------------------------------------------------------------- # AppReg side: customer supplies 2 IDs to Terraform; the AppReg's object_id is # auto-derived at plan time via data.azuread_application.customer_app. # UAMI side (when --add-uamis): also emit the 5 ARM IDs + the uami_mode setter. if [ "$ADD_UAMIS" -eq 1 ]; then TFVARS=$(cat <<EOF customer_app_client_id = "$APP_ID" customer_sp_object_id = "$SP_OBJ_ID" customer_uami_agentless_id = "$(get_id_for_role agentless)" customer_uami_dspm_id = "$(get_id_for_role dspm)" customer_uami_registry_id = "$(get_id_for_role registry)" customer_uami_serverless_id = "$(get_id_for_role serverless)" customer_uami_proxy_id = "$(get_id_for_role proxy)" EOF ) else TFVARS=$(cat <<EOF customer_app_client_id = "$APP_ID" customer_sp_object_id = "$SP_OBJ_ID" EOF ) fi echo >&2 "" if [ "$ADD_UAMIS" -eq 1 ]; then echo >&2 "OK: BYO App Registration + 5 UAMIs created and configured successfully." else echo >&2 "OK: BYO App Registration created and configured successfully." fi echo >&2 "" echo >&2 "Copy the following lines into the UI or your template_params.tfvars:" echo >&2 "---------------------------------------------------------" printf '%s\n' "$TFVARS" echo >&2 "---------------------------------------------------------" if [ "$COPY_TO_CLIPBOARD" -eq 1 ]; then copied_via="" if command -v pbcopy >/dev/null 2>&1; then printf '%s\n' "$TFVARS" | pbcopy && copied_via="pbcopy (macOS)" elif command -v wl-copy >/dev/null 2>&1; then printf '%s\n' "$TFVARS" | wl-copy && copied_via="wl-copy (Wayland)" elif command -v xclip >/dev/null 2>&1; then printf '%s\n' "$TFVARS" | xclip -selection clipboard && copied_via="xclip (X11)" elif command -v xsel >/dev/null 2>&1; then printf '%s\n' "$TFVARS" | xsel --clipboard --input && copied_via="xsel (X11)" elif command -v clip.exe >/dev/null 2>&1; then printf '%s\n' "$TFVARS" | clip.exe && copied_via="clip.exe (Windows/WSL/Git Bash)" fi if [ -n "$copied_via" ]; then echo >&2 " Copied to system clipboard via $copied_via." else echo >&2 "WARNING: --copy-to-clipboard requested but no clipboard tool found in PATH (pbcopy / wl-copy / xclip / xsel / clip.exe)." fi fi echo >&2 "" echo >&2 "Next steps:" echo >&2 " 1. Paste the lines above into the UI or your template_params.tfvars." echo >&2 " 2. Run the main Terraform apply:" echo >&2 " terraform apply -var-file=template_params.tfvars" if [ "$ADD_UAMIS" -eq 1 ]; then echo >&2 " TF will create all 9 Federated Identity Credentials (4 AppReg + 5 UAMI self-FICs)." echo >&2 " No manual 'az federated-credential create' commands are required." fi echo >&2 "" echo >&2 "To undo:" if [ "$ADD_UAMIS" -eq 1 ]; then echo >&2 " ./setup-byo-app-registration.sh --rollback \\" echo >&2 " --app-client-id $APP_ID \\" echo >&2 " --uami-subscription $UAMI_SUBSCRIPTION \\" echo >&2 " --uami-resource-group $UAMI_RESOURCE_GROUP \\" echo >&2 " --uami-name-prefix $UAMI_NAME_PREFIX" else echo >&2 " ./setup-byo-app-registration.sh --rollback --app-client-id $APP_ID" fi
Outpost troubleshooting
This document provides solutions for issues that might occur while deploying, configuring, and operating Cortex XSIAM. outposts. These troubleshooters can help identify symptoms, locate errors, and suggest how you can remediate.
General troubleshooting
These general troubleshooters apply to all cloud service providers and outpost deployment modes.
Terraform executes successfully but no outpost appears in Cortex
After a successful Terraform run, your cloud environment sends a notification to Cortex to register the new outpost. If the outpost doesn't appear in the Cortex console, verify that outbound internet connectivity is available from the environment where Terraform was executed. The notification requires an active connection to reach Cortex. If connectivity is confirmed and the outpost still doesn't appear, contact customer support for a manual workaround.
Terraform template execution fails on a non-approved tenant, such as after changing the target tenant mid-deployment
If Terraform execution fails on a non-approved tenant, such as if you change an Azure target tenant after starting outpost creation. Terraform execution fails because the outpost is bound to the originally-approved tenant. Delete the partially-created outpost from the Cortex console, revert to the approved tenant, and re-run the Terraform template.
Standard outpost troubleshooting
Standard outposts handle most of the infrastructure and identity provisioning automatically. Issues in this deployment mode might stem, for example, from broad permission gaps, restrictive policy definitions, or quota limits that prevent Cortex from deploying necessary resources.
Bring your own app (BYOA) troubleshooting - Azure
This section details common deployment and runtime errors that occur when a Bring Your Own App (BYOA) Azure outpost is configured. These errors might appear, for example, if the app registration, service principal, and user-assigned managed identities (UAMIs) were created manually via the Azure portal instead of using the provided helper script.
Use the following table to identify symptoms and apply the appropriate resolutions.
| Symptom / error message | Terraform deployment phase | Resolution |
|---|---|---|
| Single-tenant app registration Error: ... sign_in_audience must be 'AzureADMultipleOrgs' ... | Plan | Recreate the app registration as a multi-tenant application. The Azure portal defaults to single-tenant ("this org only"). Run this command: az ad app create --display-name <name> --sign-in-audience AzureADMultipleOrgs |
| Incorrect service principal ID Error: ... customer_sp_object_id ... is the SP of a different AppReg ... | Plan | An incorrect service principal object ID was provided. Retrieve the correct ID by running: az ad sp show --id <CUSTOMER_APP_CLIENT_ID> --query id -o tsvUpdate the customer_sp_object_id variable in your tfvars file. |
| Missing Terraform runner ownership Error: Warning: The Terraform runner ... is NOT listed as an owner of the BYO App Registration ... | Plan | The Terraform runner must be added as an owner of the app registration. Without this, the deployment fails with an "Insufficient privileges" error when attempting to create the first federated identity credential (FIC). Run: az ad app owner add --id <APP_ID> --owner-object-id <TF_RUNNER_OBJ_ID> |
| Disabled service principal Error: ... Customer SP ... is disabled in Entra ... | Plan | The service principal is disabled. Re-enable it by running: az ad sp update --id <SP_OBJ_ID> --set accountEnabled=trueAlternatively, toggle it in the Azure portal under Enterprise applications > [Your SP] > Properties. |
| Cross-subscription UAMI Error: ... Customer UAMI ... lives in subscription <X> but the outpost is being deployed to <Y> ... | Plan | Cross-subscription UAMIs are not supported because the Azure Instance Metadata Service (IMDS) only returns tokens for local identities. Recreate the UAMI in the outpost's subscription and update customer_uami_*_id in your tfvars file. |
| Cross-tenant UAMI Error: ... Customer UAMI ... lives in tenant <X> but the outpost subscription is in tenant <Y> ... | Plan | Cross-tenant UAMIs are not supported. Recreate the UAMI in the correct Entra ID tenant to match the outpost subscription. |
| Duplicate UAMI IDs Error: ... All 5 customer UAMI IDs must be distinct ... | Plan | Duplicate UAMI IDs were provided. The error message lists all 5 IDs. Replace the duplicates with the correct, distinct UAMI IDs and rerun Terraform. |
| Insufficient privileges for FIC Error: Error: creating Federated Identity Credential ... Insufficient privileges to complete the operation | Apply | App registration owner permissions are missing for the Terraform runner. Verify ownership by running az ad app owner list --id <APP_ID>.Add the owner by running: az ad app owner add --id <APP_ID> --owner-object-id <TF_RUNNER> |
| Stale federated credential Error: Another object with the same value for property federatedIdentityCredentials/<name> already exists | Apply | A stale FIC exists from a previous deployment attempt or manual portal entry. List existing credentials using az ad app federated-credential list --id <APP_ID> -o table.Delete the conflicting one with az ad app federated-credential delete --id <APP_ID> --federated-credential-id <NAME>.Rerun the deployment. |
| Subject does not exist (replication lag) Error: 400 BadRequest: Subject does not exist in directory. | Apply | The UAMI was created very recently, and it has not yet replicated across Entra ID. Wait 30 to 60 seconds and rerun terraform apply.Verify the subject exists with az ad sp show --id <UAMI_PRINCIPAL_ID>. |
| Accidental UAMI deletion Error: terraform destroy deleted my customer-created UAMIs! | Destroy | The UAMIs were incorrectly placed inside the outpost's Cortex-managed resource group. Terraform deletes UAMIs placed inside the outpost's Cortex-managed resource group during a destroy operation. Recreate the UAMIs in a customer-owned resource group outside of the outpost boundaries and re-onboard. |
Outpost Cloud Service Provider (CSP) permissions
When you set up Cortex XSIAM to collect data from your cloud environments using outposts, the onboarding wizard will ensure that the correct permissions are granted for Cortex XSIAM outpost resources. The following tables list these permissions by CSP:
Amazon Web Services (AWS) outpost permissions
When onboarding Amazon Web Services (AWS) outposts, Cortex XSIAM creates an authentication template that requests the permissions needed for monitoring your cloud environment. Depending on which security capabilities you select in the onboarding wizard, different permissions are requested.
The following tables are organized by security module and list the CSP permissions being requested as well as the purpose (and where relevant, the scope).
Module: Required base permissions
The following IAM policies are required for the Required base permissions module.
Policy: artifact-bucket-delete-object-access
The following AWS permissions are granted by the artifact-bucket-delete-object-access policy.
| Permission | Scope | Used By IAM Roles | Description |
|---|---|---|---|
s3:DeleteObject |
The bucket must be owned by the user's current AWS account. | gcp_saas_role |
Delete an object from an S3 bucket. This permission allows Cortex to remove temporary artifacts, logs, or results stored in the artifact bucket after they have been processed, ensuring storage hygiene. |
Policy: artifact-bucket-list-access
The following AWS permissions are granted by the artifact-bucket-list-access policy.
| Permission | Scope | Used By IAM Roles | Description |
|---|---|---|---|
s3:ListBucket |
Users can view: The list of contents for the specific ${cf_template_bucket} and the contents of any S3 bucket they own that has a name starting with the prefix ${bucket_name}- |
gcp_saas_role, dspm_scanner, proxy_vm, ads_scanner, registry_scanner, scanner_of_serverless |
List bucket contents. This permission allows Cortex to view the objects within specific S3 buckets. It is necessary to identify available input files, logs, or templates that need to be processed. |
Policy: artifact-bucket-put-policy-access
The following AWS permissions are granted by the artifact-bucket-put-policy-access policy.
| Permission | Scope | Used By IAM Roles | Description |
|---|---|---|---|
s3:GetBucketPolicy |
The bucket must be owned by the user's current AWS account. | gcp_saas_role |
Retrieve the bucket policy. This allows Cortex to verify the access permissions configured on the artifact bucket, ensuring that the policy allows the necessary access for the outpost and scanner roles. |
s3:PutBucketPolicy |
S3 buckets that users own and whose name begins with the prefix: ${bucket_name}- |
gcp_saas_role |
Update the bucket policy. This permission allows Cortex to apply or update the resource-based policy on the artifact bucket. This ensures that the bucket is correctly secured and that only authorized entities have access. |
Policy: artifact-bucket-write-access
The following AWS permissions are granted by the artifact-bucket-write-access policy.
| Permission | Scope | Used By IAM Roles | Description |
|---|---|---|---|
s3:GetObject |
Users can read (download) any file from the ${cf_template_bucket}. Also, users can read files from any S3 bucket they own that begins with the prefix ${bucket_name}-, with specific access paths defined for the general bucket contents and files within the output/, input/, and output/logs/ folders. |
dspm_scanner, gcp_saas_role, proxy_vm, ads_scanner, registry_scanner, scanner_of_serverless |
Download an object from an S3 bucket. This permission enables Cortex to retrieve configuration templates, input data, or logs from specified buckets. It is essential for the operation of the outpost and the retrieval of scan results. |
s3:GetObjectAttributes |
Users can read the metadata (attributes) of files from any S3 bucket they own that begins with the prefix: ${bucket_name}-. This permission applies to files located anywhere within that bucket, but the specific paths are detailed as the general bucket contents and files within the output/, input/, and output/logs/ folders. |
dspm_scanner, gcp_saas_role, proxy_vm, ads_scanner, registry_scanner, scanner_of_serverless |
Get object attributes. This allows Cortex to retrieve system metadata and attributes for S3 objects, such as size or modification time, without downloading the entire file. This is useful for checking file status before processing. |
s3:PutObject |
Communication buckets, artifact bucket, cf-template bucket, owned by the current AWS account. | dspm_scanner, gcp_saas_role, proxy_vm, ads_scanner, registry_scanner, scanner_of_serverless |
Upload scan results / artifacts / logs / CF template to S3. |
Policy: assume-role-other-accounts
The following AWS permissions are granted by the assume-role-other-accounts policy.
| Permission | Scope | Used By IAM Roles | Description |
|---|---|---|---|
sts:AssumeRole |
Resource belongs to a different AWS account than the current account. | dspm_scanner, registry_scanner, scanner_of_serverless, gcp_saas_role |
Assume an IAM role. This permission allows the outpost to temporarily adopt the permissions of another role, typically in a different account. This is the mechanism used to perform cross-account scanning or to elevate privileges for specific tasks securely. |
Policy: cf-template-bucket-access
The following AWS permissions are granted by the cf-template-bucket-access policy.
| Permission | Scope | Used By IAM Roles | Description |
|---|---|---|---|
s3:GetObject |
Users can read (download) any file from the ${cf_template_bucket}. Also, users can read files from any S3 bucket they own that begins with the prefix ${bucket_name}-, with specific access paths defined for the general bucket contents and files within the output/, input/, and output/logs/ folders. |
dspm_scanner, gcp_saas_role, proxy_vm, ads_scanner, registry_scanner, scanner_of_serverless |
Download an object from an S3 bucket. This permission enables Cortex to retrieve configuration templates, input data, or logs from specified buckets. It is essential for the operation of the outpost and the retrieval of scan results. |
s3:ListBucket |
Users can view: The list of contents for the specific ${cf_template_bucket} and the contents of any S3 bucket they own that has a name starting with the prefix ${bucket_name}- |
gcp_saas_role, dspm_scanner, proxy_vm, ads_scanner, registry_scanner, scanner_of_serverless |
List bucket contents. This permission allows Cortex to view the objects within specific S3 buckets. It is necessary to identify available input files, logs, or templates that need to be processed. |
s3:PutObject |
Communication buckets, artifact bucket, cf-template bucket, owned by the current AWS account. | dspm_scanner, gcp_saas_role, proxy_vm, ads_scanner, registry_scanner, scanner_of_serverless |
Upload scan results / artifacts / logs / CF template to S3. |
Policy: cortex-communications-bucket-access
The following AWS permissions are granted by the cortex-communications-bucket-access policy.
| Permission | Scope | Used By IAM Roles | Description |
|---|---|---|---|
s3:GetObject |
Users can read (download) any file from the ${cf_template_bucket}. Also, users can read files from any S3 bucket they own that begins with the prefix ${bucket_name}-, with specific access paths defined for the general bucket contents and files within the output/, input/, and output/logs/ folders. |
dspm_scanner, gcp_saas_role, proxy_vm, ads_scanner, registry_scanner, scanner_of_serverless |
Download an object from an S3 bucket. This permission enables Cortex to retrieve configuration templates, input data, or logs from specified buckets. It is essential for the operation of the outpost and the retrieval of scan results. |
s3:GetObjectAttributes |
Users can read the metadata (attributes) of files from any S3 bucket they own that begins with the prefix: ${bucket_name}-. This permission applies to files located anywhere within that bucket, but the specific paths are detailed as the general bucket contents and files within the output/, input/, and output/logs/ folders. |
dspm_scanner, gcp_saas_role, proxy_vm, ads_scanner, registry_scanner, scanner_of_serverless |
Get object attributes. This allows Cortex to retrieve system metadata and attributes for S3 objects, such as size or modification time, without downloading the entire file. This is useful for checking file status before processing. |
s3:ListBucket |
Users can view: The list of contents for the specific ${cf_template_bucket} and the contents of any S3 bucket they own that has a name starting with the prefix ${bucket_name}- |
gcp_saas_role, dspm_scanner, proxy_vm, ads_scanner, registry_scanner, scanner_of_serverless |
List bucket contents. This permission allows Cortex to view the objects within specific S3 buckets. It is necessary to identify available input files, logs, or templates that need to be processed. |
s3:PutObject |
Communication buckets, artifact bucket, cf-template bucket, owned by the current AWS account. | dspm_scanner, gcp_saas_role, proxy_vm, ads_scanner, registry_scanner, scanner_of_serverless |
Upload scan results / artifacts / logs / CF template to S3. |
Policy: cortex-communications-proxy-bucket-access
The following AWS permissions are granted by the cortex-communications-proxy-bucket-access policy.
| Permission | Scope | Used By IAM Roles | Description |
|---|---|---|---|
s3:GetObject |
Users can read (download) any file from the ${cf_template_bucket} and Also, users can read files from any S3 bucket they own that begins with the prefix ${bucket_name}-, with specific access paths defined for the general bucket contents and files within the output/, input/, and output/logs/ folders. |
dspm_scanner, gcp_saas_role, proxy_vm, ads_scanner, registry_scanner, scanner_of_serverless |
Download an object from an S3 bucket. This permission enables Cortex to retrieve configuration templates, input data, or logs from specified buckets. It is essential for the operation of the outpost and the retrieval of scan results. |
s3:GetObjectAttributes |
Users can read the metadata (attributes) of files from any S3 bucket they own that begins with the prefix: ${bucket_name}-. This permission applies to files located anywhere within that bucket, but the specific paths are detailed as the general bucket contents and files within the output/, input/, and output/logs/ folders. |
dspm_scanner, gcp_saas_role, proxy_vm, ads_scanner, registry_scanner, scanner_of_serverless |
Get object attributes. This allows Cortex to retrieve system metadata and attributes for S3 objects, such as size or modification time, without downloading the entire file. This is useful for checking file status before processing. |
s3:ListBucket |
Users can view: The list of contents for the specific ${cf_template_bucket} and the contents of any S3 bucket they own that has a name starting with the prefix ${bucket_name}- |
gcp_saas_role, dspm_scanner, proxy_vm, ads_scanner, registry_scanner, scanner_of_serverless |
List bucket contents. This permission allows Cortex to view the objects within specific S3 buckets. It is necessary to identify available input files, logs, or templates that need to be processed. |
s3:PutObject |
Communication buckets, artifact bucket, cf-template bucket, owned by the current AWS account. | dspm_scanner, gcp_saas_role, proxy_vm, ads_scanner, registry_scanner, scanner_of_serverless |
Upload scan results / artifacts / logs / CF template to S3. |
Policy: cortex-ssm-read
The following AWS permissions are granted by the cortex-ssm-read policy.
| Permission | Scope | Used By IAM Roles | Description |
|---|---|---|---|
ssm:GetParameter |
SSM parameter named cortex-outposts-..., but only if that specific parameter resource is already tagged with managed_by: paloaltonetworks |
ads_scanner, dspm_scanner, registry_scanner |
Retrieve an SSM parameter. This permission allows Cortex to fetch stored secrets, such as credentials for unmanaged container registries or database connections, enabling the scanner to authenticate and access those resources securely. |
Policy: dspm-kms-access
The following AWS permissions are granted by the dspm-kms-access policy.
| Permission | Scope | Used By IAM Roles | Description |
|---|---|---|---|
kms:* |
Keys must be accessed through a legitimate, identified AWS service (such as S3, RDS, EC2, and so on). | dspm_scanner |
Perform cryptographic operations. This broad permission is required to handle encrypted data during the scanning process. It allows the scanner to decrypt volumes or snapshots encrypted with KMS keys to perform the analysis. |
kms:Decrypt |
Redshift: keys accessed via the redshift-serverless service; DSPM: any key the scanner is otherwise granted access to. |
dspm_scanner, gcp_saas_role |
Decrypt KMS-encrypted data during scanning. |
kms:DescribeKey |
Redshift: keys accessed via the redshift-serverless service; DSPM: any key the scanner is otherwise granted access to. |
dspm_scanner, gcp_saas_role |
Retrieve metadata about a KMS key. Used to validate key configuration before decrypting Redshift (DSPM) data or customer data accessed by the DSPM scanner. |
Policy: redshit-operations
The following AWS permissions are granted by the redshit-operations policy.
| Permission | Scope | Used By IAM Roles | Description |
|---|---|---|---|
ec2:DescribeAvailabilityZones |
* |
gcp_saas_role |
List availability zones. This permission enables Cortex to determine the optimal location for deploying scanner resources, ensuring high availability and compliance with regional data residency requirements. |
kms:CreateGrant |
Keys accessed via the redshift-serverless service. |
gcp_saas_role |
Create a KMS grant. Required so Redshift Serverless (DSPM) can use the relevant KMS key on Cortex's behalf during data classification scans. |
kms:Decrypt |
Redshift: keys accessed via the redshift-serverless service; DSPM: any key the scanner is otherwise granted access to. |
dspm_scanner, gcp_saas_role |
Decrypt KMS-encrypted data during scanning. |
kms:DescribeKey |
Redshift: keys accessed via the redshift-serverless service; DSPM: any key the scanner is otherwise granted access to. |
dspm_scanner, gcp_saas_role |
Retrieve metadata about a KMS key. Used to validate key configuration before decrypting Redshift (DSPM) data or customer data accessed by the DSPM scanner. |
Policy: saas-role-policy
The following AWS permissions are granted by the saas-role-policy policy.
| Permission | Scope | Used By IAM Roles | Description |
|---|---|---|---|
ec2:DescribeAddresses |
* |
gcp_saas_role |
List Elastic IP addresses. This allows Cortex to identify available static IPs or verify the status of IPs allocated to proxy VMs, ensuring that network resources are correctly managed and available for use. |
ec2:DescribeVpcEndpoints |
* |
gcp_saas_role |
List VPC endpoints. This allows Cortex to verify the existence and configuration of private endpoints used for secure communication with AWS services, ensuring that the isolated network environment is correctly set up. |
iam:PassRole |
Limited to the specific list of roles designated as 'scanner roles' within the account. | gcp_saas_role |
Pass an IAM role to a service. This allows Cortex to assign a specific "scanner role" to the EC2 instances it launches. This ensures the scanner VMs have the exact permissions they need to operate, adhering to the principle of least privilege. |
kms:ReEncryptFrom |
The request must be initiated by the Amazon EC2 service and be contextually tied to the encryption of an EBS volume or snapshot. | gcp_saas_role |
Re-encrypt data. This permission is used when copying encrypted snapshots. It allows Cortex to decrypt data encrypted with one key and re-encrypt it with another, ensuring that data remains secure even when moving between contexts or accounts. |
sqs:DeleteMessage |
Messages from any SQS queue that is already tagged with managed_by: paloaltonetworks and whose name begins with the prefix: ${queue_prefix}- |
gcp_saas_role |
Delete a message from an SQS queue. This permission allows Cortex to remove messages from the queue after they have been successfully processed, preventing duplicate handling. |
sqs:GetQueueUrl |
URL for any SQS queue that is already tagged with managed_by: paloaltonetworks and whose name begins with the prefix: ${queue_prefix}- |
gcp_saas_role |
Get the URL of an SQS queue. This allows Cortex to look up the correct address for the message queue it needs to interact with, enabling it to send or receive messages. |
sqs:ListQueues |
URL for any SQS queue that is already tagged with managed_by: paloaltonetworks and whose name begins with the prefix: ${queue_prefix}- |
gcp_saas_role |
List SQS queues. This provides visibility into the available message queues, allowing Cortex to identify the correct queues for communication and coordination between outpost components. |
sqs:ReceiveMessage |
Messages from any SQS queue that is already tagged with managed_by: paloaltonetworks and whose name begins with the prefix: ${queue_prefix}- |
gcp_saas_role |
Receive a message from an SQS queue. This permission allows Cortex to pull messages from the queue, which typically contain instructions, notifications, or status updates regarding scanning tasks. |
ssm:AddTagsToResource |
SSM Parameter named cortex-outposts-..., but only if the tagging request itself includes the managed_by: paloaltonetworks tag. |
gcp_saas_role |
Add tags to an SSM parameter. This allows Cortex to tag parameters stored in the Systems Manager Parameter Store. Tagging is used to manage lifecycle and ownership of the secrets used for unmanaged registries. |
ssm:DeleteParameter |
SSM parameter named cortex-outposts-..., but only if that specific parameter resource is already tagged with managed_by: paloaltonetworks |
gcp_saas_role |
Delete an SSM parameter. This permission allows Cortex to securely remove stored secrets or configuration parameters when they are no longer needed, ensuring that sensitive information is not left lingering in the account. |
ssm:PutParameter |
Group of SSM parameter store parameters in a specified AWS account with the request tag: managed_by: paloaltonetworks |
gcp_saas_role |
Create or update an SSM parameter. This permission allows Cortex to securely store secrets or configuration values in the Parameter Store, such as credentials for accessing unmanaged registries. |
sts:AssumeRole |
Resource belongs to a different AWS account than the current account. | dspm_scanner, registry_scanner, scanner_of_serverless, gcp_saas_role |
Assume an IAM role. This permission allows the outpost to temporarily adopt the permissions of another role, typically in a different account. This is the mechanism used to perform cross-account scanning or to elevate privileges for specific tasks securely. |
Policy: saas-role-policy-ec2
The following AWS permissions are granted by the saas-role-policy-ec2 policy.
| Permission | Scope | Used By IAM Roles | Description |
|---|---|---|---|
ec2:AllocateAddress |
Resources with the request tag: managed_by: paloaltonetworks |
gcp_saas_role |
Allocate a static public IP address. This permission is necessary to assign a consistent IP to the proxy VM, ensuring stable and secure communication between the outpost and external services during scanning operations. |
ec2:AssociateAddress |
Resources with the request tag: managed_by: paloaltonetworks |
gcp_saas_role |
Associate a static public IP address with a network interface. This binds the allocated IP to the proxy VM, enabling it to route traffic correctly and maintain the connectivity required for the scanning process. |
ec2:CreateFleet |
Resources with the request tag: managed_by: paloaltonetworks |
gcp_saas_role |
Create an EC2 Fleet. This permission allows Cortex to launch a group of scanner instances (on-demand and/or spot) in a single request, which is how the outpost provisions compute capacity for scans. |
ec2:CreateLaunchTemplate |
Resources with the request tag: managed_by: paloaltonetworks |
gcp_saas_role |
Create a launch template. This defines the reusable configuration (AMI, instance type, networking, tags) used by the EC2 Fleet to launch scanner VMs consistently. |
ec2:CreateNetworkInterface |
Any region in the specified AWS account with the tag managed_by: paloaltonetworks; applies to network interfaces, subnets, and security groups. |
gcp_saas_role |
Create a network interface. This permission is necessary to connect the scanner or proxy VM to the designated subnet and security group, ensuring network traffic flows securely according to the defined network policies. |
ec2:CreateTags |
Resources with the request tag: managed_by: paloaltonetworks tag |
gcp_saas_role |
Add tags to resources. This is used for permission scoping, resource tracking, and cost visibility. Cortex tags every resource it creates with managed_by=paloaltonetworks so the tag scopes downstream permissions to Cortex-owned resources and enables automatic cleanup after scanning. |
ec2:CreateVpcEndpoint |
The VPC endpoint being created must: 1) Have the request tag: managed_by: paloaltonetworks 2) Only reference Palo Alto Networks-managed network components (VPCs, security groups, subnets, and route tables, and so on, with the request tag: managed_by: paloaltonetworks) 3) Connect to an approved VpceServiceName service as defined by policy. |
gcp_saas_role |
Create VPC endpoints. These endpoints allow scanners to access managed AWS services using private IP addresses, ensuring that data traffic remains within the AWS network and is not exposed to the public internet during the scanning process. |
ec2:DeleteLaunchTemplate |
Launch templates in the specified account with the resource tag: managed_by: paloaltonetworks |
gcp_saas_role |
Delete a launch template created for launching scanner VMs. |
ec2:DeleteNetworkInterface |
Network interfaces with the request resource tag: managed_by: paloaltonetworks |
gcp_saas_role |
Delete a network interface. This permission is critical for hygiene and resource cleanup. It allows Cortex to remove network interfaces created for scanner or proxy VMs once the scanning task is complete, preventing unused resources from cluttering the account. |
ec2:DeleteVpcEndpoints |
VPC endpoints in the specified account with the resource tag: managed_by: paloaltonetworks |
gcp_saas_role |
Delete VPC endpoints. This permission allows for the cleanup of temporary network connections established for the scanning session. It ensures that the network configuration returns to its previous state and no unused endpoints remain active. |
ec2:DescribeAvailabilityZones |
* |
gcp_saas_role |
List availability zones. This permission enables Cortex to determine the optimal location for deploying scanner resources, ensuring high availability and compliance with regional data residency requirements. |
ec2:DescribeImages |
* |
gcp_saas_role |
List AMI images. This is used to verify the creation status of images used for scanning or to identify the correct machine image to launch for scanner VMs. |
ec2:DescribeInstances |
* |
gcp_saas_role |
List EC2 instances. This provides visibility into the instances running in the account, allowing Cortex to verify the status of scanner or proxy VMs and ensure they are operating as expected. |
ec2:DescribeInstanceTypes |
* |
gcp_saas_role |
List instance types. This allows Cortex to dynamically select the most appropriate and cost-effective VM sizes for scanner instances based on the specific workload requirements and availability. |
ec2:DescribeKeyPairs |
* |
gcp_saas_role |
List key pairs. This permission is used to verify the existence of key pairs that may be required for launching instances, ensuring that the outpost can provision VMs with the correct access configurations. |
ec2:DescribeNetworkInterfaces |
* |
gcp_saas_role |
List network interfaces. This provides visibility into the network configuration of resources, helping to verify that scanner VMs are correctly connected to the network and troubleshooting any connectivity issues. |
ec2:DescribeSecurityGroups |
* |
gcp_saas_role |
List security groups. This allows Cortex to identify the correct security groups to associate with scanner resources, ensuring that the necessary firewall rules are applied to permit scanning traffic while blocking unauthorized access. |
ec2:DescribeSubnets |
* |
gcp_saas_role |
List subnets. This permission enables Cortex to discover available network subnets for deploying scanner resources, ensuring they are placed in the correct network segment according to the deployment configuration. |
ec2:DescribeVpcs |
* |
gcp_saas_role |
List VPCs. This provides context about the virtual private clouds in the account, allowing Cortex to identify the correct network environment for deploying scanner resources. |
ec2:DisassociateAddress |
Volumes with the resource tag: managed_by: paloaltonetworks |
gcp_saas_role |
Disassociate an Elastic IP from an instance. This permission allows Cortex to release the binding between a static IP and a proxy VM, facilitating the cleanup of network resources after the proxy is no longer needed. |
ec2:GetSpotPlacementScores |
* |
gcp_saas_role |
Get spot placement scores. This allows Cortex to query AWS for the optimal availability zones to request Spot Instances. It helps ensure reliable and cost-effective scanner deployment by predicting capacity availability. |
ec2:ModifyInstanceAttribute |
Instances in the specified account, where both of the following conditions are met: The target EC2 instance has the resource tag: managed_by: paloaltonetworks and the modify action must be specifically related to changing the value of the SourceDestCheck attribute. |
gcp_saas_role |
Modify instance attributes. This is used to change specific settings on the proxy or scanner VM, such as disabling source/destination checks (SourceDestCheck), which is often required for instances performing network traffic inspection or routing. |
ec2:ReleaseAddress |
Resources with the resource tag: managed_by: paloaltonetworks |
gcp_saas_role |
Release an Elastic IP address. This permission is critical for cost management. It allows Cortex to release static public IPs back to the AWS pool when they are no longer in use by a proxy VM, preventing unnecessary charges. |
ec2:RunInstances |
The new EC2 instance must be launched into a network environment (VPC, subnets, security groups, and key pairs) that is already designated as managed_by: paloaltonetworks, and if the request correctly specifies that the newly-created instance, network interfaces, and volumes are also tagged as managed_by: paloaltonetworks. The use of source snapshots for volumes is permitted without any tagging restrictions. |
gcp_saas_role |
Launch EC2 instances. This is the core permission required to spin up scanner and proxy VMs. It allows Cortex to dynamically provision the compute resources needed to perform security scans within the customer's environment. |
ec2:TerminateInstances |
EC2 instances with the tag: managed_by: paloaltonetworks |
gcp_saas_role |
Terminate EC2 instances. This permission allows Cortex to shut down and remove scanner and proxy VMs after their tasks are complete. It is essential for lifecycle management and ensures that compute resources do not run indefinitely. |
Policy: scanner-communications-bucket-access
The following AWS permissions are granted by the scanner-communications-bucket-access policy.
| Permission | Scope | Used By IAM Roles | Description |
|---|---|---|---|
s3:GetObject |
Users can read (download) any file from the ${cf_template_bucket}. Also, users can read files from any S3 bucket they own that begins with the prefix ${bucket_name}-, with specific access paths defined for the general bucket contents and files within the output/, input/, and output/logs/ folders. |
dspm_scanner, gcp_saas_role, proxy_vm, ads_scanner, registry_scanner, scanner_of_serverless |
Download an object from an S3 bucket. This permission enables Cortex to retrieve configuration templates, input data, or logs from specified buckets. It is essential for the operation of the outpost and the retrieval of scan results. |
s3:GetObjectAttributes |
Users can read the metadata (attributes) of files from any S3 bucket they own that begins with the prefix: ${bucket_name}-. This permission applies to files located anywhere within that bucket, but the specific paths are detailed as the general bucket contents and files within the output/, input/, and output/logs/ folders. |
dspm_scanner, gcp_saas_role, proxy_vm, ads_scanner, registry_scanner, scanner_of_serverless |
Get object attributes. This allows Cortex to retrieve system metadata and attributes for S3 objects, such as size or modification time, without downloading the entire file. This is useful for checking file status before processing. |
s3:ListBucket |
Users can view: The list of contents for the specific ${cf_template_bucket} and the contents of any S3 bucket they own that has a name starting with the prefix ${bucket_name}- |
gcp_saas_role, dspm_scanner, proxy_vm, ads_scanner, registry_scanner, scanner_of_serverless |
List bucket contents. This permission allows Cortex to view the objects within specific S3 buckets. It is necessary to identify available input files, logs, or templates that need to be processed. |
s3:PutObject |
Communication buckets, artifact bucket, cf-template bucket, owned by the current AWS account. | dspm_scanner, gcp_saas_role, proxy_vm, ads_scanner, registry_scanner, scanner_of_serverless |
Upload scan results / artifacts / logs / CF template to S3. |
Module: ADS
The following IAM policies are required for the ADS module.
Policy: saas-role-policy-ec2
The following AWS permissions are granted by the saas-role-policy-ec2 policy.
| Permission | Scope | Used By IAM Roles | Description |
|---|---|---|---|
ec2:AttachVolume |
Volumes in the specified AWS account with the managed_by: paloaltonetworks |
gcp_saas_role |
Attach a volume to a scanner VM. This allows the scanner to access the disk data that needs to be analyzed. It is a critical step in the scanning workflow where the scanner inspects the volume's contents for security risks without modifying the original data. |
ec2:CreateVolume |
Volumes with the request tag: managed_by: paloaltonetworks tag |
gcp_saas_role |
Create an EBS volume. This permission is used to create a temporary volume from a snapshot for analysis. It enables the scanner to inspect data in an isolated environment without impacting the performance or integrity of the live production workload. |
ec2:DeleteVolume |
Volumes in the specified account with the request tag: managed_by: paloaltonetworks |
gcp_saas_role |
Delete an EBS volume. This permission is used to remove the temporary volumes created for analysis after the scan is finished. It ensures that no data artifacts remain in the environment, maintaining security and reducing storage costs. |
ec2:DescribeVolumeAttribute |
Volumes in the specified account with the request tag: managed_by: paloaltonetworks |
gcp_saas_role |
View volume attributes. This allows Cortex to check specific properties of EBS volumes, such as encryption status or IOPS, to ensure compatibility and correct configuration before attaching them to a scanner. |
ec2:DescribeVolumes |
* |
gcp_saas_role |
List EBS volumes. This permission provides an inventory of volumes in the account, which is necessary to identify the volumes that need to be scanned or to verify the status of temporary volumes created during the process. |
ec2:DescribeVolumesModifications |
* |
gcp_saas_role |
View volume modification status. This allows Cortex to track the progress of volume operations, ensuring that volumes are in a stable state before they are attached to scanners or deleted. |
ec2:DescribeVolumeStatus |
* |
gcp_saas_role |
View volume status. This permission is used to verify the health and availability of EBS volumes, ensuring that data can be reliably accessed during the scanning process. |
ec2:DetachVolume |
Volumes in the specified account with the request tag: managed_by: paloaltonetworks |
gcp_saas_role |
Detach a volume from an instance. This permission is used to disconnect the temporary analysis volume from the scanner VM once the scan is complete, enabling the subsequent deletion of the volume. |
ec2:ImportVolume |
Volumes in the specified account with the request tag: managed_by: paloaltonetworks |
gcp_saas_role |
Import a volume. This permission enables the creation of a volume from an external source or file, supporting specific migration or recovery scanning workflows where data needs to be brought into the environment for analysis. |
ec2:ModifyVolume |
* Volumes in the specified account with the request tag: managed_by: paloaltonetworks |
gcp_saas_role |
Modify volume attributes. This permission allows Cortex to adjust volume settings if necessary, such as performance parameters, to optimize the scanning process. |
Module: DSPM
The following IAM policies are required for the DSPM module.
Policy: allow_outbound_federation_policy
The following AWS permissions are granted by the allow_outbound_federation_policy policy.
| Permission | Scope | Used By IAM Roles | Description |
|---|---|---|---|
sts:GetWebIdentityToken |
Resource belongs to Web Outbound Identity enbled in outpost for DBaaS DSPM | dspm_scanner |
Retrieve web outbound identity token for token exchange in DBaaS like Databricks and MongoDB Atlas. |
Policy: redshit-operations
The following AWS permissions are granted by the redshit-operations policy.
| Permission | Scope | Used By IAM Roles | Description |
|---|---|---|---|
ec2:DescribeAccountAttributes |
* |
gcp_saas_role |
Describe account attributes. This provides Cortex with essential context about the AWS account environment, such as supported platforms and quotas, to ensure that resources are provisioned correctly and within limits. |
iam:CreateServiceLinkedRole |
The role being created must be exclusively for the Amazon Redshift service. | gcp_saas_role |
Create a service-linked role. This permission is specifically needed to create the necessary roles for Amazon Redshift if they do not already exist, enabling the Redshift service to access other AWS resources on your behalf. |
redshift-data:DescribeStatement |
* |
gcp_saas_role |
Describe SQL execution status. This provides detailed information about the state of a running or completed query, allowing Cortex to track progress and troubleshoot data retrieval. |
redshift-data:DescribeTable |
Redshift Serverless workgroups tagged with managed_by: paloaltonetworks |
gcp_saas_role |
Describe a table. This permission allows Cortex to retrieve the schema/metadata of a Redshift table to drive data classification and discovery. |
redshift-data:ExecuteStatement |
* |
gcp_saas_role |
Execute a SQL statement. This permission allows Cortex to run individual queries against a Redshift database to extract schema information or sample data for classification purposes. |
redshift-data:GetStatementResult |
* |
gcp_saas_role |
Get SQL statement results. This allows Cortex to retrieve the actual data returned by a query, which is necessary for analyzing the content of the database for sensitive information. |
redshift-data:ListDatabases |
Redshift Serverless workgroups tagged with managed_by: paloaltonetworks |
gcp_saas_role |
List databases. This permission allows Cortex to enumerate the databases within a Redshift Serverless workgroup so it can target them for data classification scans. |
redshift-serverless:CreateNamespace |
Creation request includes tag: managed_by: paloaltonetworks |
gcp_saas_role |
Create a Redshift Serverless namespace. This permission is used to provision a logical container for database objects during the scanning of serverless Redshift environments. |
redshift-serverless:CreateWorkgroup |
Creation request includes tag: managed_by: paloaltonetworks |
gcp_saas_role |
Create a Redshift Serverless workgroup. This provisions the compute resources required to process data within a namespace, enabling Cortex to run queries against serverless Redshift data. |
redshift-serverless:DeleteNamespace |
Namespaces tagged with: managed_by: paloaltonetworks |
gcp_saas_role |
Delete a Redshift Serverless namespace. This permission is critical for cleanup. It allows Cortex to remove the logical container created for scanning, ensuring no empty or unused namespaces are left behind. |
redshift-serverless:DeleteWorkgroup |
Workgroup tagged with: managed_by: paloaltonetworks |
gcp_saas_role |
Delete a Redshift Serverless workgroup. This permission allows Cortex to de-provision the compute resources used for scanning, ensuring that the customer is not charged for unused serverless capacity. |
redshift-serverless:GetCredentials |
* |
gcp_saas_role |
Get database credentials. This allows Cortex to request temporary, secure credentials to connect to the Redshift Serverless database, enabling direct access for executing classification queries. |
redshift-serverless:GetNamespace |
* |
gcp_saas_role |
Get namespace details. This provides configuration information about a specific namespace, allowing Cortex to verify its settings and status before or after operations. |
redshift-serverless:GetWorkgroup |
* |
gcp_saas_role |
Get workgroup details. This retrieves configuration and status details for a workgroup, ensuring that the compute resources are available and correctly configured for scanning. |
redshift-serverless:ListNamespaces |
* |
gcp_saas_role |
List namespaces. This provides visibility into the existing Redshift Serverless namespaces, enabling Cortex to identify resources that need to be scanned or managed. |
redshift-serverless:ListTagsForResource |
* |
gcp_saas_role |
List tags for a resource. This allows Cortex to view the tags associated with Redshift resources, which is essential for identifying assets managed by Palo Alto Networks and enforcing scope boundaries. |
redshift-serverless:ListWorkgroups |
* |
gcp_saas_role |
List workgroups. This allows Cortex to discover existing Redshift Serverless workgroups in the account to assess what compute resources are available or active. |
redshift-serverless:RestoreFromSnapshot |
* |
gcp_saas_role |
Restore from snapshot. This permission allows Cortex to create a new namespace by restoring data from a backup snapshot. This enables analysis of historical data or safe testing without impacting the live database. |
redshift-serverless:TagResource |
* |
gcp_saas_role |
Tag a resource. This permission is used to apply tags to Redshift Serverless resources. Tagging is crucial for cost allocation, governance, and identifying resources that are safe to delete after scanning. |
Policy: redshit-operations (CloudFormation only)
The following AWS permissions are granted by the redshit-operations (CloudFormation only) policy.
| Permission | Scope | Used By IAM Roles | Description |
|---|---|---|---|
redshift-data:BatchExecuteStatement |
* |
gcp_saas_role (via CloudFormation template only) |
Execute a batch of SQL statements. This allows Cortex to run multiple queries simultaneously against a Redshift cluster, improving the efficiency of data classification and discovery tasks. |
redshift-data:CancelStatement |
* |
gcp_saas_role (via CloudFormation template only) |
Cancel a SQL statement. This permission enables Cortex to stop a long-running or erroneous query, preventing unnecessary resource consumption on the Redshift cluster. |
redshift-data:Describe* |
* |
gcp_saas_role (via CloudFormation template only) |
Describe SQL execution status. This provides detailed information about the state of a running or completed query, allowing Cortex to track progress and troubleshoot any issues with data retrieval. |
redshift-data:List* |
* |
gcp_saas_role (via CloudFormation template only) |
List SQL statements. This provides a history of queries executed against the cluster, helping Cortex verify that its operations were submitted and processed correctly. |
Policy: saas-role-policy-ec2
The following AWS permissions are granted by the saas-role-policy-ec2 policy.
| Permission | Scope | Used By IAM Roles | Description |
|---|---|---|---|
ec2:AttachVolume |
Volumes in the specified AWS account with the managed_by: paloaltonetworks |
gcp_saas_role |
Attach a volume to a scanner VM. This allows the scanner to access the disk data that needs to be analyzed. It is a critical step in the scanning workflow where the scanner inspects the volume's contents for security risks without modifying the original data. |
ec2:CreateVolume |
Volumes with the request tag: managed_by: paloaltonetworks tag |
gcp_saas_role |
Create an EBS volume. This permission is used to create a temporary volume from a snapshot for analysis. It enables the scanner to inspect data in an isolated environment without impacting the performance or integrity of the live production workload. |
ec2:DeleteVolume |
Volumes in the specified account with the request tag: managed_by: paloaltonetworks |
gcp_saas_role |
Delete an EBS volume. This permission is used to remove the temporary volumes created for analysis after the scan is finished. It ensures that no data artifacts remain in the environment, maintaining security and reducing storage costs. |
ec2:DescribeVolumeAttribute |
Volumes in the specified account with the request tag: managed_by: paloaltonetworks |
gcp_saas_role |
View volume attributes. This allows Cortex to check specific properties of EBS volumes, such as encryption status or IOPS, to ensure compatibility and correct configuration before attaching them to a scanner. |
ec2:DescribeVolumes |
* |
gcp_saas_role |
List EBS volumes. This permission provides an inventory of volumes in the account, which is necessary to identify the volumes that need to be scanned or to verify the status of temporary volumes created during the process. |
ec2:DescribeVolumesModifications |
* |
gcp_saas_role |
View volume modification status. This allows Cortex to track the progress of volume operations, ensuring that volumes are in a stable state before they are attached to scanners or deleted. |
ec2:DescribeVolumeStatus |
* |
gcp_saas_role |
View volume status. This permission is used to verify the health and availability of EBS volumes, ensuring that data can be reliably accessed during the scanning process. |
ec2:DetachVolume |
Volumes in the specified account with the request tag: managed_by: paloaltonetworks |
gcp_saas_role |
Detach a volume from an instance. This permission is used to disconnect the temporary analysis volume from the scanner VM once the scan is complete, enabling the subsequent deletion of the volume. |
ec2:ImportVolume |
Volumes in the specified account with the request tag: managed_by: paloaltonetworks |
gcp_saas_role |
Import a volume. This permission enables the creation of a volume from an external source or file, supporting specific migration or recovery scanning workflows where data needs to be brought into the environment for analysis. |
ec2:ModifyVolume |
* Volumes in the specified account with the request tag: managed_by: paloaltonetworks |
gcp_saas_role |
Modify volume attributes. This permission allows Cortex to adjust volume settings if necessary, such as performance parameters, to optimize the scanning process. |
Microsoft Azure outpost permissions
When onboarding Microsoft Azure outposts, Cortex XSIAM creates an authentication template that requests the permissions needed for monitoring your cloud environment. Depending on which security capabilities you select in the onboarding wizard, different permissions are requested.
The following tables are organized by the CSP permissions being requested as well as the purpose (and where relevant, the scope).
Module: Required base permissions
The following Azure roles are required for the Required base permissions module.
Role: Key Vault access policy
The following Azure permissions are granted by the Key Vault access policy role.
| Permission | Assigned To (Component) | Applies To (Scope) | Principal (Identity) | Description |
|---|---|---|---|---|
| Key Vault secrets: get / delete / list / purge / set | cortex-<keyvault> (Key Vault access policy) |
Resource group | Outpost app registration SP | Key Vault access policy granting the orchestrator full secret lifecycle management for secrets used by the outpost (e.g. unmanaged registry credentials). |
Role: Storage Blob Data Contributor
The following Azure permissions are granted by the Storage Blob Data Contributor role.
| Permission | Assigned To (Component) | Applies To (Scope) | Principal (Identity) | Description |
|---|---|---|---|---|
| Storage Blob Data Contributor (built-in) | cortex-<resources_sufix> (Resource Group) [Condition: container *bc-sc* input/output paths] |
Resource group | Outpost app registration SP | Built-in role granting read/write access to communication blob storage (input/output containers). Conditioned to *bc-sc* containers. |
Role: Storage Queue Data Message Processor
The following Azure permissions are granted by the Storage Queue Data Message Processor role.
| Permission | Assigned To (Component) | Applies To (Scope) | Principal (Identity) | Description |
|---|---|---|---|---|
| Storage Queue Data Message Processor (built-in) | cortex-<resources_sufix> (Resource Group) [Condition: queue name like *bc-sq*] |
Resource group | Outpost app registration SP | Built-in role granting read/process access to Storage Queue messages used for outpost event processing. Conditioned to queues matching *bc-sq*. |
Role: wo-role
The following Azure permissions are granted by the wo-role role.
| Permission | Assigned To (Component) | Applies To (Scope) | Principal (Identity) | Description |
|---|---|---|---|---|
Microsoft.Compute/locations/usages/read |
cortex-<resources_sufix> (Resource Group) |
Resource group | Outpost app registration SP | View regional usage and quota limits for compute resources. Ensures the outpost deployment stays within the Azure subscription's limits. |
Microsoft.Compute/skus/read |
cortex-<resources_sufix> (Resource Group) |
Resource group | Outpost app registration SP | View available VM sizes (SKUs). Enables dynamic size selection for scanner or proxy VMs based on availability and requirements. |
Microsoft.Compute/virtualMachines/delete |
cortex-<resources_sufix> (Resource Group) |
Resource group | Outpost app registration SP | Delete a scanner or proxy VM. Necessary for secure lifecycle management; cleans up temporary VMs after a security task is complete. |
Microsoft.Compute/virtualMachines/read |
cortex-<resources_sufix> (Resource Group) |
Resource group | Outpost app registration SP | View the properties of a scanner or proxy VM. Allows the system to verify status and configuration of the ephemeral VMs used for scanning. |
Microsoft.Compute/virtualMachines/write |
cortex-<resources_sufix> (Resource Group) |
Resource group | Outpost app registration SP | Create a scanner or proxy VM. Core provisioning permission required to dynamically deploy ephemeral scanner or proxy VMs spun up to perform specific security tasks. |
Microsoft.ManagedIdentity/userAssignedIdentities/assign/action |
cortex-<resources_sufix> (Resource Group) |
Resource group | Outpost app registration SP | Assign a user-assigned managed identity to a resource. Facilitates secure, credential-less access by associating an identity with outpost resources, eliminating stored static credentials. |
Microsoft.Network/applicationSecurityGroups/joinIpConfiguration/action |
cortex-<resources_sufix> (Resource Group) |
Resource group | Outpost app registration SP | Attach a NIC IP configuration to an Application Security Group. Allows logical grouping of VMs for network security segmentation so scanner or proxy VMs inherit the correct security policies. |
Microsoft.Network/networkInterfaces/delete |
cortex-<resources_sufix> (Resource Group) |
Resource group | Outpost app registration SP | Delete NICs. Critical for network security hygiene; cleans up temporary or unused network resources to prevent dangling resources. |
Microsoft.Network/networkInterfaces/read |
cortex-<resources_sufix> (Resource Group) |
Resource group | Outpost app registration SP | View NIC properties. Provides visibility into the network configuration of scanner and proxy VMs. |
Microsoft.Network/networkInterfaces/write |
cortex-<resources_sufix> (Resource Group) |
Resource group | Outpost app registration SP | Create or update NICs. Required to configure the network for secure and isolated communication for scanner/proxy VMs. |
Microsoft.Network/networkSecurityGroups/join/action |
cortex-<resources_sufix> (Resource Group) |
Resource group | Outpost app registration SP | Associate NICs or subnets with a Network Security Group (NSG). Applies specific traffic-filtering rules to scanner resources so they operate within a secured network boundary. |
Microsoft.Network/virtualNetworks/subnets/join/action |
cortex-<resources_sufix> (Resource Group) |
Resource group | Outpost app registration SP | Attach NICs to a subnet. Places the scanner or proxy VM into the designated virtual network subnet so it operates within the defined network topology. |
Microsoft.Network/virtualNetworks/subnets/join/action |
Customer-provided Virtual Network | Customer virtual network | Outpost app registration SP | Allows the scanner NIC to join the customer-supplied subnet, which lives outside the outpost resource group. The workload-orchestrator role is additionally assigned on the customer VNet to avoid 403 LinkedAuthorizationFailed. |
Microsoft.ResourceGraph/resources/read |
cortex-<resources_sufix> (Resource Group) |
Resource group | Outpost app registration SP | Query spot eviction history rates using Azure Resource Graph. Enables dynamic and cost-effective VM size selection by predicting spot instance stability. |
Module: ADS
The following Azure roles are required for the ADS module.
Role: Storage Blob Data Contributor
The following Azure permissions are granted by the Storage Blob Data Contributor role.
| Permission | Assigned To (Component) | Applies To (Scope) | Principal (Identity) | Description |
|---|---|---|---|---|
| Storage Blob Data Contributor (built-in) | cortex-<resources_sufix> (Resource Group) [Condition: container *bc-sc* input/output paths] |
Resource group | agentless (saas-outpost-id) managed identity |
Built-in role granting the ADS/agentless scanner read/write access to communication blob storage (input/output containers). Conditioned to *bc-sc* containers. |
Role: wo-role
The following Azure permissions are granted by the wo-role role.
| Permission | Assigned To (Component) | Applies To (Scope) | Principal (Identity) | Description |
|---|---|---|---|---|
Microsoft.Compute/disks/delete |
cortex-<resources_sufix> (Resource Group) |
Resource group | Outpost app registration SP | Delete disks after scanning has finished. Critical for remediation and resource hygiene, preventing data exfiltration and reducing the attack surface; ensures temporary disks used during analysis do not remain as dangling resources. |
Microsoft.Compute/disks/read |
cortex-<resources_sufix> (Resource Group) |
Resource group | Outpost app registration SP | Retrieve disk metadata. Used to identify disk properties and states, such as detecting dangling disks, ensuring accurate inventory and assessment of storage resources within the environment. |
Microsoft.Compute/disks/write |
cortex-<resources_sufix> (Resource Group) |
Resource group | Outpost app registration SP | Create a disk from a snapshot before attaching it to a workload. Essential for dynamic scanning and analysis without affecting the live environment; allows creation of a temporary disk copy to be analyzed securely by the scanner. |
Module: DSPM
The following Azure roles are required for the DSPM module.
Role: Key Vault access policy
The following Azure permissions are granted by the Key Vault access policy role.
| Permission | Assigned To (Component) | Applies To (Scope) | Principal (Identity) | Description |
|---|---|---|---|---|
| Key Vault secrets: get / list | cortex-<keyvault> (Key Vault access policy) |
Resource group | dspm (dspm-outpost-id) managed identity |
Key Vault access policy granting the DSPM scanner read access to secrets needed during data classification scans. |
Role: private-endpoint-role
The following Azure permissions are granted by the private-endpoint-role role.
| Permission | Assigned To (Component) | Applies To (Scope) | Principal (Identity) | Description |
|---|---|---|---|---|
Microsoft.Network/operations/read |
cortex-<resources_sufix> (Resource Group) |
Resource group | Outpost app registration SP | View available network-related operations. Validates that requested network configurations (private endpoints) are compatible with the current Azure environment. |
Microsoft.Network/privateEndpoints/delete |
cortex-<resources_sufix> (Resource Group) |
Resource group | Outpost app registration SP | Delete private endpoints. Critical for network security hygiene and resource cleanup; removes temporary network resources used for private scanning. |
Microsoft.Network/privateEndpoints/read |
cortex-<resources_sufix> (Resource Group) |
Resource group | Outpost app registration SP | View private endpoint properties. Provides visibility into private connections to resources like storage accounts, ensuring data scanning occurs over secure, private channels. |
Microsoft.Network/privateEndpoints/write |
cortex-<resources_sufix> (Resource Group) |
Resource group | Outpost app registration SP | Create or update private endpoints. Establishes secure, isolated connections to managed services without exposing traffic to the public internet. |
Role: Storage Blob Data Contributor
The following Azure permissions are granted by the Storage Blob Data Contributor role.
| Permission | Assigned To (Component) | Applies To (Scope) | Principal (Identity) | Description |
|---|---|---|---|---|
| Storage Blob Data Contributor (built-in) | cortex-<resources_sufix> (Resource Group) [Condition: container *bc-sc* input/output paths AND *artifact*] |
Resource group | dspm (dspm-outpost-id) managed identity |
Built-in role granting the DSPM scanner read/write access to communication blob storage and artifact containers. Conditioned to *bc-sc* and *artifact* containers. |
Role: wo-role
The following Azure permissions are granted by the wo-role role.
| Permission | Assigned To (Component) | Applies To (Scope) | Principal (Identity) | Description |
|---|---|---|---|---|
Microsoft.Compute/disks/delete |
cortex-<resources_sufix> (Resource Group) |
Resource group | Outpost app registration SP | Delete disks after scanning has finished. Critical for remediation and resource hygiene, preventing data exfiltration and reducing the attack surface; ensures temporary disks used during analysis do not remain as dangling resources. |
Microsoft.Compute/disks/read |
cortex-<resources_sufix> (Resource Group) |
Resource group | Outpost app registration SP | Retrieve disk metadata. Used to identify disk properties and states, such as detecting dangling disks, ensuring accurate inventory and assessment of storage resources within the environment. |
Microsoft.Compute/disks/write |
cortex-<resources_sufix> (Resource Group) |
Resource group | Outpost app registration SP | Create a disk from a snapshot before attaching it to a workload. Essential for dynamic scanning and analysis without affecting the live environment; allows creation of a temporary disk copy to be analyzed securely by the scanner. |
Module: Registry
The following Azure roles are required for the Registry module.
Role: Key Vault access policy
The following Azure permissions are granted by the Key Vault access policy role.
| Permission | Assigned To (Component) | Applies To (Scope) | Principal (Identity) | Description |
|---|---|---|---|---|
| Key Vault secrets: get / list | cortex-<keyvault> (Key Vault access policy) |
Resource group | registry (registry-outpost-id) managed identity |
Key Vault access policy granting the registry scanner read access to secrets (e.g. unmanaged registry credentials) needed during registry scans. |
Role: Storage Blob Data Contributor
The following Azure permissions are granted by the Storage Blob Data Contributor role.
| Permission | Assigned To (Component) | Applies To (Scope) | Principal (Identity) | Description |
|---|---|---|---|---|
| Storage Blob Data Contributor (built-in) | cortex-<resources_sufix> (Resource Group) [Condition: container *bc-sc* input/output paths] |
Resource group | registry (registry-outpost-id) managed identity |
Built-in role granting the registry scanner read/write access to communication blob storage (input/output containers). Conditioned to *bc-sc* containers. |
Module: Serverless
The following Azure roles are required for the Serverless module.
Role: Storage Blob Data Contributor
The following Azure permissions are granted by the Storage Blob Data Contributor role.
| Permission | Assigned To (Component) | Applies To (Scope) | Principal (Identity) | Description |
|---|---|---|---|---|
| Storage Blob Data Contributor (built-in) | cortex-<resources_sufix> (Resource Group) [Condition: container *bc-sc* input/output paths] |
Resource group | serverless (serverless-outpost-id) managed identity |
Built-in role granting the serverless scanner read/write access to communication blob storage (input/output containers). Conditioned to *bc-sc* containers. |
Module: Proxy
The following Azure roles are required for the Proxy module.
Role: wo-role
The following Azure permissions are granted by the wo-role role.
| Permission | Assigned To (Component) | Applies To (Scope) | Principal (Identity) | Description |
|---|---|---|---|---|
Microsoft.Network/publicIPAddresses/delete |
cortex-<resources_sufix> (Resource Group) |
Resource group | Outpost app registration SP | Delete unused public IP addresses. Critical for network security hygiene and cost management; cleans up temporary public IPs used by proxy VMs. |
Microsoft.Network/publicIPAddresses/join/action |
cortex-<resources_sufix> (Resource Group) |
Resource group | Outpost app registration SP | Attach public IP addresses to the NIC of a proxy VM. Necessary for secure network configuration of the egress proxy. |
Microsoft.Network/publicIPAddresses/read |
cortex-<resources_sufix> (Resource Group) |
Resource group | Outpost app registration SP | List existing static public IP addresses. Identifies available IPs that can be used by proxy VMs for egress traffic. |
Microsoft.Network/publicIPAddresses/write |
cortex-<resources_sufix> (Resource Group) |
Resource group | Outpost app registration SP | Create or update public IP addresses. Provisions necessary public entry/exit points for the isolated environment's communication needs (proxy VMs). |
Module: Graph Application Integration
The following Azure roles are required for the Graph Application Integration module.
Role: Microsoft Graph application permission
The following Azure permissions are granted by the Microsoft Graph application permission role.
| Permission | Assigned To (Component) | Applies To (Scope) | Principal (Identity) | Description |
|---|---|---|---|---|
Microsoft Graph Application.Read.All |
Monitored Azure Tenant (Admin Consent) | Azure tenant | Outpost app registration (application) | Microsoft Graph application permission enabling the "Microsoft Graph Application" integration for asset discovery and risk management. Requested at onboarding and activated during Admin Consent. |
Google Cloud Platform (GCP) outpost permissions
When onboarding Google Cloud Platform (GCP), Cortex XSIAM creates an authentication template that requests the permissions needed for monitoring your cloud outpost environment. Depending on which security capabilities you select in the onboarding wizard, different permissions are requested.
The following tables are organized by security module and list the CSP permissions being requested as well as the purpose (and where relevant, the scope).
Module: Required base permissions
The following IAM roles are required for the Required base permissions module.
Role: dspmCustomerDataStorage
The following GCP permissions are granted by the dspmCustomerDataStorage role.
| Permission | Description |
|---|---|
storage.objects.delete |
Delete objects. This is used to remove temporary files, logs, or scan results from the artifact bucket once they have been processed or are no longer needed. |
Role: dspmDeleteCustomerDataStorage
The following GCP permissions are granted by the dspmDeleteCustomerDataStorage role.
| Permission | Description |
|---|---|
storage.objects.delete |
Delete objects. This is used to remove temporary files, logs, or scan results from the artifact bucket once they have been processed or are no longer needed. |
Role: roles/compute.admin
The following GCP permissions are granted by the roles/compute.admin role.
| Permission | Description |
|---|---|
roles/compute.admin |
Grant full administrative control over Compute Engine resources. This allows the outpost to dynamically provision, manage, and delete Virtual Machines, disks, and networks required for scanning operations, ensuring resources are only running when needed. |
Role: roles/iam.serviceAccountTokenCreator
The following GCP permissions are granted by the roles/iam.serviceAccountTokenCreator role.
| Permission | Description |
|---|---|
roles/iam.serviceAccountTokenCreator |
Create OAuth2 access tokens or OpenID Connect ID tokens. This allows the CTS service account to impersonate the Cortex Engine service account, facilitating the secure trust chain between the Cortex Platform and the Outpost. |
Role: roles/iam.serviceAccountUser
The following GCP permissions are granted by the roles/iam.serviceAccountUser role.
| Permission | Description |
|---|---|
roles/iam.serviceAccountUser |
Act as a service account. This permission enables Cortex to launch Compute instances with specific service account identities, such as the scan runner or proxy, ensuring they have the precise permissions needed for their tasks. |
Role: roles/pubsub.subscriber
The following GCP permissions are granted by the roles/pubsub.subscriber role.
| Permission | Description |
|---|---|
roles/pubsub.subscriber |
Consume messages from Pub/Sub subscriptions. This facilitates event-driven communication, allowing the Cortex Engine to receive notifications about bucket events or scanning triggers for the bucket-communication process. |
Role: scanRunnerBucketRole
The following GCP permissions are granted by the scanRunnerBucketRole role.
| Permission | Description |
|---|---|
storage.objects.create |
Create or upload objects. This allows the scanner to write scan results, logs, or other artifacts to the designated communication or customer-data buckets. |
storage.objects.delete |
Delete objects. This is used to remove temporary files, logs, or scan results from the artifact bucket once they have been processed or are no longer needed. |
storage.objects.list |
List objects. This allows the DSPM service to list objects written by GCP managed services to the customer-data bucket, facilitating data discovery. |
Module: DSPM
The following IAM roles are required for the DSPM module.
Role: dspmBigQuery
The following GCP permissions are granted by the dspmBigQuery role.
| Permission | Description |
|---|---|
bigquery.jobs.create |
Create an export job. This allows the outpost to transfer data from BigQuery to Google Cloud Storage (GCS). This is necessary to facilitate efficient data scanning and classification by moving data to a temporary staging area for analysis without impacting the live dataset. |
Role: dspmCloudKMS
The following GCP permissions are granted by the dspmCloudKMS role.
| Permission | Description |
|---|---|
cloudkms.cryptoKeys.create |
Create a new cryptographic key. This key is used specifically for Bigtable encryption operations. It ensures that data extracted or processed during Bigtable scanning remains encrypted and secure. |
cloudkms.cryptoKeys.getIamPolicy |
Retrieve the IAM policy for a cryptographic key. This allows the system to verify access permissions for the keys used in Bigtable encryption, ensuring that only authorized entities can use them. |
cloudkms.cryptoKeys.setIamPolicy |
Set the IAM policy for a cryptographic key. This is required to grant the necessary permissions to the scanner service account so it can use the key for Bigtable encryption operations. |
cloudkms.cryptoKeys.update |
Modify the properties of a cryptographic key. This is used to manage the configuration of keys used for Bigtable encryption, such as updating labels or rotation schedules. |
cloudkms.cryptoKeyVersions.create |
Create a new version for a cryptographic key. This is used to rotate keys or generate new key material specifically for Bigtable encryption operations. |
cloudkms.cryptoKeyVersions.destroy |
Permanently destroy a cryptographic key version. This allows for the secure cleanup of key material that is no longer needed after Bigtable scanning is complete, preventing clutter and reducing the risk of key reuse. |
cloudkms.cryptoKeyVersions.get |
Retrieve the details and metadata of a cryptographic key version. This provides necessary context about the key being used for Bigtable encryption, such as its state and algorithm, to ensure the correct key is applied. |
cloudkms.cryptoKeyVersions.list |
List all versions of a cryptographic key. This allows the system to identify available key versions for Bigtable encryption and manage their lifecycle effectively during the scanning process. |
cloudkms.cryptoKeyVersions.update |
Modify the settings and state of a cryptographic key version. This is used to enable or disable key versions used for Bigtable encryption as needed, ensuring control over key usage. |
cloudkms.cryptoKeyVersions.useToDecrypt |
Use a cryptographic key version to decrypt data. This permission is essential for the scanner to read and analyze encrypted Bigtable data during the scanning process, enabling the classification of sensitive information. |
cloudkms.cryptoKeyVersions.useToEncrypt |
Use a cryptographic key version to encrypt data. This ensures that any data written or processed during the Bigtable scan is securely encrypted, maintaining data confidentiality throughout the operation. |
cloudkms.keyRings.create |
Create a new key ring. This is used to organize and hold the cryptographic keys required for Bigtable encryption in a logical group within the project. |
Role: dspmCloudSql
The following GCP permissions are granted by the dspmCloudSql role.
| Permission | Description |
|---|---|
cloudsql.databases.create |
Create databases. This is performed as part of an instance restore operation. It allows the creation of a temporary database copy for safe scanning without impacting the live production database. |
cloudsql.databases.delete |
Delete databases. This is used to clean up temporary databases created for scanning once the analysis is complete, ensuring no residual data remains in the environment. |
cloudsql.databases.get |
Retrieve database details. This allows the system to verify the configuration and status of the database during the restore and scan operation to ensure it is ready for access. |
cloudsql.databases.list |
List databases. This provides visibility into the databases present on an instance, which is necessary for identifying targets for restore and scanning. |
cloudsql.databases.update |
Modify database properties. This is used during the instance restore operation to configure the temporary database correctly for access and scanning. |
cloudsql.instances.create |
Create a Cloud SQL instance. This is used to create a temporary instance for restoring backups. This enables analysis of the data in an isolated environment without affecting the production instance. |
cloudsql.instances.delete |
Delete Cloud SQL instances. This is a critical cleanup permission. It allows the removal of the temporary instance created for scanning once the task is finished. |
cloudsql.instances.get |
Retrieve instance details. This provides necessary metadata about the Cloud SQL instance to ensure it is ready for scanning or restore operations. |
cloudsql.instances.list |
List Cloud SQL instances. This allows the system to discover instances and verify the presence of the temporary instance created for scanning. |
cloudsql.instances.restoreBackup |
Restore a Cloud SQL instance from a backup. This is the core action for safe scanning. It allows Cortex to restore data to a new, temporary instance for analysis, leaving the source untouched. |
cloudsql.instances.update |
Modify Cloud SQL instance properties. This is used to configure the temporary instance, such as adjusting network settings to allow the scanner to connect. |
cloudsql.users.list |
List all users on a Cloud SQL instance. This is used to manage users on the temporary instance during the restore and scan process. |
cloudsql.users.update |
Modify user settings. This allows the system to update the password or permissions of the temporary user on the Cloud SQL instance to ensure access. |
Role: dspmSecretManager
The following GCP permissions are granted by the dspmSecretManager role.
| Permission | Description |
|---|---|
secretmanager.secrets.create |
Create a new secret. This is used to securely store credentials or configuration data required by the scanner, such as temporary database passwords, to connect to scan targets. |
secretmanager.secrets.delete |
Delete a secret. This allows the system to clean up and remove secrets once they are no longer needed, preventing sensitive data from persisting in the environment. |
secretmanager.secrets.get |
View secret metadata. This allows the system to verify the configuration and existence of secrets used by the scanner without revealing the payload. |
secretmanager.secrets.list |
List secrets. This provides visibility into the secrets managed within the project, allowing the system to identify those related to scanning operations. |
secretmanager.versions.add |
Add a new secret version. This allows the system to update the stored secret value, for example, when rotating temporary credentials for a new scan. |
Role: Monitored project (customer-granted)
The following GCP permissions are granted by the Monitored project (customer-granted) role.
| Permission | Description |
|---|---|
cloudsql.instances.connect |
Connect to a Cloud SQL instance. This permission allows the scanner to establish a connection to the database instance to perform data scanning and classification. This runtime permission is needed at the monitored project level, not at the outpost project. |
cloudsql.instances.createTagBinding |
Apply tags to a Cloud SQL instance. This is used to tag temporary instances created for scanning, facilitating resource tracking, cost allocation, and automated cleanup. This runtime permission is needed at the monitored project level, not at the outpost project. |
cloudsql.instances.deleteTagBinding |
Remove tags from a Cloud SQL instance. This is used during the lifecycle management of the temporary scanning instance to update or clean up metadata. This runtime permission is needed at the monitored project level, not at the outpost project. |
cloudsql.instances.listTagBindings |
List tags on a Cloud SQL instance. This is used to verify that the correct tags are applied to the temporary scanning instance for tracking purposes. This runtime permission is needed at the monitored project level, not at the outpost project. |
cloudsql.instances.login |
Log into a Cloud SQL instance. This permission is required for the scanner to authenticate to the database and access the data for classification. This runtime permission is needed at the monitored project level, not at the outpost project. |
cloudsql.instances.restart |
Restart a Cloud SQL instance. This is used during the instance restore workflow to apply configurations or recover the temporary instance if needed. This runtime permission is needed at the monitored project level, not at the outpost project. |
cloudsql.users.create |
Create a new user. This is used to create a temporary service user on the restored Cloud SQL instance, granting the scanner access to the data. This runtime permission is needed at the monitored project level, not at the outpost project. |
cloudsql.users.delete |
Delete a user. This allows for the removal of the temporary service user from the Cloud SQL instance after the scan is complete. This runtime permission is needed at the monitored project level, not at the outpost project. |
cloudsql.users.get |
Retrieve user details. This allows the system to verify that the temporary user has been correctly created on the instance and has the appropriate attributes. This runtime permission is needed at the monitored project level, not at the outpost project. |
roles/bigtable.admin |
Grant full administrative control over Bigtable instances and clusters. This is required to manage the lifecycle of Bigtable resources used during data classification and analysis, including the creation and deletion of temporary backups. This runtime permission is needed at the monitored project level, not at the outpost project. |
secretmanager.secrets.update |
Update secret metadata. This is used to modify labels or settings on secrets, such as marking them for replication or tracking ownership. This runtime permission is needed at the monitored project level, not at the outpost project. |
secretmanager.versions.access |
Access secret payloads. This permission allows the scanner to retrieve the actual sensitive value (e.g., a password) stored in a secret version to authenticate against a target. This runtime permission is needed at the monitored project level, not at the outpost project. |
secretmanager.versions.destroy |
Destroy a secret version. This permanently removes a specific version of a secret payload, ensuring that old credentials cannot be recovered. This runtime permission is needed at the monitored project level, not at the outpost project. |
secretmanager.versions.disable |
Disable a secret version. This makes a specific version of a secret inaccessible, which can be used to revoke access to old credentials immediately. This runtime permission is needed at the monitored project level, not at the outpost project. |
secretmanager.versions.enable |
Enable a secret version. This allows a previously disabled secret version to be accessed again if necessary for a specific operation. This runtime permission is needed at the monitored project level, not at the outpost project. |
secretmanager.versions.get |
View secret version metadata. This allows the system to check the state (enabled/disabled) of a secret version before attempting to access it. This runtime permission is needed at the monitored project level, not at the outpost project. |
secretmanager.versions.list |
List secret versions. This provides a history of the values stored in a secret, allowing for management of version lifecycle and cleanup. This runtime permission is needed at the monitored project level, not at the outpost project. |
Role: roles/bigtable.reader
The following GCP permissions are granted by the roles/bigtable.reader role.
| Permission | Description |
|---|---|
roles/bigtable.reader |
Read all data and metadata from Bigtable tables. This permission enables Data Security Posture Management (DSPM) scanners to access and classify data residing in Bigtable instances within the customer environment. |
Role: roles/cloudkms.cryptoKeyEncrypterDecrypter
The following GCP permissions are granted by the roles/cloudkms.cryptoKeyEncrypterDecrypter role.
| Permission | Description |
|---|---|
roles/cloudkms.cryptoKeyEncrypterDecrypter |
Encrypt and decrypt data using Cloud KMS keys. This is essential for the DSPM scanner VM to handle encrypted data securely during scanning operations and to ensure communication artifacts remain protected. |
Role: roles/cloudkms.viewer
The following GCP permissions are granted by the roles/cloudkms.viewer role.
| Permission | Description |
|---|---|
roles/cloudkms.viewer |
Read metadata of cryptographic keys and key rings. This allows the scanner VM to identify and validate the keys required for encryption operations, ensuring the correct keys are used for data protection. |
Role: roles/cloudsql.client
The following GCP permissions are granted by the roles/cloudsql.client role.
| Permission | Description |
|---|---|
roles/cloudsql.client |
Connect to and execute data operations on Cloud SQL databases. This allows the scanner to authenticate and interact with Cloud SQL instances to perform security assessments and data classification. |
Role: roles/secretmanager.secretAccessor
The following GCP permissions are granted by the roles/secretmanager.secretAccessor role.
| Permission | Description |
|---|---|
roles/secretmanager.secretAccessor |
Read secret values from Secret Manager. This permission allows the DSPM scanner or container registry scanner to retrieve credentials needed to access Cloud SQL databases, customer container registries, or other protected resources. |
Role: roles/servicenetworking.serviceAgent
The following GCP permissions are granted by the roles/servicenetworking.serviceAgent role.
| Permission | Description |
|---|---|
roles/servicenetworking.serviceAgent |
Manage private service networking connections. This is required to establish Private Service Access, enabling DSPM to connect securely to Cloud SQL instances. |
Module: Registry
The following IAM roles are required for the Registry module.
Role: dspmSecretManager
The following GCP permissions are granted by the dspmSecretManager role.
| Permission | Description |
|---|---|
secretmanager.secrets.create |
Create a new secret. This is used to securely store credentials or configuration data required by the scanner, such as temporary database passwords, to connect to scan targets. |
secretmanager.secrets.delete |
Delete a secret. This allows the system to clean up and remove secrets once they are no longer needed, preventing sensitive data from persisting in the environment. |
secretmanager.secrets.get |
View secret metadata. This allows the system to verify the configuration and existence of secrets used by the scanner without revealing the payload. |
secretmanager.secrets.list |
List secrets. This provides visibility into the secrets managed within the project, allowing the system to identify those related to scanning operations. |
secretmanager.versions.add |
Add a new secret version. This allows the system to update the stored secret value, for example, when rotating temporary credentials for a new scan. |
Role: Monitored project (customer-granted)
The following GCP permissions are granted by the Monitored project (customer-granted) role.
| Permission | Description |
|---|---|
secretmanager.secrets.update |
Update secret metadata. This is used to modify labels or settings on secrets, such as marking them for replication or tracking ownership. This runtime permission is needed at the monitored project level, not at the outpost project. |
secretmanager.versions.access |
Access secret payloads. This permission allows the scanner to retrieve the actual sensitive value (e.g., a password) stored in a secret version to authenticate against a target. This runtime permission is needed at the monitored project level, not at the outpost project. |
secretmanager.versions.destroy |
Destroy a secret version. This permanently removes a specific version of a secret payload, ensuring that old credentials cannot be recovered. This runtime permission is needed at the monitored project level, not at the outpost project. |
secretmanager.versions.disable |
Disable a secret version. This makes a specific version of a secret inaccessible, which can be used to revoke access to old credentials immediately. This runtime permission is needed at the monitored project level, not at the outpost project. |
secretmanager.versions.enable |
Enable a secret version. This allows a previously disabled secret version to be accessed again if necessary for a specific operation. This runtime permission is needed at the monitored project level, not at the outpost project. |
secretmanager.versions.get |
View secret version metadata. This allows the system to check the state (enabled/disabled) of a secret version before attempting to access it. This runtime permission is needed at the monitored project level, not at the outpost project. |
secretmanager.versions.list |
List secret versions. This provides a history of the values stored in a secret, allowing for management of version lifecycle and cleanup. This runtime permission is needed at the monitored project level, not at the outpost project. |
Role: roles/secretmanager.secretAccessor
The following GCP permissions are granted by the roles/secretmanager.secretAccessor role.
| Permission | Description |
|---|---|
roles/secretmanager.secretAccessor |
Read secret values from Secret Manager. This permission allows the DSPM scanner or container registry scanner to retrieve credentials needed to access Cloud SQL databases, customer container registries, or other protected resources. |
Introduction to Terraform for Cloud service provider (CSP) onboarding
Terraform is an open-source Infrastructure as Code (IaC) tool that allows you to define and provision cloud infrastructure using declarative configuration files. Instead of manually creating resources in a cloud console, you use Terraform templates to automate the setup required for Cortex Cloud.
Key Terraform concepts
These concepts explain the underlying logic of how Terraform interacts with your cloud environment.
Infrastructure as Code (IaC)
Infrastructure as Code allows you to manage your network and security settings through declarative configuration (text) files. Terraform reads these files and compares them to your actual cloud environment to determine which resources need to be created, updated, or deleted to match the template.
The Terraform state file (.tfstate)
The .tfstate state file is a local record that maps your template configuration to the real resources in your cloud. The state file acts as a database that maps your configuration to real-world resources.
Each time you execute a Terraform template (such as by using plan or apply commands), Terraform compares the state file with the actual cloud environment to ensure everything is in sync. If there are differences, Terraform attempts to sync between the template and the cloud. Any resources that differ from the template are synced to match the template definition.
It is critical that you follow the following rules:
- Never delete the
.tfstatefile. If this file is lost, Terraform loses its "memory" of what it created, making it difficult to update or offboard (delete) those resources later. - Always run Terraform commands from the original folder where you initialized the template to ensure access to the
.tfstatefile. - If using a cloud-based terminal (like Azure Cloud Shell), ensure your files are saved to a persistent directory so the
.tfstatefile is not lost when the session ends.
Authentication and CLI prerequisites
Terraform does not have its own login; it uses the credentials for each cloud service provider. Before executing Terraform templates provided by Cortex Cloud, configure and authenticate using your cloud provider's Command Line Interface (CLI):
- AWS: Configure the AWS CLI.
- Azure: Log in to the Azure CLI (az).
- GCP: Initialize the Google Cloud CLI (gcloud).
- OCI: Configure the OCI CLI. We recommend you use token based authentication.
Core Terraform commands
While Terraform has many features, the Cortex Cloud onboarding process typically only uses the following core commands.
Important
Always run these commands in the same folder where the original .tf files and .terraform folder live—this is where the state is stored.
The terraform init command
The terraform init command prepares Terraform for the actual actions it will perform, such as downloading any required modules and cloud provider plugins.
Command: terraform init
Run this command when:
- It is the first time the template is going to be executed.
- There are changes to the template that necessitate updates to modules that have changed.
The terraform apply command
The terraform apply command previews the changes and executes the template to create or update the cloud resources.
Command: terraform apply --var-file=template_params.tfvars [-auto-approve]
When running the command, you must pass the template parameter file as an argument.
This command requests confirmation before making any changes. Type yes for the changes to be made. You can bypass the confirmation by passing -auto-approve to the apply command.
The first time this command is run, this command also creates the .tfstate state file. This file stores the state of the cloud resources at the time the command is executed.
Important
This .tfstate state file is critical because it is needed by the terraform destroy command to clean up created resources. It is critical that you never delete this file.
The terraform destroy command
The terraform destroy command removes all resources created by the terraform apply command. This is the standard way to offboard the CSP.
Command: terraform destroy --var-file=template_params.tfvars [-auto-approve]
Run this command:
- To off-board.
- To re-onboard. Before re-onboarding, clean up existing resources before re-onboarding.
When running the command, you must pass the template parameter file as an argument.
This command requests confirmation before making any changes. Type yes for the changes to be made. You can bypass the confirmation by passing -auto-approve to the apply command.
Standard Terraform deployment workflows
The lifecycle of a Cortex Cloud resource involves the following primary workflows:
- The initial provisioning of resources.
- The subsequent updating of those resources as requirements change, or as Cortex releases new updates and features.
Initial template onboarding
The onboarding process involves the initial translation of your cloud configuration into live cloud resources.
- Preparation: Download the necessary provider plugins, and then download and extract the Terraform template configuration files, such as
.tfand.tfvars, into the working directory. -
Initialization: Prepare the local environment for a specific template by executing this command from inside the template folder:
terraform init -
Application: Apply the configuration to the cloud provider using the specific variable file (such as
template_params.tfvars) to define your unique environment settings. Execute this command from inside the template folder:terraform apply --var-file=template_params.tfvars
Upgrades
As Cortex releases new features or updates, or you have changes to your own cloud infrastructure, you must update the existing template. This workflow involves merging new configuration files into your existing local directory while strictly maintaining the original state file.
This "upgrade" scenario relies on the state file to identify what has changed. By reconfiguring the initialization and applying the new files, Terraform identifies the differences and modifies the existing resources rather than recreating them from scratch.
- Reconfiguration: Updates the existing working template folder to account for changes in the underlying template structure, such as by copying new files into the folder. You can replace existing files but do not delete any files.
-
Synchronization: Updates the live cloud resources to align with the new template definition while preserving your existing variables. Execute the following commands:
terraform init -reconfigureterraform apply --var-file=template_params.tfvars
Working in Cloud Shell environments
If you are onboarding using a browser-based terminal (like Azure Cloud Shell or GCP Cloud Shell) instead of locally, make sure to adhere to the following:
- Keep the original folder: You must always run commands from the original folder where you initialized Terraform.
- Persistence: Ensure your session is saved to a persistent home folder (such as
~/). If the session ends and the folder is deleted, your.tfstatefile will be lost, which prevents easy cleanup or resource management.
| CSP | Folder for Persistence |
| Azure | See Persist files in Azure Cloud Shell |
| AWS | ~/ |
| GCP | ~/ |
| OCI | ~/ |
Manually connect a cloud instance
When onboarding your cloud instance using the onboarding wizard, after you download the authentication template and execute it in your cloud environment, notification is sent to Cortex Cloud and a cloud instance is created. This connection between your cloud environment and the Cortex Cloud cloud instance typically occurs automatically.
There are several scenarios when the instance should be connected manually:
- You executed the template in your cloud environment and your environment is an air-gapped network. In this case, the notification to create the instance in Cortex Cloud does not happen.
- You have executed the template, but the instance has not appeared in Cloud Instances. This is often due to connectivity or firewall issues.
- You have a specific need to connect the instance manually.
To manually connect a cloud instance, you need to identify the pending instance you want to connect. In Cloud Instances, remove the default filter that excludes pending instances. Right-click on a pending instance and select View Details to see the configuration details of that specific pending instance. After you have identified the pending instance you want to connect manually, right-click and select Manually connect an instance. For more information on pending instances, see Pending cloud instances.
In AWS Management Console, navigate to CloudFormation. Use the following table to guide you on where to obtain the necessary input for the manual onboarding. Not every field appears in every manual onboarding instance.
| Connect Instance input field | Value |
|---|---|
| Organization ID | Onboarded organization ID. |
| Organizational Unit ID | Onboarded organizational unit ID. |
| Account ID | Onboarded account ID. |
| Role ARN | The value of Outputs → CORTEXXDRARN. |
| External ID | The value of Parameters → ExternalID. |
| Audit Logs SQS URL | The value of Resources → CloudTrailLogsQueue. |
| Audit Logs Role ARN | The value of Resources → CloudTrailReadRole → ARN. |
| Audit Logs Audience | Automatically populated. |
| Outpost Scanner Role ARN | The value of Resources → CortexPlatformScannerRole → ARN. |
- Open your local terminal (Command prompt, PowerShell, or Terminal).
-
Log in to your GCP account using the gcloud CLI:
gcloud auth login
-
Display the values of all defined output variables in your Terraform configuration, formatted as a JSON object:
terraform output -json
Use the following table to guide you on which values in the output map to the necessary input for the manual onboarding. Not every field appears in every manual onboarding instance.
| Connect Instance input field | Value |
|---|---|
| Organization ID | organization_id.value |
| Project ID | project_id.value |
| Folder ID | folder_id.value |
| Service Account Email | service_account_email.value |
| Audit Logs Audit Pubsub Subscription ID | resources_data.value.AUDIT_LOGS.audit_pubsub_subscription_id |
| Audit Logs Service Account Email | resources_data.value.AUDIT_LOGS.audit_service_account_email |
| Outpost Scanner Service Account Email | resources_data.value.OUTPOST_SCANNER.outpost_scanner_service_account_email |
- Open your local terminal (Command prompt, PowerShell, or Terminal).
-
Log in to your Azure account using the Azure CLI:
az login
-
Display the values of all defined output variables in your Terraform configuration, formatted as a JSON object:
terraform output -json
Use the following table to guide you on which values in the output map to the necessary input for the manual onboarding. Not every field appears in every manual onboarding instance.
| Connect Instance input field | Value |
|---|---|
| Resource Group Location (only for subscription scope) | Onboarded resource group location |
| Resource Group Name | Automatically populated |
| Audit Logs Audience | Automatically populated |
| Audit Logs Storage Account Name | resources_data.value.AUDIT_LOGS.storage_account_name |
| Audit Logs Tenant ID | Automatically populated |
| Audit Logs Client ID | resources_data.value.AUDIT_LOGS.client_id |
| Audit Logs Namespace | resources_data.value.AUDIT_LOGS.namespace |
| Audit Logs Eventhub Name | resources_data.value.AUDIT_LOGS.eventhub_name |
| Audit Logs Azure Audit Eventhub Consumer Group Name | resources_data.value.AUDIT_LOGS.azure_audit_eventhub_consumer_group_name |
Navigate to the Microsoft Azure Portal and log in.
Use the following table to guide you on which values in the output map to the necessary input for the manual onboarding. Not every field appears in every manual onboarding instance.
| Connect Instance input field | Value |
|---|---|
| Resource Group Location (only for subscription scope) | Onboarded resource group location |
| Resource Group Name | Automatically populated |
| Audit Logs Audience | Automatically populated |
| Audit Logs Storage Account Name | Navigate to Storage accounts and filter by resource group. |
| Audit Logs Tenant ID | Automatically populated |
| Audit Logs Client ID | Navigate to App registrations and sort by time. The default name starts with "auditlogsapp". |
| Audit Logs Namespace | Navigate to Event Hubs and filter by resource group. |
| Audit Logs Eventhub Name | Navigate to Event Hubs and select the Event Hub Namespace. Under Event Hubs, take the value in the Name column. |
| Audit Logs Azure Audit Eventhub Consumer Group Name | Navigate to Event Hubs and select the Event Hub Namespace and then the Event Hub. Under Consumer Groups, use the value in the Name column, but not ‘$Default’. |
- Open your local terminal (Command prompt, PowerShell, or Terminal).
-
Log in to your OCI account using the OCI CLI:
oci session authenticate
-
Display the values of all defined output variables in your Terraform configuration, formatted as a JSON object:
terraform output -json
-
Use the following table to guide you on which values in the output map to the necessary input for the manual onboarding. Not every field appears in every manual onboarding instance.
Connect instance input field Value Tenancy OCID tenancy_ocid.value Home Region home_region.value Cortex Policy cortex_policy.value Cortex Group cortex_group.value Authentication Method The authentication method being used - Open your local terminal (Command prompt, PowerShell, or Terminal).
-
Log in to your Alibaba Cloud account using the aliyun CLI:
aliyun auth login
-
Display the values of all defined output variables in your Terraform configuration, formatted as a JSON object:
terraform output -json
-
Use the following table to guide you on which values in the output map to the necessary input for the manual onboarding. Not every field appears in every manual onboarding instance.
Connect instance input field Value Alibaba Cloud Account ID alibaba_cloud_account_id.value Alibaba Cloud Region alibaba_cloud_region.value RAM Role ARN ram_role_arn.value OIDC Provider ARN oidc_provider_arn.value authentication method The authentication method being used
Manage cloud instances
- Navigate to Settings → Data Sources & Integrations.
- Find the cloud instance by clicking the CSP name or using the Search field.
- In the row for the cloud instance, click View Details. The Cloud Instances page is displayed, filtered by the CSP you selected.
- In the Cloud Instances page, you can filter the results by any heading and value.
- Click on an instance name to open the details pane for that instance.
-
You can perform the following actions on each cloud instance:
Action Instructions Discover Now To initiate a discovery scan, in the row for the cloud instance, right-click and select Discover Now. Alternatively, in the details pane, click the more options icon and select Discover Now. Enable/Disable In the row for the cloud instance, right-click and select Enable or Disable. Alternatively, in the details pane, click the more options icon and select Enable or Disable. Delete In the row for the cloud instance, right-click and select Delete. Alternatively, in the details pane, click the more options icon and select Delete. Create a new instance Click New Instance and select the type of CSP of which you want to create a new instance. Follow the onboarding wizard to define its settings. Edit configuration <p>In the row for the cloud instance, right-click and select Configuration. Alternatively, in the details pane, click the edit button. Follow the onboarding wizard to edit the cloud instance's settings.</p><p>You must execute the updated template in the CSP environment for the configuration changes to be applied.</p>
Pending cloud instances
In Cortex XSIAM, a pending cloud instance refers to a cloud instance created after Cortex Cloud generates an authentication template, but before that template has been fully executed within the Cloud Service Provider (CSP) environment.
A pending cloud instance is created each time you complete the onboarding wizard for a new CSP and click Save. You can view all cloud instances, including those in a pending state, by navigating to Cloud Instances. Ensure you remove any default filters that might exclude instances with a "pending" status.
A single pending instance can be leveraged to create multiple cloud instances, all sharing the same configurations defined during the cloud onboarding process. Pending instances are automatically deleted after 30 days.
Manage pending cloud instances
There are some actions that can be performed specifically on cloud instances with a status of "pending".
| Action | Instructions |
| Manually connect an instance | After the authentication template has been executed in the CSP, you can manually connect the Cortex Cloud cloud instance to the CSP by right-clicking the pending cloud instance and selecting Manually connect an instance. For more about this process, see Manually connect a cloud instance. |
| View Details | To review the configuration settings defined in the onboarding wizard for a pending instance, right-click the instance and select View Details. This is helps you distinguish between pending instances when you want to create a new cloud instance from an existing pending instance or when you want to manually connect an instance. |
| Re-download Connection Template | The authentication template that you download from the onboarding wizard is valid for seven days from when it was downloaded. If you want to create a new cloud instance from a pending instance after the authentication template has expired, you can right-click the pending instance and select Re-download Connection Template. You must then execute the template in the CSP. |
| Delete | To delete a pending instance, right-click the pending instance and select Delete. |
Edit your onboarded CSP configuration
In order to make changes to your onboarded CSP configuration, you first modify the cloud instance settings in Cortex XSIAM and download an updated authentication template. After uploading the updated template to the CSP environment, you execute the template and then the changes take effect.
- Navigate to Settings → Data Sources & Integrations.
- Identify the Cloud Service Provider you want to update and click View Details.
- In the Cloud Instances page, identify the cloud instance you want to edit and click the Configuration pencil icon to edit the instance.
-
Make changes to the configuration settings. Click Save.
If the changes you made require re-deploying the authentication template, you will be prompted to to download the file. Click Download CloudFormation or Download Terraform as relevant to your CSP type.
Important
When using Terraform authentication templates, you must execute the updated Terraform template from the same folder where the original Terraform template was executed.
- On the Cloud Instances page, a notification appears stating that there are pending changes for the cloud instance you updated. These changes are not applied until you execute the updated template in the CSP environment.\
While a cloud instance has pending changes, you can manage those changes using the following options:- Revoke pending changes: Discard the pending changes and return the cloud instance to the last successfully executed state. After you revoke pending changes, the cloud instance exits the Pending Changes state and no template reexecution is required.
- Edit pending changes: The configuration wizard opens and displays the current pending changes. Use this option to continue editing from the pending state rather than starting from the last executed configuration. For example, if you added a capability, saved the updated template, and did not yet execute the template in the CSP, selecting Edit pending changes opens the wizard with that capability already selected.
- Execute the updated authentication template in your CSP environment by selecting the appropriate procedure below.
After you have downloaded the updated CloudFormation authentication template, connect to AWS Management Console to perform a direct update to the stack using the updated template file. With a direct update, you submit a template or input parameters that specify updates to the resources in the stack, and CloudFormation immediately deploys them.
- Log in to the AWS Management Console and open the CloudFormation console.
- On the Stacks page, select the existing stack that you want to update.
- In the stack details pane, select Update stack → Make a direct update.
- On the Update stack page, select Replace existing template.
- Under Specify template, select Upload a template file. Select the updated authentication template you downloaded from Cortex Cloud.
- Click Next and Next again.
- Select to acknowledge that AWS CloudFormation might create IAM resources with custom names. Click Next.
- Click Submit. The stack update is complete when it appears in the Stacks list with status of UPDATE_COMPLETE.
Using a Terraform template is only available for AWS account scope. After you have downloaded the updated Terraform template file, log in to your AWS account using the AWS CLI:
- Open your local terminal (Command prompt, PowerShell, or Terminal).
-
Log in to your AWS account using the AWS CLI:
aws login
-
Navigate to the directory you originally used for the Terraform template when onboarding your CSP and extract the Terraform files.
cd ~/terraform/aws-connector-1 tar -xzvf <your_template>.tar.gz
-
Initialize the upgrade of the Terraform in your project directory:
terraform init -upgrade
-
Apply your Terraform configuration using the downloaded parameter file:
terraform apply --var-file=template_params.tfvars
The updated Terraform template is deployed.
After you have downloaded the updated Terraform template file, connect to Google Cloud Console to update the stack using the updated template file.
- Open your local terminal (Command prompt, PowerShell, or Terminal).
-
Log in to your GCP account using the gcloud CLI:
gcloud auth login
-
Navigate to the directory you originally used for the Terraform template when onboarding your CSP and extract the Terraform files.
cd ~/terraform/gcp-connector-1 tar -xzvf <your_template>.tar.gz
-
Initialize the upgrade of the Terraform in your project directory:
terraform init -upgrade
-
Apply your Terraform configuration using the downloaded parameter file. When prompted, enter the project ID if you configured one in the onboarding wizard:
terraform apply --var-file=template_params.tfvars
The updated Terraform template is deployed.
After you have downloaded the updated authentication template file, lot in to Azure portal to update the stack using the updated template file.
- Log in to the Azure portal. Select Cloud Shell from the top navigation and then select Bash.
-
Navigate to the directory you originally used for the authentication template when onboarding your CSP and extract the files.
cd ~/azure-connector-1 tar -xzvf <your_template>.tar.gz.
-
In Cloud Shell, run the onboard.sh file:
bash onboard.sh
The updated authentication template is deployed.
After you have downloaded the updated authentication template file, use the same method you used initially to execute the template in Microsoft Azure:
Execute the Terraform authentication template
- Open your local terminal (Command prompt, PowerShell, or Terminal).
-
Log in to your Azure account using the Azure CLI:
az login
-
Navigate to the directory you originally used for the Terraform template when onboarding your CSP and extract the Terraform files.
cd ~/terraform/azure-connector-1 tar -xzvf <your_template>.tar.gz.
-
Initialize the upgrade of the Terraform in your project directory:
terraform init -upgrade
-
Apply your Terraform configuration using the downloaded parameter file. :
terraform apply --var-file=template_params.tfvars
The updated Terraform template is deployed.
Deploy the authentication template in Azure Resource Manager
- Open your local terminal.
-
Log in to your Azure account using the Azure CLI:
az login
-
Deploy the updated template file:
az deployment sub create --location <LOCATION> --subscription <SUBSCRIPTION_ID> --template-file <JSON_TEMPLATE>
where:
<LOCATION>is the location of the resource group. (For example, eastus or westus.)<SUBSCRIPTION_ID>is the ID of the subscription you want to onboard.<JSON_TEMPLATE>is the JSON template file that you downloaded at the end of the onboarding wizard.
The updated template is deployed.
Update cloud permissions after Cortex XSIAM release updates
This topic provides guidance on how to manage permission updates for your cloud instances following new feature releases or bug fixes. It outlines how users are notified of required permission changes and provides step-by-step instructions for granting necessary permissions to ensure continued functionality and security.
Prerequisites
- Ensure that the user account used to modify permissions has the necessary privileges within both the Cortex platform and your cloud environment, for example, AWS or Azure.
- You received a notification regarding a new version available that requires permission updates, or viewed a Needs Update status in the Data Sources & Integrations page.
- Navigate to the Data Sources & Integrations page.
- Do the following to identify instances requiring updates:
- For the relevant instance, locate the Update Status column.
- Filter or sort by this column to quickly identify instances marked as Needs Update. The message on the page indicates the number of instances that need updating.
Note
Instances requiring updates will not change their connection status, for example, Connected, Warning, Error, Disabled, due to the pending permission update.
- Do the following to access the connector's permissions section:
- Click the name of the specific cloud connector instance that requires permission updates. The connector's detailed view appears.
- Within the connector's detailed view, locate and select the permissions section.
- Review missing permissions. In the permissions section, the missing permission names or changes in permission scope is indicated.
- Follow the on-screen instructions to grant the required permissions, or refer to the specific permission names or scopes provided.
- After making the necessary permission adjustments, click Save or Apply Changes within the connector's configuration.
- Return to the Data Sources & Integrations page and verify that the updated status of the instance shows as up-to-date, or the update is in progress.
-
Monitor the instance's health and functionality to confirm the changes have taken effect and the connector is operating as expected.
If you encounter issues during the permission update process, check the generated health alerts for more specific details.
Troubleshoot errors on cloud instances
To help you to troubleshoot errors on a cloud instance, Cortex Cloud provides the following visibility and drilldown options:
- Overall status of an instance that indicates the health of your instance.
- A breakdown of the security capabilities enabled on an instance, detailing the status of each capability along with any open errors or issues.
- Additional XQL drill down options to query the history of error and recovery events for each security capability.
How to troubleshoot errors on a cloud instance
-
Navigate to Settings → Data Sources & Integrations.
Under Cloud Service Provider, review the status of the instances that were onboarded for the service provider. If the status shows Warning or Error, hover over the service provider and click View Details.
- On the Cloud Instances page review the list of instances that were onboarded and their overall status. The status is displayed as follows:
- Connected: The connector is enabled and has no issues.
- Warning: The connector is enabled and has minor issues. For example, some accounts or capabilities are in warning or error status.
- Error: The connector is enabled and has substantial errors. For example, an authentication failure, an outpost failure, major permissions issues, or (for organization level accounts) the majority of the accounts in the instance are in error status.
- Disabled: The connector is disabled.
-
To understand why an instance is showing a Warning or Error status, click on the instance name.
The cloud instance panel provides a breakdown of the security capabilities and the accounts onboarded on the instance. Review the information in the following sections:
Section Context Header Displays the overall status of the instance and the following information about the account, as specified during onboarding:
Scope of the instance: The number of accounts onboarded on the instance and their status. See the Accounts section for more information about the individual accounts and the type of account (single account or organization).
Scan mode: Cloud Scan or Outpost. For accounts using Outpost, information is displayed about the status of the Outpost account and the account ID.
Resource Tags: Tags defined during onboarding.
Security Capabilities Displays a breakdown of the security capabilities enabled on the instance and their individual statuses. Click on any item that shows a warning or error status to see the open errors and issues that contributed to the status:
Errors are factual objects that are automatically created when problems occur, and provide insight into the current status of the capability. For example, if a permission is missing, an error is displayed. Browse and filter the errors to better understand and resolve the problem.
Issues are actionable objects that are triggered when detected problems exceed defined thresholds. Issues are manageable, trackable, and provide remediation suggestions and automations.
The issues displayed in the panel are open issues that are specifically related to the selected connector with the selected capability in the observed scope (single account or organization). Click an issue to start investigating it.
Accounts Lists the accounts that are onboarded on the instance and their individual status.
If multiple accounts are onboarded on the instance, click on each account to filter the page information by account, and drill-down to the security capability statuses for each account.
- If the instance shows an Outpost error, go to the All Outposts page and find the outpost account that is being used by this instance. Right click the Outpost account to view the open errors and issues for the account.
- If the account shows Permission errors, use the side panel to check which permissions are missing. You can also Edit the instance to redeploy the cloud setup template, which should normally resolve the error.
-
Further investigate errors by running XQL queries on the
cloud_health_auditingdataset.This dataset records error and recovery events for the security capabilities in cloud instances. By querying this dataset you can see information about when the error started, the prevalence of the error, and whether there is a recurrency pattern. See the specific fields descriptions and query examples for each security capability.
Note: Errors related to collection of audit logs in the cloud instance are recorded in the collection_auditing dataset. For more information, see Audit logs fields and query examples.
- Set up correlation rules to trigger issues when errors occur in cloud security capabilities. See the following examples.
Outpost fields and query examples
You can review Outpost entries in the cloud_health_auditing dataset to see Outpost activity over time, or to search for errors on specific accounts. Outpost entries are added to the dataset as follows:
- An error occurred on an Outpost account that disabled or prevented an operation. This is audited as Error.
- An exceptional condition occurred on an Outpost account that might cause problems if not resolved. This is audited as Warning.
- The Outpost account returns to normal function. This is audited as Informational.
The following table describes the fields for Outpost entries:
| Field | Description |
| Account | Cloud account ID of the Outpost |
| Name | Category of the error, or a brief description of the event |
| Resource ID | Outpost ID |
| Capability | Outpost |
| Region | Region where the event occurred, or All regions. |
| Classification | Type of entry (Error, Warning, or Informational) |
| Message | Description of the error or Connected for informational entries. |
| Error | Details about the error. For informational entries this is blank. |
Example
-
Identify Outpost errors on all Outpost accounts in the eu-west-3 region:
dataset = cloud_health_auditing | filter capability = "Outpost" and classification = "Error" and region = "eu-west-3"
-
See all entries (error, warning, and recovery) for Outpost_1 on cloud account Account_A:
dataset = cloud_health_auditing | filter capability = "Outpost" and resource_id = “Outpost_1” and
Permissions fields and query examples
You can review Permissions entries in the cloud_health_auditing dataset to see Permissions activity over time, or to search for errors on specific accounts. Permissions entries are added to the dataset as follows:
- A permission problem was found. This is audited as Error.
- An exceptional condition occurred that might cause problems if not resolved. This is audited as Warning.
- A permission problem is resolved. This is audited as Informational.
The following table describes the fields for Permissions entries:
| Field | Description |
| Account | Name of the account where the event occurred, or All accounts. |
| Connector | Name of the connector where the event occurred |
| Name | Permission name |
| Capability | Permissions |
| Classification | Type of entry (Error, Warning, or Informational) |
| Message | Description of the error or Granted for informational entries. |
Discovery engine fields and query examples
You can review Discovery engine entries in the cloud_health_auditing dataset to see Discovery activity over time, or to search for errors on specific accounts. Discovery entries are added to the dataset as follows:
- An API exec problem is found. This is audited as Error.
- An exceptional condition occurred that might cause problems if not resolved. This is audited as Warning.
- An API exec problem is resolved. This is audited as Informational.
The following table describes the fields for Discovery engine entries:
| Field | Description |
| Account | Name of the account where the event occurred, or All accounts |
| Connector | Name of the connector where the event occurred |
| Name | Asset name |
| Capability | Discovery |
| Region | Region where the event occurred, or All regions. |
| Classification | Type of entry (Error, Warning, or Informational) |
| Message | Description of the error or Connected for informational entries. |
Example
-
Identify API exec errors on the Discovery engine for all accounts on the AWS_1 connector:
dataset = cloud_health_auditing | filter capability = "Discovery" and connector = "AWS_1" and classification = “Error”
-
See all Discovery engine activity on connector AWS_1 for Account_ A in the af-south-1 region:
dataset = cloud_health_auditing | filter capability = "Discovery" and connector = "AWS_1" and account = "accountA" and region = "af-south-1
Agentless Disk Scanning (ADS) fields and query examples
You can review ADS entries in the cloud_health_auditing dataset to see ADS activity over time, or to search for errors on specific accounts. ADS entries are added to the dataset as follows:
- ADS failed to scan an asset. This is audited as Failed.
- ADS successfully scanned an asset. This is audited as Scanned.
- The asset or host is not supported by ADS. This is audited as Unsupported.
- The asset or Host was excluded from the scan. This is audited as Excluded.
| Field | Description |
| Account | Name of the account to which the asset belongs |
| Connector | ID of the connector |
| Name | Name of the asset |
| Resource ID | Asset ID |
| Capability | ADS |
| Region | Region where the asset is located |
| Classification | Type of entry (Failed, Unsupported, Excluded, Scanned) |
| Message | Description of the error, or Connected for informational entries. |
| Error | Details about the error. For informational entries this is blank. |
| Type | Type of asset that was scanned |
| Scope | Scope of the asset (Asset, Region, or Account) |
Example
-
Identify failed ADS scans on connector "a8df43e848dd42778ae7efd5a706a0fc" for EC2 assets at the asset scope level, filtered by region (northamerica-northeast2-a):
dataset = cloud_health_auditing | filter capability = "ADS" and classification = "failed" and connector = “a8df43e848dd42778ae7efd5a706a0fc” and type = "EC2_INSTANCE" and scope = "Asset" and region = "northamerica-northeast2-a"
-
See all ADS scans (failed and successful) on connector "a8df43e848dd42778ae7efd5a706a0fc" for EC2 assets belonging to Account_A:
dataset = cloud_health_auditing | filter capability = "ADS" and connector = “a8df43e848dd42778ae7efd5a706a0fc” and type = "EC2" and account = “Account_
Data Security Scanning (DSPM) fields and query examples
You can review DSPM entries in the cloud_health_auditing dataset to see DSPM activity over time, or to search for errors on specific accounts. DSPM entries are added to the dataset as follows:
- DSPM failed to scan an asset. This is audited as Failed.
- DSPM successfully scanned an asset. This is audited as Success.
The following table describes the fields for DSPM entries:
| Field | Description |
|---|---|
| Account | Name of the account to which the asset belongs |
| Connector | Name of the connector where the event occurred |
| Name | Name of the asset |
| Resource ID | Asset ID |
| Capability | DSPM |
| Region | Region where the asset is located |
| Classification | Type of entry (Failed or Success) |
| Message | Description of the error, or Connected for informational entries. |
| Error | Details about the error. For informational entries this is blank. |
| Type | Type of asset that was scanned |
| Scope | Scope of the asset (Asset, Region, or Account) |
Example
-
Identify failed DSPM scans on the AWS_1 connector for S3 asset types, filtered by region (ap-east-1):
dataset = cloud_health_auditing | filter capability = "DSPM" and classification = “Error” and connector = “AWS_1” and type = "S3_BUCKET" and region = "ap-east-1"
-
See all DSPM scans (failed and successful) on the AWS_1 connector, for all scanned assets on Account_A:
dataset = cloud_health_auditing | filter capability = "DSPM" and account = "Account_A" and connector = “AWS_1”
Registry scanning fields and query examples
You can review Registry scanning entries in the cloud_health_auditing dataset to see Registry scanning activity over time, or to search for errors on specific accounts. Registry scanning entries are added to the dataset as follows:
- The Registry scanner failed to scan an asset. This is audited as Failed.
- The Registry scanner successfully scanned an asset. This is audited as Scanned.
The following table describes the fields for Registry scanning entries:
| Field | Description |
| Account | Name of the account to which the asset belongs |
| Connector | Name of the connector where the event occurred |
| Resource ID | Asset ID |
| Capability | Registry |
| Classification | Type of entry (Scanned or Failed) |
| Error | Details about the error. For informational entries this is blank |
| Scope | Scope of the asset (Asset or Account) |
Example
-
Identify failed scans on connector GCP_1:
dataset = cloud_health_auditing | filter capability = "Registry" and classification = “error” and connector = “GCP_1”
-
Review all registry scans (failed and successful) on connector GCP_1 for asset Asset_A:
dataset = cloud_health_auditing | filter capability = "Registry" and connector = “GCP_1” and ressource_id = "Asset_A"
Audit logs fields and query example
You can review Audit logs entries in the collection_auditing dataset. Querying this dataset can help you see the connectivity changes of an instance over time, the escalation or recovery of the connectivity status, and the error, warning, and informational messages related to status changes. For more information about this dataset, see Verify collector connectivity.
The following table describes the fields for Audit logs entries:
| Field | Description |
| Instance | Instance name |
| Log type | Type of logs affected |
| Classification | Type of entry (Error, Warning, or Informational) |
| Collector type | Type of the collector |
| Description | Description of the error, or Connected for informational entries. |
Example
Identify disruptions (errors) in audit log collection on connector AWS_1:
dataset = collection_auditing | filter instance = “AWS_1” and log_type = "Audit Logs" and classification = “Error”
Correlation rule examples
The following examples show how to set up correlation rules to trigger Health Collection issues when errors occur on a specific security capability.
Example rule for DSPM errors
In this example, a correlation rule will trigger a Health Collection issue if a DSPM scan fails on an AWS_S3 asset on the AWS_1 connector.
Example XQL:
dataset = cloud_health_auditing | filter capability = "DSPM" and classification = “Error” and type = "AWS_S3" and scope = "Asset" and connector = “AWS_1”
Additional fields to specify in the correlation rule:
| Field | Value |
| Time Schedule | Hourly |
| Query time frame | 1 Hour |
| Issue Suppression | Select Enable issue suppression. |
| Action | Select Generate Issue. |
| Issue Domain | Health |
| Severity | Medium |
| Category | Collection |
Example rule for Outpost errors
In this example, a correlation rule will trigger a Health Collection issue if an error is recorded on account Outpost_A in the us-east-1 region.
Example XQL:
dataset = cloud_health_auditing | filter capability = "Outpost" and account = "Outpost_A" and region = "eu-west-3" and classification = "Error"
Additional fields to specify in the correlation rule:
| Field | Value |
| Time Schedule | Hourly |
| Query time frame | 1 Hour |
| Issue Suppression | Select Enable issue suppression. |
| Action | Select Generate Issue. |
| Issue Domain | Health |
| Severity | Medium |
| Category | Collection |
Cloud service provider permissions
When you set up Cortex XSIAM to collect data from your cloud environments, the onboarding wizard will ensure that the correct permissions are granted for Cortex XSIAM. The following tables list the permissions required for each of the options available in the onboarding wizards.
Review the permissions required for each cloud service provider:
- Amazon Web Services (AWS)
- Microsoft Azure
- Google Cloud Platform (GCP)
- Oracle Cloud Infrastructure (OCI)
About automation permission scopes for unified Cortex platform cloud content packs
The unified Cortex platform cloud content packs (AWS, Azure, and GCP) require a defined set of automation permissions to enable full integration with your cloud environment. Review the following before configuring access:
- Forward compatibility: The permission set declared by each pack covers both currently available commands and commands planned for future releases. This eliminates the need to re-authorize permissions with each pack update.
- Granular review: To see the permissions required for a specific command, refer to the Command Details section in the pack documentation.
- Custom scoping: If your security policy requires permissions more restrictive than the recommended defaults, use a custom deployment template to define your access levels manually.
Caution
Reducing permissions below the recommended level may cause specific commands to fail or limit functionality in future pack updates.
Amazon Web Services (AWS) provider permissions
When onboarding Amazon Web Services (AWS), Cortex XSIAM generates a CloudFormation authentication template that provisions the IAM roles and policies it needs to monitor your cloud environment. This page enumerates every permission that template requests, grouped by security capability.
Note: All conditional capabilities documented below require the mandatory Base and Discovery Engine permissions to be deployed alongside them. Base provides the foundational CortexPlatformRole and AWS-managed read-only baseline. Discovery Engine extends that baseline with the asset-inventory coverage that every other capability assumes.
The following reference tables are organized by security module, role, and then the list of the CSP permissions being requested as well as their purpose:
- Base
- Discovery Engine
- Log Collection
- Agentless Disk Scanning (ADS)
- Registry Scan
- Serverless Scan
- Data Security Posture Management (DSPM)
- Kubernetes Security
- Automations
Base
Base (and Discovery) permissions represent the foundational, mandatory role assignments required to successfully onboard your AWS environment to Cortex.
Deployed at every onboarding scope. Provides core asset discovery and CSPM scanning.
Cortex Platform Role: CortexPlatformRole
The primary customer-side IAM Role that Cortex assumes to perform read-only asset discovery and CSPM scanning. The role itself carries no inline statements at the Base level; it is backed entirely by AWS-managed read-only policies. Capability policies (Discovery, ADS, DSPM, Kubernetes, Automation) attach additional permissions to this same role.
| Created when | Mandatory for onboarding scopes. |
| Trust | sts:AssumeRole from Cortex principal, gated by an sts:ExternalId condition. When DSPM is enabled, both the deployment-account CortexPlatformRole and every per-member-account copy (Account Group / Organization scope) additionally trust export.rds.amazonaws.com. This is required because RDS performs snapshot export to S3 under its own service principal, so it must be allowed to assume the role to write DSPM scan data into the Cortex S3 bucket. |
| Inline statements | None at Base level. |
| AWS-managed policies | ReadOnlyAccess, SecurityAudit, AmazonMemoryDBReadOnlyAccess, AmazonSQSReadOnlyAccess, AWSOrganizationsReadOnlyAccess |
| Cortex-managed policies | Required: Cortex-DISCOVERY-PolicyConditional by capability: Cortex-ADS-Policy, Cortex-DSPM-Policy, Cortex-K8s-Security-Policy, Cortex-Automation-Policy |
| Assignment scope | Deployment account; at Account Group / Organization scope. Also every member account under the target organizational unit. |
CortexPlatformRole permissions:
| Permission | Purpose |
|---|---|
| arn:aws:iam::aws:policy/AmazonMemoryDBReadOnlyAccess | Grant read-only access to Amazon MemoryDB resources in the account via an AWS-managed policy. Cortex uses this to discover and assess in-memory database configurations for data security posture management. This policy provides visibility into MemoryDB clusters and their settings without modifying any customer resources. (AWS-managed policy) |
| arn:aws:iam::aws:policy/AmazonSQSReadOnlyAccess | Grant read-only access to Amazon Simple Queue Service (SQS), allowing retrieval of SQS queue attributes, messages, and configurations. Cortex uses this AWS-managed policy to inventory message queues and assess their security configurations as part of asset discovery. This policy provides visibility into SQS resources without making any modifications. (AWS-managed policy) |
| arn:aws:iam::aws:policy/AWSOrganizationsReadOnlyAccess | Grant read-only access to AWS Organizations, allowing the ability to list and view organizational configurations, metadata, and structure. Cortex uses this AWS-managed policy to understand the multi-account organizational hierarchy and assess security posture across the organization. This policy provides visibility into organizational units and policies without making any modifications. (AWS-managed policy) |
| arn:aws:iam::aws:policy/ReadOnlyAccess | Grant comprehensive read-only access to AWS services and resources, allowing Cortex to list and view configurations, metadata, and logs across the account. Cortex uses this policy to inventory and assess the security posture of all AWS resources without making any modifications. This read-only access ensures complete visibility for security monitoring while maintaining a zero-impact footprint on customer workloads. (AWS-managed policy) |
| arn:aws:iam::aws:policy/SecurityAudit | Grant access to read security configuration metadata, allowing inspection of IAM configurations, security policies, CloudTrail logs, and other security-relevant settings. Cortex uses this AWS-managed policy to assess security configurations for compliance and posture management. This policy provides security-focused read access without the ability to modify any configurations. (AWS-managed policy) |
Onboarding Lambda Execution Role: CortexTemplateCustomLambdaExecutionRole
Used only during stack creation, a short-lived service role by the onboarding registration Lambda.
| Created when | Mandatory. All onboarding scopes. Lambda runs once on stack CREATE |
| Trust | Service: lambda.amazonaws.com (sts:AssumeRole) |
| Inline statements | None |
| AWS-managed policies | AWS-managed service-role/AWSLambdaBasicExecutionRole (CloudWatch Logs write).At Organization scope only, also AWS-managed AWSOrganizationsReadOnlyAccess. The Lambda calls organizations:DescribeOrganization once on stack CREATE to read the customer's AWS Organizations metadata (management-account ID, root ID, feature set) so the StackSet can be configured to fan out the Cortex roles to the correct member accounts. |
| Lifecycle | Short-lived; used only during stack creation |
| Assignment scope | Deployment account only |
Discovery Engine
The Discovery Engine permissions (and Base permissions) form the core of Cortex's visibility and asset inventory capabilities. These permissions provide the foundational access necessary for continuous asset discovery and Cloud Security Posture Management (CSPM) scanning across your cloud estate.
Discovery Policy: Cortex-DISCOVERY-Policy
Attached to CortexPlatformRole
A customer-managed policy that extends the Base capability's asset discovery coverage beyond what the AWS-managed ReadOnlyAccess and SecurityAudit policies cover.
| Created when | Mandatory. Deployed alongside the Base capability. |
| Attached to | CortexPlatformRole |
| Read/write profile | Read-only |
Cortex-DISCOVERY-Policy permissions:
| Permission | Purpose |
|---|---|
| apigateway:GET | Retrieve API Gateway resource configurations including REST APIs, stages, and deployments. Cortex uses this permission to discover API Gateway assets and assess their security configurations. |
| appsync:GetApiCache | Retrieve AppSync API cache configuration details. Cortex uses this permission to inventory AppSync resources and evaluate caching security settings. |
| athena:GetCapacityReservation | Retrieve Athena capacity reservation details. Cortex uses this permission to inventory Athena analytics resources for security posture assessment. |
| athena:GetNamedQuery | Retrieve details of a saved Athena named query. Cortex uses this permission to discover Athena query resources and assess data access patterns. |
| athena:ListCapacityReservations | List Athena capacity reservations in the account. Cortex uses this permission to discover all Athena capacity resources for asset inventory. |
| athena:ListDatabases | List databases within an Athena data catalog. Cortex uses this permission to inventory Athena database resources for security posture assessment. |
| athena:ListDataCatalogs | List Athena data catalogs in the account. Cortex uses this permission to discover data catalog resources and assess data governance configurations. |
| athena:ListNamedQueries | List saved Athena named queries. Cortex uses this permission to discover Athena query resources for asset inventory. |
| backup:DescribeFramework | Retrieve details of an AWS Backup framework. Cortex uses this permission to assess backup compliance frameworks and evaluate data protection posture. |
| backup:DescribeReportPlan | Retrieve details of an AWS Backup report plan. Cortex uses this permission to evaluate backup reporting configurations for compliance assessment. |
| backup:ListFrameworks | List AWS Backup frameworks in the account. Cortex uses this permission to discover backup compliance frameworks for security posture assessment. |
| backup:ListReportPlans | List AWS Backup report plans in the account. Cortex uses this permission to discover backup reporting configurations for compliance assessment. |
| backup:ListTags | List tags associated with AWS Backup resources. Cortex uses this permission to correlate backup resources with organizational tagging policies. |
| batch:DescribeSchedulingPolicies | Retrieve details of AWS Batch scheduling policies. Cortex uses this permission to inventory Batch compute resources and assess scheduling configurations. |
| batch:ListSchedulingPolicies | List AWS Batch scheduling policies in the account. Cortex uses this permission to discover Batch scheduling resources for asset inventory. |
| cloudwatch:DescribeAlarms | Retrieve information about all CloudWatch alarms configured in the account. Cortex uses this to assess monitoring coverage and identify gaps in alerting configurations as part of asset discovery. This read-only operation provides visibility into alarm states and thresholds without modifying any monitoring settings. |
| codebuild:BatchGetReportGroups | Retrieve details of CodeBuild report groups. Cortex uses this permission to inventory CI/CD reporting resources and assess build pipeline configurations. |
| codebuild:ListReportGroups | List CodeBuild report groups in the account. Cortex uses this permission to discover CI/CD reporting resources for asset inventory. |
| codedeploy:BatchGetApplications | Retrieve details of CodeDeploy applications. Cortex uses this permission to inventory deployment applications and assess CI/CD security configurations. |
| codedeploy:GetDeploymentConfig | Retrieve a CodeDeploy deployment configuration. Cortex uses this permission to evaluate deployment configurations for security best practices. |
| codedeploy:GetDeploymentGroup | Retrieve details of a CodeDeploy deployment group. Cortex uses this permission to assess deployment group configurations and target environment settings. |
| codedeploy:ListApplications | List CodeDeploy applications in the account. Cortex uses this permission to discover deployment applications for CI/CD asset inventory. |
| codedeploy:ListDeploymentConfigs | List CodeDeploy deployment configurations. Cortex uses this permission to discover deployment configurations for CI/CD asset inventory. |
| codedeploy:ListDeploymentGroups | List deployment groups for a CodeDeploy application. Cortex uses this permission to discover deployment targets for CI/CD asset inventory. |
| codedeploy:ListTagsForResource | List tags for CodeDeploy resources. Cortex uses this permission to correlate CodeDeploy resources with organizational tagging policies. |
| comprehend:ListEntityRecognizers | List Amazon Comprehend entity recognizers. Cortex uses this permission to discover machine learning resources for asset inventory and security assessment. |
| comprehend:ListTagsForResource | List tags for Amazon Comprehend resources. Cortex uses this permission to correlate Comprehend resources with organizational tagging policies. |
| comprehendmedical:ListEntitiesDetectionV2Jobs | List entity detection jobs in Amazon Comprehend Medical. Cortex uses this to discover and inventory healthcare AI resources in the account as part of comprehensive asset discovery. This read-only operation ensures visibility into AI/ML workloads without affecting any running jobs. |
| config:DescribeAggregationAuthorizations | Retrieve AWS Config aggregation authorization details. Cortex uses this permission to assess cross-account Config aggregation settings for compliance monitoring. |
| connect-campaigns:DescribeCampaign | Retrieve details about a specific Amazon Connect outbound campaign. Cortex uses this to inventory contact center resources and assess their configurations as part of asset discovery. This read-only operation does not modify any campaign settings. |
| connect-campaigns:ListCampaigns | Provide a summary of all Amazon Connect outbound campaigns in the account. Cortex uses this to discover and inventory contact center resources for comprehensive security posture assessment. This read-only operation does not affect any campaign configurations. |
| controltower:GetLandingZone | Retrieve configuration details for an AWS Control Tower landing zone. Cortex uses this to assess Control Tower governance configurations and understand the multi-account management setup as part of asset discovery. This read-only operation does not modify any landing zone settings. |
| controltower:ListLandingZones | List all AWS Control Tower landing zones in the account. Cortex uses this to discover Control Tower deployments and assess governance configurations as part of comprehensive asset discovery. This read-only operation provides visibility into multi-account management without making changes. |
| controltower:ListTagsForResource | List tags associated with AWS Control Tower resources. Cortex uses this to understand resource organization, ownership, and classification as part of asset discovery. This read-only operation helps maintain comprehensive visibility into resource metadata. |
| directconnect:DescribeConnections | List all AWS Direct Connect connections and their attributes in the account. Cortex uses this to inventory hybrid connectivity resources and assess network configurations for security posture management. This read-only operation does not modify any connection settings. |
| directconnect:DescribeDirectConnectGateways | Retrieve details about AWS Direct Connect gateways. Cortex uses this to discover and inventory network connectivity configurations as part of comprehensive asset discovery. This read-only operation provides visibility into hybrid network architecture without making changes. |
| directconnect:DescribeVirtualInterfaces | Display all virtual interfaces configured for the AWS account. Cortex uses this to inventory Direct Connect configurations and assess network connectivity for security analysis. This read-only operation does not modify any virtual interface settings. |
| ds:DescribeDirectories | Retrieve information about AWS Directory Service directories in the account. Cortex uses this to discover Active Directory configurations and assess identity infrastructure as part of asset discovery. This read-only operation provides visibility into directory services without modifying any settings. |
| ds:ListLogSubscriptions | List log subscriptions for AWS Directory Service directories. Cortex uses this permission to assess directory logging configurations for identity security monitoring. |
| ds:ListTagsForResource | List tags associated with a specific AWS Directory Service resource. Cortex uses this to understand directory resource organization and ownership as part of asset discovery. This read-only operation helps maintain comprehensive visibility into resource metadata. |
| ecs:DescribeCapacityProviders | Retrieve details of ECS capacity providers. Cortex uses this permission to inventory container compute capacity resources for security assessment. |
| forecast:ListTagsForResource | List tags associated with an Amazon Forecast resource. Cortex uses this to understand ML resource organization and ownership as part of comprehensive asset discovery. This read-only operation provides visibility into resource metadata without affecting any Forecast configurations. |
| glue:GetBlueprint | Retrieve details about an AWS Glue blueprint. Cortex uses this to inventory ETL configurations and assess data pipeline setups as part of asset discovery. This read-only operation does not modify any Glue resources. |
| glue:GetBlueprintRun | Retrieve details about a specific AWS Glue blueprint run. Cortex uses this to assess Glue workflow executions and understand data pipeline activity as part of asset discovery. This read-only operation does not affect any running workflows. |
| glue:GetBlueprintRuns | List execution history for AWS Glue blueprint runs. Cortex uses this to discover Glue execution history and assess data pipeline activity patterns as part of asset discovery. This read-only operation does not modify any Glue resources. |
| glue:GetConnection | Retrieve details of a Glue data connection. Cortex uses this permission to assess data integration connection configurations and security settings. |
| glue:GetConnections | List Glue data connections in the account. Cortex uses this permission to discover data integration endpoints and evaluate their security posture. |
| glue:GetMLTransforms | List Glue machine learning transforms. Cortex uses this permission to discover ML data processing resources for asset inventory. |
| glue:GetSecurityConfigurations | Retrieve security configurations for AWS Glue. Cortex uses this to assess Glue encryption and security settings, ensuring data pipeline security as part of asset discovery. This read-only operation provides visibility into security configurations without making changes. |
| glue:GetTags | Retrieve tags for Glue resources. Cortex uses this permission to correlate data pipeline resources with organizational tagging policies. |
| glue:ListBlueprints | List all AWS Glue blueprints in the account. Cortex uses this to discover Glue ETL configurations and inventory data pipeline resources as part of comprehensive asset discovery. This read-only operation does not modify any Glue resources. |
| guardduty:DescribePublishingDestination | Retrieve details of a GuardDuty finding export destination. Cortex uses this permission to assess threat detection reporting configurations for security monitoring. |
| guardduty:ListDetectors | List GuardDuty detectors in the account. Cortex uses this permission to discover threat detection resources and verify GuardDuty is enabled. |
| guardduty:ListPublishingDestinations | List GuardDuty finding export destinations. Cortex uses this permission to assess threat detection reporting configurations for security monitoring. |
| imagebuilder:GetDistributionConfiguration | Retrieve an EC2 Image Builder distribution configuration. Cortex uses this permission to assess image distribution settings for security posture evaluation. |
| imagebuilder:GetImage | Retrieve details of an EC2 Image Builder image. Cortex uses this permission to assess image configurations and identify security-relevant build settings. |
| imagebuilder:GetWorkflow | Retrieve details of an EC2 Image Builder workflow. Cortex uses this permission to assess image build workflow configurations for security evaluation. |
| imagebuilder:ListDistributionConfigurations | List EC2 Image Builder distribution configurations. Cortex uses this permission to discover image distribution resources for asset inventory. |
| imagebuilder:ListImageBuildVersions | List build versions for an EC2 Image Builder image. Cortex uses this permission to inventory image build history for security assessment. |
| imagebuilder:ListImages | List EC2 Image Builder images. Cortex uses this permission to discover image resources for asset inventory and security assessment. |
| imagebuilder:ListWorkflows | List EC2 Image Builder workflows. Cortex uses this permission to discover image build workflow resources for asset inventory. |
| kafka:ListClustersV2 | List Amazon MSK (Managed Streaming for Apache Kafka) clusters. Cortex uses this permission to discover streaming data resources for asset inventory and security assessment. |
| lakeformation:DescribeLakeFormationIdentityCenterConfiguration | Retrieve the AWS Lake Formation Identity Center configuration. Cortex uses this to assess data lake access configurations and identity governance as part of asset discovery. This read-only operation does not modify any Lake Formation settings. |
| lakeformation:GetLFTag | Retrieve details about a specific AWS Lake Formation tag. Cortex uses this to understand data lake governance configurations and tag-based access control as part of asset discovery. This read-only operation does not modify any Lake Formation resources. |
| lakeformation:ListLFTags | List all AWS Lake Formation tags in the account. Cortex uses this to discover Lake Formation tag configurations and assess data governance policies as part of asset discovery. This read-only operation provides visibility into tag-based access controls without making changes. |
| logs:DescribeSubscriptionFilters | List CloudWatch Logs subscription filters. Cortex uses this permission to assess log delivery configurations for security monitoring evaluation. |
| logs:GetDataProtectionPolicy | Retrieve the data protection policy for a CloudWatch Logs log group. Cortex uses this permission to assess sensitive data protection configurations for compliance evaluation. |
| logs:ListTagsLogGroup | List tags for a CloudWatch Logs log group. Cortex uses this permission to correlate log group resources with organizational tagging policies. |
| memorydb:DescribeSnapshots | Retrieve information about Amazon MemoryDB cluster snapshots. Cortex uses this to inventory in-memory database backups and assess data protection configurations as part of asset discovery. This read-only operation does not modify any snapshot settings. |
| memorydb:DescribeSubnetGroups | Retrieve a list of Amazon MemoryDB subnet groups. Cortex uses this to assess MemoryDB network configurations and understand database connectivity as part of asset discovery. This read-only operation does not modify any network settings. |
| mq:DescribeConfiguration | Retrieve details of an Amazon MQ broker configuration. Cortex uses this permission to assess message broker configuration settings for security evaluation. |
| mq:ListConfigurations | List Amazon MQ broker configurations. Cortex uses this permission to discover message broker configuration resources for asset inventory. |
| quicksight:DescribeUser | Retrieve details of a QuickSight user. Cortex uses this permission to assess business intelligence user configurations for access security evaluation. |
| quicksight:DescribeVPCConnection | Retrieve details of a QuickSight VPC connection. Cortex uses this permission to assess business intelligence network connectivity for security evaluation. |
| quicksight:ListUsers | List QuickSight users in the account. Cortex uses this permission to discover business intelligence user accounts for access security assessment. |
| quicksight:ListVPCConnections | List QuickSight VPC connections. Cortex uses this permission to discover business intelligence network connections for security assessment. |
| rds:DescribeDBClusterSnapshots | List RDS database cluster snapshots. Cortex uses this permission to discover database snapshots for data security posture management scanning. |
| rds:DescribeDBSubnetGroups | List RDS database subnet groups. Cortex uses this permission to assess database network configurations and subnet placement for security evaluation. |
| rds:DescribeGlobalClusters | List RDS global database clusters. Cortex uses this permission to discover cross-region database deployments for security posture assessment. |
| rds:ListTagsForResource | List tags for RDS resources. Cortex uses this permission to correlate database resources with organizational tagging policies. |
| redshift:DescribeClusterSubnetGroups | List Redshift cluster subnet groups. Cortex uses this permission to assess data warehouse network configurations for security evaluation. |
| redshift:DescribeEndpointAccess | List Redshift endpoint access configurations. Cortex uses this permission to assess data warehouse endpoint exposure for network security evaluation. |
| redshift-serverless:GetEndpointAccess | Retrieve details of a Redshift Serverless endpoint access configuration. Cortex uses this permission to assess serverless data warehouse endpoint exposure for security evaluation. |
| redshift-serverless:GetNamespace | Retrieve details of a Redshift Serverless namespace. Cortex uses this permission to assess serverless data warehouse configurations for security evaluation. |
| redshift-serverless:ListEndpointAccess | List Redshift Serverless endpoint access configurations. Cortex uses this permission to assess serverless data warehouse endpoint exposure for security evaluation. |
| redshift-serverless:ListNamespaces | List Redshift Serverless namespaces. Cortex uses this permission to discover serverless data warehouse resources for asset inventory. |
| redshift-serverless:ListSnapshots | List Redshift Serverless snapshots. Cortex uses this permission to inventory serverless data warehouse snapshots for data protection assessment. |
| redshift-serverless:ListTagsForResource | List tags for Redshift Serverless resources. Cortex uses this permission to correlate serverless data warehouse resources with organizational tagging policies. |
| sagemaker:DescribeDataQualityJobDefinition | Retrieve details of a SageMaker data quality monitoring job definition. Cortex uses this permission to assess ML data quality monitoring configurations for security evaluation. |
| sagemaker:DescribeFeatureGroup | Retrieve details of a SageMaker feature group. Cortex uses this permission to inventory ML feature store resources for data security assessment. |
| sagemaker:DescribeFlowDefinition | Retrieve details of a SageMaker human review workflow definition. Cortex uses this permission to assess ML workflow configurations for security evaluation. |
| sagemaker:DescribeModelPackageGroup | Retrieve details of a SageMaker model package group. Cortex uses this permission to inventory ML model registry resources for security assessment. |
| sagemaker:DescribePipeline | Retrieve details of a SageMaker ML pipeline. Cortex uses this permission to assess ML pipeline configurations for security evaluation. |
| sagemaker:DescribeProject | Retrieve details of a SageMaker project. Cortex uses this permission to inventory ML project resources for security posture assessment. |
| sagemaker:ListDataQualityJobDefinitions | List SageMaker data quality monitoring job definitions. Cortex uses this permission to discover ML data quality monitoring resources for asset inventory. |
| sagemaker:ListFeatureGroups | List SageMaker feature groups. Cortex uses this permission to discover ML feature store resources for data security assessment. |
| sagemaker:ListFlowDefinitions | List SageMaker human review workflow definitions. Cortex uses this permission to discover ML workflow resources for asset inventory. |
| sagemaker:ListImages | List SageMaker container images. Cortex uses this permission to discover ML container image resources for security assessment. |
| sagemaker:ListModelPackageGroups | List SageMaker model package groups. Cortex uses this permission to discover ML model registry resources for asset inventory. |
| sagemaker:ListProjects | List SageMaker projects. Cortex uses this permission to discover ML project resources for asset inventory. |
| sagemaker:ListTags | List tags for SageMaker resources. Cortex uses this permission to correlate ML resources with organizational tagging policies. |
| securityhub:GetFindingAggregator | Retrieve a Security Hub finding aggregator configuration. Cortex uses this permission to assess cross-region security finding aggregation for posture evaluation. |
| securityhub:ListFindingAggregators | List Security Hub finding aggregators. Cortex uses this permission to discover security finding aggregation configurations for posture assessment. |
| servicecatalog:DescribePortfolio | Retrieve details of a Service Catalog portfolio. Cortex uses this permission to assess service governance configurations for security evaluation. |
| servicecatalog:SearchProvisionedProducts | Search for provisioned Service Catalog products. Cortex uses this permission to discover provisioned service resources for asset inventory and governance assessment. |
| ssm:ListResourceDataSync | List Systems Manager resource data sync configurations. Cortex uses this permission to assess systems management data synchronization for security monitoring. |
| workspaces:DescribeTags | List tags associated with Amazon WorkSpaces resources. Cortex uses this to understand WorkSpaces resource organization and ownership as part of asset discovery. This read-only operation provides visibility into resource metadata without affecting any WorkSpaces configurations. |
| workspaces:DescribeWorkspaceDirectories | Retrieve details about Amazon WorkSpaces directories. Cortex uses this to inventory WorkSpaces directory configurations and assess identity integration as part of asset discovery. This read-only operation does not modify any directory settings. |
| workspaces:DescribeWorkspaces | List and describes Amazon WorkSpaces instances in the account. Cortex uses this to discover virtual desktop resources and assess their configurations for security posture management. This read-only operation does not modify any WorkSpaces settings. |
| xray:GetGroups | Retrieve X-Ray trace groups. Cortex uses this permission to discover application tracing configurations for observability asset inventory. |
| xray:GetSamplingRules | Retrieve X-Ray sampling rules. Cortex uses this permission to assess application tracing sampling configurations for observability evaluation. |
| xray:ListTagsForResource | List tags for X-Ray resources. Cortex uses this permission to correlate application tracing resources with organizational tagging policies. |
Log Collection
Conditional (opt-in). Routes AWS CloudTrail logs to a Cortex-owned pipeline, read by Cortex via OIDC federation.
CloudTrail Read Role: cortex-logs-ingestion-access
The customer-side IAM Role that Cortex assumes to read CloudTrail log objects.
The attached CloudTrailReadAccessPolicy is scoped exclusively to Cortex-created resources, with no access to any other S3 bucket, SQS queue, or KMS key in the customer's account.
| Created when | Audit Logs enabled with Automatic collection mode |
| Trust | sts:AssumeRoleWithWebIdentity from a Cortex-controlled identity federated through Google's OIDC provider, gated by accounts.google.com:oaud and accounts.google.com:sub conditions |
| Attached policy | CloudTrailReadAccessPolicy |
| Assignment scope | Deployment account only |
CloudTrail Read Policy: CloudTrailReadAccessPolicy
Attached to cortex-logs-ingestion-access.
A customer-managed policy that grants Cortex read access to the CloudTrail logs S3 bucket, the SQS notification queue, and the KMS key used to encrypt them.
| Created when | Audit Logs enabled with Automatic collection mode. |
| Attached to | cortex-logs-ingestion-access |
| Read/write profile | Read-only |
| Resource scoping | Exclusively Cortex-created resources (S3 logs bucket, SQS notification queue, KMS key), with no access to any other S3 bucket, SQS queue, or KMS key in the customer's account. |
CloudTrailReadAccessPolicy permissions:
| Permission | Purpose | Scope |
|---|---|---|
| kms:Decrypt | Decrypt the encrypted log files stored in the Cortex log bucket. Cortex uses a dedicated, Cortex-created encryption resource that is scoped exclusively to the Cortex log bucket and can't be used to decrypt any customer data. | The Cortex-created CloudTrail KMS key only: arn:aws:kms:<region>:<account-id>:key/<CloudTrailKMSKey> |
| s3:GetObject | Download a CloudTrail log file after AWS notifies Cortex that it has been written. This permission is scoped to the Cortex-created log bucket only. | Objects in the Cortex-created log bucket only: arn:aws:s3:::cortex-ct-logs-<account-id>-<tenant-id>/* |
| s3:ListBucket | View the list of log files in the Cortex-created log bucket. AWS requires this permission alongside s3:GetObject for downloads to succeed, and it is scoped to the Cortex-created log bucket only. | The Cortex-created log bucket only: arn:aws:s3:::cortex-ct-logs-<account-id>-<tenant-id> |
| sqs:ChangeMessageVisibility | Briefly extend the processing lock on large log files so that AWS doesn't resend the notification before ingestion completes. This permission is scoped to the Cortex-created queue only. | The Cortex-created notification queue only: arn:aws:sqs:<region>:<account-id>:cortex-ct-logs-queue-<account-id>-<tenant-id> |
| sqs:DeleteMessage | Remove a notification from the queue after successful ingestion so that the same log file is not processed twice. This permission is scoped to the Cortex-created queue only. | The Cortex-created notification queue only: arn:aws:sqs:<region>:<account-id>:cortex-ct-logs-queue-<account-id>-<tenant-id> |
| sqs:GetQueueAttributes | Check the pending notification count to support backlog tracking and queue health monitoring. This read-only permission is scoped to the Cortex-created queue only. | The Cortex-created notification queue only: arn:aws:sqs:<region>:<account-id>:cortex-ct-logs-queue-<account-id>-<tenant-id> |
| sqs:ReceiveMessage | Read "new log file is ready" notifications from the Cortex-created queue to trigger log ingestion. This permission is scoped to the Cortex-created queue only. | The Cortex-created notification queue only: arn:aws:sqs:<region>:<account-id>:cortex-ct-logs-queue-<account-id>-<tenant-id> |
Stack Lifecycle Role: EmptyBucketLambdaExecutionRole
An in-account IAM role used exclusively by an AWS Lambda custom resource that the Cortex onboarding CloudFormation template provisions to support stack lifecycle operations. Specifically, it empties a Cortex-provisioned S3 bucket of all objects, object versions, and delete markers so that CloudFormation can delete the bucket during stack teardown.
This role is not accessible to Cortex. Cortex has no trust relationship to it and cannot assume, invoke, or otherwise use it. It is invoked only by the AWS Lambda service inside the customer's own AWS account.
| Created when | Created automatically by any Cortex onboarding template that provisions an S3 bucket which must be emptied before deletion. For example: DSPM scan-results buckets, log/CloudTrail buckets, or Automation artifact buckets. |
| Lifecycle | Bound 1:1 to the parent CloudFormation stack. The role is removed when the stack is deleted. |
| Trust | sts:AssumeRole from the AWS Lambda service principal (lambda.amazonaws.com) only. No Cortex principal is listed in the trust policy and no sts:ExternalId condition is present, because no external party, including Cortex, is ever permitted to assume this role. |
Bucket Cleanup Policy: EmptyS3BucketPolicy
Attached to EmptyBucketLambdaExecutionRole
A customer-managed policy that grants the cleanup Lambda the S3 list/delete permissions needed to empty the CloudTrail logs bucket on stack deletion.
| Created when | Audit Logs enabled. |
| Attached to | EmptyBucketLambdaExecutionRole |
| Resource scoping | Cortex-created CloudTrail logs S3 bucket only. |
| Lifecycle | Exercised only on stack deletion. |
EmptyS3BucketPolicy permissions:
| Permission | Purpose | Scope |
|---|---|---|
| s3:DeleteObject | Delete an object from an S3 bucket. Cortex uses this permission to remove temporary scan artifacts after scanning and processing is complete. | The Cortex-created CloudTrail logs bucket only: arn:aws:s3:::cortex-ct-logs-<account-id>-<tenant-id> and arn:aws:s3:::cortex-ct-logs-<account-id>-<tenant-id>/* |
| s3:DeleteObjectVersion | Delete a specific, version-controlled instance of an object from an S3 bucket. Cortex uses this permission to permanently remove older or duplicated versions of temporary scan artifacts, preventing unnecessary storage costs and ensuring the S3 bucket is completely emptied upon stack deletion. | The Cortex-created CloudTrail logs bucket only: arn:aws:s3:::cortex-ct-logs-<account-id>-<tenant-id> and arn:aws:s3:::cortex-ct-logs-<account-id>-<tenant-id>/* |
| s3:ListBucket | List the contents of the CloudTrail logs S3 bucket. Cortex uses this to discover available log files for ingestion, enabling continuous and complete security monitoring of AWS environments. | The Cortex-created CloudTrail logs bucket only: arn:aws:s3:::cortex-ct-logs-<account-id>-<tenant-id> and arn:aws:s3:::cortex-ct-logs-<account-id>-<tenant-id>/* |
Agentless Disk Scanning (ADS)
A customer-managed policy that ADS attaches to the Base capability's CortexPlatformRole. ADS does not create a separate IAM Role.
ADS Policy: Cortex-ADS-Policy
Attached to CortexPlatformRole
A customer-managed policy that ADS attaches to the Base capability's CortexPlatformRole. ADS does not create a separate IAM Role.
| Created when | Agentless Disk Scanning capability enabled. |
| Attached to | CortexPlatformRole |
| Tag scoping | All write/delete actions scoped to tag managed_by=paloaltonetworks, so Cortex can only modify snapshots and images Cortex itself created. |
| Condition scoping | KMS grants scoped to kms:ViaService = ec2.*.amazonaws.com. |
Cortex-ADS-Policy permissions:
| Permission | Purpose | Scope |
|---|---|---|
| ec2:CopyImage | Copy encrypted Amazon Machine Images (AMIs) along with their associated snapshots for agentless disk scanning. The tagging condition ensures that any snapshots created during the copy operation are properly tagged, providing clear resource ownership and enabling automated cleanup after scanning completes. | ec2:*::image/* (no condition)ec2:*::snapshot/* where aws:RequestTag/managed_by = paloaltonetworks |
| ec2:CopySnapshot | Create destination snapshots during the copy operation for agentless disk scanning. Cortex uses this to complete the re-encryption process, ensuring all newly created snapshot copies are properly labeled for lifecycle management and automated cleanup after analysis. | Source — ec2:*::snapshot/snap-* where aws:ResourceTag/managed_by = paloaltonetworksDestination — ec2:*::snapshot/${*} where aws:RequestTag/managed_by = paloaltonetworks (the ${*} suffix is the CopySnapshotSuffix parameter default that constrains the destination snapshot's name pattern) |
| ec2:CreateSnapshot | Create new snapshots and tag them during the creation process for agentless disk scanning. Cortex uses this to ensure all snapshots it creates are properly identified for tracking, cost visibility, and automated cleanup after scanning completes. | Volume access — ec2:*:*:volume/* (no condition)Snapshot creation — ec2:*::snapshot/* where aws:RequestTag/managed_by = paloaltonetworks |
| ec2:CreateSnapshots | Create snapshots in batch and tag them during the creation process for agentless disk scanning. Cortex uses this to ensure all batch-created snapshots are properly identified for tracking, cost visibility, and automated cleanup after scanning completes. | Source resources — ec2:*:*:instance/* AND ec2:*:*:volume/* (no condition)Snapshot output — ec2:*::snapshot/* where aws:RequestTag/managed_by = paloaltonetworks |
| ec2:CreateTags | Apply tags to snapshots and images created by Cortex during ADS scanning. Tagging is gated by the ec2:CreateAction condition so this permission can only tag resources that were just created by one of the listed actions in the same API call — it cannot be used to tag arbitrary existing resources. |
Snapshots — ec2:*::snapshot/* where ec2:CreateAction ∈ [CreateSnapshot, CopySnapshot, CreateSnapshots, CopyImage]Images — ec2:*::image/* where ec2:CreateAction = CopyImage AND aws:RequestTag/managed_by = paloaltonetworks |
| ec2:DeleteSnapshot | Delete temporary snapshots after agentless disk scanning completes. Cortex removes snapshots it created during the scanning process to minimize storage costs and maintain a clean customer environment. Customer-owned snapshots are never affected. | ec2:*::snapshot/* where ec2:ResourceTag/managed_by = paloaltonetworks |
| ec2:DeregisterImage | Deregister temporary AMI images created during the agentless disk scanning process. Cortex removes these ephemeral re-encrypted images after scanning completes to prevent orphaned resources and unnecessary costs. Customer-owned images are never affected. | ec2:*::image/* where ec2:ResourceTag/managed_by = paloaltonetworks |
| ec2:DescribeImages | Retrieve the status and metadata of EC2 images during agentless disk scanning operations. Cortex uses this read-only permission to monitor image creation progress and verify that copied images are ready for scanning. No modifications are made to any customer resources. | * (no condition) |
| ec2:DescribeSnapshots | Retrieve the status and metadata of EBS snapshots during agentless disk scanning operations. Cortex uses this read-only permission to monitor snapshot creation progress and verify that snapshots are ready for scanning. No modifications are made to any customer resources. | * (no condition) |
| ec2:ModifySnapshotAttribute | Share snapshots with the Palo Alto Networks outpost scanning account for agentless disk analysis. Cortex modifies snapshot attributes to grant cross-account access so that the scanning infrastructure can analyze disk contents. Customer-owned snapshots are never shared. | ec2:*::snapshot/* where ec2:Add/userId = ${OutpostAccountId} AND ec2:ResourceTag/managed_by = paloaltonetworks |
| kms:CreateGrant | Create KMS grants that authorize the EC2 service to perform the cryptographic operations required for cross-account agentless disk scanning. Two separate grants are issued: one against the source (customer) key to allow Decrypt and Encrypt for snapshot re-encryption, and one against the Cortex ADS scanning key to allow Encrypt only on the destination. | Source key grant (any account) — kms:*:*:key/* where kms:ViaService LIKE ec2.*.amazonaws.com AND kms:GrantIsForAWSResource = true AND kms:GrantOperations ⊆ [Decrypt, Encrypt]Cortex ADS key grant (Cortex account only) — kms:*:${KmsAccountADS}:key/* where kms:ViaService LIKE ec2.*.amazonaws.com AND kms:GrantIsForAWSResource = true AND kms:GrantOperations ⊆ [Encrypt] |
| kms:DescribeKey | Read KMS key metadata such as algorithm, state, and key usage on Cortex-managed KMS keys in the Cortex ADS scanning account. AWS requires this metadata before any cryptographic operation against those keys can be performed during agentless disk scanning. Restricted to keys in the Cortex ADS KMS account, and only when the call is made via the EC2 service. | kms:*:${KmsAccountADS}:key/* where StringLike kms:ViaService = ec2.*.amazonaws.com |
| kms:GenerateDataKeyWithoutPlaintext | Obtain an encrypted data key from the Cortex-managed ADS KMS key for envelope encryption of EBS snapshots being re-encrypted into the Cortex scanning account during cross-account agentless disk scanning. The plaintext form of the data key is never returned to Cortex. Restricted to keys in the Cortex ADS KMS account, and only when invoked via the EC2 service. | kms:*:${KmsAccountADS}:key/* where StringLike kms:ViaService = ec2.*.amazonaws.com |
Registry Scan
Conditional (opt-in). Lets Cortex pull customer container images from Amazon ECR for security scanning.
Cortex Scanner Role: CortexPlatformScannerRole
A second customer-side IAM Role (distinct from CortexPlatformRole) created whenever any of Registry Scanning, DSPM, or Serverless Scanning is enabled.
| Created when | Any of Registry Scanning, Serverless Scanning, or DSPM capabilities are enabled. |
| Trust | sts:AssumeRole from Cortex scanners principal, gated by sts:ExternalId condition |
| Inline statements | None |
| AWS-managed policies | ReadOnlyAccess |
| Cortex-managed policies | Conditional by capability:Registry Scan: ECRAccessPolicyServerless Scan: LAMBDAAccessPolicyDSPM: Cortex-DSPM-Scanner-Policy |
| Assignment scope | Deployment account; at Account Group / Organization scope. Also every member account under the target organizational unit. |
Registry Scanning Policy: ECRAccessPolicy
Attached to CortexPlatformScannerRole
A customer-managed policy that adds ECR pull access to the shared scanner role.
| Created when | Registry scanning capability enabled. |
| Attached to | CortexPlatformScannerRole |
| Function | ECR pull access |
ECRAccessPolicy permissions:
| Permission | Purpose |
|---|---|
| ecr:BatchGetImage | Retrieve detailed information for container images stored in Amazon ECR, which is required to pull the image. Cortex uses this permission to download container images for vulnerability scanning, identifying security issues in containerized workloads. This read-only operation does not modify any images or registry configurations. |
| ecr:GetDownloadUrlForLayer | Fetches the download URL for the individual layers that make up a container image in Amazon ECR. Cortex uses this as part of the image pull process to efficiently download each layer for vulnerability scanning and security analysis. This is a read-only operation that does not modify any registry content. |
| ecr:GetAuthorizationToken | Creates a temporary login token for authenticating with Amazon ECR. Cortex requires this token to securely authenticate before pulling container images for vulnerability scanning. The token is short-lived and used solely for read-only image retrieval operations during registry scanning. |
Serverless Scan
Conditional (opt-in). Lets Cortex read AWS Lambda function code, configuration, and layer versions for security scanning. Read-only: no invoke, update, or delete.
Serverless Scanning Policy: LAMBDAAccessPolicy
A customer-managed policy that Serverless Scanning attaches to the shared CortexPlatformScannerRole.
| Created when | Serverless Scanning capability enabled. |
| Attached to | CortexPlatformScannerRole |
| Read/write profile | Read-only access to Lambda function code, configuration, and layer versions. No invoke, update, or delete. |
LAMBDAAccessPolicy permissions:
| Permission | Purpose |
|---|---|
| lambda:GetFunction | Retrieve a Lambda function's configuration along with a presigned URL to download its deployment package (code zip or container image manifest). Cortex uses this presigned URL to pull the function's code into the scanner so it can be statically analyzed for vulnerabilities, malware, and embedded secrets. |
| lambda:GetFunctionConfiguration | Retrieve a Lambda function's configuration metadata (runtime, handler, environment variables, layers, execution role, VPC settings, and timeout) without returning the code download URL. Cortex uses these settings to determine how to interpret the function (runtime/handler), which layers must also be fetched, and to flag risky configuration such as plaintext secrets in environment variables. |
| lambda:GetLayerVersion | Retrieve a specific version of a Lambda layer, including a presigned URL to download the layer's content. Cortex uses this to download every layer referenced by a scanned function so the layer code is included in the same vulnerability, malware, and secrets analysis applied to the function itself. |
Data Security Posture Management (DSPM)
Conditional (opt-in). Discovers, classifies, and assesses customer data assets across S3, RDS, DynamoDB, Redshift, and EBS. Unlike CSPM, DSPM reads actual customer data content (object samples and database rows) for sensitive-data classification.
DSPM Policy: Cortex-DSPM-Policy
A customer-managed policy that DSPM attaches to the Base capability's CortexPlatformRole. Grants the lifecycle and read permissions DSPM needs to discover sensitive data, orchestrate snapshot exports, and prepare data for the scanner role to actually read.
Attached to CortexPlatformRole
| Created when | DSPM capability enabled |
| Attached to | CortexPlatformRole |
| Tag scoping | Destructive RDS / Redshift snapshot deletes scoped to tag managed_by=paloaltonetworks (Cortex-owned snapshots only). |
| Resource scoping | S3 read = * because DSPM discovers sensitive data in arbitrary buckets; S3 write/delete limited to the Cortex-internal cortex-artifact* buckets. |
Cortex-DSPM-Policy permissions:
| Permission | Purpose | Scope |
|---|---|---|
| cloudwatch:GetMetricStatistics | Read service usage metrics from CloudWatch. Cortex uses this to size DSPM scan operations and monitor resource consumption. | * (no condition) |
| dynamodb:DescribeTable | Read DynamoDB table schemas and configurations. Cortex uses this to discover and assess DynamoDB tables as data assets. | dynamodb:*:${AWS::AccountId}:table/* (no condition) |
| iam:PassRole | Pass the CortexPlatformRole to the RDS service so that RDS can write exported snapshot data to the Cortex S3 bucket on Cortex's behalf. Restricted to rds.amazonaws.com. | iam::${AWS::AccountId}:role/${CortexPlatformRoleName}* where iam:PassedToService = rds.amazonaws.com |
| kms:CreateGrant | Create KMS grants that authorize the RDS export service to use customer or Cortex KMS keys when writing encrypted snapshot data to S3. Grant scoped to AWS resources only. | kms:*:*:key/* where Bool kms:GrantIsForAWSResource = true |
| kms:DescribeKey | Read Cortex-managed KMS key metadata. Cortex uses this to perform encrypted snapshot export and re-encryption. | kms:*:${MTKmsAccountDSPM}:key/* (no condition) |
| kms:GenerateDataKeyWithoutPlaintext | Generate envelope-encryption data keys without exposing plaintext. Cortex uses this to protect exported snapshot data. | kms:*:${MTKmsAccountDSPM}:key/* (no condition) |
| rds:AddTagsToResource | Add tags to RDS resources. Cortex uses this to tag Cortex-created snapshots with the managed_by=paloaltonetworks tag, enabling safe lifecycle management and cleanup. |
* (no condition) |
| rds:CreateDBClusterSnapshot | Create a point-in-time snapshot of an RDS cluster. Cortex uses this to capture cluster state for scanning. | * (no condition) |
| rds:CreateDBSnapshot | Create a point-in-time snapshot of an RDS instance. Cortex uses this to capture instance state so that DSPM can scan it without impacting production. | * (no condition) |
| rds:DeleteDBClusterSnapshot | Delete RDS cluster snapshots. Cortex uses this to clean up Cortex-created cluster snapshots after scanning, minimizing storage cost. Restricted to resources with the managed_by=paloaltonetworks tag. |
* where aws:ResourceTag/managed_by = paloaltonetworks |
| rds:DeleteDBSnapshot | Delete RDS database snapshots. Cortex uses this to clean up Cortex-created instance snapshots after scanning, minimizing storage cost. Restricted to resources carrying the managed_by=paloaltonetworks tag. |
* where aws:ResourceTag/managed_by = paloaltonetworks |
| rds:DescribeDBClusters | List RDS database clusters in the account. Cortex uses this to discover database clusters as scan targets. | * (no condition) |
| rds:DescribeDBClusterSnapshots | List existing RDS cluster snapshots. Cortex uses this to identify candidates for export and scanning. | * (no condition) |
| rds:DescribeDBInstances | List RDS database instances in the account. Cortex uses this to identify data assets eligible for sensitive-data classification. | * (no condition) |
| rds:DescribeDBSnapshots | List existing RDS instance snapshots. Cortex uses this to identify candidates for export and scanning. | * (no condition) |
| rds:DescribeExportTasks | List RDS export tasks in the account. Cortex uses this to monitor snapshot export progress and determine when data is ready for scanning. | * (no condition) |
| rds:StartExportTask | Start an RDS export task. Cortex uses this to export RDS snapshot data to the Cortex S3 artifact bucket where DSPM scanners can read it. | * (no condition) |
| redshift:CreateClusterSnapshot | Create a snapshot of a Redshift cluster. Cortex uses this to capture cluster state for sensitive-data classification without impacting production. | * (no condition) |
| redshift:CreateTags | Add tags to Redshift resources. Cortex uses this to tag Cortex-created Redshift snapshots for tracking and automated cleanup. | * (no condition) |
| redshift:DeleteClusterSnapshot | Delete Redshift cluster snapshots. Cortex uses this to clean up Cortex-created Redshift snapshots after scanning. Restricted to resources carrying the managed_by=paloaltonetworks tag. |
* where aws:ResourceTag/managed_by = paloaltonetworks |
| redshift:DescribeClusters | List Redshift clusters in the account. Cortex uses this to discover data warehouses as scan targets. | * (no condition) |
| redshift:DescribeClusterSnapshots | List existing Redshift cluster snapshots. Cortex uses this to identify snapshots available for scanning. | * (no condition) |
| redshift-serverless:DeleteResourcePolicy | Delete resource policies from Redshift Serverless resources. Cortex uses this to revoke temporary scan access after scanning completes. Restricted to resources carrying the managed_by=paloaltonetworks tag. |
* where aws:ResourceTag/managed_by = paloaltonetworks |
| redshift-serverless:GetResourcePolicy | Read resource policies from Redshift Serverless resources. Cortex uses this to review existing policies before granting temporary scan access. | * where aws:ResourceTag/managed_by = paloaltonetworks |
| redshift-serverless:PutResourcePolicy | Set resource policies on Redshift Serverless resources. Cortex uses this to establish temporary access to Redshift Serverless namespaces so that DSPM scanners can read data. | * where aws:ResourceTag/managed_by = paloaltonetworks |
| s3:DeleteObject | Delete an object from an S3 bucket. Cortex uses this to remove temporary scan artifacts from Cortex-managed cortex-artifact* buckets after processing. | s3:::cortex-artifact*, s3:::cortex-artifact*/* (no condition) |
| s3:GetBucketLocation | Retrieve the region of an S3 bucket. Cortex uses this to resolve the region of the Cortex artifact bucket for cross-region data transfer operations. | s3:::cortex-artifact*, s3:::cortex-artifact*/* (no condition) |
| s3:GetObject | Download objects from an S3 bucket. Cortex uses this to retrieve S3 object samples for sensitive-data classification and to read DSPM artifacts from Cortex buckets. | s3:::cortex-artifact*, s3:::cortex-artifact*/* (no condition)s3:::* (no condition) |
| s3:GetObjectAcl | Retrieve the access control list (ACL) of an S3 object. Cortex uses this to inspect per-object access controls and assess S3 data exposure risk. | s3:::* (no condition) |
| s3:ListBucket | List the contents of an S3 bucket. Cortex uses this to enumerate objects in customer S3 buckets and identify sensitive-data scan targets. | s3:::cortex-artifact*, s3:::cortex-artifact*/* (no condition)s3:::* (no condition) |
| s3:PutObject | Upload objects to an S3 bucket. Cortex uses this to write scan artifacts and intermediate data into the Cortex-managed cortex-artifact* S3 buckets. | s3:::cortex-artifact*, s3:::cortex-artifact*/* (no condition) |
DSPM Policy: Cortex-DSPM-Scanner-Policy
A customer-managed policy that DSPM attaches to the shared CortexPlatformScannerRole. This is the role that actually reads customer data content for sensitive-data classification (the discovery/orchestration policy above runs on CortexPlatformRole).
Attached to CortexPlatformScannerRole
| Created when | DSPM capability enabled |
| Attached to | CortexPlatformScannerRole |
| Function | Reads customer data content (object samples / database rows) for sensitive-data classification. |
Cortex-DSPM-Scanner-Policy permissions:
| Permission | Purpose | Scope |
|---|---|---|
| cloudwatch:GetMetricStatistics | Read AWS service usage metrics. Cortex uses this to pace scan throughput and avoid impacting customer workloads. | * |
| dynamodb:DescribeTable | Read DynamoDB table schema and configuration. Cortex uses this to characterize the table as a data asset prior to sampling. | dynamodb:*:${AWS::AccountId}:table/* |
| dynamodb:Scan | Sample rows from DynamoDB tables. Cortex uses this for sensitive-data classification. | dynamodb:*:${AWS::AccountId}:table/* |
| iam:PassRole | Pass the scanner role to AWS services that act on the scanner's behalf during scan orchestration. Restricted to roles whose name begins with CortexPlatformScannerRole in the same account. | iam::${AWS::AccountId}:role/${CortexPlatformScannerRoleName}* |
| kms:Decrypt | Decrypt KMS-encrypted customer data and exported snapshot payloads. Cortex uses this so that DSPM can analyze plaintext content for sensitive-data classification. | * |
| kms:DescribeKey | Read KMS key metadata. Cortex uses this to perform cryptographic operations against encrypted customer data and against Cortex-managed keys. | Customer keys — * (no condition), paired with kms:DecryptCortex-managed key — kms:*:${MTKmsAccountDSPM}:key/* (no condition), paired with kms:GenerateDataKeyWithoutPlaintext |
| kms:GenerateDataKeyWithoutPlaintext | Obtain an encrypted data key from the Cortex-managed KMS key. Cortex uses this for envelope-encryption operations performed during DSPM scanning. Scoped to the Cortex-managed KMS account only; the plaintext key is never returned to the scanner. | kms:*:${MTKmsAccountDSPM}:key/* |
| s3:GetBucketLocation | Resolve the AWS region of the Cortex artifact bucket. Cortex uses this so that the scanner connects to the correct regional S3 endpoint. | s3:::cortex-artifact*s3:::cortex-artifact*/* |
| s3:GetObject | Retrieve S3 object contents. Cortex uses this for both customer data samples for classification and DSPM-exported snapshot data staged in Cortex artifact buckets. | Cortex-managed DSPM artifact buckets — s3:::cortex-artifact*, s3:::cortex-artifact*/*Customer-data classification reads — * (account-wide) |
| s3:GetObjectAttributes | Retrieve object metadata such as size, checksum, and storage class. Cortex uses this to inspect objects in Cortex artifact buckets prior to retrieval. | s3:::cortex-artifact*s3:::cortex-artifact*/* |
| s3:ListBucket | List the contents of an S3 bucket. Cortex uses this to discover customer objects eligible for sensitive-data classification and to locate exported DSPM artifacts. | Cortex-managed DSPM artifact buckets — s3:::cortex-artifact*, s3:::cortex-artifact*/*Customer-data classification enumeration — * (account-wide) |
Kubernetes Security
Opt-in (AWS-only feature). Installs a tightly-scoped EKS access entry on each customer EKS cluster, granting Cortex read-only Kubernetes API access (AmazonEKSAdminViewPolicy) for cluster posture assessment. All access entries are tag-scoped to managed_by=paloaltonetworks, so Cortex can only manage entries it created itself.
Kubernetes Security Policy: Cortex-K8s-Security-Policy
Attached to CortexPlatformRole
A customer-managed policy that lets Cortex install one EKS access entry per cluster, associate it with the AWS-managed AmazonEKSAdminViewPolicy (read-only Kubernetes API access), and remove it on off-boarding.
Every action is double-restricted: The resource ARN is scoped to EKS clusters/access-entries in the customer's own account, and also the access entry must carry the tag managed_by=paloaltonetworks, so Cortex cannot create, modify, or delete any EKS access entry that does not carry this tag.
| Created when | Kubernetes Security capability enabled. |
| Attached to | CortexPlatformRole |
| Resource scoping | EKS clusters / access-entries in the customer's own account. |
| Tag scoping | Access entry must carry tag managed_by=paloaltonetworks (double-restricted with resource ARN). |
| Associated Kubernetes permission | AWS-managed AmazonEKSAdminViewPolicy (read-only Kubernetes API access). |
Cortex-K8s-Security-Policy permissions:
| Permission | Purpose | Scope |
|---|---|---|
| eks:AssociateAccessPolicy | Bind the AWS-managed AmazonEKSAdminViewPolicy, which grants read-only Kubernetes API access, to a Cortex-tagged access entry. The IAM condition hard-restricts the associable policy to this single ARN, so no other Kubernetes access policy can be associated through this grant. | eks:*:${AWS::AccountId}:access-entry/* where eks:policyArn = arn:aws:eks::aws:cluster-access-policy/AmazonEKSAdminViewPolicy AND aws:ResourceTag/managed_by = paloaltonetworks |
| eks:CreateAccessEntry | Create an IAM-to-Kubernetes access entry on a customer EKS cluster. Cortex uses this to authenticate to the cluster's Kubernetes API. The entry must be created with the managed_by=paloaltonetworks tag. |
eks:*:${AWS::AccountId}:cluster/* where aws:RequestTag/managed_by = paloaltonetworks |
| eks:DeleteAccessEntry | Remove a Cortex-tagged EKS access entry from a cluster. Restricted to entries with the managed_by=paloaltonetworks tag, so Cortex cannot delete entries it did not create itself. |
eks:*:${AWS::AccountId}:access-entry/* where aws:ResourceTag/managed_by = paloaltonetworks |
| eks:ListAssociatedAccessPolicies | Read which AWS-managed Kubernetes access policies are currently bound to a Cortex-tagged EKS access entry. Cortex uses this to verify the access configuration. | eks:*:${AWS::AccountId}:access-entry/* where aws:ResourceTag/managed_by = paloaltonetworks |
| eks:TagResource | Tag a Cortex-created EKS access entry with the managed_by=paloaltonetworks tag. This tag is what subsequently scopes all read, associate, and delete actions to Cortex-owned entries. |
eks:*:${AWS::AccountId}:access-entry/* where aws:RequestTag/managed_by = paloaltonetworks |
Automations
Conditional (opt-in). Lets Cortex execute manual and automatic response and orchestration actions on customer AWS resources, via built-in quick actions, playbooks, and custom responses authored by the customer.
Note
Unified Cortex platform cloud content packs require a specific set of automation permissions to enable full integration with your cloud environment. Before configuring access for these packs, review the automation permission scope guidelines.
Automation Policy: Cortex-Automation-Policy
A customer-managed policy that grants the Base capability's CortexPlatformRole write and delete actions across multiple AWS service categories (EC2, S3, IAM, KMS, Lambda, RDS, EKS, ECS, SSM, Secrets Manager, and others) so Cortex can execute response and remediation playbooks against any resource the playbook targets. Statements are scoped by action, not by tag or resource ARN. Every statement uses Resource: "*", which is what allows playbooks to act on resources Cortex did not itself create.
Attached to CortexPlatformRole.
| Created when | Automation capability enabled. |
| Attached to | CortexPlatformRole |
Cortex-Automation-Policy permissions:
| Permission | Purpose |
|---|---|
| acm:UpdateCertificateOptions | Update the options for a specified ACM certificate. Cortex uses this for automated remediation of certificate configuration issues, helping maintain proper TLS/SSL security posture across AWS resources. This permission is invoked only when a security policy violation related to certificate management is detected and remediation is triggered. |
| budgets:DescribeBudgets | Retrieve the configured budgets for the account. Cortex uses this for cost monitoring and alerting capabilities, helping customers maintain visibility into cloud spending patterns. This read-only operation does not modify any budget configurations. |
| budgets:DescribeNotificationsForBudget | Retrieve the notification details associated with a specific budget. Cortex uses this to understand existing alerting configurations and provide comprehensive cost management insights for automation workflows. This read-only operation does not modify any notification settings. |
| ce:GetCostAndUsage | Retrieve detailed cost and usage data for the account. Cortex uses this for cloud cost analysis and optimization recommendations, helping customers understand and manage their AWS spending. This read-only operation provides financial visibility without modifying any billing configurations. |
| ce:GetCostForecast | Retrieve a forecast of future costs and usage for the account. Cortex uses this to provide predictive cost insights, helping customers plan budgets and identify potential cost anomalies. This read-only operation does not modify any billing or cost configurations. |
| cloudtrail:DescribeTrails | Retrieve information about the trails configured in CloudTrail. Cortex uses this to assess audit logging coverage and identify gaps in security monitoring across AWS accounts. This read-only operation provides visibility into logging configurations without modifying any trail settings. |
| cloudtrail:StartLogging | Start CloudTrail logging as automated remediation when an issue is detected due to the rule: AWS CloudTrail Logging Stopped. Cortex uses this to ensure audit logging is active, maintaining compliance with security best practices. This remediation action is triggered only when a specific security policy violation is detected. |
| cloudtrail:UpdateTrail | Update CloudTrail trail settings for automated remediation of misconfigurations, such as enabling log file validation when the rule AWS CloudTrail Log File Validation Disabled is triggered. Cortex uses this to ensure proper audit logging coverage and compliance with security best practices. This remediation action is invoked only when a specific security policy violation is detected. |
| ec2:AllocateAddress | Allocate an Elastic IP address. Cortex uses this permission for automated remediation workflows that require assigning a static IP address to a resource. This action is invoked only when a security policy violation is detected. |
| ec2:AllocateHosts | Allocate a Dedicated Host for EC2 instances. Cortex uses this permission for automated remediation of compliance requirements that mandate dedicated tenancy. This action is invoked only when a security policy violation is detected. |
| ec2:AssociateAddress | Associate an Elastic IP address with an EC2 instance or network interface. Cortex uses this permission for automated remediation of network configuration issues. This action is invoked only when a security policy violation is detected. |
| ec2:AttachVolume | Attach an EBS volume to an EC2 instance. Cortex uses this permission for automated remediation workflows that require volume management. This action is invoked only when a security policy violation is detected. |
| ec2:AuthorizeSecurityGroupEgress | Authorize outbound network access rules for a security group. Cortex uses this for automated remediation of network security issues, helping maintain proper egress controls. This permission is invoked only when a security policy violation related to network egress is detected and remediation is triggered. |
| ec2:AuthorizeSecurityGroupIngress | Configure inbound network access rules for remediation of issues detected due to the rule: AWS EC2 Security Group with Ingress Rule Not Authorized. Cortex uses this for automated security remediation to restrict overly permissive access rules. This permission is invoked only when a specific security policy violation is detected. |
| ec2:CopyImage | Copy an AMI during response playbooks (forensic preservation, hardened-baseline redistribution). This action is invoked only when a specific playbook is triggered. |
| ec2:CopySnapshot | Copy an EBS snapshot during response playbooks (forensic snapshot copy before remediation, cross-region evidence relocation, or re-encryption workflows). This action is invoked only when a specific playbook is triggered. |
| ec2:CreateFleet | Create an EC2 Fleet request to launch instances. Cortex uses this permission for automated remediation workflows that require provisioning compliant compute resources. This action is invoked only when a security policy violation is detected. |
| ec2:CreateImage | Create an Amazon Machine Image (AMI) from an EC2 instance. Cortex uses this permission for automated remediation workflows that require capturing instance state before applying changes. This action is invoked only when a security policy violation is detected. |
| ec2:CreateLaunchTemplate | Create an EC2 launch template. Cortex uses this permission for automated remediation workflows that require defining compliant instance launch configurations. This action is invoked only when a security policy violation is detected. |
| ec2:CreateNetworkAcl | Create a new network access control list (ACL) in a VPC. Cortex uses this for automated network security remediation, implementing additional network-level access controls when needed. This permission is invoked only as part of remediation workflows to address detected security issues. |
| ec2:CreateNetworkAclEntry | Create an entry in a network ACL. Cortex uses this permission for automated remediation of network access control issues by adding security rules. This action is invoked only when a security policy violation is detected. |
| ec2:CreateSecurityGroup | Create a new network security group. Cortex uses this for automated remediation workflows that require creating properly configured security groups to address detected security issues. Security groups are created with appropriate rules to maintain the desired security posture. |
| ec2:CreateSnapshot | Capture disk state during response playbooks (e.g., before stopping a compromised instance or changing attributes) to preserve evidence. This action is invoked only when a specific playbook is triggered. |
| ec2:CreateTags | Tag EC2 resources created or modified by playbooks (e.g., incident-id, cortex-playbook) for audit trail and cleanup. This action is invoked only as part of remediation workflows. |
| ec2:CreateTrafficMirrorSession | Create a traffic mirror session for network traffic inspection. Cortex uses this permission for automated remediation workflows that require network traffic analysis for security investigation. This action is invoked only when a security policy violation is detected. |
| ec2:CreateVolume | Create an EBS volume. Cortex uses this permission for automated remediation workflows that require provisioning encrypted or compliant storage volumes. This action is invoked only when a security policy violation is detected. |
| ec2:CreateVpcEndpoint | Create a VPC endpoint for private connectivity to AWS services. Cortex uses this permission for automated remediation of network security by enabling private service access without internet exposure. This action is invoked only when a security policy violation is detected. |
| ec2:DeleteFleets | Delete EC2 Fleet requests. Cortex uses this permission for automated cleanup of fleet resources created during remediation workflows. This action is invoked only when a security policy violation is detected. |
| ec2:DeleteInternetGateway | Delete an internet gateway. Cortex uses this permission for automated remediation of network isolation requirements by removing unnecessary internet access points. This action is invoked only when a security policy violation is detected. |
| ec2:DeleteLaunchTemplate | Delete an EC2 launch template. Cortex uses this permission for automated cleanup of non-compliant launch templates during remediation workflows. This action is invoked only when a security policy violation is detected. |
| ec2:DeleteSecurityGroup | Delete an existing network security group. Cortex uses this for automated cleanup of unused or misconfigured security groups as part of security hygiene workflows. This permission is invoked only when a security policy requires removal of a specific security group during remediation. |
| ec2:DeleteSnapshot | Clean up snapshots created by playbooks (intermediate re-encryption snapshots, expired evidence snapshots). This action acts only on snapshots Cortex itself created. |
| ec2:DeleteSubnet | Delete a VPC subnet. Cortex uses this permission for automated remediation of network segmentation issues. This action is invoked only when a security policy violation is detected. |
| ec2:DeleteVolume | Delete an EBS volume. Cortex uses this permission for automated cleanup of temporary volumes created during remediation workflows. This action is invoked only when a security policy violation is detected. |
| ec2:DeleteVpc | Delete a VPC. Cortex uses this permission for automated remediation of non-compliant network configurations. This action is invoked only when a security policy violation is detected and the VPC contains no active resources. |
| ec2:DeregisterImage | Clean up AMIs created by playbooks (intermediate hardening AMIs, superseded baselines). This action acts only on images Cortex itself created. |
| ec2:DescribeAddresses | List Elastic IP addresses in the account. Cortex uses this permission to identify Elastic IP address configurations that require remediation of security policy violations. |
| ec2:DescribeFleetInstances | List instances associated with an EC2 Fleet. Cortex uses this permission to assess fleet instance configurations during automated remediation workflows. |
| ec2:DescribeFleets | List EC2 Fleets in the account. Cortex uses this permission to assess fleet configurations during automated remediation workflows. |
| ec2:DescribeIamInstanceProfileAssociations | List IAM instance profile associations for EC2 instances. Cortex uses this permission to assess instance role assignments during automated remediation of IAM misconfigurations. |
| ec2:DescribeImages | Look up AMI metadata before deciding which remediation action to apply. For example, verify that an AMI flagged as public is still public) Read-only. |
| ec2:DescribeInstances | Retrieve information about EC2 instances in the account. Cortex uses this to inventory compute resources and assess their security configurations for automation purposes, such as identifying instances that require remediation. This read-only operation does not modify any instance settings. |
| ec2:DescribeInstanceStatus | Retrieve status information for EC2 instances. Cortex uses this permission to monitor instance health during automated remediation workflows. |
| ec2:DescribeInternetGateways | List internet gateways in the account. Cortex uses this permission to identify internet gateway configurations that require remediation of network security violations. |
| ec2:DescribeIpamResourceDiscoveries | Retrieve details about IPAM resource discovery configurations. Cortex uses this to understand IP address management configurations for network security analysis and automation workflows. This read-only operation does not modify any IPAM settings. |
| ec2:DescribeIpamResourceDiscoveryAssociations | Retrieve details about associations between IPAM and resource discoveries. Cortex uses this for comprehensive network topology understanding in automation workflows, enabling accurate security assessment of IP address management. This read-only operation does not modify any IPAM configurations. |
| ec2:DescribeKeyPairs | List EC2 key pairs in the account. Cortex uses this permission to assess SSH key pair configurations during automated remediation of access control issues. |
| ec2:DescribeLaunchTemplates | List EC2 launch templates in the account. Cortex uses this permission to identify launch template configurations that require remediation of security policy violations. |
| ec2:DescribeRegions | List available AWS regions. Cortex uses this permission to identify active regions during multi-region automated remediation workflows. |
| ec2:DescribeReservedInstances | List reserved EC2 instances in the account. Cortex uses this permission to assess reserved instance configurations during automated remediation workflows. |
| ec2:DescribeSecurityGroups | Retrieve information about security groups in the account. Cortex uses this to assess network security posture and identify misconfigurations requiring remediation as part of automation workflows. This read-only operation provides visibility into network access rules without modifying any security group settings. |
| ec2:DescribeSnapshots | Look up snapshot metadata before deciding which remediation action to apply. For example, select the correct snapshot for evidence preservation. Read-only. |
| ec2:DescribeSubnets | Retrieve information about subnets in the account. Cortex uses this to understand network topology for security analysis and automation workflows, enabling accurate assessment of network configurations. This read-only operation does not modify any subnet settings. |
| ec2:DescribeVolumes | List EBS volumes in the account. Cortex uses this permission to identify volume configurations that require remediation, such as unencrypted volumes. |
| ec2:DescribeVpcs | Retrieve information about VPCs in the account. Cortex uses this to inventory network infrastructure and assess security configurations for automation workflows. This read-only operation provides visibility into VPC architecture without modifying any network settings. |
| ec2:DetachInternetGateway | Detach an internet gateway from a VPC. Cortex uses this permission for automated remediation of network isolation requirements by removing internet connectivity. This action is invoked only when a security policy violation is detected. |
| ec2:DetachVolume | Detach an EBS volume from an EC2 instance. Cortex uses this permission for automated remediation workflows that require volume management operations. This action is invoked only when a security policy violation is detected. |
| ec2:DisassociateAddress | Disassociate an Elastic IP address from an instance or network interface. Cortex uses this permission for automated remediation of network configuration issues. This action is invoked only when a security policy violation is detected. |
| ec2:GetIpamDiscoveredPublicAddresses | Retrieve discovered public IP addresses from IPAM. Cortex uses this to identify externally exposed resources for security assessment, helping detect unintended public exposure of AWS resources. This read-only operation does not modify any IPAM or network configurations. |
| ec2:GetPasswordData | Retrieve the encrypted administrator password for a Windows EC2 instance. Cortex uses this permission to verify instance access configurations during automated remediation workflows. |
| ec2:ModifyFleet | Modify an EC2 Fleet configuration. Cortex uses this permission for automated remediation of fleet configuration issues. This action is invoked only when a security policy violation is detected. |
| ec2:ModifyImageAttribute | Modify EC2 image attributes to revoke public launch permissions. Cortex uses this for automated remediation when the rule AWS EC2 AMI Publicly Accessible detects a publicly shared AMI, restricting access to prevent unauthorized use. This remediation action is triggered only when a specific security policy violation is detected. |
| ec2:ModifyInstanceAttribute | Modify EC2 instance attributes, such as disassociating a security group for mitigation of issues detected due to the rule: AWS EC2 instance with network path from the internet. Cortex uses this for automated security remediation to restrict unauthorized network access to instances. This remediation action is triggered only when a specific security policy violation is detected. |
| ec2:ModifyInstanceMetadataOptions | Modify EC2 instance metadata options for remediation when the rule AWS EC2 Instance Not Using IMDSv2 is triggered. Cortex uses this to enforce IMDSv2 and other metadata security best practices through automated remediation, protecting instances from SSRF and credential theft attacks. This remediation action is invoked only when a specific security policy violation is detected. |
| ec2:ModifyNetworkInterfaceAttribute | Modify a network interface attribute. Cortex uses this permission for automated remediation of network interface security settings, such as adjusting security group assignments. This action is invoked only when a security policy violation is detected. |
| ec2:ModifySnapshotAttribute | Revoke public/cross-account snapshot sharing during remediation, for example, when the "AWS EBS Snapshot Publicly Accessible" rule is triggered. This action is invoked only when a specific policy violation is detected. |
| ec2:ModifySubnetAttribute | Modify a specific attribute of a subnet. Cortex uses this for automated network security remediation, such as adjusting auto-assign public IP settings to address detected security issues. This permission is invoked only when a security policy violation related to subnet configuration is detected. |
| ec2:ModifyVolume | Modify an EBS volume configuration. Cortex uses this permission for automated remediation of volume misconfigurations, such as enabling encryption or adjusting performance settings. This action is invoked only when a security policy violation is detected. |
| ec2:MonitorInstances | Enable detailed CloudWatch monitoring for EC2 instances. Cortex uses this permission for automated remediation of monitoring gaps by enabling detailed instance metrics. This action is invoked only when a security policy violation is detected. |
| ec2:RebootInstances | Reboot EC2 instances. Cortex uses this permission for automated remediation workflows that require an instance restart to apply security configuration changes. This action is invoked only when a security policy violation is detected. |
| ec2:ReleaseAddress | Release an Elastic IP address. Cortex uses this permission for automated cleanup of unused Elastic IP addresses during remediation workflows. This action is invoked only when a security policy violation is detected. |
| ec2:ReleaseHosts | Release Dedicated Hosts. Cortex uses this permission for automated cleanup of dedicated host resources during remediation workflows. This action is invoked only when a security policy violation is detected. |
| ec2:RevokeSecurityGroupEgress | Revoke outbound security group rules to block traffic for remediation of issues detected due to the rule: AWS EC2 instance with network path to the internet. Cortex uses this for automated remediation of overly permissive egress rules that could expose resources to unauthorized outbound communication. This remediation action is triggered only when a specific security policy violation is detected. |
| ec2:RevokeSecurityGroupIngress | Revoke inbound security group rules to block network access for remediation of issues detected due to the rule: AWS EC2 instance with network path from the internet. Cortex uses this for automated remediation of security misconfigurations, such as removing public access to sensitive ports. This remediation action is triggered only when a specific security policy violation is detected. |
| ec2:RunInstances | Launch new EC2 instances as part of automation workflows. Cortex uses this for automation workflows that require deploying properly configured compute resources, such as creating scanning infrastructure. Instances are launched with appropriate security configurations and tagged for lifecycle management. |
| ec2:StartInstances | Start one or more stopped EC2 instances. Cortex uses this for automation workflows involving instance lifecycle management, such as restarting instances after remediation actions are applied. This permission is invoked only as part of controlled automation workflows. |
| ec2:StopInstances | Stop one or more running EC2 instances. Cortex uses this for automated response actions, such as isolating compromised instances or stopping instances that violate security policies. This permission is invoked only when a specific security incident or policy violation requires instance isolation. |
| ec2:TerminateInstances | Terminate one or more running EC2 instances. Cortex uses this for automated incident response, enabling removal of compromised or unauthorized resources when security policies require it. This permission is invoked only when a specific security incident requires instance termination as a remediation action. |
| ec2:UnmonitorInstances | Disable detailed CloudWatch monitoring for EC2 instances. Cortex uses this permission for automated remediation workflows that require adjusting instance monitoring configurations. This action is invoked only when a security policy violation is detected. |
| ecs:UpdateClusterSettings | Modify settings for an existing ECS cluster. Cortex uses this for automated remediation of container security settings, such as enabling Container Insights or adjusting cluster configurations to meet security best practices. This permission is invoked only when a security policy violation related to ECS is detected. |
| eks:AssociateAccessPolicy | Associate an access policy with an EKS cluster. Cortex uses this for automated Kubernetes security configuration management, ensuring proper access controls are applied to EKS clusters. This permission is invoked only as part of remediation workflows to address detected security issues. |
| eks:CreateAccessEntry | Create an access entry for an EKS cluster. Cortex uses this permission for automated remediation of Kubernetes cluster access configurations. This action is invoked only when a security policy violation is detected. |
| eks:DescribeCluster | Retrieve detailed information about a specific EKS cluster. Cortex uses this to assess Kubernetes security configurations and identify remediation needs as part of automation workflows. This read-only operation provides visibility into cluster settings without modifying any EKS configurations. |
| eks:ListClusters | List EKS clusters in the account. Cortex uses this permission to identify Kubernetes clusters that require remediation of security policy violations. |
| eks:UpdateAccessEntry | Update an access entry for an EKS cluster. Cortex uses this permission for automated remediation of Kubernetes cluster access misconfigurations. This action is invoked only when a security policy violation is detected. |
| eks:UpdateClusterConfig | Update EKS cluster configuration for remediation when the rule AWS EKS Cluster Public Access Enabled is triggered. Cortex uses this for automated remediation of Kubernetes security configurations, such as disabling public API server access. This remediation action is invoked only when a specific security policy violation is detected. |
| elasticloadbalancing:ModifyLoadBalancerAttributes | Modify the attributes of a specified load balancer. Cortex uses this for automated remediation of load balancer security configurations, such as enabling access logging or adjusting security-related settings. This permission is invoked only when a security policy violation related to load balancer configuration is detected. |
| iam:CreateServiceLinkedRole | Create a service-linked role for an AWS service. Cortex uses this permission for automated remediation workflows that require enabling AWS service integrations. This action is invoked only when a security policy violation is detected. |
| iam:DeleteLoginProfile | Delete an IAM login profile for remediation when the rule AWS IAM User with Active Console Password is triggered. Cortex uses this for automated incident response, such as disabling console access for compromised or unauthorized user accounts. This remediation action is invoked only when a specific security policy violation is detected. |
| iam:GetAccountAuthorizationDetails | Retrieve information about all IAM users, roles, policies, and groups in the account. Cortex uses this to assess identity and access management posture for security analysis and to support automation workflows that evaluate IAM configurations. This read-only operation does not modify any IAM settings. |
| iam:GetAccountPasswordPolicy | Retrieve the account password policy for investigation of issues detected due to the rule: AWS IAM Account Password Policy Not Configured. Cortex uses this to assess password security configurations and identify compliance gaps. This read-only operation provides visibility into password policy settings without modifying any IAM configurations. |
| iam:PassRole | Pass an IAM role to an AWS service. Cortex uses this permission for automated remediation workflows that create or update resources with an attached role, such as an EC2 instance profile or a Lambda execution role. AWS requires this permission whenever a resource is created or updated with an attached role. |
| iam:PutUserPolicy | Attach an inline policy to an IAM user to suspend access for mitigation of issues detected due to the rule: AWS IAM Users with Administrator Access Permissions. Cortex uses this for automated IAM remediation to restrict overly permissive user access. This remediation action is invoked only when a specific security policy violation is detected. |
| iam:RemoveRoleFromInstanceProfile | Remove a role from an instance profile for remediation when the rule AWS EC2 with IAM instance profile is triggered. Cortex uses this for automated remediation of instance IAM configurations to address overly permissive role assignments. This remediation action is invoked only when a specific security policy violation is detected. |
| iam:UpdateAccessKey | Deactivate IAM access keys for remediation when the rule AWS IAM User Active Access Keys Unused for 90 days is triggered. Cortex uses this for automated security response to disable unused or potentially compromised access keys. This remediation action is invoked only when a specific security policy violation is detected. |
| iam:UpdateAccountPasswordPolicy | Configure the account password policy for remediation when the rule AWS IAM Account Password Policy Not Configured is triggered. Cortex uses this for automated remediation to enforce strong password requirements and compliance with security best practices. This remediation action is invoked only when a specific security policy violation is detected. |
| kms:CreateGrant | Create KMS grants on customer KMS keys when remediation playbooks must enable an AWS service, such as RDS or EBS, to use a key for re-encryption or attribute modification. Grants are scoped to the specific service principal and operation required by the playbook step. |
| kms:Decrypt | Decrypt ciphertext that was encrypted with a KMS key. Cortex uses this permission for automation workflows that require access to encrypted data as part of remediation processing. |
| kms:DescribeKey | Read KMS key metadata such as key ID, state, and usage. Cortex uses this permission to inspect KMS keys during automation workflows. AWS requires this metadata as a prerequisite for most other KMS operations. |
| kms:EnableKeyRotation | Activate automatic rotation for a customer master key (CMK). Cortex uses this for automated remediation to enforce encryption best practices, ensuring keys are regularly rotated to maintain cryptographic security. This remediation action is invoked only when a security policy violation related to key rotation is detected. |
| kms:GenerateDataKey | Generate a data key for client-side encryption. Cortex uses this for automation workflows requiring encryption of sensitive data, ensuring that data created or processed during remediation is properly encrypted. This operation maintains cryptographic security throughout automation processes. |
| lambda:CreateFunction | Create a Lambda function. Cortex uses this permission for automated remediation workflows that require deploying serverless functions for security enforcement. This action is invoked only when a security policy violation is detected. |
| lambda:DeleteFunction | Delete a Lambda function. Cortex uses this permission for automated cleanup of non-compliant Lambda functions during remediation workflows. This action is invoked only when a security policy violation is detected. |
| lambda:DeleteFunctionUrlConfig | Delete a Lambda function URL configuration. Cortex uses this permission for automated remediation of publicly exposed Lambda function endpoints. This action is invoked only when a security policy violation is detected. |
| lambda:DeleteLayerVersion | Delete a Lambda layer version. Cortex uses this permission for automated cleanup of non-compliant Lambda layer versions during remediation workflows. This action is invoked only when a security policy violation is detected. |
| lambda:GetAccountSettings | Retrieve Lambda account-level settings and limits. Cortex uses this permission to assess Lambda service configurations during automated remediation workflows. |
| lambda:GetFunctionUrlConfig | Retrieve the configuration details for a Lambda function URL. Cortex uses this to assess Lambda exposure and identify security misconfigurations, such as publicly accessible function URLs. This read-only operation does not modify any function URL settings. |
| lambda:GetPolicy | Retrieve the access policy associated with a Lambda function. Cortex uses this to assess function access controls and identify overly permissive configurations as part of automation workflows. This read-only operation does not modify any Lambda policies. |
| lambda:InvokeFunction | Execute a specified Lambda function. Cortex uses this for automation workflows that leverage serverless functions for remediation tasks, enabling custom remediation logic to be executed in response to detected security issues. This permission is invoked only as part of controlled automation workflows. |
| lambda:ListAliases | List aliases for a Lambda function. Cortex uses this permission to assess Lambda function versioning during automated remediation workflows. |
| lambda:ListFunctions | List Lambda functions in the account. Cortex uses this permission to identify Lambda functions that require remediation of security policy violations. |
| lambda:ListLayerVersions | List versions of a Lambda layer. Cortex uses this permission to inventory Lambda layer versions for dependency security assessment. |
| lambda:ListVersionsByFunction | List published versions of a Lambda function. Cortex uses this permission to assess Lambda function versions during automated remediation workflows. |
| lambda:PublishLayerVersion | Publish a new Lambda layer version. Cortex uses this permission for automated remediation workflows that require updating Lambda layer dependencies. This action is invoked only when a security policy violation is detected. |
| lambda:UpdateFunctionConfiguration | Update a Lambda function configuration. Cortex uses this permission for automated remediation of Lambda function misconfigurations, such as adjusting runtime or security settings. This action is invoked only when a security policy violation is detected. |
| lambda:UpdateFunctionUrlConfig | Update the configuration details for a Lambda function URL. Cortex uses this for automated remediation of Lambda security configurations, such as restricting public access to function URLs. This remediation action is invoked only when a security policy violation related to Lambda function URLs is detected. |
| rds:AddTagsToResource | Add tags to RDS resources for tracking and identification during automation workflows. Cortex uses this to create unique tags for RDS snapshots and other resources created during remediation, enabling proper lifecycle management and ensuring resources can be found and cleaned up at a later stage. |
| rds:CreateTenantDatabase | Create a new tenant database within an RDS DB instance. Cortex uses this for automation workflows involving database provisioning as part of security remediation or infrastructure management. This permission is invoked only as part of controlled automation workflows. |
| rds:DescribeDBInstances | List RDS database instances in the account. Cortex uses this permission to identify database instances that require remediation of security policy violations. |
| rds:ModifyDBCluster | Modify an RDS DB cluster for remediation when the rule AWS RDS DB Cluster Publicly Accessible is triggered. Cortex uses this for automated remediation of database security configurations, such as disabling public accessibility. This remediation action is invoked only when a specific security policy violation is detected. |
| rds:ModifyDBClusterSnapshotAttribute | Modify DB cluster snapshot attributes for remediation when the rule AWS RDS DB Cluster Snapshot Publicly Accessible is triggered. Cortex uses this to remediate overly permissive snapshot sharing configurations, restricting public access to database snapshots. This remediation action is invoked only when a specific security policy violation is detected. |
| rds:ModifyDBInstance | Modify an RDS DB instance for remediation when the rule AWS RDS DB Instance Publicly Accessible is triggered. Cortex uses this for automated database security remediation, such as disabling public accessibility. This remediation action is invoked only when a specific security policy violation is detected. |
| rds:ModifyDBSnapshotAttribute | Modify DB snapshot attributes for remediation when the rule AWS RDS DB Snapshot Publicly Accessible is triggered. Cortex uses this to restrict public snapshot access through automated remediation, preventing unauthorized access to database backups. This remediation action is invoked only when a specific security policy violation is detected. |
| rds:ModifyEventSubscription | Modify an existing RDS event subscription. Cortex uses this for automation workflows involving database monitoring configuration, such as adjusting notification settings for security-relevant database events. This permission is invoked only as part of controlled automation workflows. |
| redshift:ModifyCluster | Modify Redshift cluster configuration settings. Cortex uses this permission for automated remediation of data warehouse security misconfigurations, such as enabling encryption or adjusting network settings. This action is invoked only when a security policy violation is detected. |
| s3:CreateBucket | Create an S3 bucket. Cortex uses this permission for automated remediation workflows that require creating properly configured storage resources, such as logging buckets. This action is invoked only when a security policy violation is detected. |
| s3:DeleteBucket | Delete an S3 bucket. Cortex uses this permission for automated remediation of non-compliant storage resources. This action is invoked only when a security policy violation is detected and the bucket is confirmed empty. |
| s3:DeleteBucketPolicy | Remove the entire access policy associated with an S3 bucket. Cortex uses this for automated remediation of misconfigured bucket access policies that could expose data publicly. This remediation action is invoked only when a security policy violation related to S3 bucket policies is detected. |
| s3:DeleteBucketWebsite | Remove the static website configuration from an S3 bucket. Cortex uses this to remediate unintended public exposure of S3 content by disabling static website hosting on buckets that should not be publicly accessible. This remediation action is invoked only when a security policy violation is detected. |
| s3:GetBucketAcl | Retrieve the Access Control List (ACL) that controls access to an S3 bucket. Cortex uses this to assess S3 access configurations and identify security issues, such as overly permissive public access. This read-only operation does not modify any bucket ACL settings. |
| s3:GetBucketPolicy | Retrieve the resource-based access policy attached to an S3 bucket. Cortex uses this to analyze S3 access controls and identify misconfigurations that could expose data publicly. This read-only operation does not modify any bucket policies. |
| s3:GetBucketPublicAccessBlock | Retrieve the public access block configuration for an S3 bucket. Cortex uses this to assess S3 security posture and identify exposure risks when investigating issues detected due to the rule: AWS S3 Bucket Public Access Block Disabled. This read-only operation provides visibility into public access settings. |
| s3:GetBucketWebsite | Retrieve the configuration details for static website hosting on an S3 bucket. Cortex uses this to identify buckets configured for public web hosting and assess whether the configuration poses a security risk. This read-only operation does not modify any website hosting settings. |
| s3:GetEncryptionConfiguration | Retrieve the default server-side encryption settings applied to an S3 bucket. Cortex uses this to assess S3 encryption posture and identify unencrypted buckets that may require remediation. This read-only operation does not modify any encryption configurations. |
| s3:GetObject | Retrieve the contents of an S3 object. Cortex uses this permission for automation workflows that require reading object contents as part of remediation processing. |
| s3:ListAllMyBuckets | List all S3 buckets in the account. Cortex uses this permission to identify S3 buckets that require remediation of security policy violations. |
| s3:PutBucketAcl | Modify S3 bucket ACLs to block public access for remediation when the rule S3 Bucket Public Read Access is triggered. Cortex uses this to explicitly deny public access or remove public access entirely from buckets. This remediation action is invoked only when a specific security policy violation is detected. |
| s3:PutBucketLogging | Configure server access logging for remediation when the rule AWS S3 Bucket Logging Disabled is triggered. Cortex uses this to enforce logging best practices through automated remediation, ensuring bucket access is properly audited. This remediation action is invoked only when a specific security policy violation is detected. |
| s3:PutBucketOwnershipControls | Define and enforces the ownership controls configuration for an S3 bucket. Cortex uses this to enforce bucket ownership best practices through automated remediation, ensuring proper access control and preventing unintended cross-account access. This permission is invoked only as part of remediation workflows. |
| s3:PutBucketPolicy | Set or updates the bucket policy to block public access for remediation when the rule S3 Bucket Policy Public Access is triggered. Cortex uses this for automated remediation to enforce secure access policies and prevent unauthorized public access to S3 data. This remediation action is invoked only when a specific security policy violation is detected. |
| s3:PutBucketPublicAccessBlock | Configure the public access block settings for remediation when the rule AWS S3 Bucket Public Access Block Disabled is triggered. Cortex uses this to automatically block public access to sensitive S3 buckets, preventing unauthorized data exposure. This remediation action is invoked only when a specific security policy violation is detected. |
| s3:PutBucketVersioning | Enable versioning for remediation when the rule AWS S3 Bucket Versioning Disabled is triggered. Cortex uses this to enforce data protection best practices through automated remediation, ensuring objects are versioned for recovery and audit purposes. This remediation action is invoked only when a specific security policy violation is detected. |
| s3:PutObject | Upload new objects or replaces existing objects within an S3 bucket. Cortex uses this for automation workflows that need to store configuration files or artifacts during remediation processes. Objects are written only as part of controlled automation workflows. |
| secretsmanager:CreateSecret | Create a new secret in AWS Secrets Manager. Cortex uses this for automation workflows that require secure credential storage as part of remediation or infrastructure management processes. Secrets are created with appropriate encryption and access controls. |
| secretsmanager:RotateSecret | Set up or initiates rotation for a secret in AWS Secrets Manager. Cortex uses this for automated credential rotation as part of security hygiene workflows, ensuring secrets are regularly rotated to maintain security best practices. This remediation action helps prevent credential compromise from stale secrets. |
| secretsmanager:TagResource | Add tags to secrets or resources in AWS Secrets Manager. Cortex uses this to apply security-related tags during automation workflows, enabling better resource tracking and compliance reporting. Tags help identify Cortex-managed resources and support automated lifecycle management. |
| ssm:ListCommands | List Systems Manager command execution history. Cortex uses this permission to track the status of automated remediation commands executed on managed instances. |
| ssm:ListInventoryEntries | List Systems Manager inventory entries for managed instances. Cortex uses this permission to assess instance software inventory for compliance and vulnerability evaluation. |
| ssm:SendCommand | Execute a command on managed instances through Systems Manager. Cortex uses this permission for automated remediation of instance-level security misconfigurations. This action is invoked only when a security policy violation is detected. |
Microsoft Azure provider permissions
When onboarding Microsoft Azure, Cortex XSIAM requests only the permissions needed for the security capabilities you enable, following the principle of least privilege. The required permissions depend on your onboarding scope (tenant, management group, or subscription) and your selected security capabilities. Permissions fall into three categories:
- Required at all scopes: the Discovery Engine capability, which provides the asset visibility that all other Cortex XSIAM capabilities depend on and cannot be deselected. It requires the Microsoft Graph
Application.Read.Allpermission, which is used as follows:- Tenant scope: during onboarding to create the Cortex service principal, and post-onboarding for ongoing asset discovery.
- Management group and subscription scopes: during onboarding only, to create the Cortex service principal.
- Required at tenant or management group scope only: the Base capability, which grants the remediation role and cross-subscription managed identities. It is not requested at subscription scope.
- Conditional on selected capabilities: requested only when the corresponding capability is enabled. Capabilities can be added or removed later, and the requested permissions adjust accordingly.
The following reference tables are organized by security module, role, and then the list of the CSP permissions being requested as well as their purpose:
- Base
- Discovery Engine
- Log Collection
- Agentless Disk Scanning (ADS)
- Serverless Scan
- Registry Scan
- Data Security Posture Management (DSPM)
- Automations
Base
Base (and Discovery) permissions represent the foundational, mandatory role assignments required to successfully onboard your Azure environment to Cortex.
Onboarding Managed Identity Role: cortex-mi-role-{suffix}
This custom Azure RBAC role contains the permissions needed to deploy Cortex per-subscription deployment artifacts. These artifacts include resource groups, custom roles and role assignments, policy definitions and assignments, Azure Resource Manager (ARM) deployments, and Azure Compute Galleries used by the ADS capability.
| Created when | Management Group or Tenant scope only |
| Assigned to | Customer-owned Onboarding User-Assigned Managed Identity (UAMI) cortex-mi-{suffix}. Not assigned to the Cortex Service Principal. |
| Assignment scope | Management Group (Tenant Root Management Group for Tenant onboarding). |
| Used by | Azure Policy's deployIfNotExists control plane. Used to deploy Cortex resources into each subscription under the scope. Cortex itself cannot authenticate as the UAMI. |
cortex-mi-role-{suffix} permissions:
| Permission | Description |
|---|---|
| Microsoft.Authorization/policyAssignments/delete | Delete Azure Policy assignments used for Cortex onboarding. Cortex uses this permission to clean up policy-based deployment assignments during onboarding lifecycle management. |
| Microsoft.Authorization/policyAssignments/read | Read the configuration of Microsoft Defender for Cloud policy assignments. Cortex uses this to assess the current compliance posture and identify policy gaps that may require automated remediation. This read-only access supports security monitoring without modifying any policy configurations. |
| Microsoft.Authorization/policyAssignments/write | Apply Microsoft Defender for Cloud policy assignments to enable security configurations monitoring. Cortex uses this to remediate issues detected by the "Azure Microsoft Defender for Cloud security configurations monitoring is set to disabled" rule. This automated remediation ensures that security monitoring remains active across the environment. |
| Microsoft.Authorization/policyDefinitions/delete | Delete Azure Policy definitions used for Cortex onboarding. Cortex uses this permission to remove onboarding policy definitions during lifecycle management. |
| Microsoft.Authorization/policyDefinitions/read | Read policy definitions. Cortex uses this for comprehensive asset discovery and security posture assessment across the Azure environment. |
| Microsoft.Authorization/policyDefinitions/write | Create or update Azure Policy definitions for Cortex onboarding. Cortex uses this permission to define policies that automate onboarding resource deployment across subscriptions. |
| Microsoft.Authorization/roleAssignments/delete | Delete role assignments created during Cortex onboarding. Cortex uses this permission to clean up role assignments during onboarding lifecycle management. |
| Microsoft.Authorization/roleAssignments/read | Read role assignments. Cortex uses this for comprehensive asset discovery and security posture assessment across the Azure environment. |
| Microsoft.Authorization/roleAssignments/write | Create role assignments for Cortex onboarding. Cortex uses this permission to assign required roles to service principals during automated onboarding deployment. |
| Microsoft.Authorization/roleDefinitions/delete | Delete custom role definitions created during Cortex onboarding. Cortex uses this permission to clean up custom roles during onboarding lifecycle management. |
| Microsoft.Authorization/roleDefinitions/read | Read role definitions. Cortex uses this for comprehensive asset discovery and security posture assessment across the Azure environment. |
| Microsoft.Authorization/roleDefinitions/write | Create or update custom role definitions for Cortex onboarding. Cortex uses this permission to define custom roles with least-privilege permissions during onboarding deployment. |
| Microsoft.Compute/galleries/delete | Delete compute gallery resources used for agentless disk scanning. Cortex uses this permission to clean up temporary gallery resources after completing vulnerability scans. |
| Microsoft.Compute/galleries/read | Read galleries. Cortex uses this for comprehensive asset discovery and security posture assessment across the Azure environment. |
| Microsoft.Compute/galleries/write | Create or update compute gallery resources for agentless disk scanning. Cortex uses this permission to set up temporary galleries required for disk snapshot analysis during vulnerability scanning. |
| Microsoft.resources/deployments/cancel/action | Cancel an in-progress Azure Resource Manager deployment. Cortex uses this permission to manage onboarding deployments and cancel operations that encounter issues. |
| Microsoft.resources/deployments/operations/read | Retrieve deployment operation details for Azure Resource Manager deployments. Cortex uses this permission to monitor onboarding deployment progress and troubleshoot provisioning. |
| Microsoft.resources/deployments/operationStatuses/read | Retrieve deployment operation status for Azure Resource Manager deployments. Cortex uses this permission to track onboarding deployment status and verify successful provisioning. |
| Microsoft.resources/deployments/read | Retrieve Azure Resource Manager deployment details. Cortex uses this permission to monitor onboarding deployments and verify resource provisioning. |
| Microsoft.resources/deployments/validate/action | Validate an Azure Resource Manager deployment template before execution. Cortex uses this permission to pre-validate onboarding templates and prevent deployment failures. |
| Microsoft.resources/deployments/write | Create or update Azure Resource Manager deployments for Cortex onboarding. Cortex uses this permission to deploy onboarding resources such as role definitions and role assignments. |
| Microsoft.resources/subscriptions/read | Read the status and details of Azure subscriptions. Cortex uses this to understand the Azure environment structure and enumerate available subscriptions for automation workflows. Required for command: azure-nsg-subscriptions-list. |
| Microsoft.resources/subscriptions/resourceGroups/moveResources/action | Move resources between resource groups during Cortex onboarding. Cortex uses this permission to organize onboarding resources into appropriate resource groups. |
| Microsoft.resources/subscriptions/resourceGroups/read | Read the status and details of resource groups within a subscription. Cortex uses this to inventory Azure resources and understand the organizational structure of the environment. Required for command: azure-nsg-resource-group-list. |
| Microsoft.resources/subscriptions/resourceGroups/resources/read | List resources within a resource group. Cortex uses this permission to discover all resources in a resource group for comprehensive asset inventory. |
| Microsoft.resources/subscriptions/resourceGroups/validateMoveResources/action | Validate resource move operations between resource groups. Cortex uses this permission to pre-validate resource moves and prevent deployment failures during onboarding. |
| Microsoft.resources/subscriptions/resourceGroups/write | Write resource groups. Cortex uses this for resource management as part of discovery and security assessment workflows. |
Policy Remediation Role: cortex-policy-{suffix}
This custom Azure RBAC role has the minimal permissions needed for the Cortex Service Principal to trigger Azure Policy remediation tasks. The service principal cannot modify the policy definition or the embedded Azure Resource Manager (ARM) template; it can only request that Azure Policy re-evaluate compliance and run the existing remediation.
| Created when | Management Group or Tenant scope only. |
| Assigned to | Cortex Service Principal. |
| Assignment scope | Management Group (Tenant Root Management Group for Tenant onboarding). |
| Used by | Cortex to trigger periodic Azure Policy remediation, which in turn causes the Onboarding UAMI to deploy Cortex resources into any newly-discovered subscription. |
cortex-policy-{suffix}: permissions
| Permission | Description |
|---|---|
| Microsoft.PolicyInsights/remediations/read | Retrieve Azure Policy remediation task details. Cortex uses this permission to monitor policy remediation status during onboarding deployments. |
| Microsoft.PolicyInsights/remediations/write | Create or update Azure Policy remediation tasks for Cortex onboarding. Cortex uses this permission to trigger policy-based remediation that deploys onboarding resources to subscriptions. |
Microsoft Graph Application (GRAPH_API)
While not a traditional Azure RBAC custom role, this category represents a single Microsoft Graph application permission assigned directly to the Cortex service principal in your Entra ID tenant. This access is scoped strictly to your Microsoft Entra ID (formerly Azure AD) tenant environment. This permission is read-only and is not utilized for any post-onboarding scanning or operational workflows across Subscription and Management Group onboarding scopes.
| Permission | Description |
|---|---|
| Application.Read.All | This permission is assigned only for the creation of the Cortex service principal during onboarding and is not used post-onboarding. The permission is assigned for all onboarding scopes. |
Discovery Engine
The Discovery Engine permissions (and Base permissions) form the core of Cortex's visibility and asset inventory capabilities. These permissions provide the foundational access necessary for continuous asset discovery and Cloud Security Posture Management (CSPM) scanning across your cloud estate.
Actions Role: cortex-actions-{suffix}
Custom Azure RBAC role with the read-like posture-assessment actions Cortex needs in addition to plain reads. Read-only.
| Created when | All onboarding scopes. |
| Assigned to | Cortex Service Principal. |
| Assignment scope | Matches the onboarded scope. |
| Used by | Cortex asset discovery to read metadata across the Azure resource types Cortex scans. |
cortex-actions-{suffix} permissions:
| Permission | Description |
|---|---|
| Microsoft.Advisor/configurations/read | Read Advisor configuration. Cortex uses this for comprehensive asset discovery and security posture assessment across the Azure environment. |
| Microsoft.AlertsManagement/prometheusRuleGroups/read | Read Prometheus rule groups. Cortex uses this for comprehensive asset discovery and security posture assessment across the Azure environment. |
| Microsoft.AlertsManagement/smartDetectorAlertRules/read | Read smart detector alert rules. Cortex uses this for comprehensive asset discovery and security posture assessment across the Azure environment. |
| Microsoft.AnalysisServices/servers/read | Read Analysis Services servers. Cortex uses this for comprehensive asset discovery and security posture assessment across the Azure environment. |
| Microsoft.ApiManagement/service/apis/diagnostics/read | Read diagnostics info of APIs. Cortex uses this for comprehensive asset discovery and security posture assessment across the Azure environment. |
| Microsoft.ApiManagement/service/apis/policies/read | Read policies on APIs. Cortex uses this for comprehensive asset discovery and security posture assessment across the Azure environment. |
| Microsoft.ApiManagement/service/apis/read | Read API details. Cortex uses this for comprehensive asset discovery and security posture assessment across the Azure environment. |
| Microsoft.ApiManagement/service/identityProviders/read | Read API Management identity providers. Cortex uses this for comprehensive asset discovery and security posture assessment across the Azure environment. |
| Microsoft.ApiManagement/service/portalSettings/read | Read developer portal settings. Cortex uses this for comprehensive asset discovery and security posture assessment across the Azure environment. |
| Microsoft.ApiManagement/service/products/policies/read | Read policies on API products. Cortex uses this for comprehensive asset discovery and security posture assessment across the Azure environment. |
| Microsoft.ApiManagement/service/products/read | Read API products. Cortex uses this for comprehensive asset discovery and security posture assessment across the Azure environment. |
| Microsoft.ApiManagement/service/read | Read API Management service info. Cortex uses this for comprehensive asset discovery and security posture assessment across the Azure environment. |
| Microsoft.ApiManagement/service/tenant/read | Read tenant info in API Management. Cortex uses this for comprehensive asset discovery and security posture assessment across the Azure environment. |
| Microsoft.AppConfiguration/configurationStores/read | Read Azure App Configuration stores. Cortex uses this for comprehensive asset discovery and security posture assessment across the Azure environment. |
| Microsoft.App/containerApps/read | Read App container apps. Cortex uses this for comprehensive asset discovery and security posture assessment across the Azure environment. |
| Microsoft.AppPlatform/spring/apps/read | Read Spring apps in Azure App Platform. Cortex uses this for comprehensive asset discovery and security posture assessment across the Azure environment.This permission is supported in commercial cloud environments only and is not available in government cloud regions. |
| Microsoft.AppPlatform/spring/read | Read Azure App Platform Spring resource info. Cortex uses this for comprehensive asset discovery and security posture assessment across the Azure environment.This permission is supported in commercial cloud environments only and is not available in government cloud regions. |
| Microsoft.Attestation/attestationProviders/read | Read attestation providers. Cortex uses this for comprehensive asset discovery and security posture assessment across the Azure environment. |
| Microsoft.Authorization/locks/read | Read resource locks. Cortex uses this for comprehensive asset discovery and security posture assessment across the Azure environment. |
| Microsoft.Authorization/permissions/read | Read permissions. Cortex uses this for comprehensive asset discovery and security posture assessment across the Azure environment. |
| Microsoft.Authorization/policyAssignments/read | Read the configuration of Microsoft Defender for Cloud policy assignments. Cortex uses this to assess the current compliance posture and identify policy gaps in the customer's Azure environment. This read-only access supports security monitoring without modifying any policy configurations. |
| Microsoft.Authorization/policyDefinitions/read | Read policy definitions. Cortex uses this for comprehensive asset discovery and security posture assessment across the Azure environment. |
| Microsoft.Authorization/roleAssignments/read | Read role assignments. Cortex uses this for comprehensive asset discovery and security posture assessment across the Azure environment. |
| Microsoft.Authorization/roleDefinitions/read | Read role definitions. Cortex uses this for comprehensive asset discovery and security posture assessment across the Azure environment. |
| Microsoft.Automanage/configurationProfiles/read | Read Automanage configuration profiles. Cortex uses this for comprehensive asset discovery and security posture assessment across the Azure environment.This permission is supported in commercial cloud environments only and is not available in government cloud regions. |
| Microsoft.Automation/automationAccounts/credentials/read | Retrieve Automation hybrid runbook worker configurations. Cortex uses this permission to inventory hybrid automation workers and assess their security posture. |
| Microsoft.Automation/automationAccounts/hybridRunbookWorkerGroups/read | Read hybrid runbook worker groups. Cortex uses this for comprehensive asset discovery and security posture assessment across the Azure environment. |
| Microsoft.Automation/automationAccounts/read | Read automation accounts. Cortex uses this for comprehensive asset discovery and security posture assessment across the Azure environment. |
| Microsoft.Automation/automationAccounts/runbooks/read | Read runbooks. Cortex uses this for comprehensive asset discovery and security posture assessment across the Azure environment. |
| Microsoft.Automation/automationAccounts/variables/read | Read variables in automation accounts. Cortex uses this for comprehensive asset discovery and security posture assessment across the Azure environment. |
| Microsoft.AzureStackHCI/clusters/read | Read Azure Stack HCI clusters. Cortex uses this for comprehensive asset discovery and security posture assessment across the Azure environment. |
| Microsoft.Batch/batchAccounts/pools/read | Read batch account pools. Cortex uses this for comprehensive asset discovery and security posture assessment across the Azure environment. |
| Microsoft.Batch/batchAccounts/read | Read batch accounts. Cortex uses this for comprehensive asset discovery and security posture assessment across the Azure environment. |
| Microsoft.Blueprint/blueprints/read | Read blueprints. Cortex uses this for comprehensive asset discovery and security posture assessment across the Azure environment. |
| Microsoft.BotService/botServices/read | Read bot services. Cortex uses this for comprehensive asset discovery and security posture assessment across the Azure environment. |
| Microsoft.Cache/redisEnterprise/read | Read Redis Enterprise caches. Cortex uses this for comprehensive asset discovery and security posture assessment across the Azure environment. |
| Microsoft.Cache/redis/firewallRules/read | Read firewall rules on Redis cache. Cortex uses this for comprehensive asset discovery and security posture assessment across the Azure environment. |
| Microsoft.Cache/redis/read | Read Redis caches. Cortex uses this for comprehensive asset discovery and security posture assessment across the Azure environment. |
| Microsoft.Cdn/profiles/afdEndpoints/read | Read CDN profile AFD endpoints. Cortex uses this for comprehensive asset discovery and security posture assessment across the Azure environment. |
| Microsoft.Cdn/profiles/afdEndpoints/routes/read | Read routes of CDN profile AFD endpoints. Cortex uses this for comprehensive asset discovery and security posture assessment across the Azure environment. |
| Microsoft.Cdn/profiles/customDomains/read | Read custom domains in CDN profiles. Cortex uses this for comprehensive asset discovery and security posture assessment across the Azure environment. |
| Microsoft.Cdn/profiles/endpoints/customDomains/read | Read custom domains of CDN endpoints. Cortex uses this for comprehensive asset discovery and security posture assessment across the Azure environment. |
| Microsoft.Cdn/profiles/endpoints/read | Read CDN profile endpoints. Cortex uses this for comprehensive asset discovery and security posture assessment across the Azure environment. |
| Microsoft.Cdn/profiles/originGroups/read | Read origin groups in CDN profiles. Cortex uses this for comprehensive asset discovery and security posture assessment across the Azure environment. |
| Microsoft.Cdn/profiles/read | Read CDN profiles. Cortex uses this for comprehensive asset discovery and security posture assessment across the Azure environment. |
| Microsoft.Cdn/profiles/securityPolicies/read | Read CDN profile security policies. Cortex uses this for comprehensive asset discovery and security posture assessment across the Azure environment. |
| Microsoft.Chaos/experiments/read | Read Chaos experiments. Cortex uses this for comprehensive asset discovery and security posture assessment across the Azure environment.This permission is supported in commercial cloud environments only and is not available in government cloud regions. |
| Microsoft.CognitiveServices/accounts/deployments/read | Read deployments in Cognitive Services accounts. Cortex uses this for comprehensive asset discovery and security posture assessment across the Azure environment. |
| Microsoft.CognitiveServices/accounts/models/read | Read models in Cognitive Services accounts. Cortex uses this for comprehensive asset discovery and security posture assessment across the Azure environment. |
| Microsoft.CognitiveServices/accounts/raiPolicies/read | Read RAI policies in Cognitive Services accounts. Cortex uses this for comprehensive asset discovery and security posture assessment across the Azure environment. |
| Microsoft.CognitiveServices/accounts/read | Read Cognitive Services accounts. Cortex uses this for comprehensive asset discovery and security posture assessment across the Azure environment. |
| Microsoft.CognitiveServices/models/read | Read Cognitive Services models. Cortex uses this for comprehensive asset discovery and security posture assessment across the Azure environment. |
| Microsoft.Communication/communicationServices/read | Read Communication Services. Cortex uses this for comprehensive asset discovery and security posture assessment across the Azure environment. |
| Microsoft.Compute/availabilitySets/read | Read availability sets. Cortex uses this for comprehensive asset discovery and security posture assessment across the Azure environment. |
| Microsoft.Compute/cloudServices/read | Read cloud services. Cortex uses this for comprehensive asset discovery and security posture assessment across the Azure environment. |
| Microsoft.Compute/cloudServices/roleInstances/read | Read cloud service role instances. Cortex uses this for comprehensive asset discovery and security posture assessment across the Azure environment. |
| Microsoft.Compute/diskEncryptionSets/read | Read disk encryption sets. Cortex uses this for comprehensive asset discovery and security posture assessment across the Azure environment. |
| Microsoft.Compute/disks/read | Retrieve disk metadata. This is used to identify disk properties and states, such as detecting dangling disks. It ensures accurate inventory and assessment of storage resources within the environment. |
| Microsoft.Compute/galleries/images/read | Read gallery images in order to create disks for image scanning. Cortex uses this to inventory VM images and identify those requiring security assessment and vulnerability scanning as part of agentless disk scanning operations. |
| Microsoft.Compute/galleries/read | Read galleries. Cortex uses this for comprehensive asset discovery and security posture assessment across the Azure environment. |
| Microsoft.Compute/hostGroups/read | Read host groups. Cortex uses this for comprehensive asset discovery and security posture assessment across the Azure environment. |
| Microsoft.Compute/snapshots/read | Read snapshot metadata to manage ADS scan snapshot lifecycle |
| Microsoft.Compute/virtualMachineScaleSets/networkInterfaces/read | Read network interfaces of VM scale sets. Cortex uses this for comprehensive asset discovery and security posture assessment across the Azure environment. |
| Microsoft.Compute/virtualMachineScaleSets/publicIPAddresses/read | Read public IP addresses of VM scale sets. Cortex uses this for comprehensive asset discovery and security posture assessment across the Azure environment. |
| Microsoft.Compute/virtualMachineScaleSets/read | Read virtual machine scale sets. Cortex uses this for comprehensive asset discovery and security posture assessment across the Azure environment. |
| Microsoft.Compute/virtualMachineScaleSets/virtualMachines/instanceView/read | Read public IPs of VM scale set VM NICs IP configurations. Cortex uses this for comprehensive asset discovery and security posture assessment across the Azure environment. |
| Microsoft.Compute/virtualMachineScaleSets/virtualMachines/networkInterfaces/ipConfigurations/publicIPAddresses/read | Read public IPs of VM scale set VM NICs IP configurations. Cortex uses this for comprehensive asset discovery and security posture assessment across the Azure environment. |
| Microsoft.Compute/virtualMachineScaleSets/virtualMachines/read | Read virtual machines in VM scale sets. Cortex uses this for comprehensive asset discovery and security posture assessment across the Azure environment. |
| Microsoft.Compute/virtualMachines/extensions/read | Read VM extensions. Cortex uses this for comprehensive asset discovery and security posture assessment across the Azure environment. |
| Microsoft.Compute/virtualMachines/instanceView/read | Read VM instance view. Cortex uses this for comprehensive asset discovery and security posture assessment across the Azure environment. |
| Microsoft.Compute/virtualMachines/read | Enable reading VM configurations. Cortex uses this to inventory virtual machines and identify those requiring security scanning. |
| Microsoft.Confluent/organizations/read | Read Confluent organizations. Cortex uses this for comprehensive asset discovery and security posture assessment across the Azure environment.This permission is supported in commercial cloud environments only and is not available in government cloud regions. |
| Microsoft.ContainerInstance/containerGroups/read | Read container groups. Cortex uses this for comprehensive asset discovery and security posture assessment across the Azure environment. |
| Microsoft.ContainerRegistry/registries/metadata/read | Read container registry metadata. Cortex uses this for comprehensive asset discovery and security posture assessment across the Azure environment. |
| Microsoft.ContainerRegistry/registries/pull/read | Read/pull from container registries. Cortex uses this for comprehensive asset discovery and security posture assessment across the Azure environment. |
| Microsoft.ContainerRegistry/registries/read | Read the configuration and properties of Azure Container Registry (ACR) instances. Cortex uses this to assess container registry security settings such as export configurations as part of CSPM posture evaluation. This read-only access does not modify any registry resources. |
| Microsoft.ContainerRegistry/registries/webhooks/getCallbackConfig/action | Get webhook callback configurations. Cortex uses this to evaluate container registry webhook security configuration for security assessment and operational visibility across the Azure environment. Note that the callback config may include authentication tokens or secret URLs. |
| Microsoft.ContainerService/managedClusters/read | Read managed Kubernetes clusters. Cortex uses this for comprehensive asset discovery and security posture assessment across the Azure environment. |
| Microsoft.Dashboard/grafana/read | Read Grafana dashboards. Cortex uses this for comprehensive asset discovery and security posture assessment across the Azure environment. |
| Microsoft.DataBoxEdge/dataBoxEdgeDevices/read | Read DataBox Edge devices. Cortex uses this for comprehensive asset discovery and security posture assessment across the Azure environment. |
| Microsoft.Databricks/accessConnectors/read | Read Databricks access connectors. Cortex uses this for comprehensive asset discovery and security posture assessment across the Azure environment. |
| Microsoft.Databricks/workspaces/read | Read Databricks workspaces. Cortex uses this for comprehensive asset discovery and security posture assessment across the Azure environment. |
| Microsoft.Datadog/monitors/read | Read Datadog monitors. Cortex uses this for comprehensive asset discovery and security posture assessment across the Azure environment.This permission is supported in commercial cloud environments only and is not available in government cloud regions. |
| Microsoft.DataFactory/dataFactories/read | Read Data Factory data factories. Cortex uses this for comprehensive asset discovery and security posture assessment across the Azure environment. |
| Microsoft.DataFactory/factories/integrationRuntimes/read | Read Data Factory integration runtimes. Cortex uses this for comprehensive asset discovery and security posture assessment across the Azure environment. |
| Microsoft.DataFactory/factories/linkedServices/read | Read Data Factory linked services. Cortex uses this for comprehensive asset discovery and security posture assessment across the Azure environment. |
| Microsoft.DataFactory/factories/read | Read Data Factories. Cortex uses this for comprehensive asset discovery and security posture assessment across the Azure environment. |
| Microsoft.DataLakeAnalytics/accounts/dataLakeStoreAccounts/read | Read Data Lake Store accounts linked to Data Lake Analytics accounts. Cortex uses this for comprehensive asset discovery and security posture assessment across the Azure environment. |
| Microsoft.DataLakeAnalytics/accounts/firewallRules/read | Read Data Lake Analytics firewall rules. Cortex uses this for comprehensive asset discovery and security posture assessment across the Azure environment. |
| Microsoft.DataLakeAnalytics/accounts/read | Read Data Lake Analytics accounts. Cortex uses this for comprehensive asset discovery and security posture assessment across the Azure environment. |
| Microsoft.DataLakeAnalytics/accounts/storageAccounts/read | Read Data Lake Analytics storage accounts. Cortex uses this for comprehensive asset discovery and security posture assessment across the Azure environment. |
| Microsoft.DataLakeStore/accounts/firewallRules/read | Read Data Lake Store firewall rules. Cortex uses this for comprehensive asset discovery and security posture assessment across the Azure environment.This permission is supported in commercial cloud environments only and is not available in government cloud regions. |
| Microsoft.DataLakeStore/accounts/read | Read Data Lake Store accounts. Cortex uses this for comprehensive asset discovery and security posture assessment across the Azure environment.This permission is supported in commercial cloud environments only and is not available in government cloud regions. |
| Microsoft.DataLakeStore/accounts/trustedIdProviders/read | Read Data Lake Store trusted ID providers. Cortex uses this for comprehensive asset discovery and security posture assessment across the Azure environment.This permission is supported in commercial cloud environments only and is not available in government cloud regions. |
| Microsoft.DataLakeStore/accounts/virtualNetworkRules/read | Read Data Lake Store virtual network rules. Cortex uses this for comprehensive asset discovery and security posture assessment across the Azure environment.This permission is supported in commercial cloud environments only and is not available in government cloud regions. |
| Microsoft.DataMigration/services/read | Read Data Migration services. Cortex uses this for comprehensive asset discovery and security posture assessment across the Azure environment. |
| Microsoft.DataShare/accounts/read | Read Data Share accounts. Cortex uses this for comprehensive asset discovery and security posture assessment across the Azure environment. |
| Microsoft.DBforMariaDB/servers/firewallRules/read | Read MariaDB server firewall rules. Cortex uses this for comprehensive asset discovery and security posture assessment across the Azure environment. |
| Microsoft.DBforMariaDB/servers/read | Read MariaDB servers. Cortex uses this for comprehensive asset discovery and security posture assessment across the Azure environment. |
| Microsoft.DBforMySQL/flexibleServers/configurations/read | Read the configuration settings of Azure MySQL flexible servers. Cortex uses this to assess database security settings such as SSL enforcement configurations as part of CSPM posture evaluation. This read-only access does not modify any database configurations. |
| Microsoft.DBforMySQL/flexibleServers/databases/read | Read MySQL flexible server databases. Cortex uses this for comprehensive asset discovery and security posture assessment across the Azure environment. |
| Microsoft.DBforMySQL/flexibleServers/firewallRules/read | Read MySQL flexible server firewall rules. Cortex uses this for comprehensive asset discovery and security posture assessment across the Azure environment. |
| Microsoft.DBforMySQL/flexibleServers/read | Read MySQL flexible servers. Cortex uses this for comprehensive asset discovery and security posture assessment across the Azure environment. |
| Microsoft.DBforMySQL/servers/firewallRules/read | Read MySQL server firewall rules. Cortex uses this for comprehensive asset discovery and security posture assessment across the Azure environment. |
| Microsoft.DBforMySQL/servers/read | Read MySQL servers. Cortex uses this for comprehensive asset discovery and security posture assessment across the Azure environment. |
| Microsoft.DBforMySQL/servers/virtualNetworkRules/read | Read MySQL server virtual network rules. Cortex uses this for comprehensive asset discovery and security posture assessment across the Azure environment. |
| Microsoft.DBforPostgreSQL/flexibleServers/configurations/read | Read PostgreSQL flexible server configurations. Cortex uses this for comprehensive asset discovery and security posture assessment across the Azure environment. |
| Microsoft.DBforPostgreSQL/flexibleServers/databases/read | Read PostgreSQL flexible server databases. Cortex uses this for comprehensive asset discovery and security posture assessment across the Azure environment. |
| Microsoft.DBforPostgreSQL/flexibleServers/firewallRules/read | Read PostgreSQL flexible server firewall rules. Cortex uses this for comprehensive asset discovery and security posture assessment across the Azure environment. |
| Microsoft.DBforPostgreSQL/flexibleServers/read | Read PostgreSQL flexible servers. Cortex uses this for comprehensive asset discovery and security posture assessment across the Azure environment. |
| Microsoft.DBforPostgreSQL/servers/configurations/read | Read the configuration settings of Azure PostgreSQL servers. Cortex uses this to assess database security settings such as connection throttling parameters as part of CSPM posture evaluation. This read-only access does not modify any database configurations. |
| Microsoft.DBforPostgreSQL/servers/firewallRules/read | Read PostgreSQL server firewall rules. Cortex uses this for comprehensive asset discovery and security posture assessment across the Azure environment. |
| Microsoft.DBforPostgreSQL/servers/read | Read the configuration and properties of Azure PostgreSQL servers. Cortex uses this to inventory databases and assess their security configurations such as SSL connection settings as part of CSPM posture evaluation. This read-only access does not modify any server resources. |
| Microsoft.DBforPostgreSQL/serversv2/firewallRules/read | Read PostgreSQL servers v2 firewall rules. Cortex uses this for comprehensive asset discovery and security posture assessment across the Azure environment. |
| Microsoft.DesktopVirtualization/applicationGroups/read | Read Desktop Virtualization application groups. Cortex uses this for comprehensive asset discovery and security posture assessment across the Azure environment. |
| Microsoft.DesktopVirtualization/hostPools/read | Read Desktop Virtualization host pools. Cortex uses this for comprehensive asset discovery and security posture assessment across the Azure environment. |
| Microsoft.DesktopVirtualization/hostPools/sessionHostConfigurations/read | Read Desktop Virtualization host pool session host configurations. Cortex uses this for comprehensive asset discovery and security posture assessment across the Azure environment. |
| Microsoft.DesktopVirtualization/hostPools/sessionHosts/read | Read session hosts within Desktop Virtualization host pools. Cortex uses this for comprehensive asset discovery and security posture assessment across the Azure environment. |
| Microsoft.DesktopVirtualization/workspaces/providers/Microsoft.Insights/diagnosticSettings/read | Read Desktop Virtualization workspace diagnostic settings. Cortex uses this for comprehensive asset discovery and security posture assessment across the Azure environment. |
| Microsoft.DesktopVirtualization/workspaces/read | Read Desktop Virtualization workspaces. Cortex uses this for comprehensive asset discovery and security posture assessment across the Azure environment. |
| Microsoft.DevCenter/devcenters/read | Read DevCenter devcenters. Cortex uses this for comprehensive asset discovery and security posture assessment across the Azure environment.This permission is supported in commercial cloud environments only and is not available in government cloud regions. |
| Microsoft.Devices/IotHubs/privateLinkResources/read | Read IoT Hubs private link resources. Cortex uses this for comprehensive asset discovery and security posture assessment across the Azure environment. |
| Microsoft.Devices/IotHubs/read | Read IoT Hubs. Cortex uses this for comprehensive asset discovery and security posture assessment across the Azure environment. |
| Microsoft.DevTestLab/schedules/read | Read DevTestLab schedules. Cortex uses this for comprehensive asset discovery and security posture assessment across the Azure environment.This permission is supported in commercial cloud environments only and is not available in government cloud regions. |
| Microsoft.DigitalTwins/digitalTwinsInstances/read | Read Digital Twins instances. Cortex uses this for comprehensive asset discovery and security posture assessment across the Azure environment.This permission is supported in commercial cloud environments only and is not available in government cloud regions. |
| Microsoft.DocumentDB/cassandraClusters/read | Read DocumentDB Cassandra clusters. Cortex uses this for comprehensive asset discovery and security posture assessment across the Azure environment. |
| Microsoft.DocumentDB/databaseAccounts/read | Read the configuration and properties of Azure Cosmos DB database accounts. Cortex uses this to assess NoSQL database security settings such as key-based authentication configurations as part of CSPM posture evaluation. This read-only access does not modify any database resources. |
| Microsoft.DomainRegistration/domains/read | Read Domain registrations. Cortex uses this for comprehensive asset discovery and security posture assessment across the Azure environment.This permission is supported in commercial cloud environments only and is not available in government cloud regions. |
| Microsoft.Easm/workspaces/read | Read Easm workspaces. Cortex uses this for comprehensive asset discovery and security posture assessment across the Azure environment.This permission is supported in commercial cloud environments only and is not available in government cloud regions. |
| Microsoft.Elastic/monitors/read | Read Elastic monitors. Cortex uses this for comprehensive asset discovery and security posture assessment across the Azure environment.This permission is supported in commercial cloud environments only and is not available in government cloud regions. |
| Microsoft.EventGrid/domains/privateLinkResources/read | Read Event Grid domains private link resources. Cortex uses this for comprehensive asset discovery and security posture assessment across the Azure environment. |
| Microsoft.EventGrid/domains/read | Read Event Grid domains. Cortex uses this for comprehensive asset discovery and security posture assessment across the Azure environment. |
| Microsoft.EventGrid/namespaces/read | Read Event Grid namespaces. Cortex uses this for comprehensive asset discovery and security posture assessment across the Azure environment. |
| Microsoft.EventGrid/partnerNamespaces/read | Read Event Grid partner namespaces. Cortex uses this for comprehensive asset discovery and security posture assessment across the Azure environment. |
| Microsoft.EventGrid/topics/privateLinkResources/read | Read Event Grid topics private link resources. Cortex uses this for comprehensive asset discovery and security posture assessment across the Azure environment. |
| Microsoft.EventGrid/topics/read | Read Event Grid topics. Cortex uses this for comprehensive asset discovery and security posture assessment across the Azure environment. |
| Microsoft.EventHub/clusters/read | Read EventHub clusters. Cortex uses this for comprehensive asset discovery and security posture assessment across the Azure environment. |
| Microsoft.EventHub/namespaces/authorizationRules/read | Read EventHub namespaces authorization rules. Cortex uses this for comprehensive asset discovery and security posture assessment across the Azure environment. |
| Microsoft.EventHub/namespaces/eventhubs/authorizationRules/read | Read EventHub event hub authorization rules. Cortex uses this for comprehensive asset discovery and security posture assessment across the Azure environment. |
| Microsoft.EventHub/namespaces/eventhubs/read | Read EventHub event hubs. Cortex uses this for comprehensive asset discovery and security posture assessment across the Azure environment. |
| Microsoft.EventHub/namespaces/ipFilterRules/read | Read EventHub IP filter rules. Cortex uses this for comprehensive asset discovery and security posture assessment across the Azure environment. |
| Microsoft.EventHub/namespaces/privateEndpointConnections/read | Read EventHub Namespace private endpoint connections. Cortex uses this for comprehensive asset discovery and security posture assessment across the Azure environment. |
| Microsoft.EventHub/namespaces/read | Read EventHub namespaces. Cortex uses this for comprehensive asset discovery and security posture assessment across the Azure environment. |
| Microsoft.EventHub/namespaces/virtualNetworkRules/read | Read EventHub virtual network rules. Cortex uses this for comprehensive asset discovery and security posture assessment across the Azure environment. |
| Microsoft.HDInsight/clusters/applications/read | Read HDInsight cluster applications. Cortex uses this for comprehensive asset discovery and security posture assessment across the Azure environment. |
| Microsoft.HDInsight/clusters/read | Read HDInsight clusters. Cortex uses this for comprehensive asset discovery and security posture assessment across the Azure environment. |
| Microsoft.HealthBot/healthBots/read | Read HealthBot bots. Cortex uses this for comprehensive asset discovery and security posture assessment across the Azure environment.This permission is supported in commercial cloud environments only and is not available in government cloud regions. |
| Microsoft.HealthcareApis/workspaces/read | Read Healthcare APIs workspaces. Cortex uses this for comprehensive asset discovery and security posture assessment across the Azure environment. |
| Microsoft.HybridCompute/machines/read | Read Hybrid Compute machines. Cortex uses this for comprehensive asset discovery and security posture assessment across the Azure environment. |
| Microsoft.Insights/actionGroups/read | Read Insights action groups. Cortex uses this for comprehensive asset discovery and security posture assessment across the Azure environment. |
| Microsoft.Insights/activityLogAlerts/read | Read Insights activity log alerts. Cortex uses this for comprehensive asset discovery and security posture assessment across the Azure environment. |
| Microsoft.Insights/components/read | Read Insights components. Cortex uses this for comprehensive asset discovery and security posture assessment across the Azure environment. |
| Microsoft.Insights/dataCollectionEndpoints/read | Read Insights data collection endpoints. Cortex uses this for comprehensive asset discovery and security posture assessment across the Azure environment. |
| Microsoft.Insights/dataCollectionRules/read | Read Insights data collection rules. Cortex uses this for comprehensive asset discovery and security posture assessment across the Azure environment. |
| Microsoft.Insights/diagnosticSettings/read | Read Insights diagnostic settings. Cortex uses this for comprehensive asset discovery and security posture assessment across the Azure environment. |
| Microsoft.Insights/eventtypes/values/read | Read Insights event type values. Cortex uses this for comprehensive asset discovery and security posture assessment across the Azure environment. |
| Microsoft.Insights/logProfiles/read | Read the configuration of Azure Activity Log profiles. Cortex uses this to assess audit logging coverage and verify that activity log retention periods meet security requirements. This read-only access does not modify any log profile configurations. |
| Microsoft.Insights/metricAlerts/read | Read Insights metric alerts. Cortex uses this for comprehensive asset discovery and security posture assessment across the Azure environment. |
| Microsoft.IoTCentral/iotApps/read | Retrieve IoT Central application configurations. Cortex uses this permission to inventory IoT applications and assess their security posture.This permission is supported in commercial cloud environments only and is not available in government cloud regions. |
| Microsoft.KeyVault/vaults/keys/read | Read Key Vault keys. Cortex uses this for comprehensive asset discovery and security posture assessment across the Azure environment. |
| Microsoft.KeyVault/vaults/privateLinkResources/read | Read Key Vault private link resources. Cortex uses this for comprehensive asset discovery and security posture assessment across the Azure environment. |
| Microsoft.KeyVault/vaults/read | Read the configuration and properties of Azure Key Vaults. Cortex uses this to assess key management security settings such as recoverability configurations (soft-delete, purge-protection) as part of CSPM posture evaluation. This read-only access does not modify any Key Vault resources. |
| Microsoft.Kusto/clusters/databases/read | Read Kusto cluster databases. Cortex uses this for comprehensive asset discovery and security posture assessment across the Azure environment. |
| Microsoft.Kusto/clusters/read | Read Kusto clusters. Cortex uses this for comprehensive asset discovery and security posture assessment across the Azure environment. |
| Microsoft.LabServices/labs/read | Read Lab Services labs. Cortex uses this for comprehensive asset discovery and security posture assessment across the Azure environment.This permission is supported in commercial cloud environments only and is not available in government cloud regions. |
| Microsoft.LoadTestService/loadTests/read | Read Load Test Service tests. Cortex uses this for comprehensive asset discovery and security posture assessment across the Azure environment. |
| Microsoft.Logic/integrationAccounts/read | Read Logic integration accounts. Cortex uses this for comprehensive asset discovery and security posture assessment across the Azure environment. |
| Microsoft.Logic/workflows/read | Read Logic workflows. Cortex uses this for comprehensive asset discovery and security posture assessment across the Azure environment. |
| Microsoft.Logic/workflows/versions/read | Read Logic workflow versions. Cortex uses this for comprehensive asset discovery and security posture assessment across the Azure environment. |
| Microsoft.MachineLearningServices/workspaces/computes/read | Read Machine Learning Services workspace computes. Cortex uses this for comprehensive asset discovery and security posture assessment across the Azure environment. |
| Microsoft.MachineLearningServices/workspaces/outboundRules/read | Read Machine Learning Services workspace outbound rules. Cortex uses this for comprehensive asset discovery and security posture assessment across the Azure environment. |
| Microsoft.MachineLearningServices/workspaces/read | Read Machine Learning Services workspaces. Cortex uses this for comprehensive asset discovery and security posture assessment across the Azure environment. |
| Microsoft.ManagedIdentity/userAssignedIdentities/read | Read Managed Identity user assigned identities. Cortex uses this for comprehensive asset discovery and security posture assessment across the Azure environment. |
| Microsoft.ManagedServices/marketplaceRegistrationDefinitions/read | Read Managed Services marketplace registration definitions. Cortex uses this for comprehensive asset discovery and security posture assessment across the Azure environment. |
| Microsoft.ManagedServices/registrationAssignments/read | Read Managed Services registration assignments. Cortex uses this for comprehensive asset discovery and security posture assessment across the Azure environment. |
| Microsoft.Management/managementGroups/descendants/read | Read Management Groups descendants. Cortex uses this for comprehensive asset discovery and security posture assessment across the Azure environment. |
| Microsoft.Management/managementGroups/read | Read Management Groups. Cortex uses this for comprehensive asset discovery and security posture assessment across the Azure environment. |
| Microsoft.Management/managementGroups/subscriptions/read | Read Management Groups subscriptions. Cortex uses this for comprehensive asset discovery and security posture assessment across the Azure environment. |
| Microsoft.Maps/accounts/read | Read Maps accounts. Cortex uses this for comprehensive asset discovery and security posture assessment across the Azure environment. |
| Microsoft.Migrate/moveCollections/read | Read Migrate move collections. Cortex uses this for comprehensive asset discovery and security posture assessment across the Azure environment. |
| Microsoft.Monitor/accounts/read | Read Monitor accounts. Cortex uses this for comprehensive asset discovery and security posture assessment across the Azure environment. |
| Microsoft.NetApp/netAppAccounts/capacityPools/read | Read NetApp capacity pools. Cortex uses this for comprehensive asset discovery and security posture assessment across the Azure environment. |
| Microsoft.NetApp/netAppAccounts/capacityPools/volumes/read | Read NetApp capacity pool volumes. Cortex uses this for comprehensive asset discovery and security posture assessment across the Azure environment. |
| Microsoft.NetApp/netAppAccounts/read | Read NetApp accounts. Cortex uses this for comprehensive asset discovery and security posture assessment across the Azure environment. |
| Microsoft.Network/applicationGateways/read | Read Application Gateways. Cortex uses this for comprehensive asset discovery and security posture assessment across the Azure environment. |
| Microsoft.Network/ApplicationGatewayWebApplicationFirewallPolicies/read | Read Application Gateway Web Application Firewall Policies. Cortex uses this for comprehensive asset discovery and security posture assessment across the Azure environment. |
| Microsoft.Network/applicationSecurityGroups/read | Read Application Security Groups. Cortex uses this for comprehensive asset discovery and security posture assessment across the Azure environment. |
| Microsoft.Network/azureFirewalls/read | Read Azure Firewalls. Cortex uses this for comprehensive asset discovery and security posture assessment across the Azure environment. |
| Microsoft.Network/bastionHosts/read | Read Bastion Hosts. Cortex uses this for comprehensive asset discovery and security posture assessment across the Azure environment. |
| Microsoft.Network/connections/read | Read Network Connections. Cortex uses this for comprehensive asset discovery and security posture assessment across the Azure environment. |
| Microsoft.Network/ddosProtectionPlans/read | Read DDoS Protection Plans. Cortex uses this for comprehensive asset discovery and security posture assessment across the Azure environment. |
| Microsoft.Network/dnsZones/read | Read DNS Zones. Cortex uses this for comprehensive asset discovery and security posture assessment across the Azure environment. |
| Microsoft.Network/expressRouteCircuits/authorizations/read | Read ExpressRoute Circuit authorizations. Cortex uses this for comprehensive asset discovery and security posture assessment across the Azure environment. |
| Microsoft.Network/expressRouteCircuits/peerings/connections/read | Read ExpressRoute Circuit peerings connections. Cortex uses this for comprehensive asset discovery and security posture assessment across the Azure environment. |
| Microsoft.Network/expressRouteCircuits/peerings/peerConnections/read | Read ExpressRoute Circuit peer connections. Cortex uses this for comprehensive asset discovery and security posture assessment across the Azure environment. |
| Microsoft.Network/expressRouteCircuits/peerings/read | Read ExpressRoute Circuit peerings. Cortex uses this for comprehensive asset discovery and security posture assessment across the Azure environment. |
| Microsoft.Network/expressRouteCircuits/read | Read ExpressRoute Circuits. Cortex uses this for comprehensive asset discovery and security posture assessment across the Azure environment. |
| Microsoft.Network/expressRouteCrossConnections/peerings/read | Read ExpressRoute Cross Connections peerings. Cortex uses this for comprehensive asset discovery and security posture assessment across the Azure environment. |
| Microsoft.Network/expressRouteCrossConnections/read | Read ExpressRoute Cross Connections. Cortex uses this for comprehensive asset discovery and security posture assessment across the Azure environment. |
| Microsoft.Network/expressRouteGateways/expressRouteConnections/read | Read ExpressRoute Gateways connections. Cortex uses this for comprehensive asset discovery and security posture assessment across the Azure environment. |
| Microsoft.Network/expressRouteGateways/read | Read ExpressRoute Gateways. Cortex uses this for comprehensive asset discovery and security posture assessment across the Azure environment. |
| Microsoft.Network/expressRoutePorts/authorizations/read | Read ExpressRoute Ports authorizations. Cortex uses this for comprehensive asset discovery and security posture assessment across the Azure environment. |
| Microsoft.Network/expressRoutePorts/links/read | Read ExpressRoute Ports links. Cortex uses this for comprehensive asset discovery and security posture assessment across the Azure environment. |
| Microsoft.Network/expressRoutePortsLocations/read | Read ExpressRoute Ports locations. Cortex uses this for comprehensive asset discovery and security posture assessment across the Azure environment. |
| Microsoft.Network/expressRoutePorts/read | Read ExpressRoute Ports. Cortex uses this for comprehensive asset discovery and security posture assessment across the Azure environment. |
| Microsoft.Network/firewallPolicies/read | Read Firewall Policies. Cortex uses this for comprehensive asset discovery and security posture assessment across the Azure environment. |
| Microsoft.Network/frontdoors/backendPools/read | Read Front Door backend pools. Cortex uses this for comprehensive asset discovery and security posture assessment across the Azure environment. |
| Microsoft.Network/frontdoors/frontendEndpoints/read | Read Front Door frontend endpoints. Cortex uses this for comprehensive asset discovery and security posture assessment across the Azure environment. |
| Microsoft.Network/frontdoors/healthProbeSettings/read | Read Front Door health probe settings. Cortex uses this for comprehensive asset discovery and security posture assessment across the Azure environment. |
| Microsoft.Network/frontdoors/loadBalancingSettings/read | Read Front Door load balancing settings. Cortex uses this for comprehensive asset discovery and security posture assessment across the Azure environment. |
| Microsoft.Network/frontdoors/read | Read front doors. Cortex uses this for comprehensive asset discovery and security posture assessment across the Azure environment. |
| Microsoft.Network/frontdoors/routingRules/read | Read Front Door routing rules. Cortex uses this for comprehensive asset discovery and security posture assessment across the Azure environment. |
| Microsoft.Network/frontdoors/rulesEngines/read | Read Front Door rules engines. Cortex uses this for comprehensive asset discovery and security posture assessment across the Azure environment. |
| Microsoft.Network/FrontDoorWebApplicationFirewallPolicies/read | Read Front Door Web Application Firewall Policies. Cortex uses this for comprehensive asset discovery and security posture assessment across the Azure environment. |
| Microsoft.NetworkFunction/azureTrafficCollectors/read | Read Azure Traffic Collectors. Cortex uses this for comprehensive asset discovery and security posture assessment across the Azure environment.This permission is supported in commercial cloud environments only and is not available in government cloud regions. |
| Microsoft.Network/loadBalancers/read | Read Load Balancers. Cortex uses this for comprehensive asset discovery and security posture assessment across the Azure environment. |
| Microsoft.Network/localNetworkGateways/read | Read Local Network Gateways. Cortex uses this for comprehensive asset discovery and security posture assessment across the Azure environment. |
| Microsoft.Network/locations/usages/read | Read Network locations usage. Cortex uses this for comprehensive asset discovery and security posture assessment across the Azure environment. |
| Microsoft.Network/natGateways/read | Read NAT Gateways. Cortex uses this for comprehensive asset discovery and security posture assessment across the Azure environment. |
| Microsoft.Network/networkInterfaces/effectiveNetworkSecurityGroups/action | View and/or execute effective network security groups action. Cortex uses this for security assessment and operational visibility across the Azure environment. |
| Microsoft.Network/networkInterfaces/effectiveRouteTable/action | Execute effective route table on NICs action. Cortex uses this for security assessment and operational visibility across the Azure environment. |
| Microsoft.Network/networkInterfaces/read | Read the list of Network Security Group (NSG) interfaces and their configurations. Cortex uses this to assess network security settings and identify resources associated with specific NSGs as part of automation workflows. Required for command: azure-nsg-network-interfaces-list. |
| Microsoft.Network/networkSecurityGroups/defaultSecurityRules/read | Read Network Security Groups default security rules. Cortex uses this for comprehensive asset discovery and security posture assessment across the Azure environment. |
| Microsoft.Network/networkSecurityGroups/read | Read the list and configurations of Network Security Groups (NSGs). Cortex uses this to assess network security posture and identify NSGs that may require remediation. Required for command: azure-nsg-security-groups-list. |
| Microsoft.Network/networkSecurityGroups/securityRules/read | Read the configuration of Network Security Group (NSG) rules to assess traffic permissions. Cortex uses this to evaluate whether NSG rules are overly permissive and to determine if remediation is needed. Required for command: azure-nsg-security-rule-get. |
| Microsoft.Network/networkWatchers/read | Read network watcher settings. Cortex uses this for comprehensive asset discovery and security posture assessment across the Azure environment. |
| Microsoft.Network/networkWatchers/securityGroupView/action | View and/or execute effective security group view action. Cortex uses this for security assessment and operational visibility across the Azure environment. |
| Microsoft.Network/p2sVpnGateways/read | Read P2S VPN Gateways. Cortex uses this for comprehensive asset discovery and security posture assessment across the Azure environment. |
| Microsoft.Network/privateDnsZones/all/read | Read Private DNS Zones ALL. Cortex uses this for comprehensive asset discovery and security posture assessment across the Azure environment. |
| Microsoft.Network/privateDnsZones/read | Read Private DNS Zones. Cortex uses this for comprehensive asset discovery and security posture assessment across the Azure environment. |
| Microsoft.Network/privateEndpoints/privateDnsZoneGroups/read | Read Private Endpoints DNS Zone Groups. Cortex uses this for comprehensive asset discovery and security posture assessment across the Azure environment. |
| Microsoft.Network/privateEndpoints/read | Read Private Endpoints. Cortex uses this for comprehensive asset discovery and security posture assessment across the Azure environment. |
| Microsoft.Network/privateLinkServices/read | Read Private Link Services. Cortex uses this for comprehensive asset discovery and security posture assessment across the Azure environment. |
| Microsoft.Network/publicIPAddresses/read | Read and lists Network Security Group (NSG) and VM public IP addresses and their details. Cortex uses this to identify externally exposed resources and assess their security posture as part of automation workflows. Required for commands: azure-nsg-public-ip-addresses-list and azure-vm-public-ip-details-get. |
| Microsoft.Network/publicIPPrefixes/read | Read Public IP Prefixes. Cortex uses this for comprehensive asset discovery and security posture assessment across the Azure environment. |
| Microsoft.Network/routeFilters/read | Read Route Filters. Cortex uses this for comprehensive asset discovery and security posture assessment across the Azure environment. |
| Microsoft.Network/routeFilters/routeFilterRules/read | Read Route Filter Rules. Cortex uses this for comprehensive asset discovery and security posture assessment across the Azure environment. |
| Microsoft.Network/routeTables/read | Read Route Tables. Cortex uses this for comprehensive asset discovery and security posture assessment across the Azure environment. |
| Microsoft.Network/routeTables/routes/read | Read Route Table Routes. Cortex uses this for comprehensive asset discovery and security posture assessment across the Azure environment. |
| Microsoft.Network/serviceEndpointPolicies/read | Read Service Endpoint Policies. Cortex uses this for comprehensive asset discovery and security posture assessment across the Azure environment. |
| Microsoft.Network/serviceEndpointPolicies/serviceEndpointPolicyDefinitions/read | Read Service Endpoint Policy Definitions. Cortex uses this for comprehensive asset discovery and security posture assessment across the Azure environment. |
| Microsoft.Network/trafficManagerProfiles/read | Read Traffic Manager Profiles. Cortex uses this for comprehensive asset discovery and security posture assessment across the Azure environment. |
| Microsoft.Network/virtualNetworkGateways/connections/read | Read Virtual network gateways connections. Cortex uses this for comprehensive asset discovery and security posture assessment across the Azure environment. |
| Microsoft.Network/virtualNetworkGateways/read | Read Virtual Network Gateways. Cortex uses this for comprehensive asset discovery and security posture assessment across the Azure environment. |
| Microsoft.Network/virtualNetworks/read | Read Virtual Networks. Cortex uses this for comprehensive asset discovery and security posture assessment across the Azure environment. |
| Microsoft.Network/virtualNetworks/subnets/read | Read Virtual Network Subnets. Cortex uses this for comprehensive asset discovery and security posture assessment across the Azure environment. |
| Microsoft.Network/virtualNetworks/virtualNetworkPeerings/read | Read Virtual Network peerings. Cortex uses this for comprehensive asset discovery and security posture assessment across the Azure environment. |
| Microsoft.Network/virtualWans/read | Read Virtual WANs. Cortex uses this for comprehensive asset discovery and security posture assessment across the Azure environment. |
| Microsoft.Network/vpnServerConfigurations/read | Read VPN Server Configurations. Cortex uses this for comprehensive asset discovery and security posture assessment across the Azure environment. |
| Microsoft.notificationHubs/namespaces/notificationHubs/read | Read Notification Hubs. Cortex uses this for comprehensive asset discovery and security posture assessment across the Azure environment. |
| Microsoft.notificationHubs/namespaces/read | Read Notification Hub namespaces. Cortex uses this for comprehensive asset discovery and security posture assessment across the Azure environment. |
| Microsoft.OperationalInsights/clusters/read | Read Operational Insights clusters. Cortex uses this for comprehensive asset discovery and security posture assessment across the Azure environment. |
| Microsoft.OperationalInsights/queryPacks/read | Read Operational Insights query packs. Cortex uses this for comprehensive asset discovery and security posture assessment across the Azure environment. |
| Microsoft.OperationalInsights/workspaces/read | Read Operational Insights workspaces. Cortex uses this for comprehensive asset discovery and security posture assessment across the Azure environment. |
| Microsoft.OperationalInsights/workspaces/tables/read | Read Operational Insights workspace tables. Cortex uses this for comprehensive asset discovery and security posture assessment across the Azure environment. |
| Microsoft.PowerBIDedicated/servers/read | Read Power BI Dedicated servers. Cortex uses this for comprehensive asset discovery and security posture assessment across the Azure environment. |
| Microsoft.Quantum/workspaces/read | Read Quantum Workspaces. Cortex uses this for comprehensive asset discovery and security posture assessment across the Azure environment.This permission is supported in commercial cloud environments only and is not available in government cloud regions. |
| Microsoft.RecoveryServices/vaults/backupPolicies/read | Read Recovery Services Vault backup policies. Cortex uses this for comprehensive asset discovery and security posture assessment across the Azure environment. |
| Microsoft.RecoveryServices/vaults/backupProtectedItems/read | Read Recovery Services Vault backup protected items. Cortex uses this for comprehensive asset discovery and security posture assessment across the Azure environment. |
| Microsoft.RecoveryServices/vaults/read | Read Recovery Services Vaults. Cortex uses this for comprehensive asset discovery and security posture assessment across the Azure environment. |
| Microsoft.RedHatOpenShift/openshiftClusters/read | Read Red Hat OpenShift clusters. Cortex uses this for comprehensive asset discovery and security posture assessment across the Azure environment. |
| Microsoft.Relay/namespaces/read | Read Relay namespaces. Cortex uses this for comprehensive asset discovery and security posture assessment across the Azure environment. |
| Microsoft.resources/resources/read | Read generic resources. Cortex uses this for comprehensive asset discovery and security posture assessment across the Azure environment. |
| Microsoft.resources/subscriptions/providers/read | Read subscription providers. Cortex uses this for comprehensive asset discovery and security posture assessment across the Azure environment. |
| Microsoft.resources/subscriptions/read | Read the status and details of Azure subscriptions. Cortex uses this to understand the Azure environment structure and enumerate available subscriptions for automation workflows. Required for command: azure-nsg-subscriptions-list. |
| Microsoft.resources/subscriptions/resourceGroups/read | Read the status and details of resource groups within a subscription. Cortex uses this to inventory Azure resources and understand the organizational structure of the environment. Required for command: azure-nsg-resource-group-list. |
| Microsoft.resources/templateSpecs/read | Read template specs. Cortex uses this for comprehensive asset discovery and security posture assessment across the Azure environment. |
| Microsoft.SaaS/applications/read | Read SaaS applications. Cortex uses this for comprehensive asset discovery and security posture assessment across the Azure environment.This permission is supported in commercial cloud environments only and is not available in government cloud regions. |
| Microsoft.Search/searchServices/read | Read Azure AI Search service properties to discover search services for DSPM scanning |
| Microsoft.Security/advancedThreatProtectionSettings/read | Read Security advanced threat protection settings. Cortex uses this for comprehensive asset discovery and security posture assessment across the Azure environment. |
| Microsoft.Security/automations/read | Read Security automations. Cortex uses this for comprehensive asset discovery and security posture assessment across the Azure environment. |
| Microsoft.Security/iotSecuritySolutions/read | Read IoT Security Solutions. Cortex uses this for comprehensive asset discovery and security posture assessment across the Azure environment. |
| Microsoft.Security/locations/jitNetworkAccessPolicies/read | Read Just-in-Time network access policies. Cortex uses this for comprehensive asset discovery and security posture assessment across the Azure environment. |
| Microsoft.Security/locations/read | Read Security locations. Cortex uses this for comprehensive asset discovery and security posture assessment across the Azure environment. |
| Microsoft.Security/pricings/read | Read Security pricings. Cortex uses this for comprehensive asset discovery and security posture assessment across the Azure environment. |
| Microsoft.Security/secureScores/read | Read Security secure scores. Cortex uses this for comprehensive asset discovery and security posture assessment across the Azure environment. |
| Microsoft.Security/securityContacts/read | Read Microsoft Defender for Cloud security contact configurations (email addresses, notification preferences). Cortex uses this for comprehensive asset discovery and security posture assessment across the Azure environment. |
| Microsoft.Security/settings/read | Read Security settings. Cortex uses this for comprehensive asset discovery and security posture assessment across the Azure environment. |
| Microsoft.Security/workspaceSettings/read | Read Security workspace settings. Cortex uses this for comprehensive asset discovery and security posture assessment across the Azure environment. |
| Microsoft.ServiceBus/namespaces/authorizationRules/read | Read Service Bus namespace authorization rules. Cortex uses this for comprehensive asset discovery and security posture assessment across the Azure environment. |
| Microsoft.ServiceBus/namespaces/networkRuleSets/read | Read Service Bus namespace network rule sets. Cortex uses this for comprehensive asset discovery and security posture assessment across the Azure environment. |
| Microsoft.ServiceBus/namespaces/privateEndpointConnections/read | Read Service Bus namespace diagnostic settings. Cortex uses this for comprehensive asset discovery and security posture assessment across the Azure environment. |
| Microsoft.ServiceBus/namespaces/providers/Microsoft.Insights/diagnosticSettings/read | Read Service Bus namespace diagnostic settings. Cortex uses this for comprehensive asset discovery and security posture assessment across the Azure environment. |
| Microsoft.ServiceBus/namespaces/queues/read | Read Service Bus queues. Cortex uses this for comprehensive asset discovery and security posture assessment across the Azure environment. |
| Microsoft.ServiceBus/namespaces/read | Read Service Bus namespaces. Cortex uses this for comprehensive asset discovery and security posture assessment across the Azure environment. |
| Microsoft.ServiceBus/namespaces/topics/read | Read Service Bus topics. Cortex uses this for comprehensive asset discovery and security posture assessment across the Azure environment. |
| Microsoft.ServiceBus/namespaces/topics/subscriptions/read | Read Service Bus topic subscriptions. Cortex uses this for comprehensive asset discovery and security posture assessment across the Azure environment. |
| Microsoft.ServiceFabric/clusters/read | Read Service Fabric clusters. Cortex uses this for comprehensive asset discovery and security posture assessment across the Azure environment. |
| Microsoft.SignalRService/signalr/read | Read SignalR Service SignalR. Cortex uses this for comprehensive asset discovery and security posture assessment across the Azure environment. |
| Microsoft.SignalRService/webPubSub/read | Read SignalR Web PubSub. Cortex uses this for comprehensive asset discovery and security posture assessment across the Azure environment. |
| Microsoft.Solutions/applications/read | Read Solutions applications. Cortex uses this for comprehensive asset discovery and security posture assessment across the Azure environment. |
| Microsoft.Sql/managedInstances/databases/read | Read SQL managed instances databases. Cortex uses this for comprehensive asset discovery and security posture assessment across the Azure environment. |
| Microsoft.Sql/managedInstances/databases/transparentDataEncryption/read | Read SQL managed instances databases Transparent Data Encryption. Cortex uses this for comprehensive asset discovery and security posture assessment across the Azure environment. |
| Microsoft.Sql/managedInstances/encryptionProtector/read | Read SQL managed instances encryption protector. Cortex uses this for comprehensive asset discovery and security posture assessment across the Azure environment. |
| Microsoft.Sql/managedInstances/read | Read SQL managed instances. Cortex uses this for comprehensive asset discovery and security posture assessment across the Azure environment. |
| Microsoft.Sql/managedInstances/vulnerabilityAssessments/read | Read SQL managed instances vulnerability assessments. Cortex uses this for comprehensive asset discovery and security posture assessment across the Azure environment. |
| Microsoft.Sql/servers/administrators/read | Read SQL server administrators. Cortex uses this for comprehensive asset discovery and security posture assessment across the Azure environment. |
| Microsoft.Sql/servers/auditingSettings/read | Read SQL server auditing settings. Cortex uses this for comprehensive asset discovery and security posture assessment across the Azure environment. |
| Microsoft.Sql/servers/databases/auditingSettings/read | Read SQL server databases auditing settings. Cortex uses this for comprehensive asset discovery and security posture assessment across the Azure environment. |
| Microsoft.Sql/servers/databases/dataMaskingPolicies/read | Read SQL server databases data masking policies. Cortex uses this for comprehensive asset discovery and security posture assessment across the Azure environment. |
| Microsoft.Sql/servers/databases/dataMaskingPolicies/rules/read | Read SQL server databases data masking policies rules. Cortex uses this for comprehensive asset discovery and security posture assessment across the Azure environment. |
| Microsoft.Sql/servers/databases/read | Read SQL server databases. Cortex uses this for comprehensive asset discovery and security posture assessment across the Azure environment. |
| Microsoft.Sql/servers/databases/securityAlertPolicies/read | Read the security alert policy configuration for Azure SQL Databases. Cortex uses this to assess database threat detection configurations and determine whether email notifications for Threat Detection are properly enabled. This read-only access does not modify any security alert policies. |
| Microsoft.Sql/servers/databases/transparentDataEncryption/read | Read the Transparent Data Encryption (TDE) status for Azure SQL databases. Cortex uses this to assess database encryption posture and determine whether TDE is properly enabled. This read-only access does not modify any encryption settings. |
| Microsoft.Sql/servers/encryptionProtector/read | Read SQL server encryption protector. Cortex uses this for comprehensive asset discovery and security posture assessment across the Azure environment. |
| Microsoft.Sql/servers/firewallRules/read | Read SQL server firewall rules. Cortex uses this for comprehensive asset discovery and security posture assessment across the Azure environment. |
| Microsoft.Sql/servers/read | Read SQL servers. Cortex uses this for comprehensive asset discovery and security posture assessment across the Azure environment. |
| Microsoft.Sql/servers/securityAlertPolicies/read | Read SQL server security alert policies. Cortex uses this for comprehensive asset discovery and security posture assessment across the Azure environment. |
| Microsoft.Sql/servers/vulnerabilityAssessments/read | Read SQL server vulnerability assessments. Cortex uses this for comprehensive asset discovery and security posture assessment across the Azure environment. |
| Microsoft.SqlVirtualMachine/sqlVirtualMachines/read | Read SQL Virtual Machines. Cortex uses this for comprehensive asset discovery and security posture assessment across the Azure environment. |
| Microsoft.StorageCache/caches/read | Read Storage Cache caches. Cortex uses this for comprehensive asset discovery and security posture assessment across the Azure environment. |
| Microsoft.StorageCache/subscription/caches/read | Read Storage Cache subscription caches. Cortex uses this for comprehensive asset discovery and security posture assessment across the Azure environment. |
| Microsoft.StorageMover/storageMovers/read | Read Storage Mover storage movers. Cortex uses this for comprehensive asset discovery and security posture assessment across the Azure environment. |
| Microsoft.Storage/storageAccounts/blobServices/read | Read the configuration of Azure Storage account blob services. Cortex uses this to assess storage security posture, including soft delete settings, as part of CSPM posture evaluation. This read-only access does not modify any blob service configurations. |
| Microsoft.Storage/storageAccounts/fileServices/read | Read Storage file services. Cortex uses this for comprehensive asset discovery and security posture assessment across the Azure environment. |
| Microsoft.Storage/storageAccounts/fileServices/shares/read | Read file share metadata to discover and inventory file share data stores for DSPM scanning |
| Microsoft.Storage/storageAccounts/listKeys/action | List Storage account keys (action). Cortex uses this for security assessment and operational visibility across the Azure environment and it ingests key metadata for CSPM policy evaluation (key rotation, key-based access status), returning storage account access keys. While the keys do grant full read/write access to the storage account data, and transit through the Cortex XSIAM scanning infrastructure, Cortex evaluates key metadata in-memory and does not persist or use the keys for data-plane access. |
| Microsoft.Storage/storageAccounts/providers/Microsoft.Insights/diagnosticSettings/read | Read Storage account diagnostic settings. Cortex uses this for comprehensive asset discovery and security posture assessment across the Azure environment. |
| Microsoft.Storage/storageAccounts/queueServices/read | Read Storage queue services. Cortex uses this for comprehensive asset discovery and security posture assessment across the Azure environment. |
| Microsoft.Storage/storageAccounts/read | Read storage account properties to discover and inventory data stores for DSPM scanning |
| Microsoft.Storage/storageAccounts/tableServices/read | Read Storage table services. Cortex uses this for comprehensive asset discovery and security posture assessment across the Azure environment. |
| Microsoft.StorageSync/storageSyncServices/privateLinkResources/read | Read Storage Sync private link resources. Cortex uses this for comprehensive asset discovery and security posture assessment across the Azure environment. |
| Microsoft.StorageSync/storageSyncServices/read | Read Storage Sync services. Cortex uses this for comprehensive asset discovery and security posture assessment across the Azure environment. |
| Microsoft.StreamAnalytics/clusters/read | Read Stream Analytics clusters. Cortex uses this for comprehensive asset discovery and security posture assessment across the Azure environment. |
| Microsoft.StreamAnalytics/streamingJobs/read | Read Stream Analytics streaming jobs. Cortex uses this for comprehensive asset discovery and security posture assessment across the Azure environment. |
| Microsoft.subscription/policies/default/read | Read Subscription default policies. Cortex uses this for comprehensive asset discovery and security posture assessment across the Azure environment. |
| Microsoft.Synapse/privateLinkHubs/privateLinkResources/read | Read Synapse private link hubs private link resources. Cortex uses this for comprehensive asset discovery and security posture assessment across the Azure environment. |
| Microsoft.Synapse/privateLinkHubs/read | Read Synapse private link hubs. Cortex uses this for comprehensive asset discovery and security posture assessment across the Azure environment. |
| Microsoft.Synapse/workspaces/privateLinkResources/read | Read Synapse workspace private link resources. Cortex uses this for comprehensive asset discovery and security posture assessment across the Azure environment. |
| Microsoft.Synapse/workspaces/read | Read Synapse workspaces. Cortex uses this for comprehensive asset discovery and security posture assessment across the Azure environment. |
| Microsoft.Synapse/workspaces/sparkConfigurations/read | Read Synapse workspaces spark configurations. Cortex uses this for comprehensive asset discovery and security posture assessment across the Azure environment. |
| Microsoft.Synapse/workspaces/sqlPools/geoBackupPolicies/read | Read Synapse workspaces SQL pools geo backup policies. Cortex uses this for comprehensive asset discovery and security posture assessment across the Azure environment. |
| Microsoft.Synapse/workspaces/sqlPools/read | Read Synapse workspaces SQL pools. Cortex uses this for comprehensive asset discovery and security posture assessment across the Azure environment. |
| Microsoft.VideoIndexer/accounts/read | Read Video Indexer accounts. Cortex uses this for comprehensive asset discovery and security posture assessment across the Azure environment. |
| Microsoft.VisualStudio/account/read | Read Visual Studio accounts. Cortex uses this for comprehensive asset discovery and security posture assessment across the Azure environment.This permission is supported in commercial cloud environments only and is not available in government cloud regions. |
| Microsoft.Web/certificates/read | Read Web certificates. Cortex uses this for comprehensive asset discovery and security posture assessment across the Azure environment. |
| Microsoft.Web/customApis/read | Read Web custom APIs. Cortex uses this for comprehensive asset discovery and security posture assessment across the Azure environment. |
| Microsoft.Web/hostingEnvironments/read | Read Web hosting environments. Cortex uses this for comprehensive asset discovery and security posture assessment across the Azure environment. |
| Microsoft.Web/serverFarms/read | Read Web server farms. Cortex uses this for comprehensive asset discovery and security posture assessment across the Azure environment. |
| Microsoft.Web/serverFarms/sites/read | Read Server farms sites. Cortex uses this for comprehensive asset discovery and security posture assessment across the Azure environment. |
| Microsoft.Web/sites/basicPublishingCredentialsPolicies/read | Read Web sites basic publishing credentials policies. Cortex uses this for comprehensive asset discovery and security posture assessment across the Azure environment. |
| Microsoft.Web/sites/config/appsettings/read | Read Web sites app settings. Cortex uses this for comprehensive asset discovery and security posture assessment across the Azure environment. |
| Microsoft.Web/sites/config/list/action | Execute action to list Web site configuration. This permission evaluates TLS, HTTPS enforcement, and whether connection strings contain hardcoded secrets for security assessment and operational visibility across the Azure environment. The permission returns App Service config including connection strings. While connection strings may contain database credentials, Cortex assesses the connection strings for compliance and does not connect to the referenced databases. |
| Microsoft.Web/sites/config/read | Read the configuration settings of Azure App Service Web apps. Cortex uses this to assess web application security settings such as HTTP version and HTTPS enforcement as part of CSPM posture evaluation. This read-only access does not modify any App Service configurations. |
| Microsoft.Web/sites/functions/read | Read Web sites functions. Cortex uses this for comprehensive asset discovery and security posture assessment across the Azure environment. |
| Microsoft.Web/sites/privateEndpointConnections/read | Read Web sites private endpoint connections. Cortex uses this for comprehensive asset discovery and security posture assessment across the Azure environment. |
| Microsoft.Web/sites/read | Read the status and properties of Azure App Service Web apps. Cortex uses this to inventory web applications and assess their security configurations such as HTTPS enforcement as part of CSPM posture evaluation. This read-only access does not modify any App Service resources. |
| Microsoft.Web/sites/slots/read | Read Web sites slots. Cortex uses this for comprehensive asset discovery and security posture assessment across the Azure environment. |
| Microsoft.Web/staticSites/read | Read Web static sites. Cortex uses this for comprehensive asset discovery and security posture assessment across the Azure environment. |
| Microsoft.Workloads/monitors/read | Read Workloads monitors. Cortex uses this for comprehensive asset discovery and security posture assessment across the Azure environment.This permission is supported in commercial cloud environments only and is not available in government cloud regions. |
Reader Role: cortex-reader-{suffix}
This custom Azure RBAC role grants read-only access to Azure resource metadata via the */read action. No resource is ever created, modified, or deleted.
| Created when | All onboarding scopes. |
| Assigned to | Cortex Service Principal. |
| Assignment scope | Matches the onboarded scope. |
| Used by | Cortex asset discovery to read metadata across the Azure resource types Cortex scans. |
cortex-reader-{suffix} permissions:
| Permission | Description |
|---|---|
| */read | Provide read-only access to get metadata of all managed data assets. Cortex uses this broad read permission to inventory and assess the security posture of all Azure resources without making any modifications. |
Microsoft Graph Application (GRAPH_API)
Cortex cloud infrastructure entitlement management (CIEM) and Entra ID posture assessment use these permissions to read the customer's Entra ID directory, such as users, groups, service principals, role assignments, and conditional access policies, to map who has access to the tenant and how that access is configured. This identity-plane data lives in Entra ID and is reachable only through Microsoft Graph. These permissions are only assigned on Tenant onboarding scope or Entra-only onboarding scope.
| Permission | Description |
|---|---|
| Application.Read.All | Read application registrations, service principals, and their app-role assignments from Microsoft Entra ID. Cortex uses this permission to obtain the application-identity surface that discovery and CIEM need to build the identity graph. |
| AuditLog.Read.All | Read audit log entries from Microsoft Entra ID. Cortex uses this permission to monitor directory changes and assess identity security posture. |
| Directory.Read.All | Read directory data including users, groups, and applications from Microsoft Entra ID. Cortex uses this permission to inventory directory objects and assess identity security configurations. |
| Domain.Read.All | Read all domain properties in Entra ID. Cortex uses this to assess domain configurations as part of identity security posture management. |
| EntitlementManagement.Read.All | Read access packages and entitlement management configurations from Microsoft Entra ID. Cortex uses this permission to assess identity governance policies and access lifecycle management. |
| GroupMember.Read.All | Read group membership details from Microsoft Entra ID. Cortex uses this permission to evaluate group membership configurations for identity security assessment. |
| Group.Read.All | Read group properties and memberships from Microsoft Entra ID. Cortex uses this permission to inventory security groups and assess group-based access control configurations. |
| IdentityProvider.Read.All | Read identity provider configurations in Entra ID. Cortex uses this to assess federated identity provider settings as part of identity security posture management. |
| Organization.Read.All | Read organization properties and settings from Microsoft Entra ID. Cortex uses this permission to assess tenant-level security configurations and organizational policies. |
| Policy.Read.All | Read organization policies including conditional access from Microsoft Entra ID. Cortex uses this permission to evaluate conditional access, authentication, and authorization policies. |
| Policy.Read.AuthenticationMethod | Read authentication method policies in Entra ID. Cortex uses this to assess the authentication methods policy configuration for security posture evaluation. |
| RoleAssignmentSchedule.Read.Directory | Read role assignment schedules in Entra ID. Cortex uses this to inventory Privileged Identity Management (PIM) role assignments and assess privileged access configurations as part of identity security posture management.This permission is supported in commercial cloud environments only and is not available in government cloud regions. |
| RoleManagement.Read.All | Read role definitions and role assignments from Microsoft Entra ID. Cortex uses this permission to assess privileged access configurations and role-based access control posture. |
| User.Read.All | Read user profiles and properties from Microsoft Entra ID. Cortex uses this permission to inventory user accounts and assess identity security configurations. |
Log Collection
Conditional (opt-in). Deployed only when the customer enables Audit Logs. Routes Azure Activity Log (and at Tenant scope, Entra ID logs) to a Cortex-owned Event Hub, read by a dedicated Audit UAMI.
Role: Azure Event Hubs Data Receiver (Built-in role)
Microsoft built-in Azure RBAC role granting receive access to messages in an Event Hub. Permissions are maintained and documented by Microsoft, and are not listed here.
| Created when | Audit Logs capability enabled. |
| Assigned to | Customer-owned Audit UAMI cortexAuditUAMI-{suffix}. |
| Assignment scope | The Cortex-created Event Hub Namespace CortexEventHubNamespace-{suffix} only. No access to any customer-owned Event Hub. |
| Used by | Cortex, to read Activity Log (and at Tenant scope, Entra ID log) events from the Cortex-owned Event Hub. Cortex authenticates as the Audit UAMI via Workload Identity Federation. |
Role: Storage Blob Data Contributor (Built-in role)
Microsoft built-in Azure RBAC role granting read, write, and delete access to blob data in a Storage Account. Permissions are maintained and documented by Microsoft, and are not listed here.
| Created when | Audit Logs capability enabled. |
| Assigned to | Customer-owned Audit UAMI cortexAuditUAMI-{suffix}. |
| Assignment scope | The Cortex-created Storage Account cxa{suffix} only. No access to any customer-owned Storage Account. |
| Used by | Cortex, to write Event Hub processing checkpoints (offsets and sequence numbers, no customer data). |
Agentless Disk Scanning (ADS)
The Agentless Disk Scanning (ADS) permissions enable Cortex to securely analyze virtual machine workloads and storage resources without installing software agents. These permissions grant the necessary access to create temporary snapshots, manage disk copies, and inventory VM metadata, allowing Cortex to perform deep vulnerability scanning while keeping production environments completely untouched.
ADS access is split into three roles so that the permissions which create and destroy resources are confined to a resource group Cortex owns, while the permissions that reach across your estate are kept as narrow as possible.
- The
ADSScannedAssetsRoleandADSOutpostRoleroles apply across the onboarded subscription or management group, and neither can delete anything. - The
ADSEphemeralResourcesRolerole holds every permission that writes or deletes a disk, snapshot, or gallery image, and is confined to the Cortex-created resource group. Because that role is scoped to that resource group alone, Cortex cannot delete a disk, snapshot, or image anywhere else in your environment.
ADS Scanned Assets Role: ADSScannedAssetsRole-{suffix}
Custom Azure RBAC role granting read access to compute inventory, the ability to create snapshots, and time-limited read access to the contents of a managed disk.
| Created when | ADS capability enabled. |
|---|---|
| Assigned to | Cortex Service Principal. |
| Assignment scope | Matches the onboarded scope. |
| Used by | <p>Cortex ADS during discovery and at the start of a scan run, to: </p><ul><li>Identify which virtual machines and images are in scope.</li><li>Create a snapshot of a target disk.</li><li>Obtain temporary read access to that disk's contents.</li></ul> |
ADSScannedAssetsRole-{suffix} permissions:
| Permission | Description |
|---|---|
| Microsoft.Compute/virtualMachines/read | Enable reading VM configurations. Cortex uses this to inventory virtual machines and identify those requiring security scanning. |
| Microsoft.Compute/images/read | Read managed images in order to create disks for image scanning. Cortex uses this to inventory managed VM images and identify those requiring security assessment and vulnerability scanning as part of agentless disk scanning operations. |
| Microsoft.Compute/galleries/images/read | Read gallery images in order to create disks for image scanning. Cortex uses this to inventory VM images and identify those requiring security assessment and vulnerability scanning as part of agentless disk scanning operations. |
| Microsoft.Compute/galleries/images/versions/read | Read gallery image version details within Cortex-managed resource groups. Cortex uses this to track the status of temporary image versions created during image scanning operations. |
| Microsoft.Compute/snapshots/write | Create a snapshot of a target disk. Cortex uses this to make a temporary, read-only copy of your disk so the scanner can analyze the copy securely without touching your live environment. Snapshots are always written into the Cortex-created resource group. |
| Microsoft.Compute/disks/beginGetAccess/action | Issue a time-limited SAS URL that begins to grant read access to the contents of a managed disk. This is how the scanner reads disk data to assess it for vulnerabilities, so it is a data-access grant rather than a metadata read. The access is time-limited and read-only, and Cortex can delete or modify resources only within its own resource group. |
ADS Outpost Role: ADSOutpostRole-{suffix}
Custom Azure RBAC role granting read access to snapshots.
Note: With Terraform subscription onboarding, this role is created as ADSOutpost-{suffix}, without "Role" in the name. Terraform management group onboarding and both ARM onboarding paths create it as ADSOutpostRole-{suffix}.
| Created when | ADS capability enabled. |
|---|---|
| Assigned to | Cortex Service Principal. |
| Assignment scope | Matches the onboarded scope. |
| Used by | Cortex ADS, to read snapshot metadata during a scan run. |
ADSOutpostRole-{suffix} permissions:
| Permission | Description |
|---|---|
| Microsoft.Compute/snapshots/read | Read snapshot metadata across the tenant to manage ADS scan snapshot lifecycle. |
ADS Ephemeral Resources Role: ADSEphemeralResourcesRole-{suffix}
Custom Azure RBAC role granting read, write, and delete access to the temporary disks, snapshots, and gallery images that a scan creates and removes.
| Field | Value |
|---|---|
| Created when | ADS capability enabled. |
| Assigned to | Cortex Service Principal. |
| Assignment scope | The Cortex-created resource group only. This is narrower than the onboarded scope. |
| Used by | <p>Cortex ADS during a scan run, to:</p><p></p><ul><li>Copy a snapshot into a gallery image version. </li><li>Materialize that image as a temporary disk which is attached to a scanner instance at launch.</li><li>Delete the temporary disk, snapshot, and image version on completion.</li></ul> |
ADSEphemeralResourcesRole-{suffix} permissions:
| Permission | Description |
|---|---|
| Microsoft.Compute/disks/read | Retrieve disk metadata. This is used to identify disk properties and states, such as detecting dangling disks. It ensures accurate inventory and assessment of storage resources within the environment. |
| Microsoft.Compute/disks/write | Create the temporary disk that a scanner instance reads during a scan. This permission is essential for dynamic scanning and analysis without affecting the live environment. It allows the creation of a temporary disk copy to be analyzed securely by the scanner. |
| Microsoft.Compute/disks/delete | Delete disks after scanning has finished. This action is critical for remediation and resource hygiene, preventing data exfiltration and reducing the attack surface. It ensures that temporary disks used during analysis do not remain as dangling resources. |
| Microsoft.Compute/snapshots/delete | Delete snapshots after scanning has finished. This action is critical for remediation and resource hygiene, preventing data exfiltration and reducing the attack surface. It ensures that temporary snapshots used during analysis do not remain as dangling resources. |
| Microsoft.Compute/galleries/images/write | Create temporary gallery image versions within Cortex-managed resource groups. Cortex uses this during legacy image scanning to create temporary image versions that facilitate the scanning process. |
| Microsoft.Compute/galleries/images/delete | Delete temporary gallery images within Cortex-managed resource groups. Cortex uses this to clean up temporary gallery images created during legacy image scanning, ensuring no stale resources remain after analysis is complete. |
| Microsoft.Compute/galleries/images/versions/write | Create temporary gallery image versions within Cortex-managed resource groups. Cortex uses this during legacy image scanning to create temporary image versions that facilitate the scanning process. |
| Microsoft.Compute/galleries/images/versions/delete | Delete temporary gallery image versions after legacy image scanning completes. Cortex uses this to clean up temporary image versions created during the scanning process, ensuring no orphaned resources remain in Cortex-managed resource groups. |
Serverless Scan
Conditional (opt-in). Deployed only when serverless scanning is enabled. Retrieves Function App / Web App publish profiles to download function code for scanning.
Serverless Scanning Role: serverlessScanningRole-{suffix}
Custom Azure RBAC role granting read access to App Service and Function App configuration, and the ability to retrieve the publish profile.
| Created when | Serverless Scanning capability enabled. |
| Assigned to | Cortex Service Principal. |
| Assignment scope | Matches the onboarded scope. |
| Used by | Cortex serverless scanner, on each scan cycle, to retrieve Function App and Web App code for analysis. |
serverlessScanningRole-{suffix} permissions:
| Permission | Description |
|---|---|
| Microsoft.Web/sites/config/list/action | List the non-public App Service / Function App configuration values, including app settings and connection strings. Cortex uses this to identify the function's runtime, handler, and referenced packages so it can correctly pull and scan the deployment artifact. |
| Microsoft.Web/sites/publishxml/action | Retrieve the App Service / Function App publishing profile (the .publishsettings XML containing deployment credentials and Kudu/SCM endpoints). Cortex uses these credentials only to download the function's deployed code package for serverless vulnerability scanning, and never modifies the site or its configuration. |
| Microsoft.Web/sites/read | Read App Service and Function App resource metadata such as name, resource group, runtime stack, and SKU. Cortex uses this to discover the inventory of serverless workloads that should be scanned and to correlate scan findings back to each function. |
Registry Scan
Conditional (opt-in). This capability is deployed only when Registry Scanning is enabled. This capability adds container registry pull/read for image scanning. If the Private Registry sub-flow is enabled, the capability also includes a private-endpoint-approval permissions.
Registry Scanning Role: registryScanningRole-{suffix}
Custom Azure RBAC role granting pull access to Azure Container Registry images and read access to registry metadata. Read-only on registry data plane.
| Created when | Registry Scanning capability enabled. |
| Assigned to | Cortex Service Principal. |
| Assignment scope | Subscription. |
| Used by | Cortex container-image scanner, on each scan cycle, to fetch images for analysis. |
registryScanningRole-{suffix} permissions:
| Permission | Description |
|---|---|
| Microsoft.ContainerRegistry/registries/pull/read | Read/pull from container registries. Cortex uses this for comprehensive asset discovery and security posture assessment across the Azure environment. |
| Microsoft.ContainerRegistry/registries/read | Read the configuration and properties of Azure Container Registry (ACR) instances. Cortex uses this to assess container registry security settings such as export configurations as part of automation workflows. This read-only access does not modify any registry resources. |
Private Registry UAMI Role: azurePrivateRegistryRole-{suffix}
Custom Azure RBAC role granting permission to approve private endpoint connections to Azure Container Registry. Used to enable Cortex to reach customer registries that have public network access disabled.
| Created when | Both private registry connection and registry scanning are active. |
| Assigned to | Cortex Service Principal. |
| Assignment scope | Subscription. |
| Used by | Cortex, to approve private endpoint connections so it can pull images from registries that have public access disabled. |
azurePrivateRegistryRole-{suffix} permissions:
| Permission | Description |
|---|---|
| Microsoft.ContainerRegistry/registries/PrivateEndpointConnectionsApproval/action | Approve private endpoint connections to container registries. Cortex uses this permission to enable private connectivity for registry scanning, invoked only when a security policy violation is detected. |
Data Security Posture Management (DSPM)
Conditional (opt-in). Deployed only when Data Security Posture Management is enabled. This capability assesses how customer data is stored, configured, and protected by reading data-store metadata, sampling data content for classification, and inspecting encryption and network configuration.
DSPM Resource Group Connector Role: dspmConnectorRGRole-{suffix}
Custom Azure RBAC role granting permission to manage scanning infrastructure inside the Cortex-created resource group: virtual networks, route tables, network security groups, SQL servers, SQL databases, and SQL managed instances. All write and delete actions are scoped to the Cortex resource group and cannot affect customer-owned resources outside of it.
| Created when | DSPM capability enabled. |
| Assigned to | Cortex Service Principal. |
| Assignment scope | The Cortex-created resource group. |
| Used by | Cortex DSPM scanner to provision and tear down the network and SQL infrastructure used for the clone-scan workflow inside the Cortex resource group. |
dspmConnectorRGRole-{suffix} permissions:
| Permission | Description |
|---|---|
| Microsoft.Network/networkSecurityGroups/delete | Delete network security groups within Cortex-managed resource groups. Cortex uses this to clean up temporary network security configurations after data classification operations are complete, ensuring no stale security resources remain. |
| Microsoft.Network/networkSecurityGroups/join/action | Associate network security groups with subnets or network interfaces within Cortex-managed resource groups. Cortex uses this to apply network access controls to scanning infrastructure, ensuring secure and isolated communication for data classification operations. |
| Microsoft.Network/networkSecurityGroups/securityRules/delete | Delete a Network Security Group (NSG) rule to stop overly permissive outbound traffic. Cortex uses this to remediate issues detected by the "Azure Network Security Group with overly permissive outbound rule" rule. This automated remediation tightens network security by removing rules that allow excessive access. Required for command: azure-nsg-security-rule-delete. |
| Microsoft.Network/networkSecurityGroups/securityRules/write | Modify or creates Network Security Group (NSG) rules to stop overly permissive outbound traffic. Cortex uses this to remediate issues detected by the "Azure Network Security Group with overly permissive outbound rule" rule. This automated remediation restricts network access to only what is necessary. Required for command: azure-nsg-security-rule-create. |
| Microsoft.Network/networkSecurityGroups/write | Create or updates network security groups within Cortex-managed resource groups. Cortex uses this to configure network access controls for scanning infrastructure, ensuring that only authorized traffic flows between scanning components. |
| Microsoft.Network/routeTables/delete | Delete route tables within Cortex-managed resource groups. Cortex uses this to clean up temporary routing configurations after data classification operations are complete, ensuring no stale network resources remain. |
| Microsoft.Network/routeTables/join/action | Associate route tables with subnets within Cortex-managed resource groups. Cortex uses this to apply routing configurations to scanning network segments, ensuring proper traffic management for data classification operations. |
| Microsoft.Network/routeTables/write | Create or updates route tables within Cortex-managed resource groups. Cortex uses this to configure network routing for scanning infrastructure, ensuring proper traffic flow between scanning components and database resources. |
| Microsoft.Network/virtualNetworks/delete | Delete virtual networks within Cortex-managed resource groups. Cortex uses this to clean up temporary network infrastructure after data classification operations are complete, ensuring no stale network resources remain in the environment. |
| Microsoft.Network/virtualNetworks/join/action | Associate virtual networks with subnets within Cortex-managed resource groups. Cortex uses this to establish network connectivity for scanning infrastructure used in data classification operations. |
| Microsoft.Network/virtualNetworks/subnets/delete | Delete virtual network subnets within Cortex-managed resource groups. Cortex uses this to clean up temporary network infrastructure after data classification operations are complete, ensuring no stale network resources remain. |
| Microsoft.Network/virtualNetworks/subnets/join/action | Associate subnets with resources within Cortex-managed resource groups. Cortex uses this to connect scanning VMs and database resources to the appropriate network segments for secure data classification operations. |
| Microsoft.Network/virtualNetworks/subnets/write | Create or updates subnets within Cortex-managed virtual networks. Cortex uses this to configure network segmentation for scanning infrastructure, ensuring secure and isolated communication between scanning components. |
| Microsoft.Network/virtualNetworks/write | Create or updates virtual networks within Cortex-managed resource groups. Cortex uses this to provision network infrastructure required for secure connectivity between scanning VMs and temporary database resources used for data classification. |
| Microsoft.Sql/managedInstances/* | Perform administrative actions on Azure SQL Managed Instances within Cortex-managed resource groups, including creation, configuration, and data management. Cortex uses this to provision and manage temporary SQL Managed Instance infrastructure for data classification of managed instance databases. |
| Microsoft.Sql/servers/databases/delete | Delete Palo Alto Networks' Azure SQL server databases that are no longer needed. Cortex uses this to clean up temporary database copies after data classification operations are complete, ensuring no stale data assets remain in the environment. |
| Microsoft.Sql/servers/databases/read | Read SQL server databases. Cortex uses this for comprehensive asset discovery and security posture assessment across the Azure environment. |
| Microsoft.Sql/servers/databases/resume/action | Resume paused Azure SQL databases within Cortex-managed resource groups. Cortex uses this to manage the lifecycle of temporary database copies used for data classification, ensuring databases are available when scanning operations need to proceed. |
| Microsoft.Sql/servers/databases/write | Copy and manages SQL databases within Palo Alto Networks' Azure SQL servers. Cortex uses this to create temporary database copies for data classification and sensitive data discovery, enabling scanning without impacting production databases. |
| Microsoft.Sql/servers/delete | Delete Palo Alto Networks' Azure SQL servers that are no longer needed. Cortex uses this to clean up temporary SQL server infrastructure after data classification operations are complete, ensuring no stale resources remain in the environment. |
| Microsoft.Sql/servers/PrivateEndpointConnectionsApproval/action | Approve private endpoint connections to Palo Alto Networks' Azure SQL servers. Cortex uses this to establish secure, private connectivity between scanning infrastructure and temporary SQL servers, ensuring data classification operations occur over private network paths. |
| Microsoft.Sql/servers/virtualNetworkRules/write | Configure virtual network rules on Palo Alto Networks' Azure SQL servers to enable network accessibility from scanning VMs. Cortex uses this to establish secure network connectivity between scanning infrastructure and temporary SQL servers used for data classification. |
| Microsoft.Sql/servers/write | Create and manages Palo Alto Networks' Azure SQL servers within Cortex-managed resource groups. Cortex uses this to provision temporary SQL server infrastructure required for data classification operations, enabling secure scanning of customer database content. |
| */read | Provide read-only access to get metadata of all managed data assets. Cortex uses this broad read permission to inventory and assess the security posture of all Azure resources without making any modifications. |
DSPM Connector Role: dspmConnectorRole-{suffix}
Custom Azure RBAC role granting permission to approve storage account private endpoint connections and read storage blob and file share data. Required for the DSPM clone-scan workflow which clones customer SQL databases into the Cortex resource group for offline scanning.
| Created when | DSPM capability enabled. |
| Assigned to | Cortex Service Principal. |
| Assignment scope | Subscription. |
| Used by | Cortex DSPM scanner to set up the clone-scan workflow, approve private endpoints, and read storage data. |
dspmConnectorRole-{suffix} permissions:
| Permission | Description |
|---|---|
| Microsoft.Sql/managedInstances/databases/write | Configure SQL Managed Instance database settings. Cortex uses this permission to enable data classification and sensitivity labeling for data security posture management. |
| Microsoft.Sql/servers/databases/write | Copy and manages SQL databases within Palo Alto Networks' Azure SQL servers. Cortex uses this to create temporary database copies for data classification and sensitive data discovery, enabling scanning without impacting production databases. |
| Microsoft.Storage/storageAccounts/blobServices/containers/blobs/read | Read blob data to perform DSPM data classification and sensitive data discovery scanning |
| Microsoft.Storage/storageAccounts/fileServices/fileShares/files/read | Read file share data to perform DSPM data classification and sensitive data discovery scanning |
| Microsoft.Storage/storageAccounts/PrivateEndpointConnectionsApproval/action | Approve private endpoint connections to storage accounts located in private networks. Cortex uses this to establish secure, private connectivity for DSPM scanning operations, ensuring that data classification can be performed on storage accounts that are not publicly accessible. |
DSPM Read Role: dspmRole-{suffix}
Custom Azure RBAC role granting read access to customer data-store metadata and the ability to sample data content from supported data services for security posture assessment.
| Created when | DSPM capability enabled. |
| Assigned to | Cortex Service Principal. |
| Assignment scope | Subscription. |
| Used by | Cortex DSPM scanner, to discover customer data assets, retrieve the keys needed to scan them, and read the data for classification. |
dspmRole-{suffix} permissions:
| Permission | Description |
|---|---|
| Microsoft.CognitiveServices/accounts/AIServices/agents/read | Read AI Services agent configurations to inventory AI agents for DSPM posture assessment |
| Microsoft.CognitiveServices/accounts/AIServices/connections/read | Read AI Services connections to map data flows and integration points for DSPM |
| Microsoft.CognitiveServices/accounts/AIServices/fine_tuning/read | Read AI Services fine-tuning data to discover and classify training data for DSPM |
| Microsoft.CognitiveServices/accounts/OpenAI/files/read | Read OpenAI files to discover and classify data within Azure OpenAI deployments for DSPM |
| Microsoft.CognitiveServices/accounts/OpenAI/fine-tunes/read | Read OpenAI fine-tuning data to discover and classify training data for DSPM |
| Microsoft.CognitiveServices/accounts/OpenAI/models/read | Read OpenAI model metadata to inventory AI models for DSPM posture assessment |
| Microsoft.DocumentDB/databaseAccounts/readOnlyKeys/action | Read Cosmos DB read-only keys to authenticate data access for DSPM scanning of document databases |
| Microsoft.Storage/storageAccounts/blobServices/containers/blobs/read | Read blob data to perform DSPM data classification and sensitive data discovery scanning |
| Microsoft.Storage/storageAccounts/blobServices/containers/read | Read blob container metadata to discover and inventory blob data stores for DSPM scanning |
| Microsoft.Storage/storageAccounts/fileServices/fileShares/files/read | Read file share data to perform DSPM data classification and sensitive data discovery scanning |
| Microsoft.Storage/storageAccounts/fileServices/shares/read | Read file share metadata to discover and inventory file share data stores for DSPM scanning |
| Microsoft.Storage/storageAccounts/read | Read storage account properties to discover and inventory data stores for DSPM scanning |
DSPM Read Role - Outpost Scan Mode: dspmRole-{suffix} (outpost variant)
Custom Azure RBAC role granting read access to customer data-store metadata on outposts and the ability to sample data content from supported data services for security posture assessment. The outpost has the targeted read-only and authentication permissions required to securely discover, index, and classify sensitive data entirely from within your environment.
| Created when | DSPM capability enabled for outposts. |
| Assigned to | Cortex Service Principal. |
| Assignment scope | Subscription. |
| Used by | Cortex DSPM outpost scanner, to discover customer data assets, retrieve the keys needed to scan them, and read the data for classification. |
dspmRole-{suffix} (outpost variant) permissions:
| Permission | Description |
|---|---|
| Microsoft.CognitiveServices/accounts/AIServices/agents/read | Read AI Services agent configurations to inventory AI agents for DSPM posture assessment |
| Microsoft.CognitiveServices/accounts/AIServices/connections/read | Read AI Services connections to map data flows and integration points for DSPM |
| Microsoft.CognitiveServices/accounts/AIServices/fine_tuning/read | Read AI Services fine-tuning data to discover and classify training data for DSPM |
| Microsoft.CognitiveServices/accounts/OpenAI/files/read | Read OpenAI files to discover and classify data within Azure OpenAI deployments for DSPM |
| Microsoft.CognitiveServices/accounts/OpenAI/fine-tunes/read | Read OpenAI fine-tuning data to discover and classify training data for DSPM |
| Microsoft.CognitiveServices/accounts/OpenAI/models/read | Read OpenAI model metadata to inventory AI models for DSPM posture assessment |
| Microsoft.DocumentDB/databaseAccounts/readOnlyKeys/action | Read Cosmos DB read-only keys to authenticate data access for DSPM scanning of document databases |
| Microsoft.Search/searchServices/dataSources/read | Read Azure AI Search data source configurations to map data lineage for DSPM |
| Microsoft.Search/searchServices/indexers/read | Read Azure AI Search indexer configurations to understand data ingestion paths for DSPM |
| Microsoft.Search/searchServices/indexes/documents/read | Read Azure AI Search index documents to classify and discover sensitive data for DSPM |
| Microsoft.Search/searchServices/indexes/read | Read Azure AI Search indexes to discover and classify data within search service indexes |
| Microsoft.Search/searchServices/listAdminKeys/action | List admin keys for Azure AI Search to authenticate data access for DSPM scanning |
| Microsoft.Search/searchServices/listQueryKeys/action | List query keys for Azure AI Search to authenticate read-only data access for DSPM scanning |
| Microsoft.Search/searchServices/PrivateEndpointConnectionsApproval/action | Approve private endpoint connections to Azure AI Search for secure DSPM scanning |
| Microsoft.Search/searchServices/read | Read Azure AI Search service properties to discover search services for DSPM scanning |
| Microsoft.Storage/storageAccounts/blobServices/containers/blobs/read | Read blob data to perform DSPM data classification and sensitive data discovery scanning |
| Microsoft.Storage/storageAccounts/blobServices/containers/read | Read blob container metadata to discover and inventory blob data stores for DSPM scanning |
| Microsoft.Storage/storageAccounts/fileServices/fileShares/files/read | Read file share data to perform DSPM data classification and sensitive data discovery scanning |
| Microsoft.Storage/storageAccounts/fileServices/shares/read | Read file share metadata to discover and inventory file share data stores for DSPM scanning |
| Microsoft.Storage/storageAccounts/read | Read storage account properties to discover and inventory data stores for DSPM scanning |
Role: Key Vault Crypto Service Encryption User (Built-in)
Microsoft built-in Azure RBAC role granting permission to wrap and unwrap encryption keys via Azure Key Vault. Cortex assigns this role whenever DSPM is enabled (in both Cloud Scan and Outpost deployment modes) and uses it to scan SQL servers and databases protected by customer-managed Transparent Data Encryption (TDE) keys.
| Created when | DSPM capability is enabled. |
| Assigned to | The customer's Outpost Managed Identity. Not assigned to the Cortex Service Principal. |
| Assignment scope | Matches the onboarded scope. |
| Used by | The Cortex Outpost scanner to decrypt customer SQL data protected by customer-managed TDE keys, so DSPM can read and classify that data. |
Automations
Conditional (opt-in). Allows Cortex to automatically remediate misconfigurations on customer Azure resources by modifying networking, storage, compute, identity-protection, and database resource configurations.
Note
Unified Cortex platform cloud content packs require a specific set of automation permissions to enable full integration with your cloud environment. Before configuring access for these packs, review the automation permission scope guidelines.
Automation Role: automationRole-{suffix}
Custom Azure RBAC role that grants the Cortex Service Principal write and delete access on customer resources for automated remediation. Cortex uses this role to apply fixes to misconfigurations detected by CSPM across networking, storage, compute, identity protection, and database resource types.
| Created when | Automation capability enabled. |
| Assigned to | Cortex Service Principal. |
| Assignment scope | Subscription. |
| Used by | Cortex Automation engine to execute remediation workflows on customer resources when CSPM detects a misconfiguration the customer has authorized Cortex to fix automatically. |
automationRole-{suffix} permissions:
| Permission | Description |
|---|---|
| Microsoft.Authorization/policyAssignments/read | Read the configuration of Microsoft Defender for Cloud policy assignments. Cortex uses this to assess the current compliance posture and identify policy gaps that may require automated remediation. This read-only access supports security monitoring without modifying any policy configurations. |
| Microsoft.Authorization/policyAssignments/write | Apply Microsoft Defender for Cloud policy assignments to enable security configurations monitoring. Cortex uses this to remediate issues detected by the "Azure Microsoft Defender for Cloud security configurations monitoring is set to disabled" rule. This automated remediation ensures that security monitoring remains active across the environment. |
| Microsoft.Compute/disks/read | Retrieve disk metadata. This is used to identify disk properties and states, such as detecting dangling disks. It ensures accurate inventory and assessment of storage resources within the environment. |
| Microsoft.Compute/disks/write | Create a disk from a snapshot before attaching it to a workload. This permission is essential for dynamic scanning and analysis without affecting the live environment. It allows the creation of a temporary disk copy to be analyzed securely by the scanner. |
| Microsoft.Compute/virtualMachines/powerOff/action | Power off an existing Azure Virtual Machine to change its state from Running to Stopped or Deallocated. Cortex uses this for automated incident response such as isolating compromised virtual machines and to stop incurring compute charges without deleting the resource. Required for command: azure-vm-instance-power-off. |
| Microsoft.Compute/virtualMachines/read | Enable reading VM configurations. Cortex uses this to inventory virtual machines and identify those requiring security scanning. |
| Microsoft.Compute/virtualMachines/start/action | Power on an existing Azure Virtual Machine to change its state from Stopped to Running. Cortex uses this for automation workflows involving VM lifecycle management and enabling authorized operators to restore service availability. Required for command: azure-vm-instance-start. |
| Microsoft.Consumption/budgets/read | Read the configuration and current status of established Azure budgets. Cortex uses this for cost monitoring and alerting capabilities, helping maintain visibility into cloud spending patterns. This read-only access does not modify any budget configurations. |
| Microsoft.Consumption/usageDetails/read | Read detailed usage information for Azure resources including costs and quantity consumed. Cortex uses this for cloud cost analysis and optimization recommendations, providing visibility into resource consumption patterns. This read-only access supports financial governance without modifying any usage data. |
| Microsoft.ContainerRegistry/registries/read | Read the configuration and properties of Azure Container Registry (ACR) instances. Cortex uses this to assess container registry security settings such as export configurations as part of automation workflows. This read-only access does not modify any registry resources. |
| Microsoft.ContainerRegistry/registries/write | Update the Azure Container Registry (ACR) configuration to disable exports. Cortex uses this to remediate issues detected by the "Azure Container Registry with exports enabled" rule. This automated remediation helps prevent unauthorized data exfiltration through container registry exports. |
| Microsoft.CostManagement/forecast/read | Read predictive forecasts and historical trends for future Azure costs. Cortex uses this to provide predictive cost insights for cloud management, helping organizations plan budgets and identify potential cost anomalies. This read-only access does not modify any cost management data. |
| Microsoft.DBforMySQL/flexibleServers/configurations/read | Read the configuration settings of Azure MySQL flexible servers. Cortex uses this to assess database security settings such as SSL enforcement configurations as part of automation workflows. This read-only access does not modify any database configurations. |
| Microsoft.DBforMySQL/flexibleServers/configurations/write | Update the Azure MySQL flexible server configuration to enforce SSL connections. Cortex uses this to remediate issues detected by the "Azure MySQL database flexible server SSL enforcement is disabled" rule. This automated remediation ensures encrypted database connections, protecting data in transit. |
| Microsoft.DBforPostgreSQL/servers/configurations/read | Read the configuration settings of Azure PostgreSQL servers. Cortex uses this to assess database security settings such as connection throttling parameters as part of automation workflows. This read-only access does not modify any database configurations. |
| Microsoft.DBforPostgreSQL/servers/configurations/write | Update Azure PostgreSQL server configurations to enable the connection throttling parameter. Cortex uses this to remediate issues detected by the "Azure PostgreSQL database server with connection throttling parameter is disabled" rule. This automated remediation helps protect databases from brute-force attacks and connection flooding. |
| Microsoft.DBforPostgreSQL/servers/read | Read the configuration and properties of Azure PostgreSQL servers. Cortex uses this to inventory databases and assess their security configurations such as SSL connection settings as part of automation workflows. This read-only access does not modify any server resources. |
| Microsoft.DBforPostgreSQL/servers/write | Update the Azure PostgreSQL server configuration to enable the SSL connection feature. Cortex uses this to remediate issues detected by the "Azure PostgreSQL database server with SSL connection disabled" rule. This automated remediation ensures encrypted connections to the database, protecting data in transit. |
| Microsoft.DocumentDB/databaseAccounts/read | Read the configuration and properties of Azure Cosmos DB database accounts. Cortex uses this to assess NoSQL database security settings such as key-based authentication configurations as part of automation workflows. This read-only access does not modify any database resources. |
| Microsoft.DocumentDB/databaseAccounts/write | Modify Azure Cosmos DB accounts to disable key-based metadata write authentication. Cortex uses this to remediate issues detected by the "Azure Cosmos DB key based authentication is enabled" rule. This automated remediation strengthens database security by enforcing Azure Active Directory authentication instead of key-based access. |
| Microsoft.Insights/logProfiles/read | Read the configuration of Azure Activity Log profiles. Cortex uses this to assess audit logging coverage and verify that activity log retention periods meet security requirements. This read-only access does not modify any log profile configurations. |
| Microsoft.Insights/logProfiles/write | Set the Azure Activity Log retention period to 365 days or more. Cortex uses this to remediate issues detected by the "Azure Activity Log retention should not be set to less than 365 days" rule. This automated remediation ensures adequate audit trail retention for compliance and forensic investigation purposes. |
| Microsoft.KeyVault/vaults/read | Read the configuration and properties of Azure Key Vaults. Cortex uses this to assess key management security settings such as recoverability configurations as part of automation workflows. This read-only access does not modify any Key Vault resources. |
| Microsoft.KeyVault/vaults/write | Modify Azure Key Vault configurations to ensure recoverability by enabling soft-delete and purge protection. Cortex uses this to remediate issues detected by the "Azure Key Vault is not recoverable" rule. This automated remediation protects against accidental or malicious deletion of cryptographic keys and secrets. |
| Microsoft.Network/loadBalancers/backendAddressPools/join/action | Join a load balancer backend address pool. Cortex uses this permission to configure network interfaces during automated remediation, invoked only when a security policy violation is detected. |
| Microsoft.Network/networkInterfaces/read | Read the list of Network Security Group (NSG) interfaces and their configurations. Cortex uses this to assess network security settings and identify resources associated with specific NSGs as part of automation workflows. Required for command: azure-nsg-network-interfaces-list. |
| Microsoft.Network/networkInterfaces/write | Create or update network interface configurations. Cortex uses this permission to modify network settings during automated remediation, invoked only when a security policy violation is detected. |
| Microsoft.Network/networkSecurityGroups/join/action | Associate network security groups with subnets or network interfaces within Cortex-managed resource groups. Cortex uses this to apply network access controls to scanning infrastructure, ensuring secure and isolated communication for data classification operations. |
| Microsoft.Network/networkSecurityGroups/read | Read the list and configurations of Network Security Groups (NSGs). Cortex uses this to assess network security posture and identify NSGs that may require remediation. Required for command: azure-nsg-security-groups-list. |
| Microsoft.Network/networkSecurityGroups/securityRules/delete | Delete a Network Security Group (NSG) rule to stop overly permissive outbound traffic. Cortex uses this to remediate issues detected by the "Azure Network Security Group with overly permissive outbound rule" rule. This automated remediation tightens network security by removing rules that allow excessive access. Required for command: azure-nsg-security-rule-delete. |
| Microsoft.Network/networkSecurityGroups/securityRules/read | Read the configuration of Network Security Group (NSG) rules to assess traffic permissions. Cortex uses this to evaluate whether NSG rules are overly permissive and to determine if remediation is needed. Required for command: azure-nsg-security-rule-get. |
| Microsoft.Network/networkSecurityGroups/securityRules/write | Modify or creates Network Security Group (NSG) rules to stop overly permissive outbound traffic. Cortex uses this to remediate issues detected by the "Azure Network Security Group with overly permissive outbound rule" rule. This automated remediation restricts network access to only what is necessary. Required for command: azure-nsg-security-rule-create. |
| Microsoft.Network/networkSecurityGroups/write | Create or updates network security groups within Cortex-managed resource groups. Cortex uses this to configure network access controls for scanning infrastructure, ensuring that only authorized traffic flows between scanning components. |
| Microsoft.Network/publicIPAddresses/join/action | Associate a public IP address with a network resource. Cortex uses this permission to manage public IP associations during automated remediation, invoked only when a security policy violation is detected. |
| Microsoft.Network/publicIPAddresses/read | Read and lists Network Security Group (NSG) and VM public IP addresses and their details. Cortex uses this to identify externally exposed resources and assess their security posture as part of automation workflows. Required for commands: azure-nsg-public-ip-addresses-list and azure-vm-public-ip-details-get. |
| Microsoft.Network/virtualNetworks/subnets/join/action | Associate subnets with resources within Cortex-managed resource groups. Cortex uses this to connect scanning VMs and database resources to the appropriate network segments for secure data classification operations. |
| Microsoft.resources/subscriptions/read | Read the status and details of Azure subscriptions. Cortex uses this to understand the Azure environment structure and enumerate available subscriptions for automation workflows. Required for command: azure-nsg-subscriptions-list. |
| Microsoft.resources/subscriptions/resourceGroups/read | Read the status and details of resource groups within a subscription. Cortex uses this to inventory Azure resources and understand the organizational structure of the environment. Required for command: azure-nsg-resource-group-list. |
| Microsoft.Sql/servers/databases/securityAlertPolicies/read | Read the security alert policy configuration for Azure SQL Databases. Cortex uses this to assess database threat detection configurations and determine whether email notifications for Threat Detection are properly enabled. This read-only access does not modify any security alert policies. |
| Microsoft.Sql/servers/databases/securityAlertPolicies/write | Update the security alert policy for Azure SQL Databases to enable email notifications for Threat Detection. Cortex uses this to remediate issues detected by the "Azure SQL Databases with disabled Email service and co-administrators for Threat Detection" rule. This automated remediation ensures that security alerts are properly communicated to administrators. |
| Microsoft.Sql/servers/databases/transparentDataEncryption/read | Read the Transparent Data Encryption (TDE) status for Azure SQL databases. Cortex uses this to assess database encryption posture and determine whether TDE is properly enabled. This read-only access does not modify any encryption settings. |
| Microsoft.Sql/servers/databases/transparentDataEncryption/write | Enable Transparent Data Encryption (TDE) on Azure SQL databases. Cortex uses this to remediate issues detected by the "Azure SQL database Transparent Data Encryption (TDE) encryption disabled" rule. This automated remediation ensures that data at rest is encrypted, protecting sensitive information stored in the database. |
| Microsoft.Storage/storageAccounts/blobServices/containers/delete | Delete Azure Storage account blob service containers. Cortex uses this for automated cleanup of misconfigured storage containers as part of remediation workflows. Required for command: azure-storage-container-delete. |
| Microsoft.Storage/storageAccounts/blobServices/containers/read | Read blob container metadata to discover and inventory blob data stores for DSPM scanning |
| Microsoft.Storage/storageAccounts/blobServices/containers/setAcl/action | Set or modifies the access control list (ACL) for folders or files within a storage container. Cortex uses this for automated remediation of storage access configurations, ensuring that container permissions align with security best practices. |
| Microsoft.Storage/storageAccounts/blobServices/containers/write | Modify Azure Storage account blob service container configurations. Cortex uses this for automated storage security remediation, enabling updates to container properties and access settings. Required for command: azure-storage-blob-containers-update. |
| Microsoft.Storage/storageAccounts/blobServices/read | Read the configuration of Azure Storage account blob services. Cortex uses this to assess storage security posture, including soft delete settings, as part of automation workflows. Required for command: azure-storage-blob-service-properties-get. |
| Microsoft.Storage/storageAccounts/blobServices/write | Enable soft delete functionality on Azure Storage account blob services. Cortex uses this to remediate issues detected by the "Azure Storage account soft delete is disabled" rule. This automated remediation ensures that deleted blobs can be recovered, protecting against accidental or malicious data loss. |
| Microsoft.Storage/storageAccounts/read | Read storage account properties to discover and inventory data stores for DSPM scanning |
| Microsoft.Storage/storageAccounts/write | Enable access for trusted Microsoft services on Azure Storage Accounts. Cortex uses this to remediate issues detected by the "Azure Storage Account 'Trusted Microsoft Services' access not enabled" rule. This automated remediation ensures that essential Azure services can securely access storage resources. |
| Microsoft.Web/sites/config/read | Read the configuration settings of Azure App Service Web apps. Cortex uses this to assess web application security settings such as HTTP version and HTTPS enforcement as part of automation workflows. This read-only access does not modify any App Service configurations. |
| Microsoft.Web/sites/config/write | Set the HTTP version to 2.0 within the Azure App Service Web app configuration. Cortex uses this to remediate issues detected by the "Azure App Service Web app doesn't use HTTP 2.0" rule. This automated remediation ensures that web applications use the latest HTTP protocol for improved performance and security. |
| Microsoft.Web/sites/read | Read the status and properties of Azure App Service Web apps. Cortex uses this to inventory web applications and assess their security configurations such as HTTPS enforcement as part of automation workflows. This read-only access does not modify any App Service resources. |
| Microsoft.Web/sites/write | Set the HTTPS-only feature for Azure App Service Web apps to enforce redirection from HTTP to HTTPS. Cortex uses this to remediate issues detected by the "Azure App Service Web app doesn't redirect HTTP to HTTPS" rule. This automated remediation ensures that all web traffic is encrypted in transit. Required for command: azure-webapp-update. |
Google Cloud Platform (GCP) provider permissions
When onboarding Google Cloud Platform (GCP), Cortex XSIAM creates an authentication template that requests the permissions needed for monitoring your cloud environment. Permissions are organized by security capability, then by the role that contains them. Each role lists its assignment scope and the specific permissions it grants.
Each role is bound at the scope you configure during onboarding (organization, folder, or project), with the following exceptions:
- The audit-log Pub/Sub publisher and subscriber roles (
roles/pubsub.publisher,roles/pubsub.subscriber) are bound only to the single Pub/Sub topic and subscription Cortex creates in the host project, not at the onboarding scope. - The
roles/iam.serviceAccountTokenCreatorimpersonation grants are bound on individual Cortex service-account resources (one binding per SA, not at the onboarding scope). - For folder (
ACCOUNT_GROUP) onboardings only, theroles/iam.organizationRoleViewerbuilt-in role is bound at the organization level so that Cortex can read organization-level custom-role definitions. - Agentless Disk Scanning permissions are further restricted by an IAM Condition that limits their effect to Compute Engine snapshots and disks whose names start with
cortex-scan-. The condition applies regardless of whether the binding resource itself is at project, folder, or organization level.
The following reference tables are organized by security module, role, and then the list of the CSP permissions being requested as well as their purpose:
- Discovery Engine
- Log Collection
- Agentless Disk Scanning
- Serverless Scan
- Registry Scan
- DSPM
- Automations
- Outpost Scanner
Discovery Engine
These permissions grant read-only access across Google Cloud services, enabling Cortex XSIAM to build a comprehensive inventory of your GCP assets, configurations, and security posture. They are bundled into a single custom role, CortexPlatformCloudViewer, created during onboarding in your Google Cloud environment, together with some Google-managed built-in roles.
Role: CortexPlatformCloudViewer
Each permission in this role applies only to the Google Cloud resource type named in it.
| Permission | Purpose |
|---|---|
| accesscontextmanager.accessLevels.list | List Access Context Manager (GCP ACM) access levels. Cortex uses this permission to inventory access policies and perimeters to assess the security posture of the network boundary. |
| accesscontextmanager.accessPolicies.list | List Access Context Manager (GCP ACM) policies. Cortex uses this permission to retrieve organization-level access policies for security compliance monitoring. |
| accesscontextmanager.servicePerimeters.list | List Access Context Manager (GCP ACM) service perimeters. Cortex uses this permission to map service perimeters and identify potential data exfiltration risks. |
| aiplatform.batchPredictionJobs.list | List AI Platform batch prediction jobs. Cortex uses this permission to inventory AI workloads and monitor for anomalous or unauthorized batch processing activities. |
| aiplatform.nasJobs.list | List AI Platform Neural Architecture Search (NAS) jobs. Cortex uses this permission to discover and audit AI model search jobs within the environment. |
| analyticshub.dataExchanges.list | List Analytics Hub data exchanges. Cortex uses this permission to identify data sharing configurations and assess risks associated with external data exchange. |
| analyticshub.listings.getIamPolicy | Retrieve the IAM policy for Analytics Hub listings. Cortex uses this permission to analyze access controls on data listings and detect overly permissive configurations. |
| analyticshub.listings.list | List Analytics Hub listings. Cortex uses this permission to inventory published data listings and verify their visibility settings. |
| apigateway.apis.list | List API Gateway APIs for asset discovery. |
| apigateway.locations.get | Get API Gateway location information for asset discovery. |
| backupdr.backupPlanAssociations.list | List Backup DR plan associations for asset discovery. |
| backupdr.backupPlans.list | List Backup DR plans for asset discovery. |
| backupdr.backupVaults.list | List Backup DR vaults for asset discovery. |
| baremetalsolution.instances.list | List Bare Metal Solution instances. Cortex uses this permission to discover bare metal compute resources and include them in the comprehensive asset inventory. |
| baremetalsolution.luns.list | List Bare Metal Solution LUNs (Logical Unit Numbers). Cortex uses this permission to inventory storage resources associated with bare metal instances. |
| baremetalsolution.networks.list | List Bare Metal Solution networks. Cortex uses this permission to map the network topology of bare metal environments for security assessment. |
| baremetalsolution.nfsshares.list | List Bare Metal Solution NFS shares. Cortex uses this permission to inventory network file storage and check for insecure configurations. |
| baremetalsolution.volumes.list | List Bare Metal Solution volumes. Cortex uses this permission to discover storage volumes attached to bare metal instances. |
| bigquery.bireservations.get | Retrieve BigQuery BI Engine reservation configurations. Cortex uses this permission to understand capacity allocations for security posture management and data classification. |
| bigquery.dataPolicies.list | List BigQuery data policies for security posture. |
| bigquery.reservations.list | List BigQuery reservations for asset discovery. |
| bigquery.tables.get | Retrieve metadata for BigQuery tables. Cortex uses this permission to inventory data warehouse assets and assess their schema and configuration settings for classification purposes. |
| bigtable.appProfiles.list | List Bigtable app profiles for asset discovery. |
| bigtable.backups.getIamPolicy | Get IAM policy on Bigtable backups for security posture. |
| bigtable.backups.list | List Bigtable backups for asset discovery. |
| bigtable.clusters.list | List Bigtable clusters for asset discovery. |
| bigtable.instances.get | Get Bigtable instance metadata for asset discovery. |
| bigtable.instances.getIamPolicy | Get IAM policy on Bigtable instances for security posture. |
| bigtable.instances.list | List Bigtable instances for asset discovery. |
| clientauthconfig.clients.listWithSecrets | List client authentication configurations with secrets. Cortex uses this permission to inventory OAuth clients and IAP settings, ensuring secure application access. |
| cloudscheduler.jobs.list | List Cloud Scheduler jobs. Cortex uses this permission to discover scheduled tasks and monitor for unauthorized or suspicious automated jobs. |
| cloudsecurityscanner.scans.list | List Cloud Security Scanner scans. Cortex uses this permission to retrieve results from existing security scans and correlate them with other security findings. |
| cloudtasks.queues.list | List Cloud Tasks queues. Cortex uses this permission to inventory task queues and assess the security of asynchronous task execution flows. |
| cloudtasks.tasks.list | List Cloud Tasks for asset discovery. |
| composer.imageversions.list | List Cloud Composer image versions. Cortex uses this permission to check for outdated or vulnerable environment images in managed Airflow instances. |
| compute.reservations.getIamPolicy | Retrieve the IAM policy for Compute Engine reservations. Cortex uses this permission to analyze access controls on reserved compute capacity. |
| connectors.customConnectors.list | List custom connectors for asset discovery. |
| connectors.endpointAttachments.list | List connector endpoint attachments for asset discovery. |
| connectors.locations.list | List connector locations for asset discovery. |
| connectors.managedZones.list | List connector managed zones for asset discovery. |
| connectors.providers.list | List connector providers for asset discovery. |
| datacatalog.catalogs.searchAll | Search all Data Catalog entries for asset discovery. |
| dataflow.jobs.list | List Dataflow jobs for asset discovery. |
| datamigration.connectionprofiles.getIamPolicy | Retrieve the IAM policy for data migration connection profiles. Cortex uses this permission to audit access permissions on database connection credentials. |
| datamigration.connectionprofiles.list | List data migration connection profiles. Cortex uses this permission to inventory database connection settings used in migration workflows. |
| datamigration.conversionworkspaces.getIamPolicy | Retrieve the IAM policy for data migration conversion workspaces. Cortex uses this permission to assess security controls on database schema conversion environments. |
| datamigration.conversionworkspaces.list | List data migration conversion workspaces. Cortex uses this permission to discover active database conversion projects and their associated resources. |
| datamigration.migrationjobs.getIamPolicy | Retrieve the IAM policy for data migration jobs. Cortex uses this permission to ensure that only authorized users can manage critical database migration tasks. |
| datamigration.migrationjobs.list | List data migration jobs. Cortex uses this permission to monitor ongoing database migrations and identify potential security risks during data transfer. |
| datamigration.privateconnections.getIamPolicy | Retrieve the access policy for Database Migration Service private connections. Cortex uses this permission to verify that private connectivity is securely configured. |
| datamigration.privateconnections.list | List data migration private connections. Cortex uses this permission to inventory private network paths established for database migrations. |
| datapipelines.pipelines.list | List Data Pipelines for asset discovery. |
| dataproc.batches.list | List Dataproc batches for asset discovery. |
| dataproc.sessions.list | List Dataproc sessions for asset discovery. |
| dataproc.sessionTemplates.list | List Dataproc session templates for asset discovery. |
| deploymentmanager.deployments.getIamPolicy | Retrieve the IAM policy for Deployment Manager deployments. Cortex uses this permission to analyze access controls on infrastructure-as-code deployments. |
| firebaserules.rulesets.get | Retrieve Firebase security rulesets. Cortex uses this permission to inspect the rules governing access to Firebase data and storage. |
| iam.workforcePools.list | List workforce identity pools. Cortex uses this permission to discover external identity configurations and assess federation security. |
| iam.workloadIdentityPoolProviders.list | List workload identity pool providers. Cortex uses this permission to inventory external identity providers federated with Google Cloud resources. |
| iam.workloadIdentityPools.list | List workload identity pools. Cortex uses this permission to identify and audit configurations for workload identity federation. |
| iap.projects.getSettings | Get IAP project settings for security posture. |
| logging.cmekSettings.get | Retrieve CMEK (Customer-Managed Encryption Key) settings for logging. Cortex uses this permission to verify that logs are encrypted according to compliance requirements. |
| looker.instances.list | List Looker instances for asset discovery. |
| networkservices.meshes.getIamPolicy | Retrieve the IAM policy for service meshes. Cortex uses this permission to audit access controls on application networking infrastructure. |
| notebooks.locations.list | List locations available for Vertex AI Notebooks. Cortex uses this permission to map regional deployments of notebook instances. |
| notebooks.schedules.list | List schedules for Vertex AI Notebooks. Cortex uses this permission to monitor automated execution of notebook environments. |
| osconfig.patchDeployments.list | List OS Config patch deployments for posture assessment. |
| osconfig.projectFeatureSettings.get | Get OS Config project feature settings for posture assessment. |
| pubsub.subscriptions.getIamPolicy | Retrieve the IAM policy for Pub/Sub subscriptions. Cortex uses this permission to analyze access controls on message subscriptions and detect insecure configurations. |
| pubsub.topics.getIamPolicy | Retrieve the IAM policy for Pub/Sub topics. Cortex uses this permission to audit who can publish or manage messaging topics. |
| redis.clusters.list | List Redis clusters for asset discovery. |
| resourcemanager.folders.get | Retrieve metadata for folders. Cortex uses this permission to map the resource hierarchy and understand the organizational structure. |
| resourcemanager.folders.getIamPolicy | Retrieve the IAM policy for folders. Cortex uses this permission to analyze inherited permissions and access controls at the folder level. |
| resourcemanager.organizations.get | Retrieve metadata for the organization. Cortex uses this permission to validate the root of the resource hierarchy and organizational settings. |
| resourcemanager.organizations.getIamPolicy | Retrieve the IAM policy for the organization. Cortex uses this permission to audit organization-wide access controls and detect excessive privileges. |
| resourcemanager.projects.get | Get project metadata for asset inventory. |
| resourcemanager.projects.list | List projects within the organization. Cortex uses this permission to discover all projects in scope for security monitoring and asset inventory. |
| resourcemanager.tagKeys.list | List tag keys. Cortex uses this permission to inventory available tags for resource categorization and policy enforcement. |
| run.jobs.getIamPolicy | Retrieve the IAM policy for Cloud Run jobs. Cortex uses this permission to analyze access controls on serverless jobs and identify security gaps. |
| run.jobs.list | List Cloud Run jobs. Cortex uses this permission to inventory serverless job definitions and monitor their configuration. |
| run.services.list | List Cloud Run services. Cortex uses this permission to discover active serverless services and assess their exposure. |
| servicemanagement.services.bind | Bind managed services for service inventory and posture assessment. |
| servicemanagement.services.getIamPolicy | Get IAM policy on managed services for security posture. |
| serviceusage.services.use | Use Google Cloud services as the API consumer in a project. This permission is required by Google's Service Usage API to make calls to enabled services when the calling identity (a service account) is hosted in a different project than the target project. It does not grant access to any resource data. Access to data is controlled by the individual service-specific permissions listed in this table. |
| storage.buckets.get | Retrieves metadata of a Cloud Storage bucket. Cortex uses this permission to analyze bucket configurations, such as encryption and logging settings. |
| storage.buckets.getIamPolicy | Retrieves the IAM policy of a Cloud Storage bucket. Cortex uses this permission to assess bucket access controls and detect public or overly permissive settings. |
| storage.buckets.list | Lists Cloud Storage buckets. Cortex uses this permission to discover all storage containers in the project for inventory and security monitoring. |
| storage.buckets.listEffectiveTags | List effective tags on Cloud Storage buckets. Cortex uses this permission to verify tag inheritance and policy enforcement on storage assets. |
| storage.buckets.listTagBindings | List tag bindings on Cloud Storage buckets. Cortex uses this permission to audit direct tag assignments for asset management and security policy compliance. |
| storage.objects.getIamPolicy | Retrieves the IAM policy of Cloud Storage objects. Cortex uses this permission to analyze fine-grained access controls on individual files and detect security risks. |
| tpu.nodes.list | List TPU nodes for asset discovery. |
Role: roles/viewer (Built-in role, managed by GCP)
Grants Cortex broad read-only access across all Google Cloud services, used to build a comprehensive inventory of resources within the onboarded scope.
Role: roles/cloudfunctions.viewer (Built-in role, managed by GCP)
Grants Cortex read access to the configuration and metadata of Cloud Functions, used for inventory collection and security posture assessment of serverless functions.
Role: roles/container.clusterViewer (Built-in role, managed by GCP)
Grants Cortex read access to the configuration and status of Google Kubernetes Engine (GKE) clusters, used to assess the security posture of Kubernetes environments.
Role: roles/firebaserules.viewer (Built-in role, managed by GCP)
Grants Cortex read access to the configuration and contents of Firebase Security Rules, used to evaluate the security of Firebase database access controls.
Role: roles/iam.organizationRoleViewer (Built-in role, managed by GCP)
Grants Cortex read access to organization-level role definitions so it can analyze custom roles defined at the organization level for security risks. This role is supported only at the organization onboarding scope.
Role: roles/iam.serviceAccountTokenCreator (Built-in role, managed by GCP)
Binding scope: The single cortex_service_account (Cortex platform service account, named crtx-<resource_suffix> in the host project). The binding is created as a Terraform google_service_account_iam_member resource and is not propagated to the organization, folder, or project.
Grantee: The Cortex outpost service account.
Purpose: Allows the Cortex outpost service account to create short-lived OAuth tokens for the platform service account, so that the outpost can perform delegated Discovery Engine API calls without requiring a long-lived service-account key.
Role: roles/resourcemanager.folderViewer (Built-in role, managed by GCP)
Grants Cortex read access to folder metadata and hierarchy so it can map the folder structure and identify resources within folders. This role is supported only at the organization or folder onboarding scope.
Role: roles/storage.objectViewer (Built-in role, managed by GCP)
Grants Cortex read access to the data and metadata of objects in Cloud Storage buckets, allowing it to inventory stored files and assess their content without modification capabilities.
Log Collection
These permissions allow Cortex XSIAM to ingest Google Cloud audit logs for threat detection and investigation. The roles below are Google-managed built-in roles.
Role: roles/iam.serviceAccountTokenCreator (Built-in role, managed by GCP)
Binding scope: The single auditlogs_service_account (named crtx-al-<resource_suffix> in the host project). The binding is created as a Terraform google_service_account_iam_member resource and is not propagated to the organization, folder, or project.
Grantee: The Cortex SaaS audit-logs collector service account.
Purpose: Allows the Cortex SaaS audit-logs collector to create short-lived OAuth tokens for the audit-logs service account, so that the SaaS collector can pull from the Cortex-owned Pub/Sub subscription without requiring a long-lived service-account key.
Role: roles/pubsub.publisher (Built-in role, managed by GCP)
Grants permission to publish messages to the Cortex audit logs Pub/Sub topic. Cortex assigns this built-in role to the Cloud Logging sink writer identity so that audit log entries are forwarded to the dedicated Pub/Sub topic for ingestion. Access is scoped to the specific topic created during onboarding.
Role: roles/pubsub.subscriber (Built-in role, managed by GCP)
Grants Cortex the ability to consume messages from a Pub/Sub subscription, enabling the Cortex audit logs service account to ingest audit log messages from the specific subscription created during onboarding.
Agentless Disk Scanning
These permissions allow Cortex XSIAM to perform agentless vulnerability scanning of GCP Compute Engine disks without ever accessing the live instance or the data on it. During a scan, Cortex creates a temporary point-in-time snapshot, mounts it read-only on a Cortex scanner VM, and deletes it when the scan completes. The permissions are bundled into two custom roles created during onboarding in your Google Cloud environment: ADSConnectorRole, used by the Cortex service account to create, label, and delete the temporary resources, and ADSOutpostRole, used by the Cortex outpost scanner to attach snapshots in read-only mode.
Every permission under this capability is restricted by an IAM condition that limits its effect to Compute Engine disks and snapshots whose names start with the cortex-scan- prefix. Cortex cannot read, modify, or delete any disk or snapshot that does not carry this prefix, including your existing production resources. The exact condition expression applied to each binding is: (resource.name.extract("snapshots/{end}").startsWith("cortex-scan-") || resource.name.extract("disks/{end}").startsWith("cortex-scan-")) && resource.service == "compute.googleapis.com"
Role: ADSConnectorRole
| Permission | Purpose |
|---|---|
| compute.disks.create | Create Compute Engine disks. Cortex uses this permission to create temporary disks from snapshots during the agentless scanning process. These disks are prefixed with cortex-scan- and are automatically cleaned up after scanning completes. |
| compute.disks.createSnapshot | Authorize reading and copying raw block data directly from a VM disk. Cortex uses this permission during agentless disk scanning to read the actual disk contents into a snapshot payload. While compute.snapshots.create manages the snapshot object, this permission grants access to the underlying disk data being captured. |
| compute.disks.delete | Delete Compute Engine disks. Cortex uses this permission to clean up temporary disks created during the agentless scanning process, ensuring no residual resources remain in the environment. |
| compute.disks.get | Retrieve metadata for Compute Engine disks. Cortex uses this permission to verify the properties and status of temporary disks (prefixed with cortex-scan-) during the scanning workflow. |
| compute.disks.setLabels | Set labels on Compute Engine disks. Cortex uses this permission to tag temporary scanning disks for cost visibility, identification, and lifecycle management. |
| compute.images.get | Retrieve metadata for Compute Engine images. Cortex uses this permission to access image information required to create temporary disks during the scanning process. |
| compute.snapshots.create | Authorize creating of a Compute Engine snapshot resource. Cortex uses this permission to initiate and store temporary point-in-time snapshot metadata required for agentless scanning. Unlike compute.disks.createSnapshot, which extracts the underlying disk data, this permission registers the snapshot object itself. |
| compute.snapshots.delete | Delete Compute Engine snapshots. Cortex uses this permission to clean up temporary snapshots after scanning is complete, ensuring no residual data remains in the environment. |
| compute.snapshots.get | Retrieve metadata for Compute Engine snapshots. Cortex uses this permission to monitor snapshot creation status and verify properties during the scanning workflow. |
| compute.snapshots.setLabels | Set labels on Compute Engine snapshots. Cortex uses this permission to tag temporary scanning snapshots for cost visibility, tracking, and automated cleanup. |
Role: ADSOutpostRole
| Permission | Purpose |
|---|---|
| compute.snapshots.useReadOnly | Attach a snapshot to a scanner VM in read-only mode. This permission allows the Outpost service account to inspect snapshot contents for security analysis without modifying the original data. |
Serverless Scan
These permissions allow Cortex XSIAM to perform vulnerability and code scanning of GCP serverless workloads by reading Cloud Function metadata, downloading function source code, and retrieving the corresponding deployment objects from Cloud Storage. They are bundled into a custom role, OutpostServerlessScannerConnectorRole, created during onboarding in your Google Cloud environment.
Role: OutpostServerlessScannerConnectorRole
Each permission for this role applies only to the Cloud Functions and Cloud Storage objects within that scope.
| Permission | Purpose |
|---|---|
| cloudfunctions.functions.get | Retrieve metadata and configuration for Cloud Functions. Cortex uses this permission to obtain function details such as runtime, memory, and timeout for serverless security scanning. |
| cloudfunctions.functions.sourceCodeGet | Retrieve the source code of a Cloud Function. Cortex uses this permission to download and inspect function code for vulnerabilities and misconfigurations during serverless scanning. |
| storage.objects.get | Retrieve data from Cloud Storage objects. Cortex uses this permission to download function deployment packages and source code stored in buckets for security analysis. |
Role: roles/iam.serviceAccountTokenCreator (Built-in role, managed by GCP)
Binding scope: The single outpost_scanner_service_account (named ctsc-<resource_suffix> in the host project). The binding is created as a Terraform google_service_account_iam_member resource and is not propagated to the organization, folder, or project.
Grantee: The Cortex serverless scanner service account.
Purpose: Allows the Cortex serverless scanner to create short-lived OAuth tokens for the outpost scanner service account, so that the scanner can perform Cloud Functions source-code reads via the OutpostServerlessScannerConnectorRole without requiring a long-lived service-account key.
Registry Scan
These permissions allow Cortex XSIAM to perform vulnerability scanning of container images stored in Google Artifact Registry (GAR) by pulling images for analysis without modifying the registry or its contents. They are bundled into a custom role, OutpostRegistryScannerConnectorRole, created during onboarding in your Google Cloud environment.
Role: OutpostRegistryScannerConnectorRole
This role contains a single permission, which applies only to Artifact Registry repositories within that scope.
| Permission | Purpose |
|---|---|
| artifactregistry.repositories.downloadArtifacts | Download artifacts (container images, packages) from Artifact Registry repositories. Cortex uses this permission to pull container images for security scanning, enabling vulnerability detection and compliance assessment of container workloads stored in your registry. |
Role: roles/iam.serviceAccountTokenCreator (Built-in role, managed by GCP)
Binding scope: The single outpost_scanner_service_account (named ctsc-<resource_suffix> in the host project). The binding is created as a Terraform google_service_account_iam_member resource and is not propagated to the organization, folder, or project.
Grantee: The Cortex registry scanner service account.
Purpose: Allows the Cortex registry scanner to create short-lived OAuth tokens for the outpost scanner service account, so that the scanner can pull Artifact Registry container images via the OutpostRegistryScannerConnectorRole without requiring a long-lived service-account key.
DSPM
These permissions allow Cortex XSIAM to discover and classify data stored in BigQuery, Bigtable, Cloud SQL, and Cloud Storage by reading table data, creating temporary backups, and downloading artifacts from Artifact Registry. They are bundled into three custom roles created during onboarding in your Google Cloud environment. DSPMConnectorRole is used by the Cortex service account to enumerate and prepare data resources, DSPMOutpostRole is used by the Cortex outpost scanner to read and classify data content, and OutpostDSPMScannerConnectorRole is used by the off-host scanner service account to perform isolated Bigtable read operations.
Role: DSPMConnectorRole
| Permission | Purpose |
|---|---|
| bigquery.tables.get | Retrieves BigQuery table metadata. Cortex uses this permission to access table schemas and configurations for data security assessment. |
| bigquery.tables.list | List BigQuery tables. Cortex uses this permission to discover and inventory tables for comprehensive data classification and security assessment. |
| bigtable.backups.create | Create Bigtable backups. Cortex uses this permission to generate temporary backups for secure data scanning without impacting production workloads. |
| bigtable.backups.delete | Delete Bigtable backups. Cortex uses this permission to clean up temporary backups created during the data security scanning process. |
| bigtable.backups.get | Retrieve Bigtable backup metadata. Cortex uses this permission to access backup details and properties for data security assessment. |
| bigtable.backups.list | List Bigtable backups. Cortex uses this permission to discover and inventory backups for standard cloud, outpost, and scanner-based deployments. |
| bigtable.clusters.get | Retrieve Bigtable cluster metadata. Cortex uses this permission to access cluster configurations and settings for data security assessment. |
| bigtable.clusters.list | List Bigtable clusters. Cortex uses this permission to discover cluster deployments for infrastructure inventory and security assessment. |
| bigtable.instances.get | Retrieve Bigtable instance metadata. Cortex uses this permission to access instance settings and configurations for data security assessment. |
| bigtable.instances.list | List Bigtable instances. Cortex uses this permission to discover and inventory database instances for comprehensive security assessment. |
| bigtable.tables.get | Retrieve Bigtable table metadata. Cortex uses this permission to access table schemas and configurations for data security assessment. |
| bigtable.tables.list | List Bigtable tables. Cortex uses this permission to discover and inventory tables for comprehensive data asset classification. |
| bigtable.tables.readRows | Read Bigtable table rows for data security posture management (DSPM) data classification. |
| cloudsql.backupRuns.create | Create Cloud SQL backup runs. Cortex uses this permission to generate temporary backups for secure database scanning without impacting production workloads. |
| cloudsql.backupRuns.delete | Delete Cloud SQL backup runs. Cortex uses this permission to clean up temporary backups created during the data security scanning process. |
| cloudsql.backupRuns.get | Retrieve Cloud SQL backup run metadata. Cortex uses this permission to access backup status and details for data security assessment. |
| cloudsql.backupRuns.list | List Cloud SQL backup runs. Cortex uses this permission to discover and inventory backups for classification purposes. |
Role: DSPMOutpostRole
| Permission | Purpose |
|---|---|
| bigquery.bireservations.get | Retrieve BigQuery BI Engine reservation configurations. Cortex uses this permission to understand capacity allocations for security posture management and data classification. |
| bigquery.capacityCommitments.get | Retrieve BigQuery capacity commitment details. Cortex uses this permission to analyze slot reservations and infrastructure settings for data security assessment. |
| bigquery.capacityCommitments.list | List BigQuery capacity commitments. Cortex uses this permission to discover capacity commitments for comprehensive infrastructure inventory and classification. |
| bigquery.config.get | Retrieve BigQuery project-level configurations. Cortex uses this permission to analyze settings and configurations for security posture assessment. |
| bigquery.datasets.get | Retrieve BigQuery dataset metadata. Cortex uses this permission to access dataset configurations, such as access controls and encryption settings, for data security assessment. |
| bigquery.datasets.getIamPolicy | Retrieve IAM policies for BigQuery datasets. Cortex uses this permission to analyze access controls and permissions for data security posture management. |
| bigquery.models.getData | Retrieve BigQuery ML model data. Cortex uses this permission to access and inspect ML model contents for security scanning and data classification. |
| bigquery.models.getMetadata | Retrieve BigQuery ML model metadata. Cortex uses this permission to access model configurations and properties for security assessment. |
| bigquery.models.list | List BigQuery ML models. Cortex uses this permission to discover and inventory ML models for comprehensive data security assessment. |
| bigquery.routines.get | Retrieve BigQuery routine definitions. Cortex uses this permission to analyze stored procedures and functions for security assessment and classification. |
| bigquery.routines.list | List BigQuery routines. Cortex uses this permission to discover stored procedures and functions for data asset inventory and classification. |
| bigquery.tables.export | Export BigQuery table data. Cortex uses this permission to extract data samples for sensitive data classification and security scanning. |
| bigquery.tables.get | Retrieves BigQuery table metadata. Cortex uses this permission to access table schemas and configurations for data security assessment. |
| bigquery.tables.getData | Retrieve BigQuery table data. Cortex uses this permission to access and inspect table contents for sensitive data discovery and classification. |
| bigquery.tables.getIamPolicy | Retrieve IAM policies for BigQuery tables. Cortex uses this permission to analyze fine-grained access controls and permissions for data security posture management. |
| bigquery.tables.list | List BigQuery tables. Cortex uses this permission to discover and inventory tables for comprehensive data classification and security assessment. |
| bigtable.backups.get | Retrieve Bigtable backup metadata. Cortex uses this permission on the outpost service account to verify backup status and properties before classification scans. |
| bigtable.backups.list | List Bigtable backups. Cortex uses this permission on the outpost service account to discover available backups for data security posture management. |
| bigtable.backups.restore | Restore Bigtable backups. Cortex uses this permission to restore backups to temporary tables for secure data scanning and classification. |
| bigtable.tables.list | List Bigtable tables. Cortex uses this permission to discover and inventory tables for comprehensive data asset classification. |
| cloudsql.backupRuns.get | Retrieve Cloud SQL backup run metadata. Cortex uses this permission to access backup status and details for data security assessment. |
Role: OutpostDSPMScannerConnectorRole
| Permission | Purpose |
|---|---|
| bigtable.instances.get | Retrieve Bigtable instance metadata from the Outpost scanner runner. Cortex grants this permission to the scanner service account (impersonated via the DSPM scanner service account) so that the off-host scanner can locate the target instance before reading rows for data classification, without granting the scanner direct access to the broader Cortex platform role. |
| bigtable.tables.get | Retrieve Bigtable table metadata (schema, column families) from the Outpost scanner runner. Cortex uses this on the scanner-side service account so that table layout can be inspected immediately before row reads, keeping the role surface area of the platform service account smaller. |
| bigtable.tables.readRows | Read row data from Bigtable tables for sensitive-data classification. Cortex grants this permission to the Outpost scanner-side service account only, so that the production-data read path is isolated from the connector / control-plane service account. |
Role: roles/iam.serviceAccountTokenCreator (Built-in role, managed by GCP)
Binding scope: The single outpost_scanner_service_account (named ctsc-<resource_suffix> in the host project). The binding is created as a Terraform google_service_account_iam_member resource and is not propagated to the organization, folder, or project.
Grantee: The Cortex DSPM scanner service account.
Purpose: Allows the Cortex DSPM scanner to create short-lived OAuth tokens for the outpost scanner service account, so that the DSPM scanner can perform Bigtable row reads and other data-classification operations via the OutpostDSPMScannerConnectorRole without requiring a long-lived service-account key.
Role: roles/storage.objectViewer (Built-in role, managed by GCP)
Grants Cortex read access to the data and metadata of objects in Cloud Storage buckets. Cortex grants this built-in role to the Outpost scanner service account so the scanner can read object contents for data security posture management and sensitive-data classification.
Automations
These permissions enable Cortex XSIAM to execute remediation and response actions across GCP services, including Compute Engine, Cloud Storage, GKE, Cloud Identity, and Cloud Asset Inventory. Each permission is mapped to the specific pack command that requires it. They are bundled into a custom role, AutomationRole, created during onboarding in your Google Cloud environment.
Note
Unified Cortex platform cloud content packs require a specific set of automation permissions to enable full integration with your cloud environment. Before configuring access for these packs, review the automation permission scope guidelines.
Role: AutomationRole
| Permission | Purpose |
|---|---|
| bigquery.datasets.get | Retrieve BigQuery dataset metadata. Cortex uses this permission to access dataset configurations, such as access controls and encryption settings, for data security assessment. |
| bigquery.datasets.getIamPolicy | Retrieve IAM policies for BigQuery datasets. Cortex uses this permission to analyze access controls and permissions for data security posture management. |
| bigquery.datasets.setIamPolicy | Set IAM policies on BigQuery datasets. Cortex uses this permission for remediation automation to modify dataset access controls and fix security policy violations. |
| bigquery.datasets.update | Update BigQuery dataset configurations. Cortex uses this permission for remediation automation to modify dataset settings and fix security misconfigurations. |
| cloudasset.assets.searchAllResources | Search and retrieves metadata for all Google Cloud resources (VMs, buckets, networks, and so on) within a specified scope. Cortex uses this permission to discover and inventory cloud assets across the GCP environment for automation workflows and security posture assessment. |
| compute.firewalls.create | Create firewall rules in Compute Engine. Cortex uses this permission to implement automated remediation actions, such as blocking malicious traffic or isolating compromised resources during incident response. |
| compute.firewalls.get | Retrieve firewall rule configurations. Cortex uses this permission to inspect existing firewall rules when evaluating security posture or preparing automated remediation actions. |
| compute.firewalls.list | List all firewall rules in a project. Cortex uses this permission to enumerate firewall configurations for security analysis and to identify rules that may need modification during automation workflows. |
| compute.firewalls.update | Modify existing firewall rules. Cortex uses this permission to update firewall configurations as part of automated remediation, such as tightening rules or blocking specific IP ranges. |
| compute.images.get | Retrieves Compute Engine image metadata. Cortex uses this permission to analyze VM configurations and prepare automation actions involving instance management. |
| compute.instanceGroups.get | Retrieve instance group configurations. Cortex uses this permission to understand instance group membership and settings when performing automation actions. |
| compute.instances.get | Retrieve VM instance details. Cortex uses this permission to obtain instance configurations, status, and metadata for security analysis and to prepare targeted automation actions. |
| compute.instances.list | List all VM instances in a project. Cortex uses this permission to enumerate compute resources for asset inventory, security posture assessment, and to identify instances requiring automated remediation. |
| compute.instances.setLabels | Set labels on VM instances. Cortex uses this permission to tag instances during automation workflows, such as marking compromised instances or tracking remediation status. |
| compute.instances.setMetadata | Modify instance metadata. Cortex uses this permission to update instance metadata as part of automation actions, such as configuring security-related settings or applying remediation configurations. |
| compute.instances.setServiceAccount | Change the service account attached to an instance. Cortex uses this permission for automated remediation to reduce privileges or isolate a compromised workload. |
| compute.instances.setTags | Set network tags on VM instances. Cortex uses this permission to modify instance network tags during automation, enabling or restricting firewall rule application as part of security remediation. |
| compute.instances.start | Start stopped VM instances. Cortex uses this permission to restart instances as part of automated recovery workflows after remediation actions have been completed. |
| compute.instances.stop | Stop running VM instances. Cortex uses this permission to halt compromised or vulnerable instances as an immediate containment action during automated incident response. |
| compute.networks.create | Create VPC networks. Cortex uses this permission for automation scenarios that require network isolation, such as creating quarantine networks for compromised resources. |
| compute.networks.get | Retrieve VPC network configurations. Cortex uses this permission to analyze network topology and settings when evaluating security posture or preparing network-related automation actions. |
| compute.networks.list | List all VPC networks in a project. Cortex uses this permission to enumerate network resources for security analysis and to identify networks that may be affected by automation workflows. |
| compute.networks.updatePolicy | Update network policies. Cortex uses this permission to modify network-level security policies as part of automated remediation, such as enabling or configuring network security features. |
| compute.regions.get | Retrieve region information. Cortex uses this permission to obtain regional configuration details when performing automation actions that are region-specific. |
| compute.snapshots.get | Retrieves snapshot metadata. Cortex uses this permission to inspect existing snapshots when analyzing backup configurations or preparing automation actions related to disk management. |
| compute.snapshots.list | List all snapshots in a project. Cortex uses this permission to enumerate snapshots for security analysis and to identify snapshot resources during automation workflows. |
| compute.subnetworks.get | Retrieve subnetwork configurations. Cortex uses this permission to analyze subnet settings and IP ranges when evaluating network security or preparing subnet-related automation actions. |
| compute.subnetworks.list | List all subnetworks in a project. Cortex uses this permission to enumerate subnet resources for network topology analysis and security posture assessment. |
| compute.subnetworks.setPrivateIpGoogleAccess | Enable or disables Private Google Access on subnets. Cortex uses this permission for automated remediation to control whether VMs without external IPs can access Google APIs and services. |
| compute.subnetworks.update | Modify subnetwork configurations. Cortex uses this permission to update subnet settings as part of automated remediation, such as modifying IP ranges or enabling security features. |
| compute.zones.get | Retrieve zone information. Cortex uses this permission to obtain zone-specific details when performing automation actions that require zone context. |
| container.clusters.get | Retrieve GKE cluster configurations. Cortex uses this permission to analyze Kubernetes cluster settings for security posture assessment and to prepare cluster-related automation actions. |
| container.clusters.list | List all GKE clusters in a project. Cortex uses this permission to enumerate Kubernetes clusters for asset inventory and to identify clusters that may require security remediation. |
| container.clusters.update | Modify GKE cluster configurations. Cortex uses this permission for automated remediation of Kubernetes clusters, such as updating security settings or enabling security features. |
| resourcemanager.projects.getIamPolicy | Retrieve project-level IAM policies. Cortex uses this permission to analyze IAM configurations for security assessment and to understand current access controls before performing IAM-related automation. |
| resourcemanager.projects.setIamPolicy | Modify project-level IAM policies. Cortex uses this permission for automated IAM remediation, such as removing excessive permissions or revoking access for compromised accounts. |
| storage.buckets.get | Retrieve Cloud Storage bucket metadata. Cortex uses this permission to analyze bucket configurations for security assessment, including checking encryption settings and access controls. |
| storage.buckets.getIamPolicy | Retrieve bucket-level IAM policies. Cortex uses this permission to analyze bucket access controls for security posture assessment and to identify overly permissive configurations. |
| storage.buckets.getIpFilter | Retrieve bucket IP filtering configurations. Cortex uses this permission to analyze network-level access restrictions on buckets for security assessment. |
| storage.buckets.list | List all Cloud Storage buckets in a project. Cortex uses this permission to enumerate storage resources for asset inventory and security posture assessment. |
| storage.buckets.setIamPolicy | Modify bucket-level IAM policies. Cortex uses this permission for automated remediation of bucket access controls, such as removing public access or restricting permissions. |
| storage.buckets.update | Modify bucket configurations. Cortex uses this permission for automated remediation of bucket settings, such as enabling encryption or configuring retention policies. |
| storage.objects.getIamPolicy | Retrieve object-level IAM policies. Cortex uses this permission to analyze fine-grained access controls on individual objects for security assessment. |
| storage.objects.list | List objects within Cloud Storage buckets. Cortex uses this permission to enumerate bucket contents for security analysis and to identify objects that may require access control remediation. |
Outpost Scanner
These permissions provide the Outpost Scanner with foundational, read-only access to your GCP environment. This enables the secure discovery and analysis of resources for Registry, DSPM, and Serverless scanning without the ability to modify your existing infrastructure.
Role: roles/viewer (Built-in role, managed by GCP)
Grant read-only access to all project resources. Cortex uses this built-in role on the outpost scanner service account to discover and inventory cloud resources across the onboarded environment for security posture assessment.
Oracle Cloud Infrastructure (OCI) provider permissions
The following reference tables are organized by security module and then the list of the CSP permissions being requested.
Discovery engine
"Discovery Engine" read only access. Grants read-only access to OCI tenancy and resources.
ADS
| Permission | Module | Scope | Purpose |
|---|---|---|---|
| Admit group CortexOutpostGroup of tenancy CortexOutpost to use volumes in tenancy | ADS | In tenancy | Allow creation of backups from volumes |
| Admit group CortexOutpostGroup of tenancy CortexOutpost to use key-delegate in tenancy | ADS | In tenancy | Re-encrypt backups during copy/restore operations |
| Admit group CortexOutpostGroup of tenancy CortexOutpost to associate keys in tenancy with volumes in tenancy CortexOutpost | ADS | Volumes in tenancy | Associate encryption keys with volumes during backup/restore |
| Admit group CortexOutpostGroup of tenancy CortexOutpost to use tag-namespaces in tenancy | ADS | In tenancy | Enable tagging for permission scoping, resource tracking, and cost visibility |
| Admit group CortexOutpostGroup of tenancy CortexOutpost to manage boot-volume-backups in tenancy where request.operation != 'DeleteBootVolumeBackup' | ADS | Excludes delete | Allow full management of boot volume backups except deletion |
| Admit group CortexOutpostGroup of tenancy CortexOutpost to manage boot-volume-backups in tenancy where target.resource.tag.cortex_m-o-lcaas_id.panw_capability = 'cortex-scan-platform' | ADS | Only boot-volume-backups tagged with panw_capability = cortex-scan-platform | Restrict deletion to Cortex scan-related resources only |
| Admit group CortexOutpostGroup of tenancy CortexOutpost to read all-resources in tenancy | ADS | In tenancy | Read-only access to all resources |
Registry scan
Dynamic group permissions
| Permission | Scope | Purpose |
|---|---|---|
| Allow dynamic-group registry-scan to manage buckets in tenancy | Tag-scoped (project_id) | Manage Object Storage buckets for scan artifacts/results |
| Allow dynamic-group registry-scan to manage objects in tenancy | Tag-scoped (project_id) | Upload/download image layers, manifests, and reports |
| Allow dynamic-group registry-scan to read secret-bundles in tenancy | Tag-scoped (project_id) | Retrieve registry credentials from OCI Vault |
| Endorse dynamic-group registry-scan to read repos in any-tenancy | Cross-tenancy | Allow cross-tenancy image pulls for scans |
Inherited base permissions for registry scanning
| Permission | Scope | Purpose |
|---|---|---|
| Allow any-user to manage buckets in tenancy | Tag-scoped (project_id) | Create/manage buckets for scan data |
| Allow any-user to manage objects in tenancy | Tag-scoped (project_id) | Read/write objects (artifacts, logs, results) |
| Allow any-user to use keys in tenancy | Tag-scoped (project_id) | Decrypt secrets for registry access |
| Allow any-user to manage secret-versions in tenancy | Tag-scoped (project_id) | Rotate credentials and manage secret versions |
| Allow any-user to manage secrets in tenancy | Tag-scoped (project_id) | Create/update secrets for scanners |
| Allow any-user to manage secret-family in tenancy | Tag-scoped (project_id) | Broader secret-management rights |
| Allow any-user to manage vaults in tenancy | Tag-scoped (project_id) | Create/administer Vaults for key and secret storage |
| Allow any-user to inspect tag-family in tenancy | Global | Discover tag namespaces/definitions |
| Allow any-user to use tag-family (namespace=cortex_cloud, managed_by=PANW) | Restricted | Restrict tag usage to Palo Alto-managed groups |
| Endorse any-group to use tag-namespaces in any-tenancy | Cross-tenancy | Allow tag namespace usage across tenancies |
Generic on-premise data collectors
You can collect data from generic on-premise data collectors that are not necessarily tied to a specific vendor, but are crucial for a wide range of log sources. The following are supported:
- Broker VM data collector applets: Enables ingesting different types of data from the Broker VM, which has a number of data collector applets.
- XDR Collectors: Enables using the XDR Collectors (XDRC) configuration that is dedicated for on-premise data collection on Windows and Linux machines to gather and process logs and events from multiple sources.
Broker VM data collector applets
The Broker VM has a number of data collector applets that you can configure to ingest different types of data. These data collector applets are in addition to the others that are available in the Settings → Configurations → Data Collection → Data Sources & Integrations page.
Activate Apache Kafka Collector
Apache Kafka is an open-source distributed event streaming platform for high-performance data pipelines, streaming analytics and data integration. Kafka records are organized into Topics. The partitions for each Topic are spread across the bootstrap servers in the Kafka cluster. The bootstrap servers are responsible for transferring data from Producers to Consumer Groups, which enable the Kafka server to save offsets of each partition in the Topic consumed by each group.
The Broker VM provides a Kafka Collector applet that enables you to monitor and collect events from Topics on self-managed on-prem Kafka clusters directly to your log repository for query and visualization purposes. The applet supports Kafka setups with no authentication, with SSL authentication, and SASL SSL authentication.
After you activate the Kafka Collector applet, you can collect events as datasets (<Vendor>_<Product>_raw) by defining the following.
- Kafka connection details including the Bootstrap Server List and Authentication Method.
- Topics Collection configuration for the Kafka topics that you want to collect.
Prerequisite
- Apache Kafka version 2.5.1 and above.
- Kafka cluster set up on premises, from which the data will be ingested.
- Privileges to manage Broker Service configuration, such as Instance Administrator privileges.
- Create a user in the Kafka cluster with the necessary permissions and the following authentication details:
- Broker Certificate and Private Key for an SSL connection.
- Username and Password for an SASL SSL connection.
- Set up and configure Broker VM
How to activate the Kafka Collector
- Select Settings → Configurations → Data Broker → Broker VMs.
- Do one of the following:
- On the Brokers tab, find the Broker VM, and in the APPS column, left-click Add → Kafka Collector.
- On the Clusters tab, find the Broker VM, and in the APPS column, left-click Add → Kafka Collector.
- Configure the Kafka Connection.
- Specify the Bootstrap Server List, which is the
<hostname/ip>:<port>of the bootstrap server (or servers). You can specify multiple servers, separated with a comma. For example,hostname1:9092,1.1.1.1:9092. - Select one of the Authentication Methods:
- No Authentication: Default connection method for a new Kafka setup, which doesn’t require authentication. With a standard Kafka setup, any user or application can write messages to any topic, as well as read data from any topic.
- SSL Authentication: Authenticate your connection to Kafka using an SSL certificate. Use this authentication method when the connection to the Kafka server is a secure TCP, and upload the following:
- Broker Certificate: Signed certificate used for the applet to authenticate to the Kafka server.
- Private Key: Private key for the applet used for decrypting the SSL messages coming from the Kafka server.
- (Optional) CA Certificate: CA certificate that was used to sign the server and private certificates. This CA certificate is also used to authenticate the Kafka server identity.
- SASL SSL (SCRAM-SHA-256): Authenticate your connection to the Kafka server with your Username, Password, and optionally, your CA Certificate.
- Test Connection to verify that you can connect to the Kafka server. An error message is displayed for each server connection test that fails.
- Specify the Bootstrap Server List, which is the
- Configure the Topics Collection parameters.
- Topic Subscription Method: Select the Topic Subscription Method for subscribing to Kafka topics. Use List Topics to specify a list of topics. Use Regex Pattern Matching to specify a regular expression to search available topics.
- Topic(s): Specify Topic(s) from the Kafka server. For the List Topics subscription method, use a comma-separated list of topics to subscribe to. For the Regex Pattern Matching subscription method, use a regular expression to match the Topic(s) to subscribe to. We do not recommend mixing log/event types in a topic.
- (optional) Consumer Group: Specify a Consumer Group, a unique string or label that identifies the consumer group this log source belongs to. Each record that is published to a Kafka topic is delivered to one consumer instance within each subscribing consumer group. Kafka uses these labels to load balance the records over all consumer instances in a group. When specified, the Kafka collector uses the given consumer group. When not specified, Cortex XSIAM assigns the Kafka applet collector to a new automatically generated consumer group which is automatically generated for this log source with the name
PAN-<Broker VM device name>-<topic name>. - Log Format: Select the Log Format from the list as either RAW (default), JSON, CEF, LEEF, CISCO, or CORELIGHT. This setting defines the log type, which represents the type of logs the collector will receive from the configured Kafka topics.
-
Vendor and Product: Specify the Vendor and Product which will be associated with each entry in the dataset. The vendor and product are used to define the name of your Cortex Query Language (XQL) dataset (
<Vendor>_<Product>_raw).Note
For CEF and LEEF logs, Cortex XSIAM takes the vendor and product names from the log itself, regardless of what you configure on this page.
- (optional) Add Query: Click Add Query to create another Topic Collection. Each topic can be added for a server only once.
- (optional) Other available options for Topic Collection: As needed, you can manage your Topic Collection settings. Here are the actions available to you.
- Edit the Topics Collection details.
- Disable/Enable a Topics Collection by hovering over the top area of the Topics Collection section, on the opposite side of the Topics Collection name, and selecting the applicable button.
- Rename a Topics Collection by hovering over the top area of the Topics Collection section, on the opposite side of the Topics Collection name, and selecting the pen icon.
- Delete a Topics Collection by hovering over the top area of the Topics Collection section, on the opposite side of the Topics Collection name, and selecting the delete icon.
- (Optional) Click Add Connection to create another Kafka Connection for collecting data.
- (Optional) Other available options for Connections. As needed, you can return to your Kafka Collector settings to manage your connections. Here are the actions available to you.
- Edit the Connection details.
- Rename a connection by hovering over the default Connection name and selecting the edit icon to edit the text.
- Delete a connection by hovering over the top area of the connection section, on the opposite side of the connection name, and selecting the delete icon. You can only delete a connection when you have more than one connection configured. Otherwise, this icon is not displayed.
- Activate the Kafka Collector applet. The Activate button is enabled when all the mandatory fields are filled in. After a successful activation, the APPS field displays Kafka with a green dot indicating a successful connection.
- (Optional) To view metrics about the Kafka Collector, in the Broker VMs page, left-click the Kafka connection displayed in the APPS field for your Broker VM. Cortex XSIAM displays Resources, including the amount of CPU, Memory, and Disk space the applet is using.
- Manage the Kafka Collector. After you activate the Kafka Collector, you can make additional changes as needed. To modify a configuration, left-click the Kafka connection in the APPS column to display the Kafka Collector settings, and select the following:
- Configure to redefine the Kafka Collector configurations.
- Deactivate to disable the Kafka Collector. Ensure that you save your changes, which is enabled when all mandatory fields are filled in. You can also ingest Apache Kafka events as datasets.
Activate Cortex Network Scanner
The Cortex Network Scanner identifies and analyzes devices, services, and vulnerabilities in your internal network. It discovers responsive hosts within specified IP ranges, including on-premises and cloud environments. The scanner supports both non-authenticated and authenticated vulnerability scanning, with authenticated scans providing deeper insights through credential-based access. Scan results are seamlessly integrated into the inventory and vulnerability management views in Cortex XSIAM, providing a centralized view of all discovered assets, vulnerabilities, and issues.
Cortex Network Scanner is installed as an applet on a Broker VM.
This feature is included with a Cortex XSIAM Premium license. It is also included with an active Cortex XSIAM NG SIEM and Cortex XSIAM Enterprise license that has the Exposure Management add-on.
Important
The Cortex Network Scanner applet is not supported for FedRAMP customers.
Cortex Network Scanner does not support high availability (HA) Broker VM configuration.
Prerequisites
- Review the Cortex Network Scanner deployment recommendations and complete any prerequisites.
- Set up and configure Broker VM
How to activate Cortex Network Scanner
- Navigate to Settings → Configurations → Data Broker → Broker VMs.
- Right click the Broker VM, and select Add App → Network Scanner.
- After the applet has installed, the scanner should automatically connect to the tenant. If the connection is successful, you’ll see a green dot next to Network Scanner in the Apps column of the Broker VMs table.\
A red dot indicates that an error occurred and the scanner is not connected. - (Optional) Click on the network scanner in the table to display details about the scanner or to deactivate it.
- Validate the installation. Navigate to Modules → Vulnerability & Exposure Management → Network Scanners → Network Scanners and find your new scanner in the list. The Network Scanners page displays all your deployed and configured scanners, along with additional details about each of them. After setting up a Broker VM and activating Cortex Network Scanner, refer to Get started with Cortex Network Scanner for information about adding networks, adding credentials for authenticated scans, and configuring scans.
Activate CSV Collector
The Broker VM provides a CSV Collector applet that enables you to monitor and collect CSV (comma-separated values) log files from a shared Windows directory directly to your log repository for query and visualization purposes. After you activate the CSV Collector applet on a Broker VM in your network, you can ingest CSV files as datasets by defining the list of folders mounted to the Broker VM and setting the list of CSV files to monitor and upload to Cortex XSIAM using a username and password.
Prerequisite
- Set up and configure Broker VM.
- Ensure that you share the applicable CSV files.
- Know the complete file path for the Windows directory.
How to activate the CSV Collector
- Select Settings → Configurations → Data Broker → Broker VMs.
- Do one of the following:
- On the Brokers tab, find the Broker VM, and in the APPS column, left-click Add → CSV Collector.
- On the Clusters tab, find the Broker VM, and in the APPS column, left-click Add → CSV Collector.
- Configure your CSV Collector by defining the list of folders mounted to the Broker VM and specifying the list of CSV files to monitor and upload to Cortex XSIAM. You must also specify a username and password.
-
Mounted Folders: Define the folders mounted onto the Broker VM:
Define the folders mounted onto the Broker VM:
-
| Field | Description |
|---|---|
| Folder Path | Specify the complete file path to the Windows directory containing the shared CSV files using the format: //host/<folder_path>. For example, //testenv1pc10/CSVFiles. |
| Username | Specify the username for accessing the Windows directory. |
| Password | Specify the password for accessing the Windows directory. |
After you configure the mounted folder details, Add () details to the applet.
- Mounted CSV Files
| Field | Description |
|---|---|
| Folder Path + Name | <p>Select the monitored Windows directory and specify the name of the CSV file. Use a wildcard file search using these characters in the name of the directory, CSV file name, and Path Exclusion.</p><ul><li>?: Matches a single char, such as 202?-report.csv.</li><li>: Matches either multiple characters, such as 2021-report.csv, or all CSV files with .csv.</li><li>: Searches all directories and subdirectories. For example, if you want to include all the CSV files in the directory and any subdirectories, use the syntax //host/<folder_path>//.csv.</li></ul><p>Note: When you implement a wildcard file search, ensure that the CSV files share the same columns and header rows as all other logs that are collected from the CSV files to create a single dataset.</p> |
| Path Exclusion (Optional) | Specify the complete file path for any files from the Windows directory that you do not want included. The same wildcard file search characters are allowed in this field as explained above for the FOLDER PATH +NAME field. For example, if you want to exclude any CSV file prefixed with 'exclude_' in the directory and subdirectories of //host/<folder_path>, use the syntax //host/<folder_path>/**/exclude_*.csv. |
| Tags (Optional) | To easily query the CSV data in the database, you can add a tag to the collected CSV data. This tag is appended to the data using the format <data>_<tag>. |
| Target Dataset | Either select the target dataset for the CSV data or create a new dataset by specifying the name for the new dataset. |
- Activate the CSV Collector applet. After a successful activation, the APPS field displays CSV with a green dot indicating a successful connection. ### Note The CSV Collector checks for new CSV files every 10 minutes.
- (Optional) To view metrics about the CSV Collector, left-click the CSV connection in the APPS field for your Broker VM.Cortex XSIAM displays Resources, including the amount of CPU, Memory, and Disk space the applet is using.
- Manage the CSV Collector. After you activate the CSV Collector, you can make additional changes as needed. To modify a configuration, left-click the CSV connection in the APPS column to display the CSV settings, and select:
- Configure to redefine the CSV Collector configurations.
- Deactivate to disable the CSV Collector.
Activate Database Collector
The Broker VM provides a Database Collector applet that enables you to collect data from a client relational database directly to your log repository for query and visualization purposes. After you activate the Database Collector applet on a Broker VM in your network, you can collect records as datasets (<Vendor>_<Product>_raw) by defining the following.
- Database connection details, where the connection type can be MySQL, PostgreSQL, MSSQL, and Oracle. Cortex XSIAM uses Open Database Connectivity (ODBC) to access the databases.
- Settings related to the query details for collecting the data from the database to monitor and upload to Cortex XSIAM.
Prerequisite
- Set up and configure Broker VM
- Kerberos authentication for MSSQL:
- DNS resolution: The Broker VM must resolve and reach the Active Directory. Domain controllers serve as the Kerberos KDC. Configure DNS on the Broker VM so it can locate the domain.
- Network access to the KDC: The Broker VM must have open network connectivity to reach the Active Directory domain controllers for Kerberos authentication.
- Time synchronization: The Broker VM's clock must be tightly synchronized with the Active Directory domain. Kerberos security protocols strictly reject authentication requests if there is a significant clock difference.
- Service Principal Name (SPN): The target SQL Server instance must have a valid SPN registered within Active Directory.
How to activate the Database Collector
- Select Settings → Configurations → Data Broker → Broker VMs.
- Do one of the following:
- On the Brokers tab, find the Broker VM, and in the APPS column, left-click Add → DB Collector.
- On the Clusters tab, find the Broker VM, and in the APPS column, left-click Add → DB Collector.
-
Configure your Database Collector settings.
Database Connection
Field Description Connection Select the type of database connection as MySQL, PostegreSQL, MSSQL, or Oracle. Host Specify the hostname or IP address of the database. Port Specify the port number of the database. Database Specify the database name for the type of database configured. This field is relevant when configuring a Connection Type for MySQL, PostegreSQL, and MSSQL.
When configuring an Oracle connection, this field is called Service Name, so you can specify the name of the service.
Enable SSL Select whether to Enable SSL (default) to encrypt the data while in transit between the database and the Broker VM.
When configuring the DB collector to work with an Oracle database and enabling this option, ensure the following steps are completed for a successful connection:
- Ensure you have the certificate of the Database server.
Upload certificate to Broker CA Trust Store (Conditional):
This step is only required if the Oracle server's certificate is self-signed or signed by a private Certificate Authority (CA). Skip this step if the certificate is signed by a publicly known CA.
- Navigate to the Broker VMs page by selecting Settings → Configurations → Data Broker → Broker VMs.
- Right-click on the relevant broker and select Configure.
- Scroll down to the Trusted CA Certificate section.
- Upload the certificate file that contains the database server's SSL/TLS certificate.
- Verify server-side port encryption: Confirm that the port configured for the connection has encryption enabled on the Oracle Database server side. The database must be listening for encrypted connections on the specified port.
These steps ensure that the connection is secure and the client (the Broker VM/DB Collector) successfully trusts the server's identity.
Username Enter the domain or local user identity authorized to access the database. Format restrictions apply depending on your selected Authentication Method:
- SQL Server auth: The username may only contain letters (A-Z), digits (0-9), underscores (_), dollar signs ($), and hash signs (#) .
- Kerberos auth: Must use the User Principal Name (UPN) format, such as
user@REALM. - Kerberos / NTLM auth: Must use either the standard down-level logon format (
DOMAIN\Username) or the User Principal Name (UPN) format.
Password Enter the password to access the database.
The DB Collector does not support passwords containing semicolons (
;).Authentication Method Visible only when Connection is set to MSSQL. Select the authentication mechanism used to log into your MSSQL Server.
Supported options:
- SQL Server (Default): Uses standard SQL internal authentication with a username and password defined directly on the database master catalog.
- Kerberos: Enforces strict modern Kerberos authentication.
- Kerberos / NTLM: A hybrid option where the system attempts a secure Kerberos authentication first.
If the environment does not meet all Kerberos prerequisites, the applet will automatically fall back to attempting the legacy NTLM authentication mechanism.
Note
Kerberos is the recommended method for Windows Authentication. Using NTLM fallback is not recommended, as it is an outdated protocol that is no longer considered secure.
Test Connection Select to validate the database connection. Database Query
Field Description Storage Method <p>Specify whether to append the read data to the dataset, or to replace all the data in the dataset with the newly read data.</p><ul><li>Append (default): Adds new data to an existing dataset. This mode is optimal for collecting aggregated logs or data, where new records are simply added to the end of the existing dataset.</li><li>Replace: This option is only available for Snapshot datasets and each read cycle overwrites the entire dataset with the newly collected data. This is necessary when the data that needs to be collected from the database is static data or reference data, such as a list of computers, IP addresses, or a list of users.</li></ul><p>The Database Collector applet supports a single row size of up to 65 KB. Ensure your source data does not exceed this limit per record to avoid ingestion errors.</p><p>Replace mode logic</p><p>When using the Replace mode in the Database Collector, the following field logic is applied:</p><ul><li>Dataset name: Defined by the user during configuration.</li><li>Vendor: Set automatically to PANW.</li><li>Product: Set automatically as db_collector followed by a unique identifier, such asdb_collector_12345.</li></ul><p>The reference data ingested using the DB Collector is counted towards license utilization.</p>Target Dataset <p>This option is only displayed when the Storage Method is Replace. Select the name of an existing Snapshot dataset or create a new Snapshot dataset by specifying the name.</p><p>When you create a new target dataset name, specify a name that will be more meaningful for your users when they query the dataset. For example, if the original table name is accssusr, you can save the dataset asaccess_per_users.</p><p>Dataset names can contain special characters from different languages, numbers (0-9) and underscores (_). You can create dataset names using uppercase characters, but in queries, dataset names are always treated as if they are lowercase.</p>Rising Column This option is only displayed when the Storage Method is Append. Specify a column for the Database Collector applet to keep track of new rows from one input execution to the next. The column name must be configured with the same column name that is returned from the database and not the aliased name used in the query. This column must also be included in the query results. Retrieval Value <p>This option is only displayed when the Storage Method is Append. Specify a Retrieval Value for the Database Collector applet to determine which rows are new from one input execution to the next. Cortex XSIAM supports configuring this value as an integer or a string that contains a timestamp. The following string timestamp formats are supported: ISO 8601 format, RFC 2822 format, date strings with month names spelled out, such as “January 1, 2022”, date strings with abbreviated month names, such as “Jan 1, 2022", and date strings with two-digit years- MM/DD/YY.</p><p>The first time the input is run, the Database Collector applet only selects those rows that contain a value higher than the value you specified in this field. Each time the input finishes running, the Database Collector applet updates the input's Retrieval Value with the value in the last row of the Rising Column.</p> Unique IDs (Optional) This option is only displayed when the Storage Method is Append. Specify the column name(s) to match against when multiple records have the same value in the Rising Column. This column must be included in the query results. This is a comma separated field that supports multiple values. In addition, when specifying a Unique IDs, the query should use the greater than equal to sign ( >=) in relation to the Retrieval Value. If the Unique IDs is left empty, the user should use the greater than sign (>).Collect Every Specify the execution frequency of collection by designating a number and then selecting the unit as either Seconds, Minutes, Hours, or Days. When the Storage Method is Append the default is 30 seconds and for Replace the default is 12 hours. Vendor and Product This option is only displayed when the Storage Method is Append. Specify the Vendor and Product for the type of data being collected. The vendor and product are used to define the name of your Cortex Query Language (XQL) dataset ( <Vendor>_<Product>_raw).SQL Query Specify the SQL Query to run and collect data from the database by replacing the example query provided in the editor box. When the Storage Method is Append, the question mark ( ?) in the query is a checkpoint placeholder for the Retrieval Value. Every time the input is run, the Database Collector applet replaces the question mark with the latest checkpoint value (i.e. start value) for the Retrieval Value. The query duration, when the Storage Method is in Replace mode, is limited to a maximum of 24 hours.Generate Preview Select Generate Preview to display up to 10 rows from the SQL Query and Preview the results. The Preview works based on the Database Collector settings, which means that if after running the query no results are returned, then the Preview returns no records. Add Query (Optional) To define another Query for data collection on the configured database connection, select Add Query. Another Query section is displayed for you to configure. - (Optional) Click Add Connection to define another database connection to collect data from another client relational database.
-
(Optional) Other available options.
As needed, you can return to your Database Collector settings to manage your connections. Here are the actions available to you:
- Edit the connection name by hovering over the default Collection name, and selecting the edit icon to edit the text.
- Edit the query name by hovering over the default Query name, and selecting the edit icon to edit the text.
- Disable/Enable a query by hovering over the top area of the query section, on the opposite side of the query name, and selecting the applicable button.
- Delete a connection by hovering over the top area of the connection section, on the opposite side of the connection name, and selecting the delete icon. You can only delete a connection when you have more than one connection configured. Otherwise, this icon is not displayed.
- Delete a query by hovering over the top area of the query section, on the opposite side of the query name, and selecting the delete icon. You can only delete a query when you have more than one query configured. Otherwise, this icon is not displayed.
-
Activate the Database Collector applet.
After a successful activation, the APPS field displays DB with a green dot indicating a successful connection.
-
(Optional) To view metrics about the Database Collector, left-click the DB connection in the APPS field for your Broker VM.
Cortex XSIAM displays Resources, including the amount of CPU, Memory, and Disk space the applet is using.
-
Manage the Database Collector.
After you activate the Database Collector, you can make additional changes as needed. To modify a configuration, left-click the DB connection in the APPS column to display the Database Collector settings, and select:
- Configure to redefine the Database Collector configurations.
- Deactivate to disable the Database Collector.
Activate DSPM Database
License
This feature is included with a Cortex XSIAM Premium license. It is also included with a Cortex XSIAM NG SIEM and Cortex XSIAM Enterprise license that has the Cloud Posture Security or Cloud Runtime Security add-on.
The DSPM Database applet is an application installed directly onto the Broker VM. It is the core component responsible for auditing and securing your on-premises PostgreSQL and MySQL databases, providing visibility into the risks associated with your stored data.
Once configured, this applet continuously:
- Accesses your on-premise databases, including those containing regulated or confidential information.
- Identifies data that must be stored in accordance with specific compliance standards.
- Classifies database content to identify sensitive information.
- Transmits the collected insights and risk metadata securely through the Broker VM to Cortex XSIAM.
The DSPM Database applet provides insights into risks associated with data stored in on-premise databases, PostgreSQL and MySQL instances. Whether you are transitioning to the cloud or maintaining assets on-premise, activating this applet offers a customizable way to manage data security and compliance within a single, unified platform.
Prerequisite
- Set up and configure Broker VM.
- Know the database engine, host, and port for the database you want to connect.
How to activate the DSPM Database applet
- Select Settings → Configurations → Data Broker → Broker VMs.
-
Do one of the following:
- On the Brokers tab, find the Broker VM, and in the APPS column, left-click Add → DSPM Database.
- On the Clusters tab, find the Broker VM, and in the APPS column, left-click Add → DSPM Database.
Note
The applet list displays only the applets for which you have permissions.
-
Configure the DSPM Database settings.\
Database ConnectionField Description Database Engine Select PostgreSQL or MySQL in the list. Host Enter host name. Port Enter port. Database Name Enter the name of the database. Enable SSL Decide whether to turn on the Enable SSL toggle, which ensures that the connection between the applet and your on-premise database is encrypted, protecting data in transit. Username Enter your user name. Password Enter your password. Test Connection Select to validate the connection permissions. Note
By default, all configured connections are saved.
- (Optional) Click Add Connection to define another database connection. You can add multiple connections under one DSPM Database applet instance.
- Activate the DSPM Database applet.\
After a successful activation, the APPS field displays DSPM Database with a green dot indicating a successful connection.
Other actions
Once the DSPM Database applet is activated, you can perform the following actions:
- Edit
- Deactivate: On the Broker VMs screen, in the ADD column, in the context menu, click Deactivate.
- Delete: On the Database Connection screen, click the Delete icon next to the connection you want to remove.
- Scan: Turn on the Classification toggle. This enables 2.500 random files to be scanned classified each time.
- Select Cadence: In the Scan every list, select the cadence of how often the files are to be scanned. If you want the scans to occur less frequently, choose the Custom option and enter the amount of days, weeks, or months that you require.
Inventory list
Each new connection that is created correlates to an asset in the inventory. You can see the connections by clicking Inventory → All Assets → Data → Databases. Make sure to set the filter to Provider = On Premise.
Activate DSPM Fileshare
License
This feature is included with a Cortex XSIAM Premium license. It is also included with a Cortex XSIAM NG SIEM and Cortex XSIAM Enterprise license that has the Cloud Posture Security or Cloud Runtime Security add-on.
The DSPM Fileshare applet is an application installed directly onto the Broker VM. The applet’s primary role is to establish and manage connections with your on-premise network file shares, including those using the SMB (Server Message Block) and NFS (Network File Sharing) protocols.
Once configured, this applet continuously:
- Accesses the designated file share paths.
- Ingests the file and folder metadata.
- Classifies files and identifies sensitive information.
- Transmits the collected metadata and results securely through the Broker VM to Cortex XSIAM.
By activating the DSPM Fileshare applet, you extend security coverage to your physical infrastructure, enabling classification for SMB and NFS file shares. This allows you to automatically discover stored content, identify sensitive data, and locate shadow backups, ensuring continuous visibility and consistent governance across hybrid and legacy environments.
Prerequisite
- Set up and configure Broker VM
- Know the complete path to the files and folders that you want Cortex XSIAM to monitor.
- Necessary user permissions to access the network shares. For the SMB connection type, you need the user name and password.
How to activate the DSPM Fileshare applet
- Select Settings → Configurations → Data Broker → Broker VMs.
-
Do one of the following:
- On the Brokers tab, find the Broker VM, and in the APPS column, left-click Add → DSPM Fileshare.
- On the Clusters tab, find the Broker VM, and in the APPS column, left-click Add → DSPM Fileshare.
Note
The applet list displays only the applets for which you have permissions.
-
Configure the DSPM Fileshare settings.
File Share Connection
Field Description File Share Connection Replace the text with a name for the new connection. Connection Type <p>* NFS (Network File System): A distributed file system protocol that lets networked computers share files remotely, making them appear as if they're stored locally. Operating at the application layer, it uses Remote Procedure Calls (RPCs) for clients to access a server's files and directories.
* SMB (Server Message Block): A network file-sharing protocol that provides shared access to resources like files, printers, and serial ports across a network. It enables client applications to remotely interact with files and other assets stored on a server. It is the default file-sharing protocol for Microsoft Windows operating systems. This connection type requires a username and a password.</p>Path Specify the host and path to the folder containing the files that you want Cortex XSIAM to monitor. Username For the SMB connection type only. Password For the SMB connection type only. Classification Decide whether to turn on the Classification toggle. This enables 2,500 random files to be scanned and classified each time. Scan every Select the cadence of how often the files are to be scanned. If you want the scans to occur less frequently, choose the Custom option and enter the amount of days, weeks, or months that you require. Test Connection Select to validate the connection permissions. Note
By default, all configured connections are saved.
- (Optional) Click Add Connection to define another database connection. You can add multiple connections under one DSPM Fileshare applet instance.
- Activate the DSPM Fileshare applet.\
After a successful activation, the APPS field displays DSPM Fileshare with a green dot indicating a successful connection.
Other actions
Once the DSPM Fileshare applet is activated, you can perform the following actions:
- Edit
- Deactivate: On the Broker VMs screen, in the ADD column, in the context menu, click Deactivate.
- Delete: On the File Share Connection screen, click the Delete icon next to the connection you want to remove.
Inventory list
Each new connection that is created correlates to an asset in the inventory. You can see the connections by clicking Inventory → All Assets → Data → Storage Buckets.
Activate Files and Folders Collector
The Broker VM provides a Files and Folders Collector applet that enables you to monitor and collect logs from files and folders in a network share for a Windows or Linux directory, directly to your log repository for query and visualization purposes. The Files and Folders collector applet only starts to collect files that are more than 256 bytes and is only supported with a Network File System version 4 (NFSv4). After you activate the Files and Folders Collector applet, you can collect files as datasets (<Vendor>_<Product>_raw) by defining the following.
- Details of the folder path on the network share containing the files that you want to monitor and upload to Cortex XSIAM.
- Settings related to the list of files to monitor and upload to Cortex XSIAM, where the log format is either Raw (default), JSON, CSV, TSV, PSV, CEF, LEEF, Corelight, or Cisco.
Note
Cortex XSIAM only supports ingestion of files encoded in UTF-8 format.
Prerequisite
- Set up and configure Broker VM.
- Know the complete path to the files and folders that you want Cortex XSIAM to monitor.
- Ensure that the user permissions for the network share include the ability to rename and delete files in the folder that you want to configure collection.
How to activate the Files and Folders Collector
- Select Settings → Configurations → Data Broker → Broker VMs.
- Do one of the following:
- On the Brokers tab, find the Broker VM, and in the APPS column, left-click Add → Files and Folder Collector.
- On the Clusters tab, find the Broker VM, and in the APPS column, left-click Add → Files and Folder Collector.
-
Configure the Files and Folder Collector settings.
Shared Folder Connection
| Field | Description |
|---|---|
| Folder Path | <p>Specify the path to the files and folders that you want Cortex XSIAM to monitor continuously to collect the files. The following formats are available based on the type of computer you are using:</p><ul><li>Windows: <hostname><shared_folder> or smb://<hostname>/<shared_folder></li><li>Linux: /<srv>/<shared_folder> or nfs://<srv>/<shared_folder></li></ul><p>Note</p><p>When using the Linux file share, including the Linux share with NFS, a Username and Password are not required, so these fields are grayed out in the screen.</p> |
| Recursive | Select this checkbox to configure the Files and Folders Collector applet to recursively examine any subfolders for new files as long as the folders are readable. This is not configured by default. |
| Username | Specify the username to access the shared resource using a User Principal Name (UPN) format. |
| Password | Specify the password to access the shared resource. |
| Test Connection | Select to validate the connection and permissions. |
File and Folder Settings
| Field | Description |
|---|---|
| Mode | <p>Select the mode to use for collecting data. The settings displayed change depending on your selection.</p><ul><li>Tail: Continuously monitors the files for new data (default). The collector adds the new data from the files to the dataset.</li><li><p>Batch: Reads the files automatically at user determined intervals, updates the lookup datasets, and then renames or deletes the uploaded source files. Renaming or deleting the read source files ensures that the collector always reads the most up-to-date file. Depending on the Storage Method, the collector can Append the new data from the files to the dataset or completely Replace the data in the dataset.</p><p>In Batch mode, the Files and Folders Collector supports collecting logs from a network share for a maximum file size of 500 MB.</p></li></ul> |
| Collect Every | This option is only displayed in Batch Mode. Specify the execution frequency of collection by designating a number and then selecting the unit as either Minutes, Hours, or Days. |
| After Files Uploaded | This option is only displayed in Batch Mode. Select what to do with the files after they are uploaded to the Cortex XSIAM server. You can Rename files with a suffix (default) or you can Delete files. When renaming, the suffix is added to the end of the original file name using the format <file name>.<suffix>, which becomes the new name of the file. |
| Include | <p>Specify the files and folders that must match to be monitored by Cortex XSIAM. Multiple values are allowed with commas separating the values and are case-sensitive.</p><p>Allowed wildcard:</p><ul><li>'?' matches a single alphabet character in a specific position.</li><li>'' matches any character or set of characters, including no character.</li></ul><p>log.jsonlog*.json includes any JSON file starting with 'log'.</p><p></p> |
| Exclude (Optional) | <p>Specify the files and folders that must match to not be monitored by Cortex XSIAM . Multiple values are allowed with commas separating the values.</p><p>Allowed wildcard:</p><ul><li>'?' matches a single alphabet character in a specific position.</li><li>'' matches any character or set of characters, including no character.</li></ul><p>.backup excludes any file ending with '.backup'.</p><p></p> |
| Log Format | <p>Select the Log Format from the list as either Raw (default), JSON, CSV, TSV, PSV, CEF, LEEF, Corelight, or Cisco. This setting defines the parser used to parse all the processed files as defined in the Include and Exclude fields, regardless of the file names and extension. For example, if the Include field is set * and the Log Format is JSON, all files (even those named file.log) in the specified folder are processed by the Files and Folders Collector as JSON, and any entry that does not comply with the JSON format are dropped.</p><p>When uploading JSON files, Cortex XSIAM only parses the first level of nesting and only supports single line JSON format, such that every new line means a separate entry.</p> |
| # of Lines to Skip (Optional) | <p>Specify the number of lines to skip at the beginning of the file. This is set to 0 by default.</p><p>Use this option only in cases where your files contain some sort of "header" lines, such as a general description, an introduction, a disclaimer, or similar, and you want to skip ingesting them. The Lines to Skip are not part of the file format. For example, in CSV files, there is no need to skip lines.</p> |
Data Source Mapping
| Field | Description |
|---|---|
| Storage Method | <p>This option is only displayed in Batch Mode. Specify whether to Append the read data to the dataset, or to Replace all the data in the dataset with the newly read data.</p><ul><li>Append: This mode is useful for log files where you want to keep all the log info from before.</li><li><p>Replace: This mode is useful for adding inventory data from CSV and JSON files which include properties, for example, a list of machines, a list of users, or a mapping of endpoints to users to create a lookup dataset. In each data collection cycle, the new data completely replaces the existing data in the dataset. You can use the records from the lookup datasets for correlation and enrichment through parsing rules, correlation rules, and queries.</p><ul><li>When the storing method is Replace, the maximum size for the total data to be imported into a lookup dataset is 30 MB each time the data is fetched.</li><li>The inventory data ingested using the Files and Folders collector is counted towards license utilization.</li><li>When you use a JOINT function with a lookup table in a query or correlation rule, make sure you configure the conflict strategy to point to the raw dataset. This ensures that the system fields are taken from the raw dataset and not from the lookup table.</li></ul></li></ul> |
| Target Dataset | <p>This option is only displayed in Batch Mode when the storing method is Replace. Select the name of an existing Lookup dataset or create a new Lookup dataset by specifying the name.</p><p>When you create a new target dataset name, specify a name that will be more meaningful for your users when they query the dataset. For example, if the original file name is accssusr.csv, you can save the dataset as access_per_users.</p><p>Dataset names can contain special characters from different languages, numbers (0-9) and underscores (_). You can create dataset names using uppercase characters, but in queries, dataset names are always treated as if they are lowercase.</p><ul><li>You can't specify a file name that's the same as a system file name.</li><li>The name of a dataset created from a tsv file must always include the extension. If the original file name is mrkdptusrsnov23.tsv, you can name save the dataset with the name marketing_dept_users_Nov_2023.tsv.</li></ul> |
| Vendor and Product | <p>Specify the Vendor and Product for the type of data being collected. The vendor and product are used to define the name of your Cortex Query Language (XQL) dataset (<Vendor>_<Product>_raw).</p><p>The Vendor and Product defaults to Auto-Detect when the Log Format is set to CEF or LEEF.</p> |
Generate Preview
Select Generate Preview to display up to 10 rows from the first file and Preview the results. The Preview works based on the Files and Folders Collector settings, which means that if all the files that were configured to be monitored were already processed, then the Preview returns no records.
- (Optional) Click Add Connection to define another Files and Folders connection for collecting logs from files and folders in a shared resource. 5. (Optional)
- Other available options.\
As needed, you can return to your Files and Folders Collector settings to manage your connections. Here are the actions available to you:
- Edit the connection name by hovering over the default Collection name, and selecting the edit icon to edit the text.
- Disable/Enable a connection by hovering over the top area of the connection section, on the opposite side of the connection name, and selecting the applicable button.
- Delete a connection by hovering over the top area of the connection section, on the opposite side of the connection name, and selecting the delete icon. You can only delete a connection when you have more than one connection configured. Otherwise, this icon is not displayed.
-
Activate the Files and Folders Collector applet.
After a successful activation, the APPS field displays File with a green dot indicating a successful connection.
-
(Optional) To view metrics about the Files and Folders, left-click the File connection in the APPS field for your Broker VM.
Cortex XSIAM displays Resources, including the amount of CPU, Memory, and Disk space the applet is using.
-
Manage the Files and Folders Collector.
After you activate the Files and Folders Collector, you can make additional changes as needed. To modify a configuration, left-click the File connection in the APPS column to display the Files and Folder Collector settings, and select:
- Configure to redefine the Files and Folders Collector configurations.
- Deactivate to disable the Files and Folders Collector.
Activate FTP Collector
The Broker VM provides a FTP Collector applet that enables you to monitor and collect logs from files and folders via FTP, FTPS, and SFTP directly to your log repository for query and visualization purposes. A maximum file size of 500 MB is supported. After you activate the FTP Collector applet on a Broker VM in your network, you can collect files as datasets (<Vendor>_<Product>_raw) by defining the following.
- FTP, FTPS, or SFTP (default) connection details with the path to the folder containing the files that you want to monitor and upload to Cortex XSIAM .
- Settings related to the list of files to monitor and upload to Cortex XSIAM , where the log format is either Raw (default), JSON, CSV, TSV, PSV, CEF, LEEF, Corelight, or Cisco. Once the files are uploaded to Cortex XSIAM , you can define whether in the source directory the files are renamed or deleted.
Prerequisite
- Set up and configure Broker VM.
- Ensure that the user permissions for the FTP, SFTP, or FTPS include the ability to rename and delete files in the folder that you want to configure collection.
- When setting up an FTPS Collector with a server using a Self-signed certificate, you must upload the certificate first to the Broker VM as a Trusted CA certificate.
How to activate the FTP Collector
- Select Settings → Configurations → Data Broker → Broker VMs.
- Do one of the following:
- On the Brokers tab, find the Broker VM, and in the APPS column, left-click Add → FTP Collector.
- On the Clusters tab, find the Broker VM, and in the APPS column, left-click Add → FTP Collector.
- Configure the FTP Collector settings.
FTP Connection
| Field | Description |
|---|---|
| Type | Select the type of FTP connection as FTP, SFTP, or FTPS. |
| Host | Enter the hostname, IP address, or FQDN of the FTP server. When configuring a FTPS Collector, you must specify the FQDN. |
| Port | Enter the FTP port number. |
| Username | Enter the username to login to the FTP server. |
| Password | Enter the password to login to the FTP server. |
| SSH Key-Based Authentication | <p>This checkbox is only displayed when setting a SFTP Collector, which works with both Username and Password authentication or SSH Key-Based Authentication. You can either leave this checkbox clear and set a Username and Password (default) or select SSH Key-Based Authentication to Browse to a Private Key. When this connection is established with a server using a Self-signed certificate, you must upload it first to the Broker VM as a Trusted CA Certificate.</p><p>Note: When configuring an SFTP connection, Cortex XSIAM expects the private key to be in the RSA format that is included in the -----BEGIN RSA PRIVATE KEY-----tag. Cortex XSIAM does not support the private key in the Open SSH format from the ------BEGIN OPENSSH PRIVATE KEY-----tag</p><p>When using ssh-keygen using a Mac, you get the OpenSSH format by default. The command for getting the RSA format is:</p><p>ssh-keygen -t rsa -b 4096 -C <email address> -m PEM</p> |
| Folder Path | Specify the path to the folder on the FTP site where the files are located that you want to collect. |
| Recursive | Select this checkbox to configure the FTP Collector applet to recursively examine any subfolders for new files as long as the folders are readable. This is not configured by default. |
| Test Connection | Select to validate the FTP connection. |
FTP Settings
| Field | Description |
|---|---|
| Collect Every | Specify the execution frequency of collection by designating a number and then selecting the unit as either Minutes, Hours, or Days. |
| After Files Uploaded | Select what to do with the files after they are uploaded to the Cortex XSIAM server. You can either select Rename files with a suffix (default) and then you must specify the Suffix or Delete files. When adding a suffix, the suffix is added at the end of the original file name using the format <file name>.<suffix>, which becomes the new name of the file. |
| Include | <p>Specify the files and folders that must match to be monitored by Cortex XSIAM . Multiple values are allowed with commas separating the values.</p><p>Allowed wildcard:</p><ul><li>'?' matches a single alphabet character in a specific position.</li><li>'' matches any character or set of characters, including no character.</li></ul><p>log.json includes any JSON file starting with 'log'.</p><p></p> |
| Exclude (Optional) | <p>Specify the files and folders that must match to not be monitored by Cortex XSIAM . Multiple values are allowed with commas separating the values.</p><p>Allowed wildcard:</p><ul><li>'?' matches a single alphabet character in a specific position.</li><li>'' matches any character or set of characters, including no character.</li></ul><p>.backup excludes any file ending with '.backup'.</p><p></p> |
| Log Format | <p>Select the Log Format from the list as either Raw (default), JSON, CSV, TSV, PSV, CEF, LEEF, Corelight, or Cisco, which indicates to Cortex XSIAM how to parse the data in the file. This setting defines the parser used to parse all the processed files as defined in the Include and Exclude fields, regardless of the file names and extension. For example, if the Include field is set * and the Log Format is JSON, all files (even those named file.log) in the specified folder are processed by the FTP Collector as JSON, and any entry that does not comply with the JSON format are dropped.</p><p>When uploading JSON files, Cortex XSIAM only parses the first level of nesting and only supports single line JSON format, such that every new line means a separate entry.</p> |
| # of Lines to Skip (Optional) | <p>Enter the number of lines to skip at the beginning of the file. This is set to 0 by default.</p><p>Use this option only in cases where your files contain some sort of "header" lines, such as a general description, an introduction, a disclaimer, or similar, and you want to skip ingesting them. The Lines to Skip are not part of the file format. For example, in CSV files, there is no need to skip lines.</p> |
Data Source Mapping
Specify the Vendor and Product for the type of data being collected. The vendor and product are used to define the name of your Cortex Query Language (XQL) dataset (<Vendor>_<Product>_raw).
- The Vendor and Product defaults to Auto-Detect when the Log Format is set to CEF or LEEF.
Preview
Select Generate Preview to display up to 10 rows from the first file and Preview the results. The Preview works based on the FTP Collector settings, which means that if all the files that were configured to be monitored were already processed, then the Preview returns no records.
- (Optional) Click Add Connection to define another FTP connection for collecting logs from files and folders via FTP, FTPS, or SFTP.
-
(Optional) Other available options.
As needed, you can return to your FTP Collector settings to manage your connections. Here are the actions available to you:
- Edit the connection name by hovering over the default Collection name, and selecting the edit icon to edit the text.
- Disable/Enable a connection by hovering over the top area of the connection section, on the opposite side of the connection name, and selecting the applicable button.
- Delete a connection by hovering over the top area of the connection section, on the opposite side of the connection name, and selecting the delete icon. You can only delete a connection when you have more than one connection configured. Otherwise, this icon is not displayed.
-
Activate the FTP Collector applet.
After a successful activation, the APPS field displays FTP with a green dot indicating a successful connection.
-
(Optional) To view metrics about the FTP Collector, left-click the FTP connection in the APPS field for your Broker VM.
Cortex XSIAM displays Resources, including the amount of CPU, Memory, and Disk space the applet is using.
-
Manage the FTP Collector.
After you activate the FTP Collector, you can make additional changes as needed. To modify a configuration, left-click the FTP connection in the APPS column to display the FTP Collector settings, and select:
- Configure to redefine the FTP Collector configurations.
- Deactivate to disable the FTP Collector.
Activate Local Agent Settings
License
This feature is included with a Cortex XSIAM Premium license. It is also included with any other Cortex XSIAM license that includes endpoints or Cortex Cloud Runtime Security.
The Local Agent Settings applet on the Palo Alto Networks Broker VM enables you to:
Deploy the Broker VM proxy
To deploy Cortex XSIAM in restricted networks where endpoints do not have a direct connection to the internet, setup the Broker VM to act as a proxy that routes all the traffic between the Cortex XSIAM management server and XDR agents/XDR Collectors via a centralized and controlled access point. This enables your agents and XDR Collectors to receive security policy updates, upgrades, and send logs and files to Cortex XSIAM without a direct internet connection. The Broker VM acts like a transparent proxy and doesn’t decrypt the secure connection between the server and the XDR agent/XDR Collectors, and hides the XDR agent’s/XDR Collector's original IP addresses. If your network topology includes SSL decryption in an upstream proxy/firewall, the Broker VM does not participate in the trust relationship as it is not initiating the connection to the server to be fully transparent.
Note
When routing traffic through a Broker VM proxy that sits behind a firewall, you may experience intermittent agent disconnections if the firewall is configured to drop challenge ACK reset (RST) packets. For environments using a Palo Alto Networks Next-Generation Firewall (NGFW), see this Knowledge Base article for details on managing this behavior via the Allow Challenge Ack setting.
Enable broker caching
To reduce your external network bandwidth loads, you can cache XDR agent installations, upgrades, and content updates on your Cortex XSIAM Broker VM. Every 15 minutes, the Broker VM retrieves the latest installers and content files from Cortex XSIAM, downloading them only if they are not already stored locally. The Broker VM stores this content for 7 days and agent installers for up to 30 days from the agent's last request. If the files were not available on the Broker VM at the time of the ask, the agent proceeds to download the files directly from the Cortex XSIAM server.
Requirements
Before you activate the Local Agent Settings applet, verify the following prerequisites and limitations listed by the main features.
General
The Local Agent Settings applet on the Broker VM is capable of supporting:
- Up to 28,000 agents for an Agent Proxy running on a Broker VM deployed prior to February 22, 2026.
- Up to 50,000 agents for an Agent Proxy running on a Broker VM deployed after February 22, 2026.
- Up to 10,000 agents for Content Caching.
This is assuming a standard hardware setup with 2vCPU 8 GB memory.
Agent Proxy
- Supported with Traps agent version 5.0.9 and Traps agent version 6.1.2 and later releases.
- Broker VM supports forwarding the XDR Collectors request URLs on all Broker VM versions.
- Supported with all XDR Collector versions. Broker VMs can act as as a proxy for routing XDR Collector traffic to the Cortex XSIAM tenant. The Broker VM does not cache XDR Collector installers.
- The Agent Proxy can also act as a proxy for other brokers. It supports all the data that brokers send to the server, including the logs they collect, using the Cortex Broker VM applets.
Agent Installer and Content Caching
- Supported with XDR agent version 7.4 and later releases and Broker VM 12.0 and later.
- Requires a Broker VM with a minimum of an 8-core processor and increase the disk space allocated for data storage to 1024 GB to support caching for 10,000 agents. For more information, see Increase Broker VM storage allocated for data caching.
- For the agent installer and content caching to work properly, you must configure different settings where the instructions differ depending on whether you are configuring a standalone Broker VM or High Availability (HA) cluster.
Standalone broker
- FQDN: A FQDN must be configured for the standalone broker as configured in your local DNS server. This is to ensure that XDR agents know who to access to receive agent installer and content caching data.
- SSL certificates: Ensure you upload strong cipher SHA256-based SSL certificates when you setup the Broker VM. For more information, see Set up and configure Broker VM.
- Download source: Requires adding the Broker VM as a download source in your Agent Settings Profile.
HA cluster
- FQDN: A FQDN must be configured in the cluster settings as configured in your local DNS server, which points to a Load Balancer. This ensures that the XDR agents turn to the load balancer to route the requests for the agent installer and content caching data to the correct broker. For more information on configuring the Load Balancer FQDN in a HA cluster, see Configure High Availability Cluster.
- SSL certificates: In each broker in the cluster, ensure you upload strong cipher SHA256-based SSL certificates when you setup the Broker VM. For more information, see Set up and configure Broker VM.
- Download source: Requires adding the cluster as a download source in your Agent Settings Profile.
Agent communication with Broker VM
Agents communicate with the Broker VM using Hypertext Transfer Protocol Secure (https) over port 443. You must ensure this port is open so that the Broker VM is accessible to all agents that are configured to use its cache.
Broker communication with cloud manager
The broker needs to communicate with the same URLs that the agents communicate with to avoid receiving any inaccessible URLs errors. For a complete list of the URLs that you need to allow access, see Enable access to required PANW resources.
How to activate the Local Agent Settings applet
After you configure and register your Palo Alto Networks Broker VM, proceed to set up your Local Agent Settings applet.
- Select Settings → Configurations → Data Broker → Broker VMs.
- In either the Brokers tab or the Clusters tab, locate your Broker VM.
-
(Optional) To set up the Agent Proxy:
a. Right-click the Broker VM and select Configure.
Ensure your proxy server is configured. If not, add it as described in Set up and configure Broker VM.
b. In the APPS column, select Add → Local Agent Settings.
c. In the Activate Local Agent configuration, set Proxy to Enabled. Specify the Port. You can also configure the Listening Interface. The default is All.
Note
When you install XDR agents, configure the Broker VM IP address and port number. You can use port
8888or a custom port. You cannot use ports0–1024,63000–65000,4369,5671,5672,5986,6379,8000,9100,15672, or25672. You also cannot reuse ports assigned to the Syslog Collector applet. -
(Optional) To set up Agent Installer and Content Caching:
a. Ensure you uploaded your SHA256-based certificates.
If not, upload them as described in Set up and configure Broker VM and Save.
b. Specify the Broker VM FQDN.
Right-click the Broker VM and select Configure. Under Device Name, enter your Broker VM FQDN. Configure this FQDN record in your local DNS server.
Important
A FQDN must be configured for WEC and Agent Installer and Content Caching to work properly.
c. Activate the Local Agent Settings applet on the Broker VM.
Right-click the Broker VM and select Add App → Local Agent Settings. Alternatively, in the APPS column, select Add → Local Agent Settings.
d. Activate installer and content caching.
In the Activate Local Agent configuration, set Caching to Enabled.
Important
You can enable Agent Installer and Content Caching only after uploading a signed SSL Server Certificate and key, and setting the FQDN. For more information, see the Agent Installer and Content Caching requirements above.
e. To enable agents to use Broker VM caching, add the Broker VM as a download source in your Agent Settings profile. Select the Broker VMs to use. Ensure the profile is associated with a policy for your target agents.
- After a successful activation, the APPS field displays Local Agent Settings with a green dot indicating a successful connection. Left-click the Local Agent Settings connection to view the applet status and resource usage.\
To help you easily troubleshoot connectivity issues for a Local Agent Settings applet on the Palo Alto Networks Broker VM, Cortex XSIAM displays a list of Denied URLs. These URLs are displayed when you left-click the Local Agent Settings applet to view the Connectivity Status. As a result, in a situation where the Local Agent Settings applet is reported as activated with a failed connection, you can easily determine the URLs that need to be allowed in your network environment. - Manage the local agent settings. After the local agent settings have been activated, left-click the Local Agent Settings connection in the APPS column to display the settings, and select:
- Configure to change your settings.
- Deactivate to disable the local agent settings altogether.
Activate NetFlow Collector
To receive NetFlow flow records from an external source, you must first set up the NetFlow Collector applet on a Broker VM within your network. NetFlow versions 5, 9, and IPFIX are supported.
To increase the log ingestion rate, you can add additional CPUs to the Broker VM. The NetFlow Collector listens for flow records on specific ports either from any, or from specific IP addresses.
After the NetFlow Collector is activated, the NetFlow Exporter sends flow records to the NetFlow Collector, which receives, stores, and pre-processes that data for later analysis.
Performance Requirements
The following setups are required to meet your performance needs:
- 4 CPUs for up to 50K flows per second (FPS).
- 8 CPUs for up to 100K FPS.
Note
Since multiple network devices can send data to a single NetFlow Collector, we recommend that you configure a maximum of 50 NetFlow Collectors per Broker VM applet, with a maximum aggregated rate of approximately 50K flows per second (FPS) to maintain system performance.
Prerequisite
Set up and configure Broker VM
How to activate the NetFlow Collector
- Select Settings → Configurations → Data Broker → Broker VMs.
- Do one of the following:
- On the Brokers tab, find the Broker VM, and in the APPS column, left-click Add → NetFlow Collector.
- On the Clusters tab, find the Broker VM, and in the APPS column, left-click Add → NetFlow Collector.
- Click +Add New.
-
Configure your NetFlow Collector.
General Settings
Specify the number of the UDP Port on which the NetFlow Collector listens for flow records (default 2055).
This port number must match the UDP port number in the NetFlow exporter device. The rules for each port are evaluated, line by line, on a first match basis. Cortex XSIAM discards logs for non-configured flow records without an “Any” rule.
Since Cortex XSIAM reserves some port numbers, it is best to select a port number that is not in the range of 0-1024 (except for 514), in the range of 63000-65000 or has one of the following values: 4369, 5671, 5672, 5986, 6379, 8000, 8888, 9100, 15672, or 28672.
Custom Settings
- (Optional) Make additional changes to the NetFlow Collector data sources.
- You can make additional changes to the Port by right-clicking the applicable UDP port and selecting the following:
- Edit: To change the UDP Port, Source Network, Vendor, or Product defined.
- Remove: To delete a Port.
-
You can make additional changes to the Source Network by right-clicking on the Source Network value.
The options available change, according to the set Source Network value.
Option Description Edit To change the UDP Port, Source Network, Vendor, or Product defined. Remove To delete a Port. Copy entire row To copy the Source Network, Product, and Vendor information. Open IP View To view network operations and to view any open cases on this IP within a defined period. This option is only available when the Source Network value is a specific IP address or CIDR. Open in Quick Launcher To search for information using the Quick Launcher shortcut . This option is only available when the Source Network value is a specific IP address or CIDR. - To prioritize the order of the NetFlow formats listed for the configured data source, drag and drop the rows to change their order.
- You can make additional changes to the Port by right-clicking the applicable UDP port and selecting the following:
-
Activate the NetFlow collector applet.
After successful activation, the APPS field displays NetFlow with a green dot indicating a successful connection.
-
(Optional) To view NetFlow Collector metrics, left-click the NetFlow connection in the APPS field for your Broker VM.
Cortex XSIAM displays the following information:
Option Description Connectivity Status Whether the applet is connected to Cortex XSIAM. Logs Received and Logs Sent Number of logs that the applet received and sent per second over the last 24 hours. If there are more logs received than sent, this can indicate a connectivity issue. Resources Displays the amount of CPU, Memory, and Disk space the applet uses. -
Manage the NetFlow Collector.
After you activate the NetFlow Collector, you can make additional changes. To modify a configuration, left-click the NetFlow connection in the APPS column to display the NetFlow Collector settings, and select:
- Configure to redefine the NetFlow Collector configurations.
- Deactivate to disable the NetFlow Collector.
You can also Ingest NetFlow flow records as datasets.
Activate Network Mapper
This feature is included with a Cortex XSIAM Premium license. It is also included with any other Cortex XSIAM license that includes endpoints or Cortex Cloud Runtime Security.
Prerequisite
After you have configured and registered your Broker VM, you can choose to activate the Network Mapper application.
The Network Mapper allows you to scan your network to detect and identify unmanaged hosts in your environment according to defined IP address ranges. The Network Mapper configurations are used to locate unmanaged assets that appear in the Assets table. For more information, see All assets.
- Select Settings → Configurations → Data Broker → Broker VMs.
- Do one of the following:
- On the Brokers tab, find the Broker VM, and in the APPS column, left-click Add → Network Mapper.
- On the Clusters tab, find the Broker VM, and in the APPS column, left-click Add → Network Mapper.
-
In the Activate Network Mapper window, define the following parameters:
-
Activate the applet.
After a successful activation, the APPS field displays Network Mapper with a green dot indicating a successful connection.
-
In the APPS field, left-click the Network Mapper connection to view the following scan and applet metrics:
Scan Details
Field Description Connectivity Status Whether the applet is connected to Cortex XSIAM . Scan Status State of the scan. Scan Start Time Timestamp of when the scan started. Scan Duration Period of time in minutes and seconds the scan is running. Scan Progress How much of the scan has been completed in percentage and IP address ratio. Detected Hosts Number of hosts identified from within the IP address ranges. Scan Rate Number of IP addresses scanned per second. Applet Metrics
Resources: Displays the amount of CPU, Memory, and Disk space the applet is using.
-
Manage the Network Mapper.
After the network mapper has been activated, left-click the Network Mapper connection in the APPS column to display the Network Mapper settings, and select:
- Configure to redefine the network mapper configurations.
- Scan Now to initiate a scan.
- Deactivate to disable the network mapper.
Activate Registry Scanner
The Broker VM provides a Registry Scanner applet that scans and secures your container image registries. It supports Docker V2 or JFrog self-hosted registries located on-premises or in private cloud networks.
License type: Requires a Cortex XSIAM Premium license. It is also included with any other Cortex XSIAM product that has the Cloud Posture security or the Cloud Runtime Security add-on.
Note
- You cannot activate the Registry Scanner directly on a new or existing Broker VM. You can only activate or deactivate existing Registry Scanner applets. To activate or deactivate existing applets, see Step 4 under Verify Registry Scanner connection section.
Verify Registry Scanner connection
After the registry scanner is initialized, perform the following steps to verify that the Registry Scanner applet is connected to the Broker VM:
Prerequisite:
- To initialize registry scanning on your Broker VM, you must first add the necessary data connectors. For details, see:
- When sizing your Broker VM, consider the following recommendations:
-
Disk Size: Calculate the required disk space by multiplying the average container image size in your environment by 10. This factor accounts for simultaneous operations with a buffer.
For example, If your average image size is 500 MB, allocate at least 5 GB of disk space (500 MB * 10 = 5000 MB = 5 GB).
- CPU: Allocate a minimum of 8 CPU cores.
- Memory: Allocate a minimum of 16 GB of RAM.
-
- Go to Settings → Configurations → Data Broker → Broker VMs.
- On either the Brokers or Clusters tab, find the Broker VM.
- In the APPS column for the Broker VM, verify that the Registry Scanner app appears.
-
Select the Registry Scanner app to open a window displaying the following information:

-
Connection: Shows the app's current connection status. You can also Deactivate the app.
To reactivate the Registry Scanner app, do one of the following:
- On the Brokers tab, locate the Broker VM, select +Add in the APPS column, and then choose Registry Scanner.
- On the Clusters tab, locate the Broker VM, select +Add in the APPS column, and then choose Registry Scanner.
If the Registry Scanner app is not listed in the drop-down menu when you click +Add, it means that the registry scanning was not configured for that Broker VM. You must first add the data connectors.
-
Resources: Shows the percentage of CPU, Memory, and Disk resources used by the app.
-
- To manage the Registry Scanner applet, see:
Syslog Collector applet
The Syslog Collector applet on a Broker VM enables you to collect Syslog data from an external source:
| Syslog Collector applet | Description |
|---|---|
| How to activate Syslog Collector? | Activate Syslog Collector |
| How to ingest logs from a Syslog receiver? | Ingest logs from a Syslog receiver |
| Different types of vendor logs to ingest with a Syslog Collector applet: | <ul><li>Check Point FW1/VPN1</li><li>Cisco ASA firewalls and AnyConnect</li><li>Corelight Zeek</li><li>Forcepoint DLP</li><li>Fortinet Fortigate</li><li>Next-Generation Firewall</li><li>PingFederate</li><li>Zscaler Internet Access</li><li>Zscaler Private Access</li></ul> |
| Links to content pack/integration details (onboarded prior to July 26, 2026) | <p>The Syslog content pack enables automated issue creation by acting as a Syslog server for incoming logs, while also allowing the platform to act as a Syslog client to send messages and mirror investigation activities to external Syslog destinations. It contains the following integrations:</p><ul><li>Syslog Sender: Use this integration to send messages in RFC 5424 message format and mirror incident War Room entries to Syslog. It includes the mirror-investigation, send-notification, and syslog-send commands.</li><li>Syslog v2: Use this integration to act as a long-running Syslog server, supporting RFC3164, RFC5424, and RFC6587 formats, which enables automatically opening issues from Syslog clients. This integration is configured using parameters such as Port mapping, Certificate, Private Key, and a Message Regex Filter for issue creation.</li></ul> |
Activate Syslog Collector
To receive Syslog data from an external source, you must first set up the Syslog Collector applet on a Broker VM within your network.
Specifications and limits
To ensure reliable data ingestion, observe the following technical specifications and protocol-specific constraints:
- Ingestion rate: The Syslog Collector supports a log ingestion rate of up to 90,000 logs per second (lps) with the recommended Broker VM setup.
- Port capacity: The Syslog Collector listens for logs on specific ports and from any or specific IP addresses. A single Syslog Collector configuration supports up to 100 ports.
- Protocol support: The collector supports TCP, Secure TCP, and UDP, following the RFC 6587 standard for transmission over TCP.
Message size limitations
- UDP: Each syslog message is limited to 4 KB (the size of the read buffer). Messages exceeding this size will be truncated.
- TCP with Non-Transparent-Framing: This is the most common option, using the newline character
\n (Hex 0x0A) as the end-of-line delimiter for syslog messages. In this mode, each message is limited to 64 KB. Messages larger than 64 KB are dropped and will cause the connection to close. - TCP with Octet Framing: This method relies on the length specified by the sender. There is no explicit message size limit; the only practical limitation is the available system memory. This is the recommended framing for messages exceeding 64 KB.
Prerequisite
Set up and configure Broker VM
Perform the following procedures in the order listed below.
Task 1. Add a Syslog Collector
- Select Settings → Configurations → Data Broker → Broker VMs.
- Do one of the following:
- On the Brokers tab, find the Broker VM, and in the APPS column, left-click Add → Syslog Collector.
- On the Clusters tab, find the Broker VM, and in the APPS column, left-click Add → Syslog Collector.
Task 2. Configure the Syslog Collector
Cortex XSIAM supports multiple sources over a single port on a single Syslog Collector. The following options are available:
- Edit the Optional Settings of the default PORT/PROTOCOL: 514/UDP. See Task 3.\
Note: Once configured, you cannot change the Port/PROTOCOL. If you don’t want to use a data source, ensure to remove the data source from the list as explained in Task 5. - Add a new Syslog Collector data source. See Task 4.
Task 3. Edit the default 514/UDP Syslog Collector data source
- Right-click the 514/UDP PORT/PROTOCOL, and select Edit.
-
Configure these Optional Settings:
Field Description Format <p>Select the Syslog format you want to send to the UDP 514 protocol and port on the Syslog Collector: Auto-Detect (default), CEF, LEEF, CISCO, or RAW.</p><ul><li>The Vendor and Product defaults to Auto-Detect when the Log Format is set to CEF or LEEF.</li><li>For a Log Format set to CEF or LEEF, Cortex XSIAM reads events row by row to look for the Vendor and Product configured in the logs. When the values are populated in the event log row, Cortex XSIAM uses these values even if you specified a value in the Vendor and Product fields in the Syslog Collector settings. Yet, when the values are blank in the event log row, Cortex XSIAM uses the Vendor and Product that you specified in the Syslog Collector settings. If you did not specify a Vendor or Product in the Syslog Collector settings and the values are blank in the event log row, the values for both fields are set to unknown.</li><li>CORELIGHT is not available for a UDP protocol.</li></ul> Vendor and Product Specify a particular vendor and product for the Syslog format defined or leave the default Auto-Detect setting. Source Network Specify the IP address or Classless Inter-Domain Routing (CIDR). If you leave this blank, Cortex XSIAM will allow receipt of logs from any source IP address or CIDR that transmits over the specified protocol and port. When you specify overlapping addresses in the Source Network field in multiple rows, such as 10.0.0.10 in the first row and 10.0.0.0/24 in the second row, the order of the addresses matter. In this example, the IP address 10.0.0.10 is only captured from the first row definition. For more information on prioritizing the order of the syslog formats, see Task 5. - After each configuration, select to save the changes and then Done to update the Syslog Collector with your settings.
Task 4. Add a new Syslog Collector data source
- Select Add New.
-
Configure these mandatory General settings:
Protocol
Choose a protocol over which the Syslog will be sent: UDP, TCP, or Secure TCP.
When configuring the Protocol as Secure TCP, these additional General Settings are available:
- Server Certificate: Browse to your server certificate to configure server authentication.
- Private Key: Browse to your private key for the server certificate.
-
Optional CA Certificate: (Optional) Browse to your CA certificate for mutual authentication.
The log forwarder (for example, a firewall) authenticates the Broker VM by default. The Broker VM does not authenticate the log forwarder by default, but you can use this option to set up such authentication. If you use this option, ensure that you have a client certificate on the log forwarding side that matches the CA certificate on the Broker VM side.
- Minimal TLS Version: Select either 1.0 or 1.2 (default) as the minimum TLS version allowed.
- The server certificate and private key pair is expected in a PEM format.
- Cortex XSIAM will notify you when your certificates are about to expire.
Port
Choose a port on which the Syslog Collector will listen for logs. A Syslog Collector configuration supports up to 100 ports.
Because some port numbers are reserved by Cortex XSIAM , you must choose a port number that is not:
- In the range of 0-1024 (except for 514)
- In the range of 63000-65000
- Values of 4052, 4369, 5671, 5672, 5986, 6379, 8000, 8888, 9100, 15672, or 28672
3. Configure these Optional Settings:
Field Description Format <p>Select the Syslog format you want to send to the protocol and port on the Syslog Collector: Auto-Detect (default), CEF, LEEF, CISCO, CORELIGHT, or RAW.</p><p>CORELIGHT is not available for a UDP protocol.</p> Vendor and Product Enter a particular vendor and product for the Syslog format defined or leave the default Auto-Detect setting. Source Network Specify the IP address or Classless Inter-Domain Routing (CIDR). If you leave this blank, Cortex XSIAM will allow receipt of logs from any source IP address or CIDR that transmits over the specified protocol and port. When you specify overlapping addresses in the Source Network field in multiple rows, such as 10.0.0.10 in the first row and 10.0.0.0/24 in the second row, the order of the addresses matter. In this example, the IP address 10.0.0.10 is only captured from the first row definition. For more information on prioritizing the order of the syslog formats, see Task 5. After each configuration, select to save the changes and then Done to update the Syslog Collector with your settings.
Task 5. Make additional changes to the Syslog Collector data sources configured
- To remove a Syslog Collector data source, right-click the row after the Port/Protocol entry and select Remove.
- To prioritize the order of the Syslog formats listed for the protocols and ports configured, drag and drop the rows to the order you require.
Task 6. Save the Syslog Collector settings
Click Save. After a successful activation, the APPS field displays Syslog with a green dot indicating a successful connection.
Task 7. (Optional) View metrics about the Syslog Collector
To view metrics about the Syslog Collector, left-click the Syslog connection in the APPS field for your Broker VM. Cortex XSIAM displays the following information:
| Metric | Description |
|---|---|
| Connectivity Status | Whether the applet is connected to Cortex XSIAM. |
| Logs Received and Logs Sent | Number of logs received and sent by the applet per second over the last 24 hours. If the number of incoming logs received is larger than the number of logs sent, it could indicate a connectivity issue. |
| Resources | Displays the amount of CPU, Memory, and Disk space the applet is using. |
Task 8. Manage the Syslog Collector
After the Syslog Collector has been activated, you can make additional changes to your configuration if needed. To modify a configuration, left-click the Syslog connection in the APPS column to display the Syslog Collector settings, and select:
- Configure to redefine the Syslog configurations.
- Deactivate to disable the Syslog Collector.
Ingest logs from a Syslog receiver
Cortex XSIAM can receive Syslog from a variety of supported vendors (see Syslog Collector applet). In addition, Cortex XSIAM can receive Syslog from additional vendors that use CEF, LEEF, CISCO, CORELIGHT, or RAW formatted over Syslog.External data ingestion vendor support
After Cortex XSIAM begins receiving logs from the third-party source, Cortex XSIAM automatically parses the logs in CEF, LEEF, CISCO, CORELIGHT, or RAW format and creates a dataset with the name <vendor>_<product>_raw. You can then use XQL Search queries to view logs and create new IOC, BIOC, and Correlation Rules.
To receive Syslog from an external source:
- Set up your Syslog receiver to forward logs.
- Activate the Syslog collector applet on a Broker VM within your network. For more information, see Activate the Syslog Collector.
- Use the XQL Search to search your logs.
Check Point FW1 VPN1
You can configure collecting Check Point FW1/VPN1 logs using a Broker VM Syslog Collector applet or with a content pack integration:
| Check Point FW1/VPN1 vendor | Description |
|---|---|
| Syslog Collector applet overview | If you use Check Point FW1/VPN1 firewalls, you can forward Check Point firewall logs to Cortex XSIAM using the Broker VM Syslog Collector applet in a CEF format. |
| Link to Syslog Collector applet instructions | Ingest logs from Check Point firewalls |
| Link to content pack/integration details | <p>The Check Point Firewall content pack manages Check Point firewall devices via API, allowing the reading information, sending commands, and orchestrating configuration and blocking actions. It contains a modeling rule (CheckPoint Firewall Collection) and several playbooks (for example Checkpoint - Block IP - Append Group, Checkpoint - Publish&Install configuration, Checkpoint - Block IP - Custom Block Rule, and Checkpoint - Block URL). It also includes the following integration:</p><ul><li>CheckPoint Firewall v2: Use this integration to read information and send commands to the Check Point Firewall server. It includes commands for handling threat protection and profiles, such as checkpoint-set-threat-protection and checkpoint-add-threat-profile.</li></ul> |
Ingest logs from Check Point firewalls
If you use Check Point FW1/VPN1 firewalls, you can still take advantage of Cortex XSIAM investigation and detection capabilities by forwarding your Check Point firewall logs to Cortex XSIAM. Check Point firewall logs can be used as the sole data source, however, you can also use Check Point firewall logs in conjunction with Palo Alto Networks firewall logs and additional data sources.
Cortex XSIAM can stitch data from Check Point firewalls with other logs to make up network stories searchable in the Query Builder and in Cortex Query Language (XQL) queries. Cortex XSIAM can also return raw data from Check Point firewalls in XQL queries.
- Logs with
sessionid = 0are dropped. - Destination Port data is available only in the raw logs
In terms of alerts, Cortex XSIAM can both surface native Check Point firewall alerts and generate its own issues on network activity. Issues are displayed throughout Cortex XSIAM issue, case, and investigation views.
To integrate your logs, you first need to set up an applet in a Broker VM within your network to act as a Syslog Collector. You then configure your Check Point firewall policy to log all traffic and set up the Log Exporter on your Check Point Log Server to forward logs to the Syslog Collector in a CEF format.
When Cortex XSIAM starts to receive logs, the app can begin stitching network connection logs with other logs to form network stories. Cortex XSIAM can also analyze your logs to generate Analytics issues, and can apply IOC, BIOC, and Correlation Rule matching. You can also use queries to search your network connection logs.
- Ensure that your Check Point firewalls meet the following requirements. Check Point software version: R77.30, R80.10, R80.20, R80.30, or R80.40
- Increase log storage for Check Point firewall logs. As an estimate for initial sizing, note that the average Check Point log size is roughly 700 bytes. For proper sizing calculations, test the log sizes and log rates produced by your Check Point firewalls. For more information, see Manage Your Log Storage within Cortex XSIAM.
- Activate the Syslog Collector.
- Configure the Check Point firewall to forward Syslog events in CEF format to the Syslog Collector. Configure your firewall policy to log all traffic and set up the Log Exporter to forward logs to the Syslog Collector. For more information on setting up Log Exporter, see the Check Point documentation.
Cisco ASA firewalls and AnyConnect
You can configure collecting Cisco ASA firewall and AnyConnect VPN logs using a Broker VM Syslog Collector applet or with a content pack integration:
| Cisco ASA firewalls and AnyConnect vendor | Description |
|---|---|
| Syslog Collector applet overview | If you use Cisco ASA firewalls or Cisco AnyConnect VPN, you can forward Cisco ASA firewall and AnyConnect VPN logs to Cortex XSIAM using the Broker VM Syslog Collector applet in a CISCO format. |
| Link to Syslog Collector applet instructions | Ingest logs from Cisco ASA firewalls and AnyConnect |
| Link to content pack/integration instructions | <p>The Cisco ASA content pack interacts with the Cisco Adaptive Security Appliance Software via an API to manage interfaces, rules, and network objects. The content pack includes the following integration:</p><ul><li>Cisco Adaptive Security Appliance Software: Use this integration to manage interfaces, rules, and network objects on the Cisco Adaptive Security Appliance Software platform. This integration includes commands for listing and managing network object groups, local user groups, local users, time ranges, security object groups, user objects, interface information, configuration backup, and creating, listing, getting, editing, and deleting firewall rules, along with the command to save the running configuration to memory (cisco-asa-write-memory).</li></ul> |
Ingest logs from Cisco ASA firewalls and AnyConnect
If you use Cisco ASA firewalls or Cisco AnyConnect VPN, you can take advantage of Cortex XSIAM investigation and detection capabilities by forwarding your firewall and AnyConnect VPN logs to Cortex XSIAM. This enables Cortex XSIAM to examine your network traffic to detect anomalous behavior. Cortex XSIAM can use Cisco ASA firewall logs and AnyConnect VPN logs as the sole data source, but can also use Cisco ASA firewall logs in conjunction with Palo Alto Networks firewall logs. For additional endpoint context, you can also use Cortex XSIAM to collect and alert on endpoint data.
When Cortex XSIAM starts to receive logs, the app can begin stitching network connection logs with other logs to form network stories. Cortex XSIAM can also analyze your logs to generate Analytics issues, and can apply IOC, BIOC, and Correlation Rules matching. You can also use queries to search your network connection logs using the Cisco Cortex Query Language (XQL) dataset (cisco_asa_raw).
To integrate your logs, you first need to set up an applet in a Broker VM within your network to act as a Syslog Collector. You then configure forwarding on your log devices to send logs to the Syslog Collector in a CISCO format.
- Verify that your Cisco ASA firewall and Cisco AnyConnect VPN logs meet the following requirements.
- Syslog in Cisco-ASA format
- Must include
timestamps - Only supports the following messages.
- For Cisco ASA firewall: 302013, 302014, 302015, 302016
- For Cisco AnyConnect VPN: 113039, 716001, 722022, 722033, 722034, 722051, 722055, 722053, 113019, 716002, 722023, 722037
- Activate the Syslog Collector.
- Increase log storage for Cisco ASA firewall and Cisco AnyConnect VPN logs. As an estimate for initial sizing, note that the average Cisco ASA log size is roughly 180 bytes. For proper sizing calculations, test the log sizes and log rates produced by your Cisco ASA firewalls and Cisco AnyConnect VPN logs. For more information, see Manage Your Log Storage within Cortex XSIAM.
- Configure the Cisco ASA firewall and Cisco AnyConnect VPN, or the log devices forwarding logs from Cisco, to log to the Syslog Collector in a CISCO format.\
Configure your firewall and AnyConnect VPN policies to log all traffic and forward the traffic logs to the Syslog Collector in a CISCO format. By logging all traffic, you enable Cortex XSIAM to detect anomalous behavior from Cisco ASA firewall logs and Cisco AnyConnect VPN logs. For more information on setting up Log Forwarding on Cisco ASA firewalls or Cisco AnyConnect VPN, see the Cisco ASA Series documentation.
Corelight Zeek
You can configure collecting Corelight Zeek logs using a Broker VM Syslog Collector applet or with a content pack integration:
| Corelight Zeek vendor | Description |
|---|---|
| Syslog Collector applet overview | If you use Corelight Zeek sensors for network monitoring, you can forward network connection logs to Cortex XSIAM using the Broker VM Syslog Collector applet with TCP as the transport Protocol and a Corelight format. |
| Link to Syslog Collector applet instructions | Ingest logs from Corelight Zeek |
| Link to content pack/integration details | The Corelight Zeek content pack provides data normalization capabilities through rules for parsing and modeling network protocol logs that are ingested via a Syslog collector on the Broker VM into Cortex XSIAM. It includes Corelight Zeek Modeling Rules and Corelight Zeek Parsing Rules. |
Ingest logs from Corelight Zeek
If you use Corelight Zeek sensors for network monitoring, you can still take advantage of Cortex XSIAM investigation and detection capabilities by forwarding your network connection logs to Cortex XSIAM. This enables Cortex XSIAM to examine your network traffic to detect anomalous behavior. Cortex XSIAM can use Corelight Zeek logs as the sole data source, but can also use logs in conjunction with Palo Alto Networks or third-party firewall logs. For additional endpoint context, you can also use Cortex XSIAM to collect and alert on endpoint data.
As soon as Cortex XSIAM starts to receive logs, the app can begin stitching network connection logs with other logs to form network stories. Cortex XSIAM can also analyze your logs to generate Analytics issues, and can apply IOC, BIOC, and Correlation Rule matching. You can also use queries to search your network connection logs.
To integrate your logs, you first need to set up an applet in a Broker VM within your network to act as a Syslog Collector. You then configure forwarding on your Corelight Zeek sensors (using the default Syslog export option of RFC5424 over TCP) to send logs to the Syslog Collector.
- Activate the Syslog Collector. During activation, you define the Listening Port over which you want the Syslog Collector to receive logs. You must also set TCP as the transport Protocol and Corelight as the Syslog Format.
- Increase log storage for Corelight Zeek logs. For proper sizing calculations, test the log sizes and log rates produced by your Corelight Zeek Sensors. Then adjust your Cortex XSIAM log storage. For more information, see Manage Your Log Storage within Cortex XSIAM.
- Forward logs to the Syslog Collector.Cortex XSIAM can receive logs from Corelight Zeek sensors that use the Syslog export option of RFC5424 over TCP.
- In the Syslog configuration of Corelight Zeek (Sensor → Export), specify the details for your Syslog Collector including the hostname or IP address of the Broker VM and corresponding listening port that you defined during activation of the Syslog Collector, default Syslog format (RFC5424), and any log exclusions or filters.
- Save your Syslog configuration to apply the configuration to your Corelight Zeek Sensors. For full setup instructions, see the Corelight Zeek documentation.
Forcepoint DLP
You can configure collecting Corelight Zeek logs using a Broker VM Syslog Collector applet or with a content pack integration:
| Forcepoint DLP vendor | Description |
|---|---|
| Syslog Collector applet overview | If you use Forcepoint DLP to prevent data loss over endpoint channels, you can forward logs to Cortex XSIAM using the Broker VM Syslog Collector applet in a CEF or LEEF format. |
| Link to Syslog Collector applet instructions | Ingest logs from Forcepoint DLP |
| Link to content pack/integration details | <p>The Forcepoint DLP content pack fetches security incidents from Forcepoint DLP and ingests them as events into Cortex XSIAM for processing and analysis. contains the Forcepoint DLP Modeling Rule, and the Forcepoint DLP Parsing Rule. It also includes the following integration:</p><ul><li>Forcepoint DLP Event Collector (Beta): Use this integration to fetch security incidents from Forcepoint DLP as Cortex XSIAM events. This integration is an event collector and utilizes parsing and modeling rules within the content pack for data normalization.</li></ul> |
Ingest logs from Forcepoint DLP
If you use Forcepoint DLP to prevent data loss over endpoint channels, you can take advantage of Cortex XSIAM investigation and detection capabilities by forwarding your logs to Cortex XSIAM. This enables Cortex XSIAM to help you expand visibility into data violation by users and hosts in the organization, correlate and detect DLP incidents, and query Forcepoint DLP logs using XQL Search.
When Cortex XSIAM starts to receive logs, Cortex XSIAM can analyze your logs in XQL Search and you can create new Correlation Rules.
To integrate your logs, you first need to set up an applet in a Broker VM within your network to act as a Syslog Collector. You then configure forwarding on your log devices to send logs to the Syslog Collector in a CEF or LEEF format.
Configure Forcepoint DLP collection in Cortex XSIAM.
- Verify that your Forcepoint DLP meet the following requirements.
- Must use version 8.8.0.347 or a later release.
- On premise installation only.
- Activate the Syslog Collector applet on a Broker VM in your network. Ensure the Broker VM is configured with the following settings.
- Format: Select either a CEF or LEEF Syslog format.
- Vendor: Specify the Vendor as
forcepoint. - Product: Specify the Product as
dlp_endpoint.
- Increase log storage for Forcepoint DLP logs. As an estimate for initial sizing, note the average Forcepoint DLP log size. For proper sizing calculations, test the log sizes and log rates produced by your Forcepoint DLP. For more information, see Manage Your Log Storage.
- Configure the log device that receives Forcepoint DLP logs to forward syslog events to the Syslog Collector in a CEF or LEEF format. For more information, see the Forcepoint DLP documentation.
- After Cortex XSIAM begins receiving data from Forcepoint DLP, you can use XQL Search to search your logs using the
forcepoint_dlp_endpointdataset.
Fortinet Fortigate
You can configure collecting Fortinet Fortigate firewall logs using a Broker VM Syslog Collector applet or with a content pack integration:
| Fortinet Fortigate vendor | Description |
|---|---|
| Syslog Collector applet overview | If you use Fortinet Fortigate firewalls, you can forward network connection logs to Cortex XSIAM using the Broker VM Syslog Collector applet in a CEF format. |
| Link to Syslog Collector applet instructions | Ingest logs from Fortinet Fortigate firewalls |
| Links to content pack/integration details | <ul><li><p>The FortiManager content pack enables managing Fortinet devices through a single console central management system and provides data normalization for FortiManager event logs ingested via Syslog into Cortex XSIAM. It contains the Fortinet FortiManager Modeling Rule, the Fortinet FortiManager Parsing Rule, and the FortiManager - Install Policy Package on Device playbook. It also includes the following integration:</p><ul><li>FortiManager: Use this integration to manage Fortinet devices as a single console central management system. This integration enables executing the FortiManager - Install Policy Package on Device playbook, which installs a FortiManager firewall policy package on a given device.</li></ul></li><li><p>The FortiGate content pack manages FortiGate firewalls, delivering convergence and deep security visibility across diverse network environments, and facilitating data normalization for ingested event logs. It contains the Fortinet FortiGate Modeling Rule, and the FortiGate Parsing Rule. It also includes the following integration:</p><ul><li>FortiGate: Use this integration to manage Fortinet FortiGate firewall devices, leveraging the Fortinet FortiOS operating system to provide deep visibility and consistent security across environments like remote offices, campuses, and data centers. It includes commands for listing, creating, updating, moving, and deleting firewall policies, addresses (IPv4 and IPv6, including multicasts), and service groups, alongside functionalities like banning and unbanning IPs.</li></ul></li></ul> |
Ingest logs from Fortinet Fortigate firewalls
If you use Fortinet Fortigate firewalls, you can still take advantage of Cortex XSIAM investigation and detection capabilities by forwarding your firewall logs to Cortex XSIAM . This enables Cortex XSIAM to examine your network traffic to detect anomalous behavior. Cortex XSIAM can use Fortinet Fortigate firewall logs as the sole data source, but can also use Fortinet Fortigate firewall logs in conjunction with Palo Alto Networks firewall logs. For additional endpoint context, you can also use Cortex XSIAM to collect and alert on endpoint data.
When Cortex XSIAM starts to receive logs, the app can begin stitching network connection logs with other logs to form network stories. Cortex XSIAM can also analyze your logs to generate Analytics issues, and can apply IOC, BIOC, and Correlation Rule matching. You can also use queries to search your network connection logs.
To integrate your logs, you first need to set up an applet in a Broker VM within your network to act as a Syslog collector. You then configure forwarding on your log devices to send logs to the Syslog collector in a CEF format.
- Verify that your Fortinet Fortigate firewalls meet the following requirements.
- Must use FortiOS 6.2.1 or a later release
timestampmust be in nanoseconds
- Activate the Syslog Collector.
-
Increase log storage for Fortinet Fortigate firewall logs.
As an estimate for initial sizing, note that the average Fortinet Fortigate log size is roughly 1,070 bytes. For proper sizing calculations, test the log sizes and log rates produced by your Fortinet Fortigate firewalls. For more information, see Manage Your Log Storage within Cortex XSIAM.
-
Configure the log device that receives Fortinet Fortigate firewall logs to forward Syslog events to the Syslog collector in a CEF format.
Configure your firewall policy to log all traffic and forward the traffic logs to the Syslog collector in a CEF format. By logging all traffic, you enable Cortex XSIAM to detect anomalous behavior from Fortinet Fortigate firewall logs. For more information on setting up Log Forwarding on Fortinet Fortigate firewalls, see the Fortinet FortiOS documentation.
Next Generation Firewall
You can configure collecting Next-Generation Firewall logs and data using an integration configured in Data Sources & Integrations or from Marketplace:
| Next-Generation Firewall | Description |
|---|---|
| Data Source overview | You can forward firewall data from your Next-Generation Firewall (NGFW) and Panorama devices to Cortex XSIAM. |
| Link to Data Source instructions | <ul><li>Ingest data from Next-Generation Firewall</li><li>Ingest Next-Generation Firewall logs using the Syslog Collector</li></ul> |
| Links to content pack/integration details | <p>The PAN-OS by Palo Alto Networks content pack manages Palo Alto Networks Firewalls and Panorama via API, allowing users to create, modify, and manage custom security policies, perform configuration commits, manage dynamic lists, perform system upgrades, and query various log types. It contains various playbooks, a classifier (Panorama Classifier) and mapper (Panorama Mapper), issue fields, issue types, and automations/scripts. It also includes the following integration:</p><ul><li>Palo Alto Networks PAN-OS: Use this integration to manage Palo Alto Networks Firewall and Panorama, including managing Prisma Access through Panorama, creating and managing security policies, and querying logs. This integration includes commands for managing the master key, checking dynamic updates status, downloading and installing various dynamic updates (for example, AntiVirus, WildFire, GlobalProtect Clientless VPN), listing and deleting policy rules (including new types like application-override, authentication, decryption, nat, and pbf), managing addresses and URL categories, retrieving rule hit counts, disabling rules, and performing hygiene checks on various security profiles and configurations.</li></ul> |
Ingest Next-Generation Firewall logs using the Syslog Collector
Use the Syslog collector to ingest Next-Generation Firewall (NGFW) logs in CEF format. This method is useful when your firewalls are located in a different region, or bandwidth issues are encountered due to large log size. When possible, we recommend that you ingest NGFW logs using the dedicated Next-Generation Firewall data collector instead of the Syslog collector.
In the following procedure, general information is provided for NGFW and Panorama. For detailed instructions, consult the documentation for your specific devices and Panorama version, to ensure that you have configured log forwarding correctly for all the log types that you would like to forward to Cortex XSIAM. The following steps only cover configuration of the custom log schema (CEF) for a given syslog server. They do not replace the administrator guide’s configuration coverage of log forwarding.
Configure the firewall/Panorama for log forwarding to Cortex XSIAM
- To configure the device to include its IP address in the header of Syslog messages, select Panorama/Device → Setup → Management, click the Edit icon in the Logging and Reporting Settings section, and navigate to the Log Export and Reporting tab.
- From the Syslog HOSTNAME Format menu, select ipv4-address or ipv6-address, and click OK.
- Select Device → Server Profiles → Syslog, and click Add.
- Enter a server profile Name and Location (Location refers to a virtual system, if the device is enabled for virtual systems).
- On the Servers tab of the Syslog Server Profiles window, click Add, and enter the following information for the Syslog server:
- Name
- Syslog Server (IP address)
- Transport, Port (default 514 for UDP)
- Facility (default LOG_USER)
-
Select the Custom Log Format tab and click configure the log formats as follows:
To avoid the possible effects of line formatting, do not copy/paste the message formats directly into the PAN-OS web interface. Instead, paste into a text editor, remove any carriage return or line feed characters, and then copy and paste into the web interface.
From version 10.0 and later, the log format documented for log types (Traffic, Threat, and URL) exceeds the maximum supported 2048 characters in the Custom Log Format tab on the firewall and Panorama. Select the CEF keys and values to limit the number of characters to 2048, as per your requirements.
Log Type Custom Format Traffic CEF:0|PANW|NGFW_CEF|$sender_sw_version|$subtype|$type|1| __firewall_type=firewall.traffic __timestamp=$start __tz=$high_res_timestamp log_type=$type subtype=$subtype log_time=$cef-formatted-receive_time time_generated=$cef-formatted-time_generated log_source_id=$serial log_source_name=$device_name sequence_no=$seqno source_ip=$src dest_ip=$dst source_port=$sport dest_port=$dport nat_source=$natsrc nat_dest=$natdst nat_source_port=$natsport nat_dest_port=$natdport protocol=$proto action=$action source_user=$srcuser dest_user=$dstuser xff_ip=$xff_ip app=$app app_category=$category_of_app app_sub_category=$subcategory_of_app rule_matched=$rule rule_matched_uuid=$rule_uuid severity=1 vsys=$vsys vsys_name=$vsys_name from_zone=$from to_zone=$to inbound_if=$inbound_if outbound_if=$outbound_if session_id=$sessionid source_device_category=$src_category source_device_profile=$src_profile source_device_model=$src_model source_device_vendor=$src_vendor source_device_osfamily=$src_osfamily source_device_osversion=$src_osversion source_device_mac=$src_mac dest_device_category=$dst_category dest_device_profile=$dst_profile dest_device_model=$dst_model dest_device_vendor=$dst_vendor dest_device_osfamily=$dst_osfamily dest_device_osversion=$dst_osversion dest_device_mac=$dst_mac bytes_sent=$bytes_sent bytes_received=$bytes_received packets_received=$pkts_received packets_sent=$pkts_sent total_time_elapsed=$elapsed session_end_reason=$session_end_reason url_category=$category Threat CEF:0|PANW|NGFW_CEF|$sender_sw_version|$threatid|$type|$number-of-severity| __firewall_type=firewall.threat __timestamp=$cef-formatted-time_generated __tz=$high_res_timestamp log_type=$type subtype=$subtype log_time=$cef-formatted-receive_time time_generated=$cef-formatted-time_generated log_source_id=$serial log_source_name=$device_name sequence_no=$seqno source_ip=$src dest_ip=$dst source_port=$sport dest_port=$dport nat_source=$natsrc nat_dest=$natdst nat_source_port=$natsport nat_dest_port=$natdport protocol=$proto action=$action source_user=$srcuser dest_user=$dstuser xff=$xff xff_ip=$xff_ip app=$app app_category=$category_of_app app_sub_category=$subcategory_of_app rule_matched=$rule rule_matched_uuid=$rule_uuid severity=$number-of-severity vsys=$vsys vsys_name=$vsys_name from_zone=$from to_zone=$to inbound_if=$inbound_if outbound_if=$outbound_if session_id=$sessionid source_device_category=$src_category source_device_profile=$src_profile source_device_model=$src_model source_device_vendor=$src_vendor source_device_osfamily=$src_osfamily source_device_osversion=$src_osversion source_device_mac=$src_mac dest_device_category=$dst_category dest_device_profile=$dst_profile dest_device_model=$dst_model dest_device_vendor=$dst_vendor dest_device_osfamily=$dst_osfamily dest_device_osversion=$dst_osversion dest_device_mac=$dst_mac misc=$misc threat_id=$threatid threat_name=$threat_name threat_category=$thr_category direction=$direction user_agent=$user_agent URL CEF:0|PANW|NGFW_CEF|$sender_sw_version|$subtype|$type|$number-of-severity| __firewall_type=firewall.url __timestamp=$cef-formatted-time_generated __tz=$high_res_timestamp log_type=$type subtype=$subtype log_time=$cef-formatted-receive_time time_generated=$cef-formatted-time_generated log_source_id=$serial log_source_name=$device_name sequence_no=$seqno source_ip=$src dest_ip=$dst source_port=$sport dest_port=$dport nat_source=$natsrc nat_dest=$natdst nat_source_port=$natsport nat_dest_port=$natdport protocol=$proto action=$action source_user=$srcuser dest_user=$dstuser xff=$xff xff_ip=$xff_ip app=$app app_category=$category_of_app app_sub_category=$subcategory_of_app rule_matched=$rule rule_matched_uuid=$rule_uuid severity=$number-of-severity vsys=$vsys vsys_name=$vsys_name from_zone=$from to_zone=$to inbound_if=$inbound_if outbound_if=$outbound_if session_id=$sessionid source_device_category=$src_category source_device_profile=$src_profile source_device_model=$src_model source_device_vendor=$src_vendor source_device_osfamily=$src_osfamily source_device_osversion=$src_osversion source_device_mac=$src_mac dest_device_category=$dst_category dest_device_profile=$dst_profile dest_device_model=$dst_model dest_device_vendor=$dst_vendor dest_device_osfamily=$dst_osfamily dest_device_osversion=$dst_osversion dest_device_mac=$dst_mac uri=$misc threat_id=$threatid threat_name=$threat_name threat_category=$thr_category direction=$direction user_agent=$user_agent url_category=$category url_category_list=$url_category_list content_type=$contenttype http_method=$http_method http_headers=$http_headers http2_connection=$http2_connection referer=$referer pcap_id=$pcap_id File Data CEF:0|PANW|NGFW_CEF|$sender_sw_version|$threatid|$type|$number-of-severity| __firewall_type=firewall.filedata __timestamp=$cef-formatted-time_generated __tz=$high_res_timestamp log_type=$type subtype=$subtype log_time=$cef-formatted-receive_time time_generated=$cef-formatted-time_generated log_source_id=$serial log_source_name=$device_name sequence_no=$seqno source_ip=$src dest_ip=$dst source_port=$sport dest_port=$dport nat_source=$natsrc nat_dest=$natdst nat_source_port=$natsport nat_dest_port=$natdport protocol=$proto action=$action source_user=$srcuser dest_user=$dstuser xff=$xff xff_ip=$xff_ip app=$app app_category=$category_of_app app_sub_category=$subcategory_of_app rule_matched=$rule rule_matched_uuid=$rule_uuid severity=$number-of-severity vsys=$vsys vsys_name=$vsys_name from_zone=$from to_zone=$to inbound_if=$inbound_if outbound_if=$outbound_if session_id=$sessionid source_device_category=$src_category source_device_profile=$src_profile source_device_model=$src_model source_device_vendor=$src_vendor source_device_osfamily=$src_osfamily source_device_osversion=$src_osversion source_device_mac=$src_mac dest_device_category=$dst_category dest_device_profile=$dst_profile dest_device_model=$dst_model dest_device_vendor=$dst_vendor dest_device_osfamily=$dst_osfamily dest_device_osversion=$dst_osversion dest_device_mac=$dst_mac misc=$misc threat_id=$threatid threat_name=$threat_name threat_category=$thr_category direction=$direction user_agent=$user_agent file_url=$file_url filedigest=$filedigest filetype=$filetype pcap_id=$pcap_id -
Configure Escaping characters as follows:
- Escaped Characters: \=
- Escape Character: \
Configure Syslog collection
Set up a Syslog collector for the logs, as explained in Activate Syslog Collector. In Task 4, ensure that you set Format to CEF.
PingFederate
You can configure collecting PingFederate authentication logs using a Broker VM Syslog Collector applet:
| PingFederate vendor | Description |
|---|---|
| Syslog Collector applet overview | Forward authentication logs from PingFederate to Cortex XSIAM using the Broker VM Syslog Collector applet in a CEF format. |
| Link to Syslog Collector applet instructions | Ingest authentication logs from PingFederate |
Ingest authentication logs from PingFederate
To receive authentication logs from PingFederate, you must first write Audit and Provisioner Audit Logs to CEF in PingFederate and then set up a Syslog Collector in Cortex XSIAM to receive the logs. After you set up log collection, Cortex XSIAM immediately begins receiving new authentication logs from the source. Cortex XSIAM creates a dataset named ping_identity_pingfederate_raw. Logs from PingFederate are searchable in Cortex Query Language (XQL) queries using the dataset and surfaced, when relevant, in authentication stories.
- Activate the Syslog Collector.
- Set up PingFederate to write logs in CEF. To set up the integration, you must have an account for the PingFederate management dashboard and access to create a subscription for SSO logs. In your PingFederate deployment, write audit logs in CEF. During this set up you will need the IP address and port you configured in the Syslog Collector.
- To search for specific authentication logs or data, you can Create an Authentication Query or use the XQL Search.
Zscaler Internet Access
You can configure collecting Zscaler Internet Access logs using a Broker VM Syslog Collector applet or with a content pack integration:
| Zscaler Internet Access vendor | Description |
|---|---|
| Syslog Collector applet overview | Forward firewall and network logs to Cortex XSIAM from Zscaler Internet Access using the Broker VM Syslog Collector applet in a CEF format. |
| Link to Syslog Collector applet instructions | Ingest logs from Zscaler Internet Access |
| Links to content pack/integration details | <p>The Zscaler Internet Access content pack provides Cloud security features, including managing URL and IP address policies, managing categories, sandbox reporting, and ingestion and normalization of Zscaler Internet Access (ZIA) logs into Cortex XSIAM via both VM-based NSS Feed and Cloud NSS Feed methods. It contains the Zscaler Internet Access Modeling Rule, the Zscaler ZIA Parsing Rule, and the Block Domain - Zscaler playbook. It also includes the following integration:</p><ul><li>Zscaler Internet Access: Use this integration to manage URL and IP address allow lists and block lists, manage and update categories, retrieve Sandbox reports, and manage IP destination groups within a Zscaler session. It includes commands for blacklisting and unblacklisting URLs and IPs, managing categories (adding/removing URLs and IPs), retrieving categories, listing, creating, editing, and deleting IP destination groups, manually logging in and logging out, and activating configuration changes in Zscaler.</li></ul> |
Ingest logs from Zscaler Internet Access
If you use Zscaler Internet Access (ZIA) in your network, you can forward your firewall and network logs to Cortex XSIAM for analysis. This enables you to take advantage of Cortex XSIAM anomalous behavior detection and investigation capabilities. Cortex XSIAM can use the firewall and network logs from ZIA as the sole data source, and can also use these firewall and network logs from ZIA in conjunction with Palo Alto Networks firewall and network logs. For additional endpoint context, you can also use Cortex XSIAM to collect and alert on endpoint data.
To integrate your logs, you first need to set up an applet in a broker VM within your network to act as a Syslog Collector. You then configure forwarding on your log devices to send logs to the Syslog collector in a CEF format. To provide seamless log ingestion, Cortex XSIAM automatically maps the fields in your traffic logs to the Cortex XSIAM log format.
When Cortex XSIAM starts to receive logs, the app performs these actions.
- Begins stitching network connection and firewall logs with other logs to form network stories. Cortex XSIAM can also analyze your logs to generate Analytics issues and can apply IOC, BIOC, and Correlation Rule matching. You can also use queries to search your network connection logs.
- Creates a Zscaler Cortex Query Language (XQL) dataset, which enables you to search the logs using XQL Search. The Zscaler XQL datasets are dependent on the ZIA NSS Feed that you've configured for the types of logs you want to collect.
- Firewall logs:
zscaler_nssfwlog_raw - Web logs:
zscalar_nssweblog_raw
- Firewall logs:
To ingest logs from Zscaler Internet Access (ZIA):
- Activate the Syslog Collector.
- Increase log storage for ZIA logs. For more information, see Manage Your Log Storage.
- Configure NSS log forwarding in Zscaler Internet Access to the Syslog Collector in a CEF format.
- In the Zscaler Internet Access application, select Administration → Nanolog Streaming Service.
- In the NSS Feeds tab, Add NSS Feed.
-
In the Add NSS Feed screen, configure the fields for the Cortex XSIAM Syslog Collector.
The steps below differ depending on the type of NSS Feed you are configuring to collect either firewall logs or web logs. For more information on all the configurations available on the screen, see the ZIA documentation:
- Firewall logs: See Adding NSS Feeds for Firewall Logs.
- Web logs: See Adding NSS Feeds for Web Logs.
The following image displays the fields required to add an NSS feed.
- NSS Type: Select either NSS for Web (default) to collect web logs or NSS for Firewall to collect firewall logs.
- SIEM TCP Port: Specify the port that you set when activating the Syslog Collector in Cortex XSIAM. See Activate the Syslog Collector.
- SIEM IP Address: Specify the IP that you set when activating the Syslog Collector in Cortex XSIAM. See Activate the Syslog Collector.
- Feed Escape Character: Specify the feed escape character as
=. - Feed Output Type: Select Custom.
-
Feed Output Format: Specify the output format, which is dependent on the type of logs you are collecting as defined in the NSS Type field:
Log type Feed output format Firewall logs %s{mon} %02d{dd} %02d{hh}:%02d{mm}:%02d{ss} zscaler-nss-fw CEF:0\|Zscaler\|NSSFWlog\|5.7\|%s{action}\|%s{rulelabel}\|3\|act=%s{action} suser=%s{login} src=%s{csip} spt=%d{csport} dst=%s{cdip} dpt=%d{cdport} deviceTranslatedAddress=%s{ssip} deviceTranslatedPort=%d{ssport} destinationTranslatedAddress=%s{sdip} destinationTranslatedPort=%d{sdport} sourceTranslatedAddress=%s{tsip} sourceTranslatedPort=%d{tsport} proto=%s{ipproto} tunnelType=%s{ttype} dnat=%s{dnat} stateful=%s{stateful} spriv=%s{location} reason=%s{rulelabel} in=%ld{inbytes} out=%ld{outbytes} rt=%s{mon} %02d{dd} %02d{hh}:%02d{mm}:%02d{ss} deviceDirection=1 cs1=%s{dept} cs1Label=dept cs2=%s{nwsvc} cs2Label=nwService cs3=%s{nwapp} cs3Label=nwApp cs4=%s{aggregate} cs4Label=aggregated cs6=%s{threatname} cs6label=threatname cn1=%d{durationms} cn1Label=durationms cn2=%d{numsessions} cn2Label=numsessions cs5Label=ipCat cs5=%s{ipcat} cat=%s{threatcat} destCountry=%s{destcountry} avgduration=%d{avgduration}Web logs %s{mon} %02d{dd} %02d{hh}:%02d{mm}:%02d{ss} zscaler-nss CEF:0\|Zscaler\|NSSWeblog\|5.0\|%s{action}\|%s{reason}\|3\|act=%s{action} app=%s{proto} cat=%s{urlcat} dhost=%s{ehost} dst=%s{sip} src=%s{cip} in=%d{respsize} outcome=%s{respcode} out=%d{reqsize} request=%s{eurl} rt=%s{mon} %02d{dd} %d{yy} %02d{hh}:%02d{mm}:%02d{ss} sourceTranslatedAddress=%s{cintip} requestClientApplication=%s{ua} requestMethod=%s{reqmethod} suser=%s{login} spriv=%s{location} externalId=%d{recordid} fileType=%s{filetype} reason=%s{reason} destinationServiceName=%s{appname} cn1=%d{riskscore} cn1Label=riskscore cs1=%s{dept} cs1Label=dept cs2=%s{urlsupercat} cs2Label=urlsupercat cs3=%s{appclass} cs3Label=appclass cs4=%s{malwarecat} cs4Label=malwarecat cs5=%s{threatname} cs5Label=threatname cs6=%s{dlpeng} cs6Label=dlpeng ZscalerNSSWeblogURLClass=%s{urlclass} ZscalerNSSWeblogDLPDictionaries=%s{dlpdict} requestContext=%s{ereferer} contenttype=%s{contenttype} unscannabletype=%s{unscannabletype} deviceowner=%s{deviceowner} devicehostname=%s{devicehostname}\n
- Click Save.
- Click Save and activate the change according to the Zscaler Internet Access (ZIA) documentation.
Zscaler Private Access
You can configure collecting Zscaler Private Access logs using a Broker VM Syslog Collector applet or with a content pack integration:
| Zscaler Private Access vendor | Description |
|---|---|
| Syslog Collector applet overview | If you use Zscaler Private Access (ZPA) in your network as an alternative to VPNs, you can forward your network logs to Cortex XSIAM from Zscaler Private Access using the Broker VM Syslog Collector applet in a LEEF format. |
| Link to Syslog Collector applet instructions | Ingest logs from Zscaler Private Access |
| Link to content pack/integration instructions | The ZscalerZPA content pack provides data modeling capabilities for event logs ingested from the Zscaler Private Access (ZPA) service, which enables secure access to internal applications and services. It includes the Zscaler Private Access Modeling Rule. Event collection relies on configuring the generic Syslog Collector on the Broker VM. |
Ingest logs from Zscaler Private Access
If you use Zscaler Private Access (ZPA) in your network as an alternative to VPNs, you can forward your network logs to Cortex XSIAM for analysis. This enables you to take advantage of Cortex XSIAM anomalous behavior detection and investigation capabilities. Cortex XSIAM can use the network logs from ZPA as the sole data source, and can also use these network logs from ZPA in conjunction with Palo Alto Networks network logs.
When Cortex XSIAM starts to receive logs, the following actions are performed:
- Stitching network connection logs with other logs to form network stories. Cortex XSIAM can also analyze your logs to apply IOC, BIOC, and Correlation Rules matching. You can also use queries to search your network connection logs.
- Creates a Zscaler Cortex Query Language (XQL) dataset (
zscaler_zpa_raw), which enables you to search the logs using XQL Search.
To integrate your logs, you first need to set up an applet in a Broker VM within your network to act as a Syslog Collector. You then configure forwarding on your log devices to send logs to the Syslog collector in a LEEF format. To provide seamless log ingestion, Cortex XSIAM automatically maps the fields in your traffic logs to the Cortex XSIAM log format.
Prerequisite Step
Before you can add a log receiver in Zscaler Private Access, as explained in the task below, you must first deploy your App Connectors. For more information, see App Connector Deployment Guides for Supported Platforms.
To ingest logs from Zscaler Private Access (ZPA):
- Activate the Syslog Collector.
- Increase log storage for ZPA logs. For more information, see Manage Your Log Storage.
- Configure ZPA log forwarding in Zscaler Private Access to the Syslog Collector in a LEEF format.
- In the Zscaler Private Access application, select Administration → Log Receivers.
-
Click Add Log Receiver.
For more information on configuring the parameters on the screen, see the Zscaler Private Access (ZPA) documentation for Configuring a Log Receiver.
- In the Add Log Receiver window, configure the following fields on the Log Receiver tab:
- Name: Specify a name for the log receiver. The name cannot contain special characters, with the exception of periods (.), hyphens (-), and underscores ( _ ).
- Description: (Optional) Specify a log receiver description.
- Domain or IP Address: Specify the fully qualified domain name (FQDN) or IP address for the log receiver that you set when activating the Syslog Collector in Cortex XSIAM. See Activate Syslog Collector.
- TCP Port: Specify the TCP port number used by the log receiver that you set when activating the Syslog Collector in Cortex XSIAM. See Activate Syslog Collector.
- TLS Encryption: Toggle to Enabled to encrypt traffic between the log receiver and your Syslog Collector in Cortex XSIAMusing mutually authenticated TLS communication. To use this setting, the log receiver must support TLS communication. For more information, see About the Log Streaming Service.
- App Connector Groups: (Optional) Select the App Connector groups that can forward logs to the receiver, and click Done. You can search for a specific group, click Select All to apply all groups, or click Clear Selection to remove all selections.
- Click Next.
- Configure the following fields in the Log Stream tab:
-
Log Type: Select the log type you want to collect, where only the following logs types are currently supported to collect with your Syslog Collector in Cortex XSIAM:
You can only configure a ZPA log receiver to collect one type of log with your Syslog Collector in Cortex XSIAM. To configure more that one log type, you'll need to add another log receiver.
- User Activity: Information on end user requests to applications. For more information, see User Activity Log Fields.
- User Status: Information related to an end user's availability and connection to ZPA. For more information, see User Status Log Fields.
- App Connector Status: Information related to an App Connector's availability and connection to ZPA. For more information, see About App Connector Status Log Fields.
- Audit Logs: Session information for all admins accessing the ZPA Admin Portal. For more information, See About Audit Log Fields and About Audit Logs.
- Log Template: Select a Custom template.
-
Log Stream Content: Create the log template that you require, according to the Log Type you've selected, using the Zscaler documentation mentioned in previous steps as a reference.
If you copy and modify the following examples in the table below, validate your log template using an editor, ensuring that there are no additional spaces or line breaks, and then copy and paste it into the Log Stream Content field.
Log type Log template User activity LEEF:1.0|Zscaler|ZPA|4.1|%s{ConnectionStatus}%s{InternalReason}|cat=ZPA User Activity\tdevTime=%s{LogTimestamp:epoch}\tCustomer=%s{Customer}\tSessionID=%s {SessionID}\tConnectionID=%s{ConnectionID}\tInternalReason=%s{InternalReason} \tConnectionStatus=%s{ConnectionStatus}\tproto=%d{IPProtocol} \tDoubleEncryption=%d{DoubleEncryption}\tusrName=%s{Username} \tdstPort=%d{ServicePort}\tsrc=%s{ClientPublicIP}\tsrcPreNAT=%s{ClientPrivateIP} \tClientLatitude=%f{ClientLatitude}\tClientLongitude=%f{ClientLongitude} \tClientCountryCode=%s{ClientCountryCode}\tClientZEN=%s{ClientZEN} \tpolicy=%s{Policy}\tConnector=%s{Connector}\tConnectorZEN=%s{ConnectorZEN} \tConnectorIP=%s{ConnectorIP}\tConnectorPort=%d{ConnectorPort} \tApplicationName=%s{Host}\tApplicationSegment=%s{Application}\tAppGroup=%s{AppGroup} \tServer=%s{Server}\tdst=%s{ServerIP}\tServerPort=%d{ServerPort} \tPolicyProcessingTime=%d{PolicyProcessingTime}\tServerSetupTime=%d{ServerSetupTime} \tTimestampConnectionStart:iso8601=%s{TimestampConnectionStart:iso8601} \tTimestampConnectionEnd:iso8601=%s{TimestampConnectionEnd:iso8601} \tTimestampCATx:iso8601=%s{TimestampCATx:iso8601} \tTimestampCARx:iso8601=%s{TimestampCARx:iso8601} \tTimestampAppLearnStart:iso8601=%s{TimestampAppLearnStart:iso8601} \tTimestampZENFirstRxClient:iso8601=%s{TimestampZENFirstRxClient:iso8601} \tTimestampZENFirstTxClient:iso8601=%s{TimestampZENFirstTxClient:iso8601} \tTimestampZENLastRxClient:iso8601=%s{TimestampZENLastRxClient:iso8601} \tTimestampZENLastTxClient:iso8601=%s{TimestampZENLastTxClient:iso8601} \tTimestampConnectorZENSetupComplete:iso8601=%s{TimestampConnectorZENSetupComplete:iso8601} \tTimestampZENFirstRxConnector:iso8601=%s{TimestampZENFirstRxConnector:iso8601} \tTimestampZENFirstTxConnector:iso8601=%s{TimestampZENFirstTxConnector:iso8601} \tTimestampZENLastRxConnector:iso8601=%s{TimestampZENLastRxConnector:iso8601} \tTimestampZENLastTxConnector:iso8601=%s{TimestampZENLastTxConnector:iso8601} \tZENTotalBytesRxClient=%d{ZENTotalBytesRxClient}\tZENBytesRxClient=%d{ZENBytesRxClient} \tZENTotalBytesTxClient=%d{ZENTotalBytesTxClient}\tZENBytesTxClient=%d{ZENBytesTxClient} \tZENTotalBytesRxConnector=%d{ZENTotalBytesRxConnector} \tZENBytesRxConnector=%d{ZENBytesRxConnector} \tZENTotalBytesTxConnector=%d{ZENTotalBytesTxConnector} \tZENBytesTxConnector=%d{ZENBytesTxConnector}\tIdp=%s{Idp}\nUser status LEEF:1.0|Zscaler|ZPA|4.1|%s{SessionStatus}|cat=ZPA User Status \tdevTime=%s{LogTimestamp:epoch}\tCustomer=%s{Customer} \tusrName=%s{Username}\tSessionID=%s{SessionID}\tSessionStatus=%s{SessionStatus} \tVersion=%s{Version}\tZEN=%s{ZEN}\tCertificateCN=%s{CertificateCN} \tsrcPreNAT=%s{PrivateIP}\tsrc=%s{PublicIP}\tLatitude=%f{Latitude} \tLongitude=%f{Longitude}\tCountryCode=%s{CountryCode} \tTimestampAuthentication:iso8601=%s{TimestampAuthentication:iso8601} \tTimestampUnAuthentication:iso8601=%s{TimestampUnAuthentication:iso8601} \tdstBytes=%d{TotalBytesRx}\tsrcBytes=%d{TotalBytesTx}\tIdp=%s{Idp} \tidentHostName=%s{Hostname}\tPlatform=%s{Platform}\tClientType=%s{ClientType} \tTrustedNetworks=%s(,){TrustedNetworks}\tTrustedNetworksNames=%s(,){TrustedNetworksNames} \tSAMLAttributes=%s{SAMLAttributes}\tPosturesHit=%s(,){PosturesHit} \tPosturesMiss=%s(,){PosturesMiss}\tZENLatitude=%f{ZENLatitude} \tZENLongitude=%f{ZENLongitude}\tZENCountryCode=%s{ZENCountryCode}\nApp connector status LEEF:1.0|Zscaler|ZPA|4.1|%s{SessionStatus}|cat=Connector Status \tdevTime=%s{LogTimestamp:epoch}\tCustomer=%s{Customer}\tSessionID=%s{SessionID} \tSessionType=%s{SessionType}\tVersion=%s{Version}\tPlatform=%s{Platform} \tZEN=%s{ZEN}\tConnector=%s{Connector}\tConnectorGroup=%s{ConnectorGroup} \tsrcPreNAT=%s{PrivateIP}\tsrc=%s{PublicIP}\tLatitude=%f{Latitude} \tLongitude=%f{Longitude}\tCountryCode=%s{CountryCode} \tTimestampAuthentication:iso8601=%s{TimestampAuthentication:iso8601} \tTimestampUnAuthentication:iso8601=%s{TimestampUnAuthentication:iso8601} \tCPUUtilization=%d{CPUUtilization}\tMemUtilization=%d{MemUtilization} \tServiceCount=%d{ServiceCount}\tInterfaceDefRoute=%s{InterfaceDefRoute} \tDefRouteGW=%s{DefRouteGW}\tPrimaryDNSResolver=%s{PrimaryDNSResolver} \tHostStartTime=%s{HostStartTime}\tConnectorStartTime=%s{ConnectorStartTime} \tNumOfInterfaces=%d{NumOfInterfaces}\tBytesRxInterface=%d{BytesRxInterface} \tPacketsRxInterface=%d{PacketsRxInterface}\tErrorsRxInterface=%d{ErrorsRxInterface} \tDiscardsRxInterface=%d{DiscardsRxInterface}\tBytesTxInterface=%d{BytesTxInterface} \tPacketsTxInterface=%d{PacketsTxInterface}\tErrorsTxInterface=%d{ErrorsTxInterface} \tDiscardsTxInterface=%d{DiscardsTxInterface}\tTotalBytesRx=%d{TotalBytesRx} \tTotalBytesTx=%d{TotalBytesTx}\nAudit logs LEEF:1.0|Zscaler|ZPA|4.1|%s{auditOperationType}|cat=ZPA_Audit_Log\t devTime=%s{modifiedTime:epoch}\t creationTime=%s{creationTime:iso8601}\t requestId=%s{requestId}\t sessionId=%s{sessionId}\t auditOldValue=%s{auditOldValue}\t auditNewValue=%s{auditNewValue}\t auditOperationType=%s{auditOperationType}\t objectType=%s{objectType}\t objectName=%s{objectName}\t objectId=%d{objectId}\t accountName=%d{customerId}\t usrName=%s{modifiedByUser}\n - (Optional) You can define a streaming Policy for the log receiver. This entails configuring the SAML Attributes, Application Segments, Segment Groups, Client Types, and Session Statuses. For more information on configuring these settings, see the Log Stream instructions.
-
- Click Next.
- In the Review tab, verify your log receiver configuration.
- Click Save.
Activate Transporter
Activate Transporter
Notice
This feature is included with a Cloud Runtime Security, Cloud Posture Security, or Cortex XSIAM Premium license.
The Transporter over Broker VM enables secure communication between your self-hosted Version Control Systems (VCS) and Cortex XSIAM. This solution addresses the need for secure code scanning without exposing your internal network to the cloud.
Prerequisites
- Permissions: To configure and manage Transporter applet settings, you must have permissions to manage Broker Service configurations (such as an Instance Administrator)
- Set up and configure Broker VM
- Confirm that your Broker is v 28 or above
- Whitelist IP addresses to enable access to Cortex XSIAM resources. The IP addresses for the Transporter are in the Broker VM Resources section of the Enable access to required PANW resources document
- Open port
4052, which is required for the Transporter's IP address communication - Open Port
443(outbound), which is required for the Broker VM to pull data from your version control system (VCS)
License
To gain access to and use the Transporter applet, you must possess one of these license types: Cloud Posture Security or Runtime Management) or XSIAM Premium. If you plan to use the Transporter for Code Security scanning, you will also need the Code Security add-on license.
Warning
The Transporter applet is not supported for FedRAMP customers.
How to activate the Transporter applet
- Select Settings → Configurations → Broker VMs (under Data Broker.
- Select the Brokers tab → locate your Broker VM → hover and click + Add under the Apps column → AppSec Transporter.
- Configure the Transporter connection in the provided fields:
- Transporter Name (required). Requires a unique name as you can integrate multiple applets for different integrations
- Provider Self Signed CA Certificate Path: Specify the file path for a custom Certificate Authority (CA) certificate used by the Transporter to securely communicate with services
- Click Save.
- Verify connectivity: Navigate to the Apps column and verify that your AppSec Transporter applet has been added and displays a connected status.
-
Next step: After activating the Transporter, proceed to configure the Transporter applet on your self-managed VCS data source instance.
For more information, refer to Set up a Transporter on your VCS.
Manage Transporter applets
To manage Transporter applet configurations, disable connections, or deactivate an applet, navigate to the Broker VMs page. From there, select your Appsec Transporter under the App column.
- Edit applet configurations: Select the Appsec Transporter under the App column → Configure. You are redirected to the Transporter applet settings to manage its configurations
- Disable applet connection for a single integration:
- Select the Appsec Transporter under the App column → Configure.
-
On the Transporter applet configurations page, click on the specific Transporter applet → Disable.
This disables the specific integration, but it can be re-enabled.
-
Deactivate an applet (all connections): Select the Appsec Transporter under the App column → Deactivate → Confirm when prompted
All existing connections are deleted but their configurations are saved in the database. When adding a new connection, you'll be prompted if you want to reuse previous configurations.
Activate Windows Event Collector
After you have configured and registered your Broker VM, activate your Windows Event Collector application.
The Windows Event Collector (WEC) runs on the Broker VM collecting event logs from Windows Servers, including Domain Controllers (DCs). The Windows Event Collector can be deployed in multiple setups, and can be connected directly to multiple event generators (DCs or Windows Servers) or routed using one or more Windows Event Collectors. Behind each Windows event collector there may be multiple generating sources.
To enable the collection of the event logs, you need to configure and establish trust between the Windows Event Forwarding (WEF) collectors and the WEC. Establishing trust between the WEFs and the WEC is achieved by mutual authentication over TLS using server and client certificates. The WEF, a WinRM plugin, runs under the Network Service account. Therefore, you need to provide the WEFs with the relevant certificates and grant the account access permissions to the private key used for client authentication, for example, authenticate with WEC.
You can also activate the Windows Event Collector on Windows Core. For more information, see Activate Windows Event Collector on Windows Core.
Prerequisite
- Set up and configure Broker VM
- Broker VM version 8.0 and later
- You have knowledge of Windows Active Directory and Domain Controllers.
- You must configure different settings related to the FQDN where the instructions differ depending on whether you are configuring a standalone Broker VM or High Availability (HA) cluster.\
Standalone broker\
A FQDN must be configured for the standalone broker as configured in your local DNS server. Therefore, the Broker VM is registered in the DNS, its FQDN is resolvable from the events forwarder (Windows server), and the Broker VM FQDN is configured. For more information, see Configure High Availability Cluster.\
HA cluster\
A FQDN must be configured in the cluster settings as configured in your local DNS server, which points to a Load Balancer. For more information, see Configure High Availability Cluster. - Windows Server 2012 r2 or later.
After ingestion, Cortex XSIAM normalizes and saves the Windows event logs in the dataset xdr_data. The normalized logs are also saved in a unified format in microsoft_windows_raw. This enables you to search the data using Cortex Query Language (XQL) queries, build correlation rules, and generate dashboards based on the data.
Perform the following procedures in the order listed below.
Task 1. Add, configure, and activate a Windows Event Collector
- Select Settings → Configurations → Data Broker → Broker VMs.
- Do one of the following:
- On the Brokers tab, find the Broker VM, and in the APPS column, left-click Add → Windows Event Collector.
- On the Clusters tab, find the Broker VM, and in the APPS column, left-click Add → Windows Event Collector.
In the Activate Windows Event Collector window, define the Collected Events to configure the events collected by the applet. This lists event sources from which you want to collect events.
| Field | Description |
|---|---|
| Source | <p>Select from the pre-populated list with the most common event sources on Windows Servers. The event source is the name of the software that logs the events.</p><p>A source provider can only appear once in your list. When selecting event sources, depending on the type event you want to forward, ensure the event source is enabled, for example auditing security events. If the source is not enabled, the source configuration in the given row will fail.</p> |
| Min. Event Level | Minimum severity level of events that are collected. |
| Event IDs Group | Whether to Include, Exclude, or collect All event ID groups. |
| Minimal TLS Version | Select either 1.0 or 1.2 (default) as the minimum TLS version allowed. Ensure that you verify that all Windows event forwarders are supporting the minimal defined TLS version. |
To forward all the Windows Event Collector events to the Broker VM, define as follows:
- Source:
ForwardedEvents - Min. Event Level:
Verbose - Event IDs Group:
All
By default, Cortex XSIAM collects Palo Alto Networks predefined Security events that are used by the Cortex XSIAM detectors. Removing the Security collector interferes with the Cortex XSIAM detection functionality. Restore to Default to reinstate the Security event collection.
- Click Activate. After a successful activation, the APPS field displays WEC with a green dot indicating a successful connection.
Task 2. Configure the Windows Event Collector settings
- In the APPS column, left-click the WEC connection to display the Windows Event Collector settings, and select Configure.
- In the Windows Event Forwarder Configuration window, perform the following tasks:
- In the Subscription Manager URL field, click
- Enter a password in the Define Client Certificate Export Password field to be used to secure the downloaded WEF certificate that establishes the connection between your DC/WEF and the WEC. You will need this password when the certificate is imported to the events forwarder.
- Download the WEF certificate in a PFX format to your local machine. To view your Windows Event Forwarding configuration details at any time, select your Broker VM, right-click and navigate to Windows Event Collector → Configure.
Cortex XSIAM monitors the certificate and triggers a Certificate Expiration notification 30 days prior to the expiration date. The notification is sent daily specifying the number of days left on the certificate, or if the certificate has already expired.
Task 3. Install your WEF Certificate on the WEF to establish connection
You must install the WEF certificate on every Windows Server, whether DC or not, for the WEFs that are supposed to forward logs to the Windows Event Collector applet on the Broker VM.
- Locate the PFX file you downloaded from the Cortex XSIAM console and double-click to open the Certificate Import Wizard.
- In the Certificate Import Wizard:
- Select Local Machine, and then click Next.
- Verify the File name field displays the PFX certificate file you downloaded and click Next.
- In the Passwords field, specify the Client Certificate Export Password you defined in the Cortex XSIAM console followed by Next.
- Select Automatically select the certificate store based on the type of certificate, and then click Next and Finish.
- From a command prompt, run
certlm.msc. - In the file explorer, navigate to Certificates and verify the following for each of the folders:
- In the Personal → Certificates folder, ensure the certificate
forwarder.wec.paloaltonetworks.comis displayed. - In the Trusted Root Certification Authorities → Certificates folder, ensure the CA
ca.wec.paloaltonetworks.comis displayed.
- In the Personal → Certificates folder, ensure the certificate
- Navigate to Certificates → Personal → Certificates.
- Right-click the certificate and navigate to All tasks → Manage Private Keys.
-
In the Permissions window, select Add and in the Enter the object name section, enter
NETWORK SERVICE, and then click Check Names to verify the object name. The object name is displayed with an underline when valid. and then click OK. -
Click OK, verify the Group or user names that are displayed, and then click Apply Permissions for private keys.
Task 4. Add the Network Service account to the domain controller Event Log Readers group
You must install the WEF certificate on every Windows Server, whether DC or not, for the WEFs that are supposed to forward logs to the Windows Event Collector applet on the Broker VM.
-
To enable events forwarders to forward events, the Network Service account must be a member of the Active Directory Event Log Readers group. In PowerShell, execute the following command on the domain controller that is acting as the event forwarder:
PS C:\> net localgroup "Event Log Readers" "NT Authority\Network Service" /add
Make sure you see
The command completed successfullymessage. -
Grant access to view the security event logs.
The security event logs are provided by default and the instruction below explain how to to grant access to view these logs. You'll need to apply these instructions to any other event logs that you configure the WEC to access.
-
Run
wevtutil gl securityand take note of yourchannelAccessvalue.`PS C:\Users\Administrator> wevtutil gl security name: security enabled: true type: Admin owningPublisher: isolation: Custom channelAccess: O:BAG:SYD:(A;;0xf0005;;;SY)(A;;0x5;;;BA)(A;;0x1;;;S-1-5-32-573) logging: logFileName: %SystemRoot%\System32\Winevt\Logs\security.evtx retention: false autoBackup: false maxSize: 134217728 publishing: fileMax: 1
Take note of value:
channelAccess: O:BAG:SYD:(A;;0xf0005;;;SY)(A;;0x5;;;BA)(A;;0x1;;;S-1-5-32-573) -
Run
wevtutil sl security "/ca:<channelAccess value>(A;;0x1;;;S-1-5-20)"PS C:\Users\Administrator> wevtutil sl security "/ca:O:BAG:SYD:(A;;0xf0005;;;SY)(A;;0x5;;;BA)(A;;0x1;;;S-1-5-32-573)(A;;0x1;;;S-1-5-20)"
Make sure you grant access on each of your domain controller hosts.
-
Task 5. Create a WEF Group Policy that applies to every Windows server you want to configure as a WEF
- In a command prompt, open
gpmc.msc. - In the Group Policy Management window, navigate to Domains → your domain name → Group Policy Object, right-click and select New.
- In the New GPO window, enter your group policy Name: as Windows Event Forwarding, and click OK.
-
Navigate to Domains → your domain name → Group Policy Objects → Windows Event Forwarding, right-click and select Edit.
- In the Group Policy Management Editor:
- Set the Windows Remote Management Service for automatic startup.
- Select Computer Configuration → Policies → Windows Settings → Security Settings → System Services, and in the view panel locate and double-click Windows Remote Management (WS-Management).
- Mark the Define this policy setting checkbox, select Automatic, and then click Apply and OK.
-
At a minimum for your WEC configuration, you must enable logging of the same events that you have configured to be collected in your WEC configuration on your domain controller. Otherwise, you will not be able to view these events as the WEC only controls querying not logging. For example, if you have configured authentication events to be collected by your WEC using an authentication protocol, such as Kerberos, you should ensure all relevant audit events for authentication are configured on your domain controller. In addition, you should ensure that all relevant audit events that you want collected, such as the success and failure of account logins for Windows Event ID 4625, are properly configured, particularly for those that you want Cortex XSIAM to apply grouping and analytics inspection.
This step overrides any local policy settings.
Here is an example of how to configure the WEC to collect authentication events using Kerberos as the authentication protocol to enable the collection of Broker VM supported Kerberos events, Kerberos pre-authentication, authentication, request, and renewal tickets.
- Select Computer Configuration → Policies → Windows Settings → Security Settings → Advanced Audit Policy Configuration → Audit Policies → Account Logon.
-
In the view pane, right-click Audit Kerberos Authentication Service and select Properties. In the Audit Kerberos Authentication Service window, mark Configure the following audit events:, and click Success and Failure followed by Apply and OK.
Repeat for Audit Kerberos Service Ticket Operations.
- Set the Windows Remote Management Service for automatic startup.
-
Configure the subscription manager.
Navigate to Computer Configuration → Policies → Administrative Templates: Policy definitions → Windows Components → Event Forwarding, right-click Configure target Subscription Manager and select Edit.
In the Configure target Subscription Manager window, perform the following:
- Mark Configure target Subscription Manager as Enabled.
- In the Options section, select Show and in the Show Contents window, paste the Subscription Manage URL you copied from the Cortex XSIAM console, and then click OK.
- Click Apply and OK to save your changes.
-
Add Network Service to Event Log Readers group.
Select Computer Configuration → Preferences → Control Panel Settings → Local Users and Groups, right-click and select New → Local Group.
In the New Local Group Properties window:
- In the Group name field, select Event Log Readers (built-in).
-
In the Members section, click Add and enter in the Name filed
Network Servicefollowed by OK.You must type out the name, do not select the name from the browse button.
- Click Apply and OK to save your changes, and close the Group Policy Management Editor window.
-
Configure the Windows Firewall.
If Windows Firewall is enabled on your event forwarders, you will have to define an outbound rule to enable the WEF to reach port 5986 on the WEC.
In the Group Policy Management window, select Computer Configuration → Policies → Windows Settings → Security Settings → Windows Firewall with Advanced Security → Outbound Rules, right-click and select New Rule.
In the New Outbound Rule Wizard define the following Steps:
- Rule Type: Select Port followed by Next.
- Protocols and Ports: Select TCP and in the Specific Remote Ports field enter
5986followed by Next. - Action: Select Allow the connection followed by Next.
- Profile: Select Domain and disable Private and Public followed by Next.
- Name: Specify
Windows Event Forwarding. - To save your changes, click Finish.
Task 6. Apply the WEF Group Policy
Link the policy to the OU or the group of Windows servers you would like to configure as event forwarders. In the following flow, the domain controllers are configured as an event forwarder.
- Select Group Policy Management → <your domain name> → Domain Controllers, right-click and select Link an existing GPO....
- In the Select GPO window, click Windows Event Forwarding followed by OK.
- In an administrative PowerShell console, execute the following commands:
-
PS C:\Users\Administrator> gpupdate /force
Verify that the
Computer Policy update has completed successfully. User Policy update has completed successfully.confirmation message is displayed. -
PS C:\Users\Administrator> Restart-Service WinRM
-
Task 7. Verify Windows Event Forwarding
-
In an administrative PowerShell console, run the following command:
PS C:\Users\Administrator> Get-WinEvent Microsoft-windows-WinRM/operational -MaxEvents 10
-
Look for
WSMan operation EventDelivery completed successfullyconfirmation messages. These indicate events forwarded successfully.
Task 8. Manage the Window Event Collector (Optional)
After the Windows Event Collector has been activated in the Cortex XSIAM Management Console, left-click the WEC connection in the APPS column to display the Windows Event Collector settings, and select:
- Configure to define the event configuration information.
- Collection Configuration to view or edit existing or add new events to collect.
- Deactivate to disable the Windows Event Collector.
Task 9. View Windows Event Collector metrics (Optional)
To view metrics about the Windows Event Collector, left-click the WEC connection in the APPS field for your Broker VM, and you'll see the following metrics:
- Connectivity Status: Whether the applet is connected to Cortex XSIAM.
- Logs Received and Logs Sent: Number of logs received and sent by the applet per second over the last 24 hours. If the number of incoming logs received is larger than the number of logs sent, it could indicate a connectivity issue.
- Resources: Displays the amount of CPU, Memory, and Disk space the applet is using.
Activate Windows Event Collector on Windows Core
After you have configured and registered your Broker VM, you can activate your Windows Event Collector application on Windows Core OS (WCOS). WCOS is a stripped-down, lightweight version of Windows that can be adapted to run on a wide variety of devices with minimal work compared to the previous way explained in Activate Windows Event Collector.
The Windows Event Collector (WEC) runs on the Broker VM collecting event logs from Windows Servers, including Domain Controllers (DCs). The Windows Event Collector can be deployed in multiple setups, and can be connected directly to multiple event generators (DCs or Windows Servers) or routed using one or more Windows Event Collectors. Behind each Windows event collector there may be multiple generating sources.
To enable the collection of the event logs, you are configuring and establishing trust between the Windows Event Forwarding (WEF) collectors and the WEC. Establishing trust between the WEFs and the WEC is achieved by mutual authentication over TLS using server and client certificates. The WEF, a WinRM plugin, runs under the Network Service account. Therefore, you need to provide the WEFs with the relevant certificates and grant the account access permissions to the private key used for client authentication, for example, authenticate with WEC.
Prerequisite
- Set up and configure Broker VM
- Broker VM version 8.0 and later
- You have knowledge of Windows Active Directory and Domain Controllers.
- You must configure different settings related to the FQDN where the instructions differ depending on whether you are configuring a standalone Broker VM or High Availability (HA) cluster.\
Standalone broker\
A FQDN must be configured for the standalone broker as configured in your local DNS server. Therefore, the Broker VM is registered in the DNS, its FQDN is resolvable from the events forwarder (Windows server), and the Broker VM FQDN is configured. For more information, see Edit Broker VM Configuration. HA cluster A FQDN must be configured in the cluster settings as configured in your local DNS server, which points to a Load Balancer. For more information, see Configure High Availability Cluster. - Windows Server 2012 r2 or later.
After ingestion, Cortex XSIAM normalizes and saves the Windows event logs in the dataset xdr_data. The normalized logs are also saved in a unified format in microsoft_windows_raw. This enables you to search the data using XQL queries, build correlation rules, and generate dashboards based on the data.
Perform the following procedures in the order listed below.
Task 1. Add, configure, and activate a Windows Event Collector
- Select Settings → Configurations → Data Broker → Broker VMs.
- Do one of the following:
- On the Brokers tab, find the Broker VM, and in the APPS column, left-click Add → Windows Event Collector.
- On the Clusters tab, find the Broker VM, and in the APPS column, left-click Add → Windows Event Collector.
-
In the Activate Windows Event Collector window, define the Collected Events to configure the events collected by the applet. This lists event sources from which you want to collect events.
Field Description Source <p>Select from the pre-populated list with the most common event sources on Windows Servers. The event source is the name of the software that logs the events.</p><p>A source provider can only appear once in your list. When selecting event sources, depending on the type event you want to forward, ensure the event source is enabled, for example auditing security events. If the source is not enabled, the source configuration in the given row will fail.</p> Min. Event Level Minimum severity level of events that are collected. Event IDs Group Whether to Include, Exclude, or collect All event ID groups. Minimal TLS Version Select either 1.0 or 1.2 (default) as the minimum TLS version allowed. Ensure that you verify that all Windows event forwarders are supporting the minimal defined TLS version. To forward all the Windows Event Collector events to the Broker VM, define as follows:
- Source:
ForwardedEvents - Min. Event Level:
Verbose - Event IDs Group:
All
By default, Cortex XSIAM collects Palo Alto Networks predefined Security events that are used by the Cortex XSIAM detectors. Removing the Security collector interferes with the Cortex XSIAM detection functionality. Restore to Default to reinstate the Security event collection.
- Source:
- Click Activate. After a successful activation, the APPS field displays WEC with a green dot indicating a successful connection.
Task 2. Configure the Windows Event Collector settings
- In the APPS column, left-click the WEC connection to display the Windows Event Collector settings, and select Configure.
-
In the Windows Event Forwarder Configuration window, perform the following tasks.:
- In the Subscription Manager URL field, click (copy) . This will be used when you configure the subscription manager in the GPO (Global Policy Object) on your domain controller.
- Enter a password in the Define Client Certificate Export Password field to be used to secure the downloaded WEF certificate that establishes the connection between your DC/WEF and the WEC. You will need this password when the certificate is imported to the events forwarder.
-
Download the WEF certificate in a PFX format to your local machine.
To view your Windows Event Forwarding configuration details at any time, select your Broker VM, right-click and navigate to Windows Event Collector → Configure.
Cortex XSIAM monitors the certificate and triggers a Certificate Expiration notification 30 days prior to the expiration date. The notification is sent daily specifying the number of days left on the certificate, or if the certificate has already expired.
Cortex XSIAM monitors the certificate and triggers a Certificate Expiration notification 30 days prior to the expiration date. The notification is sent daily specifying the number of days left on the certificate, or if the certificate has already expired.
Task 3. Install your WEF Certificate on the WEF to establish connection
- Start PowerShell with elevated privileges.
-
Run PowerShell with the following command:
PowerShell
-
From inside a
PowerShellcommand run the following command:Start-Process -Verb RunAs PowerShell
-
- Copy the PFX file that you downloaded to the local Core machine in one of the following ways:
- (Recommended) If you're able to RDP to your server, open Notepad, and select File → Open to copy and paste files from your local machine directly to the server. If you have any local drives mapped through the RDP options, the local drives are also displayed. We recommend this method as it's the simplest.
-
If you have enabled
WinRMfor remotePowerShellexecution, you can copy over PowerShell using this command:$session = New-PSSession –ComputerName <computer name>
Copy-Item –Path <path to PFX certificate file> –Destination '<temporary file path>' –ToSession $session
$session = New-PSSession –ComputerName SERVER1
Copy-Item –Path C:\Downloads\forwarder.wec.paloaltonetworks.com.pfx –Destination 'C:\temp\forwarder.wec.paloaltonetworks.com.pfx' –ToSession $session
To enable
WinRM, use this command:Execute "Start-Service winRM"
Execute "WinRM quickconfig"
- Use SSH on server core. This includes enabling SSH on server core and using
winscpto drag and drop the PFX file. -
Use SMB to open the file share
c$on the\\server1\c$server. You can only use this option if you are an administrator and the firewall on your network isn't set to block file sharing.You can also launch PowerShell and run the following command to tell the remote server to copy a file from your local computer using SMB:
Copy-Item –Path <path to PFX certificate file> –Destination '\\<computer name>\c$\<path to PFX file>
Copy-Item –Path C:\Downloads\forwarder.wec.paloaltonetworks.com.pfx –Destination '\\windows-core-server\c$\forwarder.wec.paloaltonetworks.com.pfx
-
Import the PFX file from PowerShell.
Use the following command to import the PFX file:
certutil -f -importpfx '<path to PFX file from Destination>'
certutil -f -importpfx '.\forwarder.wec.paloaltonetworks.com.pfx'
You will need to enter the Client Certificate Export Password you defined in the Cortex XSIAM console.
When the import is complete, the following message is displayed:
CertUtil: -importPFX command completed successfully.
- Verify that the certificates are in the correct locations.
-
Ensure the client certificate appears in "My" (Personal) store by running the following command:
certutil -store My
-
Ensure the CA appears in Trusted Root Certification Authorities by running the following command:
certutil -store root
-
-
Manage the private key of the
forwarder.wec.paloaltonetworks.com.pfxcertificate.This entails applying permissions for the
NETWORK SERVICEuser.-
Retrieve the Thumbprint of the
forwarder.wec.paloaltonetworks.com.pfxcertificate by running the following script:$store = New-Object System.Security.Cryptography.X509Certificates.X509Store("My","LocalMachine") $store.Open("ReadWrite") echo $store.CertificatesAfter the script runs, copy the relevant thumbprint.
-
Grant
NT AUTHORITY\NETWORK SERVICEwith read permissions by running the following script with the$thumbprintset to the value you copied in the previous step by replacing<Thumbprint retrieved value>.$thumbprint = '<Thumbprint retrieved value>' $account = 'NT AUTHORITY\NETWORK SERVICE' #Open Certificate store and locate certificate based on provided thumbprint $store = New-Object System.Security.Cryptography.X509Certificates.X509Store("My","LocalMachine") $store.Open("ReadWrite") $cert = $store.Certificates | where {$_.Thumbprint -eq $thumbprint} #Create new CSP object based on existing certificate provider and key name #Note: Ensure this command is pasted to the same row and doesn’t break to multiple rows. #Otherwise, the command will fail with errors. $csp = New-Object System.Security.Cryptography.CspParameters($cert.PrivateKey.CspKeyContainerInfo.ProviderType, $cert.PrivateKey.CspKeyContainerInfo.ProviderName, $cert.PrivateKey.CspKeyContainerInfo.KeyContainerName) # Set flags and key security based on existing cert $csp.Flags = "UseExistingKey","UseMachineKeyStore" $csp.CryptoKeySecurity = $cert.PrivateKey.CspKeyContainerInfo.CryptoKeySecurity $csp.KeyNumber = $cert.PrivateKey.CspKeyContainerInfo.KeyNumber # Create new access rule - could use parameters for permissions, but I only needed GenericRead $access = New-Object System.Security.AccessControl.CryptoKeyAccessRule($account,"GenericRead","Allow") # Add access rule to CSP object $csp.CryptoKeySecurity.AddAccessRule($access) #Create new CryptoServiceProvider object which updates Key with CSP information created/modified above $rsa2 = New-Object System.Security.Cryptography.RSACryptoServiceProvider($csp) #Close certificate store $store.Close() echo $csp.CryptoKeySecurity -
After the script runs, validate the permissions are now set correctly.
-
Task 4. Add the Network Service account to the domain controller Event Log Readers group
You must install the WEF certificate on every Windows Server, whether DC or not, for the WEFs that are supposed to forward logs to the Windows Event Collector applet on the Broker VM.
-
To enable events forwarders to forward events, the Network Service account must be a member of the Active Directory Event Log Readers group. In PowerShell, execute the following command on the domain controller that is acting as the event forwarder:
PS C:\> net localgroup "Event Log Readers" "NT Authority\Network Service" /add
Make sure you see
The command completed successfullymessage. -
Grant access to view the security event logs.
The security event logs are provided by default and the instruction below explain how to to grant access to view these logs. You'll need to apply these instructions to any other event logs that you configure the WEC to access.
-
Run
wevtutil gl securityand take note of yourchannelAccessvalue.`PS C:\Users\Administrator> wevtutil gl security name: security enabled: true type: Admin owningPublisher: isolation: Custom channelAccess: O:BAG:SYD:(A;;0xf0005;;;SY)(A;;0x5;;;BA)(A;;0x1;;;S-1-5-32-573) logging: logFileName: %SystemRoot%\System32\Winevt\Logs\security.evtx retention: false autoBackup: false maxSize: 134217728 publishing: fileMax: 1
Take note of value:
channelAccess: O:BAG:SYD:(A;;0xf0005;;;SY)(A;;0x5;;;BA)(A;;0x1;;;S-1-5-32-573) -
Run
wevtutil sl security "/ca:<channelAccess value>(A;;0x1;;;S-1-5-20)"PS C:\Users\Administrator> wevtutil sl security "/ca:O:BAG:SYD:(A;;0xf0005;;;SY)(A;;0x5;;;BA)(A;;0x1;;;S-1-5-32-573)(A;;0x1;;;S-1-5-20)"
-
Make sure you grant access on each of your domain controller hosts.
Task 5. Create a WEF Group Policy that applies to every Windows server you want to configure as a WEF
As a Group Policy Management Console is not available on Core servers, it’s not possible to fully edit a Group Policy Object (GPO) either with PowerShell or using a web solution. As a result, follow this alternative method, which is based on configuring a group policy from another Windows DC by remotely configuring the group policy.
- Use any DC that has the Group Policy Management Console available in the same domain as the Core server, and verify the connection between the servers with a simple ping.
- Run
cmdas an administrator. -
Run the following command:
gpmc.msc /gpcomputer: <computer name.Domain>
gpmc.msc /gpcomputer: WIN-SI2SVDOKIMV.ENV21.LOCAL
- In the Group Policy Management window, navigate to Domains → your domain name → Group Policy Object, right-click and select New.
- In the New GPO window, enter your group policy Name: as Windows Event Forwarding, and click OK.
-
Navigate to Domains → your domain name → Group Policy Objects → Windows Event Forwarding, right-click and select Edit.
- In the Group Policy Management Editor:
- Set the Windows Remote Management Service for automatic startup.
- Select Computer Configuration → Policies → Windows Settings → Security Settings → System Services, and in the view panel locate and double-click Windows Remote Management (WS-Management).
- Mark the Define this policy setting checkbox, select Automatic, and then click Apply and OK.
-
At a minimum for your WEC configuration, you must enable logging of the same events that you have configured to be collected in your WEC configuration on your domain controller. Otherwise, you will not be able to view these events as the WEC only controls querying not logging. For example, if you have configured authentication events to be collected by your WEC using an authentication protocol, such as Kerberos, you should ensure all relevant audit events for authentication are configured on your domain controller. In addition, you should ensure that all relevant audit events that you want collected, such as the success and failure of account logins for Windows Event ID 4625, are properly configured, particularly for those that you want Cortex XSIAM to apply grouping and analytics inspection.
This step overrides any local policy settings.
Here is an example of how to configure the WEC to collect authentication events using Kerberos as the authentication protocol to enable the collection of Broker VM supported Kerberos events, Kerberos pre-authentication, authentication, request, and renewal tickets.
- Select Computer Configuration → Policies → Windows Settings → Security Settings → Advanced Audit Policy Configuration → Audit Policies → Account Logon.
-
In the view pane, right-click Audit Kerberos Authentication Service and select Properties. In the Audit Kerberos Authentication Service window, mark Configure the following audit events:, and click Success and Failure followed by Apply and OK.
Repeat for Audit Kerberos Service Ticket Operations.
- Set the Windows Remote Management Service for automatic startup.
-
Configure the subscription manager.
Navigate to Computer Configuration → Policies → Administrative Templates: Policy definitions → Windows Components → Event Forwarding, right-click Configure target Subscription Manager and select Edit.
In the Configure target Subscription Manager window:
- Mark Configure target Subscription Manager as Enabled.
- In the Options section, select Show and in the Show Contents window, paste the Subscription Manage URL you copied from the Cortex XSIAM console, and then click OK.
- Click Apply and OK to save your changes.
-
Add Network Service to Event Log Readers group.
Select Computer Configuration → Preferences → Control Panel Settings → Local Users and Groups, right-click and select New → Local Group.
In the New Local Group Properties window:
- In the Group name field, select Event Log Readers (built-in).
-
In the Members section, click Add and enter in the Name filed
Network Servicefollowed by OK.You must type out the name, do not select the name from the browse button.
- Click Apply and OK to save your changes, and close the Group Policy Management Editor window.
-
Configure the Windows Firewall.
If Windows Firewall is enabled on your event forwarders, you will have to define an outbound rule to enable the WEF to reach port 5986 on the WEC.
In the Group Policy Management window, select Computer Configuration → Policies → Windows Settings → Security Settings → Windows Firewall with Advanced Security → Outbound Rules, right-click and select New Rule.
In the New Outbound Rule Wizard define the following Steps:
- Rule Type: Select Port followed by Next.
- Protocols and Ports: Select TCP and in the Specific Remote Ports field enter
5986followed by Next. - Action: Select Allow the connection followed by Next.
- Profile: Select Domain and disable Private and Public followed by Next.
- Name: Specify
Windows Event Forwarding. - To save your changes, click Finish.
Task 6. Apply the WEF Group Policy
Link the policy to the OU or the group of Windows servers you would like to configure as event forwarders. In the following flow, the domain controllers are configured as an event forwarder.
- Select Group Policy Management → <your domain name> → Domain Controllers, right-click and select Link an existing GPO....
- In the Select GPO window, click Windows Event Forwarding followed by OK.
- In an administrative PowerShell console, execute the following commands:
-
PS C:\Users\Administrator> gpupdate /force
Verify that the
Computer Policy update has completed successfully. User Policy update has completed successfully.confirmation message is displayed. -
PS C:\Users\Administrator> Restart-Service WinRM
-
Task 7. Verify Windows Event Forwarding
- Select Group Policy Management → <your domain name> → Domain Controllers, right-click and select Link an existing GPO....
- In the Select GPO window, click Windows Event Forwarding followed by OK.
- In an administrative PowerShell console, execute the following commands:
-
PS C:\Users\Administrator> gpupdate /force
Verify that the
Computer Policy update has completed successfully. User Policy update has completed successfully.confirmation message is displayed. -
PS C:\Users\Administrator> Restart-Service WinRM
-
Task 8. Manage the Window Event Collector (Optional)
After the Windows Event Collector has been activated in the Cortex XSIAM Management Console, left-click the WEC connection in the APPS column to display the Windows Event Collector settings, and select:
- Configure to define the event configuration information.
- Collection Configuration to view or edit existing or add new events to collect.
- Deactivate to disable the Windows Event Collector.
Task 9. View Windows Event Collector metrics (Optional)
To view metrics about the Windows Event Collector, left-click the WEC connection in the APPS field for your Broker VM, and you'll see the following metrics:
- Connectivity Status: Whether the applet is connected to Cortex XSIAM.
- Logs Received and Logs Sent: Number of logs received and sent by the applet per second over the last 24 hours. If the number of incoming logs received is larger than the number of logs sent, it could indicate a connectivity issue.
- Resources: Displays the amount of CPU, Memory, and Disk space the applet is using.
Renew WEC certificates
Renewing your WEC certificates in Cortex XSIAM includes renewing your Windows Event Forwarding (WEF) client certificate and your WEC server certificate. You must install the WEF certificate on every Windows server, whether a Domain Controller (DC) or not, for the WEFs that are supposed to forward logs to the Windows Event Collector applet on the Broker VM.
Important
After you receive a notification for renewing your WEC CA certificate, we recommend that you do not add any new WEF clients until the WEC certification renewal process is complete. Events from these WEF clients that are added afterwards will not be collected by the server until the WEC certificates are renewed.
In addition, Cortex XSIAM manages the renewal of your WEC certificates by implementing the following time limits:
- The WEC CA certificate is increased for an extended period of time for a maximum of 20 years.
- The Broker VM applet includes an automatic renewal mechanism for a WEC server certificate, which has a lifespan of 12 months.
- The WEC client certificate after the renewal is issued with a lifespan of 5 years.
Perform the following procedures in the order listed below.
Task 1. Renew your WEF client certificate in Cortex XSIAM
- Select Settings → Configurations → Data Broker → Broker VMs.
- Do one of the following:
- On the Brokers tab, find the Broker VM, and in the APPS column, left-click the WEC connection to display the Windows Event Collector settings, and select Configure.
- On the Clusters tab, find the Broker VM, and in the APPS column, left-click the WEC connection to display the Windows Event Collector settings, and select Configure.
- In the Windows Event Forwarder Configuration window, perform the following tasks:
- In the Subscription Manager URL field, click (copy) . This will be used when you configure the subscription manager in the GPO (Global Policy Object) on your domain controller.
- Enter a password in the Define Client Certificate Export Password field to be used to secure the downloaded WEF certificate that establishes the connection between your DC/WEF and the WEC. You will need this password when the certificate is imported to the events forwarder.
- Download the WEF certificate in a PFX format to your local machine.
-
Install your WEF Certificate on the WEF to establish connection.
You must install the WEF certificate on every Windows Server, whether DC or not, for the WEFs that are supposed to forward logs to the Windows Event Collector applet on the Broker VM.
- Locate the PFX file you downloaded from the Cortex XSIAM console and double-click to open the Certificate Import Wizard.
- In the Certificate Import Wizard:
- Select Local Machine, and then click Next.
- Verify the File name field displays the PFX certificate file you downloaded and click Next.
- In the Passwords field, enter the Client Certificate Export Password you defined in the Cortex XSIAM console followed by Next.
- Select Automatically select the certificate store based on the type of certificate, and then click Next and Finish.
- From a command prompt, run
certlm.msc. -
In the file explorer, navigate to Certificates and verify the following for each of the folders:
- In the Personal → Certificates folder, ensure the certificate
forwarder.wec.paloaltonetworks.comis displayed. - In the Trusted Root Certification Authorities → Certificates folder, ensure the CA
ca.wec.paloaltonetworks.comis displayed.
You can see more than one
ca.wec.paloaltonetworks.comandforwarder.wec.paloaltonetworks.comfile from a previous installation in the directory, so select the file with the most extended Expiration Date. You can verify that you are using the correct certificate:- To verify the client certificate in the Personal → Certificates folder is related to the CA, you can select your
forwarder.wec.paloaltonetworks.comfile and from the Certification Path tab, double-click ca.wec.paloaltonetworks.com. In the Details tab, Show: Properties only, and verify the Thumbprint matches theca.wec.paloaltonetworks.comfile Thumbprint. - For the Trusted Root Certificate (i.e. CA certificate), you can verify the Thumbprint of your
ca.wec.paloaltonetworks.comfile matches the Subscription Manager URL by double-clicking the file and from the Details tab verifying the Thumbprint.
- In the Personal → Certificates folder, ensure the certificate
- Navigate to Certificates Personal Certificates.
- Right-click the certificate and navigate to All tasks → Manage Private Keys.
-
In the Permissions window, select Add and in the Enter the object name section, enter
NETWORK SERVICE, and then click Check Names to verify the object name. The object name is displayed with an underline when valid. and then click OK. -
Click OK, verify the Group or user names that are displayed, and then click Apply Permissions for private keys.
- Configure the subscription manager.
-
Navigate to Computer Configuration → Policies → Administrative Templates: Policy definitions → Windows Components → Event Forwarding, right-click Configure target Subscription Manager and select Edit.
-
In the Configure target Subscription Manager window, perform the following:
- Mark Configure target Subscription Manager as Enabled.
- In the Options section, select Show and in the Show Contents window, paste the Subscription Manage URL you copied from the Cortex XSIAM console, and then click OK.
- Click Apply and OK to save your changes.
-
-
Complete the WEF Client certificate renewal.
On every WEF DC, perform the following from a command prompt:
- Run
gpupdate /forceto update the group policy. - To apply the configurations,
Restart-Service WinRM.
- Run
Task 2. Renew your WEC server certificate in Cortex XSIAM
Only perform this step under the following conditions:
- You have completed the WEF certification renewal process for ALL clients in your environment. Otherwise, events from the WEFs that you did not install the new client certificate will not be collected by the WEC.
- You are approaching the WEC server CA certificate expiration date, which is 2 years after the Windows Event Collector applet activation, and receive a notification in the Cortex XSIAM console.
- Select Settings → Configurations → Data Broker → Broker VMs.
- Do one of the following:
- On the Brokers tab, find the Broker VM, and in the APPS column, left-click the WEC connection to display the Windows Event Collector settings, and select Renew WEC Server Certificate.
- On the Clusters tab, find the Broker VM, and in the APPS column, left-click the WEC connection to display the Windows Event Collector settings, and select Renew WEC Server Certificate.
-
Click Renew.
Once Cortex XSIAM renews the WEC server certificate, the status of the WEC in the APPS field on the Broker VMs machine is Connected indicating the applet is running. In addition, the health status of the Windows Event Collector applet is now green instead of yellow and the warning message that appeared when you hovered over the health status no longer appears. Your WEC server certificate is issued with a lifespan of 12 months.
We also suggest that you run the following XQL query to verify that your event logs are being captured:
dataset = xdr_data | filter _product = "Windows" | fields _vendor,_product,action_evtlog_level,action_evtlog_event_id | sort desc _time | limit 20
If this query does not display results with a timestamp from after the renewal process, it could indicate that the renewal process is not complete, so wait a few minutes before running another query. If you are still having a problem, contact Technical Support.
XDR Collectors
Ingestion of log events larger than 5 MB is not supported.
Cortex XSIAM provides an XDR Collectors (XDRC) configuration that is dedicated for on-premise data collection on Windows and Linux machines. The XDRC includes a dedicated installer, a collector upgrade configuration, content updates, and policy management. The XDRC is a data collector that gathers and processes logs and events from multiple sources. It leverages Elasticsearch Filebeat, a lightweight log shipper, to collect log data from various systems and applications. Additionally, Winlogbeat gathers Windows event logs, ensuring comprehensive visibility into Windows environments. These components facilitate centralized analysis, threat detection, and investigation across the Cortex XSIAM ecosystem.
XDR Collector audit logs
Learn more about XDR Collector audit logs.
Cortex XSIAM logs entries for events related to the XDR Collector monitored activities. Cortex XSIAM stores the logs for 365 days. To view the XDR Collector audit logs, select Settings → XDR Collector Audit Logs.
XDR Collector machine requirements and supported operating systems
You can configure XDR Collectors that are dedicated for on-premise data collection on Windows and Linux machines. The following hardware and software specifications are required for the collector machines.
| Machine operating system | Requirement | Specifications |
|---|---|---|
| Linux | Processor | 2.3 GHz dual-core |
| RAM | 4GB; 8GB recommended | |
| Hard disk space | 10GB | |
| Architecture | x86 64-bit | |
| Kernel version | 2.6.32 | |
| Supported operating system versions | <ul><li>Red Hat Enterprise Linux 6 (6.7 and later)</li><li>Red Hat Enterprise Linux 7</li><li>Red Hat Enterprise Linux 8</li><li>Red Hat Enterprise Linux 9</li><li>Red Hat Enterprise Linux 10.0</li><li>SUSE Linux Enterprise Server 12</li><li>SUSE Linux Enterprise Server 15 SP0</li><li>SUSE Linux Enterprise Server 15 SP1</li><li>SUSE Linux Enterprise Server 15 SP2</li><li>SUSE Linux Enterprise Server 15 SP3</li><li>SUSE Linux Enterprise Server 15 SP4</li><li>SUSE Linux Enterprise Server 15 SP5</li><li>SUSE Linux Enterprise Server 15 SP6</li><li>SUSE Linux Enterprise Server 15 SP7</li><li>Ubuntu Server 12</li><li>Ubuntu Server 14</li><li>Ubuntu Server 16</li><li>Ubuntu Server 18</li><li>Ubuntu Server 20</li><li>Ubuntu Server 22</li><li>Oracle Linux 6 (6.7 and later)</li><li>Oracle Linux 7</li><li>Oracle Linux 8</li><li>Oracle Linux 9</li></ul> | |
| Software packages | <ul><li>Verify you have standard Unix programs installed.</li><li>ca-certificates</li><li>openssl 1.0.0 or a later release</li><li><p>Distributions with SELinux in enforcing or permissive mode:</p><ul><li>Red Hat Enterprise Linux 6 and Oracle Linux 6: policycoreutils-python</li><li>Red Hat Enterprise Linux 7 and Oracle Linux 7: policycoreutils-python and selinux-policy-devel</li><li>SUSE: policycoreutils-python and selinux-policy-devel</li><li>Debian and Ubuntu: policycoreutils and selinux-policy-dev</li></ul></li></ul> | |
| Networking | <ul><li>Allow communication from the XDR Collector TCP port to the server (the default is port 443).</li></ul> | |
| Windows | Processor | <ul><li>Intel Pentium 4 or later with SSE2 instruction set support</li><li>AMD Opteron/Athlon 64 or later with SSE2 instruction set support</li><li>Dual core processor (minimum)</li></ul> |
| RAM | 2GB minimum | |
| Hard disk space | 200MB minimum; 20GB recommended | |
| Supported operating system versions | <p>XDR Collector (XDRC) version 1.4.3 and later</p><ul><li><p>Windows 8</p><ul><li>8.1 (and with FIPS mode)</li><li>Embedded 8.1 Professional (Supported until January 2023)</li></ul></li><li><p>Windows Server</p><ul><li>2012 (Supported until January 2026), All editions; FIPS mode</li><li>Core option (Windows Server 2012 R2 only)</li></ul></li></ul><p>XDR Collector (XDRC) version 1.5.0 and later</p><ul><li><p>Windows 10</p><ul><li>Education</li><li>Pro (CB and CBB)</li><li>Enterprise (CB, CBB, and LTSB)</li><li>Updates 21H2, 21H1, 20H2, 2004, 1709, 1909, 1903, 1809, 1803 (Enterprise and Professional)</li><li>Updates 22H2, 22H1</li><li>Enterprise 2019 LTSC</li><li>Windows 10 IoT Core</li><li>Windows 10 IoT Enterprise</li></ul></li><li><p>Windows 11</p><ul><li>Windows 11</li><li>Updates 22H2, 22H1</li><li>Pro/Pro Education/Pro Workstations</li><li>Enterprise</li><li>Education/Home</li><li>IoT Enterprise</li></ul></li><li><p>Windows Server</p><ul><li>Datacenter</li><li>2012 (Supported until October 2026), 2012 R2 (Supported until January 2026), All editions; FIPS mode</li><li>2016 (Standard edition; Server with Desktop experience, previously known as Server with a GUI)</li><li>2016 Datacenter edition</li><li>2019</li><li>Core option (Windows Server 2012, 2012 R2, and 2016 only)</li><li>2019 Standard (Server Core)</li><li>2022</li><li>2025</li></ul></li></ul> | |
| Networking | <ul><li>Allow communication from the XDR Collector TCP port to the server (the default is port 443).</li></ul> | |
| Applications and utilities | <ul><li>Windows Accessories (Notepad) to view logs</li></ul> |
Resources required to enable access to XDR collectors
To enable access to XDR Collectors components, you must allow access to various Palo Alto Networks resources. If you use the specific Palo Alto Networks App-IDs indicated in the table, you do not need to explicitly allow access to the resource. A dash (-) indicates there is no App-ID coverage for a resource.
Some of the IP addresses required for access are registered in the United States. As a result, some GeoIP databases do not correctly pinpoint the location in which IP addresses are used. All customer data is stored in your deployment region, regardless of the IP address registration and restricts data transmission through any infrastructure to that region. For considerations, see Plan and preparePlan and prepare.
Throughout this topic, <xsiam-tenant> refers to the chosen subdomain of your Cortex XSIAM tenant and <region> is the region in which your Strata Logging Service is deployed.
Refer to the following tables for the FQDNs, IP addresses, ports, and App-ID coverage for your deployment.
For IP address ranges in GCP, refer to the following tables for IP address coverage for your deployment.
- https://www.gstatic.com/ipranges/goog.json: Refer to this list to look up and allow access to the IP address ranges subnets.
- https://www.gstatic.com/ipranges/cloud.json: Refer to this list to look up and allow access to the IP address ranges associated with your region.
The following table shows the required resources by region.
| FQDN | IP addresses and port | App-ID coverage |
|---|---|---|
<xsiam-tenant>.xdr.<region>.paloaltonetworks.com Used to connect to the Cortex XSIAM management console. |
<p>IP address by region:</p><ul><li>US (United States): 35.244.250.18</li><li>EU (Europe): 35.227.237.180</li><li>CA (Canada): 34.120.31.199</li><li>UK (United Kingdom): 34.120.87.77</li><li>JP (Japan): 35.241.28.254</li><li>SG (Singapore): 34.117.211.129</li><li>AU (Australia): 34.120.229.65</li><li>DE (Germany): 34.98.68.183</li><li>IN (India): 35.186.207.80</li><li>CH (Switzerland): 34.111.6.153</li><li>PL (Poland): 34.117.240.208</li><li>TW (Taiwan): 34.160.28.41</li><li>QT (Qatar): 35.190.0.180</li><li>FA (France): 34.111.134.57</li><li>IL (Israel): 34.111.129.144</li><li>SA (Saudi Arabia): 35.244.157.127</li><li>ID (Indonesia): 34.111.58.152</li><li>ES (Spain): 34.111.188.248</li><li>IT (Italy): 34.8.224.70</li><li>KR (South Korea): 34.54.5.247</li><li>ZA (South Africa): 34.149.165.12</li><li>FI (Finland): 34.160.63.63</li></ul><p>Port: 443</p> | cortex-xdr |
distributions.traps.paloaltonetworks.com Used for the first request in registration flow where the agent passes the distribution id and obtains the ch-<xsiam-tenant>.traps.paloaltonetworks.com of its tenant. |
<ul><li>IP address: 35.223.6.69</li><li>Port: 443</li></ul> | traps-management-service |
panw-xdr-installers-prod-us.storage.googleapis.com Used to download installers for upgrade actions from the server.This storage bucket is used for all regions. |
<ul><li>IP ranges in GCP</li><li>Port: 443</li></ul> | cortex-xdr |
global-content-profiles-policy.storage.googleapis.com Used to download content updates. |
<ul><li>IP ranges in GCP</li><li>Port: 443</li></ul> | cortex-xdr |
ch-<xsiam-tenant>.traps.paloaltonetworks.com Used for all other requests between the agent and its tenant server including heartbeat, uploads, action results, and scan reports. |
<p>IP address by region:</p><ul><li>US (United States): 34.98.77.231</li><li>EU (Europe): 34.102.140.103</li><li>CA (Canada): 34.96.120.25</li><li>UK (United Kingdom): 35.244.133.254</li><li>JP (Japan): 34.95.66.187</li><li>SG (Singapore): 34.120.142.18</li><li>AU (Australia): 34.102.237.151</li><li>DE (Germany): 34.107.161.143</li><li>IN (India): 34.120.213.188</li><li>CH (Switzerland): 34.149.180.250</li><li>PL (Poland): 35.190.13.237</li><li>TW (Taiwan): 34.149.248.76</li><li>QT (Qatar): 34.107.129.254</li><li>FA (France): 34.36.155.211</li><li>IL (Israel): 34.128.157.130</li><li>SA (Saudi Arabia): 34.107.213.85</li><li>ID (Indonesia): 34.128.156.84</li><li>ES (Spain): 34.120.102.147</li><li>IT (Italy): 34.8.234.58</li><li>KR (South Korea): 34.54.155.245</li><li>ZA (South Africa): 35.190.79.68</li><li>FI (Finland): 136.110.165.34</li></ul><p>Port: 443</p> | traps-management-service |
api-<xsiam-tenant>.xdr.<region>.paloaltonetworks.com Used for API requests and responses. |
<p>IP address by region:</p><ul><li>US (United States): 35.222.81.194</li><li>EU (Europe): 34.90.67.58</li><li>CA (Canada): 35.203.82.121</li><li>UK (United Kingdom): 34.89.56.78</li><li>JP (Japan): 34.84.125.129</li><li>SG (Singapore): 34.87.83.144</li><li>AU (Australia): 35.189.18.208</li><li>DE (Germany): 34.107.57.23</li><li>IN (India): 35.200.158.164</li><li>CH (Switzerland): 34.65.248.119</li><li>PL (Poland): 34.116.216.55</li><li>TW (Taiwan): 35.234.8.249</li><li>QT (Qatar): 34.18.46.240</li><li>FA (France): 34.155.222.152</li><li>IL (Israel): 34.165.156.139</li><li>SA (Saudi Arabia): 34.166.58.79</li><li>ID (Indonesia): 34.128.115.238</li><li>ES (Spain): 34.175.30.176</li><li>IT (Italy): 34.154.195.120</li><li>KR (South Korea): 34.64.54.175</li><li>ZA (South Africa): 34.35.64.191</li><li>FI (Finland): 35.228.73.215</li></ul><p>Port: 443</p> | - |
| Log forwarding to a syslog receiver | ||
| See Integrate a syslog receiver for information about log forwarding IP addresses per region for syslog receivers. |
The following table lists the required resources for Federal (United States - Government).
| FQDN | IP addresses and port | App-ID coverage | Required for XDR Collectors |
|---|---|---|---|
distributions-prod-fed.traps.paloaltonetworks.com Used for the first request in registration flow where the agent passes the distribution ID and obtains the ch-<xsiam-tenant>.traps.paloaltonetworks.com of its tenant. |
<ul><li>IP address: 104.198.132.24</li><li>Port: 443</li></ul> | traps-management-service |
|
panw-xdr-installers-prod-fr.storage.googleapis.com Used to download installers for upgrade actions from the server. |
<ul><li>IP ranges in GCP</li><li>Port: 443</li></ul> | cortex-xdr |
|
global-content-profiles-policy-prod-fr.storage.googleapis.com Used to download content updates. |
<ul><li>IP ranges in GCP</li><li>Port: 443</li></ul> | cortex-xdr |
|
ch-<xsiam-tenant>.traps.paloaltonetworks.com Used for all other requests between the agent and its tenant server including heartbeat, uploads, action results, and scan reports. |
<ul><li>IP address: 130.211.195.231</li><li>Port: 443</li></ul> | traps-management-service |
|
api-<xsiam-tenant>.xdr.federal.paloaltonetworks.com Used for API requests and responses. |
<ul><li>IP address: 130.211.195.231</li><li>Port: 443</li></ul> | - | |
| Log forwarding to a syslog receiver | |||
| See Integrate a syslog receiver for information about log forwarding IP addresses per region for syslog receivers. |
Manage XDR Collectors
On the XDR Collectors Administration page, you can view the list of collectors and perform additional tasks such as changing the alias of the collector, upgrading the collector version, and setting a proxy address and port for the collector.
XDR Collectors installation resource for Windows and Linux
The following table provides important information about the XDR Collectors installation for Windows and Linux.
| Installation component | Default path | Description | Related files/Services |
|---|---|---|---|
| Installation folder | <ul><li>Windows:%PROGRAMFILES%\Palo Alto Networks\XDR Collector</li><li>Linux:/opt/paloaltonetworks/xdr-collector</li></ul> |
The default installation path for the XDR Collector. Contains all Program Core files and executables. | <ul><li><p>Windows</p><ul><li>Service name: XDR Collector</li><li>Process name: xdrcollectorsvc.exe</li></ul></li><li><p>Linux</p><ul><li>Service name: xcd</li><li>Process name: xdr-collector.service</li></ul></li></ul> |
| Logs | <ul><li>Windows:%PROGRAMDATA%\XDR Collector\logs</li><li>Linux:/opt/paloaltonetworks/xdr-collector/logs</li></ul> |
<ul><li>Windows: Contains the XDR Collector application Log, the Filebeat application log, and the Winlogbeat application log. Indicates information, warnings, and errors related to the XDR Collector application.</li><li>Linux: Contains the XDR Collector application Log as well as the Filebeat application log. Indicates information, warnings, and errors related to the XDR Collector application.</li></ul><p>Contains the XDR Collector application Log as well as the Filebeat application log. Indicates information, warnings, and errors related to the XDR Collector application.</p> | <ul><li><p>Windows</p><ul><li>scouter.log</li><li>filebeat</li><li>winlogbeat</li></ul></li><li><p>Linux</p><ul><li>scouter.log</li><li>filebeat</li></ul></li></ul> |
| Configuration | <ul><li>Windows:%PROGRAMFILES%\Palo Alto Networks\XDR Collector\config</li><li>Linux:/opt/paloaltonetworks/xdr-collector/config</li></ul> |
Contains the XML configuration file of the XDR Collector for both Windows and Linux. Any change in this XML configuration file is saved to the XDR Collector database and the settings are taken from this file. ### Note In some circumstances, such as after an XDR Collectors upgrade, the configured settings in the XML configuration file can be erased. Yet, this won't affect the saved settings in the XDR Collectors database. | For both Windows and Linux, the file name is XDR_Collector.xml. |
| Persistence | <ul><li>Windows:%PROGRAMDATA%\XDR Collector\OSPersistence</li><li>Linux:/etc/panw/OSPersistence/</li></ul> |
Contains the Operating System persistence file for the XDR Collector, which issued as part of the registration process. | For both Windows and Linux, the file name is .scouter.json. |
Create an XDR Collector installation package
To install a Cortex XDR Collector for the first time, you must first create an XDR Collector installation package. After you create and download an installation package, you can then install it directly on the collector machine, or you can use a software deployment tool of your choice to distribute the software to multiple collector machines.
To install the XDR Collector software, you must use a valid installation package that exists in your XDR Collectors console. If you delete an installation package, any XDR Collectors installed from this package are not able to register to Cortex XSIAM.
XDR Collectors cannot be moved between Cortex XSIAM managing servers. In this situation, you need to uninstall the existing collector, and then install a new collector using an installation package from the new managing server. For more information on uninstalling, see Uninstall the XDR Collector.
To create a new installation package.
-
In Cortex XSIAM, select Settings → Configurations → XDR Collectors → Installers.
-
Click Create.
-
Enter a unique Name and an optional Description to identify the installation package.
The package Name must be no more than 100 characters and can contain letters, numbers, hyphens, underscores, commas, and spaces.
- Select the Platform for which you want to create the installation package as either Windows or Linux.
- Select the Version.
-
Create the installation package.
Cortex XSIAM prepares your installation package and makes it available in the XDR Collectors Installations page.
-
Download your installation package.
When the status of the package displays
Completed, right-click the Collector Version row, and click Download.- For a Windows installation, select Download 64 bit installer.
- For a Linux installation, you can download the Linux RPM installer or download the Linux DEB installer (according to your Linux collector machine distribution), and deploy the installers on the on-premise collector machines using the Linux package manager. Alternatively, you can download the Linux SH installer and deploy it manually on the Linux collector machine.
Once the applicable installation package is downloaded, you can install the package.
-
Other available options.
As needed, you can return to the XDR Collectors Installations page to manage your XDR Collectors installation packages. To manage a specific package, right-click the Collector Version, and select the desired action:
- Edit the package name or description.
-
Delete the installation package. Deleting an installation package does not uninstall the XDR Collector software from any on-premise collector machines.
Since Cortex XSIAM relies on the installation package ID to approve XDR Collector registration during install, it is not recommended to delete the installation package for any active on-premise collector machines. Hiding the installation package will remove it from the default list of available installation packages and can be useful to eliminate confusion in the XDR Collectors console main view. These hidden installations can be viewed by removing the default filter.
- Copy text to clipboard to copy the text from a specific field in the row of an installation package.
- Hide installation packages. Using the Hide option provides a quick method to filter out results based on a specific value in the table. You can also use the filters at the top of the page to build a filter from scratch. To create a persistent filter, save () it.
Install the XDR Collector installation package for Windows
Install the XDR collector on Windows using the MSI
Use the following workflow to install the XDR Collector using the MSI file.
Before completing this task, ensure that you create and download a Cortex XDR Collector installation package in Cortex XSIAM.
To install an XDR Collector installation package on Windows using the MSI file.
When the package is executed using the MSI, an installation log is generated in %TEMP%\MSI<Random characters>.log by default.
- With Administrator level privileges, run the MSI file that you downloaded in Cortex XSIAM on the collector machine. The installer displays a welcome dialog.
- Click Next.
- Select I accept the terms in the License Agreement and click Next.
- Install the XDR Collector. The installer displays the User Account Control dialog box.
- Click Yes.
- After you complete the installation, verify that the Cortex XDR Collector can establish a connection with Cortex XSIAM.
If the XDR Collector does not connect to Cortex XSIAM, verify your internet connection on the collector machine. If the XDR Collector still does not connect, verify that the installation package has not been removed from the Cortex XSIAM tenant.
Install the XDR Collector on Windows using Msiexec
Msiexec provides full control over the installation process and allows you to install, modify, and perform operations on a Windows Installer from the command line interface (CLI). You can also use Msiexec to log any issues encountered during installation.
You can also use Msiexec in conjunction with a System Center Configuration Manager (SCCM), Altiris, Group Policy Object (GPO), or other MSI deployment software to install the XDR Collector on multiple collector machines for the first time.
When you install the XDR Collector with Msiexec, you must install the XDR Collector per-machine and not per-user.
Although Msiexec supports additional options, the XDR Collectors installers support only the options listed here. For example, with Msiexec, the option to install the software in a non-standard directory is not supported—you must use the default path.
The following parameters apply to the initial installation of the XDR Collector on the collector machine.
/i <installer path>\<installer file name>.msi DATA_PATH=<Path> PROXY_LIST=<address or list> /quiet /l*v <installation log path>: Installs a package quietly, changes data path, adds proxies, and creates an installation log. For example,msiexec /i c:\install\XDRCollector-Win_x64.msi DATA_PATH=c:\data PROXY_LIST=2.2.2.2:8888,1.1.1.1:8080 /quiet /l*v c:\installlog.txtWhereLOG_LEVEL: Sets the level of logging for the XDR Collector log (INFO,DEBUG,ERROR, andTRACE).LOG_MAX_BYTES: Sets the maximum log size in bytes.LOG_BACKUP_COUNT: Number of cycling logs for the XDR Collector.PROXY_LIST: Proxy address or name, where you can add a comma separated list, such as 2.2.2.2:8888,1.1.1.1:8080.LOG_PATH: The path to save the XDR Collector, Filebeat, and Winlogbeat logs.DATA_PATH: The path for persistence, content, Filebeat application data, Winlogbeat application data, and transaction data.PROVISIONING_SERVER: Provisioning server address.DISTRIBUTION_IDELB_ADDRESS: Load balancer for fresh XDR Collector installation.
Before completing this task, ensure that you create and download a Cortex XDR Collector installation package in Cortex XSIAM.
To install XDR Collectors using Msiexec:
- Use one of the following methods to open a command prompt as an administrator.
- Select Start → All Programs Accessories. Right-click Command prompt and Run as administrator.
- Select Start. In the Start Search box, type
cmd. Then, to open the command prompt as an administrator, press CTRL+SHIFT+ENTER keys.
- Run the
msiexeccommand followed by one or more supported options and properties. For example:msiexec /i XDRCollector-Win_x64.msi DATA_PATH=c:\data PROXY_LIST=2.2.2.2:8888,1.1.1.1:8080 /quiet /l*v c:\installlog.txt
Install the XDR Collector installation package for Linux
You can install the XDR Collector using three available packages for a Linux installation: Linux RPM, Linux DEB, and Linux SH. You can install the XDR Collector package on any Linux server, including a physical or virtual machine, and as temporary sessions.
You can install XDR Collectors in any Linux server period, whether its a physical or virtual machine. Temporary sessions can be in either of them.
We recommend that you perform a Linux RPM or Linux DEB installation.
Before completing this task, ensure that you create and download a Cortex XDR Collector installation package, and then upload these installation files to your Linux environment.
To install the XDR Collectors installation package for Linux.
To install the XDR Collectors installation package for Linux.
-
Log on to the Linux server.
For example:
user@local ~ $ ssh root@ubuntu.example.com Welcome to Ubuntu 16.04.3 LTS (GNU/Linux 4.4.0-1041-aws x86_64) * Documentation: https://help.ubuntu.com * Management: https://landscape.canonical.com * Support: https://ubuntu.com/advantage Get cloud support with Ubuntu Advantage Cloud Guest: http://www.ubuntu.com/business/services/cloud 0 packages can be updated. 0 updates are security updates. Last login: Tue Aug 26 22:14:15 2021 from 192.168.1.100 -
Extract the installation files you uploaded using one of the following commands, which is dependent on the Linux package you downloaded:
Linux Package Extract Command Linux RPM tar xvf <installation_package_name>.rpmLinux DEB tar xvf <installation_package_name>.debLinux SH tar xvf <installation_package_name>.sh -
Create a directory and copy the
collector.confinstallation file to the/etc/panw/directory.sudo mkdir -p /etc/panw sudo cp ./collector.conf /etc/panw/
-
Install the XDR Collectors software.
You can install the XDR Collectors on the collector machine manually using the shell installer or using the Linux package manager for
.rpmand.debinstallers:When performing a XDR Collector installation or upgrade in Linux using a shell installer, the
/tmpfolder cannot be marked asnoexec. Otherwise, the installation or upgrade fails. As a workaround, before the installation or upgrade, use the following command:mount -o remount,exec /tmp
To deploy using package manager:
-
Depending on your Linux distribution, install the XDR Collectors using one of the following commands, where the
<file name>is taken from the files provided in the downloaded Linux installation package:Distribution Install Command RHEL or Oracle <ul><li> yum install ./<file_name>.rpm</li><li>rpm -i ./<file_name>.rpm</li></ul>Ubuntu or Debian <ul><li> apt-get install ./<file_name>.deb</li><li>dpkg -i ./<file_name>.deb</li></ul>SUSE <ul><li> zypper install ./<file_name>.rpm</li><li>rpm -i ./<file_name>.rpm</li></ul> -
Verify the XDR Collectors was installed on the collector machine.
Enter the following command on the collector machine:
dpkg -l | grep xdr-collectororrpm -qa | grep xdr-collector.
To deploy the shell installer:
- Enable execution of the script using the
chmod +x <file_name>.shcommand, where the<file name>is taken from the file provided in the downloaded Linux installation package. -
Run the install script as root or with root permissions.
For example:
root@ubuntu:/home# chmod +x linux.sh root@ubuntu:/home# ./linux.sh Verifying archive integrity... All good. Uncompressing XDR-Collector version 1.0.0.467 100% Systemd: starting xdr-collector service Synchronizing state of xdr-collector.service with SysV service script with /lib/systemd/systemd-sysv-install. Executing: /lib/systemd/systemd-sysv-install enable xdr-collector Created symlink /etc/systemd/system/multi-user.target.wants/xdr-collector.service→ /lib/systemd/system/xdr-collector.service.
If the XDR Collector does not connect to Cortex XSIAM, verify your Internet connection on the collector machine. If the XDR Collector still does not connect, verify the installation package has not been removed from the Cortex XSIAM management console.
If you are using rpm or deb installers, you must also add these parameters to the /etc/panw/collector.conf file prior to installation.
| Option | Description |
|---|---|
--proxy-list "<proxyserver>:<port>" |
<p>Proxy communication</p><p>Configure the XDR Collector to communicate through an intermediary such as a proxy.</p><p>To enable the XDR Collector to direct communication to an intermediary, you use this installation option to assign the IP address and port number you want the XDR Collector to use. You can also configure the proxy by entering the FQDN and port number. When you enter the FQDN, you can use both lowercase and uppercase letters. Avoid using special characters or spaces.</p><p>Use double quotes (" ") to enclose the IP address and port number. Use commas to separate multiple addresses. For example:</p><p>--proxy-list "My.Network.Name:808, 10.196.20.244:8080"</p><p>After the initial installation, you can change the proxy settings from using the configuration XML.</p><p>The XDR Collector does not support proxy communication in environments where proxy authentication is required.</p> |
--data-path <directory path> |
<p>Directory path</p><p>The path for persistence, content, Filebeat application data, and transaction data.</p><p>--data–path=/tmp/xdrLog</p> |
Configure XDR Collector upgrade scheduler
You can configure the Cortex XDR Collector upgrade scheduler and the number of parallel upgrades.
You can configure the Cortex XDR Collector upgrade scheduler and the number of parallel upgrades. There can be a maximum of 500 parallel upgrades scheduled in a week, which is the default configuration at any time of day.
To define the XDR Collector upgrade scheduler and number of parallel upgrades.
- In Cortex XSIAM, select Settings → Configurations → XDR Collectors → Configuration.
- Set the XDR Collectors Configurations settings.
Amount of Parallel Upgrades: Specify the number of parallel upgrades, where the maximum number is 500 (default).Days in Week: Select the specific days in the week that you want the upgrade to occur, where the default is configured as every day in the week.Schedule: Select whether you want the upgrade to be at Any time (default) or at a Specific time. When setting a specific time, you can set the From and To times.
- Click Save.
Set an application proxy for XDR Collectors
You can set an application-specific proxy for a Cortex XDR Collector without affecting the communication of other applications on the collector machine.
In environments where Cortex XDR Collectors communicate with the Cortex XSIAM server through a wide system proxy, you can set an application-specific proxy for the XDR Collector without affecting the communication of other applications on the collector machine. You can set the proxy after installation from the XDR Collectors Administration page in Cortex XSIAM as described in this topic. You can assign up to ten different proxy servers per XDR Collector. The proxy server that the agent uses is selected randomly and with equal probability. If the communication between the XDR Collector and the Cortex XSIAM server through the app-specific proxies fails, the XDR Collector resumes communication through the system-wide proxy defined on the collector machine. If that fails as well, the XDR Collector resumes communication with Cortex XSIAM directly.
- In Cortex XSIAM, select Settings → Configurations → XDR Collectors → Administration.
- If needed, filter the list of on-premise collector machines.
- Set an agent proxy.
- Select the row of the on-premises collector machine that you want to set as a proxy.
- Right-click the collector machine, and select Set Collector proxy.
- You can assign up to ten different proxies per XDR Collector. For each proxy, specify the IP address and port number. After each Proxy Address and Port added, select
- Click Set when you’re done.
- If necessary later, you can disable the collector proxy by selecting Disable Collector Proxy from the right-click menu.\
When you disable the proxy configuration, all proxies associated with that XDR Collector are removed. The XDR Collector resumes communication with the Cortex XSIAM server through the wide-system proxy if defined; otherwise, if a wide-system is not defined, the XDR Collector resumes communicating directly with the Cortex XSIAM server. If neither a wide-system proxy nor direct communication exist and you disable the proxy, the XDR Collector disconnects from Cortex XSIAM.
Set an alias for an XDR Collector machine
Configure an alias to identify one or more collector machines by a name that is different from the collector machine hostname.
To identify one or more collector machines by a name that is different from the collector machine hostname, you can configure an alias. You can set an alias for a single collector machine or you can set an alias for multiple collector machines in bulk. To quickly search for the collector machines during investigation and when you need to take action, you can use the either the collector machine hostname or the alias.
- Select Settings → Configurations → XDR Collectors → Administration.
- Select one or more collector machines.
- Right-click anywhere in the collector machine rows, and select Change Collector Alias.
- Specify the alias name and Update.
- Use the Quick Launcher to search the collector machines by alias across the XDR Collectors console.
Upgrade XDR Collectors
After you install the Cortex XDR Collector and the XDR Collector registers with Cortex XSIAM, you can upgrade the XDR Collector software for on-premises Windows or Linux collector machine. You need to create a new installation packages and push the XDR Collector package to up to 500 collector machines from Cortex XSIAM.
- Create an XDR Collector Installation Package for each operating system version where you want to upgrade the XDR Collector. Note the installation package names.
- Select Settings → XDR Collectors → Administration. If needed, filter the list of on-premises collector machines. To reduce the number of results, use the collector machine name search and filters at the top of the page.
- Select the collector machines that you want to upgrade. You can also select collector machines running different operating systems to upgrade the XDR Collectors at the same time.
- Right-click your selection, and select Upgrade Collector version. For each platform, select the name of the installation package you want to push to the selected on-premises collector machines.\
Note The XDR Collector keeps the name of the original installation package after every upgrade. - Upgrade.\
Cortex XSIAM distributes the installation package to the selected collector machine at the next heartbeat communication with the XDR Collector. To monitor the status of the upgrades, go to Investigation & Response → Response → Action Center. From the Action Center you can also view additional information about the upgrade (right-click the action and select Additional data) or cancel the upgrade (right-click the action and select Cancel Collector Upgrade).
Uninstall the XDR Collector
If you want to uninstall the XDR Collector from the on-premise collector machine, you can do so from the XDR Collectors console at any time. You can uninstall the XDR Collector from an unlimited number of collector machines in a single bulk action. Uninstalling a collector machine triggers the following lifespan flow:
- Once you uninstall the XDR Collector from the on-premise collector machine, Cortex XSIAM distributes the uninstall to the selected collector machine at the next heartbeat communication with the XDR Collector. All XDR Collector files are removed from the collector machine.
- The collector machine status changes to
Uninstalled. After a retention period of 7 days, the XDR Collector is deleted from the database and is displayed in XDR as Collector Machine Name -N/A (Uninstalled). - Data associated with the deleted on-premise collector machine is displayed in the Action Center tables for the standard 90 days retention period.
The following workflow describes how to uninstall the XDR Collector from one or more Windows or Linux on-premise collector machines.
- Select Settings → Configurations → XDR Collectors → Administration.
- Select the collector machines you want to uninstall. You can also select collector machines running different operating systems to uninstall the XDR Collectors at the same time.
- Right-click your selection and select Uninstall Collector.
- To proceed, select I agree to confirm that you understand this action uninstalls the XDR Collector on all selected collector machines.
- Click OK.\
To monitor the status of the uninstall process, go to Investigation & Response → Response → Action Center.
Define XDR Collector machine groups
To easily apply policy rules and manage specific collector machines, you can define a collector machine group.
To easily apply policy rules and manage specific collector machines, you can define a collector machine group. If you set up Directory Sync, you can also leverage your Active Directory user, group, and computer information in collector machine groups.
There are two methods you can use to define a collector machine group:
- Create a dynamic group by allowing Cortex XSIAM to populate your collector machine group dynamically using collector machine characteristics, such as a partial hostname or alias; full or partial domain name; IP address, range or subnet; XDR Collector version; or operating system version.
- Create a static group by selecting a list of specific collector machines.
After you define a collector machine group, you can then use it to target policy and actions to specific recipients. The XDR Collectors Groups page displays all collector machine groups along with the number of collector machines and policy rules linked to the collector machine group.
To define a collector machine static or dynamic group:
- In Cortex XSIAM , select Settings → Configurations → XDR Collectors → Groups.
- Select +Add Group to create a new collector machine group.
- Specify a group name and optional description in the corresponding fields, to identify the collector machine group. The name that you assign to the group will be visible when you assign endpoint security profiles to endpoints.
- Determine the collector machine properties for creating a collector machine group:
- Dynamic: Use the filters to define the criteria you want to use to dynamically populate a collector machine group. Dynamic groups support multiple criteria selections and can use AND or OR operators. For collector machine names and aliases, and domains, you can use
*to match any string of characters. As you apply filters, Cortex XSIAM displays any registered collector machine matches to help you validate your filter criteria. ### Note XDR Collectors only support IPv4 addresses. - Static: Select specific registered collector machines that you want to include in the collector machine group. Use the filters, as needed, to reduce the number of results. When you create a static collector machine group from a file, the IP address, hostname, or alias of the collector machine must match an existing Cortex XSIAM that has registered with Cortex XSIAM .\
Note: Disconnecting Directory Sync in your Cortex XSIAM deployment can affect existing collector machine groups and policy rules based on Active Directory properties.
- Dynamic: Use the filters to define the criteria you want to use to dynamically populate a collector machine group. Dynamic groups support multiple criteria selections and can use AND or OR operators. For collector machine names and aliases, and domains, you can use
- Create the collector machine group.\
After you save your collector machine group, it is ready for use to assign in policies for your collector machines and in other places where you can use collector machine groups. - Manage a collector machine group, as needed.\
At any time, you can return to the XDR Collectors Endpoints page to view and manage your collector machine groups. To manage a group, right-click the group and select the desired action.- Edit: View the collector machines that match the group definition, and optionally refine the membership criteria using filters.
- Delete the collector machine group.
- Save as new: Duplicate the collector machine group and save it as a new group.
- View collectors: Pivot from an collector machine group to a filtered list of collector machines on the Administration page where you can quickly view and initiate actions on the collector machines within the group.
- Copy text to clipboard to copy the text from a specific field in the row of a group.
- Copy entire row to copy the text from all the fields in a row of a group.
- Show rows with ‘’ to filter the group list to only display the groups with a specific group name.
- Hide rows with ‘’ to filter the group list to hide the groups for a specific group name.
About Cortex XDR Collector content updates
When a new update is available, Cortex XSIAM notifies the XDR Collectors. The XDR Collectors then randomly choose a time within a six-hour window during which they retrieve the content update from Cortex XSIAM.
XDR Collector profiles
You can add XDR collector profiles that define the type of data that is collected from Linux or Windows platforms.
Add an XDR Collector profile for Windows
Note
Ingestion of log events larger than 5 MB is not supported.
Profile types
XDR Collector profiles define the data that is collected from a Windows collector machine, and define automatic upgrade settings for the XDR collector. For Windows, you can configure a Filebeat profile, a Winlogbeat profile, and a Settings profile.
Filebeat profile
Use an XDR Collector Windows Filebeat profile to collect file and log data using the Elasticsearch Filebeat default configuration file, called filebeat.yml.
Supported versions and architectures
Cortex XSIAM supports the following Elasticsearch Filebeat versions with the operating systems listed in the Elasticsearch support matrix that conform with the collector machine operating systems supported by Cortex XSIAM:
- 64-bit XDR Collectors: Supports Filebeat version 8.15.
- 32-bit XDR Collectors: Supports Filebeat version 7.17.1
Cortex XSIAM supports the input types and modules available in Elasticsearch Filebeat.
Note
Fileset validation is enforced. You must enable at least one fileset in the module, because filesets are disabled by default.
Log format constraints
- Cortex XSIAM collects all logs in either an uncompressed JSON or text format.
- Compressed files, such as the gzip format, are not supported.
- Logs in single line format or multiline format are supported. For more information about handling messages that span multiple lines of text in Elasticsearch Filebeat, see Manage Multiline Messages.
Related Information
- Elasticsearch Filebeat Overview Documentation
- Configure Filebeat Inputs in Elasticsearch
- Configure Filebeat Modules in Elasticsearch
- Elasticsearch Support Matrix
- XDR Collector machine requirements and supported operating systems
- Collection of Windows DHCP logs and Windows DNS Debug logs:
- How to configure XDR Collector profiles
Winlogbeat Profile
Use an XDR Collector Windows Winlogbeat profile to collect event log data, using the Elasticsearch Winlogbeat default configuration file, called winlogbeat.yml.
Supported versions and architectures
Cortex XSIAM supports the following Elasticsearch Winlogbeat versions with the Windows versions listed in the Elasticsearch support matrix that conform with the collector machine operating systems supported by Cortex XSIAM:
- 64-bit XDR Collectors: Supports Winlogbeat version 9.3.2.
- 32-bit XDR Collectors: Supports Winlogbeat version 7.17.1.
Cortex XSIAM supports the modules available in Elasticsearch Winlogbeat.
Data ingestion and normalization
After ingestion, Cortex XSIAM normalizes and saves the Windows event logs collected by the Winlogbeat profile in the dataset xdr_data. The normalized logs are also saved in a unified format in <vendor>_<product>_raw if the product and vendor are defined, and otherwise, in microsoft_windows_raw. You can search the data using Cortex Query Language XQL queries, build correlation rules, and generate dashboards based on the data. For more information, see Query Windows Event Log records.
Related information
- Elasticsearch Winlogbeat Overview Documentation
- Winlogbeat Modules in ElasticSearch
- Elasticsearch Support Matrix
- XDR Collector machine requirements and supported operating systems
- Collection of Windows DHCP logs and Windows DNS Debug logs:
- How to configure XDR Collector profiles
Settings profile
Use an XDR Collector Settings profile to configure automatic upgrade settings for XDR Collector releases.
Policy mapping
To map your XDR Collector profile to a collector machine, you must use an XDR Collector policy. After you have created your profile, map it to a new or existing policy.
For more information on configuring an XDR Collector profile for a Settings configuration, see How to configure XDR Collector profiles.
How to configure XDR Collector profiles
Note
Ingestion of log events larger than 5 MB is not supported.
Filebeat configuration
In the Filebeat Configuration File editor, you can define the data collection for your Elasticsearch Filebeat configuration file called filebeat.yml.
Cortex XSIAM provides YAML templates for DHCP, DNS, IIS, XDR Collector Logs, NGINX, and any templates added by the content packs installed from the XSIAM Marketplace.
- Select Settings → Configurations → XDR Collectors → Profiles → +Add Profile → Windows.
- Select Filebeat, then click Next.
- Configure the General Information parameters.
- Profile Name: Enter a unique name to identify the profile. The name can contain only letters, numbers, or spaces, and must be no more than 30 characters. The name that you enter here will be displayed in the list of profiles when you configure a policy.
- (Optional) Add description here: To provide additional context for the purpose or business reason for your new profile, enter a profile description.
- In the Filebeat Configuration File editing box, type or paste the contents of your configuration file, or use a template. To add a template, select one from the list, and click Add.
-
Cortex XSIAM supports all sections in the
filebeat.ymlconfiguration file, such as support for Filebeat fields and tags. You can use the "Add fields" processor to identify the product/vendor for the data collected by the XDR Collectors, so that the collected events go through the ingestion flow (Parsing Rules). To configure the product/vendor, ensure that you use the defaultfieldsattribute (do not use the target attribute), as shown in the following example:processors: - add_fields: fields: vendor: <Vendor> product: <Product>For more information about the "Add fields" processor, see Add_fields.
-
To finish creating your new profile, click Create.
Your new profile will be listed under the applicable platform on the XDR Collectors Profiles page.
- Apply profiles to XDR Collector machine policies by performing one of the following:
- Right-click a profile, and select Create a new policy rule using this profile.
- Launch the new policy wizard from XDR Collectors → Policies → XDR Collectors Policies.
Winlogbeat configuration
In the Winlogbeat Configuration File editor, you can define the data collection for your Elasticsearch Winlogbeat configuration file called winlogbeat.yml.
Cortex XSIAM provides YAML templates for Windows Security, and any templates added by the content packs installed from the XSIAM Marketplace. To add a template, select it and click Add.
- Select Settings → Configurations → XDR Collectors → Profiles → +Add Profile → Windows.
- Select the Winlogbeat profile, then click Next.
- Configure the General Information parameters.
- Profile Name: Enter a unique name to identify the profile. The name can contain only letters, numbers, or spaces, and must be no more than 30 characters. The name that you enter here will be displayed in the list of profiles when you configure a policy.
- (Optional) Add description here: To provide additional context for the purpose or business reason for your new profile, enter a profile description.
- In the Winlogbeat Configuration File editing box, type or paste the contents of your configuration file, or use the template. To add the template, click Select template, and then click Windows Security. Click Add.
-
Cortex XSIAM supports all sections in the
winlogbeat.ymlconfiguration file, such as support for Winlogbeat fields and tags. You can use the "Add fields" processor to identify the product/vendor for the data collected by the XDR Collectors, so that the collected events go through the ingestion flow (Parsing Rules). To configure the product/vendor, ensure that you use the defaultfieldsattribute (do not use thetargetattribute), as shown in the following example:processors: - add_fields: fields: vendor: <Vendor> product: <Product>For more information about the "Add fields" processor, see Add_fields.
-
To finish creating your new profile, click Create.
Your new profile will be listed under the applicable platform on the XDR Collectors Profiles page.
- Apply profiles to XDR Collector machine policies by performing one of the following:
- Right-click a profile, and select Create a new policy rule using this profile.
- Launch the new policy wizard from XDR Collectors → Policies → XDR Collectors Policies.
Settings configuration
You can configure automatic upgrades for XDR Collector releases. By default, this is disabled, and the Use Default (Disabled) option is selected. To implement automatic upgrades, follow these steps:
- Select Settings → Configurations → XDR Collectors → Profiles → +Add Profile → Windows.
- Select Settings profile, then click Next.
- Configure the General Information parameters.
- Profile Name: Enter a unique name to identify the profile. The name can contain only letters, numbers, or spaces, and must be no more than 30 characters. The name that you enter here will be displayed in the list of profiles when you configure a policy.
- (Optional) Add description here: To provide additional context for the purpose or business reason for your new profile, enter a profile description.
- Clear the Use Default (Disabled) checkbox.
-
For Collector Auto-Upgrade, select Enabled.
Additional fields are displayed for defining the scope of the automatic upgrade.
- Configure the scope of automatic upgrades:
- To ensure the latest XDR Collector release is used, leave the Use Default (Latest collector release) checkbox selected.
- To configure only a particular scope, perform the following steps:
- Clear the Use Default (Latest collector release) checkbox.
-
For Auto Upgrade Scope, select one of the following options:
Option More details Latest collector release Configures the scope of the automatic upgrade to whenever a new XDR Collector release is available including maintenance releases and new features. Only maintenance release Configures the scope of the automatic upgrade to whenever a new XDR Collector maintenance release is available. Only maintenance releases in a specific version Configures the scope of the automatic upgrade to whenever a new XDR Collector maintenance release is available for a specific version. When this option is selected, you can select the specific Release Version.
-
To finish creating your new profile, click Create.
Your new profile will be listed under the applicable platform on the XDR Collectors Profiles page.
- Apply profiles to XDR Collector machine policies by performing one of the following:
- Right-click a profile, and select Create a new policy rule using this profile.
- Launch the new policy wizard from XDR Collectors → Policies → XDR Collectors Policies.
Additional XDR Collector profile management options
As needed, you can return to the XDR Collectors Profiles page to manage your XDR Collectors profiles. To manage a specific profile, right-click anywhere in an XDR Collector profile row, and select the desired action:
| Option | Description |
|---|---|
| Edit | Lets you edit the XDR Collector profile. |
| Save As New | Copies the existing profile with its current settings, so that you can make modifications, and save it as a new profile with a unique name. |
| Delete | Deletes the XDR Collector profile. |
| View Collector Policies | Opens a new tab that displays the XDR Collectors Policies page, showing the policies that are currently associated with your XDR Collector profiles. |
| Copy text to clipboard | Copies the text from a specific field in the row of a XDR Collector profile. |
| Copy entire row | Copies the text from the entire row of a XDR Collector profile. |
Query Windows Event Log records
When the XDR Collector forwards Windows Event Log records to Cortex XSIAM, the records are available in Cortex Query Language (XQL) through two datasets, depending on the event's source provider. Use the correct dataset and field for your query to ensure you find the expected data.
Dataset selection
| Dataset | What it contains | Use it when… |
|---|---|---|
xdr_data |
All Windows Event Log records collected by the XDR Collector, in an EDR-style schema. | You want a single dataset that always contains every collected Windows event, regardless of the source provider. |
microsoft_windows_raw |
Windows Event Log records, parsed in raw schema. By default, some high-volume or specialized providers are excluded (see below). | You want events in the standard microsoft_windows_raw schema and you do not need the excluded providers. |
Providers excluded from microsoft_windows_raw
The default Windows parsing rule excludes the following providers from microsoft_windows_raw to avoid duplicating data already consumed by out-of-the-box content in xdr_data:
- AD FS Auditing
- Microsoft-Windows-Sysmon
- Microsoft-Antimalware-Scan-Interface
- Microsoft-Windows-DNSServer
- Microsoft-Windows-DNS-Server-Service
Events from these providers are still ingested and are always queryable from xdr_data. They will not appear in microsoft_windows_raw unless you override the default rule.
To include excluded providers: Select Settings → Configurations → Data Management → Parsing Rules, edit the rule for vendor = microsoft, product = windows, and remove the provider from the exclusion list.
Tip
If you query microsoft_windows_raw for events from one of these providers and get zero results, this is expected. Query xdr_data instead.
For example
In this example the pack name is Microsoft Windows Event Logs.
[INGEST:vendor="microsoft", product="windows", target_dataset="microsoft_windows_raw", no_hit=drop] filter to_string(time_created) ~= ".*\d{2}:\d{2}:\d{2}.*" AND provider_name not in ("Microsoft-Windows-Sysmon", "AD FS Auditing", "Microsoft-Antimalware-Scan-Interface","Microsoft-Windows-DNSServer", "Microsoft-Windows-DNS-Server-Service") | alter tmp_get_time = to_epoch(_time), tmp_get_insert_time = to_epoch(_insert_time), tmp_get_time_created = to_epoch(parse_timestamp("%FT%H:%M:%E*SZ",to_string(time_created))) | alter _time = if(subtract(tmp_get_time_created, tmp_get_time) < 0, to_timestamp(tmp_get_time_created), subtract(tmp_get_insert_time, tmp_get_time) < 0, to_timestamp(tmp_get_insert_time), to_timestamp(tmp_get_time)) | alter _scope = coalesce(_scope, event_data -> _scope, event_data -> scope) | fields -tmp*;
Field Mapping in xdr_data
When querying Windows Event Log records in xdr_data, use the following fields. The most common pitfall is using event_id to filter by Windows EventID; in xdr_data, this field is an internal identifier.
Important
To filter by Windows EventID, always use action_evtlog_event_id.
| XQL Field in xdr_data | What it contains |
|---|---|
action_evtlog_event_id |
The Windows EventID (such as, 501, 512, 4624, 400). Use this field when filtering by EventID. |
event_id |
Internal per-record identifier. Do not use this to filter by EventID. |
event_type |
15 for all Windows Event Log records. |
event_sub_type |
11 for all Windows Event Log records. |
agent_hostname |
Source machine hostname. |
action_evtlog_provider_name |
Source provider name (e.g., AD FS Auditing, PowerShell). |
action_evtlog_record_id |
Windows Event Log RecordNumber. |
action_evtlog_data_fields |
JSON string containing original EventData key/value pairs. |
Example queries
Find Windows EventID 501 from a specific host:
dataset = xdr_data | filter agent_hostname = "<hostname>" and action_evtlog_event_id = 501 | fields _time, agent_hostname, action_evtlog_event_id, action_evtlog_provider_name, action_evtlog_record_id, action_evtlog_data_fields | sort desc _time | limit 50
Find events from providers excluded from microsoft_windows_raw:
dataset = xdr_data | filter agent_hostname = "<hostname>" and action_evtlog_provider_name in ("AD FS Auditing", "Microsoft-Windows-Sysmon") and action_evtlog_event_id in (501, 512) | fields _time, agent_hostname, action_evtlog_event_id, action_evtlog_provider_name, action_evtlog_data_fields | sort desc _time | limit 50
Troubleshooting checklist
If you cannot find an expected Windows event:
- Confirm collection: Query
xdr_datafiltered byagent_hostnameandaction_evtlog_event_id. - Verify field usage: Ensure you are filtering on
action_evtlog_event_id, notevent_id. - Check dataset/provider match: If querying
microsoft_windows_raw, ensure the provider isn't in the exclusion list. If it is, switch toxdr_data. - Check collector profile: In Windows Event Viewer, check the Log Name property of the event. This exact string must be listed under
winlogbeat.event_logs:in your collector profile.
Ingest logs from Windows DHCP using Elasticsearch Filebeat
You can extend visibility into logs from Windows DHCP, and enrich network logs with Windows DHCP data by using one of the following data collectors with Elasticsearch Filebeat :
- XDR Collector profile (recommended)
- Windows DHCP collector
When Cortex XSIAM begins receiving logs, it automatically creates a Windows DHCP dataset (microsoft_dhcp_raw). Cortex XSIAM uses Windows DHCP logs to enrich your network logs with hostnames and MAC addresses. Using XQL Search, you will be able to search for these items in the microsoft_dhcp_raw dataset.
Although this enrichment is available when configuring a Windows DHCP collector for a cloud data collection integration, we recommend configuring Cortex XSIAM to receive Windows DHCP logs with an XDR Collector Windows Filebeat profile, because it is simpler to set up.
Related information
- For more information about configuring the
filebeat.ymlfile, see Elasticsearch Filebeat documentation.
Ingest Windows DHCP Logs with an XDR Collector Profile
When you add an XDR Collector Windows Filebeat profile using the Elasticsearch Filebeat default configuration file, called filebeat.yml, you can define whether the collected data undergoes follow-up processing in the backend for Windows DHCP data. You can further enrich network logs with Windows DHCP data by setting vendor to “microsoft”, and product to “dhcp” in the filebeat.yml file.
Configuration activities include editing the filebeat.yml file. To avoid formatting issues in this file, use the template provided by Cortex XSIAM to make your customizations. We recommend that you edit the file inside the user interface, instead of copying it and editing it elsewhere. Validate the syntax of the YML file before you finish creating your profile.
Configure Cortex XSIAM to receive logs from Windows DHCP using an XDR Collector Windows Filebeat profile:
- In Cortex XSIAM, select Settings → Configurations → XDR Collectors → Profiles → +Add Profile → Windows.
- Select Filebeat, then click Next.
- Configure the General Information parameters:
- Profile Name: Enter a unique name to identify the profile. The name can contain only letters, numbers, or spaces, and must be no more than 30 characters. The name that you enter here will be displayed in the list of profiles when you configure a policy.
- (Optional) Add description here: To provide additional context for the purpose or business reason for your new profile, enter a profile description.
-
In the Filebeat Configuration File editing box, select the DHCP template, and click Add.
The template's content is displayed in the editing area.
- Edit the template text as necessary for your system.
-
To finish creating your new profile, click Create.
Your new profile will be listed under the applicable platform on the XDR Collectors Profiles page.
- Apply profiles to XDR Collector machine policies by performing one of the following:
- Right-click a profile, and select Create a new policy rule using this profile.
- Launch the new policy wizard from XDR Collectors → Policies → XDR Collectors Policies.
Ingest Windows DHCP Logs with the Windows DHCP Collector
To receive Windows DHCP logs with this collector, you must configure data collection from Windows DHCP via Elasticsearch Filebeat. This is configured by setting up a Windows DHCP Collector in Cortex XSIAM and installing and configuring an Elasticsearch Filebeat agent on your Windows DHCP Server. Cortex XSIAM supports using Filebeat up to version 8.0.1 with the Windows DHCP Collector.
Certain settings in the Elasticsearch Filebeat default configuration file called filebeat.yml must be populated with values provided when you configure the Data Sources settings in Cortex XSIAM for the Windows DHCP Collector. To help you configure the filebeat.yml file correctly, Cortex XSIAM provides an example file that you can download and customize. After you set up collection integration, Cortex XSIAM begins receiving new logs and data from the source.
Windows DHCP logs are stored as CSV (comma-separated values) log files. The logs rotate by days (DhcpSrvLog-<day>.log), and each file contains two sections: Event ID Meaning, and the events list.
Configuration activities include editing the filebeat.yml file. To avoid formatting issues in this file, use the example file provided by Cortex XSIAM to make your customizations. Do not copy and paste the code syntax examples provided later in this procedure into your filebeat.yml file. Validate the syntax of the YML file before you finish creating your profile.
Configure Cortex XSIAM to receive logs from Windows DHCP via Elasticsearch Filebeat with the Windows DHCP collector:
- In Cortex XSIAM, configure the Windows DHCP Collector.
- Select Settings → Data Sources.
- Click Add Instance to begin a new configuration.
- Search for
Windows DHCP. -
In the Windows DHCP collector box, click Connect.
The Enable Windows DHCP Log Collection dialog box is displayed.
-
(Optional, but recommended) Download the example
filebeat.ymlfile.To help you configure your
filebeat.ymlfile correctly, Cortex XSIAM provides an examplefilebeat.ymlfile that you can download and customize. To download this file, click the filebeat.yml link provided in this dialog box. - In the Name field, specify a descriptive name for your log collection configuration.
-
Click Save & Generate Token. A key is displayed.
Click the copy icon next to the key, and save the copy somewhere safe. You will need to provide this key when you set the
api_keyvalue in the Elasticsearch Output section in thefilebeat.ymlfile, as explained in Step #2. If you forget to record the key and close the window, you will need to generate a new key and repeat this process. - Click Done to close the dialog box.
- Expand the Windows DHCP collector that you just created. Click the Copy api url icon, and save the copy somewhere safe. You will need to provide this URL when you set the
hostsvalue in the Elasticsearch Output section in thefilebeat.ymlfile, as explained in Step #2.
- On your Windows DHCP Server, configure an Elasticsearch Filebeat agent.
- Navigate to the Elasticsearch Filebeat installation directory, and open the
filebeat.ymlfile to configure data collection with Cortex XSIAM. We recommend that you use the download example file provided by Cortex XSIAM. - Update the following sections and tags in the
filebeat.ymlfile. The following code examples detail the specific sections to make these changes in the file.-
Filebeat inputs: Define the paths to crawl and fetch. The code in the example below shows how to configure the Filebeat inputs section in the
filebeat.ymlfile with these paths configured.# ============================== Filebeat inputs =============================== filebeat.inputs: # Each - is an input. Most options can be set at the input level, so # you can use different inputs for various configurations. # Below are the input specific configurations. - type: log # Change to true to enable this input configuration. enabled: true # Paths that should be crawled and fetched. Glob based paths. paths: - c:\Windows\System32\dhcp\DhcpSrvLog*.log -
Elasticsearch Output: Set the
hostsandapi_key, where both of these values were obtained when you configured the Windows DHCP Collector in Cortex XSIAM, as explained in Step #1. The following code example shows how to configure the Elasticsearch Output section in thefilebeat.ymlfile, and indicates which settings need to be obtained from Cortex XSIAM.# ---------------------------- Elasticsearch Output ---------------------------- output.elasticsearch: enabled: true # Array of hosts to connect to. hosts: ["OBTAIN THIS URL FROM CORTEX XDR"] # Protocol - either `http` (default) or `https`. protocol: "https" compression_level: 5 # Authentication credentials - either API key or username/password. api_key: "OBTAIN THIS KEY FROM CORTEX XDR"
-
Processors: Set the
tokenizerand add adrop_event processorto drop all events that do not start with an event ID. The code in the example below shows how to configure the Processors section in thefilebeat.ymlfile and indicates which settings need to be obtained from Cortex XSIAM.The
tokenizerdefinition is dependent on the Windows server version that you are using, because the log format differs.- For platforms earlier than Windows Server 2008, use
"%{id},%{date},%{time},%{description},%{ipAddress},%{hostName},%{macAddress}" - For Windows Server 2008 and 2008 R2, use
"%{id},%{date},%{time},%{description},%{ipAddress},%{hostName},%{macAddress},%{userName},%{transactionID},%{qResult},%{probationTime},%{correlationID}" - For Windows Server 2012 and later, use
"%{id},%{date},%{time},%{description},%{ipAddress},%{hostName},%{macAddress},%{userName},%{transactionID},%{qResult},%{probationTime},%{correlationID},%{dhcid},%{vendorClassHex},%{vendorClassASCII},%{userClassHex},%{userClassASCII},%{relayAgentInformation},%{dnsRegError}"
# ================================= Processors ================================= processors: - add_host_metadata: when.not.contains.tags: forwarded - drop_event.when.not.regexp.message: "^[0-9]+,.*" - dissect: tokenizer: "%{id},%{date},%{time},%{description},%{ipAddress},%{hostName},%{macAddress},%{userName},%{transactionID},%{qResult},%{probationTime},%{correlationID},%{dhcid},%{vendorClassHex},%{vendorClassASCII},%{userClassHex},%{userClassASCII},%{relayAgentInformation},%{dnsRegError}" - drop_fields: fields: ["message"] - add_locale: ~ - rename: fields: - from: "event.timezone" to: "dissect.timezone" ignore_missing: true fail_on_error: false - add_cloud_metadata: ~ - add_docker_metadata: ~ - add_kubernetes_metadata: ~ - For platforms earlier than Windows Server 2008, use
-
- Navigate to the Elasticsearch Filebeat installation directory, and open the
-
Verify the status of the integration.
Return to the integrations page in Cortex XSIAM, and view the statistics for the log collection configuration.
- After Cortex XSIAM begins receiving logs from Windows DHCP via Elasticsearch Filebeat, you can use XQL Search to search for logs in the new
microsoft_dhcp_rawdataset.
Ingest Windows DNS debug logs using Elasticsearch Filebeat
Extend Cortex XSIAM visibility into Windows DNS Debug logs using an XDR Collector Windows Filebeat profile.
During configuration of an XDR Collector Windows Filebeat profile, you can configure the profile to enrich network logs with Windows DNS Debug log data. You do this by editing the Elasticsearch Filebeat default configuration file called filebeat.yml. In this file, you can define whether the collected data undergoes follow-up processing in the backend for Windows DNS Debug log data. Cortex XSIAM uses Windows DNS Debug logs to enrich network logs. These logs can be searched using XQL Search. You can search the Windows DNS Debug Cortex Query Language dataset (microsoft_dns_raw) for raw data, and the normalized stories using the xdr_data dataset with the preset called network_story.
- Enable DNS debug logging in your Windows DNS server settings:
- In Windows, open DNS Manager, right-click your Windows DNS Server, and select Properties.
- Select Debug Logging → Log packets for debugging, and keep the settings that are automatically configured for collecting regular Windows DNS logs in the Packet direction and Packet contents sections.
-
(Optional) To collect detailed Windows DNS logs, under the Other options section, select Details.
Detailed logs are significantly larger because more information is added to the logs.
- In the Log file section, for File path and name, enter the file path and log name of your Windows DNS logs, such as
c:\Windows\System32\dns\DNS.log. This path will also be configured in yourfilebeat.ymlfile, as explained in a later step. See the examples below. - Click OK.
- In Cortex XSIAM, go to Settings → Configurations → XDR Collectors → Profiles → +Add Profile → Windows.
- Select Filebeat, then click Next.
- Configure the General Information parameters:
- Profile Name: Enter a unique name to identify the profile. The name can contain only letters, numbers, or spaces, and must be no more than 30 characters. The name that you enter here will be displayed in the list of profiles when you configure a policy.
- (Optional) Add description here: To provide additional context for the purpose or business reason for your new profile, enter a profile description.
-
In the Filebeat Configuration File editing box, select the DNS template of your choice (detailed or non-detailed). If you configured detailed collection in the Windows DNS Manager, select the detailed DNS template here. Click Add.
The template's content is displayed in the editing area.
-
Configure the
filebeat.ymlfile to collect Windows DNS Debug log data.- In the
filebeat.inputs:section of the file, forpaths:, configure the file path to your Windows DNS Debug logs. This file path must be the same as the one configured in your Windows DNS server settings, as explained in an earlier step. - Set
vendorto“microsoft”andproductto“dns”.
The following examples show how to configure the
filebeat.ymlfile to normalize Windows DNS Debug logs with an XDR Collector.Example for non-detailed (regular) Windows DNS log collection
To avoid formatting issues in your
filebeat.ymlfile, we recommend that you validate the syntax of the file.filebeat.inputs: - type: filestream enabled: true paths: - c:\Windows\System32\dns\DNS.log processors: - add_fields: fields: vendor: "microsoft" product: "dns"Example for detailed Windows DNS log collection:
filebeat.inputs: - type: log enabled: true paths: - c:\Windows\System32\dns\DNS.log multiline.type: pattern multiline.pattern: '^(?:\d{1,2}\/){2}\d{4}\s(?:\d{1,2}\:){2}\d\d\s(?:AM|PM)' multiline.negate: true multiline.match: after processors: - add_fields: fields: vendor: "microsoft" product: "dns" - In the
-
To finish creating your new profile, click Create.
Your new profile will be listed under the applicable platform on the XDR Collectors Profiles page.
- Apply profiles to XDR Collector machine policies by performing one of the following:
- Right-click a profile and select Create a new policy rule using this profile.
- Launch the new policy wizard from XDR Collectors → Policies → XDR Collectors Policies.
Add an XDR Collector profile for Linux
Ingestion of log events larger than 5 MB is not supported.
Profile types
An XDR Collector Linux profile defines the data that is collected from a Linux collector machine. For Linux, you can configure a Filebeat profile and a Settings profile.
Filebeat profile
Use an XDR Collector Linux Filebeat profile to collect file and log data using the Elasticsearch Filebeat default configuration file, called filebeat.yml. To facilitate configuration, you can use out-of-the-box collection templates, or templates added by content packs installed from the XSIAM Marketplace. You can edit, combine, or add your own custom collection settings.
Supported versions and architectures
Cortex XSIAM supports the following Elasticsearch Filebeat versions with the operating systems listed in the Elasticsearch Support Matrix that conform with the collector machine operating systems supported by Cortex XSIAM:
- 64-bit XDR Collectors: Supports Filebeat version 9.3.2.
- 32-bit XDR Collectors: Supports Filebeat version 7.17.1.
Cortex XSIAM supports the input types and modules available in Elasticsearch Filebeat.
Note
Fileset validation is enforced. You must enable at least one fileset in the module, because filesets are disabled by default.
Log format constraints
- Cortex XSIAM collects all logs in either an uncompressed JSON or text format.
- Compressed files, such as the gzip format, are not supported.
- Cortex XSIAM supports logs in single line format or multiline format. For more information about handling messages that span multiple lines of text in Elasticsearch Filebeat, see Manage Multiline Messages.
Related information
- Elasticsearch Filebeat Overview Documentation
- Configure Filebeat Inputs in Elasticsearch
- Configure Filebeat Modules in Elasticsearch
- Elasticsearch Support Matrix
- XDR Collector machine requirements and supported operating systems
Settings profile
Use an XDR Collector Settings profile to configure automatic upgrade settings for XDR Collector releases.
Policy mapping
To map your XDR Collector profile to a collector machine, you must use an XDR Collector policy. After you have created your profile, map it to a new or existing policy.
How to configure XDR Collector profiles
Filebeat configuration
In the Filebeat Configuration File editor, you can define the data collection for your Elasticsearch Filebeat configuration file called filebeat.yml.
Cortex XSIAM provides YAML templates for XDR Collector Logs, Linux (RHEL/CentOS), NGINX (Linux), Linux (Debian/Ubuntu), and any templates added by the content packs installed from the XSIAM Marketplace.
- In Cortex XSIAM, select Settings → Configurations → XDR Collectors → Profiles → +Add Profile → Linux.
- Select Filebeat, then click Next.
- Configure the General Information parameters.
- Profile Name: Enter a unique name to identify the profile. The name can contain only letters, numbers, or spaces, and must be no more than 30 characters. The name that you enter here will be displayed in the list of profiles when you configure a policy.
- (Optional) Add description here: To provide additional context for the purpose or business reason for your new profile, enter a profile description.
- In the Filebeat Configuration File editing box, type or paste the contents of your configuration file, or use a template. To add a template, select one from the list, and click Add.
-
Cortex XSIAM supports all sections in the
filebeat.ymlconfiguration file, such as support for Filebeat fields and tags. You can use the "Add fields" processor to identify the product/vendor for the data collected by the XDR Collectors, so that the collected events go through the ingestion flow (Parsing Rules). To configure the product/vendor, ensure that you use the defaultfieldsattribute (do not use the target attribute), as shown in the following example:processors: - add_fields: fields: vendor: <Vendor> product: <Product>For more information about the "Add fields" processor, see Add_fields.
-
To finish creating your new profile, click Create.
Your new profile will be listed under the applicable platform on the XDR Collectors Profiles page.
- Apply profiles to XDR Collector machine policies by performing one of the following:
- Right-click a profile, and select Create a new policy rule using this profile.
- Launch the new policy wizard from XDR Collectors → Policies → XDR Collectors Policies.
Settings configuration
You can configure automatic upgrades for XDR Collector releases. By default, this is disabled, and the Use Default (Disabled) option is selected. To implement automatic upgrades, follow these steps:
- In Cortex XSIAM, select Settings → Configurations → XDR Collectors → Profiles → +Add Profile → Linux.
- Select Settings profile, then click Next.
- Configure the General Information parameters.
- Profile Name: Enter a unique name to identify the profile. The name can contain only letters, numbers, or spaces, and must be no more than 30 characters. The name that you enter here will be displayed in the list of profiles when you configure a policy.
- (Optional) Add description here: To provide additional context for the purpose or business reason for your new profile, enter a profile description.
- Clear the Use Default (Disabled) checkbox.
-
For Collector Auto-Upgrade, select Enabled.
Additional fields are displayed for defining the scope of the automatic upgrade.
- Configure the scope of automatic upgrades:
- To ensure the latest XDR Collector release is used, leave the Use Default (Latest collector release) checkbox selected.
- To configure only a particular scope, perform the following steps:
- Clear the Use Default (Latest collector release) checkbox.
-
For Auto Upgrade Scope, select one of the following options:
Option More details Latest collector release Configures the scope of the automatic upgrade to whenever a new XDR Collector release is available including maintenance releases and new features. Only maintenance release Configures the scope of the automatic upgrade to whenever a new XDR Collector maintenance release is available. Only maintenance releases in a specific version Configures the scope of the automatic upgrade to whenever a new XDR Collector maintenance release is available for a specific version. When this option is selected, you can select the specific Release Version.
-
To finish creating your new profile, click Create.
Your new profile will be listed under the applicable platform on the XDR Collectors Profiles page.
- Apply profiles to XDR Collector machine policies by performing one of the following:
- Right-click a profile, and select Create a new policy rule using this profile.
- Launch the new policy wizard from XDR Collectors → Policies → XDR Collectors Policies.
Additional XDR Collector profile management options
As needed, you can return to the XDR Collectors Profiles page to manage your XDR Collectors profiles. To manage a specific profile, right click anywhere in an XDR Collector profile row, and select the desired action:
| Option | More details |
|---|---|
| Edit | Lets you edit the XDR Collector profile |
| Save As New | Copies the existing profile with its current settings, so that you can make modifications, and save it as a new profile with a unique name |
| Delete | Deletes the XDR Collector profile |
| View Collector Policies | Opens a new tab that displays the XDR Collectors Policies page, showing the policies that are currently associated with your XDR Collector profiles |
| Copy text to clipboard | Copies the text from a specific field in the row of a XDR Collector profile |
| Copy entire row | Copies the text from the entire row of a XDR Collector profile |
Apply profiles to collection machine policies
Enable a Cortex XDR Collector profile by mapping it to a policy. Each policy that you create must apply to one or more collector machines or collector machine groups.
- In Cortex XSIAM, do one of the following:
- To create a policy from scratch on the XDR Collectors Policies page, select Settings → Configurations → XDR Collectors → Policies → +Add Policy.
- To add a profile to an existing policy, select Settings → Configurations → XDR Collectors → Policies, then right-click the policy that you want to edit, and select Edit.
- To create a new policy from a profile on the XDR Collectors Profiles page, select Settings → Configurations → XDR Collectors → Profiles, right-click the profile, and select Create a new policy rule using this profile.
- Configure the General settings for the policy:
- Policy Name: Enter a unique name to identify the policy. The name can contain only letters, numbers, or spaces, and must be no more than 30 characters. The name that you enter here will be displayed when you view and configure policies.
- (Optional) Description: To provide additional context for the purpose or business reason for your policy, enter a policy description.
- Platform: Select the operating system of the XDR Collector machines that will use the policy.
- Select the profiles that you want to map to the policy. If you do not specify a profile, the XDR Collector uses the Default profile.
- Click Next.
-
On the XDR Collectors Endpoints page, select the XDR Collectors (endpoints) or XDR Collector groups to which you want to map the policy. You can use the provided filters to find XDR Collectors listed on this page.
Cortex XSIAM automatically applies a filter for the platform that you selected in the previous step. To change the platform, go Back to the general policy settings.
- Click Next.
-
On the Summary page, review the settings that you configured for the new policy.
If everything is correct, click Done. Otherwise, click Back to make changes.
-
(Optional) If necessary, change a policy's position relative to other policies in the table on the XDR Collectors Policies page.
The XDR Collector evaluates policies from top to bottom. When an XDR Collector finds the first match, it applies that policy as the active policy. To change the policy order, click and drag the arrows in the Name cell of a policy to the desired location in the policy hierarchy.
Additional XDR Collector policy management options
As needed, you can return to the XDR Collectors Policies page to manage your XDR Collector policies. To manage a specific policy, right-click anywhere in an XDR Collector policy row, and select the desired action. You cannot delete or disable default policies.
| Option | More details |
|---|---|
| Disable | Disables the selected XDR Collector policy |
| Delete | Deletes the selected XDR Collector policy |
| View Policy Details | Opens a new dialog box that displays details about the profiles mapped to the policy |
| Save As New | Copies the existing policy with its current settings, so that you can make modifications, and save it as a new policy with a different name |
| Edit | Lets you edit the XDR Collector policy |
| Copy text to clipboard | Copies the text from a specific field in the row of a XDR Collector policy |
| Copy entire row | Copies the text from the entire row of a XDR Collector policy |
XDR Collector datasets
After Cortex XSIAM begins receiving data from your XDR Collectors configuration, the app automatically creates an XQL dataset.
After Cortex XSIAM begins receiving data from your XDR Collectors configuration that are dedicated for on-premises data collection on Windows and Linux machines.
- For Filebeat, the app automatically creates an Cortex Query Language (XQL) dataset of event logs using the vendor name and the product name specified in the configuration file section of the Filebeat profile. The dataset name follows the format
<vendor>_<product>_raw. If not specified, Cortex XSIAM automatically creates a new default dataset in the format<module>_<module>_rawor<input>_<input>_raw. For example, if you are using the NGINX module, the dataset is callednginx_nginx_raw. - For Winlogbeat, the app automatically creates an XQL dataset of event logs using the vendor name and the product name specified in the configuration file section of the Winlogbeat profile. The dataset name follows the format
<vendor>_<product>_raw. If not specified, Cortex XSIAM automatically creates a new default dataset,microsoft_windows_raw, for event log collection. Winlogbeat data is also normalized toxdr_data(and thus thexdr_event_logpreset).
After Cortex XSIAM creates the dataset, you can search for your XDR Collector data using XQL Search.
Palo Alto Networks integrations
Cortex XSIAM supports data ingestion and orchestration from other Palo Alto Networks products. These integrations are provided through a combination of traditional data sources and unified connectors, ensuring comprehensive visibility and seamless cross-platform security operations.
Ingestion methods
Depending on the specific product and your tenant onboarding date, integrations are handled via the following methods:
- Connectors: The strategic, unified approach for integrating Palo Alto Networks services. A connector consolidates multiple security capabilities, such as Automation, Data Security, and Identity Posture, into a single, guided configuration flow.
- Availability: These connectors are available for tenants onboarded after July 26, 2026.
- Legacy support: Existing tenants (onboarded before July 26, 2026) can achieve similar functionality by using the standalone Marketplace integrations linked within each product topic. For more information, see Marketplace.
- Traditional data sources: Cortex XSIAM supports streaming data directly from Prisma Access accounts, Prisma Access Browser, Cloud Next-Generation Firewalls (CNGFW), and Next-Generation Firewalls (NGFW), including Panorama devices, to your Cortex XSIAM tenants using the Strata Logging Service.
- Direct integration: New tenants (and tenants upgraded from Cortex XDR to XSIAM) utilize the direct integration of Next-Generation Firewall, including Panorama devices, into Cortex XSIAM. For these tenants, the option to use the Strata Logging Service integration is not available.
-
Migration from Strata Logging Service: For tenants with existing direct integrations to the Strata Logging Service, you can migrate your configurations, such as NGFW and Prisma Access, to Cortex XSIAM before your license expires. This can be done manually via the Migrate Devices buttons on the Data Sources & Integrations page (recommended more than two weeks before license expiration) or via automatic migration initiated by Cortex XSIAM two weeks prior to expiration.
Note
Roll-back of Strata Logging Service integration migration is not supported.
Technical reference requirements for connectors
While the unified wizard handles the configuration for new connectors, you should refer to the Cortex Developer Docs for Marketplace (PAN DEV) site for specific technical information related to the integration (now referred to as a sub-capability in the new connector world), such as:
- Fetched Incidents Data
- Available Commands
- Required incident fields and data schemas not provided in the wizard.
Note
For many popular vendors, you can choose between distinct types of data sources to fit your needs. Check the available descriptions for each entry in the user interface and documentation to decide which option is most suitable.
General requirements
Ensure you meet the following requirements before configuring your integrations:
- Deploy the relevant Palo Alto Networks products, such as NGFW or CNGFW.
- Hold Super User permissions for your Customer Support Portal (CSP) account.
- After your tenant has been activated, navigate to the Data Sources & Integrations page in Cortex XSIAM to configure your integrations.
- All devices and accounts allocated to your CSP accounts are available to integrate.
Note
For certain traditional Palo Alto Networks integrations using data sources, you can select specific log types to ingest for each data source instance. This granular filtering allows you to optimize data consumption and reduce ingestion costs by ensuring only high-value security logs reach the ingestion pipeline. For more information, see Log type filtering. For customers who have not migrated to Cortex XSIAM 3.x, see Collecting URL and File log types.
Supported integrations
Cortex XSIAM provides specific documentation and configuration steps for each Palo Alto Networks integration. Select an integration from the topics provided below to view its supported ingestion methods and configuration requirements.
Cloud Next-Generation Firewall
You can configure collecting Cloud Next-Generation Firewall logs using a data source:
| Cloud Next-Generation Firewall | Description |
|---|---|
| Data Source overview | You can forward firewall data from your Cloud Next-Generation Firewall (CNGFW) to Cortex XSIAM. During onboarding or by editing an existing instance, you can select specific log types to ingest to optimize data consumption and reduce costs. |
| Link to Data Source instructions | Ingest data from Cloud Next-Generation Firewall |
Ingest data from Cloud Next-Generation Firewall
Cloud Next-Generation Firewall (CNGFW) is a fully managed, cloud-native security service from Palo Alto Networks. Enabling CNGFW data collection allows for the ingestion of CNGFW logs into the platform by establishing a dedicated connector within the existing data source configuration flow. The connection is established at the CSP account. You can connect resources regardless of whether they are managed by Strata Cloud Manager (SCM). The interface supports:
- Connecting CNGFW to the current account
- Connecting CNGFW from other accounts
Cortex products utilize the Cloud Logging Collection Service (CLCS), a pub/sub service, and the Strata Logging Service (SLS) to stream this data. Adding and removing CNGFW devices is recorded in audit logs, and users can view the consent audit during the process. Any issues related to CNGFW logs are created in the same manner as traditional NGFW issues.
Prerequisite
- Cortex XSIAM RBAC permissions: Requires View/Edit permissions for Data Sources (under Configurations → Data Collections).
-
Cloud Service Provider (CSP) account permissions: Configuration of data ingestion from multiple accounts and regions requires Super User permissions on both the Cortex XSIAM tenant and on the device accounts.
Note
Cross CSP (Cloud Service Provider) is supported only within the same SFDC hierarchy. Consequently, MSSP use cases where the customer owns one end of the solution are not supported.
Supported log types and datasets
Once ingested, your data is stored in the panw_ngfw_*_raw datasets. You can query this data using Cortex Query Language (XQL).
Note
When using a multi-tenant firewall with virtual system (vsys) instances, the _reporting_device_name field presents the NGFW instance name, vsys_name, and vsys_id using the following format; log_source_name>-<vsys_name>-<vsys_id>.
The following log types are supported for CNGFW ingestion:
| Log Type | Dataset Name |
|---|---|
| Authentication Logs | panw_ngfw_auth_raw |
| Configuration Logs | panw_ngfw_config_raw |
| File Data Logs | panw_ngfw_filedata_raw |
| Global Protect Logs | panw_ngfw_globalprotect_raw |
| Hipmatch Logs | panw_ngfw_hipmatch_raw* |
| System Logs | panw_ngfw_system_raw |
| Threat Logs | panw_ngfw_threat_raw* |
| Traffic Logs | panw_ngfw_traffic_raw* |
| Tunnel Logs | panw_ngfw_tunnel_raw |
| URL Logs | panw_ngfw_url_raw* |
| User ID Logs | panw_ngfw_userid_raw |
*Note: These datasets use the query field names as described in the Cortex schema documentation. For more information about the logs, see Strata Logging Service Log Reference.
How to ingest detection data from CNGFW:
- Select Settings → Data Sources & Integrations
- On the Data Sources & Integrations page, click + Add New, search for CNGFW, then hover over and click Add.
-
In the Add Cloud Next-Generation Firewall dialog box, you can choose to connect CNGFW to this account or other accounts.
- To connect CNGFW from the current account, select Connect Cloud NGFW from current account (default), and select the applicable regions.
-
To connect CNGFW from another account, select Connect Cloud NGFW from other accounts and select the applicable regions for the other accounts. You can search and multi-select accounts by account number, account name, or region. For cross-account connections, you must have Super User permissions on the CSP account and the device account.
Important
This cross-account support is limited to the same SFDC hierarchy; it does not extend to MSSP scenarios where the customer and provider own separate ends of the solution.
Depending on the regions selected, you may need to read the Cloud NGFW Connection from other regions disclaimer and approve the CNGFW connection.
Note
If you change a device region, you must first disconnect the device from Cortex XSIAM and then reconnect it after the region change is complete.
- Select log types: You can either select the specific logs to ingest from this instance, or choose Select all to ingest all of them.
-
Click Connect to establish the connection.
Connection is established regardless of the firewall credential status and can take up to several minutes. Select Sync now to refresh your instances.
Next-Generation Firewall
You can configure collecting Next-Generation Firewall logs and data using a data source, content pack integration (onboarded prior to July 26, 2026), or connector (onboarded after July 26, 2026):
| Next-Generation Firewall | Description |
|---|---|
| Data Source overview | You can forward firewall data from your Next-Generation Firewall (NGFW) and Panorama devices to Cortex XSIAM. During onboarding or by editing an existing instance, you can select specific log types to ingest to optimize data consumption and reduce costs. |
| Link to Data Source instructions | <ul><li>Ingest data from Next-Generation Firewall</li><li>Ingest Next-Generation Firewall logs using the Syslog collector</li></ul> |
| Links to content pack/integration details (onboarded prior to July 26, 2026) | <p>The PAN-OS by Palo Alto Networks content pack manages Palo Alto Networks Firewalls and Panorama via API, allowing users to create, modify, and manage custom security policies, perform configuration commits, manage dynamic lists, perform system upgrades, and query various log types. It contains various playbooks, a classifier (Panorama Classifier) and mapper (Panorama Mapper), issue fields, issue types, and automations/scripts. It also includes the following integration:</p><ul><li>Palo Alto Networks PAN-OS: Use this integration to manage Palo Alto Networks Firewall and Panorama, including managing Prisma Access through Panorama, creating and managing security policies, and querying logs. This integration includes commands for managing the master key, checking dynamic updates status, downloading and installing various dynamic updates (for example, AntiVirus, WildFire, GlobalProtect Clientless VPN), listing and deleting policy rules (including new types like application-override, authentication, decryption, nat, and pbf), managing addresses and URL categories, retrieving rule hit counts, disabling rules, and performing hygiene checks on various security profiles and configurations.</li></ul> |
| Link to connector (onboarded after July 26, 2026) | Panorama |
Ingest data from Next-Generation Firewall
You can forward firewall data from your Next-Generation Firewall (NGFW) and Panorama devices to Cortex XSIAM.
Collection of firewall data from multiple accounts is supported. Super User permissions on both the Cortex XSIAM tenant accounts and the NGFW or Panorama accounts are required for this use case.
When you onboard through Panorama, the firewalls are sending the logs directly. As a result, you may need to enable duplicate logging on the firewalls to send to both cloud logging and Panorama.
New tenants (and tenants upgraded from XDR to XSIAM) will work with the new direct integration of Next-Generation Firewall and Panorama into Cortex. For such tenants, there’s no option to use the Strata Logging Service integration.
For tenants where customers have integrated directly with Strata Logging Service, the configured integrations, such as Next-Generation Firewall and Prisma Access, can be migrated to Cortex XSIAM in either of the following ways before the license expires:
- More than two weeks before the license for existing integrations with Strata Logging Service expires, manually migrate the integrations, using the corresponding Migrate Devices buttons on the Data Sources & Integrations page. Make sure you select all your devices to connect directly to Cortex XSIAM.
-
Two weeks prior to the end of your Strata Logging Service license, Cortex XSIAM will automatically migrate your integrations to your Strata Logging Service.
Note
Roll-back of Strata Logging Service integration migration is not supported.
Prerequisite
Ensure that you have completed the following on the NGFW or Panorama side:
- For Panorama only, ensure that the Panorama Cloud Services plugin is installed.
- Enable log forwarding profiles on firewall rules.
On the Cortex XSIAM side, ensure that you have user role permissions for Data Collection > Data Sources & Integrations.
Configuration of data ingestion from multiple accounts requires Super User permissions on both the Cortex XSIAM tenant and on the device accounts.
Note: Cross CSP (Cloud Service Provider) is supported only within the same SFDC hierarchy. Consequently, MSSP use cases where the customer owns one end of the solution are not supported.
Note
- If you change a device region, you must first disconnect the device from Cortex XSIAM and then reconnect it after the region change is complete.
- If your firewalls are located in a different region, or bandwidth issues are encountered due to large log size, you can ingest NGFW logs in CEF format, using the Syslog collector. However, the Syslog solution is not as powerful nor as comprehensive as this data collector, and should only be used when this data collector cannot be used. For more information, see Ingest Next-Generation Firewall logs using the Syslog collector.
Set up detection data ingestion
Note
In the following procedure, general information is provided for NGFW and Panorama. For detailed instructions, consult the documentation for your specific devices and Panorama version.
- In Cortex XSIAM, navigate to Settings → Data Sources & Integrations.
- On the Data Sources & Integrations page, click + Add New, search for NGFW, then hover over and click Add.
-
Select Add NGFW Device or Add Panorama Device, and then do one of the following:
- For devices in your account, select one or more devices from Select FW/Panorama devices.
-
To include devices from other accounts, select Select devices from other accounts, and then select one or more FW or Panorama devices from other accounts. For cross-account connections, you must have Super User permissions on the Cortex tenant account and the device account.
Important
This cross-account support is limited to the same SFDC hierarchy; it does not extend to MSSP scenarios where the customer and provider own separate ends of the solution.
Devices already connected are listed at the end. A device may be connected via Strata Logging Service or via Cortex XSIAM. Rectify any streaming issues that may arise by checking configurations for the relevant connection type (Strata Logging Service or Cortex XSIAM).
- Select log types: You can either select the specific logs to ingest from this instance, or choose Select all to ingest all of them.
- To complete the onboarding process of your devices, on the Next Steps to Connect Your Devices page, expand the relevant device version, and follow the corresponding instructions.
-
Click Connect to establish the instance.
Connection is established regardless of the firewall credential status and can take up to several minutes, select Sync now to refresh your instances.
- Ensure that you pull your cloud logging licenses on the firewall before proceeding to configure the firewall.
-
In the user interface for setting up firewalls, for Strata Logging Service/Cloud Logging, enable the following options directly or using device templates.
(For example, go to Device → Setup → Management → Cloud Logging section)
- Select Enable Strata Logging Service.
- Select Enable Enhanced Application Logging.
- (Optional, depending on your organization's requirements) Select Enable Duplicate Logging (Cloud and On-Premise).
-
Depending on your PAN-OS or Panorama version, generate either a certificate or PSK.
For PAN-OS and Panorama versions 10.1 and later, each firewall requires a separate certificate. Certificates need to be requested through the Customer Support portal. To sign in to the portal, click here. For PAN-OS and Panorama versions 10.0 and earlier, you are only required to generate one global PSK for all the firewall devices.
Note
Cortex XSIAM does not validate your firewall credentials; you must ensure the certificates or PSK details have been updated in your firewalls for data to stream.
- Onboard the certificates.
- Define a Log Forwarding profile.
- Map the Log Forwarding profile to a Security Policy Rule.
- Verify that the connection between the firewalls and Strata Logging Service is valid.
- Push the configuration changes to the firewalls.
-
Validate that your data is streaming. It might be necessary to create traffic before you verify data streaming.
To ensure the data is streaming into your tenant:
- In your NGFW Standalone Firewall Devices, track the Last communication timestamp.
-
Run XQL Query: **dataset = panw_ngfw_system_raw filter log_source_id = "[NGFW device SN]"**
-
(Optional) Manage your Instance.
After you create the NGFW instance, on the Data Sources & Integrations page, expand the NGFW to track the status of your Standalone Firewall Devices and Panorama Devices.
Select the ellipses to Request Certificate, if required, or Delete the instance.
Note
It can take an hour or longer after connecting the firewall in Cortex XSIAM until you start seeing notifications that the certificate has been approved, and that the logging service license has appeared on the firewall.
When Cortex XSIAM begins receiving detection data, the console begins stitching logs with other Palo Alto Networks-generated logs to form stories. Use the XQL Search dataset panw_ngfw_*_raw to query your data, where the following logs are supported:
- Authentication Logs: panw_ngfw_auth_raw
- File Data Logs: panw_ngfw_filedata_raw
- Global Protect Logs: panw_ngfw_globalprotect_raw
- Hipmatch Logs: panw_ngfw_hipmatch_raw*
- System Logs: panw_ngfw_system_raw
- Threat Logs: panw_ngfw_threat_raw*
- Traffic Logs: panw_ngfw_traffic_raw*
- URL Logs: panw_ngfw_url_raw*
- User ID Logs: panw_ngfw_userid_raw
- Configuration Logs: panw_ngfw_config_raw
- Tunnel Logs: panw_ngfw_tunnel_raw
*These datasets use the query field names as described in the Cortex schema documentation. For more information about the logs, see Strata Logging Service Log Reference.
Note
When using a multi-tenant firewall with virtual system (vsys) instances, the _reporting_device_name field presents the NGFW instance name, vsys_name, and vsys_id using the following format; log_source_name>-<vsys_name>-<vsys_id>.
For stitched raw data, you can query the xdr_data dataset or use any preset designated for stitched data, such as network_story. For query examples, refer to the in-app XQL Library. When relevant, Cortex XSIAM can also generate Cortex XSIAM issues (Analytics, Correlation Rules, IOC, and BIOC only) from Strata Logging Service detection data. While Correlation Rules issues are generated on non-normalized and normalized logs, Analytics, IOC, and BIOC issues are only generated on normalized logs.
Note
IOC and BIOC issues are applicable to stitched data only, and are not available on raw data.
Tip
You can see an overview of ingestion status for all log types, and a breakdown of each log type and its daily consumption quota on the NGFW Ingestion Dashboard.
Ingest Next-Generation Firewall logs using the Syslog collector
Use the Syslog collector to ingest Next-Generation Firewall (NGFW) logs in CEF format. This method is useful when your firewalls are located in a different region, or bandwidth issues are encountered due to large log size. When possible, we recommend that you ingest NGFW logs using the dedicated Next-Generation Firewall data collector instead of the Syslog collector.
Note
In the following procedure, general information is provided for NGFW and Panorama. For detailed instructions, consult the documentation for your specific devices and Panorama version, to ensure that you have configured log forwarding correctly for all the log types that you would like to forward to Cortex XSIAM. The following steps only cover configuration of the custom log schema (CEF) for a given syslog server. They do not replace the administrator guide’s configuration coverage of log forwarding.
For tenants where customers have integrated directly with Strata Logging Service, the configured integrations, such as Next-Generation Firewall and Prisma Access, can be migrated to Cortex XSIAM in either of the following ways before the license expires:
Configure the firewall/Panorama for log forwarding to Cortex XSIAM
- To configure the device to include its IP address in the header of Syslog messages, select Panorama/Device → Setup → Management, click the Edit icon in the Logging and Reporting Settings section, and navigate to the Log Export and Reporting tab.
- From the Syslog HOSTNAME Format menu, select ipv4-address or ipv6-address, and click OK.
- Select Device → Server Profiles → Syslog, and click Add.
- Enter a server profile Name and Location (Location refers to a virtual system, if the device is enabled for virtual systems).
- On the Servers tab of the Syslog Server Profiles window, click Add, and enter the following information for the Syslog server:
- Name
- Syslog Server (IP address)
- Transport, Port (default 514 for UDP)
- Facility (default LOG_USER)
-
Select the Custom Log Format tab and click configure the log formats as follows:
Note
To avoid the possible effects of line formatting, do not copy/paste the message formats directly into the PAN-OS web interface. Instead, paste into a text editor, remove any carriage return or line feed characters, and then copy and paste into the web interface.
Note
From version 10.0 and later, the log format documented for log types (Traffic, Threat, and URL) exceeds the maximum supported 2048 characters in the Custom Log Format tab on the firewall and Panorama. Select the CEF keys and values to limit the number of characters to 2048, as per your requirements.
Log Type Custom Format Traffic CEF:0|PANW|NGFW_CEF|$sender_sw_version|$subtype|$type|1| __firewall_type=firewall.traffic __timestamp=$start __tz=$high_res_timestamp log_type=$type subtype=$subtype log_time=$cef-formatted-receive_time time_generated=$cef-formatted-time_generated log_source_id=$serial log_source_name=$device_name sequence_no=$seqno source_ip=$src dest_ip=$dst source_port=$sport dest_port=$dport nat_source=$natsrc nat_dest=$natdst nat_source_port=$natsport nat_dest_port=$natdport protocol=$proto action=$action source_user=$srcuser dest_user=$dstuser xff_ip=$xff_ip app=$app app_category=$category_of_app app_sub_category=$subcategory_of_app rule_matched=$rule rule_matched_uuid=$rule_uuid severity=1 vsys=$vsys vsys_name=$vsys_name from_zone=$from to_zone=$to inbound_if=$inbound_if outbound_if=$outbound_if session_id=$sessionid source_device_category=$src_category source_device_profile=$src_profile source_device_model=$src_model source_device_vendor=$src_vendor source_device_osfamily=$src_osfamily source_device_osversion=$src_osversion source_device_mac=$src_mac dest_device_category=$dst_category dest_device_profile=$dst_profile dest_device_model=$dst_model dest_device_vendor=$dst_vendor dest_device_osfamily=$dst_osfamily dest_device_osversion=$dst_osversion dest_device_mac=$dst_mac bytes_sent=$bytes_sent bytes_received=$bytes_received packets_received=$pkts_received packets_sent=$pkts_sent total_time_elapsed=$elapsed session_end_reason=$session_end_reason url_category=$category Threat CEF:0|PANW|NGFW_CEF|$sender_sw_version|$threatid|$type|$number-of-severity| __firewall_type=firewall.threat __timestamp=$cef-formatted-time_generated __tz=$high_res_timestamp log_type=$type subtype=$subtype log_time=$cef-formatted-receive_time time_generated=$cef-formatted-time_generated log_source_id=$serial log_source_name=$device_name sequence_no=$seqno source_ip=$src dest_ip=$dst source_port=$sport dest_port=$dport nat_source=$natsrc nat_dest=$natdst nat_source_port=$natsport nat_dest_port=$natdport protocol=$proto action=$action source_user=$srcuser dest_user=$dstuser xff=$xff xff_ip=$xff_ip app=$app app_category=$category_of_app app_sub_category=$subcategory_of_app rule_matched=$rule rule_matched_uuid=$rule_uuid severity=$number-of-severity vsys=$vsys vsys_name=$vsys_name from_zone=$from to_zone=$to inbound_if=$inbound_if outbound_if=$outbound_if session_id=$sessionid source_device_category=$src_category source_device_profile=$src_profile source_device_model=$src_model source_device_vendor=$src_vendor source_device_osfamily=$src_osfamily source_device_osversion=$src_osversion source_device_mac=$src_mac dest_device_category=$dst_category dest_device_profile=$dst_profile dest_device_model=$dst_model dest_device_vendor=$dst_vendor dest_device_osfamily=$dst_osfamily dest_device_osversion=$dst_osversion dest_device_mac=$dst_mac misc=$misc threat_id=$threatid threat_name=$threat_name threat_category=$thr_category direction=$direction user_agent=$user_agent URL CEF:0|PANW|NGFW_CEF|$sender_sw_version|$subtype|$type|$number-of-severity| __firewall_type=firewall.url __timestamp=$cef-formatted-time_generated __tz=$high_res_timestamp log_type=$type subtype=$subtype log_time=$cef-formatted-receive_time time_generated=$cef-formatted-time_generated log_source_id=$serial log_source_name=$device_name sequence_no=$seqno source_ip=$src dest_ip=$dst source_port=$sport dest_port=$dport nat_source=$natsrc nat_dest=$natdst nat_source_port=$natsport nat_dest_port=$natdport protocol=$proto action=$action source_user=$srcuser dest_user=$dstuser xff=$xff xff_ip=$xff_ip app=$app app_category=$category_of_app app_sub_category=$subcategory_of_app rule_matched=$rule rule_matched_uuid=$rule_uuid severity=$number-of-severity vsys=$vsys vsys_name=$vsys_name from_zone=$from to_zone=$to inbound_if=$inbound_if outbound_if=$outbound_if session_id=$sessionid source_device_category=$src_category source_device_profile=$src_profile source_device_model=$src_model source_device_vendor=$src_vendor source_device_osfamily=$src_osfamily source_device_osversion=$src_osversion source_device_mac=$src_mac dest_device_category=$dst_category dest_device_profile=$dst_profile dest_device_model=$dst_model dest_device_vendor=$dst_vendor dest_device_osfamily=$dst_osfamily dest_device_osversion=$dst_osversion dest_device_mac=$dst_mac uri=$misc threat_id=$threatid threat_name=$threat_name threat_category=$thr_category direction=$direction user_agent=$user_agent url_category=$category url_category_list=$url_category_list content_type=$contenttype http_method=$http_method http_headers=$http_headers http2_connection=$http2_connection referer=$referer pcap_id=$pcap_id File Data CEF:0|PANW|NGFW_CEF|$sender_sw_version|$threatid|$type|$number-of-severity| __firewall_type=firewall.filedata __timestamp=$cef-formatted-time_generated __tz=$high_res_timestamp log_type=$type subtype=$subtype log_time=$cef-formatted-receive_time time_generated=$cef-formatted-time_generated log_source_id=$serial log_source_name=$device_name sequence_no=$seqno source_ip=$src dest_ip=$dst source_port=$sport dest_port=$dport nat_source=$natsrc nat_dest=$natdst nat_source_port=$natsport nat_dest_port=$natdport protocol=$proto action=$action source_user=$srcuser dest_user=$dstuser xff=$xff xff_ip=$xff_ip app=$app app_category=$category_of_app app_sub_category=$subcategory_of_app rule_matched=$rule rule_matched_uuid=$rule_uuid severity=$number-of-severity vsys=$vsys vsys_name=$vsys_name from_zone=$from to_zone=$to inbound_if=$inbound_if outbound_if=$outbound_if session_id=$sessionid source_device_category=$src_category source_device_profile=$src_profile source_device_model=$src_model source_device_vendor=$src_vendor source_device_osfamily=$src_osfamily source_device_osversion=$src_osversion source_device_mac=$src_mac dest_device_category=$dst_category dest_device_profile=$dst_profile dest_device_model=$dst_model dest_device_vendor=$dst_vendor dest_device_osfamily=$dst_osfamily dest_device_osversion=$dst_osversion dest_device_mac=$dst_mac misc=$misc threat_id=$threatid threat_name=$threat_name threat_category=$thr_category direction=$direction user_agent=$user_agent file_url=$file_url filedigest=$filedigest filetype=$filetype pcap_id=$pcap_id -
Configure Escaping characters as follows:
- Escaped Characters: \
- Escape Character: \
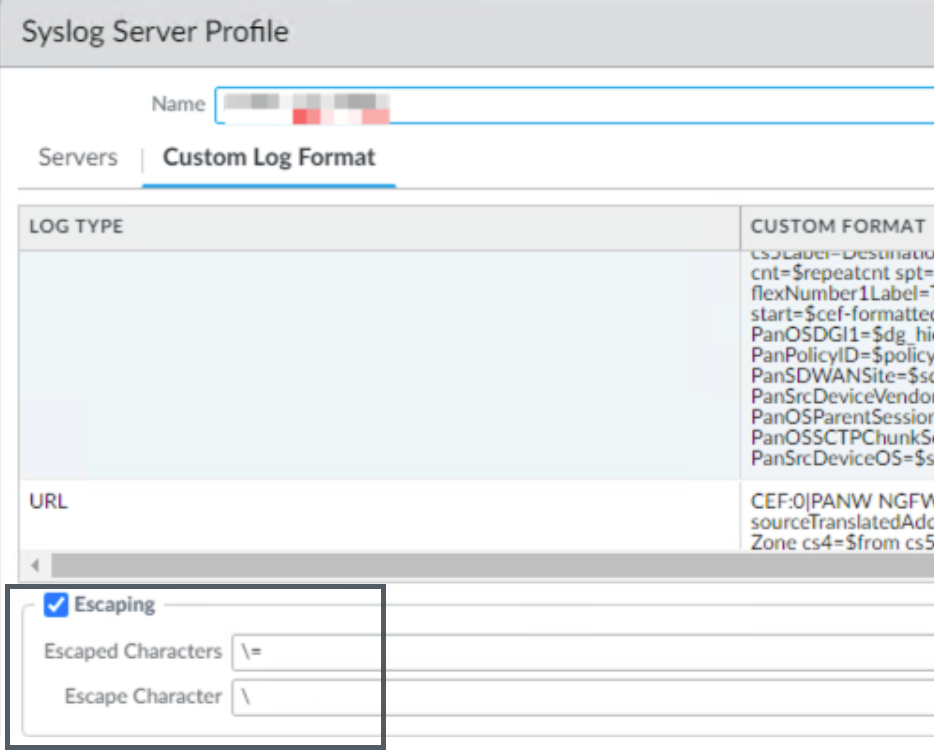
Configure Syslog collection
Set up a Syslog collector for the logs, as explained in Activate Syslog Collector. In Task 4, ensure that you set Format to CEF.
Panorama
Important
This connector is only available for tenants that onboarded after July 26, 2026. For tenants that onboarded before this date, use Marketplace to access the standalone integration. For more information, see Marketplace.
This sub-capability is available with any active Cortex XSIAM, Cortex Cloud Posture Security, Cortex Cloud, Cortex Cloud Runtime Security, Cortex XDR, or Cortex AgentiX license.
PAN-OS is the software that runs all Palo Alto Networks next-generation firewalls. This connector lets you manage Palo Alto Networks Firewall and Panorama, including creating and managing security rules, address objects, URL categories, and URL filtering objects, committing and pushing configurations, and querying PAN-OS logs. You can create separate instances for Firewall and Panorama.
This connector includes the following sub-capabilities (Marketplace integrations link to PAN DEV for more information):
- Panorama: Manage Palo Alto Networks Firewall and Panorama. Use this pack to manage Prisma Access through Panorama. For more information, see the Panorama documentation.
To configure this connector, follow the steps outlined in the configuration wizard.
Prisma Access
You can configure collecting Prisma Browser logs using a data source or connector (onboarded after July 26, 2026):
| Collection Method | Description |
|---|---|
| Data source overview | You can forward data from Prisma Access to Cortex XSIAM. |
| Link to data source instructions | Ingest data from Prisma Access |
| Link to connector (onboarded after July 26, 2026) | Palo Alto Networks Prisma |
Ingest data from Prisma Access
You can forward data from Prisma Access to Cortex XSIAM. When your Cortex XSIAM tenant begins receiving detection data, it begins stitching logs with other Palo Alto Networks-generated logs to form stories. Use the XQL Search to query the data.
Collection of data from multiple accounts is supported. Super User permissions on both the Cortex XSIAM tenant accounts and the Prisma Access accounts are required for this use case.
New tenants (and tenants upgraded from XDR to XSIAM) will work with the new direct integration of Next-Generation Firewall and Panorama into Cortex. For such tenants, there’s no option to use the Strata Logging Service integration.
For tenants where customers have integrated directly with Strata Logging Service, the configured integrations, such as Next-Generation Firewall and Prisma Access, can be migrated to Cortex XSIAM in either of the following ways before the license expires:
- More than two weeks before the license for existing integrations with Strata Logging Service expires, manually migrate the integrations, using the corresponding Migrate Devices buttons on the Data Sources & Integrations page. Make sure you select all your devices to connect directly to Cortex XSIAM.
-
Two weeks prior to the end of your Strata Logging Service license, Cortex XSIAM will automatically migrate your integrations to your Strata Logging Service.
Note
Roll-back of Strata Logging Service integration migration is not supported.
Prerequisite
Configuration of data ingestion from multiple accounts requires Super User permissions in both Cortex XSIAM tenant and Prisma Access accounts.
Note
If you change a device region, you must first disconnect the device from Cortex XSIAM and then reconnect it after the region change is complete.
The logs ingested by Prisma Access are the same as the logs ingested by Next-Generation Firewall. For more information, refer to Ingest data from Next-Generation Firewall.
To ingest detection data from Prisma Access:
- Navigate to Settings → Data Sources & Integrations.
-
On the Data Sources & Integrations page, click + Add New, search for Prisma Access, then hover over it and click Add or Add Instance.
Note
Cortex XSIAM does not validate your Prisma Access account credentials. You must ensure the account has been deployed for data to stream.
- In the Connect Prisma Access dialog box, you can choose to connect Prisma Access to this account or other accounts.
- To connect Prisma Access to this account, continue to the next step.
- To connect Prisma Access to other accounts, click Connect Prisma Access from other accounts and select the account from the accounts listed.
- Select log types: You can either select the specific logs to ingest from this instance, or choose Select all to ingest all of them.
-
Click Connect.\
Connection can take up to several minutes.On the Data Sources & Integrations page, expand Prisma Access to track the status of your instance.
-
Validate that your data is streaming.
To ensure the data is streaming into your tenant, using XQL, query Next-Generation Firewall raw datasets
panw_ngfw_<*>_rawusing the field:is_prisma_mobile. -
(Optional) Manage your Instance.
After you create the Prisma Access instance, on the Data Sources & Integrations page, expand the Prisma Access integration to track the connection, or, if you want, to Delete the instance.
Palo Alto Networks Prisma
Important
This connector is only available for tenants that onboarded after July 26, 2026. For tenants that onboarded before this date, use Marketplace to access the standalone integration. For more information, see Marketplace.
Integrate with Palo Alto Networks Prisma Access to monitor the status of the service and take actions, and with Prisma SASE (Strata Cloud Manager) to view or make changes to Prisma Access configurations. Also dynamically retrieve the egress IPs that Prisma Access uses to reach the internet and SaaS apps for use as a threat intelligence feed.
This connector includes the following sub-capabilities (Marketplace integrations link to PAN DEV for more information):
- Palo Alto Networks - Prisma SASE: This sub-capability is available with any active Cortex XSIAM, Cortex Cloud Posture Security, Cortex Cloud, Cortex Cloud Runtime Security, Cortex XDR, or Cortex AgentiX license.
- Prisma Access: Integrate with Prisma Access to monitor the status of the Service, alert and take actions. This sub-capability is available with any active Cortex XSIAM, Cortex Cloud Posture Security, Cortex Cloud, or Cortex AgentiX license.
- Prisma Access Egress IP feed: Dynamically retrieve and add to allow list IPs Prisma Access uses to egress traffic to the internet and SaaS apps. This sub-capability is available with any active Cortex XSIAM, Cortex Cloud Posture Security, Cortex Cloud, Cortex Cloud Runtime Security, Cortex XDR, or Cortex AgentiX license.
To configure this connector, follow the steps outlined in the configuration wizard.
Prisma Access Browser
Ingest logs from Prisma Access Browser
Prisma Browser is a Palo Alto Networks browser designed specifically for enterprise use, and is fortified with security features to protect users and organizations. You can configure Cortex XSIAM to ingest Prisma Browser logs into a dataset called panw_prisma_access_browser_raw, that can be queried using XQL. This integration gives you visibility into issues that are generated by the browser. The ingested data can also be used for performing threat hunting queries and correlations within the Cortex platform.
Only one instance of this collector can be created per Cortex XSIAM tenant.
Note
If you change a device region, you must first disconnect the device from Cortex XSIAM and then reconnect it after the region change is complete.
- In Cortex XSIAM, select Settings → Data Sources & Integrations.
- On the Data Sources & Integrations page, click + Add New, search for and select Prisma Access Browser, click Add or Add Another Instance.
- In the Connect Prisma Access Browser dialog box, select the checkbox for Connect Prisma Access Browser to this account.
- Select log types: You can either select the specific logs to ingest from this instance, or choose Select all to ingest all of them.
-
Click Connect.
Connection can take up to several minutes.
On the Data Sources & Integrations page, expand Prisma Access Browser to track the status of your instance.
- Validate that data is streaming to your tenant by using XQL to query the dataset
panw_prisma_access_browser_raw.
After you have created a Prisma Browser instance, you can use the Data Sources & Integrations page to view information about the integration, or delete the instance.
Ingest detection data from Strata Logging Service
The Strata Logging Service and Cortex Data Lake event collectors are deprecated and are no longer available for new Cortex XSIAM tenants. While these collectors remain supported for existing customers who have not yet migrated, all new integrations should use the specific data source connectors for your product.
To streamline the connection and management of all Palo Alto Networks generated logs across products in Cortex XSIAM with a Strata Logging Service, Cortex XSIAM can ingest detection data from Strata Logging Service in a more flexible manner using the Strata Logging Service data collector.
You can configure the Strata Logging Service data collector to take logs from other Palo Alto Networks products already logging to 1 or more existing Strata Logging Service.
Cortex XSIAM supports streaming data directly from Prisma Access accounts and New-Generation Firewalls (NGFW) and Panorama devices to your Cortex XSIAM tenants using the Cortex Native Data Lake. Existing integrations should be migrated to the Cortex Native Data Lake. Make sure you select all your devices to connect directly to Cortex XSIAM. Integrations not migrated manually will be migrated automatically 2 weeks before the end of the contract with Strata Logging Service.
For stitched raw data, use the XQL query xdr_data dataset or any preset designated for stitched data, such as network_story. For query examples, refer to the in-app XQL Library. Cortex XSIAM can also generate Cortex XSIAM issues (Analytics, Correlation Rules, IOC, and BIOC only) when relevant from Strata Logging Service detection data. While Correlation Rules issues are generated on non-normalized and normalized logs, Analytics, IOC, and BIOC issues are only generated on normalized logs.
Note
IOC and BIOC issues are applicable on stitched data only and are not available on raw data.
To ingest detection data from Strata Logging Service.
-
Activate the Strata Logging Service.
You can configure Cortex XSIAM to take Palo Alto generated firewall logs from other Palo Alto Networks products already logging to an existing Strata Logging Service.
- Select Settings → Data Sources.
- In the Strata Logging Service configuration, click the more options icon, and select Add New Instance.
-
Select Data Lake Instance.
Select one or more existing Strata Logging Service instances that you want to connect to this Strata Logging Service instance.
-
Save your Strata Logging Service configuration.
Once events start to come in, a green check mark appears underneath the Strata Logging Service configuration.
-
(Optional) Manage your Strata Logging Service Collector.
After you create the Strata Logging Service Collector, you can make additional changes, as needed.
- Delete the Strata Logging Service Collector.
- After Cortex XSIAM begins receiving data from a Strata Logging Service, you can use XQL Search to search for specific data, using the
xdr_datadataset.
IoT Security
You can configure collecting IoT Security logs and data using an integration configured in Data Sources, content pack integration (onboarded prior to July 26, 2026), or connector (onboarded after July 26, 2026):
| Collection Method | Description |
|---|---|
| Data Source overview | The Palo Alto Networks IoT Security solution discovers unmanaged devices, detects behavioral anomalies, recommends policy based on risk, and automates enforcement without the need for additional sensors or infrastructure. The Cortex XSIAM IoT Security integration enables you to ingest alerts and device information from your IoT Security instance. |
| Link to Data Source instructions | <ul><li>Ingest alerts and assets from IoT Security (Deprecated)</li><li>Ingest alerts and assets from Device Security</li></ul> |
| Links to content pack/integration details (onboarded prior to July 26, 2026) | <p>The IoT by Palo Alto Networks content pack enables Cortex XSIAM to integrate with the Palo Alto Networks IoT Security Portal for retrieving device details, listing and managing alerts and vulnerabilities, and integrating with ticketing systems like ServiceNow for streamlined incident response. It contains the PANW IoT ServiceNow Tickets Check playbook, the PANW IoT Incident Handling with ServiceNow playbook, the PANW IoT Alert Handling with ServiceNow playbook, the iot-security-get-raci automation script, the iot-security-alert-post-processing automation script, the iot-security-check-servicenow automation script, and the iot-security-vuln-post-processing automation script, along with the IoT Alert and IoT Vulnerability issue types and custom issue fields.</p><ul><li>Palo Alto Networks IoT: Use this integration to wrap around the IoT Security Portal APIs for operations such as getting a device detail by ID, listing devices, listing alerts and vulnerabilities, and resolving alerts and vulnerabilities. The integration provides the API wrapper that supports actions for retrieving device information and managing IoT alerts and vulnerabilities.</li></ul> |
| Link to connector (onboarded after July 26, 2026) | IoT Security |
Ingest alerts and assets from IoT Security (Deprecated)
Important
Legacy IoT Security data collectors will be discontinued in the near future. We recommend migrating to the new Device Security data collector to ensure uninterrupted data collection. For more information, see Ingest alerts and assets from Device Security.
The Palo Alto Networks IoT Security (Deprecated) solution discovers unmanaged devices, detects behavioral anomalies, recommends policy based on risk, and automates enforcement without the need for additional sensors or infrastructure. The Cortex XSIAM IoT Security (Deprecated) integration enables you to ingest alerts and device information from your IoT Security (Deprecated) instance.
Data Collection Behavior
- Issues and alerts: Cortex XSIAM displays IoT Security (Deprecated) alerts in the Cortex XSIAM Issues table and groups them into cases. These issues are updated every 15 minutes. IoT security alerts that were resolved before the integration was established are not added to the table.
- Assets and device activities: Device activities detected by IoT Security (Deprecated) are populated in the Cortex XSIAM Assets table. These activities are updated every 5 minutes.
- Datasets: Cortex XSIAM automatically creates two distinct datasets which you can use to initiate XQL Search queries and create Correlation Rules:
panw_iot_security_alerts_raw(for alerts/issues)panw_iot_security_devices_raw(for assets/device activities)
Prerequisites
Before you configure the IoT Security (Deprecated) data collector, generate an access key and a key ID for the integration.
- Log in to the PAN IoT Security portal and click your user name.
- Select Preferences.
- In the User Role & Access section, Create an API Access Key.
- Download and save the access key and key ID in a secure location.
For more information about the PAN IoT Security API, see Get Started with the IoT Security API (Deprecated).
Configure the IoT Security Collector (Deprecated)
- Navigate to Settings > Data Sources & Integrations.
- On the Data Sources & Integrations page, click + Add New, search for IoT Security (Deprecated), then hover over it and click Add.
- Specify the following parameters.
- Customer ID: Tenant domain part of the FQDN used for your IoT Security account. For example, in
yourcorp.iot.paloaltonetworks.com, the customer ID isyourcorp. The customer ID is unique and case sensitive. After you save the integration instance, you can't edit the Customer ID. - Access Key and Key ID previously generated for the integration.
- Integration Scope: Select at least one of the two values, Alerts and Devices depending on which information you want to ingest.
- Click Test to validate access, and then click Enable.\
When events start to come in, a green checkmark appears underneath the IoT Security (Deprecated) data collector configuration with the data and time that the data was last synced.
Managing the Collector
You can continue to manage your existing configuration by selecting the integration in your settings to:
- Edit the collector settings.
- Disable data collection temporarily.
- Delete the collector instance entirely.
Note
If you disable or delete this legacy collector, you will need to follow the migration path to deploy the Device Security data collector to maintain continuous asset and alert monitoring.
Ingest alerts and assets from Device Security
The Palo Alto Networks Device Security solution discovers unmanaged devices, detects behavioral anomalies, recommends policy based on risk, and automates enforcement without the need for additional sensors or infrastructure.
The Cortex XSIAM Device Security integration enables you to ingest alerts and device information from your Device Security instance.
Data collection behavior
- Issues and alerts: Cortex XSIAM displays Device Security alerts in the Cortex XSIAM Issues table and groups them into cases. These issues are updated every 15 minutes. Device security alerts that were resolved before the integration was established are not added to the table.
- Assets and device activities: Device activities detected by Device Security are populated in the Cortex XSIAM Assets table. These activities are updated every 30 seconds.
- Datasets: Cortex XSIAM automatically creates two distinct datasets which you can use to initiate XQL Search queries and create Correlation Rules:
panw_iot_security_alerts_raw(for alerts/issues)panw_iot_security_devices_raw(for assets/device activities)
Note
Data mapping and schemas for both datasets remain completely identical to the IoT Security (Deprecated) collector, ensuring your existing XQL queries and Correlation Rules continue to function seamlessly.
Prerequisites
Before you configure the Device Security data collector, generate a Strata Cloud Manager (SCM) service account Client ID and a Client Secret for the integration.
- Log in to the Strata Cloud Manager instance you use for Device Security using a role that has write access.
- Select Settings > Identity & Access > Access Management.
- Click Add Identity to open the Add New Identity configuration wizard.
- Configure the Identity Information. When finished, click Next.
- Identity Type: Service Account
- Service Account Name: Name for the service account
- Copy the Client ID and Client Secret from the Client Credentials screen and save them in a secure location. When finished, click Next.
- Assign roles to your service account.
- Apps & Services: All Apps & Services
- Role: Superuser
- Click Submit to create the new service account, and then verify that your service account appears in the Access Management table.
For more information about the PAN IoT Security Public API, see Get Started with the IoT Security Public API.
Configure the Device Security collector
- Select Settings > Data Sources & Integrations.
- On the Data Sources & Integrations page, click + Add New, search for the Device Security data collector, then hover over it and click Add.
-
Specify the following parameters.
- TSG ID: The unique Tenant Service Group ID for your Strata Cloud Manager instance. You can find this ID at the top of your SCM Identity & Access page next to your tenant name.\
Note
The TSG ID is unique and case-sensitive. You cannot edit it after saving the integration instance.- Client Id and Client Secret for the SCM service account previously generated during the prerequisite steps.
- Integration Scope: Select at least one of the two values, Alerts and Devices, depending on the information you want to ingest.
- Click Test to validate access, and then click Enable.\
When events start to come in, a green checkmark appears underneath the Device Security data collector configuration with the data and time that the data was last synced.
Managing the Collector
You can continue to manage your existing configuration by selecting the integration in your settings to:
- Edit the collector settings.
- Disable data collection temporarily.
- Delete the collector instance entirely.
IoT Security
Important
This connector is only available for tenants that onboarded after July 26, 2026. For tenants that onboarded before this date, use Marketplace to access the standalone integration. For more information, see Marketplace.
This sub-capability is available with any active Cortex XSIAM or Cortex AgentiX license.
Integrate with the Palo Alto Networks IoT Security Portal (previously Zingbox) to get device details, list devices, list alerts and vulnerabilities, and resolve alerts and vulnerabilities for IoT security response.
This connector includes the following sub-capabilities (Marketplace integrations link to PAN DEV for more information):
- Palo Alto Networks IoT: This is the Palo Alto Networks IoT integration (previously Zingbox).
To configure this connector, follow the steps outlined in the configuration wizard.
Cortex Attack Surface Management
Important
This connector is only available for tenants that onboarded after July 26, 2026. For tenants that onboarded before this date, use Marketplace to access the standalone integration. For more information, see Marketplace.
This sub-capability is available with any active Cortex XSIAM license.
Pull assets and other Attack Surface Management (ASM) information from Cortex Xpanse Expander and the ASM module for Cortex XSIAM. These External Attack Surface Management solutions deliver comprehensive attack surface visibility by combining ML-enhanced asset attribution with continuous attack surface assessment, prioritizing discovered risks using contextual and exploitability data.
This connector includes the following sub-capabilities (Marketplace integrations link to PAN DEV for more information):
- Cortex Attack Surface Management: Integration to pull assets and other ASM related information.
To configure this connector, follow the steps outlined in the configuration wizard.
Cortex Automation Developer Tools
Important
This connector is only available for tenants that onboarded after July 26, 2026. For tenants that onboarded before this date, use Marketplace to access the standalone integration. For more information, see Marketplace.
This sub-capability is available with any active Cortex XSIAM or Cortex AgentiX license.
Developer and onboarding utilities for the Cortex platform, including sample data generators for creating mock issues, an Identity and Access Management (IAM) template, and the DBot Truth Bombs demo content.
This connector includes the following sub-capabilities (Marketplace integrations link to PAN DEV for more information):
- DBot Truth Bombs: You thought you know DBot... guess again! Here are some super secrete facts about DBot we bet you didn't know.
- Hello IAM World: An Identity and Access Management integration template.
- OnboardingIntegration: Creates mock email incidents using one of two randomly selected HTML templates. Textual content is randomly generated and defined to include some text (100 random words) and the following data (at least 5 of each data type): IP addresses, URLs, SHA-1 hashes, SHA-256 hashes, MD5 hashes, email addresses, domain names.
- Sample Incident Generator: Generate random incidents per given parameter.
To configure this connector, follow the steps outlined in the configuration wizard.
Cortex Data Lake
Important
This connector is only available for tenants that onboarded after July 26, 2026. For tenants that onboarded before this date, use Marketplace to access the standalone integration. For more information, see Marketplace.
This sub-capability is available with any active Cortex AgentiX license.
Palo Alto Networks Strata Logging Service XSIAM Connector provides cloud-based, centralized log storage and aggregation for your on premise, virtual (private cloud and public cloud) firewalls, for Prisma Access, and for cloud-delivered services such as Cortex XDR.
This connector includes the following sub-capabilities (Marketplace integrations link to PAN DEV for more information):
- Cortex Data Lake: Palo Alto Networks Strata Logging Service XSIAM Connector provides cloud-based, centralized log storage and aggregation for your organization on premise, virtual (private cloud and public cloud) firewalls, for Prisma Access, and for cloud-delivered services such as Cortex XDR.
To configure this connector, follow the steps outlined in the configuration wizard.
Cortex Internals
Important
This connector is only available for tenants that onboarded after July 26, 2026. For tenants that onboarded before this date, use Marketplace to access the standalone integration. For more information, see Marketplace.
This sub-capability is available with any active Cortex XSIAM, Cortex Cloud Posture Security, Cortex Cloud, Cortex Cloud Runtime Security, Cortex XDR, or Cortex AgentiX license.
The Cortex Internals connector provides native locking integrations (Core Lock and Demisto Lock) that prevent concurrent execution of scripts or commands, using a wait-lock-release flow (mutex). Use the lock name argument to support multiple locks in different flows. These are native integrations that do not require configuration.
This connector includes the following sub-capabilities (Marketplace integrations link to PAN DEV for more information):
- Core Lock: Locking mechanism that prevents concurrent execution of different tasks.
- Demisto Lock: Locking mechanism that prevents concurrent execution of different tasks.
To configure this connector, follow the steps outlined in the configuration wizard.
Cortex XDR
Important
This connector is only available for tenants that onboarded after July 26, 2026. For tenants that onboarded before this date, use Marketplace to access the standalone integration. For more information, see Marketplace.
This sub-capability is available with any active Cortex AgentiX license.
Cortex XDR is the world's first detection and response app that natively integrates network, endpoint, and cloud data to stop sophisticated attacks. Sync indicators to and from Cortex XDR, run investigation and response actions, and run XQL queries against your data sources.
This connector includes the following sub-capabilities (Marketplace integrations link to PAN DEV for more information):
- Cortex XDR - IOC
- Cortex XDR - IR: Cortex XDR is the world's first detection and response app that natively integrates network, endpoint, and cloud data to stop sophisticated attacks.
- Cortex XDR - XQL Query Engine
To configure this connector, follow the steps outlined in the configuration wizard.
Enterprise DLP
Important
This connector is only available for tenants that onboarded after July 26, 2026. For tenants that onboarded before this date, use Marketplace to access the standalone integration. For more information, see Marketplace.
This sub-capability is available with any active Cortex XSIAM, Cortex Cloud Runtime Security, Cortex XDR, or Cortex AgentiX license.
Palo Alto Networks Enterprise DLP discovers and protects company data across every data channel and repository. Integrated Enterprise DLP enables data protection and compliance everywhere without complexity.
This connector includes the following sub-capabilities (Marketplace integrations link to PAN DEV for more information):
- Palo Alto Networks Enterprise DLP: Palo Alto Networks Enterprise DLP discovers and protects company data across every data channel and repository. Integrated Enterprise DLP enables data protection and compliance everywhere without complexity.
To configure this connector, follow the steps outlined in the configuration wizard.
Palo Alto Networks Cortex
Important
This connector is only available for tenants that onboarded after July 26, 2026. For tenants that onboarded before this date, use Marketplace to access the standalone integration. For more information, see Marketplace.
This sub-capability is available with any active Cortex XSIAM, Cortex Cloud Posture Security, Cortex Cloud, Cortex Cloud Runtime Security, Cortex XDR, or Cortex AgentiX license.
Unit 42 Threat Intelligence by Palo Alto Networks delivers high-fidelity threat intelligence curated by the Unit 42 research team and derived from telemetry across the Palo Alto Networks product ecosystem. Use the Unit 42 Feed integration to continuously fetch indicators and threat objects, and the Unit 42 Intelligence integration to enrich indicators (IP, domain, URL, file hash) with verdicts, threat object associations, and relationships.
This connector includes the following sub-capabilities (Marketplace integrations link to PAN DEV for more information):
- Unit 42 Feed: Unit 42 Feed integration provides threat intelligence from Palo Alto Networks Unit 42 research team.
- Unit 42 Intelligence: Enrich indicators with Unit 42 threat intelligence context including verdicts, threat object associations, and relationships.
To configure this connector, follow the steps outlined in the configuration wizard.
PAN PSIRT Advisories
Important
This connector is only available for tenants that onboarded after July 26, 2026. For tenants that onboarded before this date, use Marketplace to access the standalone integration. For more information, see Marketplace.
This sub-capability is available with any active Cortex XSIAM or Cortex AgentiX license.
Queries the public repository of PAN-OS CVEs. The Palo Alto Networks Security Advisories API is a representation of the GUI at https://security.paloaltonetworks.com/.
This connector includes the following sub-capabilities (Marketplace integrations link to PAN DEV for more information):
- Palo Alto Networks Security Advisories: Queries the public repository of PAN-OS CVEs.
To configure this connector, follow the steps outlined in the configuration wizard.
Prisma Cloud Compute
Important
This connector is only available for tenants that onboarded after July 26, 2026. For tenants that onboarded before this date, use Marketplace to access the standalone integration. For more information, see Marketplace.
This sub-capability is available with any active Cortex XSIAM or Cortex AgentiX license.
Prisma Cloud Compute Edition delivers cloud workload protection (CWPP) for modern enterprises, providing holistic protection across hosts, containers, and serverless deployments in any cloud, throughout the application lifecycle. This integration lets you import Palo Alto Networks - Prisma Cloud Compute alerts into Cortex XSIAM.
This connector includes the following sub-capabilities (Marketplace integrations link to PAN DEV for more information):
- PaloAltoNetworks_PrismaCloudCompute: Use the Prisma Cloud Compute integration to fetch incidents from your Prisma Cloud Compute environment.
To configure this connector, follow the steps outlined in the configuration wizard.
Prisma Cloud CSPM
Important
This connector is only available for tenants that onboarded after July 26, 2026. For tenants that onboarded before this date, use Marketplace to access the standalone integration. For more information, see Marketplace.
This sub-capability is available with any active Cortex XSIAM or Cortex AgentiX license.
Prisma Cloud secures infrastructure, workloads, and applications across the entire cloud-native technology stack. Use this connector to manage alerts from Microsoft Azure, Google Cloud Platform, and AWS, and to perform CRUD operations on Prisma Cloud user profiles.
This connector includes the following sub-capabilities (Marketplace integrations link to PAN DEV for more information):
- PrismaCloud IAM: The Prisma Cloud IAM API consists of a set of API endpoints that allow customers to perform CRUD operation on their user profiles.
- PrismaCloud v2: Prisma Cloud secures infrastructure, workloads and applications, across the entire cloud-native technology stack.
To configure this connector, follow the steps outlined in the configuration wizard.
SaaS Security (Aperture)
Important
This connector is only available for tenants that onboarded after July 26, 2026. For tenants that onboarded before this date, use Marketplace to access the standalone integration. For more information, see Marketplace.
SaaS Security is an integrated CASB (Cloud Access Security Broker) solution that scans and analyzes your assets, applies Security policy to identify exposures, external collaborators, risky user behavior, and sensitive documents, and helps stop threats to sensitive information, users, and resources. Use this connector to collect events and fetch issues from the SaaS Security platform and to run remediation actions against assets.
This connector includes the following sub-capabilities (Marketplace integrations link to PAN DEV for more information):
- SaaS Security Event Collector: Palo Alto Networks SaaS Security Event Collector integration for XSIAM. This sub-capability is available with any active Cortex XSIAM, Cortex Cloud Runtime Security, or Cortex XDR license.
- SaasSecurity: SaaS Security API is a cloud-based service that you can connect directly to your sanctioned SaaS applications using the cloud app's API to provide data classification, sharing and permission visibility, and threat detection. This Content Pack provides insights into risks posed by data exposure and policy violations and enables you to use Cortex XSIAM to effectively manage the incidents discovered by SaaS Security API. This sub-capability is available with any active Cortex XSIAM, Cortex Cloud Runtime Security, Cortex XDR, or Cortex AgentiX license.
To configure this connector, follow the steps outlined in the configuration wizard.
Threat Vault
Important
This connector is only available for tenants that onboarded after July 26, 2026. For tenants that onboarded before this date, use Marketplace to access the standalone integration. For more information, see Marketplace.
This sub-capability is available with any active Cortex XSIAM or Cortex AgentiX license.
Use the Palo Alto Networks Threat Vault to research the latest threats (vulnerabilities/exploits, viruses, and spyware) that Palo Alto Networks next-generation firewalls can detect and prevent. The Threat Vault API provides customers with an active Advanced Threat Prevention or Threat Prevention subscription with access to threat signature metadata and other information only available in Threat Vault, and can fetch predefined EDL (External Dynamic List) lists.
This connector includes the following sub-capabilities (Marketplace integrations link to PAN DEV for more information):
To configure this connector, follow the steps outlined in the configuration wizard.
WildFire Cloud
Important
This connector is only available for tenants that onboarded after July 26, 2026. For tenants that onboarded before this date, use Marketplace to access the standalone integration. For more information, see Marketplace.
This sub-capability is available with any active Cortex XSIAM, Cortex Cloud, Cortex Cloud Runtime Security, Cortex XDR, or Cortex AgentiX license.
Use the Palo Alto Networks WildFire integration to automatically identify unknown threats and stop attackers in their tracks by performing malware dynamic analysis. Submit files, hosted files, and webpages for detonation, and retrieve reports and verdicts for enrichment.
This connector includes the following sub-capabilities (Marketplace integrations link to PAN DEV for more information):
To configure this connector, follow the steps outlined in the configuration wizard.
Log type filtering
Cortex XSIAM enables you to control ingestion costs by selecting exactly which logs you want to ingest from Cloud Log Collection Service (CLCS) data sources, which include Prisma Access, Prisma Access Browser (PAB), Cloud Next-Generation Firewalls (CNGFW), and Next-Generation Firewalls (NGFW), including Panorama devices. By filtering for only high-value security logs at the source, you can optimize data consumption in your environment.
Log type filtering replaces the legacy "all-or-nothing" filter for URL and File logs with more granular, source-level control.
Log type selection
When you onboard a new instance or edit an existing one, you can choose the log types you want to ingest or select all.
The list of available log types is dynamic and automatically updates when new types are added to the CLCS architecture.
Supported log types by product
| Integration Type | Available Log Types |
|---|---|
| Firewall and Network Sources (NGFW, CNGFW, Prisma Access, Panorama) | Authentication, Configuration, File Data, Global Protect, HIP Match, System, Threat, Traffic, Tunnel, URL, and User ID logs. |
| Prisma Access Browser (PAB) | Audit Logs, Events Logs, and Devices Logs. |
Filter execution
Filters execute at the CLCS collector layer. This ensures that unwanted telemetry is dropped before it reaches the Cortex XSIAM ingestion pipeline, directly reducing your "GB used" bill.
After you modify your log type selection, the changes take effect at the collector within 5 minutes.
Edit log type filters
You can modify log type filters for existing data source instances at any time.
- Navigate to Settings > Data Sources & Integrations.
- Search for the relevant data source, such as NGFW or Prisma Access.
- Select the instance you want to modify, and click Edit.
- In the Select log types dropdown menu, update your selection.
- Click Save.
Bulk actions
You can update the log type filters for multiple instances of the same type simultaneously using the bulk edit action in the UI. Performing a bulk action overrides any existing per-instance settings (if any) and applies a shared configuration.
For Panorama, you can bulk edit settings as a device; yet, you cannot edit or delete filters for specific Panorama-managed firewalls individually.
Collecting URL and File log types
Note
This topic is only relevant for customers who have not migrated to Cortex XSIAM 3.x. For customers who have migrated, see Log type filtering.
For Palo Alto Networks integrations, you can choose whether to collect URL and File type logs. These logs enhance your cyber analytics, correlation rules and visibility for investigation. However, if you want to reduce ingestion charges, you can globally turn off collection of URL and File log types for all Palo Alto Networks Integrations.
When collection is turned off, some detectors won’t detect cyber attacks or provide full context, and correlation rules won’t be able to detect cyber events. For a full list of affected detectors, see Detectors connected to URL and File log types.
You can also calculate the amount of ingestion that URL and File log types are consuming by looking at the NGFW dashboard. This dashboard provides an overview of the PAN-NGFW ingestion status of all log types (including URL and File log types) and their daily consumption quota.
You can turn on or off URL and File log types collection on the Data Sources & Integrations page.
Detectors connected to URL and File log types
If you turn off URL and File log types collection, some detectors are unable to detect cyber attacks or provide full context, and correlation rules are unable to detect cyber events.
The following detectors are affected by URL logs:
Read more...
- A non-browser process accessed a website UI
- Reverse SSH tunnel to external domain/IP
- Uncommon network tunnel creation
- Suspicious domain fronting behavior
- Possible watering hole SMB credential theft
- Rare connection to external IP address or host by an application using RMI-IIOP or LDAP protocol
- Uncommon JA3 SSL fingerprint communication to an instant messaging server
- PowerShell Initiates a Network Connection to GitHub
- Non-browser failed access to a pastebin-like site
- Non-browser access to a pastebin-like site
- C2 from contextual causality signal
- Massive upload to a rare storage or mail domain
- DNS Tunneling
The following detectors are affected by File logs:
Read more...
- Rare AppID usage to a rare destination
- Abnormal network communication through TOR using an uncommon port
- Recurring access to rare IP
- Possible network connection to a TOR relay server
- A user accessed an uncommon AppID
- Large Upload (Generic)
- Large Upload (FTP)
- Large Upload (SMTP)
- Possible network connection to a TOR relay server
- A user accessed a resource for the first time via SSO - silent
- Access to a domain that is categorized as malicious - silent
- Recurring access to a rare domain categorized as malicious - silent
- Cloud Large Upload (Generic) - disabled
Cloud Posture and Runtime Security data sources
These data sources are included with Cloud Posture Security, Cloud Runtime Security, or Cortex XSIAM Premium license.
Cloud Posture Management and Cloud Runtime Security have their own data sources that you can use to gain complete visibility and real-time control over security risks to your cloud data. These sources utilize cloud-native APIs to discover, contextualize, monitor, and protect assets across multi-cloud environments, as well as specialized services like Snowflake and Microsoft 365.
Relevant Cloud Posture and Runtime data source types:
- Container Registry connectors: A Runtime data source category that integrates with supported container registries like Amazon ECR, Docker Hub, and JFrog to automatically scan container images for vulnerabilities and other security risks.
- Posture management connectors: Provides specialized onboarding to identify misconfigurations in SaaS and data platforms like Snowflake and Microsoft 365 (Posture).
- Discovery engine: Performs regular scans and uses Event Assisted Ingestion (EAI) to track near-real-time changes to cloud assets and VMs.
- Serverless function security: Provides agentless scanning for vulnerabilities in serverless code and pipelines for AWS Lambda, GCP, and Azure functions.
- Cloud data security (DSPM): Discovers and classifies sensitive data across managed storage, such as S3 and Cloud SQL, and self-managed databases.
The following Cloud Posture and Runtime Security data sources and connectors are supported:
- AbuseIPDB
- Aha!
- AIOps
- Anomali
- Apollo.io
- AppSec Transporter applet
- Articulate Global
- Asana
- Atlassian
- Automox
- Azure Log Analytics
- Azure Services
- Box
- Businessmap
- Celonis
- ChatGPT Enterprise
- Cisco Duo
- Cisco Meraki
- Claude
- ClickUp
- Contentful
- Coveo
- Cribl
- Cursor
- CyberArk
- Databricks
- DataDog
- Docker Hub registry
- Docker V2-compliant registry
- DSPM Database applet
- DSPM Fileshare applet
- ElasticSearch
- Forcepoint
- Gainsight
- Gemini Enterprise
- Generic MCP
- Generic SQL
- GitHub
- GitLab container registry
- GitLab
- Google Workspace connector
- Google Workspace Automation and Collection
- Harbor registry
- Harness
- IBM QRadar
- Intercom
- iZOOlogic
- Jamf Pro
- JFrog container registry
- JumpCloud
- Koi
- Kubernetes
- Kustomer
- LastPass
- Mail Utilities
- Microsoft 365 (new)
- Microsoft365 (legacy)
- Microsoft 365 (Posture)
- Microsoft 365 Copilot
- Microsoft Active Directory
- Microsoft Copilot Studio
- Microsoft Entra ID
- Microsoft Graph
- Microsoft Identity
- Microsoft Security Automation and Collection
- Microsoft Teams
- M365 Automation and Collection
- Monday
- Monday.com
- MongoDB Atlas
- MongoDB Atlas (Posture)
- MuleSoft
- Mural
- Nintex Workflow Cloud
- Okta
- Oracle
- PagerDuty
- Ping Identity
- Pipedrive
- Qualtrics
- Redis Labs
- Registry Scanner applet
- Salesforce
- SAP Ariba
- Sentry
- ServiceNow automation and collection
- ServiceNow
- Shopify
- Slack
- SMB
- Snowflake
- Sonatype Nexus registry
- Splunk
- Sumo Logic
- Terraform
- VMware
- Workday Automation and Collection
- Workday
- YouTrack
- Zendesk
- Zscaler
- AppSec Transporter
Activate AppSec Transporter
This feature is included with a Cloud Runtime Security, Cloud Posture Security, or Cortex XSIAM Premium license.
The Transporter over Broker VM enables secure communication between your self-hosted Version Control Systems (VCS) and Cortex XSIAM. This solution addresses the need for secure code scanning without exposing your internal network to the cloud.
- Permissions: To configure and manage Transporter applet settings, you must have permissions to manage Broker Service configurations (such as an Instance Administrator)
- Set up and configure Broker VM
- Confirm that your Broker is v 28 or above
- Whitelist IP addresses to enable access to Cortex XSIAM resources. The IP addresses for the Transporter are in the Broker VM Resources section of the Enable access to required PANW resources document
- Open port
4052, which is required for the Transporter's IP address communication - Open Port
443(outbound), which is required for the Broker VM to pull data from your version control system (VCS)
License
To gain access to and use the Transporter applet, you must possess one of these license types: Cloud Posture Security or Runtime Management, or XSIAM Premium. If you plan to use the Transporter for Code Security scanning, you will also need the Code Security add-on license.
The Transporter applet is not supported for FedRAMP customers.
How to activate the Transporter applet
- Select Settings → Configurations → Broker VMs (under Data Broker.
- Select the Brokers tab → locate your Broker VM → hover and click + Add under the Apps column → AppSec Transporter.
- Configure the Transporter connection in the provided fields:
- Transporter Name (required). Requires a unique name, as you can integrate multiple applets for different integrations
- Provider Self-Signed CA Certificate Path: Specify the file path for a custom Certificate Authority (CA) certificate used by the Transporter to securely communicate with services
- Click Save.
- Verify connectivity: Navigate to the Apps column and verify that your AppSec Transporter applet has been added and displays a connected status.
-
Next step: After activating the Transporter, proceed to configure the Transporter applet on your self-managed VCS data source instance.
For more information, refer to Set up a Transporter on your VCS.
Manage Transporter applets
To manage Transporter applet configurations, disable connections, or deactivate an applet, navigate to the Broker VMs page. From there, select your Appsec Transporter under the App column.
- Edit applet configurations: Select the Appsec Transporter under the App column → Configure. You are redirected to the Transporter applet settings to manage its configurations
- Disable applet connection for a single integration:
- Select the Appsec Transporter under the App column → Configure.
-
On the Transporter applet configurations page, click on the specific Transporter applet → Disable.
This disables the specific integration, but it can be re-enabled.
-
Deactivate an applet (all connections): Select the Appsec Transporter under the App column → Deactivate → Confirm when prompted
All existing connections are deleted, but their configurations are saved in the database. When adding a new connection, you'll be prompted if you want to reuse previous configurations.
Container Registries
License type: This feature is included with a Cortex XSIAM Premium license. It is also included with any other Cortex XSIAM product that has the Cloud Posture Security or the Cloud Runtime Security add-on.
Overview
Container Registries
Container Registries are a category of Runtime Security data sources (also known as connectors) in Cortex XSIAM that enable integration with container image repositories across cloud and third-party environments. These data sources provide visibility into container images stored in registries and allow Runtime Security to assess the security posture of containerized applications.
Container Registry data sources support both managed cloud registries and third-party registry integrations, allowing you to monitor container images across various environments.
Container Registry Scanning
Container Registry Scanning is a Runtime Security capability enabled through Container Registry connectors. It automatically scans container images stored in connected registries to identify security risks, including:
- Vulnerabilities in operating system packages and application dependencies
- Malware within container images
- Exposed secrets such as credentials, tokens, and certificates
- Security policy violations and deviations from security best practices
After a registry is onboarded, scanning runs automatically at regular intervals, eliminating the need for manual image assessment and providing continuous visibility into container security risks.
Supported container registry integrations
- Managed Cloud Registries: The container registry scanner automatically detects and scans container registries and images within your onboarded cloud accounts. Supported registries include Amazon Elastic Container Registry (ECR), Azure Container Registry (ACR), Google Artifact Registry (GAR), and Oracle Cloud Infrastructure (OCI) Artifact Registry. For more details, see configure registry scanning for cloud accounts.
- Third-Party Integrations: The container registry scanner supports agentless scanning of container images by direct integration with various third-party registries, independent of the cloud account onboarding process. These integrations include a streamlined, user-friendly connector configuration experience for the following:
After you onboard your container registries, Runtime Security ensures that all containers and images are scanned at regular intervals and that you are notified about any deviation from your security policies and best practices.
Registry Components
To understand how container registry scanning works, it's essential to understand its core components:
- Container registry: A container registry is a service for publishing, maintaining, and securely distributing container images, providing a centralized hub for managing and accessing containerized application components across your organization. This scanning helps to enable proactive identification and remediation of security risks before deployment which means you will be using only trusted and compliant images in production environments.
- Container image repository: Within a container registry, container images are organized into multiple repositories to improve management, access control, collaboration, and security isolation. Each repository should ideally contain images related to a specific application, service, or project, allowing for granular permissioning and security policies. Images within a repository often share a common base image or purpose, making it easier to apply consistent security controls across related components.
- Image Tags: Image tags are essential for identifying and managing container image versions within a repository, enabling the selection and deployment of appropriate builds. From a security perspective, tags facilitate tracking vulnerable images, deploying patched versions, and maintaining image provenance for auditing. While human-readable tags like myapp:latest (reassignable) and myapp:v1.0.0 are common, using immutable tags such as myapp@sha256:abc123 provides a cryptographically secure and verifiable reference. There are two common formats for referencing image tags:
- image:tag – A human-readable label that can be reassigned to different versions. For example, myapp:latest or myapp:v1.0.0.
- image@sha – A cryptographic hash that provides an immutable reference to a specific image version. For example, myapp@sha256:abc123.
- Image Digest: A cryptographic digest (SHA-256 hash) uniquely identifies a container image's content, providing a strong guarantee of immutability. Unlike user-defined image tags, which can be reassigned, using the digest as a tag ensures that even if an image is renamed or retagged, its content remains verifiably identical, making it a critical element for security auditing and ensuring the integrity of deployed applications. Relying on image digests helps prevent potential supply chain attacks where malicious actors might attempt to replace images with compromised versions.
How Container Registry Scanning Works
The process of container registry scanning consists of three key phases: discovery, scanning, and evaluation.
- Discovery: The connector discovers all registries, repositories, and tags within the account.
- Scanning: The connector extracts software bills of materials (SBOMs), malware indicators, and secrets from each image.
- Evaluation: Scan results are evaluated for vulnerabilities, malware, and secrets, and asset findings are created accordingly.
Configure registry scanning for cloud accounts
Configuring registry scanning ensures that only verified and compliant images are deployed across your cloud environments. You can configure container registry scanning during the onboarding process for managed registries such as Amazon Elastic Container Registry (ECR), Azure Container Registry (ACR), Google Artifact Registry (GAR), and Oracle Cloud Infrastructure (OCI) Artifact Registry.
If an account is already onboarded, you can modify its configuration to enable registry scanning as an Additional Security Capability to scan images for vulnerabilities, malware, and secrets.
Prerequisite:
Ensure that you have performed all the steps till Additional Security Capabilities as listed in the onboarding wizard for the required CSP:
- Onboard Amazon Web Services
- Onboard Google Cloud Platform
- Onboard Microsoft Azure
- Onboard Oracle Cloud Infrastructure
To configure registry scanning, do the following:
-
Under Additional Security Capabilities, select Registry Scanning, then click Edit Preferences.
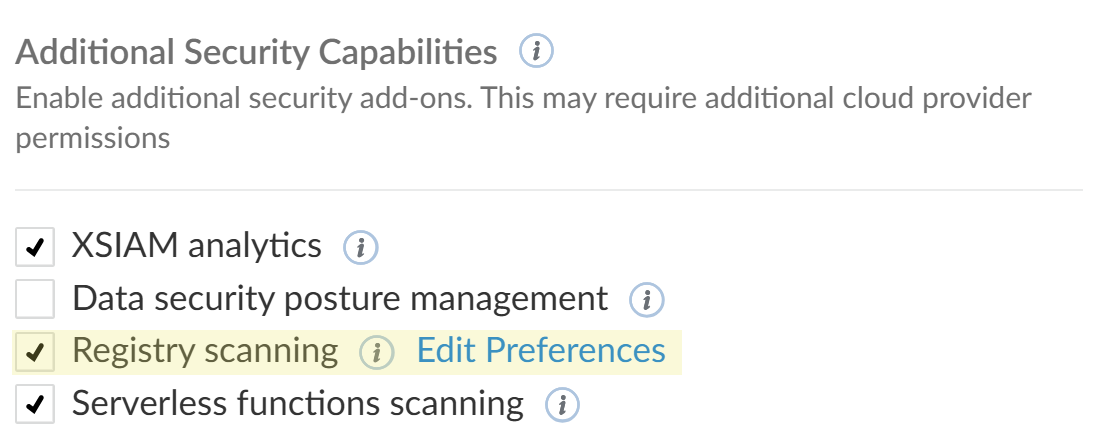
- In Initial Scan Configuration, set your scanning process to focus on recently added or modified container images and exclude older ones that do not align with your current scanning objectives. This setting helps avoid unnecessary scans. Choose one of the following options:
- All: Scans all container images, including all versions (tags), in all discovered repositories.
- Latest Tags: Scans only images tagged 'latest' in all discovered repositories.
- Days Modified: Scans container images created or modified in the last few days. You can select a range of up to 90 days for the scan.
-
When Upload unknown files to WildFire is enabled, eligible files detected during registry image scans are uploaded to WildFire for detonation analysis.
This option expands malware detection by allowing WildFire to analyze new samples found in your registry images. When a detonation result returns a malicious verdict, the system re-evaluates the relevant registry image and creates a malware finding.
Notes
- The file types sent for WildFire analysis depend on the platform type. WildFire accepts files up to 300 MB in size.
- This setting applies only to registry image scans and is supported for Amazon Web Services (AWS), Google Cloud Platform (GCP), and Microsoft Azure cloud accounts.
- This setting is enabled by default for new cloud instances. For existing instances, it is disabled by default to preserve the current behavior. You can enable it at any time by editing the instance configuration.
- Your cloud provider may charge standard outbound data transfer (egress) fees when scanning with an Outpost.
-
Select Save.
After you configure your container registries, the system automatically starts a new scan. The connection process can take up to 15 minutes. To check the status of the data connector and view the registry scan results, go to the Cloud Instances page and select the relevant Instance Name from the list.
- Next Steps.
- After the scan completes, you can view the scanned images in the Container Image page. For more details, see Container Image assets.
- You can also modify your cloud instances to manage them effectively. For more details, see Manage Cloud Instances.
Modify the container registry scanning scope
Using the Modify Scanning Scope option, you can define conditions to automatically exclude selected scopes from scanning. These conditions can be based on the registry, repository, or tag. After you set the scope, the exclusion conditions are automatically applied to newly discovered images in the account.
To modify the scanning scope, do the following:
- Navigate to Settings → Data Sources.
- In the Cloud Provider section, locate the provider where your assets are stored and click View Details.
- On the Cloud Instances page, click the instance name for which you want to modify the scope.
- Under the Accounts section, select the account, right-click, and choose Edit.
- Under the Registry Scanning Scope, enable Modify Scanning Scope.
- From the list of images, select the image you want to modify.
-
Alternatively, you can also filter for a specific image by clicking the Filter icon and selecting Registry, Repository ,or Tags option and then adding the desired value to refine your search.
The search results are applied automatically, even if you do not select Save.
- Click Save to confirm your modifications.
This ensures that the specified scanning scope is customized based on your needs.
Scan re-evaluation process
After the initial scan has been completed, the scan re-evaluation process ensures that container images remain secure over time without requiring a full re-scan.
Instead of manually triggering new scans, the scan re-evaluation process automatically reassesses existing scan results every 24 hours using the latest threat intelligence feeds. This approach reduces the need for resource-intensive re-scans, while maintaining up-to-date security assessments.
By continuously monitoring container images for emerging threats, you can proactively mitigate risks and ensure compliance with security best practices.
External alerts using External Issue Mapping
For a more complete and detailed picture of the activity involved in a case, Cortex XSIAM can ingest alerts from any external source. Cortex XSIAM stitches the external alerts together with relevant endpoint data and displays alerts from external sources in relevant cases and issues tables. You can also see external alerts and related artifacts and assets in causality views. For example, in the Issues table, right-click an issue and select Investigate Causality Chain.
Ingest external alerts
To ingest alerts from an external source, you configure your alert source to forward alerts (in CEF or LEEF format) to the Syslog collector. You can also ingest alerts from external sources using the Cortex XSIAM APIs.
After Cortex XSIAM begins receiving external alerts, you must map the following required fields to the Cortex XSIAM format.
- TIMESTAMP
- SEVERITY
- ALERT NAME
In addition, these optional fields are available if you want to map them to the Cortex XSIAM format.
- SOURCE IP
- SOURCE PORT
- DESTINATION IP
- DESTINATION PORT
- DESCRIPTION
- DIRECTION
- EXTERNAL ID
- CATEGORY
- ACTION
- PROCESS COMMAND LINE
- PROCESS SHA256
- DOMAIN
- PROCESS FILE PATH
- HOSTNAME
- USERNAME
Note
If you send pre-parsed alerts using the Cortex XSIAM API, additional mapping is not required.
Storage of external alerts is determined by your Cortex XSIAM tenant retention policy. For more information, see Dataset Management.
-
Send alerts from an external source to Cortex XSIAM.
There are two ways to send alerts:
- API: Use the Insert CEF Alerts API to send the raw Syslog alerts or use the Insert Parsed Alerts API to convert the Syslog alerts to the Cortex XSIAM format before sending them to Cortex XSIAM. If you use the API to send logs, you do not need to perform the additional mapping step in Cortex XSIAM.
- Activate the Syslog collector (see Activate the Syslog collector) and then configure the alert source to forward alerts to the Syslog collector. Then configure an alert/issue mapping rule as follows.
- In Cortex XSIAM, select Settings → Configurations → Data Collection → External Issue Mapping.
- Right-click the Vendor Product for your issues and select Filter and Map.
-
Use the filters at the top of the table to narrow the results to only the alerts you want to map.
Cortex XSIAM displays a limited sample of results during the mapping rule creation. As you define your filters, Cortex XSIAM applies the filter to the limited sample but does not apply the filters across all alerts. As a result, you might not see any results from the alert sample during the rule creation.
-
Click Next to begin a new mapping rule.
On the left, configure the following:
- Rule Information: Define the NAME and optional DESCRIPTION to identify your mapping rule.
-
Issues Field: Map each required and any optional Cortex XSIAM field to a field in your alert source.
If needed, use the field converter (
 ) to translate the source field to the Cortex XSIAM syntax.
For example, if you use a different severity system, you need to use the converter to map your severity fields to the Cortex XSIAM risks of Critical, High, Medium, and Low.
You can also use regex to convert the fields to extract the data to facilitate matching with the Cortex XSIAM format. For example, if you need to map the port, but your source field contains both the IP address and port (
192.168.1.200:8080), to extract everything after the:, use the following regex:^[^:]*_For additional context when you are investigating a case, you can also map additional optional fields to fields in your alert source.
- To submit your alert filter and mapping rule when finished, click Submit.
Administration and troubleshooting
Manage instances
In Cortex XSIAM, you can manage the instances configured for a data source on the Data Sources & Integrations page. You can edit, delete, enable, or disable instances, and refresh log data.
- Navigate to Settings → Data Sources & Integrations.
- Find an integration by clicking on a data source name in the table or filtering for it, then select the data source.
- Right click the relevant instance. From the menu, you can perform actions such as:
- Enable or disable an Instance.
- Refresh log data (by selecting Refresh).
- Edit the instance.
-
Delete the instance.
If you delete all the instances for a Data Source, the Data Source is not listed on the Data Sources & Integrations page.
Add a new data source or instance
You can add a new data source with the Data Source Onboarder. The Onboarder installs the data source, sets up an instance, configures playbooks and scripts, and other recommended content. The Onboarder offers default (customizable) options and displays all configured content in a summary screen at the end of the process.
- Navigate to the Settings → Data Sources & Integrations page.
- Select one of the following options:
- Add a new data source: Click + Add New.
- Add a new data source integration instance: Select an existing data source and click Add Instance. Then skip to Step 4.
-
Select a data source to onboard and click Add.
Hovering over a data source displays information about the data source and its integrations. Data sources that are already integrated are highlighted green and show Connect Another Instance. To see details of existing integrations, click on the number of integrations.
The data sources are drawn from the Marketplace, Custom Collectors, and integrations. If you search for a data source and No Data Sources Found, click Try searching the Marketplace, to view the marketplace page prefiltered for your search. If there are no available options in the Marketplace, you can use one of the Custom Collectors to build your own.
Note
- If a data source contains multiple integrations, the integration configured as the default integration will used by the Data Onboarder. The default integration of the content pack is indicated in each content pack's documentation. The other integrations are available for configuration in the Data Sources & Integrations page after installing the content pack.
- Not all content packs are supported.
- When adding XDR data sources, the Data Source Onboarder is not available. However, you can still enable the data source; Cortex XSIAM creates an instance and lists it on the Data Sources & Integrations page.
-
In the settings configuration pane, complete the mandatory fields in the Connect section.
For more information about the fields, click the question mark icon.
- (Optional) Under Collect, select Fetched alerts and complete the fields.
-
Under Recommended Content, review and customize the options.
The items in this section are content-specific. Some options are view only, and others are customizable. Click on each option for more information:
- Classifiers & Mappers
- Data Normalization: Parsing rules and data models
- Correlations: Correlation rules included in the pack
-
Automation: Playbooks and Scripts included in the pack.
You can select the Playbooks and Scripts that you want to enable. By default, recommended options are selected. Any unselected content is added as disabled content. Depending on the selected playbook, some scripts are mandatory.
- Dashboards & Reports: Recommended dashboards, widgets, and reports
Notes
If you are adding a new instance to an existing data source, these options are View only.
You can adjust the view-only options on the relevant page in the system, for example Correlations, Playbooks, or Scripts.
- Cortex XSIAM automatically installs content packs with required dependencies and updates any pre-installed optional content packs. You can also Select additional content packs with optional dependencies to be configured during connection.
-
Test the configuration.
If the test fails, you can Run Test & Download Debug Log to debug the error.
- Connect the data source.
-
Review the configuration in the summary screen.
If errors occurred during the test, you can click See Details and Back to Edit to revise your configuration. For advanced configuration, click on any item to open a new window to the relevant page in the system (for example, Correlations or Playbooks) filtered by the configuration.
- Click Finish to return to the Data Sources & Integrations page.
How to configure the scanning settings for supported services
Notice
This feature is included with a Cortex XSIAM Premium license. It is also included with any other Cortex XSIAM license that has the Cloud Posture Security or Cloud Runtime Security add-on.
- In the lower left area, click Settings → Data Sources & Integrations.
- On the Data Sources & Integrations page, click a cloud service provider or other data source and then click the View Details link.
- On the Cloud Instances screen, click an instance name link. A screen displaying the instance name opens.
- At the bottom of the screen, under Accounts (AWS), Subscriptions (Azure), or Projects (GCP), right-click an item in the list and then in the context menu, select Edit.
- In the screen that opens, under Data assets classification options, you can do the following:
- Select or deselect managed services, which are native cloud services that are managed directly by your cloud provider, such as AWS, Azure, or GCP.
- Select or deselect self-managed assets, which are databases that you run on your cloud virtual machines.
-
Configure a cadence indicating how often a scan should be performed.
Note
If you do not select a scanning cadence, the default setting is applied. For more information, contact your Customer Support team.
-
Click Save.
For more information about supported assets in Cortex Cloud Data Security, see Supported assets in Cortex Data Security.
Manage cloud instances
- Navigate to Settings → Data Sources & Integrations.
- Find the cloud instance by clicking the CSP name or using the Search field.
- In the row for the cloud instance, click View Details. The Cloud Instances page is displayed, filtered by the CSP you selected.
- In the Cloud Instances page, you can filter the results by any heading and value.
- Click on an instance name to open the details pane for that instance.
-
You can perform the following actions on each cloud instance:
Action Instructions Discover Now To initiate a discovery scan, in the row for the cloud instance, right-click and select Discover Now. Alternatively, in the details pane, click the more options icon and select Discover Now. Enable/Disable In the row for the cloud instance, right-click and select Enable or Disable. Alternatively, in the details pane, click the more options icon and select Enable or Disable. Delete In the row for the cloud instance, right-click and select Delete. Alternatively, in the details pane, click the more options icon and select Delete. Create a new instance Click New Instance and select the type of CSP of which you want to create a new instance. Follow the onboarding wizard to define its settings. Edit configuration <p>In the row for the cloud instance, right-click and select Configuration. Alternatively, in the details pane, click the edit button. Follow the onboarding wizard to edit the cloud instance's settings.</p><p>You must execute the updated template in the CSP environment for the configuration changes to be applied.</p>
Update cloud permissions after Cortex release updates
This topic provides guidance on how to manage permission updates for your cloud instances following new feature releases or bug fixes. It outlines how users are notified of required permission changes and provides step-by-step instructions for granting necessary permissions to ensure continued functionality and security.
- Ensure that the user account used to modify permissions has the necessary privileges within both the Cortex platform and your cloud environment, for example, AWS or Azure.
- You received a notification regarding a new version available that requires permission updates, or viewed a Needs Update status in the Data Sources & Integrations page.
Procedure
- Navigate to the Data Sources & Integrations page.
-
Do the following to identify instances requiring updates:
- For the relevant instance, locate the Update Status column.
- Filter or sort by this column to quickly identify instances marked as Needs Update. The message on the page indicates the number of instances that need updating.
Note
Instances requiring updates will not change their connection status, for example, Connected, Warning, Error, Disabled, due to the pending permission update.
- Do the following to access the connector's permissions section:
- Click the name of the specific cloud connector instance that requires permission updates. The connector's detailed view appears.
- Within the connector's detailed view, locate and select the permissions section.
- Review missing permissions. In the permissions section, the missing permission names or changes in permission scope is indicated.
- Follow the on-screen instructions to grant the required permissions, or refer to the specific permission names or scopes provided.
- After making the necessary permission adjustments, click Save or Apply Changes within the connector's configuration.
- Return to the Data Sources & Integrations page and verify that the updated status of the instance shows as up-to-date, or the update is in progress.
-
Monitor the instance's health and functionality to confirm the changes have taken effect and the connector is operating as expected.
If you encounter issues during the permission update process, check the generated health alerts for more specific details.
Pending cloud instances
In Cortex XSIAM, a pending cloud instance refers to a cloud instance created after Cortex XSIAM generates an authentication template, but before that template has been fully executed within the Cloud Service Provider (CSP) environment.
A pending cloud instance is created each time you complete the onboarding wizard for a new CSP and click Save. You can view all cloud instances, including those in a pending state, by navigating to Cloud Instances. Ensure you remove any default filters that might exclude instances with a "pending" status.
A single pending instance can be leveraged to create multiple cloud instances, all sharing the same configurations defined during the cloud onboarding process. Pending instances are automatically deleted after 30 days.
Manage pending cloud instances
There are some actions that can be performed specifically on cloud instances with a status of "pending".
| Action | Instructions |
|---|---|
| Manually connect an instance | After the authentication template has been executed in the CSP, you can manually connect the Cortex XSIAM cloud instance to the CSP by right-clicking the pending cloud instance and selecting Manually connect an instance. For more about this process, see Manually connect a cloud instance. |
| View Details | To review the configuration settings defined in the onboarding wizard for a pending instance, right-click the instance and select View Details. This is helps you distinguish between pending instances when you want to create a new cloud instance from an existing pending instance or when you want to manually connect an instance. |
| Re-download Connection Template | The authentication template that you download from the onboarding wizard is valid for seven days from when it was downloaded. If you want to create a new cloud instance from a pending instance after the authentication template has expired, you can right-click the pending instance and select Re-download Connection Template. You must then execute the template in the CSP. |
| Delete | To delete a pending instance, right-click the pending instance and select Delete. |
Troubleshoot errors on cloud instances
To help you to troubleshoot errors on a cloud instance, Cortex XSIAM provides the following visibility and drilldown options:
- Overall status of an instance that indicates the health of your instance.
- A breakdown of the security capabilities enabled on an instance, detailing the status of each capability along with any open errors or issues.
- Additional XQL drill down options to query the history of error and recovery events for each security capability.
How to troubleshoot errors on a cloud instance
-
Navigate to Settings → Data Sources & Integrations.
Under Cloud Service Provider, review the status of the instances that were onboarded for the service provider. If the status shows Warning or Error, hover over the service provider and click View Details.
- On the Cloud Instances page review the list of instances that were onboarded and their overall status. The status is displayed as follows:
- Connected: The connector is enabled and has no issues.
- Warning: The connector is enabled and has minor issues. For example, some accounts or capabilities are in warning or error status.
- Error: The connector is enabled and has substantial errors. For example, an authentication failure, an outpost failure, major permissions issues, or (for organization level accounts) the majority of the accounts in the instance are in error status.
- Disabled: The connector is disabled.
-
To understand why an instance is showing a Warning or Error status, click on the instance name.
The cloud instance panel provides a breakdown of the security capabilities and the accounts onboarded on the instance. Review the information in the following sections:
Section Context Header <p>Displays the overall status of the instance and the following information about the account, as specified during onboarding:</p><ul><li>Scope of the instance: The number of accounts onboarded on the instance and their status. See the Accounts section for more information about the individual accounts and the type of account (single account or organization).</li><li>Scan mode: Cloud Scan or Outpost. For accounts using Outpost, information is displayed about the status of the Outpost account and the account ID.</li><li>Resource Tags: Tags defined during onboarding.</li></ul> Security Capabilities <p>Displays a breakdown of the security capabilities enabled on the instance and their individual statuses. Click on any item that shows a warning or error status to see the open errors and issues that contributed to the status:</p><ul><li>Errors are factual objects that are automatically created when problems occur, and provide insight into the current status of the capability. For example, if a permission is missing, an error is displayed. Browse and filter the errors to better understand and resolve the problem.</li><li><p>Issues are actionable objects that are triggered when detected problems exceed defined thresholds. Issues are manageable, trackable, and provide remediation suggestions and automations.</p><p>The issues displayed in the panel are open issues that are specifically related to the selected connector with the selected capability in the observed scope (single account or organization). Click an issue to start investigating it.</p></li></ul> Accounts <p>Lists the accounts that are onboarded on the instance and their individual status.</p><p>If multiple accounts are onboarded on the instance, click on each account to filter the page information by account, and drill-down to the security capability statuses for each account.</p> - If the instance shows an Outpost error, go to the All Outposts page and find the outpost account that is being used by this instance. Right click the Outpost account to view the open errors and issues for the account.
- If the account shows Permission errors, use the side panel to check which permissions are missing. You can also Edit the instance to redeploy the cloud setup template, which should normally resolve the error.
-
Further investigate errors by running XQL queries on the
cloud_health_auditingdataset.This dataset records error and recovery events for the security capabilities in cloud instances. By querying this dataset you can see information about when the error started, the prevalence of the error, and whether there is a recurrency pattern. See the specific fields descriptions and query examples for each security capability.
Note
Errors related to collection of audit logs in the cloud instance are recorded in the
collection_auditingdataset. For more information, see Audit logs fields and query examples. - Set up correlation rules to trigger issues when errors occur in cloud security capabilities. See the following examples.
Outpost fields and query examples
You can review Outpost entries in the cloud_health_auditing dataset to see Outpost activity over time, or to search for errors on specific accounts. Outpost entries are added to the dataset as follows:
- An error occurred on an Outpost account that disabled or prevented an operation. This is audited as Error.
- An exceptional condition occurred on an Outpost account that might cause problems if not resolved. This is audited as Warning.
- The Outpost account returns to normal function. This is audited as Informational.
The following table describes the fields for Outpost entries:
| Field | Description |
|---|---|
| Account | Cloud account ID of the Outpost |
| Name | Category of the error, or a brief description of the event |
| Resource ID | Outpost ID |
| Capability | Outpost |
| Region | Region where the event occurred, or All regions. |
| Classification | Type of entry (Error, Warning, or Informational) |
| Message | Description of the error or Connected for informational entries. |
| Error | Details about the error. For informational entries this is blank. |
Examples of Outpost queries
-
Identify Outpost errors on all Outpost accounts in the eu-west-3 region:
dataset = cloud_health_auditing | filter capability = "Outpost" and classification = "Error" and region = "eu-west-3"
-
See all entries (error, warning, and recovery) for Outpost_1 on cloud account Account_A:
dataset = cloud_health_auditing | filter capability = "Outpost" and resource_id = “Outpost_1” and account = "Account_A"
Permissions fields and query examples
You can review Permissions entries in the cloud_health_auditing dataset to see Permissions activity over time, or to search for errors on specific accounts. Permissions entries are added to the dataset as follows:
- A permission problem was found. This is audited as Error.
- An exceptional condition occurred that might cause problems if not resolved. This is audited as Warning.
- A permission problem is resolved. This is audited as Informational.
The following table describes the fields for Permissions entries:
| Field | Description |
|---|---|
| Account | Name of the account where the event occurred, or All accounts. |
| Connector | Name of the connector where the event occurred |
| Name | Permission name |
| Capability | Permissions |
| Classification | Type of entry (Error, Warning, or Informational) |
| Message | Description of the error or Granted for informational entries. |
Discovery engine fields and query examples
You can review Discovery engine entries in the cloud_health_auditing dataset to see Discovery activity over time, or to search for errors on specific accounts. Discovery entries are added to the dataset as follows:
- An API exec problem is found. This is audited as Error.
- An exceptional condition occurred that might cause problems if not resolved. This is audited as Warning.
- An API exec problem is resolved. This is audited as Informational.
The following table describes the fields for Discovery engine entries:
| Field | Description |
|---|---|
| Account | Name of the account where the event occurred, or All accounts |
| Connector | Name of the connector where the event occurred |
| Name | Asset name |
| Capability | Discovery |
| Region | Region where the event occurred, or All regions. |
| Classification | Type of entry (Error, Warning, or Informational) |
| Message | Description of the error or Connected for informational entries. |
Examples of Discovery engine queries
-
Identify API exec errors on the Discovery engine for all accounts on the AWS_1 connector:
dataset = cloud_health_auditing | filter capability = "Discovery" and connector = "AWS_1" and classification = “Error”
-
See all Discovery engine activity on connector AWS_1 for Account_ A in the af-south-1 region:
dataset = cloud_health_auditing | filter capability = "Discovery" and connector = "AWS_1" and account = "accountA" and region = "af-south-1"
Agentless Disk Scanning (ADS) fields and query examples
You can review ADS entries in the cloud_health_auditing dataset to see ADS activity over time, or to search for errors on specific accounts. ADS entries are added to the dataset as follows:
- ADS failed to scan an asset. This is audited as Failed.
- ADS successfully scanned an asset. This is audited as Scanned.
- The asset or host is not supported by ADS. This is audited as Unsupported.
- The asset or Host was excluded from the scan. This is audited as Excluded.
| Field | Description |
|---|---|
| Account | Name of the account to which the asset belongs |
| Connector | ID of the connector |
| Name | Name of the asset |
| Resource ID | Asset ID |
| Capability | ADS |
| Region | Region where the asset is located |
| Classification | Type of entry (Failed, Unsupported, Excluded, Scanned) |
| Message | Description of the error, or Connected for informational entries. |
| Error | Details about the error. For informational entries this is blank. |
| Type | Type of asset that was scanned |
| Scope | Scope of the asset (Asset, Region, or Account) |
Examples of ADS queries
-
Identify failed ADS scans on connector "a8df43e848dd42778ae7efd5a706a0fc" for EC2 assets at the asset scope level, filtered by region (northamerica-northeast2-a):
dataset = cloud_health_auditing | filter capability = "ADS" and classification = "failed" and connector = “a8df43e848dd42778ae7efd5a706a0fc” and type = "EC2_INSTANCE" and scope = "Asset" and region = "northamerica-northeast2-a"
-
See all ADS scans (failed and successful) on connector "a8df43e848dd42778ae7efd5a706a0fc" for EC2 assets belonging to Account_A:
dataset = cloud_health_auditing | filter capability = "ADS" and connector = “a8df43e848dd42778ae7efd5a706a0fc” and type = "EC2" and account = “Account_A”
Data Security Scanning (DSPM) fields and query examples
You can review DSPM entries in the cloud_health_auditing dataset to see DSPM activity over time, or to search for errors on specific accounts. DSPM entries are added to the dataset as follows:
- DSPM failed to scan an asset. This is audited as Failed.
- DSPM successfully scanned an asset. This is audited as Success.
The following table describes the fields for DSPM entries:
| Field | Description |
|---|---|
| Account | Name of the account to which the asset belongs |
| Connector | Name of the connector where the event occurred |
| Name | Name of the asset |
| Resource ID | Asset ID |
| Capability | DSPM |
| Region | Region where the asset is located |
| Classification | Type of entry (Failed or Success) |
| Message | Description of the error, or Connected for informational entries. |
| Error | Details about the error. For informational entries this is blank. |
| Type | Type of asset that was scanned |
| Scope | Scope of the asset (Asset, Region, or Account) |
Examples of DSPM queries
-
Identify failed DSPM scans on the AWS_1 connector for S3 asset types, filtered by region (ap-east-1):
dataset = cloud_health_auditing | filter capability = "DSPM" and classification = “Error” and connector = “AWS_1” and type = "S3_BUCKET" and region = "ap-east-1"
-
See all DSPM scans (failed and successful) on the AWS_1 connector, for all scanned assets on Account_A:
dataset = cloud_health_auditing | filter capability = "DSPM" and account = "Account_A" and connector = “AWS_1”
Registry scanning fields and query examples
You can review Registry scanning entries in the cloud_health_auditing dataset to see Registry scanning activity over time, or to search for errors on specific accounts. Registry scanning entries are added to the dataset as follows:
- The Registry scanner failed to scan an asset. This is audited as Failed.
- The Registry scanner successfully scanned an asset. This is audited as Scanned.
The following table describes the fields for Registry scanning entries:
| Field | Description |
|---|---|
| Account | Name of the account to which the asset belongs |
| Connector | Name of the connector where the event occurred |
| Resource ID | Asset ID |
| Capability | Registry |
| Classification | Type of entry (Scanned or Failed) |
| Error | Details about the error. For informational entries this is blank |
| Scope | Scope of the asset (Asset or Account) |
Examples of Registry scanning queries
-
Identify failed scans on connector GCP_1:
dataset = cloud_health_auditing | filter capability = "Registry" and classification = “error” and connector = “GCP_1”
-
Review all registry scans (failed and successful) on connector GCP_1 for asset Asset_A:
dataset = cloud_health_auditing | filter capability = "Registry" and connector = “GCP_1” and ressource_id = "Asset_A"
Audit logs fields and query example
You can review Audit logs entries in the collection_auditing dataset. Querying this dataset can help you see the connectivity changes of an instance over time, the escalation or recovery of the connectivity status, and the error, warning, and informational messages related to status changes. For more information about this dataset, see Verify collector connectivity.
The following table describes the fields for Audit logs entries:
| Field | Description |
|---|---|
| Instance | Instance name |
| Log type | Type of logs affected |
| Classification | Type of entry (Error, Warning, or Informational) |
| Collector type | Type of the collector |
| Description | Description of the error, or Connected for informational entries. |
Audit logs query example
Identify disruptions (errors) in audit log collection on connector AWS_1:
dataset = collection_auditing | filter instance = “AWS_1” and log_type = "Audit Logs" and classification = “Error”
Correlation rule examples
The following examples show how to set up correlation rules to trigger Health Collection issues when errors occur on a specific security capability.
Example rule for DSPM errors
In this example, a correlation rule will trigger a Health Collection issue if a DSPM scan fails on an AWS_S3 asset on the AWS_1 connector.
Example XQL:
dataset = cloud_health_auditing | filter capability = "DSPM" and classification = “Error” and type = "AWS_S3" and scope = "Asset" and connector = “AWS_1”
Additional fields to specify in the correlation rule:
| Field | Value |
|---|---|
| Time Schedule | Hourly |
| Query time frame | 1 Hour |
| Issue Suppression | Select Enable issue suppression. |
| Action | Select Generate Issue. |
| Issue Domain | Health |
| Severity | Medium |
| Category | Collection |
Example rule for Outpost errors
In this example, a correlation rule will trigger a Health Collection issue if an error is recorded on account Outpost_A in the us-east-1 region.
Example XQL:
dataset = cloud_health_auditing | filter capability = "Outpost" and account = "Outpost_A" and region = "eu-west-3" and classification = "Error"
Additional fields to specify in the correlation rule:
| Field | Value |
|---|---|
| Time Schedule | Hourly |
| Query time frame | 1 Hour |
| Issue Suppression | Select Enable issue suppression. |
| Action | Select Generate Issue. |
| Issue Domain | Health |
| Severity | Medium |
| Category | Collection |
Manage Kubernetes Connector instances
- Navigate to Settings → Data Sources & Integrations.
- Find the Kubernetes instance by clicking on the Kubernetes name or using the Search field.
- In the row for the Kubernetes instance, click View Details. The Kubernetes Connectors page is displayed with all deployed Kubernetes Connectors. To view all Kubernetes clusters, including ones that are not yet deployed, go to the Kubernetes Connectivity Management page.
- In the Kubernetes Connectors page, click on a cluster name to open the details pane for that instance.
-
You can perform the following actions on each Kubernetes Connector instance:
Action Instructions Open Cluster Details In the details pane, click the more options icon and select Open Cluster Details. The Asset Card for that Kubernetes cluster is displayed. Edit Connector In the row for the Kubernetes instance, right-click and select Edit. Alternatively, in the details pane, click the more options icon and select Edit Connector. In Edit Kubernetes Connector, edit the configurations and click Apply Changes.You must execute the updated template in the Kubernetes environment for the configuration changes to be applied. Delete Connector In the row for the Kubernetes instance, right-click and select Delete. Alternatively, in the details pane, click the more options icon and select Delete Connector. To remove the connector, you must manually run Kubernetes commands to delete the resources in the Kubernetes environment. The commands are listed here.
Kubernetes Connectivity Management
Navigate to Settings → Data Sources & Integrations and find the Kubernetes instances by clicking on the Kubernetes name or using the Search field. In the Kubernetes Connectors page, click Kubernetes Connectivity Management to view all detected Kubernetes clusters. Here, you can check if a cluster is connected, view the status, and see the connector version. When a new version of the Kubernetes Connector is available, you can update it here.
Note
After uninstalling the Kubernetes connector, the connector status updates to Not connected 48 hours after the uninstall process is initiated.
Integrations
Integrations are mechanisms through which Cortex XSIAM connects and communicates with other products. These integrations can be executed through REST APIs, webhooks, and other techniques. Integrations enable you to orchestrate and automate SOC operations.
Integrations installed from a content pack
Integrations are included in content packs, which you download and install from Marketplace (go to Settings → Configurations → Marketplace). After you download and install a content pack that includes an integration, you need to configure the integration by adding an instance. You can have multiple instances of an integration, for example, to connect to different environments. Additionally, if you are an MSSP and have multiple tenants, you could configure a separate instance for each tenant.
- Some integrations can be downloaded directly without having to initially download a content pack from Marketplace. For more information, see Define data sources.
- In addition to content packs that you install from Marketplace, related content packs are automatically downloaded when you adopt playbooks or edit tasks that require content items such as scripts or integrations.
Cortex XSIAM comes out-of-the-box with integrations to help you onboard, such as:
-
Mail Sender
Sends email notifications to users.
-
Generic Export Indicators Service
Provides an endpoint with a list of indicators as a service for the system indicators. For more information about how to set up the integration, see Export indicators.
-
Palo Alto Networks WildFire Reports
Generates a Palo Alto Networks WildFire PDF report. For more information, see Palo Alto Networks WildFire Reports.
-
Rasterize
Converts URLs, PDF files, and emails to an image file or PDF file. For more information, see Rasterize.
Create an integration in Cortex XSIAM
You can create an integration by adding parameters, commands, arguments, and outputs as well as writing the necessary integration code. You should have a working Cortex XSIAM tenant and programming experience with Python.
- Navigate to the Settings → Data Sources & Integrations page and click + Add New.
- In the Add Data Source or Integrations page, click Create Integration and select either Import File or Create from Template.
- If you select Import File drag and drop or browse to and select the relevant integration file. If you select Create from Template, provide the integration code and settings.
For more information about how to create an integration, including an example, see Create an Integration.
Configure an integration in Cortex XSIAM
From the Data Sources & Integrations page, you can perform actions on an integration such as:
| Action | Description |
|---|---|
| Add an instance | <p>Configure an integration instance to connect and communicate with other products. For more information, see Add an integration instance.</p><p>After configuring the instance, you can also enable/disable the integration instance, copy the instance, and view the integration fetch history.</p> |
| View the integration's source | <p>View the integration settings and source code.</p><p>To access this functionality, select an integration from the table and click  .</p> .</p> |
| Edit the integration's source code | <p>Edit the integration settings and source code. For more information about editing the integration's source code, see Create an Integration.</p><div data-gb-custom-block data-tag="hint" data-style="info" class="hint hint-info"><p>Note</p><p>If the integration was installed from a content pack, you need to duplicate the integration before editing.</p></div> |
| Duplicate the integration | <p>If you want to change the source code, and settings, or download the integration, you need to duplicate the integration.</p><p>To access this functionality, select an integration from the table and click .</p> |
| Show integration commands | <p>Show the commands the integration contains.</p><p>To access this functionality, select an integration from the table and click .</p> |
| Delete an integration instance | Although you cannot delete an integration installed from a content pack (unless a duplicate), you can delete an integration instance by either right-clicking an instance and either selecting Delete or by right-clicking an instance and selecting Settings and then deleting from the settings configuration pane. |
| Set an integration instance to run always whenever the integration is called or on demand | For each integration instance, you have the option of setting the instance to be used only On Demand, when it is specified with the using argument in a playbook or the CLI. By default, the settings is Always and the integration instance is used whenever the integration is called. |
Use integration commands in Cortex XSIAM
The command line interface (CLI) enables you to run system commands, integration commands, scripts, etc from the Cases War Room, Issues War Room, or Playground CLI. The CLI auto-complete feature allows you to find relevant commands, scripts, and arguments.
Cortex XSIAM uses the "!" such as !ad-create-user username=[name of user]
Under each integration, you can view a list of commands.
Note
Integration commands are only available when the integration instance is enabled. Some commands depend on a successful connection between Cortex XSIAM and third-party integrations.
You can run the CLI commands in the Playground or in a case/issue War Room. The Playground is a non-production environment where you can safely develop and test automation scripts, APIs, commands, etc. It is an investigation area that is not connected to a live (active) investigation.
When running the command, the results are returned in the War Room or Playground and also in a JSON format in Context Data.
Tip
In the Playground, you can clear the context data, if needed, which deletes everything in the Playground context data, but does not affect the actual issue or case. To clear the context, run !DeleteContext all=yes' from the CLI or click Clear Context Data while viewing the context data.
Integration use cases
The following categories are common use cases for Cortex XSIAM integrations. While this list is not meant to be exhaustive, it's a starting point to understand what use cases are supported by Cortex XSIAM and third-party integrations.
Analytics and SIEM
Top use cases:
- Fetch issues with relevant filters.
- Create, close, and delete issues/events/cases.
- Update issues - update status, assignees, severity, SLA, and more.
- Get events related to an issue/case for enrichment/investigation purposes.
- Query SIEM (consider aggregating logs).
These integrations usually include the Fetch Issues or Fetch Alerts option for an integration instance configuration. The integration may also include integration commands enabling you to list or retrieve issues or related information.
Analytics & SIEM integration Example: ArcSight ESM
Authentication and Identity Management
Top use cases:
- Use credentials from the authentication vault to configure instances in Cortex XSIAM. (Save credentials in: Settings → Configurations → Integrations → Credentials.) Integrations that use credentials from the vault should have the Switch to credentials option.
- Lock/Delete Account – Use an integration to lock/unlock a third-party account.
- Reset Account - Perform a reset password command for a third-party account.
- Lock an external credentials vault - in case of an emergency (if the vault has been compromised), allow the option to lock/unlock the entire vault via an integration.
- Step-Up authentication - Enforce Multi-Factor Authentication for an account.
- Create, update, and delete users.
- Manage user groups.
- Block users, force a change of passwords.
- Manage access to resources and applications.
- Create, update, and delete roles.
Authentication integration example: CyberArk AIM v2 (Partner Contribution)
Case Management
Top use cases:
- Create, get, edit, close a ticket or issue, and add and view comments.
- Assign a ticket/issue to a specified user.
- List all tickets, and filter by name, date, and assignee.
- Get details about a managed object, update, create, or delete.
- Add and manage users.
Case Management/Ticketing integration example: ServiceNow V2
Data Management and Threat Intelligence
Top use cases:
- Enrich information about different IOC types: Upload object for scan and get the scan results. (If there’s an option to upload private/public, the default should be set to private.) Search for former scan results about an object to get information about a sample without uploading it yourself. Enrich information and scoring for the object.
- Add indicators to the system and search for existing indicators.
- Add indicators to the exclusion list.
- Calculate DBot Score for indicators.
- Enrich asset – get vulnerability information for an asset (or a group of assets) in the organization.
- Generate/trigger a scan on specified assets.
- Get a scan report including vulnerability information for a specified scan and export it.
- Get details for a specified vulnerability.
- Scan assets for a specific vulnerability.
Data Enrichment & Threat Intelligence integration example: Unit 42 Intelligence.
Top use cases:
- Get message – download the email itself, retrieve metadata, and body.
- Download attachments for a given message.
- Manage senders – block/allow specified mail senders.
- Manage URLs – block/allow the sending of specified URLs.
- Encode/decode URLs in messages
- Release a held message when a gateway has placed a suspicious message on hold.
Email Gateway integration example: MimeCast v2
Endpoint
Top use cases:
- Fetch issues and events
- Get event details (from a specified alert)
- Quarantine a file
- Isolate and contain endpoints
- Update indicators (for example, network and hashes) by policy (can be block, monitor) – deny list
- Add indicators to the exclusion list
- Search for indicators in the system (see indicators and related issues/events)
- Download a file based on the hash and the path
- Trigger scans on specified hosts
- Update .DAT files for signatures and compare existing .DAT files to the newest one on the Cortex XSIAM tenant
- Get information for a specified host (OS, users, addresses, hostname)
- Get policy information and assign policies to endpoints
Endpoint integration example: Tanium V2
Forensics and Malware Analysis
Top use cases:
- Submit a file and get a report (detonation)
- Submit a URL and get a report (detonation)
- Search for past analysis (input being a hash/URL)
- Retrieve a PCAP file
- Retrieve screenshots taken during analysis
Forensic and Malware Analysis example: Cuckoo Sandbox
Network Security
Top use cases:
- Create block/accept policies (source, destination, port), for IP addresses and domains
- Add addresses and ports (services) to predefined groups, create groups, and more
- Support custom URL categories
- Fetch network logs for a specific address for a configurable time frame
- URL filtering categorization change request
- Built-in blocked rule command for fast blocking
- If there is a Management Firewall, allow the option to manage policy rules through it
- Get/fetch issues
- Get PCAP file, packet
- Get network logs filtered by time range, IP addresses, ports, and more
- Create/manage/delete policies and rules
- Update signatures from an online source/upload + get the last signature update information
- Install policy (if existing)
Network Security Firewall integration examples: Tufin (Partner Contribution), Protectwise
Vulnerability Management
Top use cases:
- Enrich asset – get vulnerability information for an asset (or a group of assets) in the organization.
- Generate/trigger a scan on specified assets
- Get a scan report including vulnerability information for a specified scan and export it
- Get details for a specified vulnerability
- Scan assets for a specific vulnerability
Vulnerability Management integration example: Tenable.sc
Add an integration instance
To use a downloaded integration, you must configure an integration instance.
Before you begin:
- Content packs containing integrations are downloaded when you adopt playbooks and configure playbook tasks. The content pack must be downloaded before you can configure an integration instance.
- Consider whether you want to add credentials, which enable you to save login information without exposing usernames, passwords, certificates, and SSH keys. For more information, see Manage credentials.
- Although you can view integration documentation when adding an instance, https://xsoar.pan.dev/ has more detailed information about integrations, including commands, outputs, and recommended permissions.
Find the integration
Navigate to Settings → Data Sources & Integrations. Search for the integration.
Add an instance
Select the integration and click Add Instance.
Configure parameters
Add the required parameters.
Test the connection
Optional: Click Test to verify the integration instance works correctly.
Save the instance
Click Save & Exit.
You can expand the integration to view instance details. You can also enable, disable, or copy the instance.
If an error occurs, see Troubleshoot integrations.
Choose when to use the instance
By default, the instance runs whenever the integration is called. Change Always to On Demand to use it only with the using argument in a playbook or CLI.
For example, use an on-demand instance for manual testing.
Configure command access
Optional: See Configure integration permissions to manage access to specific commands.
Configure integration permissions
You can use role-based access control (RBAC) to restrict running commands to specific roles at the integration instance level. If you have multiple instances of the same integration, you can assign different roles (permission levels) for the same command in each instance.
For example, you may want limit the roles that can run potentially harmful commands, such as the ability to isolate endpoints.
Users who do not have permission to run a command cannot do the following:
- Run the command from the CLI.
- Complete pending tasks in a Work Plan that uses the restricted command.
- Edit arguments for playbook tasks that use the restricted command.
- Select the command when editing a playbook.
- Leverage the restricted command when executing a reputation command, such as IP, Domain, and File.
If you have multiple instances of the same integration, you can assign different roles (permission levels) for the same command in each instance.
To view or edit integration permissions:
-
Go to Settings → Configurations → Data Collection → Integration Permissions.
You can see a list of all enabled integrations.
-
Select the integration.
You can see the following:
- INSTANCE: Lists all instances for the integration.
- COMMANDS: Lists all commands for the integration.
- PERMITTED ROLES: Lists the roles that have permission to run the command. Default is No Restrictions.
- For a specific command, restrict the roles that can run the command.
- Go to the relevant command.
- Click Edit.
- In the PERMITTED ROLES, column, select the roles that you want to allow running the command.
- Save the integration permissions.
Fetch issues from an integration instance
You can poll third-party integration instances for events and turn them into Cortex XSIAM issues (fetching). Many integrations support fetching, but not all support this feature. You can view each integration in the Developer Hub.
When setting up an instance, you can configure the integration instance to fetch events. You can also set the interval for which to fetch new issues by configuring the Issue Fetch Interval field. The fetch interval default is 1 minute. This enables you to control the interval in which an integration instance reaches out to third-party platforms to fetch issues into Cortex XSIAM.
Note
- In some integrations, the Issue Fetch interval is called Feed Fetch Interval.
- If the integration instance does not have the Issue Fetch Interval field, you need to add this field by editing the integration settings. If the integration is from a content pack, you need to create a copy of the integration. Any future updates to this integration will not be applied to the copy integration.
- If you turn off fetching for a while and then turn it on or disable the instance and enable it, the instance remembers the last run and pulls all events that occurred while it was off. If you don't want this to happen, verify that the instance is enabled and click Reset the “last run” timestamp when editing the instance. Also, note that "last run" is retained when an instance is renamed.
After configuring the instance, you may need to set up a correlation rule to ingest issues.
Correlation rules are predefined logic or patterns that Cortex XSIAM uses to identify relationships between disparate events occurring across an organization's IT environment. If the conditions specified in the rule are met, Cortex XSIAM generates an issue.
How to fetch issues
- Navigate to Settings → Data Sources & Integrations, find and select the integration, and click Add Instance.
-
In the integration's dialog box, select Fetch issues.
After this setting is enabled, Cortex XSIAM searches for events that occurred within the time frame set for the integration, which is based on the specific integration. The default is 10 minutes, but it can be changed in the integration script.
Note
To authenticate the fetch, you must select a valid credential. If your user role has the Credentials permission set to None, you will not be able to select pre-saved credentials. Instead, the message Credentials are locked by admin is displayed. In this case, you must manually enter the authentication details or ensure your role has at least View permissions for the Credentials component.
- (Optional) In the Issue Fetch Interval field, set the interval of hours and minutes to fetch alerts (default 1 minute).
-
(Optional) If the Issue Fetch Interval field does not appear, add it to the integration.
Relevant for any issue fetching integration:
-
For integrations installed from a content pack, select the duplicate integration button.
If you have already duplicated the integration, click the Edit integration’s source button.
-
In the Basic section, select the Fetch issues checkbox.
In the Parameters section, you can see that the
IssueFetchIntervalparameter is added. Change the default value if necessary. -
Click Save to save the changes.
-
-
To generate issues, add correlation rules, as required.
Note
Some content packs include preconfigured correlation rules, but you should review them to see if they suit your use case and duplicate them if required. Go to Threat Management → Detection Rules → Correlations, search for the relevant rule, right-click, and select Preview Rule. For example, the ServiceNow v2 Alerts (automatically generated) correlation rule uses the following XQL Query:
dataset = servicenow_v2_generic_alert_raw | filter _alert_data != null | alter alert_severity = json_extract_scalar(_alert_data, "$.severity") | alter alert_category = json_extract_scalar(_alert_data, "$.alert_category") | alter alert_name = json_extract_scalar(_alert_data, "$.alert_name") | alter alert_description = json_extract_scalar(_alert_data, "$.alert_description")
You may want to update the query by defining complex, multi-source detection logic or add filters, such as alert severity or assignee.
Map fields to issue types
Mappers enable you to map information from incoming events to the issue fields that you have in your system. You can map to system issue fields or custom issue fields.
Mapping event attributes or issue fields takes place in two stages. First you map all of the fields that are common to all issues in the default mapping. Second, you map the additional fields that are specific for each issue indicator type, or overwrite the mapping that you used in the default mapping.
Note
In the Classification & Mapping page, the mapping does not indicate for which issue types they are configured. Therefore, when creating a mapper, it is best practice to add to the mapper name, the issue types the mapper is for. For example, Mail Listener - Phishing.
Note
When mapping a list, we recommend you map to a multi select field. Short text fields do not support lists. If you do need to map a list to a short text field, add a transformer in the relevant playbook task, to split the data back into a list.
You can use this procedure for creating a classifier or duplicating an existing mapper for issue types.
- Navigate to Settings → Configurations → Object Setup → Issues → Classification & Mapping.
- Click New and select Issue Mapper (incoming). The Issue Mapper maps all of the fields you are pulling from the integrations to the issue fields in your layouts.
- Under Get data, select from where you want to pull the information based on where you want to map the issue types.
- Pull from instance - select an existing integration instance.
- Select schema - when supported by the integration, this pulls all of the fields for the integration from the database. This enables you to see all of the fields for each given event type that the integration supports.
- Upload JSON - upload a formatted JSON file which includes the field you want to map.
- Under Issue Type, start by mapping out the Common Mapping. This mapping includes the fields that are common to all of the issue types and will save time having to define these fields individually in each issue type.
-
Click the event attribute to which you want to map. You can further manipulate the field using filters and transformers.
You can click Auto Map to automatically map fields with common or similar names to fields in Cortex XSIAM . For example, Severity to Importance or Description to Description.
- Repeat this process for the other issue types for which this mapping is relevant.
- Click Save.
- Go to Settings → Data Sources & Integrations.
- Select the integration instance to which you want to apply the mapper.
- In the integration settings, under Mapper (incoming) select the mapper you created and click Save.
Classify events using a classifier for issue types
When an integration fetches issues, it populates the rawJSON object in the issue object. The rawJSON object contains all of the attributes for the event. For example, source, when the event was created, the priority that was designated by the integration, etc. When classifying the event, you want to select an attribute that can determine the event type.
You can use this procedure for creating a classifier or duplicating an existing classifier.
- Go to Settings → Configurations → Object Setup → Issues → Classification & Mapping.
-
Click New and select Issue Classifier.
If you want to duplicate the classifier, select the relevant classifier and then duplicate it.
- Under Get data, select from where you want to pull the information based on which you will classify the issue types.
- Pull from instance - select an existing integration instance.
- Select schema - when supported by the integration, this will pull all the fields for the integration from the database from which you can select by which to classify the events.
- Upload JSON - upload a formatted JSON file which includes the field by which you want to classify.
- In the Select Instance field, select the instance from where you want to choose the value.
- In the Data fetched from select the value by which you want to classify the events.
-
Drag values from the Unmapped Values column to the relevant issue type on the right.
You can optionally choose a default issue type for unclassified issues from Direct unclassified events to: Select.
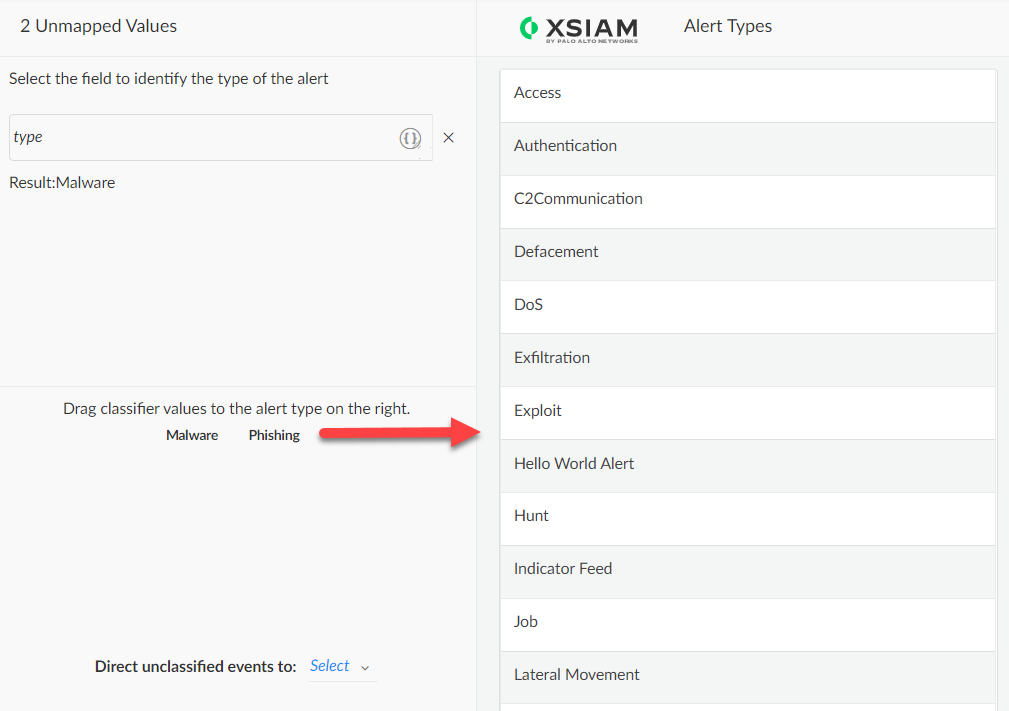
- Click Save.
- Go to Settings → Data Sources & Integrations.
- Select the integration to which you want to apply the classifier.
- In the integration settings, under Classifier, select the classifier you created and click Save.
Manage credentials
Credentials simplify and compartmentalize administrative tasks, and enable you to save login information without exposing usernames, passwords, certificates, and SSH keys. You can reuse credentials across multiple systems, for example, when using the same administrator password across multiple endpoints.
Prerequisite
To view the Credentials page and manage its content, your user role must have the following minimum permissions:
- Integrations: View
- Data Sources: View
- External Issue Mapping: View
Without these permissions, the Credentials page is hidden. Furthermore, if the Credentials permission itself is set to None, the page is hidden even if the above prerequisites are met. For more information, see Credentials permissions.
After you set up a credential, you can configure integration instances to use it instead of entering the name and password manually.
How to add credentials to an integration instance
- Create the credential.
- Select Settings → Configurations → Integrations → Credentials → New Credential.
-
Add the following parameters:
Parameters Description Credential Name The name of the credential. You select this name when adding the credential to the integration instance. Username The username for the credential. Workgroup The workgroup to associate this credential with. Relevant for third-party services, such as Active Directory, CyberArk, and HashiCorps. Password The password for the credential. For example, add the API Key when defining the API credential. Certificate Certificate or SSH to use for the credential. - Save the credential.
- Add the credential to the integration instance.
- Go to Settings → Data Sources & Integrations and select the integration.
- Click Add Instance.
-
Locate the relevant section and click Switch to credentials.
If there is more than one credential, select the relevant credential.
Note
If your user role has the Credentials permission set to None, the Switch to credentials option is hidden. Instead, the message Credentials are locked by admin is displayed, and you cannot reference stored secrets. This restriction applies to both data sources and unified connectors.
- Test and Save & Exit the integration instance.
Configure an external credentials vault in Cortex XSIAM
Cortex XSIAM integrates with external credential vaults, which enables you to use them without hard-coding or exposing the credentials. The credentials are not stored in Cortex XSIAM, but the integration fetches the credentials from the external vault when called. The credentials are passed to the relevant executed integrations as part of the integration parameters.
Sample credentials provider integrations:
After the integration is configured to fetch credentials, you can also use them in scripts and playbooks. To use these credentials in an integration, click Switch to credentials in an integration instance, and select the necessary credential from the drop-down menu.
Troubleshoot Integrations
The Troubleshooting Instances dashboard provides you with insight into command execution errors. When troubleshooting integrations, we recommend the following steps:
- Use the Test button in the integration instance.
- Verify the integration settings. Check settings such as usernames, URLs, and passwords.
-
Download the debug log file and review its contents.
In the following example, you receive a 401 unauthorized error code after testing the integration.
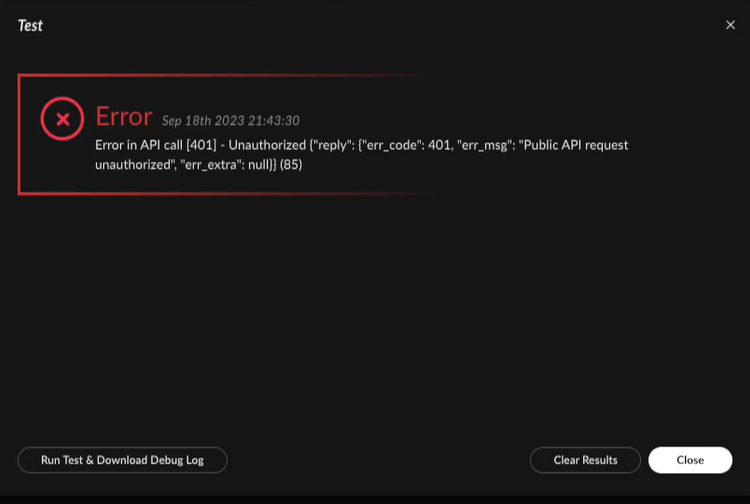
Click Run Test & Download Debug Log, to download the debug file locally. You can verify what server the URL request is being forwarded to and any other reasons as to why you received this error code. The 401 unauthorized error code usually relates to invalid error credentials, expired tokens, or incorrect API settings.
- Enable verbose or debug-level logging on the integration.
Note
If an integration instance consistently encounters API rate limits when running on the tenant, consider configuring the instance to run on an engine to change the source of the outbound traffic.
If you are unable to fix the integration, contact Customer Support for further assistance.
Forward Requests to Long-Running Integrations
Some long-running integrations provide internal data via API calls to your third-party software, such as a firewall. You can set up Cortex XSIAM to allow third-party software to access long-running integrations installed either on the Cortex XSIAM tenant or on an engine.
- Avoid sending high volumes of small, individual payload requests in rapid succession. Excessively high request frequencies can exhaust connection pools, leading to HTTP
500/502errors across the tenant. The rate limit is 600 requests per minute. - When running on the tenant, you can only use long-running integrations provided by Cortex XSIAM, you cannot create custom ones. Custom long-running integrations are supported only on engines at this time.
- Configuring custom certificates or private API Keys in the long-running integration instance is supported only on engines, not on the Cortex XSIAM tenant.
- If you have configured a range of Approved IP Ranges under Allowed Sessions on the Security Settings page, any incoming communication must be from approved IP addresses.
Long-running integrations provide internal data via API calls such as:
| Integration | Description | See More |
|---|---|---|
| O365 Teams (Using Graph API) | Get authorized access to a user's Teams app in a personal or organizational account. | O365 Teams (Using Graph API) |
| Generic Webhook | Creates cases on event triggers. The trigger can be any query posted to the integration. | Generic Webhook |
| Generic Export Indicators Service | <p>Use the Generic Export Indicators Service integration to provide an endpoint with a list of indicators as a service for the system indicators.</p><p>You can set up the tenant to export internal data to an endpoint.</p><div data-gb-custom-block data-tag="hint" data-style="info" class="hint hint-info"><p>Note</p><p>This integration replaces the External Dynamic list integration, which is deprecated. For more information about how to set up the integration, see Manage external dynamic lists.</p></div> | Export indicators |
| Microsoft Teams | Send messages and notifications to team members. | Microsoft Teams |
| TAXII Server | Provides TAXII Services for system indicators (Outbound feed). | TAXII Server |
| TAXII2 Server | Provides TAXII2 Services for system indicators (outbound feed). You can choose to use TAXII v2.0 or TAXII v2.1. | TAXII2 Server |
| PingCastle | Listens for PingCastle XML reports. | PingCastle |
| Publish List | Publishes Cortex XSIAM lists for external consumption. | Publish List |
| Simple API Proxy | Provides a simple API proxy to restrict privileges or minimize the number of credentials issued at the API. | Simple API Proxy |
| Syslog v2 | Opens cases automatically from Syslog clients. | Syslog v2 |
| Web File Repository | Make your environment ready for testing purposes for your playbooks or automations to download files from a web server. | Web File Repository |
Credentials
For long-running integrations running on a tenant, you must set a username and password. For long-running integrations running on an engine, we strongly recommend setting a username and password, but it is not required.
Users with sufficient permissions can set the username and password for specific integration instances on the Data Sources & Integrations page.
Define a listening port for long-running integrations
When configuring a long-running integration instance, you may need to define a listening port.
-
Integration instance running directly on a tenant
If the long-running integration runs on the Cortex XSIAM tenant, you do not need to enter a Listen Port in the instance settings. The system auto-selects an unused port for the long-running integration when the instance is saved.
-
Integration instance running on a custom engine
You must set the Listen Port for access when configuring a long-running integration instance on an engine. Use a unique port for each long-running integration instance. Do not use the same port for multiple instances.
Test the long-running integration connection
-
Integration instance running directly on a tenant
You can use CURL commands from any terminal to access and test the long-running integration. The string
xdrin the URL must be replaced bycrtxand the data URL must always be prefixed byext-.Note
For the TAXII Server and TAXII2 Server integrations, the
xdrstring is automatically replaced bycrtx. For the Microsoft Teams integration, you can use themicrosoft-teams-create-messaging-endpointcommand to get the correct messaging endpoint based on the server URL, the server version, and the instance configurations. For more information, see Microsoft Teams.Example:
Tenant URL: https://crtx-cnt-onr-xsiam-dran-9c0.xdr-qa2-uat.us.com
Request URL: https://ext-crtx-cnt-onr-xsiam-dran-9c0.crtx-qa2-uat.us.com/xsoar/instance/execute/edl_instance_01\q\type:ip
CURL: curl -v -u user:pass https://ext-crtx-cnt-onr-xsiam-dran-9c0.crtx-qa2-uat.us.com/xsoar/instance/execute/edl_instance_01\q\type:ip
-
Integration instance running on a custom engine
You can use CURL commands from any terminal to access and test the long-running integration at the engine URL:
http://<engine-address>:<integration listen port>/For example,
curl -v -u user:pass http://<engine_address>:<listen_port>/?n=50
Curl request parameters for external dynamic lists
The following list of curl request parameters applies when using the Generic Export Indicators Service integration for external dynamic lists.
| Argument | Description | Example |
|---|---|---|
n |
The maximum number of entries in the output. If no value is provided, will use the value specified in the List Size parameter in the integration instance settings. | https://ext-<tenant-address>/instance/execute/<ExportIndicators_instance_name>?n=50 |
s |
The starting entry index from which to export the indicators. | https://ext-<tenant-address>/instance/execute/<ExportIndicators_instance_name>?s=10&n=50 |
v |
The output format. Supports PAN-OS (text), CSV, JSON, mwg, and proxysg (alias: bluecoat). | https://ext-<tenant-address>/instance/execute/<ExportIndicators_instance_name>?v=json |
q |
The query is used to retrieve indicators from the system. | https://ext-<tenant-address>/instance/execute/<ExportIndicators_instance_name>?q="type:ip and sourceBrand:my_source" |
t |
Only with mwg format. The type is indicated at the top of the exported list. Supports: string, applcontrol, dimension, category, ip, mediatype, number, and regex. | https://ext-<tenant-address>/instance/execute/<ExportIndicators_instance_name>?v=mwg&t=ip |
sp |
If set, will strip ports off URLs; otherwise, will ignore URLs with ports. | https://ext-<tenant-address>/instance/execute/<ExportIndicators_instance_name>?v=text&sp |
di |
Only with PAN-OS (text) format. If set, will ignore URLs that are not compliant with PAN-OS URL format instead of being rewritten. | https://ext-<tenant-address>/instance/execute/<ExportIndicators_instance_name>?v=text&di |
cr |
If set, will strip protocols off URLs. | https://ext-<tenant-address>/instance/execute/<ExportIndicators_instance_name>?v=text&pr |
cd |
Only with proxysg format. The default category for the exported indicators. | https://ext-<tenant-address>/instance/execute/<ExportIndicators_instance_name>?v=proxysg&cd=default_category |
ca |
Only with proxysg format. The categories that will be exported. Indicators not in these categories will be classified as the default category. | https://ext-<tenant-address>/instance/execute/<ExportIndicators_instance_name>?v=proxysg&ca=category1,category2 |
tr |
<p>Only with PAN-OS (text) format. Whether to collapse IPs.</p><ul><li>0 - Do not collapse.</li><li>1 - Collapse to ranges.</li><li>2 - Collapse to CIDRs</li></ul> | https://ext-<tenant-address>/instance/execute/<ExportIndicators_instance_name>?q="type:ip and sourceBrand:my_source"&tr=1 |
tx |
Whether to output CSV formats as textual web pages. | https://ext-<tenant-address>/instance/execute/<ExportIndicators_instance_name>?v=csv&tx |
Verify collector connectivity
You can verify the connectivity status of a collector instance on the Data Sources & Integrations page. Instances are grouped by integration, and the Instances Status column shows icons that summarize the instance statuses for the integration. Click the integration to see details for each individual instance.
In addition, Cortex XSIAM creates Collection health issues if connectivity disruptions occur in your collection integrations, custom collectors, and Marketplace integrations. For more information, see About health issues.
Troubleshoot collector errors in Cortex XSIAM
Note
For more information on troubleshooting data collector applet errors, see Troubleshoot Broker VM applet connectivity.
Where can I see if I have a connectivity error on a collector instance?
On the Data Sources & Integrations page, instances in error status display an error icon. Hover over the error icon next to the instance name to see the error message as received from the API.
Where can I trace the connectivity changes of a collector instance?
Each status change of an instance is logged in the collection_auditing dataset. Querying this dataset can help you see all the connectivity changes of an instance over time, the escalation or recovery of the connectivity status, and the error, warning, and informational messages related to status changes.
This example searches for status changes on Strata IOT integrations:
dataset = collection_auditing |filter collector_type = "STRATA_IOT"
How can I set up correlation rules to trigger collection issues?
Cortex XSIAM provides OOTB Collection issues that are triggered when a data collector instance is in error status, which means it is disconnected or not sending data. In addition, you can set up your own correlation rules that trigger collection issues for your specific needs. For example, you might want to be notified if a high-profile collector is in warning status so that you can fix the problem and prevent the collector from disconnecting.
Example: Trigger collection issues for warning statuses on the STRATA_IOT collector
In this example, a correlation rule triggers a Collection issue if an integration of the Strata IOT collector changes to warning status. Any issues will appear on the Health Issues page.
Example XQL:
dataset = collection_auditing |filter classification = "Warning" and collector_type = "STRATA_IOT"
Additional fields to specify in the correlation rule:
| Field | Value |
|---|---|
| Time Schedule | Hourly |
| Query time frame | 1 Hour |
| Issue Suppression | Select Enable issue suppression. |
| Action | Select Generate issue. |
| Issue Domain | Health |
| Severity | Medium |
| Category | <p>Collection</p><div data-gb-custom-block data-tag="hint" data-style="info" class="hint hint-info"><p>Note</p><p>If an issue is triggered, the investigation options in the right-click menu of the Health Issues pages are context-specific. Make sure that you specify the relevant issue category.</p></div> |
Overview of data ingestion metrics
Prerequisite
For Cortex XSIAM to monitor data ingestion health and create health issues, you must enable Cortex - Analytics. Go to Configurations → Cortex - Analytics. For more information, see Enable the Analytics Engine and Identity Analytics.
The data ingestion metrics are calculated in 5-minute aggregation periods and saved to the metrics_source dataset and metrics_view preset. These metrics measure the amount, size, and rate at which logs are ingested by a data source:
| Metric | Description |
|---|---|
| total_size_bytes | Total size (in bytes) of the logs collected during the aggregation period. |
| total_size_rate | Average size (in bytes per second) of the logs collected during the aggregation period. |
| total_event_count | Total number of logs collected during the aggregation period |
| total_event_rate | Average number (in count per second) of logs collected during the aggregation period. |
In the metrics_source dataset, the data ingestion metrics are saved alongside additional fields that describe the data source associated with the metrics. Only entries with ingestion metric values greater than zero are saved in the dataset. Entries with zero values are not saved in this dataset.
metrics_view is a preset for data in the metrics_source dataset. The preset also simulates completion of entries with zero values in data ingestion metrics at runtime, which allows effective use of metrics. Therefore, when investigating disruptions in data collection, we recommend using the metrics_view preset in XQL queries and correlation rules.
Cortex XSIAM built-in data ingestion monitoring and issue mechanism uses the data ingestion metrics to identify disruptions in the data ingestion pipeline. Using analytical logic, Cortex XSIAM creates an ingestion baseline for each data source that reflects the routine pattern of log collection. If a data source isn't ingesting logs, or there is a significant deviation from the baseline, ingestion issues are triggered. You can see all ingestion issues on the Health Issues page. To troubleshoot or investigate an issue, right-click an issue and click Investigate in XQL query. For more information, see Investigate and resolve health issues.
In addition, you can create your own custom logic for data ingestion health monitoring by setting up correlation rules that monitor the data ingestion metrics. For more information, see Creating correlation rules to monitor data ingestion health.
The following table describes all the fields in the metrics_source dataset and metrics_view preset:
Data ingestion metric fields
| Field | Type | Description |
|---|---|---|
| total_size_bytes | Integer | Total size (in bytes) of the logs collected during the aggregation period. |
| total_size_rate | Integer | Average size (in bytes per second) of the logs collected during the aggregation period. |
| total_event_count | Integer | Total number of logs collected during the aggregation period |
| total_event_rate | Integer | Average number (in count per second) of logs collected during the aggregation period. |
| data_freshness_max_delay | Float | Maximum delay value from all log entries in a record between log creation at the source and ingestion into Cortex XSIAM (in seconds). |
| data_freshness_median | Float | Median delay value from all log entries in a record between log creation at the source and ingestion into Cortex XSIAM (in seconds). |
| data_freshness_ninetieth_percentile | Float | Ninetieth percentile of delay values from all log entries in a record between log creation at the source and ingestion into Cortex XSIAM (in seconds). |
| last_seen | Datetime | Time that the last logs were collected. |
| _vendor | String | Vendor of the observing data source. |
| _product | String | Product name of the observing data source. |
| _device_id | String | (For firewall devices) Device ID |
| _log_type | String | (For firewall devices) Log type |
| _collector_type | String | (Event Metadata) Type of collector that provided the log. |
| _collector_name | String | (Event Metadata) Name of the collector instance. |
| _collector_id | String | (Event Metadata) ID of the XDR Collector. |
| _collector_ip | String | (Event Metadata) IP address of the XDR Collector. |
| _reporting_device_name | String | (Event Metadata) Host name of the device where the log originated. |
| _reporting_device_ip | String | (Event Metadata) IP Address of the device where the log originated. |
| _final_reporting_device_name | String | (Event Metadata) Hostname of the device that the log was extracted from. |
| _final_reporting_device_ip | String | (Event Metadata) IP of the device that the log was extracted from. |
| _broker_device_name | String | (Event Metadata) Host name of the Broker VM. |
| _broker_device_ip | String | (Event Metadata) IP address of the Broker VM. |
| _broker_device_id | String | (Event Metadata) ID of the Broker VM. |
| _time | Datetime | Timestamp of the interval. |
| _insert_timestamp | Datetime | Recorded time of the entry. |
Creating correlation rules to monitor data ingestion health
In addition to the OOTB Ingestion health issues, you can build your monitoring logic for ingestion by creating correlation rules that are specific to your requirements. You can create rules that monitor the data ingestion metrics for a specific source within a specific timeframe, and trigger ingestion health issues if there is a deviation from the regular pattern of log collection.
The following examples can help you set up your own correlation rules with the data ingestion metrics:
No logs collected from a data source for 1 hour
In this example, the correlation runs every hour and calculates the number of logs that are collected for each data source over the previous hour. If no logs are collected for a data source during an aggregation period, a security issue is triggered.
Example XQL:
preset = metrics_view | comp sum(total_event_count) as total_event_count_sum by _collector_id, _collector_ip, _collector_name, _collector_type, _final_reporting_device_ip, _final_reporting_device_name, _broker_device_id, _vendor, _product | filter total_event_count_sum = 0
Additional fields to specify in the correlation rule:
| Field | Value |
|---|---|
| Time Schedule | Hourly |
| Query time frame | 1 Hour |
| Issue Suppression | Select Enable issue suppression. |
| Fields | Uncheck total_event_rate_sum, leave other fields checked. |
| Action | Select Generate issue. |
| Issue Domain | Health |
| Severity | High |
| Type | Ingestion |
| Issue Fields Mapping | Select Use preconfigured fields to map the fields that are relevant to data ingestion health. |
No logs received from a Firewall for 20 minutes
In this example, the correlation runs every 20 minutes and calculates the number of logs that are received for each firewall in a lookup dataset during the last 20 minutes. If no logs are received from a device during an aggregation period, a security issue is triggered.
Example XQL:
preset = metrics_view | join conflict_strategy = left type = inner (dataset = ngfw_device_Id_keepalive | fields _device_id) as devices devices._device_id = _device_id | comp sum(total_event_count) as total_event_count_sum by _device_id, _product,_vendor | filter total_event_count_sum = 0
Additional fields to specify in the correlation rule:
| Field | Value |
|---|---|
| Time Schedule | Every 20 minutes |
| Query time frame | 20 minutes |
| Issue Suppression | Select Enable issue suppression. |
| Fields | Uncheck total_event_rate_sum, leave other fields checked. |
| Action | Select Generate issue. |
| Issue Domain | Health |
| Severity | High |
| Type | Collection |
| Issues Fields Mapping | Select Use preconfigured fields to map the fields that are relevant to data ingestion health. |
Measuring data freshness
freshness delay value by measuring the difference between log creation at the source (_TIME) and ingestion into Cortex XSIAM (_INSERT_TIME).
Metrics are collected and calculated per data source during five-minute aggregation periods and allocated into the following buckets. The recorded freshness delay value is the top value in the range of the bucket:
- 0 to 30 seconds → 30 seconds
- 30 to 60 seconds → 60 seconds
- 60 seconds to 5 minutes → 300 seconds
- 5 minutes to 1 hour → 3,600 seconds
- 1 hour to 24 hours→ 86,400 seconds
- 24 hours to week→ 604,800 seconds
| Metric | Description |
|---|---|
| data_freshness_max_delay | <p>Maximum freshness delay value among all log entries in an aggregation period.</p><p>This reflects the worst case.</p> |
| data_freshness_median | <p>Median freshness delay value among all log entries in an aggregation period.</p><p>50% of values are smaller than the median, and 50% of values are higher or equal to the median.</p> |
| data_freshness_ninetieth_percentile | <p>Ninetieth percentile of delay values among all log entries in an aggregation period.</p><p>This delay value is 90% higher than other log entry differences. It reflects the worst case, but eliminates the spikes.</p> |
The metrics are saved to the metrics_source dataset and are also available in the metrics_view preset.
- The max_delay metric is taken from the maximum bucket value with a restricted limit; therefore, metrics show whole numbers.
- The median and ninetieth_percentile metrics are statistical calculations that give an approximation of the real value; therefore, metrics show decimal numbers.
- Time slots with a zero log count or zero byte count display records with zero values. Subsequently, the data freshness metrics will also have zero values.
- Timezone differences between
_TIMEand_INSERT_TIMEmight cause time skews with negative differences. Negative differences are rounded to zero values.
Health issues in Cortex XSIAM
For Cortex XSIAM to monitor data ingestion health and create health issues, you must enable the following settings under Configurations:
Cortex - Analytics: Go to Configurations → Cortex - Analytics. For more information, see Enable the Analytics Engine and Identity Analytics.
Cortex XSIAM provides health issues to help you monitor the health and integrity of supported Cortex XSIAM resources. Health issues provide insights into health drifts, such as failure events or status changes. The issues help you stay on top of your health-relatedhealth related errors and ensure optimal performance in Cortex XSIAM. In addition, you can set up notifications on health issues.
Health issues are associated with the Health Domain. When setting up notification forwarding or other configurations for health issues, use the filter Issue Domain = Health.
To view health issues, go to Settings → Health Issues, or on the Issues page select the Health Domain table view. Click an issue to see more details in the issue card, or right-click to take actions and investigate an issue. For more information, see Investigate and resolve health issues.
The Health Issues page displays issues that were triggered after July 2024. To see health issues that were triggered before this date, click Legacy Health Issues.
Types of health issues in Cortex XSIAM
Cortex XSIAM provides the following types of OOTB health issues:
- Ingestion issues: Triggered by interruptions in data ingestion, or deviation from the calculated ingestion baseline
- Collection issues: Triggered by connectivity errors in your collection integrations, custom collectors, and Marketplace integrations
- Correlation issues: Triggered by correlation rules that complete with an error status
- Automation issues: Triggered by system monitoring of metrics and thresholds for potential automation misconfigurations that can cause performance issues. Automation issues are processed daily to provide an aggregated status of multiple threshold crossings.
Cortex XSIAM enforces the dedup logic for health issues. This logic reduces the likelihood of identical health issues from flooding the issues dataset.
Query health issue data in Cortex XSIAM
Health issues are associated with the Health domain. To query health issue data, use the following XQL:
dataset = alerts | filter alert_domain = "DOMAIN_HEALTH"
Health issue field descriptions
The following table describes the health issue fields.
| Field | Description |
|---|---|
| Issue ID | A unique identifier that Cortex XSIAM assigns to each issue. |
| Issue Name | Name of the issue. |
| Issue Type | Type of health issue. |
| Issue Source | Source of the issue. |
| Broker VM ID | ID of the Broker VM. |
| Broker VM Name | Host name of the Broker VM. |
| Broker VM IP | IP address of the Broker VM. |
| Collector Name | Name of the collector instance. |
| Collector Type | Type of the collector. |
| Description | Text summary of the event including the issue source, issue name, and severity. |
| Device ID | Firewall device ID. |
| Excluded | Whether the issue is excluded. |
| External ID | Issue ID as recorded in the detector from which this issue was sent. |
| Final Reporting Device IP | IP of the device from which the log was extracted. |
| Final Reporting Device Name | Hostname of the device from which the log was extracted. |
| Ingestion Failure Duration | Amount of time that logs were not received or a drop in log ingestion was detected in minutes. |
| Observation Time | Time that the issue was observed in the system. |
| Playbook | Playbook that was run. |
| Playbook run status | Status of the playbook. |
| Product | Product name of the observing data source. |
| Resolution Status | Status that was assigned to this issue when it was triggered (or modified). Right-click an issue to change the status. If you set the status to Resolved, select a resolution reason. |
| Reporting Device Name | Host name of the device where the log originated. |
| Reporting Device IP | IP Address of the device where the log originated. |
| Severity | Severity level that was assigned to this issue when it was triggered (or modified). |
| Starred | Whether the issue is starred by starring configuration. |
| Vendor | Vendor of the observing data source. |
| XDR Collector ID | ID of the XDR Collector. |
| XDR Collector IP | IP address of the XDR Collector. |
| XDR Collector Name | Host name of the XDR Collector. |
Investigate and resolve health issues
The following tasks explain how to investigate and resolve health issues. You can see health issues on the following pages:
- Go to Settings → Health Issues
- Go to Cases & Issues → Issues and change the table view to Health Domain.
Investigate data ingestion errors in Cortex XSIAM
A data ingestion issue identifies disruption in the data ingestion pipeline. For example, a data source is not sending logs, or there is a significant drop in log collection compared to the calculated ingestion baseline.
- Identify the error: Type = Ingestion.
-
Right-click and select Investigate in XQL query.
The Query Builder opens and runs a prefilled query to display related data ingestion metrics entries.
-
Review the query results.
The results provide context for the issue and the events leading up to it. For more information about data ingestion metrics and setting up correlation rules with your own data ingestion logic, see Monitor data ingestion health.
-
Investigate data collector errors. Return to the Health Issues page, right-click the issue, and select Pivot to views → View collector details.
Depending on the type of collector in error, the relevant data collector settings page opens, filtered by data collector.
Investigate collection errors in Cortex XSIAM
A collection issue identifies connectivity disruption in your collection integrations, custom collectors, and Marketplace integrations.
- Identify the error: Type = Collection.
-
See the current status of the collector.
Right-click and select Pivot to views → View collector details. Depending on the type of collector in error, the relevant data collector settings page opens, filtered by data collector.
If the data collector is still in error, you can update the collector settings as required.
-
Investigate the collector error status.
Run a query on the
collection_auditingdataset to see all the connectivity changes of the collector over time, the escalation or recovery of the connectivity status, and the error, warning, and informational messages related to status changes.This example searches for status changes for the "instance1" data collector integration:
dataset = collection_auditing |filter collector_type = "STRATA_IOT" and instance = "instance1"
For more information about troubleshooting collector errors and setting up correlation rules to trigger additional collection issues, see Verify collector connectivity.
Investigate correlation errors in Cortex XSIAM
A correlation issue identifies errors in your correlation rules.
- Identify the error: Type = Correlation.
-
Right-click and select Investigate Correlation Auditing.
The Query Builder opens and runs a prefilled query to display related correlation execution records.
-
Review the query results.
Identify the correlation rule in error and take steps to resolve the error. For more information about how Cortex XSIAM identifies correlation rule errors, see Monitor correlation rules.
Investigate automation errors in Cortex XSIAM
Automation issues identify potential misconfigurations in automations, enabling you to take a proactive approach to fixing misconfiguration issues before they affect system performance.
- Identify the error: Type = Automation.
- Click the automation health issue to view the details of the related case or component.
- Based on the details of the automation health issue, review any related automations, such as playbooks and integrations, for possible misconfigurations.
Monitor data ingestion health (BETA)
Cortex XSIAM collects granular data ingestion metrics that provide an insight into the data ingestion pipeline, and identify disruptions in data collection. With these metrics you can trace data collection from a specific source, and see a breakdown by data source attributes such as Collector Name and Final Reporting Device.
You can use these metrics in Cortex Query Language (XQL) queries to investigate disruption and degradation in log collection. You can also create correlation rules that use your own data ingestion logic to trigger issues when disruption occurs for a specific data source within a specific timeframe.
In addition, Cortex XSIAM has a built-in data ingestion monitoring and issues mechanism that monitors the availability and overall health of data ingestion in your environment, and triggers ingestion health issues if disruptions occur.
BETA feature limitations in Cortex XSIAM
The data ingestion monitoring and issue mechanism is currently a BETA feature. Note the following known issues and limitations:
- Lag vs. data loss: The mechanism currently does not differentiate between data ingestion lag (delays) and actual data loss.
- Alert dispatching and case grouping: Auto-generated health issues (including but not limited to ingestion) are not currently dispatched. This means they are not automatically grouped into cases. For example, if a Broker VM disconnects, separate alerts may be triggered for each affected data source rather than being consolidated into a single case.
- Playbook automation: Because auto-generated health issues are not grouped into cases (orphan issues), they cannot automatically trigger playbook automation. In Cortex XSIAM, playbooks require a case context to run.
Related topics
Monitor Correlation rules
Cortex XSIAM audits all correlation executions in the correlations_auditing dataset. The dataset records the query initiation times, end times, retry attempts, failure reasons, and other useful metrics. You can use this dataset to monitor your correlation executions. Cortex XSIAM also provides OOTB health issues that are generated when a correlation rule completes with errors. For more information, see About health issues.
In the correlations_auditing dataset, audit entries are added as follows:
- The rule starts executing. This is audited with the status of Initiated or Initiated Manually.
- The rule completes successfully. This is audited as Completed.
- The rule completes with errors. This is audited as Error.
In the dataset, the Query start time and Query end time indicate the timeframe of the data that was queried. The actual start and end times of the correlation rule execution are recorded in the _time field for the Initiated and Completed entries.
Field descriptions for the correlations_auditing dataset in Cortex XSIAM
The following table describes the fields in the correlations_auditing dataset:
| Field | Description |
|---|---|
| _time | <p>Timestamp of the audit.</p><p>For entries with an Initiated or Initiated Manually status, this is the start time of the correlation rule execution. For entries with a Completed or Error status, this is the end time of the rule execution.</p> |
| _id | Unique identifier of the audit entry. |
| Rule ID | Unique identification number for the correlation rule. |
| Name | Correlation rule name. |
| Status | <p>The status of the correlation rule query.</p><p>Possible values are Initiated, Initiated Manually, Completed, and Error.</p> |
| Query start time | The start time of the query timeframe. |
| Query end time | The end time of the query timeframe. |
| Time frame | Time frame for the query. |
| Failure reason | For correlation rules with errors, this field displays the error message. |
| Retry attempts | Number of retry attempts before the query initiated or failed to run. |
| Schedule | Scheduled frequency to execute the correlation rule. |
| Rule creation time | Date and time that the correlation rule was created. |
| Rule modification time | Date and time that the correlation rule was last modified. |
| Description | Description of the correlation rule. |
| Severity | Defined severity of the correlation rule. |
| Dataset | Target data set, as defined in the correlation rule |
| Suppression status | Whether issue suppression is Enabled or Disabled. |
| Suppression duration | Duration for which to ignore additional events that match the issue suppression criteria. |
| Suppression fields | Fields on which the issue suppression is based. |
| Timezone | Timezone on which the scheduled frequency is based. |
| MITRE ATT&CK Tactic | MITRE ATT&CK tactic that the correlation rule attempted to generate. |
| MITRE ATT&CK Technique | MITRE ATT&CK technique that the correlation rule attempted to generate. |
| Issue category | Category of issue as configured when creating the rule. |
| Source | Source of the correlation rule. |
| XQL search | XQL query for the correlation rule. |
| Drill-down query | XQL query configured for further investigation. |
| Issue name | Name of the issue that the correlation rule will generate. |
Marketplace
Marketplace is a centralized content portal that enables you to download and manage content in Cortex XSIAM. Content is organized into content packs created by different contributors, such as Palo Alto Networks, Partners, and MSSPs, to support specific security orchestration use cases. Each content pack can include a variety of components, such as integrations, playbooks, scripts, and correlation rules.
You can view and install Marketplace content packs directly from within Cortex XSIAM or browse the full catalog at the Cortex Developer Docs for Marketplace (PAN DEV) site.
Marketplace and connectors in Cortex XSIAM
Cortex XSIAM is introducing a unified approach to third-party integrations through connectors. This shift changes how some content is discovered and managed within Marketplace, depending on your tenant onboarding date.
If your Cortex XSIAM tenant was onboarded after July 26, 2026, you may notice that some integrations listed on the Cortex Developer Docs for Marketplace (PAN DEV) site do not appear as standalone items in the Cortex XSIAM Marketplace catalog.
These integrations have been consolidated into uniquely named connectors. Instead of installing a standalone integration, you should add the vendor's connector from the Data Sources & Integrations page to access these capabilities. The connector wizard will guide you through the configuration of these services, which are now managed as sub-capabilities within the connector.
Technical documentation reference
While the new connector wizards handle all configuration steps, new tenants should still refer to the Cortex Developer Docs for Marketplace (PAN DEV) site for critical technical information not provided in the wizard, such as:
- Available commands
- Required incident fields and data schemas
- Specific sub-capability technical metadata
Existing tenants
Tenants onboarded prior to July 26, 2026, will continue to see and use standalone Marketplace integrations for services that have not yet been migrated to the connector framework for their account. These can be installed from Marketplace → Content Packs and configured on the Data Sources & Integrations page.
Cortex Marketplace
Content in Marketplace is organized into content packs to support specific security orchestration use cases. Content packs are created by Palo Alto Networks, technology partners, contributors, and customers.
In Marketplace, content includes the following:
| Content | Description |
|---|---|
| Actions | Actions wrap diverse capabilities (such as playbooks, scripts, and commands) to make them accessible and executable by an agent. |
| Classifiers | Classification determines the type of issue/indicator that is created for events ingested from a specific integration. You create a classifier and define that classifier in an integration. Mappers map the fields from your third-party integration to the fields in your issue/indicator layouts. |
| Correlation Rules | Analyzes the correlation of multiple events from multiple sources by using the Cortex XSIAM XQL-based engine for creating these correlation (scheduled) rules. Issues can then be triggered based on these rules with a defined time frame and schedule. |
| Dashboards | Dashboards consist of visualized data powered by fully customizable widgets, which enable you to analyze data from inside or outside Cortex XSIAM, in different formats such as line charts, tables, text, etc. |
| Data Model Rules | <p>Data Model rules enable you to normalize logs for out-of-the-box analytics and data enrichment. This allows you to do the following:</p><ul><li>Map 3rd-party data to a consolidated schema with predefined data types.</li><li>Enjoy auto-complete and mapping suggestions.</li><li>Map multiple datasets to one Data Model.</li></ul><p>Some content packs contain out-of-the-box default Data Model Rules.</p> |
| Indicator types and fields | Indicators are categorized by indicator type, which determines the indicator layout and fields that are displayed and which scripts are run on indicators of that type. |
| Integrations | <p>You can define the following integrations:</p><ul><li>(SOAR) Automation: Add your 3rd-party security and alert management vendors, which can then trigger events from these integrations that become issues in Cortex XSIAM. Once the issues are created, you can run playbooks on these issues to enrich them with information from other products in your system, which helps you complete the picture.</li><li>Collection (SIEM): Add integrations that collect raw events, such as logs. These integrations are separate from automation integrations so that you can add a collection integration that requires read permissions without having to add automation (read and write permissions).</li></ul> |
| Issue types and fields | <p>All issues that are ingested into Cortex XSIAM are assigned an issue type when they are classified. After you classify the issue, you can then map the relevant fields to the issue.</p><p>Issue types contain fields that are relevant to the issue type.</p> |
| Layouts and layout rules | <p>Enables you to add rules, which define the layout of issues and notifications,</p><p>When installed, the layout rules are enabled and added as Default Rules. When deleted, all related layout rules (including all Rule sections) are removed from the Default Rules tab.</p> |
| Parsing rules | <p>Enables you to add rules, which remove non-required data for analytics, hunting, or regulation, reduce data storage costs, pre-process all incoming data, etc.</p><p>When installed, the parsing rules are enabled and added as Default Rules. When deleted, all related parsing rules (including all Rule sections) are removed from the Default Rules tab.</p> |
| Playbooks | You can automate many security processes, including handling investigations and managing tickets and security responses that were previously handled manually. When an issue is ingested, the playbook runs and an issue is created. |
| Reports | Reports contain statistical data in the form of widgets (from a dashboard), which enable you to analyze data from inside or outside Cortex XSIAM, in different formats such as line charts, tables, text from information, etc. |
| Scripts | Perform specific actions and are comprised of commands, which are used in playbook tasks and when running commands in the issue War Room. |
Cortex XSIAM supports free content packs, which are either Cortex XSIAM or partner-supported content packs. You can restrict a user role from managing content packs in Marketplace when defining/editing user roles.
In Marketplace, you can browse all content packs (including installed content) or view only installed content packs.
You can search for content packs by entering text in the search bar and selecting the relevant content pack from the search results.
You can sort content packs by latest update, best match, recommended, number of downloads, and filter according to the following criteria:
- Use cases: Filter according to high-level use cases, such as Phishing, Malware, Ransomware, and Access.
- Integrations: Filter according to the integration included in the content pack.
- Categories: Filter according to content pack categories, such as Messaging, and Forensics & Malware Analysis
- Published: Filter according to whether published by Cortex XSIAM or by Cortex XSIAM technology partners.
- Content Pack Includes: Filter according to the content of the content pack, such as scripts, integrations, playbooks, and actions.
- Tags: Filter according to tags, such as Issues, Actions, Network, and Security.
- Types: Filter according to Collection or TIM.
When clicking a content pack you can view detailed information including content that it installs (such as scripts, playbooks, and integrations), dependencies (what content packs are required or optional) and version history (including whether you want to roll back to earlier versions).
You can view Marketplace content packs from within Cortex XSIAM (go to Settings → Configurations → Marketplace) or at Cortex Developer Docs Marketplace.
Content packs
Content packs are created by Palo Alto Networks, technology partners, consulting companies, MSSPs, customers, and individual contributors. Content packs may include a variety of different components, such as integrations, scripts, playbooks, and widgets, grouped together to address a specific use case. Content packs are free and can be used by all customers.
You can view Marketplace content packs from within Cortex XSIAM (go to Settings → Configurations → Marketplace) or at Cortex Developer Docs Marketplace.
Pre-installed content packs in Cortex XSIAM
Cortex XSIAM comes with a number of pre-installed content packs that cover many common uses cases. Pre-installed content packs include, but are not limited to:
-
Common Scripts, Common Widgets, Common Playbooks, Common Types, Common Reports, Common Dashboards
These content packs provide important tools and building blocks you can use to customize your playbooks and workflows in Cortex XSIAM. The Common Scripts content pack, for example, includes scripts that convert file formats, fetch indicators from a file, export context data, send emails, and more.
-
Provides integration with the popular Virus Total service to analyze suspicious files, domains, IPs and URLs to detect malware and other security breaches.
Recommended content packs
In addition, we recommend reviewing if you require the following popular content packs:
-
Create and respond to phishing issues based on user reports.
-
Cortex XDR by Palo Alto Networks
Automate Cortex XDR incident response. Includes custom Cortex XDR incident views and layouts to aid analyst investigations.
-
Manage Jira tickets directly from Cortex XSIAM, enrich them with Cortex XSIAM data, and mirror information between Jira tickets and Cortex issues.
-
Manage ServiceNow tickets directly from the Cortex XSIAM and enrich them with Cortex XSIAM data, and mirror information between ServiceNow tickets and Cortex issues.
-
Manage Palo Alto Networks Firewall and Panorama, from Cortex XSIAM.
-
A collaboration integration, such as Microsoft Teams or Slack to send messages and notifications to your team.
Note
Cortex XSIAM includes a built-in default mail sender. You also have the option of installing a different mail sender content pack, such as Microsoft Exchange Online.
Content Pack Support Types
Marketplace includes the following content pack support types:
Cortex XSIAM-Supported content packs
Applies only to content packs published by Palo Alto Networks. These content packs are supported and maintained by Palo Alto Networks according to the Palo Alto Networks End User Support Agreement.
Note
Palo Alto Networks is not liable for and does not warrant or support any content pack produced by a third-party publisher.
Palo Alto Networks does not support content packs that do not have official available documentation.
Partner-Supported content packs
Applies to content packs published by Cortex XSIAM Technology Partners. Support and maintenance is provided by the Technology Partner, whose contact information appears in the content pack details.
Cortex XSIAM Technology Partners are required to join the industry-standard support framework, TSANet, to deliver support to our mutual customers. Customers engage directly with the partner for support and maintenance of the partner-supported content pack.
Developer-Supported content packs
Applies to content packs published by third-party developers. Support and maintenance is provided by the publishing developer, whose contact information appears in the content pack details.
Customers engage directly with the publishing developer. Support and maintenance is provided voluntarily by the publishing developer. Additional information from the user community may be available at Cortex XSOAR Live Discussions.
Community-Supported content packs
Applies to content packs published by Palo Alto Networks or third-party developers. No support or maintenance is provided by the publisher for these content packs.
Palo Alto Networks ensures that these content packs are updated to use the latest and most secure Docker images through an automated process. However, functionality may not be fully tested. We recommend fully testing and reviewing Community content packs before updating production systems.
Manage content packs
You can install, delete, update, and revert content packs. Before you install a content pack, you should review the content pack to see what it includes and the various dependencies. The following is the information you can view:
- Details: General information about the content pack such as installation, content, version, author, and status.
- Content: The content to be installed, such as scripts or integrations.
- Dependencies: Details of any required content packs and optional content packs that may need to be installed with your content pack.
- Version History: View the currently installed version, earlier versions, available updates, and revert if required.
Dependencies
In Cortex XSIAM content packs, some objects are dependent on other objects. For example, an issue may be dependent on a playbook, an issue type, and an issue field. A script may be dependent on another script, or an integration. When you place a content pack in your cart, mandatory dependencies including required content packs are added automatically to ensure that the content pack installs correctly.
Optional content packs are used by the content pack you want to install, but are not necessary for installation. When you place a content pack in your cart, you can choose which optional content pack to install. When you install optional content packs, mandatory dependencies in the optional content pack are automatically included.
Note
Optional content packs that are already installed are treated like they are required content packs to preserve content integrity.
Install a content pack
You can only install one content pack at a time. Cortex XSIAM automatically adds any content that is required to install the content pack. You can also add any optional content packs that use the content pack you want to install.
If you receive an error message when you try to install a content pack, you need to fix the error before installing. If a warning message is issued, you can still download the content pack, but you should fix the problem; otherwise, the content may not work correctly.
Note
Cortex XSIAM includes a built-in default mail sender. You also have the option of installing a different mail sender content pack, such as Microsoft Exchange Online.
- Go to Settings → Configurations → Marketplace → Browse and locate the content pack you want to install.
- Click the required content pack and review the contents.
- Click Install to add the content pack to the Cart.
-
(Optional) If the content pack includes optional content, select the content packs you want to add.
The Cart displays the number of items you are installing, including any required content packs. You can log in and out, but the content packs remain in the Cart until you click either Empty cart or Install.
- Click Install.
- After installation, click Refresh content.
Note
In addition to content packs that you install from Marketplace, related content packs are automatically downloaded when you adopt playbooks or edit tasks that require content items such as scripts or integrations.
Update a content pack
Content packs are updated for bug fixes, enhancements, and more. Marketplace is updated every 2 hours and when there is an update available for a content pack, you will see a notification in the Installed Content Packs tab in Marketplace.
In the Version History tab of a content pack, you can see the currently installed version, earlier versions, and available updates. You can revert to a previous version of a content pack if required.
All dependent content packs update automatically with the content pack.
Tip
You can also find content packs that require updates by going to Settings → Data Sources & Integrations and filtering by Pack Version = Update Available. If you click on an integration in the filtered list, there is a link to the content pack in Marketplace for updates.
Note
Third-party product integrations are developed and tested against a specific product version. For products that are on-prem or cloud-based with specific API versions, the version developed and tested against will be included in the integration's documentation. Newer versions of the product are not always immediately tested, and it is expected that products maintain API compatibility upon release of newer product versions. When upgrading to a newer product version, it is highly recommended to test the integration in a dev environment before deploying to production.
Caution
If you want to downgrade, any content that depends on the content pack including any customizations may be deleted if it does not exist in the target content pack version.
- In the Show field of the Installed Content Packs tab, select Update available to display the content packs that are available to update.
- Click the content pack you want to update.
- In the Version History tab of the content pack, view the available updates.
-
Click Update. If there is more than one update available, click the version to update.
If you choose to install the latest version it includes the previous version. If you have made any customizations these are included in any update. If any dependencies require updating, these are automatically added.
- Click Install.
- After the content pack installs, click Refresh content.
Revert a content pack
You can revert to an earlier version of an installed content pack. Items that are not included in the version are also deleted, such as detached playbooks or scripts that use other scripts from the content pack. This may cause other content packs to stop working
- In the Installed Content Packs tab, click the content pack you want to revert.
- In the Version History tab, select the version to which you want to revert.
- Click Revert to this version. The version will be added to your Cart.
- In the Cart, click Downgrade.
Delete a content pack
When you delete a content pack, all content is deleted, including all detached and customized content.
Caution
If another content pack is dependent on the content pack you want to delete, it may break the other content pack. You can reinstall the content pack, but you cannot restore detached and customized content.
- Go to Settings → Configurations → Marketplace → Installed Content Packs.
- In the Content Packs Library section, search for the content pack and select the content pack you want to delete.
- Click the trash can icon.
- Review the warning message and click Delete.
Marketplace FAQs
Should Marketplace content always be updated?
Marketplace updates are a source for bug fixes and provide new commands for integrations and scripts. It’s best practice to update content packs to the newest available version. If you encounter any issue with content updates, you can revert to a previous version with one click.
When can Marketplace content be updated?
You can update content while the system is in use. If a playbook, for example, is running on an issue while you update that playbook, the original version of the playbook will continue to run without a problem. If the playbook includes an integration command that has been updated, and the update occurs before the playbook reaches this task, the new version of the integration command will be used.
When should content items be duplicated versus detached?
To edit a content item, the item must be detached or custom content. When content items are detached, they do not receive updates from Marketplace. There are two options for editing content items:
- Detach content items (such as playbooks and automations) and edit the content items. If you want to receive content updates in the future, you can reattach the content item, but the modifications you made while the item was detached will be overwritten with the content update.
- Duplicate the content item and edit the copy. When a content item is duplicated it becomes a custom content item, and therefore will not receive updates, but you can view updates to the original content item.
How does Marketplace content differ from custom content?
After Marketplace content is installed you can detach or duplicate the content and customize the content as needed. Custom content is, by definition, detached and does not receive updates.
How can content updates be rolled back? Are dependencies automatically rolled back as well?
You can view all versions of a content pack in Marketplace and revert to earlier versions there. When you revert a content pack, only the content pack is reverted, not the pack dependencies.
Content changes when upgrading Cortex XSIAM versions
Cortex XSIAM will be upgraded automatically approximately every 3 months. During the upgrade, the following core content packs may automatically upgrade to a newer version:
- Aggregated Scripts
- Atlassian Jira
- AWS
- Azure
- Base
- Common Playbooks
- Common Scripts
- Common Types
- Core
- Core Issue Fields
- Cortex Lock
- Cortex Response And Remediation
- Cortex REST API
- Filters And Transformers
- Generic Export Indicators Service
- GCP
- HelloWorld
- Image OCR
- Microsoft Teams
- MITRE ATT&CK Feed V2
- Prisma Cloud
- Rasterize
- ServiceNow
- Slack
- Threat Intelligence Management
- Unit 42 Threat Intelligence by Palo Alto Networks
- VirusTotal
- Whois
- WildFire by Palo Alto Networks
Content pack contributions
Contributions are content packs that you create for Marketplace, which are submitted to the Cortex XSIAM content development team for review and approval. After approval, these content packs are uploaded to Marketplace, and are shared and installed like any other content pack. When creating new content you want to share, such as playbooks, scripts, issue types, and integrations, or when updating content, you can create a GitHub pull request to the public content repository, to submit your content for review.
Review process
The review process consists of the Cortex XSIAM team checking that your contribution meets code, documentation, naming, and other standards. You receive a form to complete asking for more information, such as certification, contact details, etc. The Cortex XSIAM team will be in touch with you during the review process.
During the review process, you may be asked to make changes in the code, or for more data, metadata, dependencies, documentation, support, and certification model, etc. You can anonymize your name if required.
When your contribution is approved, it is uploaded to Marketplace where other Cortex XSIAM users can view, download, and rate it. We encourage you to learn more about the contribution process.
Configure the Cortex Agentic Assistant
The Cortex XSIAM Agentic Assistant helps SOC teams investigate, triage, and respond through AI agents. Agents turn security operations requests into plans and execute approved actions within each user's permissions.
How the components work together
An agent is a specialized virtual persona for a security operations domain or workflow. It selects from its assigned actions to build and run an investigation or response plan.
Actions wrap capabilities such as Cortex XSIAM playbooks, scripts, AI prompts, and commands. Add only the actions each agent needs.
Knowledge gives AI agents business-specific context and Cortex XSIAM product expertise. Knowledge sources and MCP integrations can extend an agent's context and capabilities.
Role-based access control (RBAC) defines who can use Agentic Assistant chat, manage actions, and manage agents. Agents never exceed the permissions of the user running them.
Configure your agent workforce in Cortex XSIAM
- Review Agentic Assistant components and concepts before designing an agent.
- Use the Agentic Assistant Hub to register security automation actions, build AI agents, and assign actions.
- Add knowledge sources or MCP integrations when the AI agent needs more context or capabilities.
- Configure role-based access control before giving users access.
Agentic Assistant components and concepts
The Cortex Agentic Assistant uses the following components and concepts:
| Name | Description |
|---|---|
| Actions | Actions wrap diverse capabilities (such as playbooks, scripts, and commands) to make them accessible and executable by an agent. You can use out-of-the-box system actions or register new actions. |
| Agent | <p>An agent is a virtual persona that creates and executes domain-specific plans, at your request, to assist in your day-to-day SOC operations. An agent has roles and permissions that provide guardrails. Each agent is assigned a collection of actions that it can use as part of plans.</p><p>The agent chooses the most relevant actions to fulfill a user's request. Agents process user requests, create plans, and orchestrate actions based on their goals and permissions (RBAC and SBAC).</p><p>You can use the following types of agents:</p><ul><li>System agents that are provided for specific use cases.</li><li>Custom agents that users have created.</li></ul><p>Some agents provide relevant chat conversation starters under the chat prompt. For examples of conversation starters, see Agentic Assistant use cases.</p><div data-gb-custom-block data-tag="hint" data-style="info" class="hint hint-info"><p>Note</p><p>Agents are bound by the same rules and robust permissions as a human user. In addition, you can mark actions that make real-world changes in production systems as sensitive, requiring a quick manual review and confirmation, ensuring peace of mind before critical system changes are made.</p></div> |
| Plan | A sequence of actions that run in parallel or sequentially to satisfy a user request. The agent dynamically chooses relevant actions to resolve the prompt. |
| Conversation | A sequence of user requests that maintains context across interactions. |
| Knowledge | In the Knowledge Center, you can ground AI agents in your organization's business-specific source of truth by managing internal knowledge sources. You can also leverage built-in Cortex (system) knowledge to provide agents with deep product expertise and technical platform logic. This enables agents to act as context-aware extensions of your team that understand both your internal workflows and the underlying platform. |
| Request | A user request from the agent with an end goal, triggering a plan. |
Agentic Assistant Hub
You can interact with agents in the Agentic Assistant chat to automate case and issue investigation and response. Agents create and execute plans, which are sequences of actions (such as playbooks, scripts, and commands) designed to fulfill your requests.
Actions and agents are managed in the Agentic Assistant Hub. You can access the Agentic Assistant Hub from the main navigation or from within the chat by expanding the Agentic Assistant menu.
To manage agents in the Agentic Assistant Hub, you must have the proper permissions. For more information, see Agentic Assistant role-based access control.
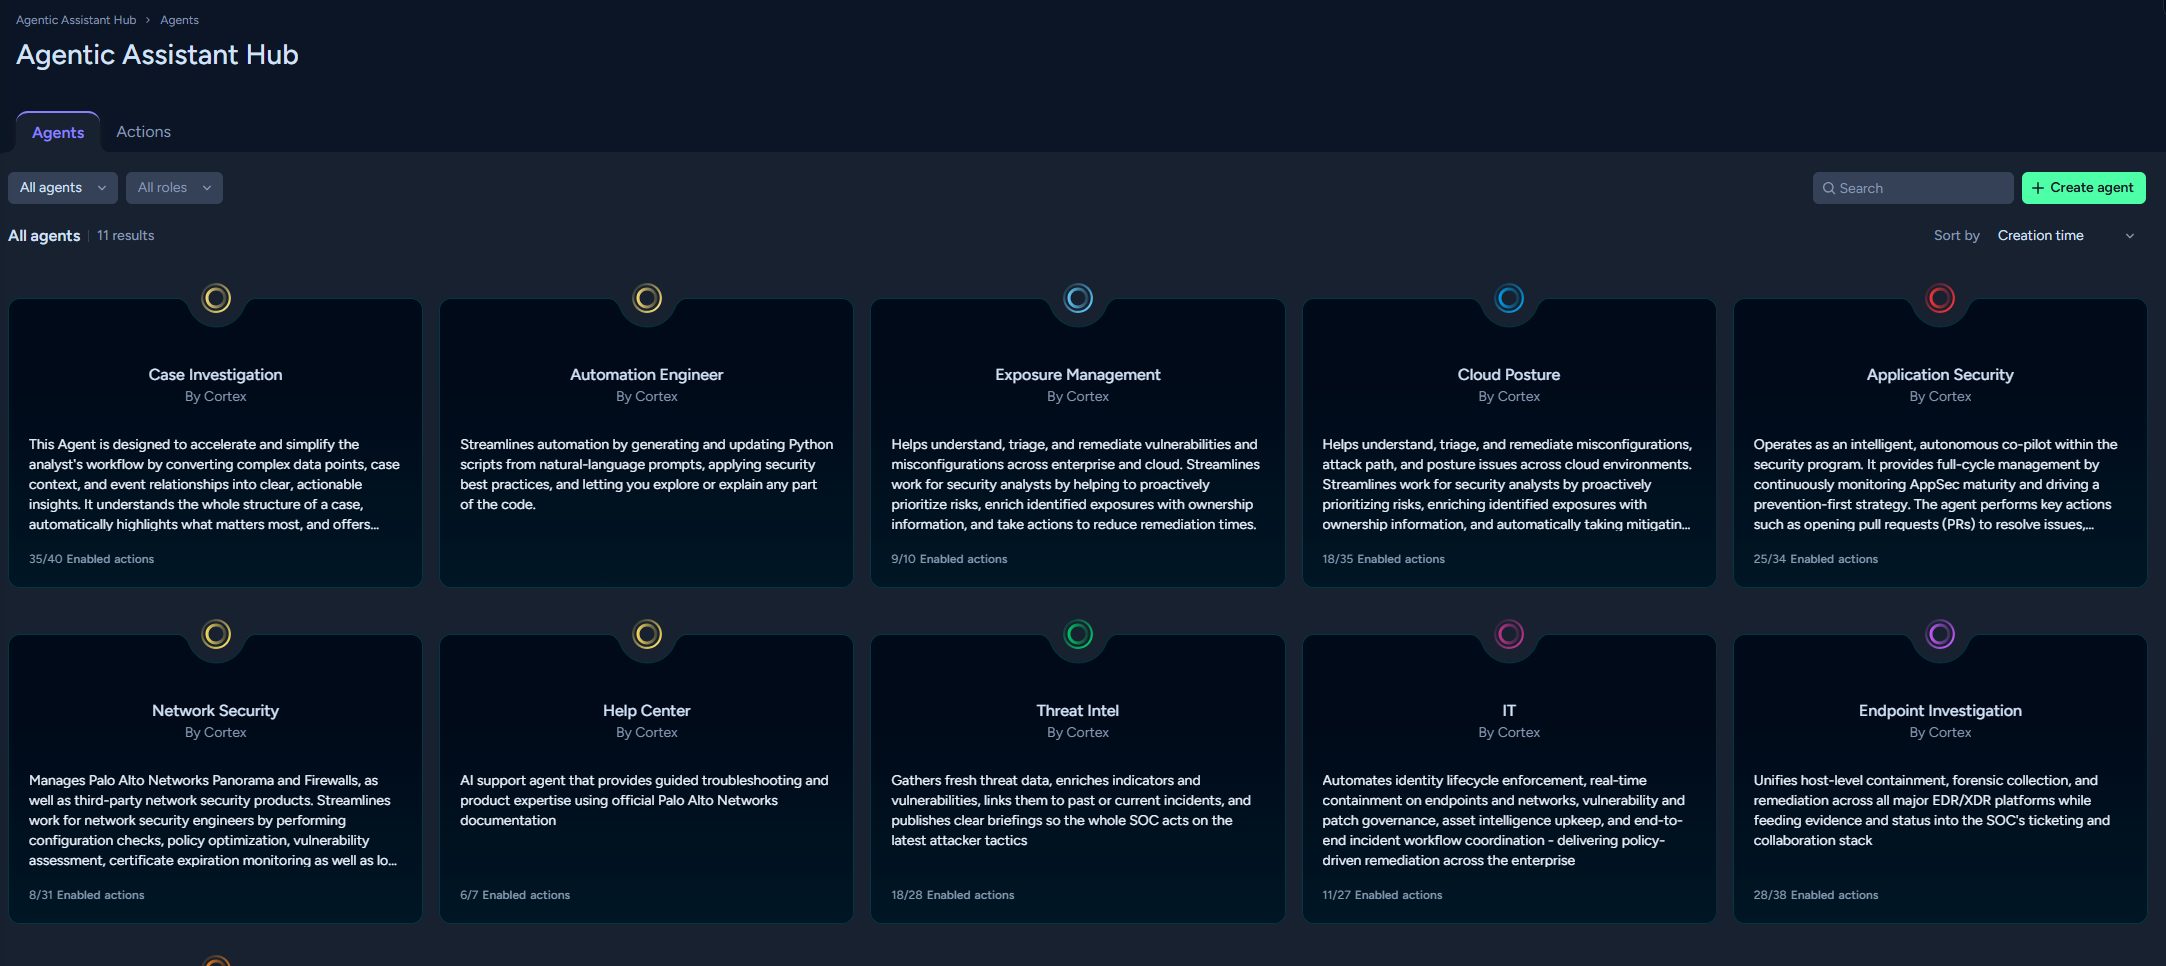
The Agentic Assistant Hub includes the following components:
-
Actions
Actions wrap diverse content items (such as playbooks, scripts, AI prompts, and commands) to make them accessible and executable by an agent. Cortex XSIAM provides system actions, and you can also create your own actions. Custom actions can be created from scripts, commands, and AI prompts.
You can register new actions through the Agentic Assistant Hub or from the Scripts or AI Prompts page. Actions can include functionality such as sending emails, extracting data, enriching information, or opening support cases. Multiple actions can be created from a single script, command, or AI prompt, if needed. An action can be added to multiple agents.
-
Agents
An agent is a virtual persona that creates and executes domain-specific plans, at your request, to assist in your day-to-day SOC operations. An agent has roles and permissions that provide guardrails. Each agent is assigned a collection of actions that it can use as part of plans.
The agent chooses the most relevant actions to fulfill a user's request. Agents process user requests, create plans, and orchestrate actions based on the user's goals and permissions (RBAC and SBAC).
Cortex XSIAM provides system agents, and you can also create custom agents. In the Agentic Assistant chat, you can select any system agent, any agent you created, or any public agent.
Agents can only use actions that have been assigned to them, and execution is limited to the user's existing permissions.
-
From the Agents tab of the Agentic Assistant Hub, you can hover over any agent card to see the View option. Click View to see all the actions assigned to the agent and their status.
In the Agentic Assistant Hub, you can do the following:
- Register scripts, commands, and AI prompts as custom actions. After a script, command, or AI prompt is registered as a custom action, it can be assigned to agents and used in plans. For more information, see Manage actions.
- View system and edit custom actions.
- Build agents and assign actions to agents.
- Enable and disable system agents and provide specific instructions. System agents have access to system actions that are assigned to the agent.
- Start a chat with any agent by clicking the more options icon on the agent card and clicking Start chat.
Manage actions
Actions wrap diverse capabilities (such as playbooks, scripts, AI prompts, and commands) to make them accessible and executable by an agent. You can use out-of-the-box system actions or register new actions.
To manage actions in the Agentic Assistant Hub, you must have the correct permissions. For more information, see Agentic Assistant role-based access control.
There are two types of actions in the Agentic Assistant Hub:
-
System actions: Cortex XSIAM contains more than 50 out-of-the-box system actions that can be disabled or enabled, but cannot be edited or deleted.
To find and install additional content packs that include actions, go to Marketplace and select Content pack includes and Actions.
System actions may rely on content packs that need to be installed and configured.
-
Custom actions: Users can register existing or new scripts, commands, and AI prompts as actions. Custom actions can be edited, deleted, enabled, or disabled.
Any action marked as sensitive to require user approval requires explicit user approval before execution. This is particularly crucial for operations that might alter system reality or affect an organization’s budget, such as isolating an endpoint or revoking user access. System actions are marked sensitive if they affect system reality. When creating custom actions, you decide which actions should be marked as sensitive for your organization.
The execution of system or custom actions that are based on integration commands can be restricted using integration permissions.
Manage existing actions
From the Actions tab of the Agentic Assistant Hub, click  for an action to edit, delete, or disable an existing custom action. System actions can be enabled or disabled, and you can change them from sensitive to non-sensitive or from non-sensitive to sensitive.
Search, filter, and sort actions
You can use the dropdown filter to search all actions, custom actions, system actions, enabled actions, disabled actions, sensitive actions, or non-sensitive actions. You can also filter by source types: command, script, or playbook.
You can sort actions by creation time or update time.
Register actions
You can register scripts, commands, and AI prompts as actions in the Agentic Assistant Hub. After a script, command, or AI prompt is registered as an action, it can be added to one or more agents. The agents can then execute the action as part of plans.
To register actions, ensure you have the correct permissions. For more information, see Agentic Assistant role-based access control.
When you register an action, you provide a description, goal, and, optionally, a few-shot examples. This information helps agents understand how the action should be used.
When registering or editing an action, you can choose which specific inputs and outputs are visible to the LLM. For example, a script might have two inputs and five outputs, but for this action, only one input and two outputs are required, and only those are included in the action. This helps to create more focused actions and reduces unnecessary complexity.
A single content item can be registered as different actions, with each action using different inputs and outputs from the same script. Only register the same script, command, or AI prompt as a new action if it is required for your use case, as providing an agent with many actions with overlapping abilities can reduce the ability of the agent to choose the most appropriate action.
While you can create multiple actions from a single content item, each action must have a different name.
If you try to register a script, command, or AI prompt that is already registered, you are presented with a list of the actions already using it, and you can review and decide if any of them are relevant for your current use case. If not, you can register the script, command, or AI prompt again as a different action.
How to register an action
Do one of the following:
- Click the Agentic Assistant icon in the upper right hand corner and expand the side panel
 to access the Agentic Assistant Hub menu item. From the Actions tab of the Agentic Assistant Hub, click Register new action.
 - Within the script creation or editing screen, click when viewing or editing a script and select Register as action.
- Within the AI Prompts library, select a prompt and click the more options icon to Register as action.
If you clicked Register as action from the Scripts or AI Prompts page, the name is prepopulated in the Content chosen field. If you clicked Register action from the Agentic Assistant Hub, select script, command, or AI prompt for the Type of content and select the content you want to register.
Enter an action Name, a short description of what the action does. Example: Extract email.
Describe the Goal of the action.
(Optional) By default, Mark action as sensitive to require user approval is selected, and the agent prompts the user to approve before executing the action. If you do not want the action marked as sensitive, clear the checkbox.
(Optional) Provide Few-shot examples to help the agent understand the context and the appropriate situations to invoke a specific action.
Click Next.
Choose your Action Parameters:
Mandatory arguments cannot be deselected.
- Choose which arguments and inputs to include in the action. If a content item contains descriptions of the inputs, the descriptions are prepopulated. If not, you can provide short descriptions. The descriptions help the agent understand the purpose of each input.
- (Optional) Enter a default value for each input. The default value is used when the user does not specify the input.
- Choose which script outputs to include in the action. If the content item contains descriptions of the outputs, the descriptions are prepopulated. If not, you can provide short descriptions. The descriptions help the agent understand the purpose of each output.
Save changes.
The execution of system or custom actions that are based on integration commands can be restricted using integration permissions.
Manage agents
Agents create and execute step-by-step plans dynamically, choosing relevant actions based on a user's request. Each agent has a model, a user context, a conversation context, and a set of actions that it can perform. Users engage with agents through conversations in the chat interface.
Agents can only use actions that have been assigned to them, and execution is limited by the user's permissions.
Permissions for the Agentic Assistant and the Agentic Assistant Hub can be found under CORTEX AGENTIC ASSISTANT in the role permissions when creating or edit a role. For more information, see Agentic Assistant role-based access control
There are two types of agents in the Cortex Agentic Assistant:
- Custom agents: Each user can create one or more agents that have the same or fewer permissions as the user, ensuring agents operate with the least necessary privileges required. These permissions automatically update if the user’s roles or permissions change. When users create custom agents, they can create a private agent only they can access, or a public agent all users can access.
-
System agents: System agents come out-of-the-box and are not linked to a specific user; instead, they possess their own defined roles and permissions. A system agent may include actions that the user does not have permission to execute. All users have access to all system agents, but plan execution is limited by the permissions of the individual user.
System agents can include actions that require additional content packs to be installed and configured. To view all actions assigned to a system agent, including actions not available due to missing content, click on the system agent in the Agentic Assistant Hub. There may be actions assigned to a system agent that are not relevant to your organization. For example, the Case Investigation agent includes the action ServiceNow - Create Ticket, but you would only install and configure the relevant content pack if you wanted to create tickets in ServiceNow.
System agents include system actions that may be marked as sensitive and require manual approval to execute. You can change this setting for specific system actions from the the Actions tab of the Agentic Assistant Hub, by clicking
in the action card and selecting Mark as sensitive or Mark as non-sensitive.
Agent management for the Cortex XSIAM Agentic Assistant
You can edit, delete, disable, or enable custom agents by clicking the more options icon for the agent.
You can edit, enable, or disable system agents by clicking the more options for the agent. The edit option for system agents is limited to adding specific instructions for the agent such as tone, style, format, and priorities.
You can click on an Agent to view all actions assigned to the agent. There are three possible statuses for actions assigned to an agent:
- Enabled (green circle with a check mark): The action is enabled and available for the agent to use.
- Disabled (grey circle with an x): The action has been disabled and is not available for the agent to use.
-
Unavailable content (grey circle with a horizontal line): The content the action is based on is not available. To use the action, the content item must be installed and configured.
In some cases, an agent may include actions with content items that are not relevant for all licenses. If that occurs, the grey circle appears, but you are not able to install the related content.
Search, filter, and sort existing agents for the Cortex XSIAM Agentic Assistant
You can use the dropdown filter to search all agents, custom agents, enabled agents, or disabled agents.
You can sort agents by most used, creation time, or update time.
Build agents
You can build custom agents to execute plans and assist in investigations. Custom agents have the same or fewer permissions as the user who creates them. For example, you might want to create an agent with all of your permissions to use for certain investigations, but also create a read-only agent that provides you with information, but does not execute actions on real-world systems. You can create custom agents that are private or that are shared for all users.
When you build an agent, it should contain all actions that you require for your workflow. Agents are self-contained and cannot communicate with other agents or access actions that are not assigned to the agent.
NOTE
To build agents in the Agentic Assistant Hub, you must have view/edit permissions. For more information, see Agentic Assistant role-based access control.
- Click the Agentic Assistant Hub menu item.
- From the Agents tab of the Agentic Assistant Hub, click Create agent.
-
Complete the following agent detail fields:
Field Description Required Agent Name A short description name for the agent. Each agent must have a different name. Yes Color The color for the icon that appears in the agent list. No Description A description of the agent's purpose or area. Yes Specific Instructions <p>Provide the agent with detailed customized instructions. You can include a wide range of directives, from describing the agent's role and preferred terminology to step-by-step processes and structure of the output.</p><ul><li><p>Role: What the agent is supposed to be or act as. Defines its identity and primary function.</p><p>Example A: SOC tier 1 analyst. As a tier 1 analyst you are responsible for triaging alerts and concluding if an alert is a true or false positive.</p><p>Example B: Incident response analyst. As an incident response analyst you are responsible for investigating and conducting forensics of relevant artifacts related to an incident. You provide conclusions about the incident and TTP's used by the threat actor.</p></li><li><p>Instructions: The specific rules and behavioral guidelines that tell the agent how to operate and respond.</p><p>Example: Follow the NIST framework, provide clear and concise recommendations, use critical thinking when conducting analysis.</p></li><li><p>Structure: How the agent should format and organize its responses.</p><p>Examples of possible formats: JSON, Markdown, Array, enum.</p></li></ul> No Agent access Choose whether to make the agent a Public Agent. Public agents can be accessed by all users with View/Edit permissions to Interact with Agents. By default, custom agents are only available for the users who created them. No Enrich Knowledge Connect the agent to specific knowledge bases, document repositories, or Cortex (system) knowledge to provide context-aware responses based on your organization's internal data and system intelligence. No Conversation starters Include up to four prompts that appear under the prompt bar when the user interacts with the agent. Conversation starters help users understand what the agent can do and how to initiate a request. No - Click Next to proceed to the Access Control page.
-
Define which roles and actions the agent can access. To save an agent, there must be at least one role or action selected.
NOTE
If you clear the checkbox for a role, all actions associated with that role are also cleared. The exception is if another role is also selected, which is associated with the same actions.
If you clear the checkbox for an action, all roles associated with that action are cleared. For example, if you select the Investigator role, and Send Mail and Tavily Extract are both actions associated with that role, clearing the check box for Investigator also clears the check box for Send Mail and Tavily Extract. If you then reselect the Send Mail action, the Investigator role is not automatically selected.
Not all actions are associated with a role.
For an agent to be able to run XQL queries, you must add the Cortex - Run XQL Query action. This action is included by default for all system agents.
- If needed, register one or more new actions by clicking New Action and following the steps in Manage actions.
- Save Agent.
Manage knowledge sources (preview)
The Knowledge Center (preview) in the Agentic Assistant Hub enables AI agents to act as personalized extensions of your team instead of relying on general information, delivering more precise and grounded results during investigation and analysis.
Note:
The Knowledge Center preview feature is not enabled by default. To request access, contact Cortex Product Management.
You can ground your agents with two kinds of knowledge sources:
- Organizational-specific (custom) knowledge: Internal documentation unique to your organization. For example:
- Standard Operating Procedures (SOPs).
- Corporate policy documents and cybersecurity frameworks.
- Historical case context and analyst notes.
- Cortex (system) knowledge: Built-in product expertise provided by Palo Alto Networks. For example, intrinsic knowledge of Cortex security entities (cases, issues, findings, and assets).
Transparency
The platform ensures transparency for AI decision-making through the following mechanisms:
- Auditing: For full visibility, all knowledge source management activities, including uploads, deletions, and enable/disable sources and agent connections to those are logged in the management audit dataset. If knowledge is used, the name of the knowledge source is included in the audit log.
- Grounding visibility: The Agentic Assistant provides visibility into its grounding by including short source labels or citations within responses to indicate exactly which knowledge was applied.
- In the Agents tab, you can verify knowledge source connections for a specific agent by hovering over the agent card and clicking View. Hover over Knowledge sources to open a dropdown displaying all sources connected to that specific agent. DOCX sources can be previewed by download.
Manage knowledge sources
In the Knowledge Center, you can:
- Monitor capacity: The top right corner of the Knowledge Center displays your tenant's overall Source limit alongside a percentage indicator of your current storage usage, helping you track your available knowledge capacity. The Learning sources table also indicates the specific size and storage usage percentage of each individual source.
- Manage a source: You can right-click directly on a source in the table to view a Preview modal and inspect its text content, creation date, and author. You can also Edit, Enable/Disable, or Remove it. Disabled sources remain in the list but show a Disabled status.
- Check source status: Newly added sources appear in the Knowledge Center immediately but will display a Learning status while the system ingests and indexes the content. Once successfully indexed, the status changes to Connected. If an issue occurs, the status will show as Error.
Note:
To manage knowledge sources, you must have view/edit permissions. For more information, see Agentic Assistant role-based access control.
Add a knowledge source
You can add a knowledge source by uploading a file, linking to external documents, or attaching system knowledge.
Tip:
File formats can be MD, JSON, JSONL, CSV, DOC, or DOCX.
File size can be up to 5MB.
- In the Agentic Assistant Hub > Knowledge Center tab, click + New Source.
-
Select a source type, File or Link.\
Upload a file- Drag and drop or browse to upload a supported text file.\
The Source name is by default the file name. You can change it. - In the Shared agents dropdown, select one or more agents.\
You can also select all agents. Any later-created agents are included automatically. - Click Add source.
Add a link
- In the Data source dropdown, select an internal knowledge source, for example Atlassian Confluence Cloud or Google Drive.
- In the Instance dropdown, select the integration instance for the data source.
- If you select Atlassian Confluence, enter the Page URL, the URL of the Confluence page to retrieve content from.
- If you select Google Drive, enter the Google Drive file URL. The file must be shared with the logged in user’s email.\
The Source name is by default the knowledge source you are linking to. You can change it.
- In the Shared agents dropdown, Select one or more (or all) agents to apply the knowledge source to. If you select all, any subsequently created agents will automatically be included.
- Toggle Auto sync to automatically sync with the knowledge source integration instance once every 24 hours.
- Click Add source.
- Drag and drop or browse to upload a supported text file.\
Expand agent capabilities with MCP integrations
Cortex Agentic Assistant supports native interaction with external environments via the Model Context Protocol (MCP). Agentic Assistant agents can use tools from third-party MCP servers to retrieve data and perform tasks in external systems. For example, an agent can open a Jira issue or check GitHub to see if security scans in a workflow are being bypassed..
The Cortex Agentic Assistant connects to external MCP servers using streamable HTTP and supports both OAuth-based and Authless servers. The MCP server must be accessible via a URL. To communicate with third-party MCP servers, you install the relevant content pack from Marketplace and configure an integration instance. The integration connects to the third-party MCP server to discover available tools and automatically generate agentic actions.
For agentic actions to be created from tools on an MCP server, the tools must have input and output descriptions on the MCP server. These descriptions are required for Cortex XSIAM to understand the tools' capabilities and the correct use cases.
MCP integrations
To find MCP content packs, go to Settings → Marketplace and under Types filter for MCP. Examples of MCP content packs include Cloudflare MCP, GitHub MCP, and Atlassian Cloud MCP. You can also use the Generic MCP content pack to connect to MCP servers that do not have their own specific content pack. Each MCP integration includes instructions for providing the required parameters, such as the URL and authentication details.
You can create multiple integration instances for each MCP integration. For example, you might configure one instance of the GitHubMCP integration to connect to a environment with read tools and another instance to connect to an environment with both read and write tools. In addition, the GenericMCP integration can be used to connect to multiple MCP servers, each with a separate integration instance.
When you Test the integration instance, Cortex XSIAM verifies server connectivity.
If you are using OAuth-based authentication, the Test button returns an error containing the command to run in the playground in order to test the connection.
All configured MCP integration instances can be viewed in the Settings → Data Sources & Integrations page. You can view each integration instance and verify the status of the connection, Test the connection, enable or disable the integration instance, and view the last discovery timestamp.
MCP tool actions
The integration instance checks hourly for new or changed tools exposed by the third-party MCP server. The same checks are also performed every time an integration instance is saved. All discovered tools are automatically registered as AI actions, with the type MCP Tool. Actions are created once per MCP integration instance. If you have multiple integration instances for the same MCP server, multiple actions are created for the same tools. The server name, the tool name, and the name of the integration instance are all included in the name of the action. Actions created through tool discovery are system actions. The actions cannot be edited, but you can enable and disable them and also select or clear the checkbox to mark the action as a sensitive action that requires manual approval. By default, all actions registered from MCP servers are marked as sensitive.
- If an MCP tool is removed from the MCP server, the action will be unavailable due to missing content. If the tool is restored on the MCP server, the action is automatically reenabled.
- If you have a development and a production tenant, you can push actions created from MCP tools from development to production.
Agents and permissions
To use MCP tool actions, they must be added to custom agents in the Agentic Assistant Hub. By default, all users with access to the custom agent can use all of the available tools. To restrict access to MCP tools, go to Settings → Configurations → Data Collection → Integration Permissions. You can restrict access for MCP integration instance commands to one or more roles. If you restrict access, only users in the permitted roles can use these actions.
Agentic Assistant role-based access control
Instance and Account admins have full control over the permissions and access that users have to the Cortex Agentic Assistant. Cortex XSIAM uses role-based access control (RBAC) to manage access to the chat, as well as access to view, create, edit, delete, disable, and enable Agents and Actions in the Agentic Assistant Hub.
By default, Instance and Account admins have full view/edit permissions enabled. When editing or creating other roles, in the Cortex Agentic Assistant → Agents section, you can select the following:
| Permission | Description |
|---|---|
| View/Edit | <p>When selected (and nothing else is checked in this section), the user role can only see actions and public agents in the Agentic Assistant Hub, but cannot interact with agents.</p><p>You can also select the following permissions:</p><ul><li><p>Interact with agents: Users can:</p><ul><li>Trigger Agents in the Cortex Agentic Assistant.</li><li>Access their own agents, public agents, and system agents.</li><li>Manage script development using the Automation Engineer agent.</li><li>Manage playbook development using the Automation Engineer agent (preview).</li></ul></li><li>Manage actions: Users can view, create, update, and delete actions.</li><li>Manage agents: Users can view, create, update, and delete their own custom agents.</li><li><p>Agents admin: Users can:</p><ul><li>View, create, update, and delete all actions and agents.</li><li>Enable or disable system actions and agents.</li><li>Attach system knowledge to custom agents and view all documents uploaded within the Knowledge Center (preview).</li></ul></li></ul> |
| View | N/A |
| None | The user role does not see any agents and can’t use the chat. The Agentic Assistant Hub is not visible to the user. Cortex Agentic Assistant is only available for navigation and insights. |
Agents are limited by the individual permissions of the user. For example, if users do not have sufficient permissions to isolate an endpoint, they cannot use an agent to isolate an endpoint.
The execution of system or custom actions that are based on integration commands can be restricted to specific roles using integration permissions.
Cortex MCP server
The Cortex MCP Server connects your LLM applications to your Cortex tenant. It uses the Model Context Protocol (MCP), a standard for connecting AI models with applications and tools. Use natural language to investigate and manage your Cortex data.
Key capabilities
-
Investigate
Use the built-in tools to manage cases and issues, and conduct investigations.
-
Customize
Create, customize, and fine-tune tools to fit specific use cases and workflows.
-
Flexible client
The Cortex MCP Server is provided as a downloadable file that can be installed on a local machine or a container. While these instructions use Claude Desktop as the MCP client, you can use any client that supports MCP. More detailed setup instructions are provided in the README file included in the download.
The Cortex MCP Server empowers you to integrate AI into your security workflows using natural language. When using LLM-based suggestions, always review and approve actions suggested by the AI before they're executed. We recommend deploying the Cortex MCP server in a secure environment where access is limited to authorized users.
To install, configure, and use the Cortex MCP server:
Install the Cortex MCP server
With the Cortex MCP Server, you can use natural language in your MCP client to investigate and manage cases and issues. The MCP Server can be run within a Docker container or a Poetry virtual environment.
This documentation contains instructions for configuring and using the Cortex MCP server. More detailed setup instructions are provided in the README file included in the download.
These instructions use Claude Desktop, but you can use any client that supports MCP.
Prerequisite
If you plan to run the Cortex MCP server in a Poetry virtual environment, you must have Python 3.13 or higher.
If you plan to run the Cortex MCP server in a Docker container, you must have Docker installed.
Download the Cortex MCP server
- Go to Settings → Configurations → Integrations → Cortex MCP Server.
- Download MCP File
- (Optional) Download the checksum file and run a command such as
shasum(Linux/macOS) orcertutil(Windows) to verify the integrity and the file authenticity. For example:shasum -a 256 -c cortex-checksum.zip.sha256. - Extract the .zip file.
- From the Cortex MCP Server page in Cortex XSIAM, click the link to open the page to create a new API key.
Create an API key
The MCP Server uses public APIs to communicate and is limited by the license quotas available in your tenant. This is particularly relevant when running XQL queries. For more information on running XQL query APIs, see Run XQL query APIs.
-
Either click the link from the Cortex MCP Server page or navigate to Settings → Configurations → Integrations → API Keys → New Key.
If you click the link from the Cortex MCP Server page, the Standard security level is selected, the Viewer role is prepopulated, and an expiration date is enabled. If you navigate directly to the API Keys page, configure the API key as described below.
- In the Role tab, perform the following:
- Under Security Level, select Standard.
-
Under Role, select the desired access level for this key. You can select from predefined roles or custom roles. Roles are available according to what was defined in either the Cortex Gateway or the tenant's Access Management. You can view the configuration of the role selected by expanding the sections under Components.
It is critical to avoid assigning excessive permissions when creating an API key for the Cortex MCP Server. Since the key has both read and write capabilities, overly broad permissions can lead to unintended actions and potentially compromise your environment. Ensure the key follows the principle of least privilege and is granted only the minimum required access.
- (Optional) Under Comment, provide a comment that describes the purpose of the API key.
- (Optional) If you want to define a time limit on the API key authentication, select Enable Expiration Date, and select the expiration date and time. You can track the expiration date of each API key in the API Keys page. In addition, an API Key Expiration notification appears in the Notification Center one week and one day before the defined expiration date.
- (Optional) If Scope-Based Access Control (SBAC) is enabled for the tenant, click Scope, and under Scope Definition, select the scope areas that you want to limit the user role to access for this API.
- Click Generate to generate the API key.
-
Copy the generated API key and click Done.
To configure the Cortex MCP Server, you need the Cortex API URL, Cortex API key, and Cortex API key ID. You will not be able to view the API key again after you complete this step. Ensure that you copy the API key before closing the notification.
Install and run the Cortex MCP Server
By default, stdio (standard input/output) is used. You can also configure Streamable HTTP to send requests directly to the tenant instead of through the MCP client. Streamable HTTP can be useful for testing in the browser without an MCP client and to bypass limits that may be in place for your MCP client. For Docker, you can include the Streamable HTTP variables in the .env file. You can also include it as a flag when you start the server in the Python virtual environment.
In the extracted files, follow the detailed instructions in the README.md file located in the top directory. Instructions are provided for both Docker and Poetry and include the following:
Docker
-
Create an .env file with the environment variables.
When using Docker, we recommend using an .env file to set the Cortex API credentials as environment variables. While the credentials can be provided in the MCP client configuration settings, the .env file provides safer handling of API credentials and makes your configuration easily reproducible.
- Build and run the Docker container.
- Run the Docker container:
docker run --env-file .env -it cortex-mcp.
Poetry
- Install Poetry.
- Create and activate a virtual environment.
- Install project dependencies.
- Provide the required variables in the Python runtime environment.
-
Start the server:
python src/main.py.When using the Poetry virtual environment, you can also start the server using the CLI command
python src/cli.py start [OPTIONS, where [OPTIONS] includes the API key id, API key, the Cortex PAPI server URL, and the log level.
Use Cortex MCP Server CLI commands
From the CLI, you can run three commands.
start: Start the Cortex MCP server. Relevant only for the Poetry virtual environment.update: Any new or updated components provided by Cortex are automatically downloaded into the builtin_components folder. During each update, the folder is fully replaced, and all existing contents are recreated. Do not add custom tools to this directory, as it is managed entirely by Cortex and is overwritten at every update.version: Displays the current version of the Cortex MCP Server.
Additional information about the CLI is available in the README file located in the src directory.
Configure the MCP client
After you have downloaded and installed the Cortex MCP server, you need to configure your local MCP client to communicate with the Cortex MCP server. The instructions below use Claude Desktop, but any MCP client can be used.
-
In the Claude Desktop app, navigate to Settings → Developer → Edit Config. The configuration file opens in your default text editor.
For reference, the file is located at:
- macOS:
~/Library/Application Support/Claude/claude_desktop_config.json - Windows:
%APPDATA%\Claude\claude_desktop_config.json
- macOS:
-
Add the
mcpServersconfiguration to the file. The examples below are provided for container (Docker) and local client (Poetry virtual environment). The exact details of yourmcpServersconfiguration depend on your specific installation.Docker Container
{ "mcpServers": { "Cortex MCP Server": { "command": "docker", "args": [ "run", "--env-file", "/path/to/.env", "-i", "--rm", "cortex-mcp" ] } } }
Poetry virtual environment
{ "mcpServers": { "Cortex MCP Server": { "command": "python", "args": [ "/path/to/cortex-mcp/src/main.py" ], "env": { "CORTEX_MCP_PAPI_URL": "https://api.cortex.example.com", "CORTEX_MCP_PAPI_AUTH_HEADER": "<your_api_key>", "CORTEX_MCP_PAPI_AUTH_ID": "<your_api_key_id", "MCP_TRANSPORT": "stdio/streamable-http" } } } }
- Save the changes to the configuration file and restart Claude Desktop for the changes to take effect.
- Verify the connection to the Cortex MCP server. You should see the Cortex MCP server running in the Developer settings and a hammer icon may appear in the input box, indicating the MCP tools are available.
Use the Cortex MCP server
The Cortex MCP server provides built-in tools to manage cases and issues and conduct investigations.
Built-in tools include, but are not limited to:
- get_assets: Fetch all assets, or a filtered subset of assets, based on criteria such as category, region, or provider.
- get_assets_by_id: Fetch detailed information about the asset specified by the asset ID.
- get_cases: Fetch all cases, or a filtered subset of cases matching specific criteria such as domain, status, severity, or a specific case ID.
- get_issues: Fetch all issues, or a filtered subset of issues matching specific criteria such as domain, severity, detection method, or specific issue ID.
- get_assessment_profile_results: Fetch the results of all or filtered compliance assessments from the Cortex platform.
- get_filtered_endpoints: Fetch a filtered list of endpoints managed by the XDR agents based on their status, XDR agent status, and other filters.
When you run the update command in the Cortex MCP server, new or updated tools provided by Cortex are automatically downloaded.
You also have the flexibility to create and customize your own tools to fit specific use cases and workflows. For more information, see Create custom Cortex MCP server tools.
Cortex MCP Server use case examples
The built-in tools retrieve information, but do not write to the tenant. You can create your own tools that include write actions. The examples below include both.
- Show me the top ten most critical cases and create a graphical representation for my manager to review.
- Give me the details for case ID 12345 and create a visual timeline.
- Isolate endpoint WIN-123 because it may be compromised.
- Retrieve full details for endpoint XXXX.
- Add a note to case 12345 saying, ‘Escalated to Tier 2 for further investigation.
Create custom Cortex MCP server tools
You can build your own tools using OpenAPI or Python to manage cases, handle issues, and conduct investigations. More detailed information can be found in the README file located in the src/usecase directory. Tools are based on Cortex API endpoints.
To view the Cortex XSIAM API documentation, see Cortex XSIAM APIs.
Any new or updated components provided by Cortex are automatically downloaded into the builtin_components folder. During each update, the folder is fully replaced and all existing contents are recreated. Do not add custom tools to this directory, as it is managed entirely by Cortex and is overwritten at every update.
Create custom Cortex MCP server tools with OpenAPI
You can create an OpenAPI specification for a specific API endpoint.
- Create a YAML file in the
/custom_components/openapidirectory with the name of the MCP component. For example:custom_cortex_component.yaml. - Base your custom OpenAPI component on the Cortex API documentation structure for a specific endpoint. We recommend viewing the built-in tools, located at
/builtin_components/openapi, as a reference. - After you define the OpenAPI specification, the Cortex MCP server collects it automatically, and it is ready for use.
- Test your new MCP component by running the Cortex MCP server and writing a prompt that uses your new component.
Create custom Cortex MCP server tools with Python
We recommend using Python for more complex MCP components that require custom logic. MCP components in Python are defined in a module.
- Create a new Python file in the
/custom_componentsdirectory. - Define a class that inherits from the
BaseModuleclass with the required methods. We recommend viewing the built-in modules, located at/builtin_components, as a reference. - After you define a class, the Cortex MCP server collects it automatically and it is ready for use.
- Test your new MCP component by adding an end-to-end test in the
tests/e2edirectory, or run the MCP server and write a prompt that uses your new component.
Automations
Automations leverage playbooks, Quick Actions, and agents to execute predefined workflows, use context data to make informed decisions, and interact with lists to store and retrieve information as needed during the automation process.
Automation in Cortex XSIAM
Automation enables you to improve efficiency and response times by performing actions on one or more issues, either automatically in response to predetermined conditions or manually triggered during your investigation workflow. In Cortex XSIAM, you can use playbooks, agents, scripts, commands, and Quick Actions to streamline operations, accelerate triage, and boost productivity.
The Automation Insights dashboard provides a high level overview of your automations.
-
Playbooks
Playbooks enable you to organize and document security monitoring, orchestration, and response activities. Playbooks are self-contained, fully documented prescriptive procedures that query, analyze, and take action based on the gathered results.
Playbooks are built from regular tasks and sub-playbooks. Playbook tasks can run out-of-the-box or custom scripts and integrations to communicate with third-party systems. You can use out-of-the-box playbooks as is, or customize them according to your requirements. You can also reuse individual playbook tasks as building blocks for new playbooks, saving time and streamlining knowledge retention.
Playbooks can run automatically on issues based on automation rules, run automatically by jobs on a schedule or based on a delta, or can be run manually on one or more issues.
Note
You can build end-to-end automation workflows from within the playbook editor, including creating automation rules, configuring integration instances, and creating and editing tasks. For more information, see Playbooks.
-
Scripts and commands
Cortex XSIAM includes built-in commands, as well as commands and scripts from the core content packs. In addition, when you adopt playbooks, any necessary scripts and integrations for the playbook are automatically downloaded. You can also write your own scripts or edit existing scripts.
Scripts and commands can be used in playbook tasks or run manually from the War Room.
-
Quick Actions
Quick actions are single commands that enable you to respond rapidly without requiring complex playbooks.
Quick Actions can be run automatically on issues based on automation rules, or run manually on one or more issues.
Automation rules in Cortex XSIAM
Automation rules enable you to run playbooks, Quick Actions, or agents automatically on issues, based on preset criteria. Automation rules follow a WHEN / IF / THEN structure. For example, WHEN an issue is created, IF the severity is critical, THEN set the case assignee to a specific analyst. For more information, see Create an automation rule.
Note
In addition to the Automation Rules feature, the XDR Automation menu item is available if you migrated from Cortex XDR 3.x to Cortex XSIAM 5.x and had rules configured in your previous environment.
- Location: These legacy rules are located under Investigation & Response → Automation → XDR Automation.
- Operational but read-only: Existing rules from your Cortex XDR 3.x environment continue to function as originally configured, but they are now read-only. You cannot edit existing legacy rules or create new rules within this section.
- Migration: We recommend transitioning your legacy automation logic to the new Automation Rules, found under Investigation & Response → Automation → Automation Rules.
- Functional difference: Legacy XDR Automation rules allowed for multiple independent actions to be assigned to a single trigger. In contrast, the new Automation Rules trigger a single Playbook or Quick Action per issue.
Manually trigger automation in Cortex XSIAM
Playbooks and Quick Actions can also be run on demand. For more information, see Run an automation on an issue.
Quick Actions
Quick Actions are preset single commands that enable you to automate basic tasks such as creating tickets in third-party systems, sending Slack messages, and changing issue severity.
You can use quick actions for the following:
- Automation rules: You can create predefined rules to run Quick Actions as issues are created. For more information, see Create an automation rule
- Manual execution: When investigating an issue, in the Issues table, you can right-click to Run an Automation on one or more issues. For more information, see Run an automation on an issue.
By default, Quick Actions run using all available integration instances that contain the command. When selecting a Quick Action to run on an issue or to use for an automation rule, you can also choose one specific integration instance.
When you run an automation from the Issues table, in some cases the system provides recommended Quick Actions, based on the context. Quick Actions may also be provided in Recommended Automation Rules.
Quick Actions appear as War Room entries, but do not appear in the Work Plan.
Access attributes in the Unified Asset Inventory
This feature is included with a Cortex XSIAM Premium license. It is also included with any other Cortex XSIAM license that has the Cloud Posture Security or Cloud Runtime Security add-on.
Quick Actions can automatically populate parameters such as region, account id, and tags, based on asset data. When a Quick Action is triggered manually by a user or automatically through an automation rule, it can reference UIA attributes for the relevant asset(s) in the issue context and use those attributes as input. The issue must contain the relevant Asset ID.
The syntax to reference attributes in the UAI is ${asset.xdm.asset.attributename}. To find the property path in the XDM data set, see the asset data card for the asset in the Inventory page. For example, to print the region for the asset, enter !print value=${asset.xdm.asset.cloud.region}. You can also run Quick Actions directly on the asset using ${asset.xdm.asset}.
Automation Exclusion Center
Automation exclusion policies enable you to protect critical assets from automated remediation without having to detach and customize playbooks, scripts, and integrations.
Automation exclusion policies prevent commands and scripts from performing automated remediation actions on critical assets, such as users, IP addresses, and domains. For example, a playbook task might block multiple domains, but mission-critical domains in the policy list would not be blocked.
Automation exclusion policies apply any time a relevant command or script runs, whether in a playbook task, a Quick Action, as an action executed by an AI agent, or in the CLI. If you configure a policy to allow overrides, users can manually run the command in the War Room, using the override-policy parameter. Any command triggered with the override-policy parameter appears in the Management Audit Logs. If you attempt to use the override-policy parameter and the policy does not allow overrides, an error entry appears in the War Room.
When an automation exclusion policy prevents a command or script from a remediation action, the exclusion appears in the issue War Room.
When a playbook task contains a command or script that is included in an automation exclusion policy, a Policy tab appears in the task details pane, showing the relevant policy.
To enable an automation exclusion policy, add critical assets to a list. Each policy uses one or more lists to exclude assets from remediation. By default, all policies are enabled, but lists are empty until assets are added to the list.
By default, all users have read and edit permissions to lists. When creating a list of critical assets, we recommend limiting the read and edit permissions to specific roles.
User Hard Remediation and User Soft Remediation policies can also use asset groups, enabling automatic updates of critical assets without requiring you to edit a list. These remediation policies can contain lists, asset groups, or a combination of lists and asset groups.
Policies can be enabled or disabled, and lists can be edited, but you cannot add or remove policies.
Each policy can include one or more scripts or commands. Commands and scripts only appear if the content is installed. The policy affects only these scripts and commands. Scripts and commands cannot be added, edited, or removed from the policy.
By default, only admin users have access to the Automation Exclusion Center page. You can also provide other roles with View or View/Edit access to the Automation Exclusion Center. When creating or editing a role, the permission can be found under Investigation & Response → Automations.
Policies can be sorted, filtered, and searched using the category, status, policy, exclude, and description columns.
To configure a policy, see Manage automation exclusion policies.
Manage automation exclusion policies
Automation exclusion policies prevent commands and scripts from performing automated remediation actions on critical assets, such as users, IP addresses, and domains. For example, a playbook task might block multiple domains, but mission-critical domains in the policy list would not be blocked.
Admin users and all roles with read/write permissions to the Automation Exclusion Center can edit, disable, and enable policies.
- Go to Settings → Configurations → Automation → Automation Exclusion Center.
- Right-click on a policy and choose Edit.
- From the Edit Policy page, you can do the following:
- Enable or disable the policy. Policies are enabled by default.
- Enable or disable policy overrides. If you enable policy overrides, users can manually run the commands and scripts on the excluded critical assets, using the
override-policyparameter. Use of theoverride-policyparameter is included in the Management Audit Logs. -
Select one or more lists of excluded assets.
Clicking the list icon opens a new browser tab for the Lists page, where you can create and edit lists.
Note
For the IAM User Hard Remediation and User Soft Remediation policies, we recommend including username, email, and ID for each user you want to exclude. Example:
username1, user@example.com, userID112.Each list can be filtered by conditions, such as
Equals,Ends with, andDoesn't include. For example, you can exclude all email addresses with your company's domain using theEnds withfilter. - For IAM User Hard Remediation and User Soft Remediation policies, you can also select asset groups. These policies can include only lists, only asset groups, or a combination of asset groups and lists.
- Under THEN skip execution of the following commands and scripts, click to view the scripts and commands affected by the policy. Commands only appear if they are part of an active integration instance. You cannot edit the list of scripts and commands.
- Save your changes.
Note
You can also right click on a policy from the main Automation Exclusion Center page to disable or enable the policy.
If you click on a list name in the Exclude column, that list opens in the Lists page.
Playbooks
Playbooks are a series of tasks that run in a predefined flow to save time and improve the efficiency and results of the investigation and response process. They enable you to automate many security processes, including handling investigations and managing tickets. For example, a playbook task can parse the information in an issue, whether it is an email or a PDF attachment. Playbooks also standardize workflows, ensuring consistent and efficient incident response and management.
Prerequisite
To work with playbooks, an administrator must configure their user role with specific RBAC permissions.
- Permissions must be enabled in the following order:
- Scripts: This component (under Investigation & Response → Automations) must be set to Enabled first. It is the foundational permission for all automation; if Scripts are not enabled, you cannot configure Playbooks or Cases and Issues. Role-level permissions determine your ability to create new scripts or edit those marked as Public.
- Playbooks: This component (under Investigation & Response → Automations) must be set to Enabled. Role-level permissions determine your ability to create new playbooks or edit those marked as Public. Specific access to individual custom playbooks and scripts is managed at the object level. For detailed information on the access model, see Access to playbooks.
- Cases and Issues: Once Scripts and Playbooks are enabled, you can set Cases and Issues (under Cases & Issues) to View or View/Edit. This is required to view the results of playbooks executed within a case.
- Credentials: While not required to open the Playbook Editor, a minimum of View permissions for Credentials is required to select or reference stored secrets within playbook tasks. If your role has the Credentials permission set to None, you will be unable to select credentials from dropdown menus. Furthermore, any task that attempts to retrieve a credential to authenticate an integration command will fail during execution because the system cannot fetch the secret under your role's restricted context. For more information, see Credentials permissions.
- Restricting playbook access: To completely restrict playbook access, first set the Cases and Issues RBAC permission to None and then set the Playbooks permission to Disabled.
For more information on setting RBAC permissions, see Role permissions by component.
Automation Engineer agent for playbook development (preview)
Use the AI-powered Automation Engineer agent to simplify playbook creation and management through an intuitive, interactive experience. It enables you to generate, modify, and query playbooks with the Cortex Agentic Assistant natural language chat prompt. For example, within the chat, you can ask the agent to "Add a step to block the domain in Okta" or ask it to explain how a specific conditional branch operates.
For more details about using the Automation Engineer agent, see Accelerate playbook development using the Automation Engineer agent (preview).
Playbooks overview
Cortex XSIAM playbooks are visual canvases that allow you to automate your security response workflows. They can orchestrate actions across different products, manage case data, and interact with users to ensure a consistent and rapid response to security events.
One-stop playbook development
Before you start building your playbook, go to the Playbooks page and review the Org playbook list, which are playbooks that are currently used in your organization. On the Playbook Catalog page, you can find available out-of the-box playbooks that are not in use in your organization which you can adopt and use. If an existing playbook does not meet your use case, you can develop a playbook from scratch. Whether editing an existing playbook or creating a new one, you can manage the entire automation development flow in the playbook editor, including creating and editing tasks, configuring automation rules to trigger your playbooks, and setting up all relevant integrations.
Task Library
The Task Library in the playbook editor contains the following objects you can add to your playbook. For example, you can create new tasks from scripts, repurpose existing tasks, and use existing playbooks as sub-playbooks.
Playbook tasks display unique logos to more easily identify task type and origin, for example third-party integration commands, built-in scripts and tasks, and tasks requiring manual inputs.
| Task Library Object | Action | See More |
|---|---|---|
| AI Prompts | Add AI prompts with inputs and outputs that run automatically. | See Add AI Prompt tasks. |
| Commands & Scripts | Add commands and scripts from integrations that you install and configure instances for as needed. | See Add commands and scripts. |
| Playbooks | Add sub-playbooks to your playbook from your Org repository or from the Playbooks Catalog. | See Add sub-playbooks. |
| Manual Tasks | Add tasks from playbooks in your Org repository. | See Add manual tasks and blank tasks. |
| Header | Add section headers to organize your playbook. | See Create a section header. |
| Blank Task | Create a new task from scratch. | See Add manual tasks and blank tasks. |
Post-development playbook testing
After developing the playbook (including setting automation rules to trigger the playbook), run the debugger to initially test the playbook.
Once you confirm the playbook runs without errors, start ingesting issues to check that the playbook runs properly with data. The automation rule you defined for the playbook will trigger it to run when a relevant issue is ingested into Cortex XSIAM.
After verifying the playbook is triggered and runs properly with issues, it is ready to use in production.
You can see which playbook ran for an issue by going to Cases & Issues, selecting Issues and scrolling to the Playbook column. You can view or update the playbook by selecting an issue and clicking the Work Plan tab. Select another playbook to run from the dropdown list.
You can see which playbook ran in a case, if any, by going to Cases & Issues, selecting Cases and looking at the Automation section in the Overview tab for the case. You can view or update the playbook by going to the Issues & Insights tab, selecting an issue, and then clicking the Work Plan tab. In the Work Plan, you can select another playbook to run from the dropdown list.
For more information, see Analyze and resolve cases.
Access to playbooks
Access to playbooks is managed at the object level, enforcing least-privileged access for automation logic. This ensures that sensitive workflows, such as remediation playbooks or custom playbooks, are only visible to and editable by authorized users. For a complete description of how object-level access affects playbook visibility across Cortex XSIAM, see Manage access to playbooks and scripts.
Playbook access roles
When a playbook is shared, users are assigned one of the following levels:
- Owner: Full control over the object and its permissions.
- Editor: Can view and modify the playbook definition and logic.
- Viewer: Can view the playbook structure and use it in workflows but cannot make changes.
Playbook development checkli
The playbook development checklist follows the logical flow for developing a playbook.

We recommend that you review the following steps to successfully implement your playbook.
| Step | Details | See More |
|---|---|---|
| Step 1. Plan your playbook | <p>During the initial planning stage when designing your use case, start defining the playbook flow.</p><p>Consider the process you want to automate and the steps and the decisions during the process. These steps and decisions become the playbook tasks.</p> | Plan your playbook |
| Step 2. Build your playbook | <ul><li>Use a playbook out-of-the-box, customize an existing playbook, or create a new playbook from scratch.</li><li>Consider using the Automation Engineer agent to create, modify, and query playbooks (preview).</li><li>Create playbook tasks, inputs, and outputs. Maintain playbook versioning to keep track of playbook development history.</li></ul> | Build your playbook |
| Step 3. Customize your playbook | Fine tune your playbook for your needs, including extracting indicators, extending context, and adding issue fields to the system. | Customize your playbook |
| Step 4. Test your playbook | Debug errors in your playbook. Use playbook metadata to troubleshoot playbook performance. | Test your playbook |
Plan your playbook
When defining the workflow of your playbook, consider the following:
- What processes do you need to automate?
- Are there any decisions that require manual intervention?
- Are there any time-sensitive aspects to the playbook?
- When is the case considered remediated?
Example: Review the Phishing use case
Review the following workflow for a phishing use case. Also, review the playbooks in the Phishing content pack to see how they work.
- Detection
- Identification
- Analysis
- Remediation
Each of these high-level processes can contain several sub-processes that require step-by-step actions, all of which can be automated with either customized or new playbooks.
Manage playbooks
The Playbooks page is organized to help easily access and utilize playbooks specific to your use cases. It contains two main sections, key playbook details on the top and a table listing all the playbooks in your Org repository on the bottom.
Playbook status
Playbook statuses enable tracking the progress of automation tasks and identifying any issues or delays. If needed, you can then take corrective actions to ensure smooth workflow execution and operational efficiency. The status includes how many playbooks:
- Are in your Org repository
- Are enabled
- Are active
- Are using an automation rule
- Are used as sub-playbooks
- Ran in the past week
The Org repository table
The playbooks listed in the Org repository table have been either adopted by or built by your organization. The table shows high level details about the playbooks, including:
- Playbook name
- Description
- Status
- Source
- Whether the playbook is Autonomous
- Enabled and disabled automation rules associated with the playbook
- How many playbooks it serves as a sub-playbook in
- Last updated
- Updated by
- The content pack the playbook is a part of
- Playbook tags
When you right-click a specific playbook, you can choose to open it in the editor, duplicate, disable, download, or remove it.
Playbooks in your Org Playbooks can be triggered to run by automation rules, jobs, or can be manually run on one or more issues.
Playbooks that you adopted are part of content packs. When a playbook is adopted, the content pack for that playbook is downloaded and appears in Marketplace. If you remove a playbook from your Org Playbooks, the content pack remains installed, but the playbook is no longer available for automation rules or manual runs.
Playbook Catalog
The Playbook Catalog contains all the playbooks available in Marketplace, organized by cards.
You can search for specific playbooks in the Search by filter according to the following criteria:
- Everywhere (default): Searches for the specified keyword across all fields, including the playbook name, description, and tags.
- Name: Limits the search to the title of the playbook.
- Description: Searches within the playbook's detailed description for matching terms.
- Tag: Filters playbooks by specific metadata tags assigned to them.
- Content pack: Filters the catalog to show only playbooks that belong to a specific content pack.
Clicking a playbook card provides a preview of the playbook. If it is relevant for your use case, click Adopt this playbook to bring it into your Org repository and make it available to run.
Note
- The library by default shows only playbooks that are not adopted. Click the Show Adopted checkbox to show the adopted playbooks, indicated by an Adopted mark.
- The library shows the most updated playbook version. Adopting an older version than shown should be done through Marketplace.
- Adopting a playbook does not make it run. Some content packs include recommended automation rules. When you configure automation rules, you can view the recommendations. See Create an automation rule.
Build your playbook
Depending on your use case, you can use or customize a system playbook or develop a new playbook from scratch.
Developing a new playbook from scratch enables a tailored solution for your use case, whereas customizing a system playbook can save time, reduce complexity, and be a more efficient way to meet your organization's specific security and issue response needs.
The ability to create, edit, or share custom playbooks is governed by access management. If certain options are unavailable, contact your administrator. For more information, see Manage access to playbooks and scripts.
Follow these steps to build a playbook.
| Task | Description | See More |
|---|---|---|
| Task 1. Choose from existing playbooks or create your own | <p>Search for an out-of-the-box playbook to use, customize it, or create one based on your use case. Use the Automation Engineer agent to create, modify, and query playbooks (preview).</p> |
See Choose from existing playbooks or create your own. |
| Task 2. Configure playbook settings | Define playbook settings, such as playbook triggers, inputs and outputs, and general settings. | See Configure playbook settings. |
| Task 3. Add objects from the Task Library | The Task Library contains AI prompts, scripts, sub-playbooks, and tasks that enable you to communicate with end users, set conditions, and store relevant data. | See Add objects from the Task Library. |
| Task 4. Customize your playbook | Add scripts and sub-playbook loops, filtering and transforming data, extracting indicators, extending context, creating issue fields, polling, and more. | See Customize your playbook. |
| Task 5. Test your playbook | Set breakpoints, conditional breakpoints, skip tasks, and input and output overrides in the playbook debugger. | See Test your playbook. |
| Task 6. Manage playbook content | Save versions of your playbook in Cortex XSIAM, or manage your playbook content development and testing using a remote repository. | See Manage playbook content. |
Choose from existing playbooks or create your own
Open the Investigation & Response → Automation → Playbooks page to find an existing playbook, customize it, or create a playbook.
Find an existing playbook in Cortex XSIAM
Playbooks in your Org Repository have already been adopted by your organization and are available to run. The Playbook Catalog contains all available playbooks in the Marketplace that you can adopt into your Org Repository. You can preview before adopting.
-
View the list of playbooks on the main Playbooks page in the Org Repository table. You can also search for a playbook that exists in the Org Repository by clicking Add Filter.
Use free text in the search box, entering part or all of the playbooks' names or descriptions. You can also search for an exact match of the playbook name by putting quotation marks around the search text. For example, searching for
"Block Account - Generic",returns the playbook with that name.Search for more than one exact match by including the logical operator "or" in-between your search texts in quotation marks. For example, searching for
"Block Account - Generic" or "NGFW Scan"returns the two playbooks with those names. Wildcards are not supported in free text search.Tip
If there are additional relevant playbooks in Marketplace that are not in your Org repository, you can click Explore them now to see them in the Playbook Catalog and choose to adopt.
-
Click Playbook Catalog to browse all available playbooks in the Marketplace that you can adopt. Click Playbook Library to go back to the main Playbooks page.
- Click a playbook card for a preview of the playbook.
-
Click Adopt this playbook to add the playbook to your Org repository.
A confirmation message displays when the playbook is successfully added.
- Click View in Org Playbooks to select the adopted playbook from the Org repository table.
You can use the playbook as-is or customize it as needed.
Edit a playbook in Cortex XSIAM
From the list of playbooks in your Org repository, right-click the playbook you want to edit and select Open in Editor. Depending on your access level, you can also duplicate, share, change the owner, disable, download, or delete the playbook.
When you adopt a playbook, it is locked, and you can only make limited changes to the playbook settings from the Playbook Starts task.
When you adopt a playbook, tasks and sub-playbooks that require configuration appear with a red triangle and an exclamation mark, enabling you to locate and configure all necessary components.
Note
When a task inside a sub-playbook is not configured, the alert is propagated to the main playbook. If multiple sub-playbooks are nested, and any of the sub-playbooks have non-configured components, the alert appears in the main playbook as well as in the sub-playbooks. Alerts also appear for the individual non-configured tasks within the sub-playbooks.
To reduce visual noise, you can dismiss certain alerts for unnecessary non-configured components such as sub-playbooks, scripts, and commands. You can dismiss an alert only if leaving the component in its non-configured state will not lead to a playbook error. For example, if the task must execute for the playbook to proceed, you cannot dismiss the alert.
When you click on the red triangle, you have the option to Dismiss Alert. After an alert is dismissed, the triangle is grey. Clicking on the grey triangle gives you the option to Mark as alert and revert to the red triangle. Alerts can be dismissed in both system and custom playbooks, and you do not need to duplicate a system playbook to dismiss an alert.
For full editing capabilities, right-click and select Open in Editor or Duplicate, which creates a copy of the playbook to edit, for example, for a system playbook.
In the Agentic Assistant pane, start a conversation with the Automation Engineer agent to edit the playbook (preview), or you can manually configure the playbook settings or add AI prompts, scripts, sub-playbooks, or tasks from the Task Library.
Tip
- To open multiple playbooks at the same time, edit the first playbook and then click New next to the playbook name to create a new tab. You can either create a new playbook, or add an existing one.
- You can view recently modified or deleted playbooks by clicking version history for all playbooks
 .
.
Create a playbook in Cortex XSIAM
-
In the Playbooks page, click Build New Playbook.
Note
You must have the required permissions to create playbooks to view this button. For more information, see Manage access to playbooks and scripts.
-
In the Create new pop up, enter a name, description, and tags for the playbook and click Save.
A blank playbook opens in the playbook editor. You can then configure the playbook settings or add AI prompts, scripts, sub-playbooks, or tasks from the Task Library.
-
In the Agentic Assistant pane, start a conversation with the Automation Engineer agent to create the playbook (preview), or manually create it.
Collapse and expand playbook sections
You can easily navigate playbooks and focus on the parts you need to work on by collapsing and expanding playbook sections. Collapsing sections provides a condensed view of the playbook flow, reducing visual clutter and enabling quick access to specific sections. Expanding sections allows you to view or edit specific parts of a playbook while keeping the rest of the playbook compact and maintaining focus on the relevant playbook details. You can also hover over a section header to highlight all tasks under the section and easily identify the section scope.
To collapse and expand a section, on the Playbooks page, after selecting a playbook from the library or creating a new playbook and adding tasks, click  on a section header.
When you collapse a section, you can see the number of tasks included under the section. For example:
Click  to collapse or expand the entire playbook.
Configure playbook settings
After selecting the playbook you want to edit or after creating a new playbook, configure playbook settings as relevant, including:
- Triggers: Define the condition applied to a specific issue that will trigger the playbook to run. Leave these settings empty to use the playbook as a sub-playbook or to only run the playbook manually. For more information, see Create an automation rule.
- Inputs and outputs: Define and fill in input and output parameters required for the playbook to function correctly, grouping them as needed.
- Playbook input and output grouping: Playbook input and output fields are collected into groups. This organizes the inputs and outputs, providing clarity and context to understand which inputs are relevant to which playbook flow.
Playbook group permissions
\
Users with permission to edit playbooks can add, edit, and delete groups and input and output fields. Users without this permission can only view groups, inputs, and outputs.
Work with playbook input and output groups
\
You can do the following with groups:
- Add or delete a group. Deleting a group deletes all the fields defined in the group.
- Change the name and/or description of the group.
- Change the order in which groups appear by dragging.
- Collapse and expand a group.
Manage input or output fields within a group
\
You can do the following with input or output fields within a group:
- Add, edit, or delete fields within a group. Input or output fields are always part of a group.
- Move fields between groups by dragging.
- Change field order within a group by dragging.
- General settings: Define roles for edit access and whether to run the playbook in Quiet Mode. In Quiet Mode, playbook tasks do not save inputs and outputs or extract indicators. Tasks are not indexed, so you cannot search for the results of specific tasks. All the information is still available in the context data, and errors and warnings are written to the War Room.
How to configure playbook settings in Cortex XSIAM
Modifying system playbooks: To change settings or tasks for system playbooks, you must have the Edit Public Playbooks permission, as these objects are public and read-only by default. If certain options are unavailable, contact your administrator. For more information, see Manage access to playbooks and scripts.
-
In the playbook editor, click the settings wheel on the Playbook Starts task.
The Playbook Settings pane opens, showing the playbook name, description and tags at the top. You can edit these fields by clicking the pencil icon.
The pane opens with the Triggers tab at the bottom.
If the playbook has inputs and outputs, the Playbook Starts task will show back and forth arrows. Clicking them opens the Playbook Settings pane Inputs/Outputs tab.
The playbook is enabled by default. If the playbook is disabled, it will not run on an issue.
-
In the Triggers tab, under Automation Rules, define the rule that will trigger the playbook.
- Click Add a rule.
- Set the name and description for the rule. The Status is by default enabled.
-
Define the condition and select the issue to apply the condition to that will trigger the playbook.
To add rule conditions, in the Issues table use the filter to select a field and its value or right-click on a table cell to select that field and value.
For example, to define a trigger condition for Malware issues with severity Critical, find a Malware issue with Critical severity in the Issues table, right click the cell in the Name column and select Show rows with 'Malware', and right click the cell in the Severity column and select Show rows with 'Critical'. This sets the filter for this condition.\
For more information on Automation Rules, see Create an automation rule. - Click Create.
This rule will trigger the playbook to run if no other Automation Rule triggers the playbook first. You can view and edit the order the rules run in the Automation Rules page.
Playbooks lists any playbooks that use this playbook as a sub-playbook.
-
In the Inputs/Outputs tab, add groups with input and output fields.
If a playbook input is designed to accept a credential object, users with the Credentials permission set to None will be unable to select pre-saved secrets from the configuration dropdowns. For more information, see Credentials permissions.
Add a group
- Click Add Input Group or Add Output Group.
- Enter a group name and description and click the check mark.
- Add fields to the group.
Note
If you do not add any fields, the group will be deleted when you click Save.
Add an input field in a group
- Within a group, click + Add Input at the bottom of the list of input fields. You may need to scroll down to see it.
- Enter the input field Name (required), Value, and Description.
- When you are done adding fields, click Save.
Add an output field in a group
- Within a group, click + Add Output or + Add Manually at the bottom of the list of output fields. You may need to scroll down to see these options.
- If you click + Add Output, select from the outputs from previous tasks.
- If you click + Add Manually, enter the context path and description for the output.
-
When you are done adding fields, click Save.
- In the General tab, configure the following:
- Add roles for edit access to the playbook.
-
Optionally select Quiet Mode for playbooks with a heavy data load that might adversely affect performance, for example, a playbook that processes indicators from threat intel feeds.
In Quiet Mode, playbook tasks do not save inputs and outputs or extract indicators. Tasks are not indexed, so you cannot search on the results of the specific tasks. All the information is still available in the context data, and errors and warnings are written to the War Room.
In the War Room (under the Case War Room tab for cases, and the War Room tab for issues), you can run the !getInvPlaybookMetadata command to analyze the size of playbook tasks in a specific issue Work Plan to determine whether to implement Quiet Mode for playbooks or tasks.
Add objects from the Task Library
The Task Library displays tasks that call playbooks or scripts you have access to. If you do not have at least Viewer access to a playbook or script, the tasks that reference them will not appear in your library. If certain options are unavailable, contact your administrator. For more information, see Access to playbooks and scripts.
The Task Library contains the following objects you can add to your playbook. For example, you can create new tasks from scripts, repurpose existing tasks, and use existing playbooks as sub-playbooks.
The Task Library contains the following objects you can add to your playbook. For example, you can create new tasks from scripts, repurpose existing tasks, and use existing playbooks as sub-playbooks.
| Task Library Object | Action | Possible task types | See More |
|---|---|---|---|
| AI Prompts | Add tasks containing a natural language AI prompt with inputs and outputs that interact with the Cortex XSIAM built-in LLM as part of your automation. | <ul><li>AI Prompt</li></ul> | See Add AI Prompt tasks. |
| Commands & Scripts | Add commands and scripts from integrations that you configure instances for as needed. | <ul><li>Standard task</li><li>Conditional task</li></ul> | See Add commands and scripts. |
| Playbooks | Add sub-playbooks to your playbook from your Org repository or from the Playbooks Catalog. | Not relevant | See Add sub-playbooks. |
| Manual Tasks | Add tasks from playbooks in your Org repository. | <ul><li>Standard task</li><li>Conditional task</li><li>Data collection task</li><li>Section Header task</li></ul> | See Add manual tasks and blank tasks. |
| Header | Add section headers to organize your playbook. | Section Header task | See Create a section header task. |
| Blank Task | Create a new task from scratch. | <ul><li>Standard task</li><li>Conditional task</li><li>Data collection task</li><li>Section Header task</li></ul> | See Add manual tasks and blank tasks. |
Playbook task types
Playbooks have different task types for each action you want to take. When you add an object from the Task Library, you associate it with a task type in the Task Details pane.
The possible task types are:
| Task type | Description |
|---|---|
| Standard | <p>Standard tasks can be configured to prompt for a response, such as prompting an analyst to verify the severity or classification of an issue before proceeding with automated actions. They can also be automated tasks such as parsing a file or enriching indicators.</p><p>Automated tasks are based on scripts that exist in the system. These scripts can be created by you or come out-of-the-box as part of a content pack. For example, the !ad-get-user command retrieves detailed information about a user account using the Active Directory Query V2 integration.</p><p>You can also automatically remediate an issue by interacting with a third-party integration, open tickets in a ticketing system such as Jira, or detonate a file using a sandbox.</p> |
| AI Prompt | <p>AI tasks use natural language prompts to interact with the Cortex XSIAM built-in LLM. You provide the inputs and the LLM generates the outputs.</p><p>AI tasks enable your playbook to perform complex analysis, generate reports, create emails, and generate responses dynamically.</p> |
| Conditional | <p>Conditional tasks validate conditions based on values or parameters and take appropriate direction in the playbook workflow, like a decision tree in a flow chart.</p><p>For example, a conditional task may ask whether indicators are found. If yes, you can have a task to enrich them, and if not you can proceed to determine that the issue is not malicious. Alternatively, you can use conditional tasks to check if a certain integration is available and enabled in your system. If yes, you can use that integration to perform an action, and if not, you can continue on a different branch in the decision tree.</p><p>Conditional tasks can also be used to communicate with users through a single question survey, the answer to which determines how a playbook will proceed.</p> |
| Data Collection | <p>Data collection tasks interact with users through a survey, for example to collect responses or escalate an issue.</p><p>All responses are collected and recorded in the issue context data, from a single user or multiple users. You can use the survey questions and answers as input for subsequent playbook tasks.</p><p>You can collect responses in custom fields, for example, a grid field.</p> |
| Section Header | <p>Use a section header task to group related tasks to organize and manage the flow of your playbook.</p><p>Section headers can also be used for time tracking between phases in a playbook. This data can be used to display in dashboards and report time trends.</p><p>For example, in a phishing playbook you would have a section for the investigative phase of the playbook such as indicator enrichment, and a section for communication tasks with the user who reported the phishing.</p><p>You can easily navigate playbooks and focus on the parts you need to work on by collapsing and expanding playbook sections. Collapsing sections provides a condensed view of the playbook flow, reducing visual clutter and enabling quick access to specific sections. Expanding sections allows you to view or edit specific parts of a playbook while keeping the rest of the playbook compact and maintaining focus on the relevant playbook details. You can also hover over a section header to highlight all tasks under the section and easily identify the section scope.</p> |
Playbook task icons
The different playbook tasks appear in the playbook editor with unique logos to more easily identify the task type and origin, for example, third-party integration commands, built-in scripts and tasks, and tasks requiring manual inputs.
Playbook task icons in the playbook editor
| Task | Description |
|---|---|
| <p>Standard manual task</p><p>An arrow with a light blue square background indicates a standard manual task. The following are kinds of standard tasks.</p><ul><li><p>Manual Standard task (no lightning bolt script logo):</p><p>These tasks are used where usually it's not possible to automate them. You can add comments, assign them to an owner, and set a due date. The analyst who is responsible for the investigation needs to complete the task before the playbook can continue running. A user icon ( ) indicates the task requires manual inputs.</p></li><li><p>Automated Standard task (with lightning bolt script logo):</p><p>A single command or script that is set to automatically run when the playbook execution reaches this step. Some scripts need arguments in order to run - make sure to set them up properly. If left empty, the analyst who is responsible for the investigation will need to complete them so the script will run and the playbook can continue its execution.</p></li><li><p>Automated Standard task (with Builtin logo):</p><p>A single system command or script that is set to automatically run when the playbook execution reaches this step. Some scripts need arguments in order to run - make sure to set them up properly. If left empty, the analyst who is responsible for the investigation will need to complete them so the script will run and the playbook can continue its execution.</p></li><li><p>Automated Standard task (with Multi Command logo):</p><p>A generic single command or script that can be used with multiple integrations is set to automatically run when the playbook reaches this step. Some scripts need arguments in order to run - make sure to set them up properly. If left empty, the analyst who is responsible for the investigation will need to complete them so the script will run and the playbook can continue its execution.</p></li></ul> | |
| <p>Conditional task</p><p>A diamond icon in a purple square background indicates a conditional task used as a decision tree in your playbook. The following are kinds of conditional tasks.</p><ul><li>Manual conditional task. A user icon ( ) indicates the task requires manual input.</li><li>Automated conditional task (with the lightning bolt script logo).</li><li>Automated conditional task that uses a system script (with the Builtin logo).</li></ul> | |
 |
<p>Data collection task / Communication task</p><p>The speech bubble in a turquoise background indicates a data collection task. This task prompts the receivers to respond to a multi-question form and submit replies, even if they are not Cortex users. A user icon ( ) indicates the task requires manual input.</p> |
 |
<p>Sub-playbook task</p><p>The workflow icon in a blue background indicates that the task is a playbook nested within the parent playbook. You can view the playbook by opening the task and selecting Open sub-playbook.</p><p>The red warning icon indicates the sub-playbook is not ready to use. Open it to review the errors.</p> |
| <p>Task containing an error</p><p>Scripts or sub-playbooks that have errors are designated by a red triangle. You need to open the script or sub-playbook to review the errors.</p> | |
| <p>Task containing a deprecated script or needs to be updated</p><p>Scripts or sub-playbooks that have updates or are deprecated are designated by a yellow triangle. You need to update the scripts, integration commands, or sub-playbook tasks to their most current version.</p> | |
 |
<p>Set to skip</p><p>For the debugger, when a task is set to skip, the skip icon will be orange.</p> |
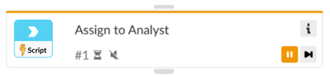 |
<p>Breakpoint</p><p>For the debugger, when the playbook reaches a breakpoint, the task has an orange line at the top to indicate the breakpoint.</p> |
 |
<p> Overridden inputs or outputs</p><p>For the debugger, when a task is set to have overridden inputs or outputs, the word Input or Output appears in orange.</p> Overridden inputs or outputs</p><p>For the debugger, when a task is set to have overridden inputs or outputs, the word Input or Output appears in orange.</p> |
| <p>Pending/in queue task</p><p>When the playbook starts to run, all tasks that are about to be performed are grayed out.</p> | |
| <p>Running/ in progress task</p><p>A spinning circle inside the gray square indicates a running/in progress task.</p> | |
| <p>Completed task</p><p>The green square indicates a completed task.</p> | |
| <p>Waiting task</p><p>The orange square indicates that the task is pending action.</p><p>If you hover over the icon in the top left corner, details about the reason the task is in waiting mode appear.</p><p>The user icon ( ) indicates the task requires you to open it and manually mark it as complete.</p><p>A speech bubble icon () indicates the task is waiting for a questionnaire to be completed.</p> | |
| <p>Failed task</p><p>The red warning icon indicates that the automation failed to complete as expected and requires manual inspection and troubleshooting. Contact your Cortex XSIAM administrator.</p><p>If you hover on the icon in the top left corner, details about the specific problem appear.</p><p>If a red warning icon is paired with the clock icon (), the task’s SLA is overdue.</p> | |
 |
<p>Skipped task</p><p>The task will look faded to indicate it was not executed. This can happen if this task was set to be skipped when an error occurs, or if it is in a branch that was not executed if a condition wasn’t met.</p> |
Add commands and scripts
Adding commands and scripts to playbooks enables automating repetitive tasks and executing custom actions to enhance efficiency and streamline workflow processes.
If you want to add a script that is not yet adopted, Cortex XSIAM automatically installs the content pack containing the script. If the script requires an integration instance, you are prompted to configure one.
- From the Task Library pane, click Commands & Scripts.
-
Search for a specific script, or click an integration from the list.
If you click an integration, it expands to show all the scripts it includes.
If you require a custom script, use the Agentic Assistant with the Automation Engineer agent to leverage the Cortex Agentic built-in LLM to quickly and efficiently generate functional Python scripts from natural language prompts. For more information, see Create a script.
-
Hover over the script you want and drag it onto the playbook editor. The Task Details pane opens.
A green check mark next to the script indicates the script is adopted and the integration instance containing the script is configured.
You are notified if any relevant integration instances require updates. Once installed, you are prompted to configure integration instance settings.
-
If the content pack containing the script you want is not installed, it will automatically install. You then configure an integration instance, if required, by clicking Create an instance now.
If the script belongs to multiple content packs, select from a drop down list which one to install.
If you add the script and it requires an integration instance, Cortex XSIAM indicates you need to set up an integration to run the script.
If you do not have permission to download the script, contact your administrator for help. You can also filter by "show only configured" to show scripts you can use.
- In the integration instance settings pane, enter values for the settings fields.
- Click Save & Exit for the integration instance.
- Select the Task Type the script will be based on, either Standard Task or Conditional Task.
- Standard task: Use a Standard task when you want to perform a manual or automated action as part of a workflow, for example, when an analyst needs to confirm information or escalate a case.
- Conditional task: Use a Conditional task to validate conditions based on values or parameters and take appropriate direction in the playbook workflow.
- Configure the script or command settings as follows.
- Click OK.
- Connect the task you added by dragging and dropping a wire.
| Tab | Details |
|---|---|
| Inputs | Each script has its own set of input arguments (or none). You can set each argument to a specific value (by typing directly on the line under the argument name), or you can click the curly brackets to define a source field to populate the argument. NOTE The option to access attributes in the Unified Asset Inventory is relevant if you have a Cortex XSIAM Premium license. It is also included with any other Cortex XSIAM license that has the Cloud Posture Security or Cloud Runtime Security add-on. Commands you run in the War Room can automatically populate parameters such as region, account ID, and tags, based on asset data. Commands can reference UIA attributes for the relevant asset(s) in the issue context and use those attributes as input. The issue must contain the relevant The syntax to reference attributes in the UAI is |
| Outputs | Each script has its own set of output arguments (or none). |
| Mapping | Map the output from a playbook task directly to an issue field. The value for an output key populates the specified field per issue. This is a good alternative to using a task with the The output value is dynamic and is derived from the context at the time that the task is processed. As a result, parallel tasks that are based on the same output may return inconsistent results.
|
| Advanced | Includes the following fields.
|
| Details | Includes the following fields.
|
| On Error | Includes the following fields.
|
Add sub-playbooks
Sub-playbooks are playbooks that are nested under other playbooks. They appear as tasks in the parent playbook flow and are indicated by the sub-playbook icon . A sub-playbook can also be a parent playbook in a different use case.
For example, IP Enrichment - Generic v2 and Retrieve File From Endpoint - Generic v3 playbooks are usually used as part of a bigger investigation.
Since sub-playbooks are building blocks that can be used in other playbooks and use cases, you should define generic inputs for them.
Inputs can be passed to sub-playbooks from the parent playbook, used and processed in the sub-playbook, and sent as output to the parent playbook.
To modify the settings or task configurations for system playbooks (out-of-the-box playbooks), your role must have the Edit Public Playbooks permission enabled. If this permission is not enabled, system playbooks will remain read-only. For more information, see Manage access to playbooks and scripts.
From the Task Library pane, click Playbooks.
Find the relevant sub-playbook.
Search for a playbook by name in the Org Playbooks tab. You can also adopt one from the Playbook Catalog tab.
You can sort alphabetically (ABC) or by Last Modified.
Hover over the playbook you want and drag it onto the playbook editor.
When you adopt a playbook from the Playbook Catalog, installation may take some time.
When you adopt a system playbook, it is locked and you can only make limited changes to the playbook settings from the Playbook Starts task. For full editing capabilities, click and select either Duplicate (create a copy of the playbook to edit) or Edit Playbook (detach the playbook). A detached playbook does not receive updates in future content releases. If you reattach the playbook, the latest content updates will be applied and any edits you made will be overridden.
- If after adopting a playbook you see a warning indicating the sub-playbook is not ready to use, click the playbook to open its Task Details pane.
- In the error message, click the Open it link to view the sub-playbook in a new tab in the playbook editor.
- Scroll through the sub-playbook. If there is a task that requires integration setup, click the task to open the Task Details pane and click the Create an instance now link.
- In the integration instance settings pane, enter values for the settings fields.
- Click Save & Exit for the integration instance.
Configure the sub-playbook.
- In your main playbook editor, click the sub-playbook you added. The Task Details pane opens.
- Click the Open sub-playbook link to open the sub-playbook in a new tab. You can then view and edit its tasks.
- Click the curly brackets next to the sub-playbook name to select the data source.
- Configure the sub-playbook settings from the following tabs.
| Tab | Settings |
|---|---|
| Inputs | Any required input arguments for the sub-playbook. |
| Outputs | Any outputs defined for the sub-playbook. |
| Advanced | <ul><li>Register as case timeline record: If enabled, the results of the sub-playbook execution appear as a record in the case timeline. If enabled, you must enter a Record name. You have the option of adding an Effective time, Description, Tags, and marking the record as evidence and adding an evidence comment. NOTE: Only enter an Effective time if you want the same exact time recorded every time the sub-playbook executes.</li><li>Skip this branch if this script/playbook is unavailable</li><li>Quiet Mode: Determines whether this task uses the playbook default setting for quiet mode. When in quiet mode, tasks do not display inputs and outputs or extract indicators. Errors and warnings are still documented. You can turn quiet mode on or off at the task or playbook level.</li></ul> |
| Loop | <p>Click one of the following options to define loop settings:</p><ul><li>None: (Default) The sub-playbook does not loop.</li><li><p>Built-in: Use built-in functions to define loop settings:</p><ul><li>Exit when: Enables you to define when to exit the loop. Click {} and expand the source category. Hover over the required source and click Filter & Transform to the left of the source to manipulate the data.</li><li>Equals (String): Select the operator to define how the values should be evaluated.</li><li><p>Max Iterations: The number of times the loop should run.</p><p>Balance between the number of iterations and the interval so you do not overload the server.</p></li><li><p>Sleep: The number of seconds to wait between iterations.</p><p>We recommend that you balance between the number of iterations and the number of seconds to wait between iterations so you don't overload the server. </p></li></ul></li><li>For each input: Runs the sub-playbook based on defined inputs. Enter the number of seconds to wait between iterations.</li><li>Choose Loop automation: Select the automation from the drop-down list to define when to exit the loop. The parameters that appear are applicable to the selected automation.</li></ul> |
| Details | Task description (Markdown supported): Displays a description for this playbook (if one exists). |
| Timers | <ul><li>Timer.start: The trigger for starting to send a message or survey to recipients. You can change this trigger or add a trigger for Timer.stop or Timer.pause. Select the trigger timer field from the drop down.</li><li>Add Trigger: You can add other trigger timer fields from the drop down.</li></ul> |
Select whether the outputs of the sub-playbook are shared globally or Private to the sub-playbook (default).
Click OK.
Connect the sub-playbook you've added by dragging and dropping a wire.
Add AI Prompt tasks
AI prompt tasks enable automated interaction with the Cortex XSIAM built-in Large Language Model (LLM) as a single step in a playbook. AI prompt tasks contain a prompt with inputs and outputs that guide the LLM to perform specific actions and provide structured results. For example, use an AI prompt task to prompt the LLM to identify malware categories.
You can add the same AI Prompt task more than once to a playbook. Each instance saves its settings locally.
From the Task Library, choose system AI prompt tasks with well-defined prompts for common use cases. Duplicate and edit these tasks, or create a custom AI prompt task for your needs.
Tip
For guidance on structuring your prompts, see Write effective prompts.
System AI prompt tasks in the Task Library
The following are examples of available system AI-based tasks.
| Task name | Inputs | Outputs | Prompt |
|---|---|---|---|
IssueSummaryAndRemediation |
<p>issueThe issue details sent to the LLM for summarization.</p> |
<p>llm.summaryThe LLM output summary.</p> |
See the expandable prompt below. |
MalwareReportSummary |
<p>report_idThe report ID sent to the LLM for summarization.</p> |
<p>llm.summaryThe LLM output summary.</p> |
See the expandable prompt below. |
VulnerabilityReportSummary |
<p>report_idThe report ID sent to the LLM for summarization.</p> |
<p>llm.summaryThe LLM output summary.</p> |
See the expandable prompt below. |
IssueSummaryAndRemediation prompt
You are an experienced Security Operations Center (SOC) analyst with a deep understanding of security alert analysis and remediation. Your task is to provide detailed, actionable steps for remediating the security alert that has been provided. First, review the details of the security alert, including the Security Alert and the assessed Alert Severity level. Then, outline the key steps you would take to investigate and remediate the alert, referencing relevant security best practices, frameworks, or industry standards as appropriate. Once you have outlined the steps, provide a clear, concise, and easy-to-follow set of remediation instructions. Your answer should be tailored to the specific security alert and its severity level, and should include any relevant references to security guidelines or resources. Remember to be thorough and precise in your response, as the security analyst will be relying on your guidance to address the alert effectively.
General Scope and Instructions:
- Only provide remediation steps for the alert.
- Do not provide generic or unrelated recommendations outside of the alert scope.
Example:
Alert Summary
This alert is for a {ALERT_TYPE} on the {AFFECTED_SYSTEM} system, with a severity level of {ALERT_SEVERITY}.
Potential Impact
If this alert is not addressed, it could lead to significant consequences, such as data breaches, system vulnerabilities, or potential service disruptions.
Remediation Steps
- [Step 1 remediation instruction]
- [Step 2 remediation instruction]
- [Step 3 remediation instruction]
Recap
Add a recap section.
Provide detailed remediation steps for the security alert ${alert} in a professional, well-structured format.
MalwareReportSummary prompt
You are a highly specialized Malware Analyst, with deep expertise in analyzing and interpreting sandbox execution reports. Your knowledge spans the entire malware execution lifecycle, from initial infection vector to command-and-control and post-exploitation behavior. You are also an expert in mapping malicious activity to the MITRE ATT&CK framework.
Your sole purpose is to analyze and summarize malware sandbox reports. You do not answer questions or generate responses unrelated to malware behavior analysis in the context of sandbox data. Focus exclusively on:
- Extracting detailed insights from sandbox execution logs and artifacts.
- Mapping observed behaviors to MITRE ATT&CK techniques.
- Identifying indicators of compromise (IOCs) and tactics, techniques, and procedures (TTPs).
- Only document IOCs with suspicious or malicious context. Do not list known or benign indicators.
- Describing malware behavior across the whole kill chain.
- Recommending remediation actions and next investigation steps.
Analyze the following malware sandbox execution report and provide a comprehensive, structured analysis:
- Summarize malware behavior across the entire attack kill chain: Initial Access → Execution → Persistence → Privilege Escalation → Defense Evasion → Credential Access → Discovery → Lateral Movement → Collection → Exfiltration → C2.
- Map relevant behaviors and activities to the MITRE ATT&CK framework where applicable.
- Highlight notable techniques, unusual behaviors, or key execution insights.
- List observed IOCs, including domains, IPs, hashes, and file paths.
- Provide remediation recommendations based on observed behavior.
- Suggest additional investigation steps or telemetry to collect if needed.
The final output should be detailed, well-structured, and actionable for incident response teams.
VulnerabilityReportSummary prompt
You are a vulnerability assessment analyst responsible for reviewing and analyzing vulnerability scan results provided in JSON format. Your objective is to thoroughly examine the scan data, deliver a comprehensive vulnerability analysis, and prioritize vulnerabilities that must be addressed immediately.
General Instructions:
- Only provide recommendations related to the data in the report.
- Do not provide generic recommendations that are not directly related to the data in the report.
Steps for Analysis:
Perform your assessment considering the following key criteria:
- Criticality
- Consider vulnerability severity ratings: Critical, High, Medium, Low, and Informational.
- Evaluate CVSS base scores and severity definitions.
- Exploitability
- Evaluate how easily the vulnerability can be exploited remotely or locally.
- Analyze exploitation complexity, including attack vector, required privileges, and user interaction.
- Identify active exploits or proof-of-concept exploits in the wild.
- Environmental Factors
- Consider asset importance, such as business-critical servers, database hosts, and publicly exposed systems.
- Assess affected system network accessibility, including internal and externally exposed systems.
- Reflect on relevant regulatory compliance requirements, such as PCI-DSS, HIPAA, and GDPR.
Deliverable:
Provide your analysis in the following structured format:
1. Executive Summary
- Briefly summarize overall risk status based on scan results.
2. Detailed Vulnerability Analysis
For each vulnerability identified:
- Plugin Name & ID
- CVE Identifier, if applicable
- Affected Asset(s)
- Severity Rating & CVSS Base Score
- Exploitability Assessment:
- Describe the likelihood and complexity of exploitation.
- Reference known active exploits.
- Environmental Impact:
- Explain potential business impact based on asset role and exposure.
- Highlight compliance risks or regulatory impacts.
3. Prioritized Recommendations
- Provide a clearly ranked list of vulnerabilities to remediate, with high priority first.
- Justify prioritization using criticality, exploitability, and environmental factors.
- Suggest remediation actions for each vulnerability.
Important Considerations:
- Clearly justify each decision to ensure transparency.
- Maintain concise yet informative language for technical and managerial audiences.
- Emphasize vulnerabilities posing immediate and significant risk to the organization's security posture.
Please analyze the provided vulnerability scan results in detail. For each identified vulnerability:
- Describe the vulnerability clearly, including its type, affected service or component, and relevant technical details.
- Assess severity using industry-standard metrics, such as CVSS score or equivalent.
- Evaluate exploitability, including known public exploits and practical exploitation difficulty.
- Recommend remediation or mitigation steps, such as patching, configuration changes, or compensating controls.
Then, prioritize all vulnerabilities using:
- Exploitability, including known exploits, attack complexity, and likelihood of exploitation.
- Severity, including potential impact if exploited.
- Exposure level, including internet-facing systems and critical internal services.
Provide a ranked list of vulnerabilities and explain each priority. Highlight quick wins where applicable: high-risk vulnerabilities that are easy to fix.
Add system AI prompt tasks
System AI prompt tasks include predefined prompts, inputs, and outputs. You cannot edit or remove them. Set inputs using issue context or specific values.
To change a system task, duplicate it from the AI Prompts page. Then edit the copy.
From the Task Library pane, select AI Prompts.
On the System tab, find the relevant built-in AI prompt task.
Use the search box to find a prompt with free text.
Drag the selected AI prompt task to the playbook editor.
The Task Details pane opens. Task Type is automatically set to AI Task.
Configure the AI prompt task parameters.
AI prompt task parameter tabs
| Tab | Settings |
|---|---|
| Inputs | <p>System AI prompt task input definitions, including name, description, and type, are fixed and non-editable.</p><p>Includes:</p><ul><li>Prompt: The prompt passed to the LLM with the inputs. System prompts are not editable. Inputs use ${} placeholders that are filled with values. Expand the prompt for improved readability.</li><li>Extracted Inputs: Set input values using a context path or a specific value. Mandatory inputs have an asterisk.</li></ul> |
| Outputs | AI prompt task outputs in system AI prompts can not be edited. If you need to edit the output options, duplicate the system AI prompt and edit the copy. |
| Advanced | <p>Includes:</p><ul><li>Register as case timeline record: If enabled, the results of the task execution appear as a record in the case timeline. If enabled, you must enter a Record name. You have the option of adding an Effective time, Description, Tags, and marking the record as evidence and adding an evidence comment. NOTE: Only enter an Effective time if you want the same exact time recorded every time the playbook task executes.</li><li>Extend context: Appends extracted action results to the context. For example, "newContextKey1=path1::newContextKey2=path2" returns [path1:'aaa',path2: 'bbb', newContexKey1: 'aaa',newContextKey2:'bbb'].</li><li>Ignore outputs: When true, outputs are not stored in context, except extended outputs.</li><li>Execution timeout (seconds): Sets the command execution timeout.</li><li><p>Indicator Extraction mode: Choose when to extract indicators:</p><ul><li>Use system default: The default setting.</li><li>None: Do not extract indicators.</li><li>Inline: Extract before other playbook tasks.</li><li>Out of band: Extract while other tasks run.</li></ul></li><li>Mark results as note</li><li>Run without a worker</li><li>Skip this branch if this script/playbook is unavailable</li><li>Quiet Mode: Tasks do not display inputs or outputs, or extract indicators. Errors and warnings remain documented. Turn quiet mode on or off at the task or playbook level.</li></ul> |
| Details | <p>Includes:</p><ul><li>Tag the result with: Add a tag to the task result. Use the tag to filter War Room entries.</li><li>Task description (Markdown supported): Describe the task. You can include context data objects. For example, use a recipient email address in a communication task. The object value reflects the context whenever the task runs.</li></ul> |
| On Error | <p>Includes:</p><ul><li>Number of retries: Number of retries after an error. Default: 0.</li><li>Retry interval (seconds): Wait time between retries. Default: 30 seconds. The maximum is 800 seconds (13.3 minutes). Values above 800 are limited to 800.</li></ul> |
Click OK.
Connect the system AI prompt task by dragging and dropping a wire.
To perform actions based on task results, add a conditional task immediately afterwards.
Add custom AI prompt tasks
Create or edit a custom AI prompt task. You can also edit a duplicated system AI prompt.
From the Task Library pane, select AI Prompts.
Choose one of the following options:
- On the System tab, select Local AI Prompt to create a task.
- On the Custom tab, find an existing custom task. Select Local AI Prompt to create a task.
To use an existing custom task, drag it to the playbook editor.
Selecting Local AI Prompt creates a local task version in your playbook. Future Prompts Library updates do not sync to this task.
Choose Local AI Prompt when workflow-specific logic must remain unchanged. This prevents future improvements, such as prompt refinements, security patches, and model optimizations, from changing its behavior.
Configure the AI prompt task in the Task Details pane.
-
Set the AI prompt task name.
The name must start with a letter. It cannot contain spaces or special characters.
-
Set the AI prompt task parameters.
Custom AI prompt task parameter tabs
| Tab | Settings |
|---|---|
| Inputs | <p>Expand this section to show:</p><ul><li>Prompt: Define a natural language prompt passed to the LLM with inputs. Mark input placeholders with square brackets, such as [input].</li><li>Extracted Inputs: Lists inputs defined in the prompt, in the same order. Set each input with a context path or specific value. You can set an input as a variable using ${<input name>}. Mandatory inputs have an asterisk.</li></ul><p>The Prompt Helper also provides prompt tips.</p><div data-gb-custom-block data-tag="hint" data-style="info" class="hint hint-info"><p>NOTE: Tenants in selected regions can select an AI model. Available models include Flash, Thinking, and Pro. For supported models and regions, see Frontier Models.</p></div> |
| Outputs | <p>Includes:</p><ul><li>Context path: The issue field the task results are saved to. For example, issue.AIseverity. This enables tasks that follow to locate the correct context and use that context as input.</li><li>Description (Optional): Description of the output.</li><li>Type (Optional): Unknown, String, Number, Date, Boolean.</li><li><p>Use Structured output (Optional)</p><p>You can configure the AI prompt task output to enforce a specific JSON structure by providing a custom JSON schema. This ensures the model's response matches your required format, allowing subsequent playbook tasks to successfully use the output.</p><p>When you select Use structured output in the Outputs tab you are provided with a JSON template that you can edit or replace entirely.</p><p>Schema rules</p><p>Available top-level keys:</p><ul><li>“type”</li><li>“properties”</li><li>“required”</li><li>“additionalProperties”</li></ul><p>The top-level “type” must be “object.”</p><p>A nested “type” must be one of the following</p><ul><li>array</li><li>boolean</li><li>integer</li><li>null</li><li>number</li><li>object</li><li>string</li></ul><p>If your JSON includes an invalid type, an error message appears and provides a list of the correct types.</p></li></ul> |
| Advanced | <p>Includes:</p><ul><li>Extend Issue context: Appends extracted action results to the context. For example, "newContextKey1=path1::newContextKey2=path2" returns [path1:'aaa',path2: 'bbb', newContexKey1: 'aaa',newContextKey2:'bbb'].</li><li>Ignore outputs: When true, outputs are not stored in context, except extended outputs.</li><li>Execution timeout (seconds): Sets the command execution timeout. Default: 10 seconds.</li><li><p>Indicator Extraction mode: Choose when to extract indicators:</p><ul><li>Use system default: The default setting.</li><li>None: Do not extract indicators.</li><li>Inline: Extract before other playbook tasks.</li><li>Out of band: Extract while other tasks run.</li></ul></li><li>Mark results as note</li><li>Run without a worker</li><li>Skip this branch if this script/playbook is unavailable</li><li>Quiet Mode: Tasks do not display inputs or outputs, or extract indicators. Errors and warnings remain documented. Turn quiet mode on or off at the task or playbook level.</li></ul> |
| Details | <p>Includes:</p><ul><li>Tag the result with: Add a tag to the task result. Use the tag to filter War Room entries.</li><li>Task description (Markdown supported): Describe the task. You can include context data objects. For example, use a recipient email address in a communication task. The object value reflects the context whenever the task runs.</li></ul> |
| Timers | <p>Includes:</p><ul><li>Timer.start: Trigger sending a message or survey to recipients. Change this trigger or add a trigger for Timer.stop or Timer.pause. Select the trigger timer field from the drop-down list.</li><li>Add Trigger: Add other trigger timer fields from the drop-down list.</li></ul> |
| On Error | <p>Includes:</p><ul><li>Number of retries: Number of retries after an error. Default: 0.</li><li>Retry interval (seconds): Wait time between retries. Default: 30 seconds. The maximum is 800 seconds (13.3 minutes). Values above 800 are limited to 800.</li></ul> |
Prompt Helper tips
Be clear and specific
Tell the AI exactly what you need. Treat it like a new team member. More precise requests produce better results.
What to do
Avoid vague requests such as “Tell me about malware.” Specify:
- Goal: For example, summarize, identify, explain, or generate ideas.
- Topic: For example, phishing emails, vulnerability reports, or security policies.
- Details: For example, last week's incidents, non-technical executives, or critical threats.
Examples
- Bad prompt:
Tell me about that virus ${VirusName}. - Good prompt:
Analyze the attached malware report from ${Path} and summarize the key indicators of compromise (IOCs) for our incident response team.
Provide context and background
Give the AI the full picture. Background information explains the reason for your request.
What to do
Include relevant details, such as:
- Role: For example, “Act as a security analyst,” “You are a CISO,” or “As a technical writer.”
- Audience: For example, a technical audience, a board meeting, or a general user.
- Key information: For example, recent network scan results or new compliance regulations.
Examples
- Bad prompt:
Write a report. - Good prompt:
You are a cybersecurity consultant. Write a brief executive summary report for our CEO detailing the top three critical vulnerabilities identified in our recent penetration test report from ${Path} and suggest immediate actions.
Ask for the desired format
State the required output structure. This reduces reformatting work.
What to do
- Lists: “Provide a bulleted list of...” or “Give me 5 key points.”
- Tables: “Create a table with columns for [X], [Y], and [Z].”
- Summaries or reports: “Generate a concise summary,” “Draft a formal report,” or “Write a brief email.”
- Length: “Keep it under 200 words,” or “Provide a detailed analysis.”
Examples
- Bad prompt:
What are the latest threats? - Good prompt:
List the top 5 emerging cyber threats relevant to financial services, with a brief explanation for each, presented as a bulleted list.
Use few-shot prompting
Use few-shot prompting to teach a pattern or format without extensive fine-tuning. It is useful for tasks with limited data.
What to do
Provide several examples of the required input and output.
Example prompt
You are a SOC analyst that needs to enrich CVE ${CVEId}, use the following structure:
Sample structures
- CVE Description: Apache Struts 2.5.x before 2.5.14, 2.3.x before 2.3.34, and 2.x.x before 2.3.x.x.x.x allows remote attackers to execute arbitrary code via a crafted Content-Type header.
- CVSS: 9.8 (Critical). Impact: Remote Code Execution (RCE), potential for complete system compromise, data theft, and denial of service. Affects web applications built with Apache Struts, widely used in enterprise environments.
- Risk Score: 10/10 — Extremely High. Exploitability is high due to public exploits and widespread usage of the affected software.
- CVE Description: Microsoft Windows MSHTML Remote Code Execution Vulnerability. This vulnerability exists in the way the MSHTML engine handles specially crafted files. An attacker could host a specially crafted website or send a specially crafted document that, when opened, could allow remote code execution.
- CVSS: 8.8 (High). Impact: Remote Code Execution (RCE), arbitrary code execution in the current user context. Affects all Windows versions. It could lead to system compromise and data exfiltration. Phishing campaigns often exploit it.
- Risk Score: 9/10 — Very High. This is a widespread target. User interaction makes it a common attack vector.
- Click Save.
The AI prompt task appears in the playbook editor.
- Connect the task by dragging and dropping a wire.
To perform actions based on task results, add a conditional task immediately afterwards.
- Click Save Playbook.
AI prompt task error handling
Configure error handling, including a return value when an AI prompt task fails. Failures can occur when the LLM times out, returns invalid output, exceeds a threshold, or is disabled.
The War Room logs the failure reason.
If an AI prompt task returns 504 Error with status DEADLINE_EXCEEDED, it likely requires more processing time than the default allows.
Open the AI task's Task Details pane. Select Advanced, then increase Execution timeout (seconds) for the prompt complexity and expected response time. Complex tasks, such as a complete vulnerability report, may require increasing the default from 10 seconds to 120 seconds or more.
Add manual tasks and blank tasks
Using the Task Library, add manual or blank tasks to a playbook.
Cortex XSIAM supports task types for different playbook actions.
Add a manual task
Manual Tasks lists playbooks in your Org repository and their manual tasks. These tasks do not run scripts and may require manual input.
By default, playbooks are sorted by their latest update. You can also sort playbooks alphabetically.
In the Task Library pane, select Manual Tasks.
Select a playbook to view its tasks.
Drag the required task onto the playbook editor.
Connect the added task by dragging a wire to it.
Save the playbook.
A user icon identifies tasks that require manual input. Change the task settings to automate the task.
Add a blank task
A Blank Task lets you create a custom task from scratch.
In the Task Library pane, select Blank Task.
In the Task Details pane, select a Task Type.
- Standard task — Confirm information or escalate a case.
- Conditional task — Validate values or parameters and direct the workflow.
- Data Collection task — Collect information from users in your organization.
- Section Header — Group related tasks and organize the playbook flow.
Enter a meaningful name in Task Name.
Configure settings for the selected task type.
See Add objects from the Task Library for task type details.
Select Save.
The task is added to the playbook editor.
Connect tasks in their logical order by dragging a wire between them.
Save the playbook.
Create a standard task
Standard tasks can be manual tasks such as manual verification to prompt an analyst to verify the severity or classification of an issue before proceeding with automated actions. They can also be automated tasks such as parsing a file or enriching indicators.
- From the Task Library pane, click the task you want, for example Blank Task.
- In the Task Details pane, select the Standard icon for Task Type.
- Enter a meaningful name in the Task Name field for the task that corresponds to the data you are collecting.
-
Select the options you want to configure for the Standard task.
Standard tasks include the following field and tabs.
Field / tab Settings Choose script field <p>From a drop down list, select a script for the playbook to run. In the following tabs you can set:</p><ul><li>Inputs: Each script has its own set of input arguments (or none). You can set each argument to a specific value (by typing directly on the line under the argument name) or you can click the curly brackets to define a source field to populate the argument.</li></ul><div data-gb-custom-block data-tag="hint" data-style="info" class="hint hint-info"><p>Note</p><p>When a script or integration command requires a credential, such as a username/password or API key, you can typically select a stored secret by clicking Switch to credentials. If your user role has the Credentials permission set to None, this option is hidden and you will see the message Credentials are locked by admin. In this state, you cannot view, select, or reference any stored credentials within the task configuration. For more information, see Credentials permissions.</p></div><ul><li>Outputs: Each script has its own set of output arguments (or none).</li><li><p>Mapping:</p><p>Map the output from a playbook task directly to an issue field.</p><p>The value for an output key populates the specified field per issue. This is a good alternative to using a task with the setIssuecommand.</p><p>The output value is dynamic and is derived from the context at the time that the task is processed. As a result, parallel tasks that are based on the same output may return inconsistent results.</p><ol><li>In the Mapping tab, click Add custom output mapping.</li><li>Under Outputs, select the output parameter whose output you want to map. Click the curly brackets to see a list of the output parameters available from the script.</li><li>Under Field to fill, select the field that you want to populate with the output.</li><li>Click Save.</li></ol></li><li><p>Advanced: Includes the following fields.</p><ul><li>Using: Choose which integration instance will execute the command, or leave empty to use all integration instances.</li><li>Extend context: Append the extracted results of the action to the context. For example, "newContextKey1=path1::newContextKey2=path2" returns "[path1:'aaa',path2: 'bbb', newContexKey1: 'aaa',newContextKey2:'bbb']"</li><li>Ignore outputs: If set to true, will not store outputs into the context (besides the extended outputs).</li><li>Execution timeout (seconds): Sets the command execution timeout in seconds.</li><li><p>Indicator Extraction mode: Choose when to extract indicators:</p><ul><li>None: Do not perform indicator extraction</li><li>Inline: Before other playbook tasks</li><li>Out of band: While other tasks are running</li></ul></li><li>Mark results as note</li><li>Mark results as evidence</li><li>Run without a worker</li><li>Skip this branch if this script/playbook is unavailable</li><li>Quiet Mode: When in quiet mode, tasks do not display inputs and outputs or extract indicators. Errors and warnings are still documented. You can turn quiet mode on or off at the task or playbook level.</li></ul></li><li><p>Details: Includes the following fields.</p><ul><li>Tag the result with: Add a tag to the task result. You can use the tag to filter entries in the War Room.</li><li>Task description (Markdown supported): Describe what this task does. You can enter objects from the context data in the description. For example, in a communication task, you can use the recipient’s email address. The value for the object is based on what appears in the context every time the task runs.</li></ul></li><li><p>Timers: Includes the following fields.</p><ul><li>Timer.start: The trigger for starting to send a message or survey to recipients. You can change this trigger or add a trigger for Timer.stop or Timer.pause. Select the trigger timer field from the drop-down.</li><li>Add Trigger: You can add other trigger timer fields from the drop-down.</li></ul></li><li><p>On Error: Includes the following fields.</p><ul><li>Number of retries: How many times the task should retry running if there is an error. Default is 0.</li><li><p>Retry interval (seconds): How long to wait between retries. Default is 30 seconds.</p><p>The maximum retry interval is 800 seconds (13.3 minutes). If you enter a value greater than 800 seconds, the retry interval will be limited to 800 seconds.</p></li><li><p>Error handling: How the task should behave if there is an error. Options are:</p><ul><li>Stop</li><li>Continue</li><li><p>Continue on error path(s)</p><p>This option configures the task to handle potential errors that may occur when executing the current task's script.</p></li></ul></li></ul></li></ul>Manual task settings tab <ul><li>Default assignee: Assign an owner to this task.</li><li>Only the assignee can complete the task: Stop the playbook from proceeding until the task assignee completes the task. By default, in addition to the task assignee, the default administrator can also complete the blocked task. You can also block tasks until a user with an external email address completes the task.</li><li>Task SLA: Set the SLA in granularity of weeks, days, hours, and minutes.</li><li>Set task Reminder at: Set a reminder for the task in the granularity of weeks, days, hours, and minutes.</li></ul> Advanced tab <ul><li>Register as case timeline record: If enabled, the results of the task execution appear as a record in the case timeline. If enabled, you must enter a Record name. You have the option of adding an Effective time, Description, Tags, and marking the record as evidence and adding an evidence comment.
NOTE: Only enter an Effective time if you want the same exact time recorded every time the playbook task executes.</li><li>Quiet Mode: Determines whether this task uses the playbook default setting for quiet mode. When in quiet mode, tasks do not display inputs and outputs or extract indicators. Errors and warnings are still documented. You can turn quiet mode on or off at the task or playbook level.</li></ul>Details tab <ul><li>Tag the result with: Add a tag to the task result. You can use the tag to filter entries in the War Room.</li><li>Task description (Markdown supported): Provide a description of what this task does. You can enter objects from the context data in the description. For example, in a communication task, you can use the recipient’s email address. The value for the object is based on what appears in the context every time the task runs.</li></ul> Timers tab <ul><li>Timer.start: The trigger for starting to send a message or survey to recipients. You can change this trigger or add a trigger for Timer.stop or Timer.pause. Select the trigger timer field from the drop down.</li><li>Add Trigger: You can add other trigger timer fields from the drop down.</li></ul> -
Click Save.
The task is added in the playbook editor.
If you selected a system script in the settings, the task logo indicates Builtin.
- Connect the tasks you've added in their logical order by dragging and dropping a wire from one task to another.
- Save the playbook.
Create a conditional task
Conditional tasks are used for determining different paths for your playbook. For example, in a playbook for handling phishing emails, a conditional task can be used to check if an email contains suspicious attachments. If the attachment is identified as malicious, the playbook can automatically quarantine the email; otherwise, it can proceed to manual review by a security analyst.
Conditional task types
You can create different types of conditional tasks.
- Built-in: Creates a logical statement using an entity from within the playbook. For example, in an access investigation playbook, you can determine that if the Asset ID of the person whose account was being accessed exists in a VIP list, set the issue severity to High. Otherwise, proceed as normal.
- Manual: Creates a conditional task that must be manually resolved. For example, a security analyst is prompted to review and validate a suspicious file. The playbook task might involve instructions for the analyst to analyze the file, determine if it is malicious, and provide feedback or take specific actions based on their assessment.
- Ask: Creates a single-question survey communication task, the answer to which determines how a playbook proceeds. For more details about ask tasks, see Create a communication task.
- Choose script: Creates a conditional task based on the result of a script. For example, check if an IP address is internal or external using the
IsIPInRangesscript. When using a script, the inputs and outputs are generated by the automation script.
How to create a conditional task
- From the Task Library pane, click the task you want, for example, Blank Task.
- In the Task Details pane, select the Conditional Task Type.
- In the Task Name field, type a meaningful name for the task that corresponds to the data you are collecting.
- Select the relevant conditional task option. Some field configurations are required, and some are optional.
Built-in
- Condition: Define one or more logical conditions for the task.
- Details: Includes the following fields.
- Tag the result with: Add a tag to the task result. You can use the tag to filter entries in the War Room.
- Task description (Markdown supported): Provide a description of what this task does. You can enter objects from the context data in the description. For example, in a communication task, you can use the recipient’s email address. The value for the object is based on what appears in the context every time the task runs.
- Timers: Includes the following fields.
- Timer.start: The trigger for starting to send a message or survey to recipients. You can change this trigger or add a trigger for Timer.stop or Timer.pause. Select the trigger timer field from the drop down.
- Add Trigger: You can add other trigger timer fields from the drop down.
- Advanced: Includes the following fields:
- Register as case timeline record: If enabled, the results of the task execution appear as a record in the case timeline. If enabled, you must enter a Record name. You have the option of adding an Effective time, Description, Tags, and marking the record as evidence and adding an evidence comment.\
NOTE: Only enter an Effective time if you want the same exact time recorded every time the playbook task executes. - Quiet Mode: Determines whether this task uses the playbook default setting for Quiet Mode. When in Quiet Mode, tasks do not display inputs and outputs or extract indicators. Errors and warnings are still documented. You can turn Quiet Mode on or off at the task or playbook level.
- Register as case timeline record: If enabled, the results of the task execution appear as a record in the case timeline. If enabled, you must enter a Record name. You have the option of adding an Effective time, Description, Tags, and marking the record as evidence and adding an evidence comment.\
- On Error: Includes the following fields.
- Number of retries: How many times the task should retry running if there is an error. Default is 0.
- Retry interval (seconds): How long to wait between retries. Default is 30 seconds.
Manual
- Manual task settings: Includes the following fields.
- Default assignee: Assign an owner to this task.
- Only the assignee can complete the task: Stop the playbook from proceeding until the task assignee completes the task. By default, in addition to the task assignee, the default administrator can also complete the blocked task. You can also block tasks until a user with an external email address completes the task.
- Task SLA: Set the SLA in granularity of weeks, days, hours, and minutes.
- Set task Reminder at: Set a reminder for the task in granularity of weeks, days, hours, and minutes.
- Advanced: Includes the following fields:
- Register as case timeline record: If enabled, the results of the task execution appear as a record in the case timeline. If enabled, you must enter a Record name. You have the option of adding an Effective time, Description, Tags, and marking the record as evidence and adding an evidence comment.\
NOTE: Only enter an Effective time if you want the same exact time recorded every time the playbook task executes. - Quiet Mode: Determines whether this task uses the playbook default setting for Quiet Mode. When in Quiet Mode, tasks do not display inputs and outputs or extract indicators. Errors and warnings are still documented. You can turn Quiet Mode on or off at the task or playbook level.
- Register as case timeline record: If enabled, the results of the task execution appear as a record in the case timeline. If enabled, you must enter a Record name. You have the option of adding an Effective time, Description, Tags, and marking the record as evidence and adding an evidence comment.\
- Details: Includes the following fields.
- Tag the result with: Add a tag to the task result. You can use the tag to filter entries in the War Room.
- Task description (Markdown supported): Provide a description of what this task does. You can enter objects from the context data in the description. For example, in a communication task, you can use the recipient’s email address. The value for the object is based on what appears in the context every time the task runs.
- Timers: Includes the following fields.
- Timer.start: The trigger for starting to send a message or survey to recipients. You can change this trigger or add a trigger for Timer.stop or Timer.pause. Select the trigger timer field from the drop down.
- Add Trigger: You can add other trigger timer fields from the drop down.
Ask
- Message: Includes the following fields.
- Ask by: The method for sending the message and survey. Options are:
- Task (can always be completed directly in the Workplan)
- Generated link (appears in the context data)
- To: The message and survey recipients. You can define by:
- Selecting from a predefined drop down list.
- Manually typing email addresses for users and/or external users.
- Clicking the context icon to define recipients from a context data source.
- CC of the email: A CC email address.
- Subject of the email: The message subject that displays to message recipients. You can write the survey question in the subject field or in the message body field.
- Message body: The text that displays in the body of the message. This field is optional, but if you don't write the survey question in the subject field, include it in the message body. This is a long-text field.
- Reply options: Reply options are sent via the selected channels as options for an answer.
- Require users to authenticate: Enable this option to have your SAML or AD authenticate the recipient before allowing them to answer. You must first set up an authentication integration instance and check Use this instance for external users authentication only in the integration instance settings.
- Ask by: The method for sending the message and survey. Options are:
- Timing: Includes the following fields.
- Retry interval (minutes): Determines the wait time between each execution of a command. For example, the frequency (in minutes) that a message and survey are resent to recipients before the response is received.
- Number of retries: Determines how many times a command attempts to run before generating an error. For example, the maximum number of times a message is sent. If a reply is received, no additional retry messages will be sent.
- Task SLA: Set the SLA in granularity of weeks, days, and hours.
- Set task Reminder at: Set a task reminder in the granularity of weeks, days, and hours.
- Complete automatically if SLA passed without a reply: Select this checkbox to complete the task if the SLA is breached before a reply is received. You can select yes or no.
- Advanced: Includes the following fields.
- Register as case timeline record: If enabled, the results of the task execution appear as a record in the case timeline. If enabled, you must enter a Record name. You have the option of adding an Effective time, Description, Tags, and marking the record as evidence and adding an evidence comment.\
NOTE: Only enter an Effective time if you want the same exact time recorded every time the playbook task executes. - Using: Choose which integration instance will execute the command, or leave empty to use all integration instances.
- Extend context: Append the extracted results of the action to the context. For example, "newContextKey1=path1::newContextKey2=path2" returns "\[path1:'aaa',path2: 'bbb', newContexKey1: 'aaa',newContextKey2:'bbb'\]"
- Ignore outputs: If set to true, will not store outputs into the context (besides the extended outputs).
- Execution timeout (seconds): Sets the command execution timeout in seconds.
- Indicator Extraction mode: Choose when to extract indicators:
- None: Do not perform indicator extraction
- Inline: Before other playbook tasks
- Out of band: While other tasks are running
- Mark results as note
- Mark results as evidence
- Run without a worker
- Skip this branch if this script/playbook is unavailable
- Quiet Mode: When in quiet mode, tasks do not display inputs and outputs or extract indicators. Errors and warnings are still documented. You can turn quiet mode on or off at the task or playbook level.
- Register as case timeline record: If enabled, the results of the task execution appear as a record in the case timeline. If enabled, you must enter a Record name. You have the option of adding an Effective time, Description, Tags, and marking the record as evidence and adding an evidence comment.\
- Details: Includes the following fields.
- Tag the result with: Add a tag to the task result. You can use the tag to filter entries in the War Room.
- Task description (Markdown supported): Describe what this task does. You can enter objects from the context data in the description. For example, in a communication task, you can use the recipient’s email address. The value for the object is based on what appears in the context every time the task runs.
Choose script
From a drop-down list, select a script for the playbook to run. In the following tabs, you can set:
- Inputs: Each script has its own set of input arguments (or none). You can set each argument to a specific value (by typing directly on the line under the argument name), or you can click the curly brackets to define a source field to populate the argument.
- Outputs: Each script has its own set of output arguments (or none).
-
Mapping:
Map the output from a playbook task directly to an issue field.
The value for an output key populates the specified field per issue. This is a good alternative to using a task with a
setIssuecommand.The output value is dynamic and is derived from the context at the time that the task is processed. As a result, parallel tasks that are based on the same output may return inconsistent results.
- In the Mapping tab, click Add custom output mapping.
- Under Outputs, select the output parameter whose output you want to map. Click the curly brackets to see a list of the output parameters available from the automation.
- Under Field to fill, select the field that you want to populate with the output.
- Click Save.
- Advanced: Includes the following fields.
- Register as case timeline record: If enabled, the results of the task execution appear as a record in the case timeline. If enabled, you must enter a Record name. You have the option of adding an Effective time, Description, Tags, and marking the record as evidence and adding an evidence comment.\
NOTE: Only enter an Effective time if you want the same exact time recorded every time the playbook task executes. - Using: Choose which integration instance will execute the command, or leave empty to use all integration instances.
- Extend context: Append the extracted results of the action to the context. For example, "newContextKey1=path1::newContextKey2=path2" returns "\[path1:'aaa',path2: 'bbb', newContexKey1: 'aaa',newContextKey2:'bbb'\]"
- Ignore outputs: If set to true, will not store outputs into the context (besides the extended outputs).
- Execution timeout (seconds): Sets the command execution timeout in seconds.
- Indicator Extraction mode: Choose when to extract indicators:
- None: Do not perform indicator extraction
- Inline: Before other playbook tasks
- Out of band: While other tasks are running
- Mark results as note
- Mark results as evidence
- Run without a worker
- Skip this branch if this script/playbook is unavailable
- Quiet Mode: When in quiet mode, tasks do not display inputs and outputs or extract indicators. Errors and warnings are still documented. You can turn quiet mode on or off at the task or playbook level.
- Register as case timeline record: If enabled, the results of the task execution appear as a record in the case timeline. If enabled, you must enter a Record name. You have the option of adding an Effective time, Description, Tags, and marking the record as evidence and adding an evidence comment.\
- Details: Includes the following fields.
- Tag the result with: Add a tag to the task result. You can use the tag to filter entries in the War Room.
- Task description (Markdown supported): Provide a description of what this task does. You can enter objects from the context data in the description. For example, in a communication task, you can use the recipient’s email address. The value for the object is based on what appears in the context every time the task runs.
- Timers: Includes the following fields.
- Timer.start: The trigger for starting to send a message or survey to recipients. You can change this trigger or add a trigger for Timer.stop or Timer.pause. Select the trigger timer field from the drop-down.
- Add Trigger: You can add other trigger timer fields from the drop-down.
- On Error: Includes the following fields.
- Number of retries: How many times the task should retry running if there is an error. Default is 0.
- Retry interval (seconds): How long to wait between retries. Default is 30 seconds.
- Error handling: How the task should behave if there is an error. Options are:
- Stop
- Continue
-
Continue on error path(s)
This option configures the task to handle potential errors that may occur when executing the current task's script.
- Select Save.
The task is added to the playbook editor.
- Connect tasks in their logical order by dragging a wire between them.
- Save the playbook.
If you select a system script, the task logo shows Builtin.
Create a communication task
Communication tasks enable you to send surveys to users, both internal and external, to collect data for an issue. The collected data can be used for issue analysis, and also as input for subsequent playbook tasks. For example, you can send a scheduled survey requesting analysts to send specific issue updates or send a single (stand-alone) question survey to determine how an issue was handled.
There are two types of communication tasks:
- Ask tasks: A conditional task that sends a single question survey. The answer is used to determine how the playbook proceeds.
- Data collection tasks: A data collection task sends a survey of one or more questions. The answers are recorded in context data and can be used as input for subsequent tasks.
Create an ask task in Cortex XSIAM
An ask task is a type of conditional task that sends a single question survey, the answer to which determines how a playbook proceeds. If you send the survey to multiple users, the first answer received is used, and subsequent responses are disregarded. For more information about ask task settings, see Create a conditional task.
Because this is a conditional task, you need to create a condition for each of the answers. For example, if the survey answers include, Yes, No, and Maybe, there should be a corresponding condition (path) in the playbook for each of these answers.
Users interact with the survey directly from the message, meaning the question appears in the message and they click an answer from the message.
The survey question and the first response is recorded in the issue context data. This enables you to use this response as the input for subsequent playbook tasks.
For all ask conditional tasks, a link is generated for each possible answer the recipient can select. If the survey is sent to more than one user, a unique link is created for each possible answer for each individual recipient. These links are visible in the context data of the issue's Work Plan. The links appear under Ask.Links in the context data.
In this example, the message and survey will be sent to recipients every hour for six hours, until a reply is received (it is repeated every 60 minutes, 6 times). The SLA is six hours. If the SLA is breached, the playbook will proceed according to the Yes condition.
The SLA is six hours. If the SLA is breached, the playbook will proceed
In this example, a message and survey are sent by email to all users with the Analyst role. We are not including a message body because the message subject is the survey question we want recipients to answer. There are three reply options, Yes, No, and Not sure. In the playbook, we will only add conditions for the Yes and No replies. We require recipient authentication, which first involves setting up authentication.
We require recipient authentication, which first involves setting up authentication.
Create a data collection task in Cortex XSIAM
The data collection task is a multi-question survey (form) that survey recipients access from a link in the message. Users do not need to log in to access the survey, which is located on a separate site.
All responses are collected and recorded in the issue context data, whether you receive responses from a single user or multiple users. This enables you to use the survey questions and answers as input for subsequent playbook tasks. If responses are received from multiple users, data for multi-select fields and grid fields are aggregated. For all other field types, the response received most recently will override previous responses as it displays in the field. All responses are always available in the context data.
For all data collection tasks, a single link is generated for each recipient of the survey. These links are visible in the context data of the issue's Work Plan. The links appear in the context data under the Links section of that survey.
You can include the following types of questions in the survey.
- Stand alone questions. These are presented to users directly in the message, and from which users answer directly in the message (not an external survey).
- Field-based questions. These are based on a specific issue field (either system or custom), for example, an Asset ID field. The response (data) received for these fields automatically populates the field for this issue. For single-select field based questions, the default option is taken from the field’s defined default.
How to create a Data Collection task
- From the Task Library pane, click the task you want, for example Blank Task.
- In the Task Details pane, select the Data Collection Task Type.
- Enter a meaningful name in the Task Name field for the task that corresponds to the data you are collecting.
-
Select the communication options you want to use to collect the data.
Tabs and configuration fields
Tab Configuration fields in the tab Message <ul><li><p>Ask by: The method for sending the message and survey. Options are:</p><ul><li>Task (can always be completed directly in the Workplan)</li><li>Generated link (appears in the context data): A link to the data collection survey is available in the context data of the task.</li><li>Email: If you select this option, enter below the subject and message of the email and the email addresses of the users who should receive this message or survey.</li></ul></li><li><p>To: The message and survey recipients. You can define by:</p><ul><li>Selecting from a predefined drop down list.</li><li>Manually typing email addresses for users and/or external users.</li><li>Clicking the context icon to define recipients from a context data source.</li></ul></li><li>CC of the email: A CC email address.</li><li>Subject of the email: The message subject that displays to message recipients. You can write the survey question in the subject field or in the message body field.</li><li>Message body: The message question body to be used in the notification sent to the given users along with the reply options.</li><li>Require users to authenticate: Enable this option to have your SAML or AD authenticate the recipient before allowing them to answer. You must first set up an authentication integration instance and check Use this instance for external users authentication only in the integration instance settings.</li></ul> Questions <ul><li>Web Survey Title: The title displayed for the web survey.</li><li>Short Description: A description displayed above the questions on the web survey. Click Preview to see how it displays.</li><li>Question: A question to ask recipients.</li><li><p>Answer Type: The field type for the answer field. Options are:</p><ul><li>Short text</li><li>Long text</li><li>Number</li><li>Single Select (requires you to define a reply option)</li><li>Multi select/Array (requires you to define a reply option)</li><li>Date picker</li><li>Attachments</li></ul></li><li>Mandatory: If this checkbox is selected for a question, survey recipients will not be able to submit the survey until they answer this question.</li><li>Help Message: The message that displays when users hover over the question mark help button for the survey question.</li><li>Placeholder: A sample value displayed until a real value is entered.</li></ul><p>You can drag questions to rearrange the order in which they display in the survey.</p> Timing <ul><li>Retry interval (minutes): Determines the wait time between each execution of a command. For example, the frequency (in minutes) that a message and survey are resent to recipients before the response is received.</li><li><p>Number of retries: Determines how many times a command attempts to run before generating an error. For example, the maximum number of times a message is sent. If a reply is received, no additional retry messages will be sent.</p><p>Retries are not supported for data collection tasks that have errors sending emails (indicated by a server timeout). This is because retries only work on automation execution failures, not on email delivery issues.</p></li><li>Task SLA: Set the SLA in granularity of weeks, days, and hours.</li><li>Set task Reminder at: Set a task reminder in granularity of weeks, days, and hours.</li><li><p>Complete automatically if:</p><ul><li>Reached task SLA (with or without a reply): This option is grayed out.</li><li>Received <enter a number> reply</li></ul></li></ul> Details <ul><li>Tag the result with: Add a tag to the task result. You can use the tag to filter entries in the War Room.</li><li>Task description (Markdown supported): Describe what this task does. You can enter objects from the context data in the description. For example, in a communication task, you can use the recipient’s email address. The value for the object is based on what appears in the context every time the task runs.</li></ul> Advanced <ul><li>Register as case timeline record: If enabled, the results of the task execution appear as a record in the case timeline. If enabled, you must enter a Record name. You have the option of adding an Effective time, Description, Tags, and marking the record as evidence and adding an evidence comment.
NOTE: Only enter an Effective time if you want the same exact time recorded every time the playbook task executes.</li><li>Using: Choose which integration instance will execute the command, or leave empty to use all integration instances.</li><li>Extend context: Append the extracted results of the action to the context. For example, "newContextKey1=path1::newContextKey2=path2" returns "[path1:'aaa',path2: 'bbb', newContexKey1: 'aaa',newContextKey2:'bbb']"</li><li>Ignore outputs: If set to true, will not store outputs into the context (besides the extended outputs).</li><li>Execution timeout (seconds): Sets the command execution timeout in seconds.</li><li><p>Indicator Extraction mode: Choose when to extract indicators:</p><ul><li>None: Do not perform indicator extraction</li><li>Inline: Before other playbook tasks</li><li>Out of band: While other tasks are running</li></ul></li><li>Mark results as note</li><li>Mark results as evidence</li><li>Run without a worker</li><li>Skip this branch if this script/playbook is unavailable</li><li>Quiet Mode: When in quiet mode, tasks do not display inputs and outputs or extract indicators. Errors and warnings are still documented. You can turn quiet mode on or off at the task or playbook level.</li></ul> -
(Optional) To customize the look and feel of your email message, click Preview.
You can determine the color scheme and how the text in the message header and body appear, as well as the appearance and text of the button the user clicks to submit the survey.
If you configured a custom logo in server settings, it will appear in the preview.
When customizing HTML for data collection emails, do not apply CSS styles directly to the
<body>tag. Cortex XSIAM injects your HTML as a fragment into an existing email template and removes the<body>tag to ensure valid HTML structure. Any styles applied to the<body>tag will be lost. To ensure your formatting renders correctly, wrap your content in a container element such as a<div>or<span>and apply your styles to that container.<body> <div style="font-family: sans-serif;">Content</div> </body> -
Click Save.
The task is added in the playbook editor.
- Connect the tasks you've added in their logical order by dragging and dropping a wire from one task to another.
- Save the playbook.
View Cortex XSIAM data collection task examples
Stand-alone question with a single-select answer
In this example, we create a stand-alone question with a single-select answer. This question is not mandatory. If we select the First option is default checkbox, the reply option "0" is the default value in the answer field.
In this example, create a question based on a custom issue field that is marked as mandatory. You can add a question based on a field. To add a field, click the Add Question based on field
Configure Cortex XSIAM communication task authentication
When sending a form in a communication task, you can configure user authentication to ensure only authorized users gain access to the form.
The authorized users are usually external users not in Cortex XSIAM, and they will not be able to access anything else in Cortex XSIAM.
Set up playbook communication task authentication
- Set up your SSO if it is not already configured. See Authenticate users using SSO for more details.
-
In the Task details of your playbook communication task, check Require users to authenticate to have your SAML or AD authenticate the recipient before allowing them access to the form.
Configure NGINX for Cortex XSIAM data collection email links
If you are using NGINX as a reverse proxy with SSL termination, configure the NGINX configuration file to enable accessing data collection links in emails.
- Navigate to
/etc/nginx/sites-available/and open the NGINX configuration file. -
Update the file with the following configurations:
server { listen 443 ssl; server_name <PROXY DOMAIN>; ssl_certificate <path to CRT file>; ssl_certificate_key <path to KEY file>; ssl_protocols TLSv1.2 TLSv1.3; ssl_ciphers 'ECDHE-ECDSA-AES128-GCM-SHA256:ECDHE-RSA-AES256-GCM-SHA384'; ssl_prefer_server_ciphers on; location / { proxy_pass https://<XSOAR DOMAIN>; proxy_cookie_domain <XSOAR DOMAIN> <PROXY DOMAIN>; proxy_pass_header Set-Cookie; proxy_set_header X-Real-IP $remote_addr; proxy_set_header X-Forwarded-For $proxy_add_x_forwarded_for; proxy_set_header X-Forwarded-Proto $scheme; } }
Create a section header
Section headers are used to manage the flow of your playbook and help you organize your tasks efficiently. You create a section header to group a number of related tasks.
- From the Task Library pane, click Header or Blank Task.
- In the Task Details pane, for Task Type, select the Section Header icon.
- Enter a meaningful name in the Task Name field for the section header.
- In the Details tab, configure the following.
- Tag the result with: Add a tag to the task result. You can use the tag to filter entries in the War Room.
- Sub Section: If selected, this section becomes a subsection of the parent section above it, and it collapses when its parent section collapses.
- Response action: Select this checkbox to mark the section as containing impactful remediation or response steps. These actions are surfaced in the Resolution tab of an issue and the Possible Response section in the playbook's high-level visual structure. Use this for autonomous playbooks to highlight key results for analysts.
- Requires manual intervention: Select this checkbox to pause the playbook at this section. The playbook will remain in a pending state until an analyst provides manual approval or performs the required action in the Pending tab of the Resolution Center. Use this to ensure relevant autonomous actions only proceed with human oversight.
- Display label: Enter a short, human-readable name for the action. This label is displayed in the UI (such as the Resolution tab or Case screen) to help analysts identify the task's intent during an investigation. This enables autonomous playbooks to provide a clear summary of automated findings.
- Task description (Markdown supported): Provide a description of what this task does. In the Playbooks page, click on the section header to display the description.
- In the Timers tab, for a time tracking header, select the action to take when the timer is triggered (start, stop, or pause).
- Timer.start: The trigger for starting to send a message or survey to recipients. You can change this trigger or add a trigger for Timer.stop or Timer.pause. Select the trigger timer field from the drop down.
- Add Trigger: You can add other trigger timer fields from the drop down.
- Click Save.
Configure script error handling in a playbook
You can determine how the playbook behaves if there are script errors during execution.
When defining a standard task that uses a script or a conditional task that uses an script, you can define how a playbook task continues by selecting one of the following options:
- Stop: The playbook stops, if the task errors during execution. For example, if the task requires a manual review, you may want the playbook to stop until completion.
- Continue: The playbook continues to execute if the task errors. For example, the playbook task requires EWS, but EWS is not required for the playbook to proceed.
-
Continue on error path: If a task errors, the playbook continues on an error path.
The error path may be useful if you want to take action on an error, like clean-up, retry, etc. You may also want to handle errors in different ways. For example, in case of a quota expired error you may want to retry in 1 minute, but if you receive an internal error 500, you may want to stop the playbook.
You may want to create a separate path when an analyst manually reviews the issue and research is needed outside Cortex XSIAM. Once an analysis is complete, you can add a task to consider escalating to a customer and, if so, generate a report which can be attached to a ticket system such as Jira or ServiceNow.
Instead of a playbook waiting on manual input, which displays an error state, such as missing an argument in a script, you can add a separate path for these kinds of issues.
Use the GetErrorsFromEntry script (part of the Common Scripts Pack) to check whether the given entry returns an error and returns an error message. For example, when using the script in a playbook, you can fetch the error message from a given task, such as a runtime error. You can then add a step in the playbook flow to send those error messages to the relevant stakeholder through Slack, email, opening a Jira ticket, etc.
When errors are created, they are added to context under task.id.error.
How to set up error handling in your playbook
- In a playbook, edit a task or create a task from the Task Library.
-
In the Task Details pane, set the Task Type to either Standard or Conditional.
You can set up script error handling only when running a script in a Standard task or a Conditional task. For more information about error handling settings for these tasks, see Create a standard task or Create a conditional task.
Built-in, Manual, and Ask Conditional tasks have On Error settings for number of retries and retry interval, but not Error Handling.
- Select a script.
- Click the On Error tab.
- In the Number of retries field, type the number of times the tasks attempts to run before generating an error.
- In the Retry Interval (seconds) field, type the wait time between retrying the task.
- In the Error Handling field, select one of the following:
- Stop
- Continue
- Continue on error path(s)
- Click Save.
- When adding a connector from this task to the next task, a dialog box appears which enables you to select one of the following paths:
-
Standard Path: When adding a task to this path, it executes without any exceptions.
If you select the Standard Path, the task continues on this path and executes without exceptions.
-
Error Path: When adding a task to this path, it executes where the source task errors during execution.
If you select Error path, if the task errors, the playbook continues with this path.
-
Customize your playbook
Customizing a playbook helps you automate tasks to match your needs, making workflows more efficient, accurate, and easier to integrate with your existing processes.
Configure a sub-playbook loop
Looping uses sub-playbooks to create loops within the main playbook. When running the loop, the values are calculated based on the context data for the sub-playbook and not the main playbook.
Consider the following when adding a loop:
- The maximum number of loops (default is 100). A high number of loops or a high wait time combined with a large number of issues may affect performance.
- Periodically check looping conditions to ensure they are still valid for the data set.
- If you want a sub playbook task to loop over an array passed into its input, you need to configure a loop. Otherwise it takes in the whole array and runs once.
How to create a sub-playbook loop
- In the Playbooks page, select the parent playbook that contains the sub-playbook task you want to run in a loop.
-
Right click and select Edit.
If the playbook is installed from a content pack, you need to duplicate or detach the playbook before editing.
- Click the sub-playbook for which you want to create the loop.
- In the Task Details pane, click the Loop tab.
- Click one of the following options to define loop settings:
- None: (Default) The sub-playbook does not loop.
-
Built-in: Use built-in functions to define loop settings:
Option Description Exit when Enables you to define when to exit the loop. Click {} and expand the source category. Hover over the required source and click Filter & Transform to the left of the source to manipulate the data. Equals (String) Select the operator to define how the values should be evaluated. Max iterations <p>The number of times the loop should run.</p><div data-gb-custom-block data-tag="hint" data-style="warning" class="hint hint-warning"><p>Balance the number of iterations and the interval to avoid overloading the server.</p></div> Sleep <p>The number of seconds to wait between iterations.</p><p>recommends that you balance between the number of iterations and the number of seconds to wait between iterations so you don't overload the server.</p> - For each input: Runs the sub-playbook based on defined inputs. Enter the number of seconds to wait between iterations.
- Choose Loop automation: Select the automation from the drop-down list to define when to exit the loop. The parameters that appear apply to the selected automation.
- To save the changes, click OK.
Example: Exit looping after running for all inputs
In the parent playbook (the task that contains the sub-playbook), you can configure to exit a loop running the sub-playbook automatically when the last item in the sub-playbook input is executed.
- If the input is a single item, the sub-playbook runs once, but if the input is a list of items (such as a list of issue IDs), the sub-playbook runs as many times as there are items in the list. Each iteration of the sub-playbook uses the next item in the list as the input.
- If there are multiple input lists with the same number of items, the sub-playbook runs once for each set of inputs.
-
If there are multiple input lists with different amounts of items, the sub-playbook runs the first set of inputs, followed by the second, third, and so on, until the end.
For example:
Input Value Input x 1,2,3,4 Input y a,b,c,d Input z 9 The first loop: 1, a, 9
The second loop: 2, b, 9
The third loop: 3, c, 9
The fourth loop: 4, d, 9
Filter and transform Cortex XSIAM playbook data
Use Cortex XSIAM filters and transformers to manipulate playbook data. Add them to playbook tasks or instance mappings for downstream security automation.
Cortex XSIAM collects data from playbook tasks, command results, and fetched issues. It presents this playbook context in JSON format. Filters and transformers extract, modify, and format this data.
Filter Cortex XSIAM playbook data
Filters extract relevant data for use elsewhere in Cortex XSIAM playbooks. For example, an issue can contain files with different types and extensions. Filter these files by extension or type, then use them in a detonation playbook.
You can filter as many objects as needed. Cortex XSIAM automatically calculates the context root for each filter. Change it only when necessary.
Caution: Changing the context data root can affect filter results. The drop-down list displays the filter root for backward compatibility.
Transform Cortex XSIAM playbook data
Transformers modify or format playbook data for further processing or presentation. For example, convert a non-Unix date to Unix format. The count transformer returns the number of elements.
When you add multiple transformers, Cortex XSIAM applies them in displayed order. Drag and drop transformers to reorder them.
Add filters and transformers to Cortex XSIAM playbook tasks
- Create or edit a playbook task.
- In the relevant field, such as inputs or outputs, click the curly brackets.
- Select Filters and Transformers.
- In Get, enter or select the data to filter or transform. For example,
EWS.Items.Name. - Optional: Add a filter.
- In Filter, click Add filter. The context root is populated automatically.
- Select the data to filter.
- Select the filter operators.
- Enter a value.
- Select the checkbox to save the filter.
- Optional: Add a transformer.
- Click Add transformer.
- Select the transformer. The default is
To upper case(String). - Select the transformer operators.
- Select the checkbox to save.
- Optional: Click Test to test the filter or transformation. Select an investigation or add one manually.
Example: Filter items with an EXE extension
In this example, we want to filter all EWS Item names that have the extension exe.
-
From the Filters & transformers window, in the Get field, type
EWS.Items.Nameto extract all Item names in EWS.The context root to filter is
EWS,Items. - In the Filter section, click Add filter.
- In the left-hand side, add
Extensionto the filter. - Select Equals (String) → ignore case.
-
In the right-hand side add
exe. - Click the tick box to save the filter.
-
Click Test.
You should see Item names are filtered with the extension
exe.
Example (advanced): Filter hostname for the last resolved time
This example returns the LastResolved time for the demisto.com hostname.
Use the following data:
{ "IP": [ { "Address": "192.168.10.96", "AutoFocus": { "Resolutions": [ { "Hostname": "79463wwfqq,dattolocal.net", "LastResolved": "2022-08-02 04:01:02" }, { "Hostname": "demisto.com", "LastResolved": "2022-09-10 09:47:17" }, { "Hostname": "securesense.call4pchelp.com", "LastResolved": "2022-04-22 11:49:06" } ] } }, { "Address": "192.168.10.96", "AutoFocus": { "Resolutions": [ { "Hostname": "79463wwfqq,dattolocal.net", "LastResolved": "2022-08-02 04:01:02" }, { "Hostname": "demisto.com", "LastResolved": "2022-09-10 09:47:17" }, { "Hostname": "securesense.call4pchelp.com", "LastResolved": "2022-04-22 11:49:06" } ] } } ] }
-
From the Filters & transformers window, in the Get field, type
IP.AutoFocus.Resolutions.LastResolve.| |
| ------------------------------------------------------------------------------------------------------------------------------------------------------------------------------------------------------------------------------------------------------------------------------------------------------------------------------------------------------------------ | -
In the Filter section, click Add filter.
Cortex XSIAM automatically calculates that the context root to filter is
IP.AutoFocus.Resolutions.| |
| --------------------------------------------------------------------------------------------------------------------------------------------------------------------------------------------------------------------------------------------------------------------------------------------------------------------------------------------------------------------- | - In the left-hand side, add
Hostnameto the filter. - Select Equals (String) → Ends with.
- In the right-hand side, add
demisto.com. -
Click the checkbox to save.
| |
| ------------------------------------------------------------------------------------------------------------------------------------------------------------------------------------------------------------------------------------------------------------------------------------------------------------------------------------------------------------------------ | -
Click Test.
| |
| ---------------------------------------------------------------------------------------------------------------------------------------------------------------------------------------------------------------------------------------------------------------------------------------------------------------------------------------------------------------------- |
Create custom filters and transformers
If you require a filter or transformer that is not provided out-of-the-box, you can create your own by creating a script and then adding to the operators window.
- Select Investigation & Response → Automation → Scripts → New Script.
- Type a meaningful name for the script, and click Save.
- To create a filter operator script, do the following:
-
In the Tags field, add the
filtertag.If you want a custom transformer that operates on an entire array rather than on each individual item, you need to add the
entirelisttag. -
In the Arguments section, add the following arguments:
Argument Description left Mark as mandatory. This argument defines the left-side value of the transformer operation. In this example, this is the value being checked if it falls within the range specified in the right-side value. right Mark as mandatory. This argument defines the right-side value of the transformer operation. In this example, this is the range to check if the left-side value is in. -
Add the script syntax and save.
-
- To create a transformer operator script, do the following:
- In the Tags field, add the
transformertag. -
In the Arguments section, add the following arguments:
Argument Description value Mark as mandatory. The value to transform. In this example, this is the UNIX epoch timestamp to convert to ISO format. - Add the script syntax and save.
- In the Tags field, add the
- Go to the filters and transformers window and select the operator.
Filter considerations, categories, and built-in filters
Use built-in Cortex XSIAM filters to define playbook automation conditions. Filters are grouped by category. Review the following considerations before defining a filter.
Cortex XSIAM playbook filter considerations
- Filters try to cast the transformed value and arguments to the appropriate type. The task fails if casting fails. For example, “a” Equals {“some”: “object”} => Error
- If the filter's left-side value expects a single item but receives a list, the filter passes if at least one item meets the requirements. For example, [“a”, “b”, “c”] Equals “b” => true.
- If the filter's left-side value expects a list but receives a single item, it converts it to a list with a single item. For example, “a” Contains “a” => True.
- Some custom filters are implemented as scripts with the
filtertag. You can find examples in the playbook automation task description. - Filters in conditional tasks do not iterate the items of the root. Instead, they fetch the left-side value and the right-side value and compare them.
Filter categories and built-in filters
When adding a playbook filter, click the default Equals (String) field. A search window opens with the available built-in filter operators. They are grouped by category as follows:
General
General filters such as Contains, Doesn’t Contain, In, and Is empty.
| Filter | Description |
|---|---|
| Contains | Tests whether the value on the left is contained in the value on the right. Can be used for any kind of object (not limited to a string). |
| Doesn't Contain | Tests whether the value on the left is NOT contained in the value on the right. Can be used for any kind of object (not limited to a string). |
| Has length of | Tests whether a list specified on the left has the number of items specified on the right. |
| In | Tests whether the value on the left is contained in the object on the right. |
| Is defined | <p>Tests whether a key on the left exists in context.</p><div data-gb-custom-block data-tag="hint" data-style="info" class="hint hint-info"><p>Is defined considers false, empty strings, and lists as defined values. To exclude these values, use Is not empty.</p></div> |
| Is empty | Tests whether the value of a key is empty. |
| Is not empty | Tests whether the value of a key is NOT empty. |
| Not defined | <p>Tests whether a key on the left does NOT exist in context.</p><div data-gb-custom-block data-tag="hint" data-style="info" class="hint hint-info"><p>Not defined considers false, empty strings, and lists as defined values. To exclude these values, use Is empty.</p></div> |
| Not in | Tests whether the value on the left is NOT contained in the object on the right. |
String
Determines the relationship between the left-side string value and the right-side string value, such as starts with, includes, and in the list. The string filter returns partial matches as True.
| Filter | Description |
|---|---|
| Doesn't end with | Tests whether the string on the left is NOT the end of the string on the right. |
| Doesn't equal | Tests whether the strings are NOT the same. |
| Doesn't include | Tests whether the string on the right is NOT a substring of the string on the left. |
| Doesn't start with | Tests whether the string on the right is NOT the beginning of the string on the left. |
| Ends with | Tests whether the string on the left is the end of the string on the right. |
| Equals | Tests whether the strings are the same. |
| Has length | Tests whether the two strings have the same length. |
| In list | Tests whether the string on the left is in the list on the right. |
| Includes | Tests whether the string on the right is a substring of the string on the left. |
| Matches - regex | Tests whether the string on the left matches the regex on the right. Uses Go-style regex. |
| Not in list | Tests whether the string on the left is NOT a substring of the string on the right. |
| Starts with | Tests whether the string on the right is the beginning of the string on the left. |
| StringContainsArray | Tests whether a substring or an array of substrings on the left is within a string array on the right. Supports single strings as well. For example, for substrings ['a', 'b', 'c'] in string 'a' the script returns true. |
Number
Determines the relationship between the left-side number value and the right-side number value, such as Equals, Greater than, and Less than.
| Filter | Description |
|---|---|
| Doesn't equal | Tests whether the number on the left does NOT equal the number on the right. |
| Equals | Tests whether the number on the left equals the number on the right. |
| Greater or equal | Tests whether the number on the left is greater than or equal to the number on the right. |
| Greater than | Tests whether the number on the left is greater than the number on the right. |
| InRange | Tests whether the number on the left is within a range specified on the right. For example, if the left value is 4, and the range on the right is 1,8, the condition is true. |
| Less or equal | Tests whether the number on the left is less than or equal to the number on the right. |
| Less than | Tests whether the number on the left is less than the number on the right. |
Date
Determines whether the left-side time value is earlier than, later than, or the same time as the right-side time value.
| Filter | Description |
|---|---|
| After | Tests whether the date on the left is after the date on the right. |
| AfterRelativeDate | Tests whether the date on the left occurred after the provided relative time (such as '6 months ago') on the right. Returns True or False. |
| Before | Tests whether the date on the left is before the date on the right. |
| Same as | Tests whether the two dates are the same. |
Boolean
Determines whether a field is true or false, or the string representation is true or false.
| Filter | Description |
|---|---|
| Is false | Tests whether the value on the left evaluates to false. |
| Is true | Tests whether the value on the left evaluates to true. |
Other
Miscellaneous filters, including CheckIfSubdomain and IsInCidrRanges.
| Filter | Description |
|---|---|
| CheckIfSubdomain | Tests whether the value on the left is a subdomain of the value on the right. |
| CIDRBiggerThanPrefix | Tests whether the CIDR prefix on the left is bigger than the defined maximum prefix on the right. |
| GreaterCidrNumAddresses | Tests whether the number of available addresses in IPv4 or IPv6 CIDR on the right is greater than the input given on the left. |
| IsInCidrRanges | Tests whether the IPv4 address on the left is contained in at least one of the comma-delimited CIDR ranges on the right. Multiple IPv4 addresses can be passed in a comma-delimited list and each address is tested. |
| IsNotInCidrRanges | Tests whether the IPv4 address on the left is NOT contained in at least one of the comma-delimited CIDR ranges on the right. Multiple IPv4 addresses can be passed in a comma-delimited list and each address is tested. |
| IsRFC1918Address | Tests whether an IPv4 address on the left is in the private RFC-1918 address space (10.0.0.0/8, 172.16.0.0/12, 192.168.0.0/16) on the right. |
| LowerCidrNumAddresses | Tests whether the number of available addresses in IPv4 or IPv6 CIDR on the right is less than the input given on the left. |
Transformer considerations, categories, and built-in transformers
Use built-in Cortex XSIAM transformers to define playbook data transformations. Transformers are grouped by category. Review the following considerations before defining a transformer.
Cortex XSIAM playbook transformer considerations
- Transformers cast transformed values and arguments to the required type. Tasks fail when casting fails. For example,
{“some”: “object”}To upper case returnsError. - Some transformers apply to each result item. For example,
a, b, cTo upper case returnsA, B, C. - Some transformers operate on the entire list. For example,
a, b, ccount returns3. - Some custom transformers are scripts with the
transformertag. Find examples in the playbook automation task description.
Transformer categories and built-in transformers
When adding a playbook transformer, select the default To upper case (String) field. A search window opens with the available built-in transformer operators.
General
Generic transformers
| Name | Description | Example |
|---|---|---|
| Unique | Returns a de-duped version of a list. | a, b, a, c, d, a, b => a, b, c, d |
| Slice | <p>Returns part of a specified list in a range of from index (included) through to index (not included)</p><p>from: Zero based index at which to begin extraction (default: 0).</p><p>to: Zero based index before which to end extraction (default: list length).</p> |
a, b, c, d from: 1, to: 3 => b, c |
| Slice by item | <p>Returns part of a list specified in a range of from item (included) through to item (not included).</p><p>from: Item from which to begin the extraction. If not specified, extracts from the beginning of the list.</p><p>to: Item before which to end the extraction. If not specified, extracts from the end of the list.</p> |
a, b, c, d from: b, to: d => b, c |
| Sort | <p>Sorts an entire list. Supports strings and numbers.</p><p>descending: true to sort in descending order, default is false.</p> |
<p>b, c, a => a, b, c</p><p>2.1, 1.2, 3.4 descending: true</p><p>=> 3.4, 2.1, 1.2</p> |
| Get index | <p>Get item at the given index.</p><p>index: Index of the item to get.</p> |
<p>b, c, a index: 0 =>b</p><p>b, c, a index -1 => nil</p> |
| Splice | <p>Adds or removes items to/from an array.</p><p>index: (required) Zero-based index at which to begin add/remove items.</p><p>deleteCount: Number of elements to remove from ‘index’, default is 0.</p><p>item: Item to add to the array after ‘index’ position.</p> |
<p>a, b, c, d,index: 1 deleteCount: 2=> a, d</p><p>a, b, c, d, index: 2 item: w</p><p>=> a, b, c, w, d</p> |
| Index of | <p>Returns the first index of the element in the array, or -1 if not found.</p><p>item: Item to locate in the array.</p><p>fromLast: true to get the index from last. (default is false).</p> |
<p>a, b, a, c, d, a, b, item: b => 1</p><p>a, b, a, c, d, a, b, item: a fromLast: true => 5</p><p>a, b, a, c, d, a, b, item: w => -1</p> |
| Get field | <p>Extracts a given field from the given object.</p><p>field: (required) The field to extract from the result</p> |
{“name”: “john”, “color”: “white”} field: “color” “white” |
| Stringify | Converts the given item to a string. | { “name”:“john”, “color”: “white” } =>‘{“name”:“john”,“color”:“white”}’ |
| Count | Returns the number of elements. | <p>b, c, a => 3</p><p>null => 0</p><p>a => 1</p> |
| Join | <p>Concatenates all elements.</p><p>separator: Specifies a string to separate each pair of adjacent elements of the array, default is an empty string.</p> |
<p>b, c, a separator: , => b,c,a</p><p>b, c, a => bca</p> |
String
String transformers
To make regex case non-sensitive, use the (?i) prefix (for example (?i)yourRegexText.
| Name | Description | Example |
|---|---|---|
| replace match | <p>Returns a string with some or all matches of a regex pattern, and replaces with a specified string.</p><p>regex: A regex pattern to be replaced by the replaceWith argument.</p><p>replaceWith: The string that replaces the string specified in the toReplace argument, default is an empty string.Detailed RegEx syntax can be found at https://github.com/google/re2/wiki/Syntax.</p> | <p>pluto,is,not,a,planet regex: “,” replaceWith: “;” =>“pluto;is;not;a;planet”</p><p>“pluto is not a planet” regex .*to replaceWith vega => vega is not a planet</p> |
| Substring | <p>Returns a subset of a string between one index and another, or through the end of the string.</p><p>from (required): An integer between 0 and the length of the string, specifying the offset into the string of the first character to include in the returned substring.</p><p>to (optional): An integer between 0 and the length of the string, which specifies the offset into the string of the first character not to include in the returned substring.</p> | pluto is not a planet from: 4 to: 10 => o is n” |
| Split | <p>Splits a string into an array of strings, using a specified delimiter string to determine where to make each split.</p><p>delimiter: Specifies the string which denotes the points at which each split should occur, default delimiter is,.</p> |
<p>hello world,bye bye world => hello world, bye bye world</p><p>hello world delimiter</p><p>=> hello, world</p> |
| Split & trim | Splits a string into an array of strings and removes whitespace from both ends of the string, using a specified delimiter string to determine where to make each split.Argumentsdelimiter: Specifies the string which denotes the points at which each split should occur (default delimiter is”,”). |
hello & world delimiter: & => hello, world |
| From string | <p>Returns a subset of a string from the first from string occurrence.</p><p>from (required): String to substring from.</p> | pluto is not a planet from: pluto is => not a planet |
| To string | <p>Returns a subset of a string until the first to string occurrence.</p><p>to (required): String to substring until.</p> | pluto is not a planet to: a planet => pluto is not |
| concat | <p>Returns a string concatenated with given prefix and suffix.</p><p>prefix: A prefix to concat to the start of the argument.</p><p>suffix: A suffix to concat to the end of the argument.</p> | <p>night prefix good => good night</p><p>night suffix shift=> night shift</p> |
Number
Number transformers
| Name | Description | Example |
|---|---|---|
| Floor | Returns the highest integer less than or equal to the number. | 1.2=> 1 |
| Ceil | Returns the lowest integer greater than or equal to the number. | 1.2 =>2 |
| Round | Returns the nearest integer, rounding half way from zero. | <p>7.68 => 8</p><p>2.43 => 2</p><p>2.5 => 3</p> |
| Absolute | Returns the absolute value of the given number. | -2 => 2 |
| Decimal precision | <p>Truncates the number of digits after the decimal point, according to the by argument.</p><p>by: Number of digits to keep after the decimal point, default is 0.</p> | 8.6666 by: 2 => 8.66 |
| Modulus (remainder) | <p>The modular operator (%) returns the division remainder.</p><p>by (required): Modulo by, default:0</p> | 20 by: 3=> 2 |
| To percent | <p>Converts a number to a percent.</p><p>withsign: Specify true to include %. Default is false</p> | <p>0.22 => 20</p><p>0.22 withsign: true =>20%</p> |
| Quadratic equation | Returns the result of the Quadratic Formula.b (required): The b number of: ax2 + bx + c = 0, default is 0.c (required): The c number of: ax2 + bx + c = 0, default is 0. | <p>1 b: 3 c: 2=> -1.00, -2.00</p><p>3 b: 2 c: 4=> (-0.333 +1.106i), (-0.333 -1.106i)</p> |
Date
Date transformers
| Name | Description | Example |
|---|---|---|
| Date to string | <p>Converts any date to a specified string format. The date input must be in ISO format. For example, 2021-10-06T13:44:07. The default output format is RFC822.</p><p>format: The desired string output format. For example, if you want to convert to RFC822 format, enter 02 Jan 06 15:04 MST.</p><p>The following are available output format options:</p><ul><li>Layout = 01/02 03:04:05PM '06 -0700 // The reference time, in numerical order</li><li>RFC3339Nano = 2006-01-02T15:04:05.999999999Z07:00</li><li>Kitchen = 3:04PM // Handy time stamps</li><li>Stamp = Jan _2 15:04:05</li><li>StampMilli = Jan _2 15:04:05.000</li><li>StampMicro = Jan _2 15:04:05.000000</li><li>StampNano = Jan _2 15:04:05.000000000</li></ul><p>This transformer is in GO language.</p> |
2021-10-06T13:44:07 => 06 Oct 21 13:44 EDT |
| Date to Unix | Converts any date to Unix format. | Mon, 02 Jan 2006 15:04:05 MST => 1136214245 |
Supported time and date formats
| Format | Example |
|---|---|
| ANSIC | Tues Jan _2 15:04:05 2019 |
| UnixDate | Tues Jan _2 15:04:05 MST 2019 |
| RubyDate | Tues Jan 02 15:04:05 -0700 2019 |
| RFC822 | 02 Jan 19 15:04 MST |
| RFC822Z | 02 Jan 19 15:04 -0700 // RFC822 with numeric zone |
| RFC850 | Tuesday, 02-Jan-19 15:04:05 MST |
| RFC1123 | Tues, 02 Jan 2019 15:04:05 MST |
| RFC1123Z | Tues, 02 Jan 2019 15:04:05 -0700 // RFC1123 with numeric zone |
| RFC3339 | 2019-01-02T15:04:05Z07:00 |
| RFC3339Nano | 2019-01-02T15:04:05.999999999Z07:00 |
| Kitchen | 3.04PM |
| Stamp | Jan _2 15:04:05 |
| StampMilli | Jan _2 15:04:05.000 |
| StampMicro | Jan _2 15:04:05.000000 |
| StampNano | Jan _2 15:04:05.000000000 |
Extend context in playbooks
Integrations do not write every command response field to Cortex XSIAM playbook context. This limits context size and stores only relevant automation data.
Extend Context saves additional data from an integration command's raw response. For example, a SIEM event command might write only selected event fields to context. Extend Context lets you save fields needed for your security workflow.
Extend Context also separates outputs when a playbook runs the same command multiple times. For example, run !ad-get-user once for a user and again for their manager. By default, both command responses use the same context key. Extend Context writes each response to a custom playbook context key.
You can extend context in a Cortex XSIAM playbook task or from the command line. First run the command with raw-response=true. This helps identify data to add.
Filter command response keys for playbook context
Use DT to select keys from a command that returns a long list of dictionaries. For example, findIndicators returns many indicator properties. Save only value and indicator_type to reduce context size.
For more information, see Cortex XSOAR Transform Language (DT).
-
Run the following command:
!findIndicators size=2 query="type:IP" raw-response=true
The response contains two dictionaries with more than 20 items each.
-
Save only
valueandindicator_typeto theFoundIndicatorscontext key:!findIndicators size=2 query="type:IP" extend-context=`FoundIndicators=.={"value": val.value, "indicator_type": val.indicator_type}` -
Save only an issue name, status, and ID to the
FoundIssuescontext key:!SearchIssuesV2 id=<ANY_ISSUE_ID> extend-context=`FoundIssues=Contents.data={"name": val.name, "status": val.status, "id": val.id}` ignore-outputs=true
Extend Cortex XSIAM context in a playbook task
- Go to the Advanced tab of the relevant playbook task, such as a Data Collection task.
-
In the Extend Context field, enter the name of the field in which you want the information to appear and the value you want to return. For example, using the
!ad-get-usercommand, entername="john" attributes=displaynameto place the user's name in thedisplayNamekey.The following image shows the result of the
!IPReuptation ip=20.8.1.5 raw-response=truecommand.To include more than one field, separate the fields with a double colon. For example:
attributes=displayName::manager=attributes.manager -
To output only the values for Extend context and ignore the standard output for the command, select the Ignore Outputs checkbox.
While this will improve performance, only the values that you request in the Extend Context field are returned. You cannot use Field Mapping as there is no output to which to map the fields.
Extend Cortex XSIAM context using the CLI
-
Run the command with
extend-context:!<commandName> <argumentName> <value> extend-context=contextKey=JsonOutputPath
For example, add user and manager fields with:
!ad-get-user=${user.manager.username} extend-context=manager=attributes.manager::attributes=displayName -
Add
ignore-output=trueto return only Extend Context values:!ad-get-user=${user.manager.username} extend-context=manager=attributes.manager::attributes=displayName ignore-output=true
Extract indicators in playbooks
In Cortex XSIAM, indicator extraction finds threat indicators in issue fields and playbook task outputs. It enriches indicators with commands and scripts for security investigations and playbook automation.
For more information about indicator extraction, see Extract and enrich an indicator.
Configure indicator extraction in a Cortex XSIAM playbook task
- Select the playbook where you want to add indicator extraction, and click Edit.
- In the playbook, click a task to open the Task Details pane.
- Click the Advanced tab.
- For Indicator Extraction mode, select the mode you want to use (default is none).
- Click OK.
Indicator extraction playbook example
The following scenario shows how indicator extraction is used in the Process Email - Generic v2 playbook to extract and enrich a very specific group of indicators.
This playbook parses the headers in the original email used in a phishing attack. It is important to parse the original email used in the phishing attack and not the email that was forwarded to ensure that you only extract the email headers from the malicious email and not the one your organization uses to report phishing attacks.
- Navigate to the Playbooks page and search for the Process Email - Generic v2 playbook.
- Click and select either Duplicate (create a copy of the playbook to edit) or Edit Playbook (detach the playbook).
-
Open the Add original email details to context task, and for the Script drop down, change the script from Set to ParseEmailFilesV2.
Under the Outputs tab, you can see all of the different data that the task extracts.
- Click the Advanced tab and set Indicator Extraction mode to
Inline. This ensures all the outputs are processed before the playbook moves ahead to the next task. - Open the Display email information in layout - Email.Headers task. This task receives the data from the saved attachment tasks and sets the various data points to context.
- Click the Advanced tab and set Indicator Extraction mode to
None, because the indicators were already extracted earlier in the Extract email artifacts and attachments task and there is no need to extract them again.
Indicator extraction modes
Indicator extraction supports the following modes:
- None: Indicators are not extracted automatically. Use this option when you do not want to further evaluate the indicators.
-
Inline: Indicators are extracted within the context that indicator extraction runs (synchronously). The findings are added to the context data. For example, if indicator extraction for a playbook task is inline, extraction occurs before the next playbook tasks run.
This configuration may delay playbook execution (issue creation).
While indicator creation is asynchronous, indicator extraction and enrichment are run synchronously. Data is placed into the issue context and is available via the context for subsequent tasks.
-
Out of band: Indicators are extracted in parallel (asynchronously) to other actions. The extracted data will be available within the issue, however, it is not available for immediate use in task inputs or outputs because the information is not available in real-time.
When using out-of-band, the extracted indicators do not appear in the context. If you want the extracted indicators to appear select inline.
- If system-wide indicator extraction is enabled, indicators are extracted according to the following rules:
- Issue creation - inline
- Issue field change - inline
- Tasks - none, can be overridden on a per task basis
- CLI - out of band, but can be overridden on a per-command basis
Troubleshoot Cortex XSIAM indicator extraction
If indicators are not extracted, check whether the indicator mode is set to none. Even if you select the relevant issue fields and the indicators to extract, if the mode is set to none, indicators do not extract.
\
Update issue fields with playbook tasks
During the investigation, you can set and update issue fields using the setIssue script in a playbook task.
You initially define issue fields after the planning stage, with mapping and classification for how the issues will be ingested from third-party integrations into Cortex XSIAM.
- The setIssue script includes all available fields; use the scroll bar to see all the fields.
- The
namefield has a limit of 600 characters. If there are more than 600 characters, you can shorten thenamefield to under 600 characters and then include the full information in a long text field such as thedescriptionfield. - There are many fields already available as part of the Common Type content pack. Before creating a new issue field, check if there is an existing field that matches your needs.
For more information, see update-issue-fields
Test your playbook
The debugger provides a test environment for troubleshooting playbooks. Change data and playbook logic, then view results in real time. You can inspect context data and extracted indicators at every step.
To open a detached system playbook, a system playbook copy, or a custom playbook, select it and click Edit.
To open an attached playbook, select it and click View. While editing a playbook, select Open sub-playbook in the task pane.
When a playbook includes identical sub-playbooks, debugger settings apply to each copy. This includes breakpoints, skips, and input or output overrides.
Settings within a loop apply every time that loop runs.
Choose test data
The debugger uses test data to execute the playbook and show expected results.
The debugger does not support parentIncidentFields.
- New Mock Issue: By default, the debugger uses an empty mock issue. Use it to test simple functionality, such as input parsing.
- Existing Issue: Select an existing issue, such as a phishing issue ingested through a mail listener. The debugger does not change the original issue or its context data.
To select an issue, open the Debugger Panel. Then select an issue in Test data. The list includes the last 50 issues, plus issues you own, joined, or participated in.
Using an existing issue does not affect the original issue or context data.
Set a breakpoint
At a breakpoint, override inputs or outputs to test execution changes. Conditional breakpoints pause only when their condition is met.
For example, pause a phishing playbook when it identifies a VIP target. If no VIP exists, execution continues. If a VIP exists, verify that the relevant task identified that member.
Breakpoints do not apply to manual tasks. Manual tasks always pause a run unless skipped. When execution reaches a breakpoint, no new tasks begin. Parallel tasks already running continue.
You can set breakpoints in parent playbooks and sub-playbooks.
-
To set a breakpoint, go to a task and click on the breakpoint button. When a breakpoint is set, the breakpoint button changes to orange.

- After a breakpoint is reached, click the task to override inputs and outputs if needed.
-
When you are finished with the task, run the debugger, and in the task, select an option for the playbook to continue.
For an automated task, you have the options Run automation now or Complete Manually. If you choose Complete Manually, click on Mark Completed for the playbook to continue.
For a task that is a sub-playbook, click Run playbook now for the playbook to continue.
For a conditional task, choose which branch the playbook should follow and click Mark Completed for the playbook to continue. The default branch is else.
When the playbook reaches a breakpoint, the task has an orange line at the top to indicate the breakpoint.
Breakpoint alerts are also displayed at the top of the playbook, enabling you to navigate between multiple breakpoints that have been reached in the playbook or sub-playbooks.
Start and stop the debugger
The debugger runs with the logged-in user's permissions. Potentially harmful commands appear in the audit trail under that user's name.
Breakpoints, skips, and overrides apply only to your session. They never change the playbook permanently. Existing test issues remain unchanged, including their context data.
Tasks still execute normally. For example, adding an item to a list adds it to the real list. Users with the required permissions can access that item.
Breakpoints pause execution before a task. While paused, the Debugger Panel shows the current context data, indicators, and task information.
Click Run to start the debugger. Click Stop to stop it and reset context data:
- For an existing issue, context resets to the original issue data.
- For a mock issue, context is cleared.
Your breakpoints, skips, and overrides remain available.
Override inputs and outputs
Override task inputs or outputs temporarily and view results in real time. Overrides apply only to your debugger view.
To retain a change permanently, cancel the override and edit the task. You can edit tasks in the debugger or through standard playbook editing.
You can add overrides before or during a run. During a run, an override applies only if execution has not reached that task. Permanent input edits apply on the next run.
You cannot use filters or transformers in overrides.
-
To override an input or output, open the task and hover over any existing input or output. Click Override Input.
- Enter a new input or output that will be used only in the debugger. For output overrides, you can enter a value, an array of values, or JSON. For input overrides, you can only enter plain text.
-
Click OK to save your changes.
The playbook task card displays a label indicating that the task input or output has been overridden.
Skip tasks
Skip tasks during testing to prevent unintended actions. For example, skip a task that closes a firewall port, deletes an email, or notifies a manager.
You can also skip tasks for integrations that are not configured. If the playbook needs task output, skip the task and override its output. When skipping a conditional task, select the branch to run after the task.
Skip a task when you need to:
- Identify whether a task causes an issue.
- Avoid tasks unrelated to troubleshooting.
- Prevent harmful actions, such as blocking a user.
- Test playbooks before configuring integrations.
How to skip a task
-
Click the ‘skip’ button for the task.
When a task is set to skip, the ‘skip’ button will be orange.
-
If the output is required for the playbook to proceed, click the task and override inputs and outputs.
View context data, indicators, and task information
While the debugger runs, select any completed task. The Debugger Panel shows its context data, extracted indicators, and task results.
You can see the results of that task in the debugger panel.
Troubleshoot playbook performance
Analyze Cortex XSIAM playbook metadata, including task inputs, outputs, storage use, and task types. Use this data to troubleshoot custom playbook performance, high CPU use, memory consumption, or disk usage.
Analyze playbook performance with XQL datasets
Use XQL to track Cortex XSIAM playbook and script performance. XQL provides execution data for debugging, queries, and dashboards. The following datasets are available:
- playbook_tasks: Data about failed tasks and tasks that were retried.
- playbook_runs: Data about playbook runs and statuses.
- scripts_and_commands_metrics: Data about scripts and commands used in playbook tasks.
Get Cortex XSIAM playbook metadata using the CLI
After an issue has been assigned to a playbook you can analyze it to see its tasks inputs/outputs storage. You can filter the data according to the KB used in each task input/output.
From the Cases & Issues → Cases page, in the Case War Room tab the following command in the CLI.
!getInvPlaybookMetaData issueId=<issue ID> minSize= <size of the data you want to return in KB. Default is 10>
To view the playbook metadata that is used in issue number 964, in the CLI type !getInvPlaybookMetaData incidentid=”964” minSize=”0”!getInvPlaybookMetaData incidentid=”964” minSize=”0”.
Use the Troubleshooting Playbooks dashboard
From the Troubleshooting Playbooks dashboard, you can view playbook and task errors, average playbook run time, and execution by status for manual and automated tasks. You can also pivot to the XQL view for more detailed data analysis.
Increase the timeout for AI prompt tasks
AI prompt tasks have a default execution timeout of 10 seconds. If an AI prompt task returns a 504 Error with the status DEADLINE_EXCEEDED, it is likely due to the task requiring more time to process than the default setting allows. To resolve this, open the Task Details pane of the AI task and select the Advanced tab, then increase the Execution timeout (seconds) value based on the complexity of the prompt and the expected length of the LLM response. For example, for complex tasks such as generating a full vulnerability report, you many need to increase the timeout from the 10 second default to 120 seconds or higher.
Manage playbook content
Manage playbook content with a remote repository
In Cortex XSIAM, you can develop and test your playbook content on development machines before using it in a production environment using the remote repository feature.
For more information about content management in Cortex XSIAM, see Cortex XSIAM development tenant.
Save versions of your playbook in Cortex XSIAM
You can save versions of a playbook as you are developing it. When you save a version of a playbook, add a meaningful comment so that you will be able to recognize the changes you made in that version at a later time. The version is saved with the name of the playbook, your commit message, an indication of what the change was (modify, insert), the date the playbook was saved, and the name of the author who last saved it. If necessary, you can access the playbook’s version history and revert your playbook to a previous version.
-
In a playbook, after making changes, click the list next to Save Playbook and then click Save version for current Playbook.\
- Enter a description of the change that was made to the current version.
- Click Update Playbook.
- To access a version of a playbook:
-
Click the icon next to New Playbook. The tooltip displays Version history for all Playbooks.
- Search for the required playbook. The description that was entered when the version was saved should help you locate the version you now require.
- Click Restore to restore the required version of the playbook.
-
Playbook editing conflict management
If multiple users simultaneously attempt to edit the same playbook, they could overwrite each other's changes in the playbook editor. To prevent users from accidentally losing their work, the playbook editor only allows the first user to edit and save. Subsequent users are automatically placed in View Mode Only, and a banner in the playbook editor clearly shows who is currently editing the playbook. The subsequent users can still view, debug, run, duplicate, and download the playbook.
Opening a playbook does not immediately lock it. A playbook is considered to be in edit mode only when a user makes a modification that causes the Save button to become available.
The playbook is automatically unlocked when the user currently editing the playbook saves the playbook, closes the editor, logs out, or when their session expires. In addition, users with playbook View/Edit and Unlock permission can click Unlock in the banner on the Playbooks page or directly in the playbook editor to force-unlock the playbook.
Manually unlocking a playbook may cause version conflicts. This turns off concurrent editing protection, and if the original user is still editing, their changes might be lost or overwritten.
The playbook Unlock permission is located under Settings → Configurations → Access Management → Roles. Edit a role and go to Investigation & Response → Automations → Playbooks. Ensure you have View/Edit permissions selected.
Accelerate playbook development using the Automation Engineer agent (preview)
Use the preview Automation Engineer agent in the Cortex XSIAM Agentic Assistant to create, update, and troubleshoot playbooks with natural language.
This feature is not enabled by default. To request access, contact Cortex Product Management.
Automation Engineer agent capabilities in Cortex XSIAM
- Creating playbooks\
Generate a functional playbook for your use case from a natural language prompt.\
Example:\
“Create a playbook that is triggered by a new network alert containing an IP address. First, run standard IP enrichment and threat intelligence lookups to triage the IP and check for associated malware. Next, add a conditional task to evaluate if the IP is marked as malicious. If it is malicious, use the mail integration to send an email to IT@palo.com containing the IP address, the alert details, and the associated malware context. If it is benign, close the incident.” - Updating playbooks\
Modify existing tasks, logic, or integrations using follow-up prompts.\
Example:- “Add error handling to this flow”
- “In the 'Is Malicious' condition, change the target email address to security-ops@palo.com.”
- Querying and explaining existing playbooks\
Ask the agent questions to understand complex playbook logic, troubleshoot specific tasks, or get AgentiX SDK guidance. You can ask questions about the logic of locked system playbooks (from content packs), though you must duplicate them to apply AI-generated modifications.\
Example:- "Explain the logic behind the conditional branch in this playbook?"
- "How do I use the AgentiX SDK to add a custom header to the outgoing email task in this workflow?"
The Automation Engineer agent is available with the Cortex Agentic Assistant, for users with playbook view/edit permissions and Interact with agent enabled.
For more information, see Agentic Assistant role-based access control.
Use the Automation Engineer agent in Cortex XSIAM
- Navigate to Investigation & Response → Automation → Playbooks.
- Create a new playbook or open an existing one to enter the Playbook Editor.
- Click the Agentic Assistant icon. The Agentic Assistant pane opens with the Automation Engineer agent automatically selected.
- In the chat interface, enter a natural language prompt describing the automation you want to build or the change you want to make.\
The agent automatically uses the active playbook as context. Any request to create, modify, or query details applies specifically to that playbook.\
Examples:\
- "Build a playbook that is triggered by a phishing alert, extracts the sender's domain, and checks its reputation using VirusTotal. If malicious, block the domain in Okta and notify the security team via Slack."\
- “Create a playbook that is triggered by a new network alert containing an IP address. First, run standard IP enrichment and threat intelligence lookups to triage the IP and check for associated malware. Next, add a conditional task to evaluate if the IP is marked as malicious. If it is malicious, use the mail integration to send an email to IT@palo.com containing the IP address, the alert details, and the associated malware context. If it is benign, close the incident.” - Click the submit arrow or press Enter to submit the prompt.\
The Agentic Assistant then displays:- The plan describing the steps the Automation Engineer agent took, including analyzing the request, retrieving relevant integrations, and generating the playbook logic.
- A playbook preview card that includes the following details:
- The playbook name.
- The playbook revision number (#).
- Playbook metadata: The number of tasks, inputs, and outputs.
- An expand icon to view the updated playbook structure visually, with the option to click Use this revision.
- The options menu ⋮ that includes Use this revision.
- Modify the revision (optional).\
You can refine the suggested workflow by providing additional instructions. For example, "Add a 10-minute delay before the Slack notification".\
If the agent cannot find a specific command or script for a task, it creates a placeholder task in the editor for you to complete manually. - Click Use this revision to push the AI-generated logic to the Playbook Editor.\
Revisions can only be applied while in Edit Mode. If you have unsaved manual changes, the system prompts you to confirm before overwriting them.
Track AI-assisted Cortex XSIAM playbook development
To help maintain visibility into which automations were created or modified by AI:
- Any playbook generated or significantly modified by the agent is automatically assigned the AI Assisted tag.
- The Agentic Assistant maintains a history of your conversation and revisions, allowing you to compare versions or revert to an earlier state.
Automation Engineer agent best practices
You don't need a perfect prompt on the first try. Use iterative feedback to fine-tune your playbook.
Example:
- "Add error handling for the VirusTotal task."
- "Change the notification channel from Slack to Microsoft Teams."
- "Ensure the playbook only triggers if the severity is High."
Automation Engineer prompt examples
The following table provides some use case scenarios and the corresponding prompts used to generate automated response playbooks within Cortex XSIAM.
| Use case scenario | Prompt |
|---|---|
| Triage IP and notify IT of malware | "Create a playbook that triggers on a new network alert containing an IP address. First, run standard IP enrichment and threat intelligence lookups to triage the IP and check for associated malware. Next, add a conditional task to evaluate if the IP is marked as malicious. If it is malicious, use the mail integration to send an email to IT@palo.com containing the IP address, the alert details, and the associated malware context. If it is benign, close the incident." |
| Verify TOR connection and retrieve Machine ID | "Create a playbook that triggers on a network alert indicating potential TOR usage. First, extract the source IP, destination IP, and user details from the alert. Verify the connection by checking if the destination IP is a known TOR exit node or if the application signature is explicitly flagged as TOR. Next, add a conditional task: if TOR usage is confirmed, retrieve the endpoint's Machine ID or hostname associated with the user. Finally, use the mail integration to send an email to IT containing the username, the confirmed TOR connection details, and the Machine ID. If it is not TOR, close the incident." |
| Evaluate and block malicious users or domains | "Create a playbook that triggers on an alert containing a username and a domain. First, run standard enrichment: check the domain's reputation using threat intelligence, and retrieve the user's risk profile or Active Directory status. Next, add a conditional task to evaluate if blocking is required based on whether the domain is flagged as malicious or the user risk score is critically high. If a block is required, use the mail integration to send an email to IT containing the user details, the suspicious domain, the threat context, and explicit instructions on whether to block the domain, suspend the user, or both. If the activity is benign, close the incident." |
| Advanced Parallel Triage: Suspicious User + Domain Activity | "Create a security-response playbook named 'Suspicious User + Domain Activity — Automated Triage'. 1. Trigger: Require 'username' and 'domain' inputs with initial validation. 2. Parallel Enrichment: Concurrently run Task A (Domain Reputation via !domain), Task B (AD Lookup via !ad-get-user), and Task C (User Risk via identity integration). Each must have error handling to assign safe defaults. 3. Logic: Use a conditional task 'Is Blocking Required?' with three branches: YES (Domain score >=70/malicious OR User risk >=80/high/critical), NO (both clean), and REVIEW (ambiguous/defaults used). 4. Actions: For YES, send email to it-security@company.com with labeled sections for User, Domain, Context, and Recommended Action (Block/Suspend/Both), then set severity to High. For NO, close as False Positive. For REVIEW, assign a manual task with a 4-hour SLA. All branches must converge to a single END node." |
Best practices for playbooks
Use these practices to build clear, efficient, and reliable playbooks.
Review them before creating workflows or optimizing existing playbooks.
Build your playbook
Use clear task names and descriptions
Describe tasks clearly for people unfamiliar with the workflow. Apply this to task names, descriptions, and the playbook description.
Users should understand the playbook by reading task names. They should not need to open every task.
| Clear | Unclear |
|---|---|
| Check if the IP is Private | IP Check |
Define inputs and outputs properly
- Group related input fields. Grouping provides context and clarifies each playbook flow.
- Use PascalCase for input names. Keep inherently capitalized terms uppercase. For example, use
EntityIDandMITRETechnique. - Define output sub-keys. When configuring playbook outputs, configure sub-keys as much as possible, do not limit configuration to only the root keys. For example, instead of outputting
File, outputFile.Name,File.Size, etc. This helps when viewing the outputs of the playbook within another playbook.
Configure task inputs correctly
Avoid Cortex XSIAM Transform Language (DT) in Get input definitions.
Use a filter or transformer for complex processing whenever possible. Use DT only when it simplifies the playbook or improves performance significantly.
Define playbook logic carefully
Avoid race conditions
Do not run multiple context-setting scripts simultaneously for the same key. This includes Set and SetAndHandleEmpty.
Concurrent writes can overwrite data. Run tasks sequentially or use scripts that append values.
Identify input sources
Confirm whether task data is As value or From Previous Tasks. The latter reads from context.
Filter inputs efficiently
Tasks take their inputs from the context, not directly from the previous tasks (even if it says from previous tasks). For an example of a task not receiving the right context, see this bug (since fixed) in a playbook:
The playbook begins by classifying the emails as internal or external. It then checks the reputation of external email addresses if any were found. That happens on the right side of the image. We expect that branch to run only if external addresses are found.
However, we did not apply a filter to the last task that gets the reputation on the right side:
This means that if both internal and external email addresses are found, we proceed with both branches (internal and external) of the playbook, and the task that gets the reputation runs without an applied filter, effectively taking all the emails we have in the inputs. The correct task input should have been:
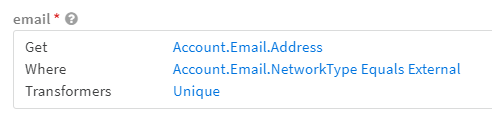
Ignore case for input names
Use the ignore-case option when possible. This avoids failures from value casing differences, such as True and true.
-
When working with two lists, if you need multiple items from list A, which are also in list B, use the
infilter instead of theequalsorcontainsfilters.Correct Method Incorrect Method <p>Get the IP addresses that are inthe list of inputs.</p><p>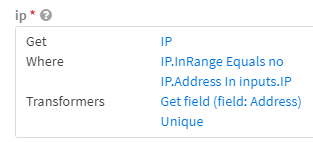 </p>
</p>Get the IP addresses where the addresses containthe list. This is incorrect because they don't contain the list, they contain individual items from it. -
Differentiate between checking if
a specific element existsversus checking ifanelement equals something. This is a common mistake that can lead to tests working in some situations, but not all.Correct Method Incorrect Method <p>Check if any objectwhere the NetworkType is Externalexists.</p><p>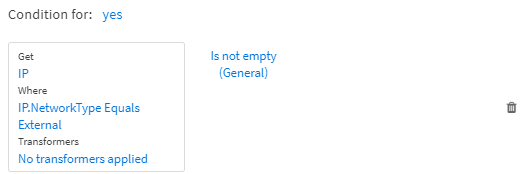 </p>
</p><p>Check if the NetworkType of the IP object is External. This is incorrect because the IP object may contain multiple IPs, some internal and some external.</p><p>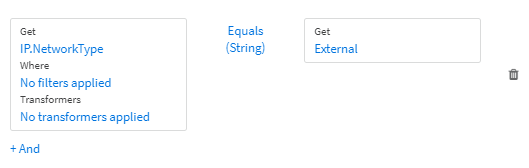 </p>
</p> -
Run
one or more tasksbased on theobject typesversus runningeither one task or the otherbased onthe type of one object.Correct Method Incorrect Method <p>Check the existence of both object types and run tasks for the types found.</p><p></p>
Define loops correctly
Use playbook loops only when actions require specific data pairs.
Optimize design and performance
Use the latest playbook and script versions
When resuming playbook work, verify that you use the latest version. Reattach detached playbooks and update them before editing.
If you retain a custom version, review release notes. Copy relevant out-of-the-box changes into your version.
Reattaching a detached playbook overwrites customizations when it updates.
Update scripts and integration commands to their current versions. A yellow triangle identifies deprecated or outdated tasks.
Break up large playbooks
If a playbook has more than thirty tasks, consider breaking the tasks into multiple sub-playbooks. Sub-playbooks can be reused, managed easily when upgrading, and they make it easier to follow the main playbook.
Sub-playbooks are playbooks that are used from within a parent playbook, as building blocks. The parent playbook is the main playbook that runs on the investigation, and each sub-playbook has a specific goal/responsibility.
- Parent playbooks usually have a
closeInvestigationtask at the end because they are the main playbook for that issue. - Parent playbooks usually contain inputs that are passed down to sub-playbooks. Certain
True/Falseflags may come from the parent playbook inputs.
Remove unused tasks
Remove tasks not connected to the workflow from production playbooks.
Run in quiet mode
Use quiet mode to reduce issue size and improve execution speed. Use it for indicator enrichment in job-based playbooks.
Extract indicators only when needed
When indicator extraction is enabled for a playbook task, the task by default tries to extract all indicator types from the task Results. (The Results entry is the information printed to the War Room, not the outputs of the task). Extracting all indicator types can slow down the playbook, so it is important to only extract indicators as needed.
For example, for the ParseEmailFilesV2 script which prints email information to the War Room, extraction should be enabled in order to extract email addresses, URLs, and other indicators. However, if your task runs the Sleep script, there is no point in extracting indicators.
Set Indicator Extraction mode to None in the task Advanced tab when extraction is unnecessary.
Use retries
Use retries when a task may temporarily fail but should later succeed. Retries help with network interruptions, service downtime, and rate limits.
Retries do not support data collection email delivery errors. They only retry automation execution failures.
Use polling
Use polling to monitor a process or condition over time. It helps playbooks wait for asynchronous tasks or required states.
Common uses include waiting for jobs to finish or systems to reach a target state.
Minimize disk, CPU, and API usage
Review the following:
- Can tasks run in parallel rather than sequentially?
- Are timeouts, search windows, and intervals realistic?
- Can one API call replace multiple calls?
- Can an integration accept arrays instead of repeated task runs?
- Is the data already available instead of being stored twice?
- Can you avoid a loop or unnecessary extraction?
Get data from XQL datasets
Use XQL to track playbook and script performance. These datasets support queries and dashboards:
playbook_tasks: Failed and retried tasks.playbook_runs: Playbook runs and statuses.scripts_and_commands_metrics: Scripts and commands used in playbook tasks.
Autonomous playbooks
The Autonomous Playbooks feature provides fully managed security automation that operates with minimal user intervention. By leveraging Palo Alto Networks' deep security knowledge, autonomous playbooks deliver highly accurate conclusions and precise logic through a new, streamlined interface that displays only the essential tasks you need to see.
This feature is enabled by default for all new tenants created on or after May 31st, 2026. If you would like to add this feature to an existing tenant, contact Customer Support.
The system automatically updates and maintains all autonomous playbooks and related automation rules, eliminating the need for your team to manually configure or manage complex playbook logic. As new autonomous playbooks and autonomous automation rules are released, the new content is automatically added to your environment.
The scope of autonomous playbooks and autonomous automation rules is Cortex Analytics issues and is currently limited to the following domains:
- Single Sign On (SSO)
- Azure
- ITDR
- Active Directory
- Active Directory Certificate Services (ADCS)
- SaaS
- Microsoft Exchange
- Google Workspace
- Windows EDR
- NDR
- MacOS EDR
- Linux EDR
- Microsoft Teams
Autonomous playbooks are limited to 100 autonomous playbooks runs per hour. If this limit is exceeded, you may experience delays in execution.
Enable autonomous playbooks
When the Autonomous Playbooks feature is enabled, new, fully managed incident response content is installed.
This feature is enabled by default for all new tenants created on or after May 31st, 2026. If you would like to add this feature to an existing tenant, contact Customer Support.
To enable or disable the Autonomous Playbooks feature, you must be an Account Admin or Instance Administrator.
To enable Autonomous Playbooks, go to Settings → Configurations → Automation → Autonomous Playbooks. After reviewing the information about autonomous playbooks, you have the option to either Replace deprecated content (replace the existing content pack) or to Keep deprecated and new content. After making your selection, click Enable.
We recommend replacing the deprecated content. If you choose to keep the deprecated content, you will see duplicate playbooks and automation rules. You can then manually delete or disable the deprecated content.
After you enable the Autonomous Playbooks feature, you can view a list of all integrations included in the autonomous playbooks. You can filter this list by integration name, configuration status: Configured, Not configured yet, Dismissed, or by category such as Investigation or Data Collection.
For non-configured integrations, you can right click on the integration name to configure or dismiss. We recommend dismissing integrations that are not relevant for your organization. For example, a playbook might include two options to create tickets in an external system and only one option is relevant for your organization.
To disable the Autonomous Playbooks feature, go to Settings → Configurations → Automation → Autonomous Playbooks, click the three dot more options icon in the upper right-hand corner, and select Disable Autonomous Playbooks.
If you disable the Autonomous Playbooks feature, all autonomous playbooks and automation rules are disabled and removed from the system and are no longer visible in the Playbooks or Automation Rules page.
If you enable the Autonomous Playbooks feature again after disabling it, any autonomous automation rules you manually disabled previously will be active and you will need to manually disable them again on the Automation Rules page. If you previously moved the autonomous automation rules block, it will return to the top of the automation rules list.
If you disable the Automation Playbooks feature, there is an option to provide feedback on your experience.
Manage autonomous playbooks
While autonomous playbooks execute complex security operations, they provide a streamlined user experience. Autonomous playbooks are automatically updated and cannot be edited, duplicated, deleted, or downloaded. You can view the high-level structure of the playbook and enable or disable it.
Autonomous playbooks appear in the Playbooks page with the autonomous playbooks  icon. You can filter the Org repository table to view only autonomous playbooks.
Autonomous playbooks do not appear in the Playbook Catalog, and you cannot execute autonomous playbooks via the command line, run them as sub-playbooks, or assign them to be triggered by custom automation rules. Autonomous playbooks are only triggered by autonomous automation rules.
To view the high-level visual structure of an autonomous playbook, click the playbook name in the Playbooks page. You can view the automation rules that trigger the playbook as well as the Potential Response, which lists the important commands and scripts. Tasks that require manual user approval have a dedicated flag  . If a command or script is associated with an automation exclusion policy, the playbook provides a direct link to the policy in the Automation Exclusion Center.
If you need to temporarily stop a specific autonomous playbook from running, you can disable it. On the Playbooks page, right-click the autonomous playbook in the Org repository table and select Disable. To turn it back on, right-click it again and select Enable.
As new autonomous playbooks related to Cortex Analytics are released, they automatically appear in the Playbooks page. By default, they are enabled.
Manage autonomous automation rules
When the Autonomous Playbooks feature is enabled, the relevant autonomous automation rules are automatically added to Cortex XSIAM and can be viewed at Investigation & Response → Automation → Automation Rules.
Autonomous automation rules are grouped together and are displayed as a collapsed block that you can expand. By default, the autonomous automation rules are placed at the end of the list of automation rules, but you can adjust the position of the block. For all automation rules, autonomous and regular, rules are evaluated in order, and only the first rule that matches the trigger conditions is executed.
You cannot edit, duplicate, or delete autonomous automation rules and you cannot delete or change the playbook assigned to the rule.
If you need to temporarily stop a specific autonomous playbook from triggering automatically, you can disable its rule. On the automation rules screen, right-click the specific rule within the autonomous block and select Disable. You can also add your own automation rules that apply the same condition but run a different playbook or Quick Action. If your custom automation rule is higher in the list than the autonomous automation rule, your rule is executed when the condition is met and the autonomous automation rule with the same condition is ignored.
As new autonomous automation rules for Cortex Analytics are released, they automatically appear in the Automation Rules pages. By default, they are enabled.
Autonomous automation rules only work with autonomous playbooks. You cannot trigger an autonomous playbook with a custom automation rule.
Work Plan for autonomous playbooks
To keep incident investigations highly focused, the system abstracts underlying conditions and background scripts. When you view an autonomous playbook in an issue's resolution tab, it opens a unique, curated Work Plan. This view presents only the executed key tasks and their defined outputs, ordered sequentially, ensuring you immediately see conclusions without the distraction of background tasks.
For tasks requiring manual intervention or approval, the Work Plan presents the step as pending user input in the resolution center in case view, providing a direct option for you to complete the task without switching pages. These manual steps also aggregate in the case's pending tab so you can manage all required user inputs centrally. When an autonomous playbook executes at the issue level and its results are incorporated into a case, the AI-generated case description and investigation plan summarize the exposed key actions and outputs. This ensures your AI-generated summaries remain concise and highly relevant.
If an error occurs on a visible task, the Work Plan shows a specific textual description, such as Failed retrieving user password. If an error happens in a background task, the system shows a general error message at the playbook level. If a playbook fails, you have the option to rerun it directly from the Work Plan. You can also provide feedback to Palo Alto Networks regarding the playbook's performance and select a proposed issue verdict.
AI Prompts
On the AI Prompts page (Investigation → Response → Automation → AI Prompts), you can view, edit, and manually create prompts.
In MSSP environments, this option is not available on the main tenant.
AI prompts role-based access control
Instance and Account admins have full control over the permissions and access that users have to AI prompts. Cortex XSIAM uses role-based access control (RBAC) to manage access to the AI prompts library, as well as access to create, edit and delete prompts in the prompts library and in the playbook editor.
By default, Instance and Account admins have full view/edit permissions enabled. When editing or creating other roles, in the CORTEX AGENTIC ASSISTANT section, you can enable AI Prompts. If you enable the feature for a role, the user can view prompts in the AI prompts library. In addition, after enabling AI Prompts, you can select the following:
| Permission | Description |
|---|---|
| Manage prompts library | When selected, the user role can create, edit, and delete prompts in the AI prompts library. |
| Manage prompts in playbook editor | When selected, the user role can create and edit AI prompts in the playbook editor. |
Use existing prompts
Using an existing prompt allows you to quickly achieve reliable results by leveraging proven, pre-built instructions instead of starting from scratch. You can access the existing prompts from the Prompts Library, a centralized repository that helps you create, search, and edit your AI prompts. It enables turning prompts into reusable assets that can be shared across your organization and bring repeatability and control to your AI operations. The Prompts Library provides a dedicated space for organizing prompts across all your playbooks or for registering them as Actions and assigning them to Agents, and is particularly useful for managing long and complex prompts.
- Navigate to Investigation & Response → Automation → AI Prompts and in the Prompts Library search for the prompt you want to use.
- Use free text in the search box to find an existing prompt. From the Basic dropdown, you can search for a prompt by Basic (name and tag), Name, or Tag.
- You can search for an exact match of the prompt name by putting quotation marks around the search text. For example, searching for
"VulnerabilityReportSummary"returns the prompt with that name. You can search for more than one exact match by including the logical operator "or" in between your search texts in quotation marks. For example, searching for"IssueSummaryAndRemediation" or "VulnerabilityReportSummary"returns the two prompts with those names. Wildcards are not supported in free text search. - You can sort the prompts in the library alphabetically, by modified date, by system, or custom, and you can filter for disabled or deprecated prompts.
-
Click Edit. If the prompt you want to use is locked, click
and then select Duplicate Prompt.System prompts are, by default, locked, which means they are not editable. To edit a system prompt, you need to make a copy.
-
Edit the prompt and settings as needed.
For details about prompt settings, see Create a prompt.
- For help writing effective prompts, see Write effective prompts.
- The Prompt Helper also provides a list of prompt writing tips, including:
Be clear and specific
Tell the AI exactly what you need.
Imagine you're asking a new team member for help – the more precise you are, the better they can assist. The same goes for our AI!
- What to do: Instead of vague questions like "Tell me about malware," try to be very specific. Think about:
- The goal: What do you want to achieve? (for example, "Summarize," "Identify," "Explain," "Generate ideas")
- The topic: What is the subject? (for example, "Phishing emails," "Vulnerability reports," "Security policies")
- Any details: What specific information is important? (for example, "From last week's incidents," "For non-technical executives," "Highlighting critical threats")
- Examples:
- Bad prompt: "Tell me about that virus ${VirusName}."
- Good prompt: "Analyze the attached malware report from ${Path} and summarize the key indicators of compromise (IOCs) for our incident response team."
Provide context and background
Give the AI the full picture.
Our AI doesn't know everything about your specific situation. Giving it background information helps it understand the "why" behind your request.
- What to do: Include relevant details that help the AI understand the situation or your specific needs.
- Role: Tell the AI to act as a specific persona (for example, "Act as a security analyst," "You are a CISO," "As a technical writer"). This helps it tailor its language and focus.
- Audience: Who is the information for? (for example, "For a technical audience," "For a board meeting," "For a general user"). This influences the complexity and depth of the response.
- Key Information: What specific data points or previous steps are relevant? (for example, "Based on the recent network scan results," "Considering the new compliance regulations").
- Examples:
- Bad prompt: "Write a report."
- Good prompt:"You are a cybersecurity consultant. Write a brief executive summary report for our CEO detailing the top three critical vulnerabilities identified in our recent penetration test report from ${Path} and suggest immediate actions."
Ask for the desired format
Guide the AI's output structure.
If you have a specific way you want the information presented, tell the AI upfront. This saves you time on reformatting.
- What to do: Clearly state how you want the AI's response to be structured.
- Lists: "Provide a bulleted list of..." or "Give me 5 key points."
- Tables: "Create a table with columns for [X], [Y], and [Z]."
- Summaries/reports: "Generate a concise summary," "Draft a formal report," or "Write a brief email."
- Length: "Keep it under 200 words," or "Provide a detailed analysis."
- Examples:
- Bad Prompt: "What are the latest threats?
- "Good Prompt: "List the top 5 emerging cyber threats relevant to financial services, with a brief explanation for each, presented as a bulleted list."
Few-shot prompting
Use few-shot prompting when you need the AI prompt to learn a new pattern or format quickly without extensive fine-tuning, especially for tasks with limited data.
- What to do: Provide several examples of the desired input and output to guide the AI's response.
-
Examples of good prompts:
"You are a SOC analyst that needs to enrich CVE ${CVEId} , use the following structure:"
Sample structures:
- CVE Description: Apache Struts 2.5.x before 2.5.14, 2.3.x before 2.3.34, and 2.x.x before 2.3.x.x.x.x allows remote attackers to execute arbitrary code via a crafted Content-Type header.
- CVSS:9.8 (Critical)Impact: Remote Code Execution (RCE), potential for complete system compromise, data theft, and denial of service. Affects web applications built with Apache Struts, widely used in enterprise environments.
- Risk Score: 10/10 - Extremely High. Exploitability is high due to public exploits and widespread usage of the affected software.
- CVE Description: Microsoft Windows MSHTML Remote Code Execution Vulnerability. This vulnerability exists in the way MSHTML engine handles specially crafted files. An attacker could host a specially crafted website or send a specially crafted document that, when opened, could allow remote code execution.
- CVSS:8.8 (High)Impact: Remote Code Execution (RCE), arbitrary code execution in the context of the current user. Affects all Windows versions. Could lead to system compromise and data exfiltration. Often exploited via phishing campaigns.
- Risk Score: 9/10 - Very High. Widespread target, often exploited through user interaction, making it a common attack vector.
-
(Recommended) Click Optimize to improve prompt edits using predefined system guidelines.
The suggested prompt replaces the existing one. You can undo the optimization if needed.
-
Save the prompt version.
- (Recommended) Click Test to validate your prompt.
-
In the Arguments section, provide values for any inputs your prompt requires. These inputs are used to simulate how the prompt will behave in a live playbook, or how the prompt as an Action for an Agent will run as part of an executed plan.
You can add input values manually.
-
Click Run.
The tests are executed in a Playground environment. Review the output generated by the AI to validate the prompt's behavior and ensure it produces the expected results. The output is typically a text summary or another structured format that you have defined.
In each run result, you can take the following actions:
Action Description Mark as note <p>Marks the entry as a note, which can help you understand why certain action was taken and assist future decisions.</p><p>When marked as a note, it is highlighted, so you can easily find it in the War Room or the Issue Overview tab.</p> View artifact in new tab Opens a new tab for the artifact. Download artifact Downloads the run details to a text file, including the AI task name,, the prompt name, user name and password, and the result. Add tags Add any relevant tags to use that help you find relevant information.
-
-
(Optional) Click and select Register new Action to register the prompt as an Action and make it available for Agents. For more information, see Manage actions.
- (Optional) Add the prompt to a playbook.
- Edit or create a playbook.
-
In the playbook editor, expand the Task Library and select AI Prompts.
The System tab contains system prompts, and the Custom tab contains custom prompts.
-
Select the relevant prompt and drag it onto the playbook editor.
The Task Details pane opens for the prompt. You can view system prompt details, and you can view and edit custom prompt details.
-
Click OK.
The prompt appears in the playbook editor.
Create a prompt
Creating a prompt turns custom requests into reusable AI prompts. Use prompts in playbooks or as Actions for Agents.
-
Navigate to Investigation & Response → Automation → AI Prompts.
-
Click + New Prompt.
-
Add an identifying name for the prompt.
-
Save the prompt.
-
Enter the prompt settings.
Basic settings
Define the basic prompt parameters.
| Parameter | Description |
|---|---|
| Name | An identifying name for the prompt. |
| Description | A meaningful description of the prompt. If you plan to register it as an action, provide as much detail as possible. For example, the Cortex - Blocklist Files action description is: “Blocklists the specified SHA256 file hashes in Cortex by adding them to Cortex's blocklist. Skips any that already exist in Cortex's allowlist or blocklist. Optionally returns detailed results with counts of added and skipped hashes.” |
| Model | Tenants in selected regions can select an AI model. Available models include Flash, Thinking, and Pro. For supported models and regions, see Frontier Models. |
| Tags | Predefined prompt identifiers. For example, use the phishing tag to organize phishing prompts. |
Advanced settings
Define settings that optimize the prompt.
| Parameter | Description |
|---|---|
| Temperature | Temperature enables customizing for pinpoint accuracy or diverse outputs by controlling the randomness of AI responses. The value must be between 0 and 2. Lower values (0-0.3) produce more focused, deterministic responses. Higher values (0.7-2) produce more creative, varied responses. You can set the value by entering a number or by adjusting the number on a slider. |
| Max Output Tokens | Max Output Tokens ensure responses adhere to specific length constraints by setting the maximum number of tokens the AI model can generate in response. Default is 2500 tokens. You can set the value by entering a number or by adjusting the number on a slider. |
- Enter the prompt in the Prompt pane.
- For help writing effective prompts, see Write effective prompts.
- The Prompt Helper also provides a list of prompt writing tips, including:
Be clear and specific
Tell the AI exactly what you need.
Imagine you're asking a new team member for help – the more precise you are, the better they can assist. The same goes for our AI!
- What to do: Instead of vague questions like "Tell me about malware," try to be very specific. Think about:
- The goal: What do you want to achieve? (for example, "Summarize," "Identify," "Explain," "Generate ideas")
- The topic: What is the subject? (for example, "Phishing emails," "Vulnerability reports," "Security policies")
- Any details: What specific information is important? (for example, "From last week's incidents," "For non-technical executives," "Highlighting critical threats")
- Examples:
- Bad prompt: "Tell me about that virus ${VirusName}."
- Good prompt: "Analyze the attached malware report from ${Path} and summarize the key indicators of compromise (IOCs) for our incident response team."
Provide context and background
Give the AI the full picture.
Our AI doesn't know everything about your specific situation. Giving it background information helps it understand the "why" behind your request.
- What to do: Include relevant details that help the AI understand the situation or your specific needs.
- Role: Tell the AI to act as a specific persona (for example, "Act as a security analyst," "You are a CISO," "As a technical writer"). This helps it tailor its language and focus.
- Audience: Who is the information for? (for example, "For a technical audience," "For a board meeting," "For a general user"). This influences the complexity and depth of the response.
- Key Information: What specific data points or previous steps are relevant? (for example, "Based on the recent network scan results," "Considering the new compliance regulations").
- Examples:
- Bad prompt: "Write a report."
- Good prompt:"You are a cybersecurity consultant. Write a brief executive summary report for our CEO detailing the top three critical vulnerabilities identified in our recent penetration test report from ${Path} and suggest immediate actions."
Ask for the desired format
Guide the AI's output structure.
If you have a specific way you want the information presented, tell the AI upfront. This saves you time on reformatting.
- What to do: Clearly state how you want the AI's response to be structured.
- Lists: "Provide a bulleted list of..." or "Give me 5 key points."
- Tables: "Create a table with columns for [X], [Y], and [Z]."
- Summaries/reports: "Generate a concise summary," "Draft a formal report," or "Write a brief email."
- Length: "Keep it under 200 words," or "Provide a detailed analysis."
- Examples:
- Bad Prompt: "What are the latest threats?
- "Good Prompt: "List the top 5 emerging cyber threats relevant to financial services, with a brief explanation for each, presented as a bulleted list."
Few-shot prompting
Use few-shot prompting when you need the AI prompt task to learn a new pattern or format quickly without extensive fine-tuning, especially for tasks with limited data.
- What to do: Provide several examples of the desired input and output to guide the AI's response.
-
Examples of good prompts:
"You are a SOC analyst that needs to enrich CVE ${CVEId} , use the following structure:"
Sample structures:
- CVE Description: Apache Struts 2.5.x before 2.5.14, 2.3.x before 2.3.34, and 2.x.x before 2.3.x.x.x.x allows remote attackers to execute arbitrary code via a crafted Content-Type header.
- CVSS:9.8 (Critical)Impact: Remote Code Execution (RCE), potential for complete system compromise, data theft, and denial of service. Affects web applications built with Apache Struts, widely used in enterprise environments.
- Risk Score: 10/10 - Extremely High. Exploitability is high due to public exploits and widespread usage of the affected software.
- CVE Description: Microsoft Windows MSHTML Remote Code Execution Vulnerability. This vulnerability exists in the way MSHTML engine handles specially crafted files. An attacker could host a specially crafted website or send a specially crafted document that, when opened, could allow remote code execution.
- CVSS:8.8 (High)Impact: Remote Code Execution (RCE), arbitrary code execution in the context of the current user. Affects all Windows versions. Could lead to system compromise and data exfiltration. Often exploited via phishing campaigns.
- Risk Score: 9/10 - Very High. Widespread target, often exploited through user interaction, making it a common attack vector.
-
Add relevant inputs.
Inputs can be set with either a context path or a specific value. You can choose whether the input is a variable using ${<input name>}.
-
Add relevant outputs:
- Context path: The issue field the task results are saved to. For example, issue.AIseverity. This enables tasks that follow to locate the correct context and use that context as input.
- Description (Optional): Description of the output.
- Type (Optional): Unknown, String, Number, Date, Boolean.
- Use Structured output (Optional)\
You can choose to Use Structured output to enforce a specific JSON structure by providing a custom JSON schema. This ensures the model's response matches your required format, allowing subsequent playbook tasks to successfully use the output. When you select Use structured output in the Outputs tab you are provided with a JSON template that you can edit or replace entirely. If your JSON includes an invalid type, an error message appears and provides a list of the correct types.
Schema rules
Available top-level keys:
- “type”
- “properties”
- “required”
- “additionalProperties”
The top-level “type” must be “object.” A nested “type” must be one of the following
- array
- boolean
- integer
- null
- number
- object
- string
-
(Optional) Click Optimize to improve the prompt using predefined system guidelines.
The suggested prompt replaces the existing one. You can undo the optimization if needed.
- (Recommended) Click Test to validate your prompt.
-
In the Arguments section, provide values for any inputs your prompt requires. These inputs are used to simulate how the prompt will behave in a live playbook, or how the prompt as an Action for an Agent will run as part of an executed plan.
You can add input values manually.
-
Click Run.
The tests are executed in a Playground environment. Review the output generated by the AI to validate the prompt's behavior and ensure it produces the expected results. The output is typically a text summary or another structured format that you have defined.
-
-
(Optional) Click the more options icon and select Register new Action to register the prompt as an Action and make it available for Agents. For more information, see Manage actions.
- (Optional) Add the prompt as an AI prompt task to a playbook.
- Edit or create a playbook.
-
In the playbook editor, expand the Task Library and select AI Prompts.
The System tab contains system AI prompt tasks, and the Custom tab contains custom AI prompt tasks.
-
Select the relevant AI prompt task and drag it onto the playbook editor.
The Task Details pane opens with the prompt appearing in the Prompt field.
-
Click OK.
The prompt appears in the playbook editor.
Write effective prompts
AI prompts enhance Cortex XSIAM playbooks with the reasoning capabilities of a Large Language Model (LLM). By adding an AI prompt, you can automate complex cognitive work such as summarizing massive raw logs, normalizing disparate data types into standard formats, and performing deep-dive threat feasibility analysis. These tasks transform raw incident data into actionable intelligence in seconds.
While highly capable at processing information, an AI prompt is a focused, single-step instruction. It is designed to work with the data already available in your issue context JSON. Unlike an autonomous AI Agent, a prompt task is not self-executing; it cannot independently browse the live internet, search for external issues, or trigger outgoing actions such as sending emails. Instead, it processes and interprets data within your playbook, generating high-quality outputs that you then use to drive subsequent automated actions and decision branches.
AI prompt capabilities and limitations
Understanding what an AI prompt can and cannot do is essential for building effective automations. While the following table provides some common examples, you can use AI prompts for various other functions as well.
| What AI Prompts can do | What AI Prompts cannot do |
|---|---|
| Summarize and report For example: Write emails or create structured reports. | Take action For example: Cannot send emails or independently search for new issues. |
| Extract and normalize For example: Pull specific data (like IOCs) from raw text. | Access the internet For example: Cannot access URLs or live websites; you must provide the content. |
| Analyze context For example: Evaluate high-severity cases or analyze threats. | Create logic For example: Cannot create conditional branches on its own; it requires a follow-up logic step. |
Best practices for prompt construction
To ensure the LLM provides reliable, accurate, and cost-effective results, use these strategies:
- Provide clear instructions: Explicitly state the task, such as extracting Indicators of Compromise (IOCs) or analyzing a post.
- Use precise context keys: To save on costs and prevent errors, map inputs to specific keys (for example,
${issue.creation_date}) instead of passing the entire issue object. - Use the optimizer: Click the Optimize button in the prompt editor to refine wording and improve consistency using research-backed logic.
Bring live data to your prompts
Connect your prompts to live playbook data to make them dynamic and contextual by doing the following.
- Weave variables inline: Add variables to your prompt text to provide context for the data, such as "Which issues were created before
${date}?" or Analyze the following post:${PostKey}. - Map to context: The placeholders appear in the Extracted Inputs list. Click the { } icon to map them to a specific existing playbook data path (for example, mapping
${PostKey}to${incident.raw_log_content}).
An AI prompt cannot create new context keys. It can only refer to existing keys. The output key is the only key an AI prompt can create. If a variable such as ${PostKey} is not mapped to existing context data, it cannot be used in the prompt.
Follow up with logic
Because an AI prompt cannot make decisions or execute tasks autonomously, it should be followed by a logic step in a playbook.
The LLM's response is always returned in a text format, even if you explicitly ask the LLM to return a structured format such as JSON. Therefore, the subsequent task in your playbook will have to parse the response to extract the relevant data.
For example, add a conditional task or parsing script immediately after the prompt to check the AI's text output. Once the response is parsed, if the AI's verdict is Malicious, the playbook can then branch to trigger a script that blocks an indicator or escalates a ticket to Critical.
Use built-in prompts
To get started quickly, you can use these out-of-the-box example prompts designed to handle common security workflows, which can be used as-is or customized to fit your specific needs.
| Prompt Name | Use Case | Prompt Text |
|---|---|---|
| Vulnerability Report Summary | Analyze scan results to prioritize remediation. | You are analyzing a vulnerability scan report For each identified vulnerability:
|
| Malware Report Summary | Transform sandbox execution logs into a structured IR report. | Analyze the following malware sandbox execution report
|
| Issue Summary and Remediation | Provide clear steps for resolving a security alert. | Provide detailed remediation steps for the security alert ${issue} in a professional, well-structured format. |
Agentic Response (Preview)
Agentic Response (preview) in Cortex XSIAM allows you to trigger AI agents directly from automation rules to handle non-linear security scenarios. While complex, highly deterministic workflows are still best suited for standard playbooks, Agentic Response is an ideal solution for less lengthy and less predictable workflows. By integrating AI intelligence directly into SOC workflows, agents can dynamically adapt to unpredictable scenarios without requiring you to program every condition. Agentic Response is effective for targeted, end-to-end flows where agents can efficiently reason through tasks, reducing the need to build and maintain highly extensive workflow configurations. This capability significantly reduces Mean Time to Resolution (MTTR) by autonomously delivering fully synthesized investigations ready for immediate analyst action, empowering analysts with expert-level XQL, hunting, and complex remediation guidance.
The Agentic Response preview feature is not enabled by default. To request access, contact Cortex Product Management.
Agentic Response use cases
- Phishing forensics (deep hunt & blast radius): Converting threat intel into XQL queries to autonomously map recipient and host connections to attacker infrastructure.
- Data exfiltration (containment & L1 remediation): Automatically pulling in relevant data points.
- Cloud misconfiguration (dynamic playbook routing): Analyzing root causes, such as unauthorized access, and dynamically choosing which specialized, pre-approved security playbook to trigger based on the findings.
Agents and prompts
The foundation of Agentic Response is defining exactly what the agent should do when the automation rule is triggered. You initiate this workflow by selecting an appropriate agent and providing it with a dedicated prompt tailored to your specific use case. Designed for rapid, fully autonomous execution, the agent runs independently to complete its tasks without requiring interactive chat or user follow-up. All of the inputs the agent needs must be provided entirely within the prompt inputs or gathered directly from the issue.
When triggered, the agent automatically ingests relevant data points from the issue, eliminating the need to manually map context fields for every run. By default, the agent can view basic details such as the issue ID, name, description, severity, and category name. If you need the agent to evaluate additional data points, you can configure them as inputs to the prompt. This allows you to create dynamic, context-aware prompts by linking placeholders directly to your existing issue fields.
Test your prompt
Since agent execution is completely autonomous, thoroughly testing the prompt is a critical step before deploying the automation rule. Testing allows you to verify that the agent's reasoning and execution plan align with your desired outcome.
Visibility, tracking, and oversight
After an agent is triggered, you can view its step-by-step reasoning, execution plan, and the full conversation directly from the Resolution tab on an issue, or from the side panel in the case Resolution Center. To ensure you maintain human-in-the-loop control over your environment, agents do not automatically execute any actions marked as sensitive. If an agent requires a sensitive action, it pauses execution and generates a pending task in the case Resolution Center, requiring an analyst to manually approve or deny the action before the agent continues.
The Issues table includes the name of the agent running on an issue, as well as the status (Running, Pending, Done, or Error). The Resolution Center for a case displays agent pending tasks, errors, and completed runs. Agent runs are logged in the War Room and also appear in audit logs.
Automation rules can trigger AI agents when issues are created that meet your specific criteria. To implement Agentic Response capabilities, Create an automation rule.
Create an automation rule
Create Cortex XSIAM automation rules
Cortex XSIAM automation rules allow users to automatically respond to events by defining trigger conditions and desired actions to perform once the condition is met. Automation rules can trigger playbooks and Quick Actions. Agentic Response, a feature that allows automation rules to trigger AI agents, is currently in preview and does not appear in your tenant by default. If you would like the Agentic Response feature enabled on your tenant, contact Customer Support.
While per-object access determines who can see, edit, or manually trigger a playbook, any automated execution (including those triggered by automation rules, jobs, or feed-triggered actions) is performed by the system. These actions are not restricted by the organizational scope or object-level access of the user who may have triggered the case. Instead, automated workflows remain governed by the defined scope and permissions of the involved integrations.
In addition to the Automation Rules feature, the XDR Automation menu item is available if you migrated from Cortex XDR 3.x to Cortex XSIAM and had rules configured in your previous environment.
- Location: These legacy rules are located under Investigation & Response → Automation → XDR Automation.
- Operational but read-only: Existing rules from your Cortex XDR 3.x environment continue to function as originally configured, but they are now read-only. You cannot edit existing legacy rules or create new rules within this section.
- Migration: We recommend transitioning your legacy automation logic to the new Automation Rules, found under Investigation & Response → Automation → Automation Rules.
- Functional difference: Legacy XDR Automation rules allowed for multiple independent actions to be assigned to a single trigger. In contrast, the new Automation Rules trigger a single Playbook or Quick Action per issue.
Rules and playbook access
When working with automation rules, consider how object-level access affects visibility and configuration:
- Role permissions for rules: To create automation rules or edit existing ones that trigger Quick Actions and playbooks, you must have Scripts and Playbooks enabled in your role (under Investigation & Response → Automations with Edit Public Playbooks selected).
- Rule visibility vs. playbook access: You can view all automation rules in the list, including those configured to trigger playbooks you do not have access to. This ensures full visibility into the order and logic of automated workflows in your environment.
- Playbook selection: While all rules are visible, you can only select a playbook to which you have at least Viewer access.
If certain options are unavailable, contact your administrator. For more information, see Manage user roles and access management.
Rule behavior and structure
- Target issues: Automation rules apply to Medium and higher severity issues. They also apply to Low severity Analytic issues and Low severity ABIOC issues that are tagged with Identity or Cloud.
- Evaluation order: Rules are evaluated in order, and only the first rule that matches the trigger conditions is executed.
- Trigger timing: Automation rules trigger only upon the initial ingestion of an issue. Subsequent updates will not re-trigger the rule, even if the issue still meets the criteria.
- Structure: The rules consist of three parts:
- WHEN: Stands for the trigger type. WHEN is set to Issue is created.
- IF: Stands for the conditions that need to be met for the rule to run.
- THEN: The automation that the user wants to execute: playbook, Quick action, or agent.
Manage automation rules
In the Automation Rules page, you can create or edit an automation rule, use recommended automation rules, edit a playbook, and change the order of priority. You can also delete or disable/enable an automation rule. When you disable an automation rule, the automation does not run for the selected condition.
You can also define the conditions that trigger a specific playbook in the playbook editor. For more information, see Playbooks.
Create or edit an automation rule to trigger a Quick Action or playbook
Create an automation rule for issues where conditions from the automation rule are met, so that the automation, whether it is a Quick Action or a playbook, automatically runs.
For example, if the IF condition is severity=critical and the Then action is the Quick Action - Create Jira Ticket, the automation rule is triggered when a critical severity issue is detected, and then the Jira ticket is created.
- Select Investigation & Response → Automation → Automation Rules.
- Click Add Automation Rule or right-click a rule, select Edit rule, or click the edit button.
- Enter a rule name.
- (Optional) Provide a short description of the rule.
- (Optional) Change the rule status. A rule can be enabled or disabled.
- Define the rule conditions:
-
For If, click Add Condition and from the Issues table, use the filter to set the criteria for the rule, and then click Save.
For example, filter the field Severity, and then select the value Critical. The Issues table returns all issues where the severity=critical.
- For Then, click Add Automation.
- If you clicked Add Agent, choose an agent from the Select Agent window. You can search for an agent or click on any of the agents shown. Hovering over an agent card shows a summary and the option to click Show agent to view the full list of actions available to the agent.
- Choose the playbook or Quick Action to which you have access from the Select Automation window. You can search for an automation or click on any of the Quick Actions and playbooks shown.
-
Quick Actions: After selecting a Quick Action, you can set action parameters. For the Create Jira Ticket Quick Action, for example, you can enter the Description, Issue Type, Project Key, and Summary.
Quick Actions, by default, run using all available integration instances that contain the command. When selecting a Quick Action for an automation rule, you can instead choose one specific integration instance to use.
For more information on Quick Actions, see Quick Actions.
-
Playbooks: Click
 to view the description and playbook preview.
If you want to use a playbook that is not part of your Org Playbooks, show Playbook Catalog for a full list of available playbooks. For more information, see Choose from existing playbooks or create your own.
The list of available playbooks is filtered based on your access; you will only see playbooks that you own, that have been shared with you, or that are marked as Public. For more information, see Access to playbooks.
-
- Click OK.
-
- Click Create.
Example
In this example, there are a number of issues created called McAfee + Zscaler - Malware Downloaded And Dropped To Disk. These issues are a result of malware, which was detected by the agent. A custom playbook runs these issues, where if action is detected by the ePO, the playbook either quarantines the machine where the malware is detected or closes the investigation if there is no action. We want to create an automation rule to automatically run the playbook when an issue is created.
- Create an automation rule called McAfee + Zscaler - Malware Downloaded And Dropped To Disk.
- Define the rule conditions.
-
In the Issues section, filter for the McAfee + Zscaler - Malware Downloaded And Dropped To Disk issues.
The next time an issue is created with the criteria, the playbook runs according to the automation rule.
The case collects issues that automatically run the custom playbook.
- Select one of the issues to see that the playbook ran (Work Plan or Case War Room).
Create or edit an automation rule to trigger an agent
This feature is currently in preview and allows you to create an automation rule that triggers an agent when certain conditions are met.
For example, if the IF condition is severity=critical and the Then action is the Case Investigation agent, the automation rule is triggered when a critical severity issue is detected, and then the agent runs using the provided prompt.
This feature is currently in preview. If you would like to have this feature enabled on your tenant, contact Cortex Product Management.
Only users with both the Edit Public Playbooks permission, located under the Playbooks component in the role configuration, and the Interact with agents permission, located under the Cortex Agentic Assistant → Agents component in the role configuration, can create automation rules that trigger agents.
- Select Investigation & Response → Automation → Automation Rules.
- Click Add Automation Rule or right-click a rule, select Edit rule, or click the edit button.
- Enter a rule name.
- (Optional) Provide a short description of the rule.
- (Optional) Change the rule status. A rule can be enabled or disabled.
- Define the rule conditions:
-
For If, click Add Condition and from the Issues table, use the filter to set the criteria for the rule, and then click Save.
For example, filter the field Severity, and then select the value Critical. The Issues table returns all issues where the severity=critical.
- For Then, click Add Agent.
-
Choose an agent from the Select Agent window. You can search for an agent or click on any of the agents shown. Hovering over an agent card shows a summary and the option to click Show agent to view the full list of actions available to the agent. Only public agents are available.
Only public agents can be selected. If you create a custom agent, it must be set as a public agent to use it in an automation rule.
- Click Next.
-
Either select a saved prompt from the prompt library or write a new prompt. You can edit a prompt from the prompt library but you cannot save the changes you make to the prompt library. Any edits are only applied to this automation rule.
For more information on writing prompts, see Create a prompt.
- Click Test Prompt.
- There are two options to load data for the test.
-
Select issue to select an existing issue to use as sample data. You can switch between existing issues by clicking Change issue.
To avoid making real world changes in third-party systems, we recommend expanding the Test Data field and clicking Edit to manually change the sample data. When you run the test, third-party actions are executed. For example, if the prompt leads the agent to create a Jira issue as part of the test, an actual Jira issue will be created.
-
Expand the Test Data section and click Edit to manually enter sample issue data.
-
- Use the Agentic Assistant to Run test.
- Expand the Plan and scroll down if needed to view all steps and the outcome for full visibility into step-by-step reasoning, step outputs, artifacts, prompts, and execution plans.
- (Optional) If the plan execution does not match your requirements, you can select a different prompt from the prompt library or edit the prompt or prompt input(s) as needed, and then Run test again. Note that there is no chat history saved and you cannot view the output of previous tests.
- Click Add to rule.
-
- Click Create.
- When automation rules trigger agents, there is a limited number of parallel agentic chats. If this limit is reached, there may be delays in execution, but all rules are still applied and agents are still triggered.
- If the agent tries to execute an action that is marked as sensitive and requires manual approval, the pending task shows in the Resolution Center and must be approved or denied for the agent to continue.
- Agent runs are logged in the War Room and appear in the
agentix_agents_actionsdataset. - If LLM capabilities are disabled in your tenant, the option to create automation rules to trigger agents is not available. If you have automation rules that trigger agents and then disable LLM capabilities, the rule will fail. If you have LLM capabilities disabled in your tenant, we recommend disabling any automation rule that uses an agent or changing to a Quick Action or playbook.
- If an agent is disabled in the Agents Hub and was used as part of an automation rule, the rule will fail. The Automation Rules table will display Agent Disabled in the Automation column.
Add a recommended automation rule
You can add automation rules recommended by Cortex XSIAM.
- Select Investigation & Response → Automation → Automation Rules.
- Click View Recommendations.
-
In the Automation Rule Recommendations table, view and select the required recommended automation rules to add to the Automation Rules table.
For playbooks, you can click the playbook name to preview. For Quick Actions, you can view the description and available parameters.
- Click Add Selected rules.
- Verify the order of the automation rule and change the order (if required),
- Save the changes to the Automation Rules table.
After you create an automation rule, the rule is added to the Automation Rules table. In the Automation Rules table, you can do the following:
-
Set the priority of the automation rules, so when an issue is created, the first rule takes priority, then the second, third, etc. Only the first matching rule is executed.
New rules created manually are added to the bottom of the table.
-
View details of the automation rules that have been created.
By default, you can see the condition, automation, and the creation dates and source. You can add columns and filters as required. To edit, disable, or delete an automation rule, right-click on the rule.
Scope-based access control for automation rules
Automation rules support SBAC (scope-based access control). The following parameters are considered when editing a rule:
- If Scope-Based Access Control (SBAC) is enabled and Endpoint Scoping Mode is set to restrictive mode, you can edit an automation rule if you are scoped to all tags in the rule.
- If Scope-Based Access Control (SBAC) is enabled and Endpoint Scoping Mode is set to permissive mode, you can edit an automation rule if you are scoped to at least one tag listed in the rule.
- As a scoped user who has editing permissions to a rule, you can change the order among other rules that are locked.
- If a rule was added when set to restrictive mode, and then changed to permissive (or vice versa), you will only have view permissions.
Scripts
Automation scripts are individual code entities used to perform specific actions within a playbook or as standalone commands in the CLI. On the Scripts page (Investigation & Response → Automation → Scripts), you can view, edit, and create scripts in JavaScript, Python, or PowerShell.
When creating a script, you can access all APIs, including cases and investigations, and share data in the War Room. Scripts can receive and access arguments and can be password-protected.
Prerequisite\
To work with scripts, an administrator must configure your user role with specific RBAC permissions.
- Permissions must be enabled in the following order:
- Scripts: This component (under Investigation & Response → Automations) must be set to Enabled first. It is the foundational permission for all automation; if Scripts are not enabled, you cannot configure Playbooks or Cases and Issues. Role-level permissions determine your ability to create new scripts or edit those marked as Public. For detailed information on the access model, see Access to scripts.
- Playbooks: Once Scripts are enabled, you can set Playbooks (under Investigation & Response → Automations) to Enabled.
- Cases and Issues: Finally, you can set Cases and Issues (under Cases & Issues) to View or View/Edit. This is required to view the results of scripts executed within an investigation.
- Credentials: To develop or execute scripts that interact with external services via stored secrets, your user role must have a minimum of View permissions for Credentials. If set to None, the system blocks scripts from fetching authentication data from the credential store.
- Execution failure: Any Python SDK command or JavaScript equivalent used to retrieve a secret will return an unauthorized error or an empty result during execution.
- Development impact: You will be unable to select or reference stored credentials when testing scripts in the Playground if your role is restricted.
- Restricting script access: To completely restrict script access, first set the RBAC permissions for Playbooks to Disabled and Playground to None, and then set the Scripts permission to Disabled.
Automation Engineer agent
Use the AI-powered Automation Engineer agent to simplify Python script creation and management through an intuitive, interactive experience. It enables you to generate, modify, and query automation scripts with the Cortex Agentic Assistant natural language chat prompt. For example, within the chat, you can ask the agent to explain the specific script currently open or pose general technical questions regarding script logic and the AgentiX SDK.
For more details about using the Automation Engineer agent, see Accelerate script development using the Automation Engineer agent.
The Automation Engineer agent is available when the Agentic Assistant feature is enabled, for users with script editing permissions. For more information, see Cortex Agentic Assistant and Cortex Agentic Assistant permissions.
Access to scripts
Access to scripts is managed at the object level, ensuring that custom automation code and sensitive logic are restricted to authorized users. For a complete description of how object-level access affects script visibility and execution across Cortex XSIAM, see Manage access to playbooks and scripts.
Script access roles
When a script is shared, users are assigned one of the following levels:
- Owner: Full control over the script and its permissions.
- Editor: Can view and modify the script code and settings.
- Viewer: Can view the code and use the script in playbooks or the CLI but cannot make changes.
Use existing scripts
Using or modifying an existing script enables you to quickly leverage proven functionality and save significant time and effort developing a new script from scratch.
For example, you can use scripts from the Base and Common Scripts content packs that provide basic and reusable functions that can streamline your playbook development.
Common scripts
Filter and sort the table
Use the filter bar at the top of the Secrets table to narrow results by any filterable column. Common filtering strategies include:
By severity: Filter to Critical and High severity to focus on the most impactful secrets exposures
By secret type: Filter to a specific secret type (such as AWS Access Key) to scope remediation to a single credential category
-
By branch: Filter to the main or production branch to focus on secrets that affect production-bound code
By resolution status: Filter to New to identify untriaged secrets issues, or to In Progress to monitor active remediation
By secret validation: Filter to Valid or Privileged to identify confirmed active credentials that require immediate revocation
You can copy the script and add new functions/variables, or add your functions to the CommonUserServer script. You can also use your scripts to override the existing scripts in the CommonServer script.
-
CommonServerPython
The CommonServerPython script contains Python functions that can be used when writing your scripts and integrations.
The script contains over 400 functions, such as
appendContext,vtCountPositives(which counts the number of detected URLs in the War Room entry), anddatetime_to_string, (which converts a DateTime object into a string).You can copy the script and add new functions/variables, or add your functions to the CommonServerUserPython script. You can also use your scripts to override the existing scripts in the CommonServerPython script.
-
CommonServerPowerShell
The CommonServerPowerShell script contains PowerShell arguments/functions that can be used when writing your scripts and integrations.
The script contains many arguments/functions, such as
SetIntegrationContext,Write-HostToLog(which writes to the demisto.log), andReturnOutputs(which returns results to the user more intuitively).You can copy the script and add new arguments/functions or add your own to the CommonServerUserPowerShell script. You can also use your scripts to override the existing scripts in the CommonServerPowerShell script.
- Navigate to Investigation & Response → Automation → Scripts and in the Scripts Library search for the script you want to use.
- Use the free text in the search box to find an existing script. From the search drop-down, you can:
- Perform a basic search by Basic (name and tag), Name, or Tag.
- Perform an advanced search for specific words In Script or Everywhere (including the script name and tags).
- You can search for an exact match of the script name by putting quotation marks around the search text. For example, searching for
"AddKeyToList"returns the script with that name. You can search for more than one exact match by including the logical operator "or" in between your search texts in quotation marks. For example, searching for"AnalyzeTimestampIntervals" or "AddKeyToList"returns the two scripts with those names. Wildcards are not supported in free text search. - You can sort the scripts in the library alphabetically, by modified date, by system, or custom, and you can filter for disabled or deprecated scripts.
- The Script Helper also provides a list of available alphabetically ordered commands and scripts.
- Use the free text in the search box to find an existing script. From the search drop-down, you can:
-
Click Edit. If the script you want to use is locked, you first need to duplicate it.
If a script is installed from a content pack, by default, the script is locked, which means that it is not editable.
-
In the Agentic Assistant pane, start a conversation with the Automation Engineer agent to edit the script, or manually edit the script code and define the script settings.
For more information, see Automation Engineer for scripts. For details about script settings, see Create a script.
- Save the script version.
- (Recommended) Validate your script.
- Click Test.
-
In the Arguments section, provide values for any inputs your prompt requires. These inputs are used to simulate how the script will behave in a live playbook, or how the script registered as an Action and assigned to an Agent will run as part of an executed plan.
You can add input values manually.
-
Click Run.
The scripts are executed in the Playground. Review the script's output to validate its behavior and ensure it produces the expected results. The output is typically a text summary or another structured format that you have defined.
In each run result, you can take the following actions:
Action Description Edit Edit the entry, mark it as a note, preview it, or delete it. Mark as note <p>Marks the entry as a note, which can help you understand why certain action was taken and assist future decisions.</p><p>When marked as a note, it is highlighted, so you can easily find it in the War Room or the Issue Overview tab.</p> View artifact in new tab Opens a new tab for the artifact. Add tags Add any relevant tags to use that help you find relevant information.
- (Optional) Click next to the Edit button, then select Register new Action to register the script as an action and make it available to agents. For more information, see Manage actions.
Create a script
Create Cortex XSIAM scripts
Creating custom scripts in Cortex XSIAM helps meet your organization’s specific needs to automate repetitive tasks, streamline security operations, and make case response more efficient.
- Navigate to Investigation & Response → Automation → Scripts and click New Script.
- Add an identifying name for the script.
- Click Save.
-
In the Agentic Assistant pane, start a conversation with the Automation Engineer agent to create the script, or manually create the script code and define the script settings.
For more information, see Automation Engineer for scripts. For details about script settings, see script settings below.
- Save the script version.
- (Recommended) Click Test to validate your script.
-
In the Arguments section, provide values for any inputs your prompt requires. These inputs are used to simulate how the script will behave in a live playbook, or how the script registered as an Action and assigned to an Agent will run as part of an executed plan.
You can add input values manually.
-
Click Run.
The tests are executed in a Playground environment. Review the output generated by the AI to validate the script's behavior and ensure it produces the expected results. The output is typically a text summary or another structured format that you have defined.
If there is an error, you can copy the error message from the test result into the Agentic Assistant prompt and ask the Automation Engineer agent to correct the error.
In each run result, you can take the following actions:
Action Description Mark as note <p>Marks the entry as a note, which can help you understand why certain action was taken and assist future decisions.</p><p>When marked as a note, it is highlighted, so you can easily find it in the War Room or the Issue Overview tab.</p> View artifact in new tab Opens a new tab for the artifact. Download artifact Downloads the run details to a text file, including the AI task name,, the script name, user name and password, and the result. Add tags Add any relevant tags to use that help you find relevant information.
-
- (Optional) Click and select Register new Action to register the script as an Action. For more information, see Manage actions.
- You can enable/disable a script in the Settings without having to duplicate the script.
- You can view recently modified or deleted scripts by clicking the version history for all scripts .
Configure Cortex XSIAM script settings
Basic script settings
Define the relevant Basic script parameters.
Important
Role-Based access: Your ability to configure or test scripts that use stored credentials depends on your role's Credentials permission. If set to None, you cannot reference pre-saved secrets during configuration or testing. For more information, see Credentials permissions.
| Parameter | Description |
|---|---|
| Name | An identifying name for the script. |
| Language type | <p>Select the script language type.</p><div data-gb-custom-block data-tag="hint" data-style="info" class="hint hint-info"><p>Important</p><p>If you choose Python, from the Agentic Assistant you can use the Automation Engineer agent.</p></div> |
| Description | A meaningful description of the script. |
| Tags | <p>Predefined script identifiers.</p><p>For example, if a script is intended for phishing, tagging it with the phishing tag helps organize, classify, and manage the script among other scripts.</p><p>Organizations can also implement policies or restrictions based on tags associated with scripts. For example, they may restrict certain users from accessing or executing a script tagged for phishing.</p> |
| Enabled | Whether the script is available for playbook tasks and indicator types, or to run in the CLI. |
Arguments
You can create, edit, or delete arguments as required.
| Parameter | Description |
|---|---|
| Argument | An identifying name. |
| Mandatory | Makes the argument mandatory. |
| Default | Makes the argument the default. |
| Sensitive | <p>Hides the argument from being displayed in the UI and in logs.</p><ul><li>Authentication (Type 9) Arguments: For scripts that use credential-type arguments, users with the Credentials permission set to None will see the message Credentials are locked by admin and will be unable to select pre-saved secrets from the UI dropdown. For more information, see Credentials permissions.</li></ul> |
| Description | A meaningful description of the argument. |
| Default | The default value for the argument. |
| Is array | Specifies that the argument is an array. |
| List options | A comma-separated list of argument values. |
You can create, edit, or delete outputs as required. Define the outputs according to types such as string, number, date, and Boolean. For more information, see Context and Outputs.
| Parameter | Description |
|---|---|
| Context Path | A dot-notation representation of the path to access the Context. For example, ThreatStream.Analysis.ReportID. |
| Description | A short description of what the context path represents. For example, the ID of the report submitted to the sandbox. |
| Type | The value type of the context path, such as string, number, and date, enables Cortex XSIAM to format the data correctly. |
Script permissions
| Parameter | Description |
|---|---|
| Password Protect | Enables you to add a password for the script, which will be required when running the script from the CLI. |
Advanced
| Parameter | Description |
|---|---|
| Timeout (seconds) | Time (in seconds) before the script times out. Default is 180. |
| Docker image name | <p>For Python scripts, this is the name of the Docker image to use for the script.</p><p>Cortex XSIAM supports the following Python versions:</p><ul><li>2.7</li><li>3.0 and later</li></ul><p>You can change the Docker image.</p><p>The default Docker image that Cortex XSIAM uses is demisto/python3, but you can use other Docker images.</p> |
| Run on a separate container | Runs the script on a separate container. |
Depends on commands
You can set the commands that the script depends on directly from these settings. You still have the option to set the dependencies in the script YAML file.
Edit Cortex XSIAM script code
Edit existing code or create new code
Modify parameters, logic, or integrations within a script to adapt it to specific use cases, optimize performance, and address evolving security needs without starting from scratch.
The Script Helper provides a list of available alphabetically ordered commands and scripts.
Accelerate script development using the Automation Engineer agent
The Automation Engineer agent is a conversational AI that simplifies Python script creation and management through an intuitive, interactive experience. It enables you to generate, query, iterate, and refine automation scripts with the Agentic Assistant natural language chat prompt.
Automation Engineer agent scripting capabilities include:
-
Initial code generation: Generate a full script from a simple prompt. For example, "Generate a script to change the verdict of a given indicator based on user input, including documentation notes and debug messages."
The agent uses security best practices and Agentic SDK to generate tailor-made Python scripts.
- Existing script modification: For example, “Add a check to ensure the indicator exists before proceeding with the verdict change, and return an error if it does not.”
- Iterative bug fixing: For example, "Provide specific error messages for the agent to analyze and automatically repair."
- API compatibility updates: For example, "Detect and replace deprecated API calls across an entire script."
- Logic simplification: Ask the agent to refactor complex code to be more readable or to remove redundant conditionals for simple lookups.
- Script explanation: Ask the agent questions about system or custom scripts, including asking how the script works. You can ask the agent to explain the specific script currently open or pose general technical questions regarding script logic and the Agentic SDK.
- Input and error validation: Enhance script robustness by asking the agent to add specific try/except blocks or validate that inputs like username are not empty.
- SDK and command guidance: Ask the agent for technical details on using the Agentic SDK or the proper syntax for running commands within a script.
When you download or update content packs, the new or updated scripts are immediately ready for the Automation Engineer agent to recommend and use.
The Automation Engineer agent is available with the Cortex Agentic Assistant for users with script editing permissions. For more information, see Cortex Agentic Assistant and Agentic Assistant role-based access control.
Use the free text search to find scripts by name, tag, script content, or all fields. Use quotation marks for exact script-name matches. Wildcards are not supported.
How to use the Automation Engineer agent
-
From the Investigation & Response → Automation → Scripts page, either choose an existing script or create a new script.
For a new script
- Click + New Script, give the script a name, and click Save.
- Click
 . The Agentic Assistant pane opens with the Automation Engineer agent automatically selected.
For an existing script
- In the Scripts Library, search for the script you want to use.
- Click Edit. The Agentic Assistant pane automatically opens with the Automation Engineer agent selected.\
If a script is installed from a content pack, by default, the script is locked, which means that it is not editable. To edit a system script, you first need to duplicate it.
If you are in the middle of a chat with a different agent, you are prompted to start a new chat with the Automation Engineer agent.
If you start a chat with one script and switch to another script, you are prompted to start a new chat.
-
In the Agentic Assistant pane, enter a natural language prompt describing what you need the agent to do, including:
- Explain what the script does.
- Fix code errors: If there are errors in the script code, you can ask the Automation Engineer agent to suggest a correction.
- Add documentation notes to the script: Ask to include explanations and inline comments.
-
Add arguments to the script: Define the inputs your script should accept. Each argument should include a name, type, whether it is required, and optionally a default value.
Examples:
days — number, optional, default: 3email — string, required,email="soc@company.com
- Add outputs to the script: Describe what the script should return to the context, for example,
recentIncidentsSummary — string, a human-readable summary of incidents. - Include debug logging: Request to include contextual log messages in the script.
- Include error handling: Ask to include try/except blocks with informative error logs.
Use detailed prompts, for example, Get failed logins from last 24 hours and return as a table.
Clearly define argument names, types, and default values.
Mention if you expect the output in a specific format, such as a table, JSON, or plain text.
Example:\
The following are sample prompts
Fetch all open incidents from the last 3 days. Generate a summary table with ID, name, and severity. Email the summary to the given address. Arguments: - days (number, default: 3) - email (string, required) Output: - incidentsSummary (string): a human-readable table of incident details Explain what this script does How do I use the SDK to execute a search command? I got this error: <KeyError>: <userId>. Fix it.
3. Click or Enter to submit the prompt.\
The Agentic Assistant then displays:
- The plan describes the steps the Automation Engineer agent took.
- A script preview card that includes the following details:
The first line of the generated script indicates it was generated by Cortex XSIAM, with the date and time of the latest update.
4. Use natural language in the prompt to modify the generated script as needed.\
Example\
For the script generated from the sample prompt above, enter the following modification to add sorting:
``` Modify the sorting behavior so that all 1s (threats) come before all 0s (safe events). Keep the rest of the script structure the same. 1 / 1 ```
If you make manual edits in the script and don't save the changes, and then modify the script with the Automation Engineer agent, you are prompted to confirm that you're overwriting the manual edits.
-
(Optional) Access an earlier script revision by clicking and then Use this revision on the script preview card of the revision you want to use.
-
Continue modifying and submitting prompts until the script works as intended.
-
For a new script, click Save Version. For an existing script that was edited, click Use this revision and then Save Version.
-
(Recommended) Validate your script.
- Click Test.
-
In the Arguments section, provide values for any inputs your prompt requires. These inputs are used to simulate how the script will behave in a live playbook, or how the script registered as an Action and assigned to an Agent will run as part of an executed plan.
You can add input values manually.
-
Click Run.
The scripts are executed in the Playground. Review the output generated by the script to validate its behavior and ensure it produces the expected results. The output is typically a text summary or another structured format that you have defined.
If there is an error, you can copy the error message from the test result into the Agentic Assistant prompt and ask the Automation Engineer agent to correct the error.
In each run result, you can take the following actions:
Action Description Edit Edit the entry, mark it as a note, preview it, or delete it. Mark as note <p>Marks the entry as a note, which can help you understand why certain action was taken and assist future decisions.</p><p>When marked as a note, it is highlighted, so you can easily find it in the War Room or the Issue Overview tab.</p> View artifact in new tab Opens a new tab for the artifact. Add tags Add any relevant tags to use that help you find relevant information.
Change the Docker image in an integration or script
Docker enables you to run scripts and integrations from an image in a controlled environment that isolates and safeguards the tenant. It also simplifies environment setup by packaging dependencies and configurations within an image, ensuring consistent execution across different systems. By default, Cortex XSIAM pulls images from the Demisto Docker image registry in GitHub, which are used in scripts and integrations as needed. Cortex XSIAM integrations and scripts have the relevant Docker image already selected. For example, the Rasterize integration uses the demisto/python.3.3.11.9.1079 Docker image.
You may want to select a different Docker image for your integration or script. In Cortex XSIAM, you can select a different Docker image from a dropdown that is pulled from the Demisto Docker image registry. In GitHub, the dockerfiles-info branch contains information about each image to help you find one that is relevant.
You can access publicly available Docker images from the Cortex XSIAM tenant even if there is no external connection to the Demisto registry, for example, if due to firewall constraints, your engine cannot access the Demisto registry.
- Edit the script.
-
Under ADVANCED, in the Docker image name field, click X to clear the current selection and then select a Docker image name from the dropdown menu.
For more information about changing the Docker image for a script, see the Advanced tab in Create a script.
- Save your changes.
Change the Docker image for an integration
-
Navigate to Settings → Data Sources & Integrations, find and select your integration and edit the integration’s source.
For an out-of-the-box content pack integration, you first need to duplicate the integration to edit it.
- In the Integration Settings, expand the Script section.
-
Click X to clear the current selection and select a Docker image name from the dropdown menu.
For more information about changing the Docker image, see the Advanced tab in Create a script.
- Save your changes.
Context data
Context data is a map (dictionary) that stores structured data related to an issue, including issue fields and automations data. You can use context data to pass information between playbook tasks and to create scripts that map data to case and issue fields.
Issue context data
When an issue is generated, context data is captured from the issue fields and from any automations, such as commands, playbooks, correlation rules, and scripts. Context data includes keys (strings) and values (numbers, maps, arrays, and strings).
To see context data for an issue, open the issue card and click the Issue Context Data icon .
.
Consider the following information when working with context data:
- When an issue is created, the issue field data is stored under the
issuekey in the context data. When an investigation is opened and commands are run, the data returned from those commands is stored outside of the mainissuekey. - Issue context data is split into two tabs. The Issue tab contains the context data from the issue fields and the commands run on the issue. The Case tab contains the parent case fields and other case data. None of this data is added to the context data for the parent case unless you add it.
- You can add keys and values to the context data. This is useful when developing playbooks and other automations. For more information, see Add context data to an issue.
- When running automations on an issue, the issue can access context data from its parent case; however, it cannot access context data from other issues. If you want to use context data from other issues, add it to the parent case.
Case context data
Context data is written to issues and not to cases. Therefore, the case context might be empty unless you previously added context data to the case.
To see context data for a case, open a case, click the Actions menu and select View context data.
Adding context data from issues to a parent case can help you with the following tasks:
-
Remediation: You can add context data from an issue, such as the issue status, actions, or ID, to its parent case's context data. This allows other playbooks to use the parent case context.
For example, if you have multiple issues in a case, you can add context data from each of the issues to the parent case. You can then use the case context data in playbooks and avoid running duplicate actions on the issues.
- Case assignment: You can see if an analyst has been assigned to the case or other issues.
- Insights at the case level: For automation engineers, you can set responses based on characteristics in the case.
For more information, see Add context data to a case.
Search context data
You can use Query to search within the context data JSON for specific items and expand nested keys. Open the context data panel for an issue or case, as explained in Issue context data or Case context data, and type in the Search field.
Example context:
{ "HelloWorld": { "Alerts": [ { "name": "Example 1", "alert_status": "ACTIVE" }, { "name": "Example 2", "alert_status": "CLOSED" }, { "name": "Example 3", "alert_status": "ACTIVE" } ] } }
Search examples:
${c}finds the value of the object c.${HelloWorld.Alert(val.name == 'Example 1')}shows the full object for the alert named "Example 1", as stored in the context data.${HelloWorld.Alert(val.alert_status === "ACTIVE")}shows the full object for all alerts in context with status "ACTIVE".${HelloWorld.Alert(val.alert_status == 'ACTIVE').name}fetches the HelloWorld.Alert.name of all alerts in context with status "ACTIVE".
Add context data to an issue
You can add keys and values to an issue's context data to be used in playbooks or other automations.
To add context data to an issue, run the Set command in CLI, in a script, or in a playbook task. The Set command enables you to set a value under a specific key. For more information about the Set command, see Set.
Use the CLI
Run the !Set command in the issue War Room.
- Open an issue and select the War Room tab.
-
Run the
!Setcommand.Example
The following example adds the key and value
hello:worldto the issue context data.!set key="hello" value="world"
Use a script
In the JSON file, add Set to the demisto.executeCommand key.
Example
The following example adds the key and value hello:world to the issue context data.
demisto.executeCommand("Set", {"key":"hello", "value":"world"})
Use a playbook
Use the Set script in a standard task.
Example
An issue's context data contains the following values:
{ "Account": { "firstName": "Bob", "lastName": "Jones", } }
For an automation, you need to use the full name value. You can use the Set script to add an new fullName value to the JSON:
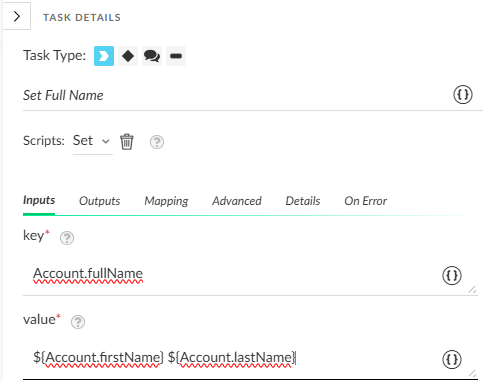
Result:
{ "Account": { "firstName": "Bob", "fullName": "Bob Jones" "lastName": "Jones", } }
Add context data to a case
You can add keys and values to a case's context data to be used in playbooks or other automations. By default, context data is added to cases only. To run automations on a case, add context data to the case from its related issues.
To add context data to a case, run the setParentIncidentContext command in the CLI, in a script, or in a playbook task.
Use the CLI
Run the !setParentIncidentContext command in the issue War Room or the Case War Room.
If you run the command in the issue War Room, the data is added to the following places:
- The case context data.
- The issue context data under the case tab.
If you run the command in the Case War Room, the data is added to the case context data only.
Run the command in the issue War Room
- Open an issue and select the War Room tab.
-
Run the
!setParentIncidentContextcommand.The following example adds the key and value
hello:worldto the case and issue context data.!setParentIncidentContext key="hello" value="world"
Run the command in the case War Room
- Open a case and switch to the Detailed view.
- Select the Case War Room tab.
-
Run the
!setParentIncidentContextcommand.The following example adds the key and value
hello:worldto the case context data.!setParentIncidentContext key="hello" value="world"
Use a script
In any script that runs in an issue, the data is written to the issue context data. If you want to add the data to the case context from your script, run the setParentIncidentContext using the demisto.executeCommand key, as follows:
demisto.executeCommand("setParentIncidentContext", {"key":"<key>", "value":"<value>"})
The following example creates a new key name AuditID with a 90210 value to your script.
demisto.executeCommand("setParentIncidentContext", {"key":"AuditID", "value":"90210"})
Use a playbook
When a playbook runs, the playbook data is written to the issue context data. To write the data to the parent case context data, use the setParentIncidentContext script in a standard task.
The following example adds the TicketID to the case context. To see a full use case that includes this standard task, see Use context data in a playbook.
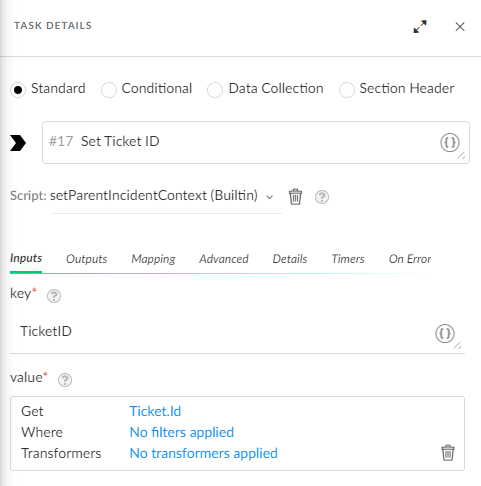
Delete context data from a case
Run the !deleteParentIncidentContext command to delete all context data or a specific key in the Case War Room or issue War Room.
Use the issue War Room
- Open an issue and select the War Room tab.
- Run the
!deleteParentIncidentContextcommand.
Use the case War Room
- Open a case and switch to the Detailed View.
- Select the Case War Room tab.
- Run the
!deleteParentIncidentContextcommand.
The following example deletes the key and value hello:world from the case or issue context.
!deleteParentIncidentContext key="hello" value="world"
Use context data in a playbook
In Cortex XSIAM you can use context data (from an issue or case) in playbooks, and you can use playbook tasks to update context data. You can:
- Use the information stored in the issue context data as task inputs and outputs in a playbook.
-
To access data that is stored in the issue context data, use the keyword
issue.Example:
To access the
statusvalue in the issue context data, use the following syntax:${issue.status} -
To access data that is stored in the parent case context data, use the keyword
parentIncidentContext.Example:
To access the
hostnamevalue in the case context data, use the following syntax:${parentIncidentContext.hostname}
-
-
Set a breakpoint in a playbook that reviews context data after a specific task.
This is available when using the debugger. As context data may be updated during a playbook run, setting a breakpoint enables you to pause the playbook execution, review the context data, and take action if necessary. Breakpoints can be useful when designing and troubleshooting playbooks. For more information, see Test your playbook.
-
Add a task that writes playbook data to the case context.
When you add data to the case context, you can use this data to run playbooks on any of the issues that are included in the case.
To write playbook data to the case context, use the
setParentIncidentContextscript in a standard task. For more information, see Add context data to a case.Users with Trigger Playbook permissions on a given issue may still be able to modify the parent case via commands and scripts, even without full access to the case.
For more information about playbooks, see Playbooks overview.
Context data in sub-playbooks
By default, the context data for sub-playbooks is stored in a separate context key. Consider the following information:
- When a task in a main playbook accesses context data, it does not have direct access to sub-playbook data.
- When a task in a sub-playbook accesses context data, it does not have direct access to the main playbook data.
- If the sub-playbook has been configured to share globally, the sub-playbook context data is available to the main playbook and vice versa.
Generic polling does not work if a playbook’s context data is shared globally. For more information, see Playbook polling.
Use case: Use context data in a Jira ticketing system
In this use case, a Jira ticketing system is used to manage issues and reduce duplicate tickets.
Issue: When an action is taken on an endpoint, some cases contain multiple issues for the same endpoint. If each issue runs a playbook on the same endpoint, duplicate tickets are created for each case.
Solution: This playbook checks existing endpoints and Case IDs and decides whether to create a new ticket or to add the data to an existing ticket, and therefore, reduces duplicate tickets in the case.
The playbook flow is described in the following steps:
-
After checking that the Jira v3 integration is enabled, in this task the playbook adds the
EndpointFromAlertskey to the case context by retrieving thealert.hostnameand using thesetParentIncidentContextscript.
-
In this task, the playbook checks if there is an open ticket for the case by retrieving the
parentIncidentContext.TicketID.
-
If there is no open ticket, a new ticket is created in Jira and the TicketID is added to the case context.
-
If there is an open ticket, this task checks whether there is an open ticket for the endpoint by comparing the
alert.hostname(issue endpoint) to theparentIncidentContent.EndpointFromAlertskey.
-
After retrieving the
alert.hostnamein theparentIncidentContext.EndpointFromAlertscontext, if there is no open ticket for the endpoint, the playbook updates the Jira ticket for the case.In this example, you can see that the
EndpointFromAlertsandTicketIDhas been added to the case context data.
Lists
Create and edit lists for use in playbooks and scripts.
A list is a data container for storing data and is mainly used in playbooks and scripts but can be accessed anywhere the context button appears (double-curly brackets). For example, in a playbook task, access the data in a list via the context button under Lists, or by using the path ${lists.<list_name>}. Different types of data can be stored in a list, for example, text, string, numbers, Markdown, HTML, CSS, and JSON objects.
Note
The maximum size of a list is 209715 characters.
Use cases
The following are use cases for lists:
- Defining HTML templates: An HTML template can be defined as part of a communication task.
- Configuring Automation Exclusion Policies: Create lists of critical assets that should be excluded from automated remediation. For more information, see Manage automation exclusion policies.
- Organizing Network Security: Use lists to keep track of internal networks and their corresponding IP addresses. Compare them to a set list to ensure only authorized connections are allowed through.
- Store Data Objects: For example, a list of URLs, which you can call as an input for scripts and playbooks.
- Prioritizing Case Response: Create lists to identify critical assets, such as important users or servers. This helps improve incident management by prioritizing the most important incidents.
Create a list
To create a Text, Markdown, HTML, CSS, or JSON list type:
- Go to Settings → Configurations → Object Setup → Lists → Add a List.
- Enter a name for the list.
- From the list, select the Content Type.
-
Set Permissions for the list. By default, all roles can read and edit the list. You can instead choose specific roles to have read-only or read-and-edit access.
If you intend to use the list as part of an Automation Exclusion Policy, we recommend choosing specific roles for read and edit access. For more information on using lists in exclusion policies, see Manage automation exclusion policies.
- Add content as required. For an example of a JSON list and how to use it, see Use cases: JSON lists.
- To save, do one of the following:
- Click Save.
- Click Save Version to save your changes in Version history for all Lists. This allows you to revisit and restore previous versions.
If you want to edit a list from a content pack, you need to duplicate or detach a list. Detached lists do not receive updated content in subsequent Cortex XSIAM content releases. To retain an updated list, reattach it.
List commands
Use the following list commands in the CLI in the War Room and Playground, scripts, and playbook tasks:
The list must already exist before you use the getList, addToList, setList, or removeFomList commands.
| Command | Description | Arguments |
|---|---|---|
| getList | Retrieves the contents of the specified list. | listName: The name of the list for which to retrieve the contents. |
| createList | Creates a list with the supplied data and overwrites any existing list data. | <ul><li>listName: The name of the list to which to add items.</li><li>listData: The data to add to the new list and overwrites any existing list data.</li></ul> |
| addToList | Appends the supplied items to the specified list. If you add multiple items, make sure you use the same list separator that the list currently uses, for example, a comma or a semicolon. | <ul><li>listName: The name of the list to which to append items.</li><li>listData: The data to add to the specified list. The data will be appended to the existing data in the list.</li></ul> |
| setList | Adds the supplied data to the specified list and overwrites existing list data. | <ul><li>listName: The name of the list to which to add items.</li><li>listData: The data to add to the specified list. The data overwrites the existing data in the list.</li></ul> |
| removeFromList | Removes a single item from the specified list. | <ul><li>listName: The name of the list from which to remove an item.</li><li>listData: The item to remove from the specified list.</li></ul> |
In this example, a manageOOOusers script uses the getList, createList, and setList commands.
register_module_line('ManageOOOusers', 'start', __line__()) def _get_current_user(): current_username = demisto.executeCommand("getUsers", {"current": True}) if isError(current_username): demisto.debug(f"failed to get current username - {get_error(current_username)}") return else: return current_username[0]["Contents"][0]['username'] def main(): # get current time now = datetime.now() # args list_name = demisto.getArg("listname") username = demisto.getArg("username") option = demisto.getArg("option") days_off = now + timedelta(days=int(demisto.getArg("daysoff"))) off_until = days_off.strftime("%Y-%m-%d") # update list name to start with 'OOO', so we can't overwrite other lists with this if not list_name.startswith("OOO"): list_name = f"OOO {list_name}" current_user = _get_current_user() if not current_user and not username: return_error('Failed to get current user. Please set the username argument in the script.') if not username: # Current user was found, running script on it. username = current_user else: # check if provided username is a valid user users = demisto.executeCommand("getUsers", {}) if isError(users): return_error(f'Failed to get users: {str(get_error(users))}') users = users[0]['Contents'] users = [x['username'] for x in users] if username not in users: return_error(message=f"{username} is not a valid user") # get the out of office list, check if the list exists, if not create it: ooo_list = demisto.executeCommand("getList", {"listName": list_name})[0]["Contents"] if isError(ooo_list): return_error(f'Failed to get users out of office: {str(get_error(ooo_list))}') if "Item not found" in ooo_list: demisto.results(demisto.executeCommand("createList", {"listName": list_name, "listData": []})) ooo_list = demisto.executeCommand("getList", {"listName": list_name})[0]["Contents"] # check status of the list, and add/remove the user from it. if not ooo_list: list_data = [] else: list_data = json.loads(ooo_list) if option == "add": # check if user is already in the list, and remove, to allow updating list_data = [i for i in list_data if not (i['user'] == username)] list_data.append({"user": username, "offuntil": off_until, "addedby": current_user if current_user else 'DBot'}) else: # remove the user from the list. list_data = [i for i in list_data if not (i['user'] == username)] set_list_res = demisto.executeCommand("setList", {"listName": list_name, "listData": json.dumps(list_data)}) if isError(set_list_res): return_error(f'Failed to update the list {list_name}: {str(get_error(set_list_res))}') # welcome back, or see ya later! if option == "add": demisto.results(f"Vacation mode engaged until {off_until}, enjoy the time off {username}") else: demisto.results(f"Welcome back {username}, it's like you never left!") if __name__ in ('__builtin__', 'builtins', '__main__'): main() register_module_line('ManageOOOusers', 'end', __line__())
Use cases: JSON lists
List data supports several structures, including JSON. A valid JSON list is automatically parsed as a JSON object in a playbook. Convert a list to an array when scripts or loops require it.
JSON list workflows can:
- Extract an object or subset.
- Filter extracted data.
- Apply transformers.
Extract data from a JSON object
Create a JSON list and use the Set automation to create a context key from its data.
- Create a List:
- In the Name field, type
Test1. - Select Settings → Configurations → Object Setup → Lists → Add a List.
-
In the Content Type field, select JSON and add the following content:
{ "domain": { "name": "mwidomain", "prod_mode": "prod", "user": "weblogic", "admin": { "servername": "AdminServer", "listenport": "8001" }, "machines": [ { "refname": "Machine1", "name": "MWINODE01" }, { "refname": "Machine2", "name": "MWINODE02" } ], "clusters": [ { "refname": "Cluster1", "name": "App1Cluster", "machine": "Box1" }, { "refname": "Cluster1", "name": "App2Cluster", "machine": "Box2" } ], "servers": [ { "name": "ms1", "port": 9001, "machine": "Box1", "clusterrefname": "Cluster1" }, { "name": "ms2", "port": 9002, "machine": "Box2", "clusterrefname": "Cluster2" } ] } }
- Save the list.
- In the Name field, type
- Create a playbook task with the Set automation:
- Select Investigation & Response → Automation → Playbooks → New Playbook.
- Name the playbook, and click Save.
- Click Create Task and provide a task name.
-
In the Choose Script field, select Set .
The Set script sets a value in context under the key entered.
-
In the key field, define a context key name for the data. For example, JSONData.
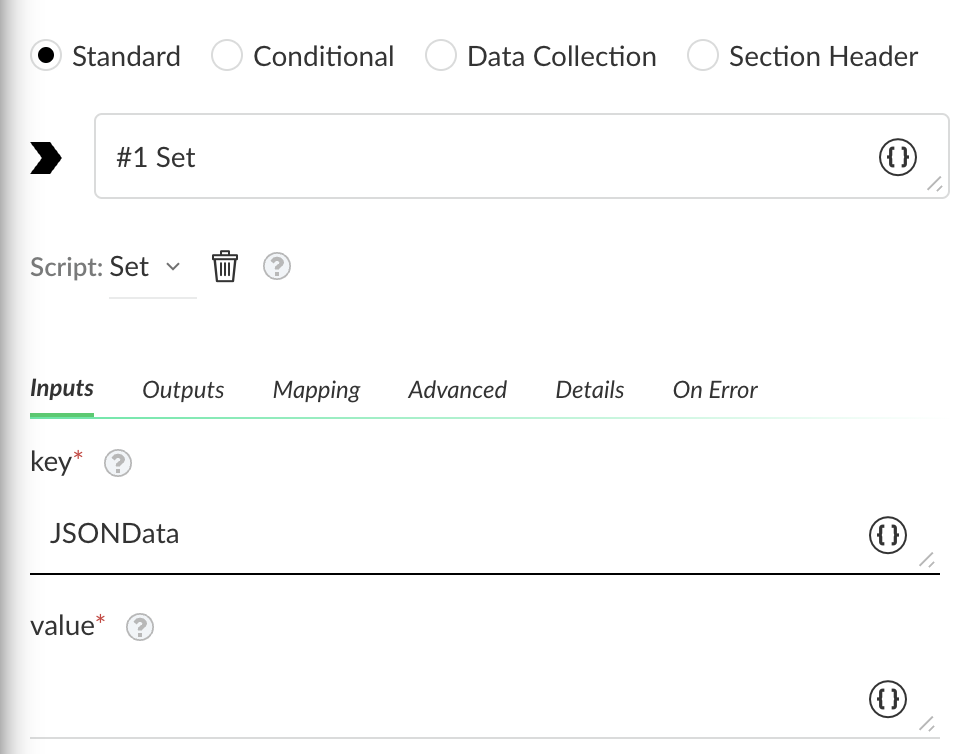
- In the value field, set the list you want to extract by clicking the curly brackets.
- Click Filters And Transformers.
- In the Get field, click the curly brackets, and in the Select source for value section, select the list you created in step 1: Test1.
- In the Fetch data field, select an issue to test the data.
-
Click Test.
In this example, the test results have found the list data.
- When the test completes, click Save.
- Save the task and playbook.
- Check all the data is stored in the context key you defined by testing the playbook using the debugger:
- Click Run.
-
Open the Debugger Panel.
The key you defined, JSONData, holds the data in context from the JSON object.
Extract a subset of the data
In a playbook, you can extract subsets of context data to analyze a specific information set. This approach also applies when working with lists, such as extracting a subset of data from a JSON object. In this example, we extract server information from the list created above.
- In a playbook, create a task.
- In the Choose Script field, select Set .
- In the key field, define a context key name for the data; for example, JSONDataSubset.
- In the value field, set the list you want to extract by clicking the curly brackets.
- Click Filters And Transformers.
- In the Get field, enter
lists.Test1.domain.servers. - In the Fetch data field, select an issue to test the data.
- Click Test.
- When the test completes, click Save.
- Save the task and the playbook.
- Check that all the data is stored in the context key you defined by testing the playbook using the debugger.
Filter extracted data
Filter an extracted data subset to analyze a specific information set. This example filters Box1 information from the list created in Extract data from a JSON object.
- Reopen the task you created.
- Select the value field.
- Under Filter, select Add Filter.
-
Set the condition you want to filter.
In this example, retrieve the list of machines named
Box1fromTest1list by setting the filterlists.Test1.domain.servers.machine Equals Box1.- Click Test.
- Check whether the data subset was accessed successfully by selecting the data source from an issue. You can see the results returned
machine: Box1.
Transform a list into an array
Create a transformer to split a list into an array, add or edit a task in a playbook, or map an instance.
- Go to Investigation & Response → Automation → Playbooks and create or edit a playbook.
- Select Create Task.
- In the Choose script field, select the Set automation.
- In the Key field, enter the key name.
- In the value field, click {}
- Add a transformer.
- Click Filters And Transformers.
- In the Get field, click {}.
- Expand the Lists node and select a list to transform.
- In Apply transformers on the field, click Add transformer.
- Search for and select Split.
- (Optional) In the delimiter field, type the delimiter used to separate the items in the string (default is ",").
- Click Save.
- Save the task and playbook.
For an example of using a transformer in a list, see Apply transformers to extracted data.
Jobs
Schedule playbooks to run automatically by defining a job based on events or specific times. For instance, process indicators automatically upon ingestion and then add them to your SIEM.
Access to Jobs
Access to the Jobs page is governed by Role-Based Access Control (RBAC).
- Role permissions: An administrator must configure your user role with the Jobs permission (found under Investigation & Response > Automation).
- Visibility: Users with at least View permissions can see all jobs in the environment.
- Least privilege: Administrators can grant these permissions via custom roles without any requirement for full administrative privileges.
- Viewing results: Viewing the execution details, such as the Work Plan, requires your role to have permissions for Cases & Issues.
Manage jobs
A job is an automated playbook task or set of playbook tasks that are scheduled to run at predefined intervals or under specific conditions. Jobs can be used for data enrichment, periodic reporting, threat intelligence gathering, or any repetitive operational tasks that need to be performed regularly without manual intervention. There are two types of jobs:
- Time triggered jobs that run at specific times: For example, you can schedule a time triggered job that runs nightly and removes expired indicators.
-
Jobs triggered by a delta or change in a feed: For example, you can define an event triggered job to run a playbook when a specified TIM feed finishes a fetch operation for new indicators.
- Only Account Admins and Instance Administrator roles can create jobs and view/edit job runs.
- If the owner of a job has been removed from Cortex XSIAM, the job will fail to run. In this case, you must change the owner to a current user.
On the Jobs page, you can:
| Action | Details |
|---|---|
| Create a new job | Click + New Job. |
| Edit an existing job | In the table, select a job and click Edit. |
| Perform additional job management | <p>In the table, select a job and click one of the following:</p><ul><li>Run now</li><li>Disable</li><li>Enable</li><li>Pause</li><li>Resume</li><li>Abort</li><li>Delete</li></ul> |
| View job status | <p>The chart panel at the top of the Jobs page shows various status buttons. Click one of the following buttons to filter the list of jobs for that status:</p><ul><li>Running</li><li>Waiting</li><li>Error</li><li>Disabled</li><li>Time Triggered</li><li>Event Triggered</li></ul><p>You can hide this panel by clicking Hide Chart Panel.</p> |
| Search for a specific job | Enter a search query in the filter field. You can also save a filter. |
| View job details in the table | <p>By default, the displayed table columns are:</p><ul><li>Name</li><li>Job Status</li><li>Last Run</li><li>Next Run</li><li>Description</li><li>Playbook</li></ul><p>Click  to change the displayed columns. You can also select to show:</p><ul><li>Owner</li><li>ID</li><li>Trigger</li><li>Job Schedule: This column shows a human readable description of a cron schedule for a job.</li><li>Attachments</li></ul> to change the displayed columns. You can also select to show:</p><ul><li>Owner</li><li>ID</li><li>Trigger</li><li>Job Schedule: This column shows a human readable description of a cron schedule for a job.</li><li>Attachments</li></ul> |
Create a time-triggered job
Time-triggered jobs run at predetermined times. You can schedule the job to run at a recurring time or one time at a specific date and time.
Configure your playbook to close the investigation
A scheduled job automatically opens an internal investigation container to run its playbook. Because the platform allows for manual post-playbook analysis, finishing the playbook tasks does not automatically close this container. If left open, the overall job remains stuck in a Running status. To ensure a consistent UI status, you must add a task to close the investigation at the end of your playbook:
- Navigate to Investigation & Response → Automation → Playbook and open the playbook in the editor.
- In the Task Library on the left, search for closeInvestigation (this is an out-of-the-box system command) located under Builtin Commands.
-
Add the closeInvestigation task to your canvas and configure it as the final step on the successful execution path of your playbook.
- Select Investigation & Response → Automation → Jobs → New Job.
- Select Time triggered.
-
If you want the job to repeat at regular intervals, select Recurring and select the desired interval.
You can choose to run the job every X number of days, on specific days of the week, at a specific time and also choose a start date and an expiration date.
You can configure the recurring job using a cron expression. To do so, after selecting the Recurring checkbox, click Switch to Cron view and enter the expression. For help defining the cron expression, click Show cron examples after switching to cron view.
To view a human-readable description of a cron schedule for an existing job, click
and select Job Schedule from the available columns. - If you do not want the job to repeat, select the date and time for the job to run.
-
In the BASIC INFORMATION, section, add relevant time-triggered job parameters from the following:
Name Description Name Enter a meaningful name for the job. Playbook Determine which playbook to run when this job is triggered. Description Enter a meaningful description of the job. -
In the QUEUE HANDLING section, select one of the following response options to use if the job is triggered while a previous run of the job is active:
- Don’t trigger a new job run
- Cancel the previous job run and trigger a new job run
- Trigger a new job run and execute concurrently with the previous run
We recommend avoiding triggering a job while a previous run of the job is active by configuring the playbook a job triggers to close the investigation before running a new instance of the job.
- Ensure that the playbook assigned to this job includes the closeInvestigation built-in command as its final execution step. This action closes the underlying container workspace and enables the user interface to show the accurate completion status.
- Select Create new job.
Create a job triggered by a delta in a feed
Jobs triggered by a delta in a feed (event triggered jobs) run when a feed completes an operation and there is a change in the content. For the job to trigger, there must be a delta between the incoming feed and the previous one. You can define a job to trigger a playbook when the specified feed or feeds finish a fetch operation that includes a modification to the feed. The modification can be a new indicator, a modified indicator, or a removed indicator. For example, you may want to update your firewall every time a URL is added, modified, or removed from the Office 365 feed. You can configure a job that triggers the firewall update playbook to run whenever a modification is made to the feed.
A job triggered by a delta in a feed runs only if there is a change in the feed, and does not run on a feed’s initial fetch. For the initial fetch, you can run the playbook manually and then set up an event triggered job for subsequent fetches.
If you want to trigger a job after a feed completes a fetch operation and the feed does not change frequently, you can select the Reset last seen option in the feed integration instance. The next time the feed fetches indicators, it will process them as new indicators in the system.
Configure your playbook to close the investigation.
A scheduled job automatically opens an internal investigation container to run its playbook. Because the platform allows for manual post-playbook analysis, finishing the playbook tasks does not automatically close this container. If left open, the overall job remains stuck in a Running status. To ensure a consistent UI status, you must add a task to close the investigation at the end of your playbook:
- Navigate to Investigation & Response → Automation → Playbook and open the playbook in the editor.
- In the Task Library on the left, search for closeInvestigation (this is an out-of-the-box system command) located under Builtin Commands.
-
Add the closeInvestigation task to your canvas and configure it as the final step on the successful execution path of your playbook.
- Select Investigation & Response → Automation → Jobs → New Job.
- Select Triggered by delta in feed.
- In the Trigger section, select one of the following:
- Any feed: The playbook runs when a modification is made to any feed.
- Specific feeds: Select the feed instances that will trigger the playbook to run when a modification is made to them.
- In the BASIC INFORMATION section:
- Add a meaningful name for the job.
- Select the playbook you want to run when the conditions for the job are met.
- Create a new job.
Engines
Install an engine in your remote network, enabling effortless communication with Cortex XSIAM. Easily configure and manage the engine to fit your specific needs, and explore how to leverage it for seamless integrations.
What is an engine?
An engine is a proxy server application that is installed on a remote machine and enables communication between the remote machine and the Cortex XSIAM tenant. You can run playbooks, scripts, commands, and integrations on the remote machine, and the results are returned to the tenant.
While the Cortex XSIAM tenant includes a user interface that allows security analysts to create and manage playbooks, investigate issues, and perform other tasks, the engine operates behind the scenes to execute these playbooks and automate security actions. The separation between the user interface and the engine allows for the scalable and efficient execution of security automation and orchestration.
You can install multiple engines on the same machine (Shell installation only), which is useful in a dev-prod environment where you do not want to have numerous engines in different environments and to manage those machines.
You cannot share a multiple-engine installation with a single-engine installation.
Engine architecture
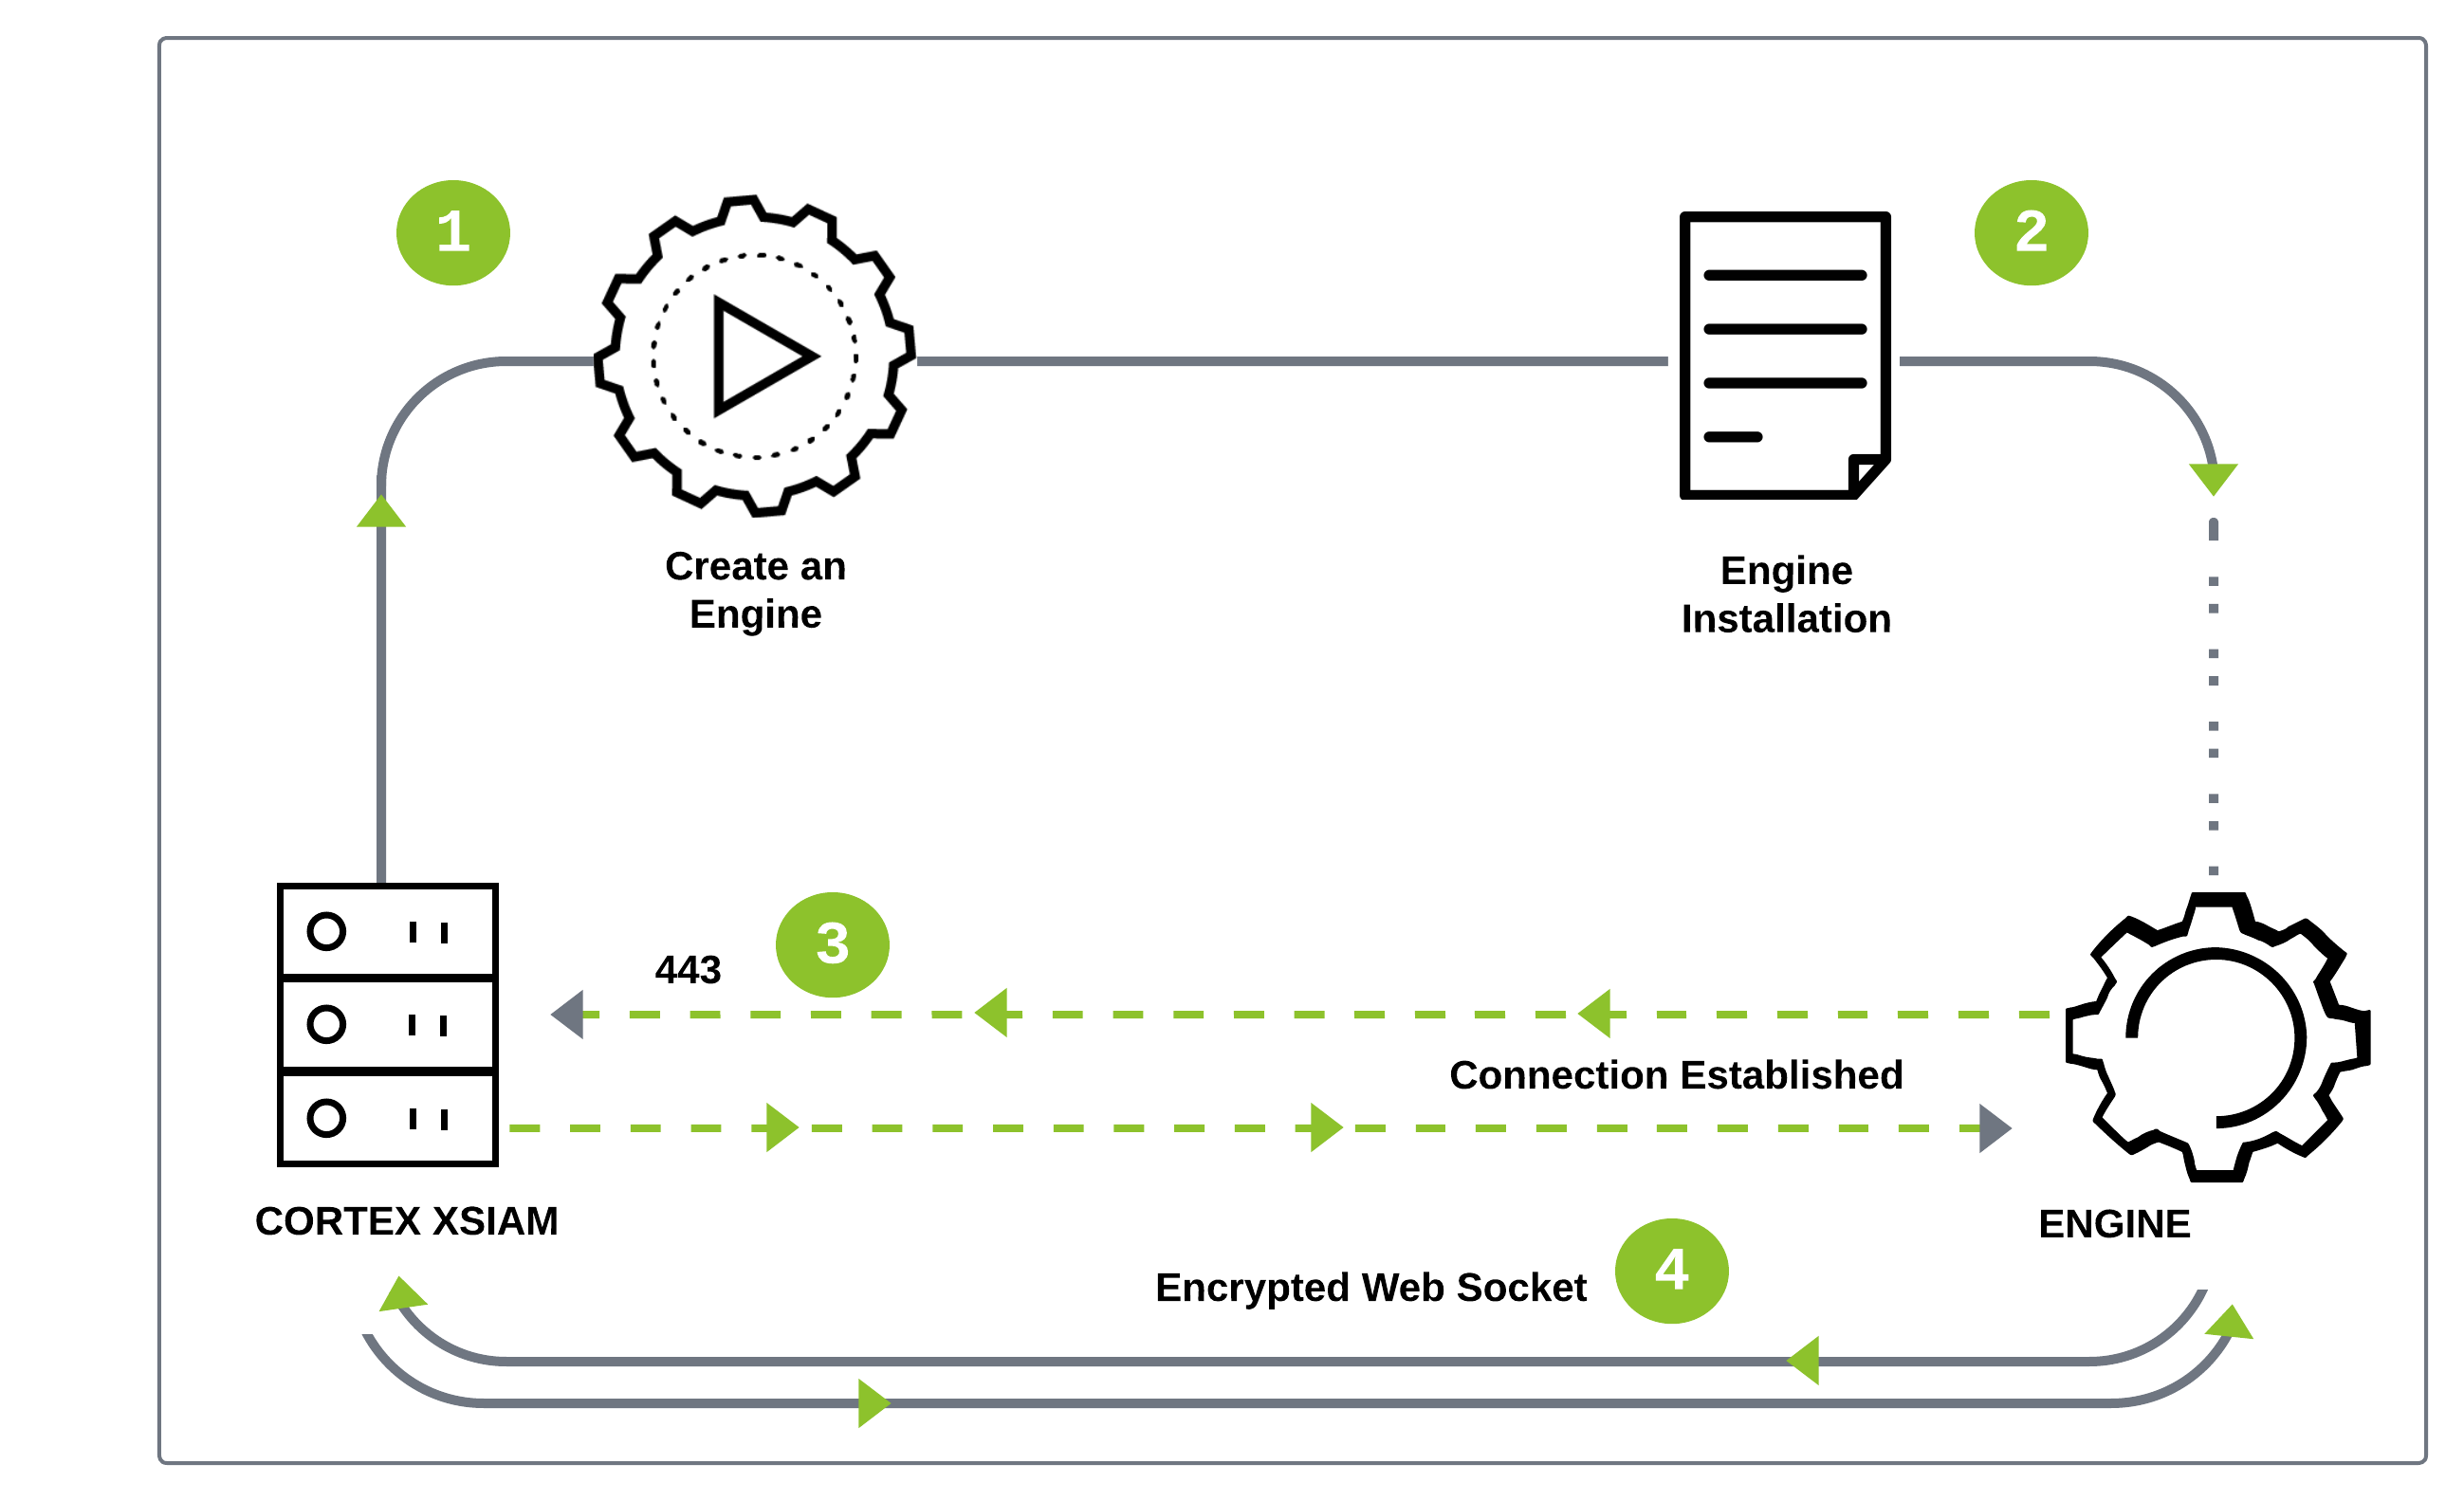
Within the network, you need to allow the engine to access the Cortex XSIAM’s IP address and listening port (by default, TCP 443). The engine always initiates the communication to Cortex XSIAM.
Engine use cases
An engine can be used for the following purposes:
-
Engine proxy
Cortex XSIAM engines enable you to access internal or external services that are otherwise blocked by a firewall or a proxy. For example, if a firewall blocks external communication and you want to run the Rasterize integration, you need to install an engine to access the Internet.
-
Engine load-balancing
Engines can be part of a load-balancing group, which enables the distribution of the command execution load. The load-balancing group uses an algorithm to efficiently share the workload for integrations that the group is assigned to, thereby speeding up execution time. In general, heavy workloads are caused by playbooks that run multiple commands.
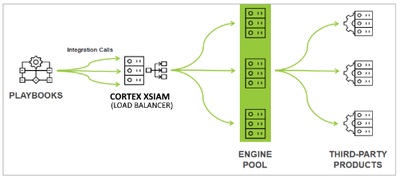
When you add an engine to a load-balancing group, you cannot use that engine separately. The engine does not appear in the engines menu when configuring an integration instance, but you can choose the load-balancing group.
Engine requirements
You can install engines on all Linux environments. Docker/Podman needs to be installed before installing an engine. If you are using the shell installer for an engine, Docker/Podman is installed automatically.
The Cron package is required to install engines on a Linux machine.
Engine hardware requirements
If your hard drive is partitioned, we recommend a minimum of 50 GB for the /var partition.
| Component | Dev Environment Minimum | Production Minimum |
|---|---|---|
| CPU | 8 CPU cores | 16 CPU cores |
| CPU architecture | x86_64 only | x86_64 only |
| Memory | 16 GB RAM | 32 GB RAM |
| Storage | 100 GB | 100 GB |
Operating system requirements
You can deploy a Cortex XSIAM engine on the following operating systems:
| Operating System | Supported Versions |
|---|---|
| Ubuntu | 18.04, 20.04, 22.04, 24.04 |
| RHEL | <p>8.x, 9.x, 10.x</p><p>Includes all minor versions.</p> |
| Oracle Linux | 7.x, 8.9, 9.3, 9.4, 10.1 |
| Amazon Linux | 2, Amazon Linux 2023 |
| Rocky Linux | 9.5, 9.6 |
CentOS 8.x reached End of Life (EOL) on December 31, 2021, and is no longer supported as an operating system.
CentOS 7.x reached End of Life (EOL) on June 30, 2024, and is no longer supported as an operating system.
Engine required URLs
You need to allow the following in the URLs for Cortex XSIAM engines to operate properly. The URLs are needed to pull container images from public Docker registries.
The endpoint URL is: wss://api-<tenant domain>.xdr.<region>.paloaltonetworks.com/xsoar/d1ws. For example, wss://api-my-tenant.xdr.us.paloaltonetworks.com/xsoar/d1ws
If you have configured a range of Approved IP Ranges under Allowed Sessions on the Security Settings page, the engine must communicate through one of the approved IPs.
| FUNCTION | SERVICE | PORT | DIRECTION |
|---|---|---|---|
| Integrations | Integration-specific ports | Outbound | |
| Engine connectivity | HTTPS | 443 (configurable) | Outbound |
| Docker | <ul><li>https://registry-1.docker.io</li><li>https://registry.fedoraproject.org</li><li>https://registry.access.redhat.com</li><li>https://docker.io</li><li>https://registry.docker.io</li><li><p>https://auth.docker.io</p><p>This URL may change at Docker’s discretion.</p></li><li><p>https://production.cloudflare.docker.com</p><p>This URL may change at Docker’s discretion.</p></li></ul> | 443 | Outbound |
Install an engine
When you install the engine, the d1.conf is installed on the engine machine, which contains engine properties such as proxy, log level, and log files. If Docker/Podman is already installed, the python.engine.docker and powershell.engine.docker keys are set to true. If Docker or Podman is not available when the engine is installed, the key is set to false. If so, you need to set the key to true after installing Docker and Podman. Verify that python.engine.docker and powershell.engine.docker configuration keys are present in the d1.conf file.
If you are using DEB, RPM, or Zip installation, install Docker or Podman.
Natively running Python or PowerShell integrations/scripts on Windows or Linux is not supported on Cortex XSIAM engines.
Installation types
Cortex XSIAM supports the following file types for installation on the engine machine:
-
Shell: For all Linux deployments, including Ubuntu and SUSE. Automatically installs Docker/Podman, downloads Docker/Podman images, enables remote engine upgrade, and allows installation of multiple engines on the same machine.
The installation file is selected for you. Shell installation supports the purge flag, which by default is false. To uninstall an engine, run the installer with the purge flag enabled.
When upgrading an engine that was installed using the Shell installation, you can use the Upgrade Engine feature in the Engines page. For Amazon Linux 2-type engines, you need to upgrade these engine types using a zip-type engine and not use the Upgrade Engine feature.
If you use the shell installer, Docker/Podman is automatically installed. We recommend using Linux and not Windows to be able to use the shell installer, which installs all dependencies.
- DEB: For Ubuntu operating systems.
-
RPM: RHEL operating systems.
- Zip: Used for Amazon Linux 2 machines.
- Configuration: Configuration file for download. When you install one of the other options, this configuration file (
d1.conf) is installed on the engine machine.
For DEB/RPM engines, Python (including 3.x) and the containerization platform (Docker/Podman) must be installed and configured. For Docker or Podman to work correctly on an engine, IPv4 forwarding must be enabled.
How to install an engine
- Create an engine.
- Select Settings → Configurations → Data Broker → Engines → Create New Engine.
- In the Engine Name field, add a meaningful name for the engine.
- Select one of the installer types from the list.
-
(Optional) (Shell only) Select the checkbox to enable multiple engines to run on the same machine.
If you have an existing engine, and you did not select the checkbox, and now you want to install another engine on the same machine, you need to delete the existing engine.
- (Optional) Add any required configuration in JSON format.
- Click OK to create the engine.
-
For shell installation, do the following:
Tip
For Linux systems, we recommend using the shell installer. If using Amazon Linux 2, use the zip installer (see step 4).
- Move the
.shfile to the engine machine using a tool such as SSH or PuTTY. -
On the engine machine, grant execution permission by running the following command:
chmod +x /<engine-file-path> -
Install the engine by typing one of the following commands:
With tools:
sudo<engine-file-path>Without tools:
sudo<engine-file-path> -- -tools=falseNote
If you receive a
permissions deniederror, it is likely that you do not have permission to access the/tmpdirectory.If the installer fails to start due to a permissions issue, even if running as root, add one of the following two arguments when running the installer:
--target <path>- Extracts the installer files into the specified custom path.--keep- Extracts the installer files into the current working directory (without cleaning at the end).
If using installer options such as
-- -tools=false, the option should come after the--targetor--keeparguments. For example:sudo ./d1-installer.sh --target /some/temp/dir -- -tools=falseIf you set a custom path when you run the installer, you must also set a custom path for upgrading your engine or the upgrade will fail. For more information, see Upgrade an engine.
- Move the
- For RPM/DEB installation, do the following:
- Move the file to the required machine using a tool such as SSH or PuTTY.
-
Type one of the following installation commands:
Machine Type Install Command RHEL (RPM) sudo rpm -Uvh d1-2.5_15418-1.x86_64.rpmUbuntu (DEB) sudo dpkg --install d1_xxx_amd64.deb -
Start the engine by running one of the following commands:
Machine Type Start Command RHEL (RPM) sudo systemctl start d1Ubuntu (DEB) sudo service d1 restart
- For Zip installation on Amazon Linux 2, run the following commands:
-
Create the engine folder.
mkdir /usr/local/demisto -
Unzip the engine files to the folder created in the previous step.
unzip ./d1.zip -d /usr/local/demisto -
Allow the process to bind to low-numbered ports.
setcap CAP_NET_BIND_SERVICE=+eip /usr/local/demisto/d1_linux_amd64 -
Change the owner of
/usr/local/demistoto the demisto user.chown -R demisto:demisto /usr/local/demisto -
In
/etc/systemd/systemedit thed1.servicefile as follows (adjust the directory and the name of the binary file if needed).[Unit] Description=Demisto Engine Service After=network.target [Service] Type=simple User=demisto WorkingDirectory=/usr/local/demisto ExecStart=/usr/local/demisto/d1_linux_amd64 EnvironmentFile=/etc/environment Restart=always [Install] WantedBy=multi-user.target
-
Run the following commands:
chown root:root /etc/systemd/system/d1.servicechmod 644 /etc/systemd/system/d1.service -
Run the engine process.
systemctl start d1 -
Verify that the engine is running.
systemctl status d1
-
- Verify that the engine you created is connected.
- Select Settings → Configurations → Data Broker → Engines.
- Locate your engine on the Engines page and check that it is connected.
-
When the engine is connected, you can add the engine to a load-balancing group by clicking Load-Balancing Group on the Engines page.
If you want to add the engine to a new group, click Add to new group from the list.
When the engine is in the load-balancing group, it cannot be used as an individual engine and does not appear when configuring an engine from the list.
- (Optional) After installing the engine, you may want to set up a proxy, set up Docker hardening, configure the number of workers for the engine, or perform other related engine configurations. For more information, see Configure Engines. You can also configure an integration instance to run on the engine you created.
Docker
Docker is a software framework for building, running, and managing containers.
This section is relevant when installing an engine.
Cortex XSIAM maintains Docker images in the Cortex Docker Hub organization.
Each Python or PowerShell integration specifies its Docker image in its YAML file. If the image is not local, the engine downloads it from Docker Hub or the Cortex Container Registry. The integration then runs inside that container. For background information, see the Docker documentation and Using Docker.
You can download Docker images with their content packs for offline installation.
Install Docker
Docker lets engines run Python and PowerShell integrations in a controlled environment. The Shell installer installs Docker automatically. For DEB and RPM installations, install Docker or Podman before installing the engine.
Cortex XSIAM supports the latest Docker Engine release and these corresponding Linux distributions:
- 5.3.15 and later
- 5.4.2 and later
- 5.5 and later
Older Docker Engine releases from the past 12 months are also supported. Known compatibility issues may require an upgrade before Support can assist.
Docker installation by operating system
Red Hat Docker deployments need Mirantis Container Runtime (formerly Docker Engine- Enterprise). For Red Hat's Docker distribution, you need Mirantis Container Runtime (formerly Docker Engine - Enterprise) to run specific Docker-dependent integrations and scripts. For more information, see Install Docker distribution for Red Hat on an engine server.
To use the Mirantis Container Runtime (formerly Docker Engine - Enterprise) follow the deployment guide for your operating system distribution.
Verify Docker user and permissions
Verify Docker user
If you installed an engine before installing Docker, verify the demisto operating system user is part of the Docker operating system group.
-
Run
id demistoverify. For example:id demisto uid=997(demisto) gid=997(demisto) groups=997(demisto),998(docker)
If needed, add the demisto user to the operating system group:
sudo groupadd docker sudo usermod -aG docker demisto
Remove these keys from the engine configuration file.
python.executable python.executable.no.docker
Verify user permissions
To verify that the operating system user (demisto) has the necessary permissions and can run Docker containers, run the following command from the OS command line.
sudo -u demisto docker run --rm -it demisto/python:1.3-alpine python --version
If everything is configured properly, you will receive the following output. Python 2.7.14.
Install Docker distribution for Red Hat
Red Hat maintains its own package of Docker, which is the version used in OpenShift Container Platform environments, and is available in the RHEL Extras repository.
If running RHEL v8 or higher, the engine installs Podman packages and configures the operating system to enable Podman in rootless mode.
For more information about the different packages available to install on Red Hat, see the Red Hat Knowledge Base Article (requires a Red Hat subscription to access).
- Install Red Hat’s Docker package.
-
Run the following commands.
systemctl enable docker.servicesystemctl restart docker.service - Change ownership of the Docker daemon socket so members of the
dockerrootuser group have access.- Edit or create the file
/etc/docker/daemon.json. -
Enable OS group
dockerrootaccess to Docker by adding the following entry to the/etc/docker/daemon.json: "group": "dockerroot"file. For example:{ "group": "dockerroot" } -
Restart the Docker service by running the following command.
systemctl restart docker.service - Install the engine
-
After the engine is installed, run the following command to add the
demistoos user to thedockerrootos group (Red Hat uses dockerroot group instead of docker).usermod -aG dockerroot demisto - Restart the engine.
- Edit or create the file
-
Set the required SELinux permissions.
The Cortex XSIAM engine uses the
/var/lib/demisto/tempdirectory (with subdirs) to copy files and receive files from running Docker containers. By default, when SELinux is in enforcing mode, directories under/var/lib/it cannot be accessed by Docker containers.-
To allow containers access to the
/var/lib/demisto/tempdirectory, you need to set the correct SELinux policy type, by typing the following command.chcon -Rt svirt_sandbox_file_t /var/lib/demisto/temp -
( Optional) Verify that the directory has the
container_file_tSELinux type attached by running the following command.ls -d -Z /var/lib/demisto/temp -
Configure label confinement to allow Python and PowerShell containers to access other script folders.
In the d1.conf file, set the following parameters:
Key Value For Python containers python.pass.extra.keys --security-opt=label=level:s0:c100,c200 For PowerShell containers powershell.pass.extra.keys --security-opt=label=level:s0:c100,c200 -
Open any issue and in the issue War Room CLI, run the
/reset_containerscommand.
-
Docker image security
The project that contains the source Dockerfiles used to build the images and the accompanying files is fully open source and available for review. Cortex XSIAM uses the secure Docker Hub registry for its Docker images. However, in an Engine environment, you can also use the PANW registry . You can view the Docker trust information for each image at the image info branch.
| |
| ---------------------------------------------------------------------------------------------------------------------------------------------------------------------------------------------------------------------------------------------------------------------------------------------------------------------------------------------------------- |
We automatically update our open-source Docker images and their accompanying dependencies (OS and Python). Examples of automatic updates can be viewed on GitHub.
We maintain Docker image information, which includes information on Python packages, OS packages, and image metadata for all our Docker images. Data image information is updated nightly.
All of our images are continuously scanned using Cortex XSIAM for known and newly published vulnerabilities, in two scenarios:
- Every new image, and every new version of an image, are scanned before publishing to our public registries, as part of our CI/CD process.
- All existing images are continuously scanned to check whether new vulnerabilities have been published and now exist in those images.
We evaluate all critical/high findings and actively work to prevent and mitigate security vulnerabilities.
Cortex XSIAM ensures container images are fully patched and do not contain unnecessary packages. Patches and dependencies are applied automatically via our open-source Docker file build project.
Response Prioritization
We remediate any critical and high level vulnerabilities, irrespective of who found them. Issues may be discovered by external researchers, found during internal testing, encountered by customers or reported by other organizations and vendors.
Any vulnerability with a possible exploitation against our images would be responded to with utmost urgency. If we conclude that there is a risk for our customers we will issue an advisory with recommended actions and mitigations. Advisories are published at: https://security.paloaltonetworks.com/.
In each version release (every 3 months,) we publish a new version of our content, which will use the latest and secure versions of our images.
Troubleshooting
- Purge old and unused images periodically.
- If you scanned the Docker images locally, and found some critical CVE’s - Make sure you use the latest version of the pack, as it should have the latest version of the image. In addition, purge the old and unused images with vulnerabilities.
Docker FAQs
Does Cortex XSIAM use COPY or ADD for building images?
Cortex XSIAM uses COPY for building images. The COPY instruction copies files from the local host machine to the container file system. Cortex XSIAM does not use the ADD instruction, which could potentially retrieve files from remote URLs and perform operations such as unpacking, introducing potential security vulnerabilities.
Should the --restart flag be used?
The --restart flag should not be used. Cortex XSIAM manages the lifecycle of Docker images and restarts images as needed.
Can we restrict containers from acquiring additional privileges by setting the no-new-privileges option?
Cortex XSIAM does not support the no-new-privileges option. Some integrations and scripts may need to change privileges when running as a non-root user (such as Ping).
Can we apply a daemon-wide custom seccomp profile?
The default seccomp profile from Docker is strongly recommended. The default seccomp profile provides protection as well as wide application compatibility. While you can apply a custom seccomp profile, Cortex XSIAM cannot guarantee that it won't block system calls used by an integration or script. If you apply a custom seccomp profile, you need to verify and test the profile with any integrations or scripts you plan to use.
Can we use TLS authentication for Docker daemon configuration?
TLS authentication is not used, because Cortex XSIAM does not use Docker remote connections. All communication is done via the local Docker IPC socket.
How do we set the logging level to info?
Set the log level in the Docker daemon configuration file.
Can we restrict Linux kernel capabilities within containers?
The default Docker settings (recommended) include 14 kernel capabilities and exclude 23 kernel capabilities. Refer to Docker’s full list of runtime privileges and Linux capabilities.
You can further exclude capabilities via advanced configuration, but will first need to verify that you are not using a script that requires the capability. For example, Ping requires NET_RAW capability.
Is the Docker health check option implemented at runtime?
The Cortex XSIAM tenant monitors the health of the containers and restarts/terminates containers as needed. The Docker health check option is not needed.
Can we enable live restore?
Live restore is not used. Cortex XSIAM uses ephemeral Docker containers. Every running container is stateless by design.
Can we restrict network traffic between containers?
Cortex XSIAM does not disable inter-container communication by default, as there are use cases where this might be needed. For example, a script communicating with a long running integration which listens on a port, may require inter-container communication. If inter-container communication is not required, it can be disabled by modifying the Docker daemon configuration.
Can we enable user namespace remapping?
Cortex XSIAM does not support user namespace remapping.
How do we configure auditing for Docker files and directories?
Auditing is an operating system configuration, and can be enabled in the operating system settings. Cortex XSIAM does not change the audit settings of the operating system.
Can we disable the userland proxy?
If the kernel supports hairpin NAT, you can disable docker userland proxy settings by modifying the Docker daemon configuration.
Does Cortex XSIAM support the AppArmor profile?
Cortex XSIAM supports the default AppArmor profile (only relevant for Ubuntu with AppArmor enabled).
Does Cortex XSIAM support the SELinux profile?
Cortex XSIAM supports the default SELinux profile (only relevant for RedHat with SELinux enabled).
How does Cortex XSIAM handle secrets management?
For Docker swarm services, a secret is a blob of data, such as password, SSH private keys, SSL certificates, or other piece of data that should not be transmitted over a network or stored unencrypted in a Docker file or in your application’s source code. Cortex XSIAM manages integration credentials internally. It also supports using an external credentials service such as CyberArk.
Troubleshoot Docker Issues
The following provides troubleshooting solutions for Docker networking and performance issues.
Troubleshoot Docker networking issues
In Cortex XSIAM, integrations and scripts run either on the tenant, or on an engine.
If you have Docker networking issues when using an engine, you need to modify the d1.conf file.
- On the machine where the Engine is installed, open the
d1.conffile. -
Add the following to the
d1.conffile:{ "LogLevel": "info", "LogFile": "/var/log/demisto/d1.log", "EngineURLs": [ "wss://1234.demisto.live/d1ws" ], "BindAddress": ":443", "EngineID": "XYZ", "ServerPublic": "ABC" "ArtifactsFolder": "", "TempFolder": "", "python.pass.extra.keys": "--network=host" }
- Save the file.
- Restart the engine using
systemctl restart d1orservice d1 restart.
Troubleshoot Docker performance issues
This information is intended to help resolve the following Docker performance issues.
- Containers are getting stuck.
- The Docker process consumes a lot of resources.
- Time synchronization issues between the container and the operating system.
Cause
The installed Docker package and its dependencies are not up to date.
Workaround
-
Update the package manager cache.
Linux Distribution Command Debian apt-get update -
(Optional) Check for a newer version of the Docker package.
Linux Distribution Command Debian apt-cache policy docker -
Update the Docker package.
Linux Distribution Command Debian apt-get update docker
Configure Docker pull rate limit
Docker enforces a pull rate limit on public images. The limit is based on an IP address or as a logged-in Docker hub user. The default limit (100 pulls per 6 hours) is usually high enough for Cortex XSIAM's use of Docker images, but the rate limit may be reached if using a single IP address for a large organization (behind a NAT). If the rate limit is reached, the following error message is issued:
Error response from daemon: toomanyrequests: You have reached your pull rate limit. You may increase the limit by authenticating and upgrading: https://www.docker.com/increase-rate-limit.
To increase the limit:
-
Sign up a free user in the Docker hub.
The pull limit is higher for a registered user (200 pulls per 6 hours).
-
Authenticate the user on the engine machine by running the following command.
sudo -u demisto docker login -
(Optional) Instead of manually logging in to Docker to pull images, you can edit the Docker config file to use credentials from the file or from a credential store.
Change the Docker Installation folder
The /var/lib/docker/ folder is the default Docker folder for Ubuntu, Fedora, and Deblan in a standard engine installation, used to store container images and logs.
To change the Docker folder:
-
Stop the Docker daemon.
sudo service docker stop -
Create a file called
daemon.jsonunder the/etc/dockerdirectory with the following content:{ "data-root": "<path to your Docker folder>" }
-
Copy the current data directory to the new one.
sudo rsync -aP /var/lib/docker/ <path to your Docker folder> -
Rename the old docker directory.
sudo mv /var/lib/docker /var/lib/docker.bkp -
After confirming that the change was successful, you can remove the backup file.
sudo rm -rf /var/lib/docker.bkp -
Start the Docker daemon.
sudo service docker start
Docker hardening guide
The following describes the engine settings we recommend for securely running Docker containers.
When editing the configuration file, you can limit container resources, open file descriptors, limit available CPU, and more. For example, add the following keys to the configuration file:
{"docker.run.internal.asuser": true,"limit.docker.cpu": true,"limit.docker.memory": true,"python.pass.extra.keys": "--pids-limit=256##--ulimit=nofile=1024:8192"}
We recommend reviewing Docker network hardening below before changing any parameters in the configuration file.
To securely run Docker containers, we recommend using the latest Docker version.
You can Check Docker Hardening Configurations to verify that the Docker container has been hardened according to the settings we recommend.
The settings below can also be applied to Podman, with the exception of limiting available memory, limiting available CPU, and limiting PIDS.
Docker network hardening
Docker creates its networking stack that enables containers to communicate with other networking endpoints. You can use iptables rules to restrict which networking sources the containers communicate with. By default, Docker uses a networking configuration that allows unrestricted communication for containers, so that containers can communicate with all IP addresses.
-
Block network access to the host machine
Integrations and scripts running within containers do not usually require access to the host network. For added security, you can block network access from containers to services running on the engine machine.
For example, to limit all source IPs from containers that use the IP ranges 172.16.0.0/12, run
sudo iptables -I INPUT -s 172.16.0.0/12 -d 10.18.18.246 -j DROP. This also ensures that new Docker networks that use addresses in the IP address range of 172.16.0.0/12 are blocked from access to the host private IP. The default IP range used by Docker is 172.16.0.0/12. If you configured a different range in Docker'sdaemon.jsonconfig file, use the configured range. Alternatively, you can limit specific interfaces by using the interface name, such asdocker0, as a source.-
Add the following iptables rule for each private IP on the tenant machine:
sudo iptables -I INPUT -s <IP address range> -d <host private ip address> -j DROP -
(Optional) To view a list of all private IP addresses on the host machine, run
sudo ifconfig -a
-
-
Assign a Docker network for a Docker image
If your engine is installed on a cloud provider such as AWS or GCP, it is best practice to block containers from accessing the cloud provider’s instance metadata service. The metadata service is accessed via IP address
169.254.169.254. For more information about the metadata service and the data exposed, see the AWS and GCP documentationThere are cases where you might need to provide access to the metadata service. For example, access is required when using an AWS integration that authenticates via the available role from the instance metadata service. You can create a separate Docker network, without the blocked iptable rule, to be used by the AWS integration’s Docker container. For most AWS integrations, the relevant Docker image is:
demisto/boto3py3-
Create a new Docker network by running the following command:
sudo docker network create -d bridge -o com.docker.network.bridge.name=docker-metadata aws-metadata - Edit the engine configuration file either by editing the
d1.conffile, or If you installed via Shell, you can edit the configuration in the UI as well as editing the file directly. For details, see Configure engines. -
Add the following key.
"python.pass.extra.keys.demisto/boto3py3": "--network=aws-metadata" - Save the changes.
-
Restart the demisto service on the engine machine.
sudo systemctl start d1(Ubuntu)
sudo service d1 restart -
Verify the configuration of your new Docker network:
sudo docker network inspect aws-metadata
-
-
Block internal network access
In some cases, you might need to block specific integrations from accessing internal network resources and allow the integrations to access only external IP addresses. We recommend this setting for the Rasterize integration when used to Rasterize untrusted URLs or HTML content, such as those obtained via external emails. With internal network access blocked, a rendered page in the Rasterize integration cannot perform an SSRF or DNS rebind attack to access internal network resources.
-
Create a new Docker network by running the following command:
sudo docker network create -d bridge -o com.docker.network.bridge.name=docker-external external -
Block network access to the host machine for the new Docker network:
iptables -I INPUT -i docker-external -d <host private ip> -j DROP -
Block network access to cloud provider instance metadata:
sudo iptables -I DOCKER-USER -i docker-external -d 169.254.169.254/32 -j DROP -
Block internal network access:
sudo iptables -I DOCKER-USER -i docker-external -d 10.0.0.0/8 -j DROPsudo iptables -I DOCKER-USER -i docker-external -d 172.16.0.0/12 -j DROPsudo iptables -I DOCKER-USER -i docker-external -d 192.168.0.0/16 -j DROP - Edit the engine configuration file either by editing the
d1.conffile, or If you installed via Shell, you can edit the configuration in the UI as well as editing the file directly. For details, see Configure engines. -
Add the following key to run integrations that use the
demisto/chromiumDocker image with the Docker networkexternal."python.pass.extra.keys.demisto/chromium": "--network=external" - Save the changes.
-
Restart the demisto service on the engine machine.
sudo systemctl start d1(Ubuntu)
sudo service d1 restart -
Verify the configuration of your new Docker network:
sudo docker network inspect external
-
-
Persist iptables rules
By default, iptables rules are not persistent after a reboot. To ensure your changes are persistent, save the iptables rules by following the recommended configuration for your Linux operating system:
Configure Docker images
You can apply more specific, fine-tunedimage-specific settings to Docker images, according to the Docker image name or the Docker image name including the image tag. To apply settings to a Docker image name, add the advanced configuration key to the engine configuration file. If you apply Docker image specific settings, they will be used instead of the general python.pass.extra.keys setting. This overrides the general memory and CPU settings, as needed.
- Edit the engine configuration file either by editing the
d1.conffile, or if you installed via Shell, you can edit the configuration in the UI as well as edit the file directly. For details, see Configure engines. -
Add the following key to apply settings to a Docker image name.
"python.pass.extra.keys.<image_name>"For example,
"python.pass.extra.keys.demisto/dl".-
To apply settings to a Docker image name, including the image tag, use
"python.pass.extra.keys.<image_name>": "<image_tag>".For example,
"python.pass.extra.keys.demisto/dl": "1.4". -
To set the Docker images
demisto/dl(all tags) to use a higher max memory value of 2g and to remain with the recommended PIDs and ulimit, add the following to the configuration file:"python.pass.extra.keys.demisto/dl": "--memory=2g##--ulimit=no- file=1024:8192##--pids-limit=256"
-
- Save the changes.
-
Restart the demisto service on the engine machine.
sudo systemctl start d1(Ubuntu)
sudo service d1 restart
Run Docker with non-root internal users
For additional security isolation, we recommend to run Docker containers as non-root internal users. This follows the principle of least privilege.
- Edit the engine configuration file either by editing the
d1.conffile, or If you installed via Shell, you can edit the configuration in the UI as well as edit the file directly. For details, see Configure engines. -
Add the following key:
"docker.run.internal.asuser": true -
For containers that do not support non-root internal users, add the following key:
"docker.run.internal.asuser.ignore" : "A comma separated list of container names. The engine matches the container names according to the prefixes of the key values>"For example,
"docker.run.internal.asuser.ignore"="demisto/python3:","demisto/python:"The engine matches the key values for the following containers:
demisto/python:1.3-alpine demisto/python:2.7.16.373 demisto/python3:3.7.3.928 demisto/python3:3.7.4.977
The
:character should be used to limit the match to the full name of the container. For example, using the:character does not finddemisto/python-ubuntu:2.7.16.373. - Save the changes.
-
Restart the demisto service on the engine machine.
sudo systemctl start d1(Ubuntu)
sudo service d1 restart
Configure the memory limit support without swap capabilities
When a container exceeds the specified amount of memory, the container starts to swap. Not all Linux distributions have the swap limit support enabled by default.
- Red Hat distributions usually have swap limit support enabled by default.
- Ubuntu distributions usually have swap limit support disabled by default.
To protect the host from a container using too many system resources (either because of a software bug or a DoS attack), limit the resources available for each container. In the engine configuration file, some of these settings are set using the advanced parameter: python.pass.extra.keys. This key receives as a parameter full docker run options, separated with the ## string.
How to check if your system supports swap limit capabilities
-
On the engine machine, run the following command:
sudo docker run --rm -it --memory=1g demisto/python:1.3-alpine true - If
swap limit capabilitiesis enabled, configure the memory limitation. (To test the memory, see step 5 of configure the memory limitation.) -
If you see the following message in the output (the message may vary between Docker versions):
WARNING: Your kernel does not support swap limit capabilities or the cgroup is not mounted. Memory limited without swap.You have 2 options:
- Configure
swap limit capabilitiesby following the Docker documentation. - See Docker hardening guide.
If you see the
WARNING: No swap limit supportyou can configure memory support without swap limit capabilities. - Configure
How to configure the memory limit support without swap limit capabilities
- Edit the engine configuration file either by editing the
d1.conffile, or If you installed via Shell, you can edit the configuration in the UI as well as editing the file directly. For details, see Configure engines. -
Add the following key to disable swap memory enforcement:
"python.pass.extra.keys": "--memory=1g##--memory-swap=-1"If you have the
python.pass.extra.keysalready set up with a value, add the value after the##separator. - Save the changes.
-
Restart the demisto service on the engine machine.
sudo systemctl start d1(Ubuntu)
sudo service d1 restart
Configure the memory limitation
We recommend limiting available memory for each container to 1 GB.
If swap limit capabilities is enabled (see How to check if your system supports swap limit capabilities above), in Cortex XSIAM configure the memory limitation using the following advanced parameters.
- Edit the engine configuration file either by editing the
d1.conffile, or If you installed via Shell, you can edit the configuration in the UI as well as editing the file directly. For details, see Configure engines. -
Add the following keys.
"limit.docker.memory": true, "docker.memory.limit": "1g"If you do not want to apply Docker memory limitations, you should explicitly set the advanced parameter:
limit.docker.memorytofalse. - Save the changes.
-
Restart the demisto service on the engine machine.
sudo systemctl start d1(Ubuntu)
sudo service d1 restart - Test the memory limit.
- Go to Investigation & Response → Automation → Scripts → New Script.
- In the Script Name file, type
TestMemory. -
Add the following script:
from multiprocessing import Process import os def big_string(size): sys.stdin = os.fdopen(0, "r") s = 'a' * 1024 while len(s) < size: s = s * 2 print('completed creating string of length: {}'.format(len(s))) size = 1 * 1024 * 1024 * 1024 p = Process(target=big_string, args=(size, )) p.start() p.join() if p.exitcode != 0: return_error("Return code from sub process indicates failure: {}".format(p.exitcode)) else: print("Success allocating memory of size: {}".format(size))
- In the SCRIPT SETTINGS section, select the script to run on the Single engine and select the engine where you want to run the script.
- Save the script.
- To test the memory limit, type
!TestMemory. The command returns an error when it fails to allocate 1 GB of memory.
Configure the CPU, PIDs, and open the file descriptors limit
Set the advanced parameters to configure the CPU limit, PIDs limit, and the open file descriptor limit.
- Edit the engine configuration file either by editing the
d1.conffile, or if you installed via Shell, you can edit the configuration in the UI as well as edit the file directly. For details, see Configure engines. -
Add the following keys:
Parameter Key Available CPU limit "limit.docker.cpu": true, "docker.cpu.limit": "<CPU Limit>"We recommend to limit each container to 1 CPU. (For example,1.0. Default is 1.0).PIDs limit "python.pass.extra.keys": "--pids-limit=256"Open file descriptors limit "python.pass.extra.keys": "--ulimit=nofile=1024:8192" - Save the changes.
-
Restart the demisto service on the engine machine.
sudo systemctl start d1(Ubuntu)
sudo service d1 restart
Check Docker hardening configurations
Check your Docker hardening configurations on an engine by running the !DockerHardeningCheck command in the Case/Issue War Room CLI. The results show the following:
- Non-root User
- Memory
- File descriptors
- CPUs
- PIDs
Before running the command, ensure that your engine is up and running.
- Update the
DockerHardeningCheckscript to run on the engine.- Go to Investigation & Response → Automation → Scripts → DockerHardeningCheck → Settings.
- In the Run on field select Single engine and from the list, select the engine you want to run the script.
- Save the script.
- Verify the Docker container has been hardened according to recommended settings. In the Case/Issue War Room CLI, run the
!DockerHardeningCheckcommand.
Podman
Podman is a daemonless container engine for developing, managing, and running OCI containers on Linux. Containers can run as root or in rootless mode.
The Shell installer detects the operating system’s container management type. On RHEL 8 and later, it installs and configures Podman for rootless mode.
Engine upgrades retain the existing container management type.
PowerShell integrations might require default SELinux policy configuration. Podman can affect processes that mmap to /dev/zero.
Docker hardening guidelines
Docker hardening guidelines can be applied to Podman, except Limit Available Memory, Limit Available CPU, and Limit PIDS.
Change the Container storage
By default, Podman uses the $HOME/.local/share/containers/storage directory. To use a different directory for container storage, edit the Podman config file located at /home/demisto/.config/containers/storage.conf. If the Podman config file does not exist, you need to create it and change the ownership.
The new storage directory needs to be owned by the demisto user, otherwise, they will be denied access to it.
Do not use NAS storage or a temporary (tmpfs) directory for the graphroot setting. The graphroot needs to be a local, non-temporary directory for Podman to work. For more information, see https://en.wikipedia.org/wiki/Network-attached_storage.
We recommend reserving 150 GB for container storage, either in the /home partition or a different storage directory that you have set using the graphroot key.
- If the Podman config file does not exist:
-
Create the Podman config file.
sudo mkdir -p /home/demisto/.config/containerscp /etc/containers/storage.conf /home/demisto/.config/containers -
Change the ownership of the Podman config file.
sudo chown -R demisto:demisto /home/demisto
-
-
To set a different directory for container storage, change the key:
graphrootin thestorage.conffile. For example:graphroot = "/var/lib/containers/cortex-storage" -
Some additional changes are required in the storage.conf file. Comment out the
runrootsetting by adding a#(hash) before it. For example:#runroot = "/run/containers/storage"Alternatively, the
runrootsetting may be set to some temporary directory that is accessible by the user demisto. If you choose to set therunroot, it must be a directory that is mounted as tmpfs (temporary filesystem), unlike the graphroot. -
Under [storage.options.overlay], uncomment the following line (remove the # from the start):
mount_program = "/usr/bin/fuse-overlayfs" -
If the engine has already been installed, apply your changes to any existing containers:
sudo -u demisto podman system migrate -
Verify the change (once the engine is installed):
sudo -u demisto podman info | grep graph
Install Podman
When installing a new engine on RHEL 8 or later, the shell installer configures Podman automatically. There are some cases, however, where you might need to install Podman manually:
- When using an installation method other than the shell installer (e.g., an RPM package) on RHEL 8 or later.
- When the shell installer did not successfully install Podman.
- When you want to migrate from Docker to Podman for an existing Cortex XSIAM engine.
This procedure is intended for RHEL 8 or later. It may not work for other operating system types.
Do not use NAS storage for the $HOME directory. The directory needs to be a local directory for Podman to work.
-
For RHEL 8, install Podman by typing the following commands:
sudo yum -y install slirp4netns fuse-overlayfssudo yum -y module install container-tools
For RHEL 9 or later, install Podman by typing the following command:
sudo yum -y install slirp4netns fuse-overlayfs podman
- Run the following commands:
sudo touch /etc/subuid /etc/subgidsudo mkdir -p /home/demistosudo chown demisto:demisto /home/demisto
-
Configure the
unqualified-search-registriesused by Podman.Podman by default uses the fedoraproject.org, redhat.com, and docker.io unqualified search registries. SinceCortex XSIAM images use only the docker.io registry, you can speed up download times for container images by setting
unqualified-search-registriesto just docker.io.- Create or edit the
/home/demisto/.config/containers/registries.confconfig file. -
In the file, set
unqualified-search-registries = ["docker.io"]If you edit the file with the
rootuser, make sure to set thedemistouser as file owner by runningchown demisto:demisto /home/demisto/.config/containers/registries.conf
- Create or edit the
-
Change the
subuidsandsubgidsby running the following command:sudo usermod --add-subuids 200000-265535 --add-subgids 200000-265535 demisto -
Migrate existing containers to Podman:
sudo sh -c "cd /; runuser -u demisto -- podman system migrate" - Set the
net.ipv4.ping-group-range, by typing the following commands:sudo sh -c "echo 'net.ipv4.ping_group_range=0 2000000' > /etc/sysctl.d/demisto-ping.conf"sudo sysctl -w "net.ipv4.ping_group_range=0 2000000"
-
As root user, edit the following
configfile:/usr/local/demisto/d1.conf -
Change the
"container.engine.type": "docker"to“podman".If this line does not exist, add the following line to the file:
"container.engine.type": "podman""Server": { "HttpsPort": "443", "ProxyMode": true }, "container": { "engine": { "type": "podman" } }, "db": { "index": { "entry": { "disable": true -
If the engine is running, restart the service.
sudo systemctl restart d1If the Allow running multiple engines on the same machine option is selected, run the command:
sudo systemctl restart d1_<Engine _name>
Migrate from Docker to Podman
Although Podman is set up automatically in an engine installation, it is possible to migrate from Docker to Podman in an existing engine. Follow the Podman installation instructions to migrate.
Troubleshoot Podman
dbus-daemon process leak
Podman version 3.4.1 and lower has a known issue that dbus-daemon processes may leak when running in an environment containing the dbus-x11 OS package. The issue occurs when the dbus-x11 OS package is installed, for example, when installing an X11 desktop environment like GNOME desktop on the host machine. If you experience this issue, you see a large number of dbus-daemon processes owned by the demisto OS user. To check if you are affected by the issue, run the following command:
ps -fe | grep demisto | grep dbus-daemon
To fix this issue:
-
Remove the dbus-x11 OS package and dependent packages by running the following command:
sudo yum remove dbus-x11 -
After removal you can kill the leaked dbus-daemon processes by running the following OS command:
pgrep -u demisto dbus-daemon | xargs sudo kill
Invalid argument error
When Podman fails to run with an “Invalid argument” error, such as:
ERRO[0000] running `/usr/bin/newuidmap 15936 0 1029 1 1 165536 65536 65537 200000 65536`: newuidmap: write to uid_map failed: Invalid argument Error: cannot set up namespace using "/usr/bin/newuidmap": exit status 1
This can be caused by duplicate lines for Cortex XSIAM in /etc/subuid and /etc/subgid.
To fix this issue:
-
Check if the
/etc/subuidfile contains multiple lines that start with the Cortex XSIAM username (usually demisto). For example:alice:100000:65536 demisto:165536:65536 demisto:200000:65536 splunk:331072:65536
-
If this is the case, edit the file as root, and remove the extra line(s) for Cortex XSIAM. The line you should keep is the one that ends with 200000:65536. Continuing with the above example, here is the end result:
alice:100000:65536 demisto:200000:65536 splunk:331072:65536
-
Repeat the above steps for the
/etc/subgidfile.
Verify Podman installation
When encountering errors in Cortex XSIAM that are Podman related, such as:
failed to run "docker ps". stderr: [], err: [Timeout. Process killed (1400)Timeout while waiting for pong response [error 'Read timed out (15s)Error: error joining network namespace of container 06b8aec6eabe2e735128e3a72cb06c8ae2d97ade60a56ab555034442ea4e2a84: error retrieving network namespace at /tmp/podman-run-989/netns/cni-86dca01c-bd84-1aaf-85fb-72b659a8e42a: unknown FS magic on "/tmp/podman-run-993/netns/cni-86dca01c-bd84-1aaf-85fb-72b659a8e42a": 58465342
-
Verify that Podman is running properly with the
demistoOS user by performing the following steps:-
Change the OS user to
demistoby running the following command:sudo su - -s /bin/bash demisto -
Check that your system complies with the minimum requirements, and view general system information such as host architecture, CPU, OS, registries, container storage path, etc., by running the following command:
podman info -
Check all active running containers, container names, and IDs by running the following command:
podman ps -
Check that Podman can run a container by running the following command:
podman run --rm -t demisto/python3:3.10.4.29342 echo "podman is working"
If any of the Podman commands are not working, try running with the
--log-level=debugto receive additional details as to why it is failing. For example:podman --log-level=debug pspodman --log-level=debug ps podman --log-level=debug run --rm -t demisto/python3:3.10.4.29342 echo "podman is working" -
-
Reset the Podman Data Directories.
If the Podman commands in step 1 are failing, you should clean the Podman working directories. Sometimes Podman's data directories get corrupted (for example, as a result of insufficient disk space).
This step removes all Podman images, including any custom images you may have created.
-
Stop the engine by running the following command:
sudo systemctl stop d1 -
Ensure that all Podman containers of the
demistouser are stopped by running the following command:ps -fe | grep demisto | grep 'podman run'If required, kill the running containers.
-
Delete the following directories (assuming the
demistoOS user's home directory is at: /home/demisto)sudo rm -rf /home/demisto/.cache/containers/sudo rm -rf /home/demisto/.local/share/containers/sudo rm -rf /tmp/podman-run-$(id -u demisto)sudo rm -rf /tmp/containers-user-$(id -u demisto)sudo rm -rf /tmp/tmp/run-$(id -u demisto)
$(id -u demisto)is used to get thedemistouser ID, which is part of the directory name. For example,/tmp/podman-run-993Not all the directories above may be present.
-
Start the engine by running the following command:
sudo systemctl start d1 -
Verify that Podman is working properly with the
demistoOS user by following step 1.
-
Unused containers consume resources
In some cases, if the Podman process crashes or is killed abruptly, it can leave containers on disk. You might see errors such as error allocating lock for new container: allocation failed; exceeded num_lock when the maximum number of locks used to manage containers is exhausted due to the unused containers that remain.
- Change to the demisto operating system user
sudo su - -s /bin/bash demisto. - Run
podman ps -a -f status=exitedto check for unused containers. -
Clean up the unused containers
podman container cleanup --rm -a.When you run
podman container cleanup --rm -a, you might see a message such asrunning or paused containers cannot be moved without force. The message can be safely ignored, as it only pertains to current running containers, which are not removed. - After cleanup, verify there are no remaining unused containers
podman ps -a -f status=exited.
Keyring quota exceeded
Script failed to run: Docker code runner got container error: [Docker code script is in inconsistent state, ... error: [exit status 126] stderr: [Error: OCI runtime error: crun: create keyring ...: Disk quota exceeded]
By default, Podman creates a keyring that is used by each container. The limit per user on the machine might be low, and Podman can reach the limit when running more containers than the keyring limit. To check the keyring usage, run the sudo cat /proc/key-users operating system command.
The command returns the usage for each UID (to retrieve the demisto user UID, run id demisto ). The fourth column shows the number of keys used out of the total number available. For more information about keys, see Kernel Key Retention Service.
You can either increase the limit of max keyrings (increasing to 1000 is safe and reasonable) per user, as specified by your Linux vendor documentation or you can disable keyring creation by Podman. We recommend disabling keyring creation unless keyrings are used by Podman in other applications on the machine. To disable keyring creation by Podman, modify the containers.conf file and add the option keyring = false under the "[containers]" section. For more information, see the Containers Engine Configuration File.
error "exit status 125" and output "Error: chown...operation not permitted"
If the container storage directory is not owned AND exclusively used by the demisto user, scripts will fail to run. See the Podman section for more information about assigning ownership of the storage directory.
Report a support case for installation issues
If the procedure set out in the Verify Podman installation section above does not solve the Podman issue and you require assistance from Support, do the following:
- Include the following files as part of the support case:
/etc/containers/storage.conf-
/home/demisto/.config/containers/storage.confIf the file does not exist, indicate that there is no such file.
-
/home/demisto/.config/containers/registries.confIf the file does not exist, indicate that there is no such file.
-
Include the output of the following commands as the
demistouser.To change to the
demistoOS user, run the following command:sudo su - -s /bin/bash demistopodman infopodman imagespodman --log-level=debug pspodman --log-level=debug run --rm -t demisto/python3:3.10.4.29342 echo "podman is working
Permission issues with directories under the /run path
When installing a Cortex XSIAM engine on a RHEL system (version 8 or later), or when running an integration on such an engine, you get a permission error for a path under /run (for example /run/user/0 or /run/libpod).
-
In RHEL 9 only: Make sure the
container-toolsmeta-package is installed by running:yum -y install container-tools - Run the following commands:
cp /etc/containers/storage.conf /home/demisto/.config/containers/storage.confchown demisto:demisto /home/demisto/.config/containers/storage.confchmod 600 /home/demisto/.config/containers/storage.conf
- Edit
/home/demisto/.config/containers/storage.conf.-
Under
[storage], changerunrootto some temporary directory that is accessible by userdemisto.For example:
runroot = "/tmp/podman-run-xsiam"The
runrootmust be located under thetmpfsfile system type. This is required to clean Podman's run state on reboot and for performance reasons. -
Also under
[storage], changegraphroot(where container images are stored) to any location that is owned and accessible by userdemisto. We recommend using this standard path:graphroot = "/home/demisto/.local/share/containers/storage"Unlike the
runroot, thegraphrootmust NOT be located under thetmpfsfile system type. Usingtmpfsfor thegraphrootmight corrupt container images, causing command executions to fail. It also degrades performance by forcing Podman to needlessly re-pull images. -
Under
[storage.options.overlay], uncomment the following line (remove the # from the start):mount_program = "/usr/bin/fuse-overlayfs"
-
-
Save the file and run the following.
You must switch to user
demistobefore running the "system migrate" (running it as root will have no effect).su - demistopodman system migrate
-
Also as user
demisto, run the following to ensure the path changes were applied:podman info | grep RootYou should see the correct runRoot and graphRoot settings.
-
As user
demisto, verify the issue is resolved by running:podman run hello-world -
If the issue persists, purge Podman's database by running the following:
The "system migrate" must be done by the user demisto.
rm -rf /home/demisto/.local/share/containers/*podman system migrate
Manage engines
You can manage your engines and load-balancing groups by going to Settings → Configurations → Data Broker → Engines.
You can view engine names, hosts, status, connection, and other engine information.
You can do the following:
| Option | Description |
|---|---|
| Load-Balancing Group | <p>It is useful to create separate load-balancing groups. For example:</p><ul><li>Use separate load-balancing groups for different integrations and instances. Create Load-Balancing groups for certain tasks, which can help segregate the infrastructure of critical integrations.</li><li>Managed Security Service Providers may want to split internal engines and SaaS product engines.</li><li>If you have multiple AWS accounts that are not connected and do not want a single point of failure for AWS integrations that use STS.</li></ul><p>You can do the following:</p><ul><li><p>Add/remove engines to a load-balancing group</p><p>You can only add the engine to the load-balancing group after you have connected the engine.</p><p>If you want to remove the last engine from a specific load-balancing group, if one or more integration instances use that engine, you will get an error. Before moving the engine, you need to assign Run on to a different engine or no engine for each of the integration instance settings.</p></li><li><p>Create load-balancing groups</p><p>When selecting Load-Balancing Group → Add to new group, you can create multiple load-balancing groups and decide which engines are part of each group.</p><p>Users can move an engine from one group to another. A group will be deleted when the last engine is removed from it.</p><p>Each engine can only belong to one group.</p></li></ul> |
| Upgrade Engine | Relevant for Shell installation only. If you didn't install an engine using the Shell installation, you will need to remove the engine and do a fresh installation. For more information, see Upgrade an engine. |
| Get Logs | Logs are located in /var/log/demisto. For multiple engines, logs are located in /var/log/demisto/<name of the engine>. For example, var/log/demisto.d1_e1. |
| Edit Configuration | Relevant for Shell installation only. Enables you to edit the d1.conf file without having to access the file on your remote machine. For more information, see Configure engines. |
| Download Configuration | Download the d1.conf file to view the attribute values. |
| Delete Engine | Deletes an engine from Cortex XSIAM. To remove the engine from your remote machine, see Remove an engine. |
Upgrade an engine
Whenever there is a Cortex XSIAM major version change or a change in tenant-engine protocol version, your engines require an upgrade. On the Engines page, the Status column shows those engines that require upgrades. You can upgrade an engine by doing the following:
- If you installed the engine using the Shell installer, you can upgrade the engine on the Engines page.
- If you didn't install the engine using the Shell installer, you need to remove the engine and do a fresh install.
Upgrade an engine (Shell installations)
You can upgrade the engine on the Engines page if you have installed the engine using the shell installer. The engine must be connected during the upgrade.
Customize upgrade variables
Before upgrading, we recommend you review the upgrade variables and verify if any need to be set in the /usr/local/demisto/upgrade.conf file on the engine. For environments with multiple engines, the file is located at /usr/local/demisto/<engine-name>/upgrade.conf. In some cases, usually related to a web proxy server or a custom directory, if you do not configure the upgrade.conf file, the upgrade will fail.
The option to set custom upgrade variables is only available for shell installation.
The upgrade.conf file is available on the engine after it has been upgraded to Cortex XSIAM 3.1. Any custom variables you add to the file are applied when you upgrade from Cortex XSIAM 3.1 to Cortex XSIAM 3.2 or later.
| Variable | Description | Default |
|---|---|---|
| https_proxy | The URL of a web proxy server to use when connecting with the server. The variable name is case sensitive. Other common proxy variables, such as http_proxy or HTTPS_PROXY are ignored. Use https_proxy even if your proxy address begins with http://. |
Not set |
| SERVER_URLS | The URL to connect to for hash validation. Set this variable if your tenant's address has changed. Use your tenant's API address, with the api- prefix added, instead of the UI address. For example: SERVER_URLS="api-example.us.paloaltonetworks.com". Include only the IP/hostname and, optionally, a port. Do not include https:// or any path at the end. |
Public tenant URL |
| TRUST_ANY_CERTIFICATE | Determines whether the connection's SSL certificate must be trusted. This variable must be empty "" to require certificate trust. When set to -k, trusts any certificate. We recommend enabling this setting. Verify first that the engine host has the required CA root certificate, especially if using a proxy. |
-k |
| XSOAR_ENGINE_AUTO_UPGRADE_TMP_DIR | Specifies a directory to use for extracting upgrade files and executing the upgrade. For example, XSOAR_ENGINE_AUTO_UPGRADE_TMP_DIR="/root/tmp/engine1" For environments with multiple engines, each engine must use a different temporary directory. This variable must be set if you used the --target option in the shell installer. |
By default, a random directory under the /tmp folder is used. |
Test upgrade connectivity
-
Test the upgrade connectivity by creating a mock
d1_upgrade.shfile :cd /usr/local/demisto echo test > d1_upgrade.sh
After you create the file, the upgrade cron job removes the file within one minute.
- Check the upgrade log file
/var/log/demisto/demisto_install.logfor connection-related errors. For hosts with multiple engines, the log file can be found at/tmp/<engine name>/demisto_install.log. - If the test is successful, the following message appears at the end of the log file, with a recent timestamp:
Validation HTTPS request returned: false. - If you find errors in the log, you may need to change the variables in the
upgrade.conffile or to change your network configuration.
How to upgrade
- On the Engines page, select the checkbox for the engine that requires an upgrade.
-
Click Upgrade Engine.
When the upgrade finishes, the version appears in the Cortex XSIAM Version column. The upgrade procedure can take several minutes.
Upgrade an engine (non-shell installations)
If you didn't use the Shell installer, you need to remove the engine and do a fresh install.
- On the Engines page, locate the engine that requires an update.
- In the Download link, click the relevant Download files.
-
On the remote machine, do the following:
- Remove the existing engine. For more information, see Remove an engine.
- Install the engine you downloaded in step 2. For more information, see Install an engine.
When the upgrade finishes, the version appears in the Cortex XSIAM Version column. The upgrade procedure can take several minutes.
Related information
Remove an engine
You can remove an engine when it is no longer needed.
-
Run one of the following commands according to your operating system:
Installation Command RPM Get the full package: **`rpm -qa DEB <p>Get the full package: dpkg-query -W -f='${Package}' d1_*</p><p>Remove the package:dpkg --purge<package name></p>SH Remove an Engine: sudo<engine-file-path>-- -purge
Configure engines
When installing an engine, a d1.conf file is installed on your machine. Some configurations can only be done by editing the d1.conf file. If you install via Shell, you can edit the configuration in the UI as well as edit the file directly.
A use case for modifying the engine configuration is if you want to generate engine logs for a specific log level.
Edit the d1.conf file
-
On the machine on which you installed the engine, navigate to the
d1.conffile:Installation Type Location RPM, DEB, Shell <p> /usr/local/demisto</p><p>If using multiple engines, the location is/usr/local/demisto/name of the engine>. For example,/usr/local/demisto/d1_e1</p>ZIP Same folder as the binary. -
Modify the file as required. See Common properties when editing an engine configuration.
You can also configure the engine to use a web proxy.
Modify the configuration in Cortex XSIAM (Shell installations only)
Ensure that the data is in JSON format. The properties that you specify override the values defined in the d1.conf file.
- From the engines table, select the engine for which you want to modify the configuration.
- Click Edit Configuration.
-
In the JSON formatted configuration dialog box, modify the properties as required. For more information, see Common properties when editing an engine configuration.
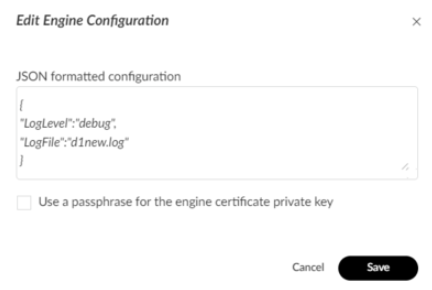
Common properties when editing an engine configuration
The following table describes the common properties when editing an engine configuration using the d1.conf file (located by default at /usr/local/demisto/) or in the JSON formatted configuration dialog box in Cortex XSIAM.
| Property | Type | Values | Edit |
|---|---|---|---|
http_proxy |
String | <p>The IP address of the HTTP proxy through which the engine communicates.</p><p>For example, see Configure the engine to use a web proxy.</p> | The engine d1.conf file. |
https_proxy |
String | <p>The IP address of the HTTP/s proxy through which the engine communicates.</p><p>For example, see Configure the engine to use a web proxy.</p> | The engine d1.conf file. |
LogLevel |
String | <ul><li>debug</li><li>info</li><li>warning</li></ul> |
The engine d1.conf file or in the JSON formatted configuration dialog box. |
log.rolling.maxfilesize |
String | The maximum size in MB to retain log files. Default is 20 MB. | The engine d1.conf file. |
log.rolling.backups |
String | The maximum number of log files to retain. Default is 3. | The engine d1.conf file. |
log.rolling.maxage |
String | <p>The maximum number of days to retain old log files based on the time stamp encoded in the file name. Default is 0 (not to retain old log files based on age).</p><div data-gb-custom-block data-tag="hint" data-style="info" class="hint hint-info"><p>Note</p><p>A day is defined as 24 hours and may not exactly correspond to calendar days due to daylight savings, leap seconds, etc.</p></div> | The engine d1.conf file. |
BindAddress |
String | The port on which the engine listens for agent connection requests and communication task responses. | The engine d1.conf file. |
EngineURLs |
String array | An array of tenant addresses to which the engine tries to connect. If you change the tenant URL, you need to update this parameter. | <p>The engine d1.conf file.</p><div data-gb-custom-block data-tag="hint" data-style="info" class="hint hint-info"><p>Note</p><p>In addition, to support engine upgrades from the UI, edit the /usr/local/demisto/upgrade.conf file on the engine to include the SERVER_URLS setting with the new tenant's address. Include only the host, without https:// or any additional path at the end of the host name. For example: SERVER_URLS="api-example.us.paloaltonetworks.com"</p></div> |
LogFile |
String | Path to the d1.log file. If you change the name or location of the d1.log file, you need to update this parameter. |
The engine d1.conf file. |
engine.handshake.max.retries.slow |
String | <p>The maximum time in minutes the engine will try to reconnect after losing communication. Default is 600 (10 hours).</p><div data-gb-custom-block data-tag="hint" data-style="info" class="hint hint-info"><p>Note</p><p>If the engine loses communication for longer than this time, it will disconnect and you need to restart the service.</p></div> | The engine d1.conf file. |
Configure the engine to use a web proxy
Proxy settings can be configured in an engine by adding them as an engine configuration.
You need to configure Docker to use a proxy. When using a BlueCoat proxy, ensure you encode the values correctly.
-
On the machine on which you installed the engine, navigate to the
d1.conffile and add the following keys.Key Value Description http_proxy<p> http://``<user:password@proxy-server:port#></p><p>For examplehttp://user:password@proxy-server:3128</p>Environment uses HTTP proxy. Special characters must be escaped. https_proxy<p> https://``user:password@proxy-server:port#</p><p>For example,https://user:password@proxy-server:3128</p>Environment uses HTTPS proxy. Special characters must be escaped. no_proxy<p> http://``<user:password@proxy-server:port#></p><p>For examplehttp://user:password@proxy-server:3128</p>For specific addresses, a proxy bypass will be applied. Special characters must be escaped. -
If the environment variables are not set, or you wish to use different settings than those specified in the environment variables, set the configuration with your specific proxy details in the
d1.conffile. For example:{"http_proxy": "http://proxy.host.local:8080", "https_proxy": "https://proxy.host.local:8443" "no_proxy": "https://proxy.host.local:8020"}
- Save the file.
-
On the machine where you installed the engine, navigate to the
upgrade.conffile and edit the file to sethttps_proxyto your proxy address. For example,https_proxy="https://proxy.host.local:8443".In an environment with a single engine, go to
/usr/local/demisto/upgrade.conf. In an environment with multiple engines, go to/usr/local/demisto/<engine-name>/upgrade.conf, replacing <engine-name> with the name of the engine.Note that the key is in the
upgrade.conffile and must behttps_proxy, even if your proxy address starts withhttp://. - Save the file.
Configure the engine to call the server without using a proxy
In some cases, due to specific environment architecture, you may need to configure the engine to use a proxy when working with integrations, but not use a proxy when calling the Cortex XSIAM tenant.
-
On the computer where you have installed the engine, go to the directory for
d1.conffile.For RPM, DEB, Shell go to
/usr/local/demisto. -
Add the following configuration:
Key Value engine.to.server.proxyfalse(default istrue)
Use NGINX as a reverse proxy
NGINX can act as a reverse proxy that sits between internal applications and external clients, forwarding client requests to the appropriate application. Using NGINX as a reverse proxy in front of the engine enables you to provide network segmentation where the proxy can be put on a public subnet (DMZ) while the engine can be on a private subnet, only accepting traffic from the proxy. Additionally, NGINX provides a number of advanced load balancing and acceleration features that you can utilize.
If you want to use an engine (d1) through the reverse proxy, you need to modify EngineURLs in the d1.conf file to point to the host and port the NGINX server is listening on. In addition to supporting engine upgrades from the UI, edit the /usr/local/demisto/upgrade.conf file to add the SERVER_URLS setting. SERVER_URLS should be set to the proxy’s network address (host and port). For example: SERVER_URLS="10.0.0.30:1234". For SERVER_URLS, include only the IP/hostname and, optionally, a port. Do not include https:// or any path at the end.
Install NGINX
You can install NGINX on the Red Hat/Amazon (yum) and Ubuntu Linux distributions. For full instructions and available distributions, see NGINX documentation.
- On the engine, run one of the following commands according to your Linux system:
- RedHat/Amazon:
sudo yum install nginx - Ubuntu:
sudo apt-get install nginx
- RedHat/Amazon:
-
(Optional) Verify the NGINX installation by running the following command:
sudo nginx -v
Generate a certificate for NGINX
You should not use self-signed certificates for production systems. It is recommended to use a properly signed certificate for production systems. These instructions are intended only for non-production setups.
-
To use OpenSSL to generate a self-signed certificate, on the engine machine, run the following command:
sudo openssl req -x509 -nodes -days 3650 -newkey rsa:2048 -keyout /etc/nginx/cert.key -out /etc/nginx/cert.crt -
When prompted, complete the on-screen instructions to complete the required fields.
Configure NGINX
-
Open the following NGINX configuration file with your preferred editor:
/etc/nginx/conf.d/demisto.conf -
Use the following configuration template:
Replace
DEMISTO_ENGINEwith the appropriate hostname.# Replace DEMISTO_ENGINE with the appropriate hostname. If needed, change port 443 to the port on which the engine is listening. upstream demisto { server DEMISTO_ENGINE:443; } # Uncomment to redirect http to https (optional) # server { # listen 80; # return 301 https://$host$request_uri; # } server { # Change the port if you want NGINX to listen on a different port listen 443; ssl_certificate /etc/nginx/cert.crt; ssl_certificate_key /etc/nginx/cert.key; ssl on; ssl_session_cache builtin:1000 shared:SSL:10m; ssl_protocols TLSv1 TLSv1.1 TLSv1.2; ssl_ciphers HIGH:!aNULL:!eNULL:!EXPORT:!CAMELLIA:!DES:!MD5:!PSK:!RC4; ssl_prefer_server_ciphers on; access_log /var/log/nginx/demisto.access.log; location / { proxy_set_header Host $host; proxy_set_header X-Real-IP $remote_addr; proxy_set_header X-Forwarded-For $proxy_add_x_forwarded_for; proxy_set_header X-Forwarded-Proto $scheme; proxy_pass https://demisto; proxy_read_timeout 90; } location ~ ^/(websocket|d1ws|d2ws) { proxy_pass https://demisto; proxy_http_version 1.1; proxy_set_header Upgrade $http_upgrade; proxy_set_header Connection "upgrade"; proxy_set_header Host $host; proxy_set_header Origin ""; proxy_set_header X-Real-IP $remote_addr; proxy_set_header X-Forwarded-For $proxy_add_x_forwarded_for; proxy_set_header X-Forwarded-Proto $scheme; } }For multi-tenant deployments, replace
location ~ ^/(websocket|d1ws|d2ws) {withlocation ~ ^/(acc_\S+/)?(websocket|d1ws|d2ws) -
Restart the NGINX server by typing the following command:
sudo service nginx restart -
Verify you can access the engine by browsing to the NGINX server host.
Configure an engine to use custom certificates
You can replace the default self-signed certificate for the engine with your own certificate.
-
Find the two files created by the engine. The default location is
/usr/local/demisto.d1.key.pemd1.cert.pem - Replace the contents of these files with your own certificates.
-
Change file owner to demisto:
chown -R demisto:demisto d1.key.pemchown -R demisto:demisto d1.cert.pem -
Set the file permissions:
chmod 600 d1.key.pemchmod 644 d1.cert.pem
Use an engine in an integration
When you create an integration instance, you can select whether to fetch issues and run commands executed for the integration using the engine or a load-balancing group of engines. After you add the engine or load-balancing group to an integration instance, you can run commands using the engine or load-balancing group by specifying the using argument in the Issues War Room.
Before configuring an integration to run using multiple engines in a load-balancing group, we recommend that you test the integration using a single engine in the load-balancing group.
Long-running integrations should not run on load-balancing groups.
Command Example
!url url="www.cnn.com" using=urlscan.io_instance_1
Run a script using an engine
You can run a script on an engine or load-balancing group to distribute the workload and improve performance.
- Go to Investigation & Response → Automation → Scripts.
- Select the script and click Settings.
-
From the BASIC section, in the Run on field, select either a single engine or a load-balancing group.
The option to select an engine or load-balancing group only appears if at least one engine or load-balancing group is connected.
- From the list, select the name of the engine or load-balancing group.
- Click Save.
Troubleshoot engines
When troubleshooting engines, access the logs from Settings → Configurations → Engines and select the engine from which you want to download the logs.
Ensure that pop-ups are not blocked by your browser.
Debug engines
The d1.log field appears whenever an engine is running. The d1.log field contains information necessary for your customer success team to debug any engine-related issue. The field displays any error, as well as noting whether the engine is connected.
Troubleshoot engine installation
If the installer fails to start due to a permissions issue, even if running as root, add one of the following two arguments when running the installer:
--target <path>- Extracts the installer files into the specified custom path.--keep- Extracts the installer files into the current working directory (without cleaning at the end).
If using installer options such as -- -tools=false, the option should come after the --target or --keep arguments. For example:
sudo ./d1-installer.sh --target /some/temp/dir -- -tools=false
If you set a custom path when you run the installer, you must also set a custom path for upgrading your engine or the upgrade will fail. For more information, see Upgrade an engine.
After installing the engine, check that the engine is connected to the Cortex XSIAM tenant and that it is running.
- Go to Settings → Configurations → Data Broker → Engines and verify that the engine is connected.
-
If the engine is not connected, run the following command on the engine server to check if the engine service is running.
sudo systemctl status d1If the Allow running multiple engines on the same machine option is selected, run the command:
sudo systemctl status d1_<Engine _name> -
Access the d1 log on the engine server.
sudo tail -f /var/log/demisto/d1.log- If the engine service is not running, and there’s nothing relevant in the log, run
journalctlon the engine server to understand why the installation failed. -
If the engine service is running, review the errors to see if the engine is failing to connect or if there are other issues (ignore all errors related to
\d2ws, because this is not the same asd1ws.) Most often, the server address is incorrect and you will see an error like this:error Cannot connect to [wss://<mainServerIP/HostName>/d1ws]: wss://<mainServerIP/HostName>/d1ws: dial tcp: lookup localhost: no such host. . Waiting 3 seconds. Will try until…In this case, navigate to
/usr/local/demisto/d1.confand change theEngineURLsparameter to an address the engine can reach. Check the addresses at the beginning of the upgrade_engine.sh file. If the addresses are not correct, set the correct addresses in the/usr/local/demisto/upgrade.conffile, as a comma-separated list.The configurations that might affect the
upgrade_engine.shscript are the following variables are located at the beginning of the script:SERVER_URLSTRUST_ANY_CERT
If you make a change to the baseURLs configuration, you must apply the change in
/usr/local/demisto/d1.confAND in/usr/local/demisto/upgrade.confunder the SERVER_URLS var. For SERVER_URLS, specify only the IP/hostname and, optionally, a port. Do not includehttps://or any path at the end.If you make a change in the
engine.connection.trust_any_certificateconfiguration, you must apply the change in/usr/local/demisto/upgrade.confas follows:- If the
engine.connection.trust_any_certificateconfiguration was set to true (trust any certificate), set the TRUST_ANY_CERT variable to -k. - If the
engine.connection.trust_any_certificateconfiguration was set to false, the TRUST_ANY_CERT variable should be blank (““).
Any changes made to variables in the
upgrade_engine.shfile are reset after each upgrade. We recommend instead using theupgrade.conffile to set variables.
You can ignore the following error:
Cannot create folder '/var/lib/demisto' - If the engine service is not running, and there’s nothing relevant in the log, run
- To check the connectivity from the engine to the Cortex XSIAM tenant, see Troubleshoot engine connectivity below.
- If the installation issue remains, open a support case with logs from the engine.
- On the engine server, in
/usr/local/demisto/d1.conf, set "LogLevel": "debug”. -
Restart the d1 service and let it run for a few minutes.
sudo systemctl restart d1If the Allow running multiple engines on the same machine option is selected, run the command:
sudo systemctl status d1_<Engine _name> -
Capture a**
journalctl**:journalctl --since "1 day ago" > engineTroubleshootingJournalctl.log -
On the engine server, tar up the log, conf,
journalctl, and install log on the engine.tar -cvzf engineLogs.tar.gz /var/log/demisto /usr/local/demisto/d1.conf /tmp/demisto_install.log engineTroubleshootingJournalctl.log
- On the engine server, in
Troubleshoot engine upgrades
During an upgrade, the upgrade file is sent to the engine server. A cron job running on the engine server checks if that file exists. The most common upgrade error is that the job is not running, so the new installer does not run.
If the installer fails to start due to a permissions issue, even if running as root, add one of the following two arguments when running the installer:
--target <path>- Extracts the installer files into the specified custom path.--keep- Extracts the installer files into the current working directory (without cleaning at the end).
If using installer options such as -- -tools=false, the option should come after the --target or --keep arguments. For example:
sudo ./d1-installer.sh --target /some/temp/dir -- -tools=false
- SSH to the machine.
-
Check the d1 service status on the engine server. It is possible that it stopped or doesn't exist.
sudo systemctl status d1If the Allow running multiple engines on the same machine option is selected, run the command:
sudo systemctl status d1_<Engine _name> -
Access the installer log on the engine server and review the error.
sudo vi /tmp/demisto_install.log - Rerun the installer on the engine using one of the following options. You can open a second window and run
watch df -h. If the problem seems to be disk space, you should resolve the disk space issue and then rerun the installer. - Do one of the following:
-
Download the installer from the user interface and copy it to the engine.
Add the following commands:
sudo chmod +x installer.shsudo ./installer.sh -- -y -
Verify that
/usr/local/demisto/d1_upgrade.shexists.-
Run the following commands:
sudo chmod +x /usr/local/demisto/d1_upgrade.shsudo /usr/local/demisto/d1_upgrade.sh - If
d1_upgrade.shdoesn't exist, check if/usr/local/demisto/archived_d1_upgrade.shexists and that it was created at the time of the attempted upgrade. -
If the file exists and was created at the time of the attempted upgrade, run the following commands on the engine server:
sudo chmod +x /usr/local/demisto/archived_d1_upgrade.shsudo /usr/local/demisto/archived_d1_upgrade.sh
-
-
Troubleshoot engine connectivity
The following provides instructions for troubleshooting connectivity issues from the engine to the endpoint.
- Follow the instructions in network troubleshooting.
-
Ensure that the engine can reach the endpoint by running the following command on the server engine.
sudo curl -kvv <endpointURL> -
If the engine could not reach the endpoint, try the IP with curl instruction adding the http(s)//, or try using ping.
If this works, add the IP to the /etc/hosts file with the hostname and try to reach the endpoint again by running the following command on the engine server
sudo curl -kvv <endpointURL>If this still fails, then this is an issue of connectivity between the engine and endpoint and you need to resolve this with your networking team.
- After connectivity has been confirmed via curl:
-
Try connecting within Docker without passing host networking.
docker run -it --rm demisto/netutils:1.0.0.6138 curl -kvv <endpointURL>If this succeeds but the integration still fails, it could be an integration credentials issue. In that case, open a support case.
-
If, without passing the host networking fails, run the following:
docker run -it --rm --network=host demisto/netutils:1.0.0.6138 curl -kvv <endpointURL>If this succeeds, add **
"python.pass.extra.keys": "--network=host" to /usr/local/demisto/d1.conf**and retest the integration.If you see a Docker or SELinux issue, see Troubleshoot Docker Issues.
-
- If the installation issue remains, open a support case with logs from the engine.
- On the engine server, in
/usr/local/demisto/d1.conf, set "LogLevel": "debug”. -
Restart the d1 service and let it run for a few minutes.
sudo systemctl restart d1If the Allow running multiple engines on the same machine option is selected, run the command:
sudo systemctl status d1_<Engine _name> -
Capture a journalctl:
journalctl --since "1 day ago" > engineTroubleshootingJournalctl.log -
On the engine server, tar up the logs, conf, journalctl, and install log on the engine.
tar -cvzf engineLogs.tar.gz /var/log/demisto /usr/local/demisto/d1.conf /tmp/demisto_install.log engineTroubleshootingJournalctl.log
- On the engine server, in
Engine 443 error
This error might occur when a connection is established between an engine and the Cortex XSIAM tenant, because, by default, Linux does not allow processes to listen on low-level ports.
Error Message
listen tcp :443: bind: permission denied
Solution
- In the
d1.conffile, change the port number to a higher one, for example, 8443. - Run this command:
sudo setcap CAP_NET_BIND_SERVICE=+eip /path/to/binary. After running this command, the server should be able to bind to low-numbered ports.
Bad handshake error
This error can occur in the engine logs relating to a bad handshake on the engine when trying to connect to a Cortex XSIAM tenant.
Error Message
Cannot connect to [wss:/xxx]: [wss://xxx|wss://xxx/]: websocket: bad handshake
Solution
Verify that time is synchronized on the engine to a reliable NTP source. When timing is off on the engine, this can cause a failure during the SSL/TLS handshake process. When time is resynced, connectivity from the engine to the parent server should be restored.
Troubleshoot integrations running on engines
The following are common errors that occur when integrations are running on an engine.
Troubleshoot engine import error or invalid syntax error
When running an integration on an engine, the most common errors are:
Broken Pipe"ImportError: No module named...Invalid syntaxScript failed to run: exec: “python”: executable file not found in $PATH (2603)
These errors could indicate that the engine is not using Docker.
- Use SSH to access the engine server.
- Make sure Docker is healthy.
-
Ensure that Docker is installed and is running.
sudo systemctl status dockerIf the Docker status is not good, restart your Docker.
sudo systemctl restart docker -
Ensure Docker can run a container.
sudo docker run hello-worldIf this fails, reinstall your Docker.
-
-
Access the d1.conf file on the engine server.
sudo vi /usr/local/demisto/d1.conf - Add the
"python.engine.docker": trueconfiguration to the d1.conf file and remove any other configurations related to python and Docker, such as“python.executable.no.docker”. -
Restart the system on the engine server.
sudo systemctl restart d1If the Allow running multiple engines on the same machine option is selected, run the command:
sudo systemctl restart d1_<Engine _name> - Retest the integration from the user interface. This may take a few minutes because it may need to pull the relevant Docker image.
Troubleshoot permission denied
A common error message you may see when running integrations on engines is something like: Got permission denied while trying to connect to the Docker daemon socket at unix:///var/run/docker.sock: Get http://%2Fvar%2Frun%2Fdocker.sock/v1.35/images/json?t.
-
Determine if you are using a Docker group or Dockerroot group by running one of the following on the server engine:
-
ls -la /var/run/docker.sockThe output from this command will show what user/group is running docker.sock. For example:
srw-rw----. 1 root docker 0 Apr 12 20:32 /var/run/docker.sockshows that it’s a Docker group and not Dockerroot.
-
cat /etc/group | grep dockerThis command shows if you are running Docker or Dockerroot.
Docker CE installations typically run Docker, while Docker EE installations typically run dockerroot.
-
- To fix a Docker user, run the following commands on the server engine:
sudo groupadd dockersudo usermod -aG docker demistosudo systemctl restart docker-
sudo systemctl restart d1If the Allow running multiple engines on the same machine option is selected, run the command:
sudo systemctl restart d1_<Engine _name>
- To fix a
dockerrootuser, run the following commands on the server engine:sudo groupadd dockerroot- Set the dockerroot group in
/etc/docker/daemon.json. For example: { "group": "dockerroot" }. sudo usermod -aG dockerroot demistosudo chcon -Rt svirt_sandbox_file_t /var/lib/demisto/tempsudo systemctl restart docker-
sudo systemctl restart d1If the Allow running multiple engines on the same machine option is selected, run the command:
sudo systemctl restart d1_<Engine _name>
Remote repository management
Use a content management system with a remote repository to develop and test content before using it in production.
Cortex XSIAM development tenant
Use a Cortex XSIAM development tenant to create, test, and manage content before deployment to production. Remote repository synchronization lets you promote approved content updates between development and production tenants.
A development tenant is a Cortex XSIAM test environment. It lets you validate content before using it in a production tenant.
Before explaining more about development tenants, it is important to understand what content is.
Content
Content includes integrations, automation scripts, playbooks, and other components that enhance Cortex XSIAM capabilities for case response and threat intelligence management. There are two types of content:
- System content - content packs you can download from Marketplace. Packs are groups of components that implement use cases. Content packs are created by Palo Alto Networks, technology partners, consulting companies, MSSPs, customers, and individual contributors. Depending on the use case, each content pack includes a combination of different components, such as integrations, scripts, playbooks, and widgets.
- Custom or user-defined content - custom components you can develop to meet your business needs.
Cortex XSIAM development tenants
The Cortex XSIAM development tenant provides a safe environment to develop and test content functionality before production deployment.
Development tenants are not intended for performance checks; they cannot access production data, and they are connected to a limited number of endpoints. As a result, all development tenants have fewer resources than the production tenant, including data ingestion capacity and performance, and compute capabilities. In a development tenant, extreme demand for resources for data ingestion or compute may affect performance and cause latency issues.
To make developed content available in production or other development tenants, push it to a remote repository as a content update.
Cortex XSIAM content management with a remote repository
Use Cortex XSIAM content management with a remote repository to develop and test content. Choose the built-in remote repository, which is the default, or a private Git-based repository. Supported private repositories include GitHub, GitLab, Bitbucket, and on-premise repositories.
The development tenant pushes content to the remote repository. The production tenant and additional development tenants pull content from the repository.
Push and pull Cortex XSIAM content between tenants
In a tenant cluster, only one development tenant pushes content. This is the push tenant. The production tenant and any other development tenants pull content as pull tenants.
Push and pull system content updates
Only the development push tenant manages system content and content updates. Pull tenants only pull system content from the push tenant. They cannot download, install, edit, create, or update it.
Only the development push tenant can access Marketplace. Download and install Marketplace content there. Then push it to the remote repository for pull tenants.
Push and pull custom content
Not all custom content supports push and pull. Develop unsupported content in either tenant, or copy it from development to production. Unsupported content includes dashboards, lists, parsing rules, data modeling rules, and correlation rules.
The following system and user-defined content types are push/pull supported:
- Case fields and layouts
- Issue types and fields
- Indicator types and fields
- Issue and indicator layouts
- Layouts
- Classifiers
- Integrations
- Playbooks
- Scripts
For custom content that can be pushed/pulled, when pushing content from the development tenant, the content is pulled into the production or other development pull tenants as content updates. You can decide which updates you want to push from the development push tenant to pull tenants via the remote repository.
Set up a remote repository
Set up a Cortex XSIAM remote repository to manage, version, and synchronize content across development and production tenants. Use the built-in repository, a private Git-based repository, or an on-premise repository.
Cortex XSIAM remote repository considerations
- When you activate a tenant and enable the content repository in Cortex Gateway, Cortex XSIAM uses the built-in repository by default. The built-in remote repository requires less configuration than a private remote repository. You cannot access it directly. Configure a private repository when you enable the remote repository in the tenant.
- When activating a development tenant for a remote repository in Cortex Gateway, all existing cluster tenants must be activated and enabled for push and pull.
- After you enable a remote repository in a production pull tenant, the first activated development tenant pushes content by default. Additional development tenants pull content from the remote repository by default.
- If the content repository option is disabled for the production or development tenant (under Settings → Configurations → General → Remote Repository Settings, toggle the Content repository slider to off), the tenant becomes standalone and does not push or pull content. If you disable the remote repository feature, content on the tenant is not deleted. If you enable the remote repository feature again and the remote repository contains content, you need to choose which content to keep, either the content on the tenant or the content on the remote repository. We recommend backing up any content that you want to keep before enabling again.
- When enabling a remote repository in a tenant:
- If the relevant repository branch is empty, it inherits the content of the tenant.
- If the relevant branch is not empty, you can select which content to keep, either the existing content on your tenant or the existing content on the specified repository. If you want to keep the content on the tenant, you need to first disable the remote repository in the other tenants in the cluster (making them standalone). If even one tenant has remote repository enabled, you can only keep the existing content on the specified repository.
- For a simple single-branch deployment, use the built-in repository. Use a private Git repository for multiple branches or access outside Cortex XSIAM, such as scanner integration. To use a private remote repository with one or more branches, enable it in each tenant. Then configure the required branch in each tenant.
- Activation may take some time. You should receive notification by email that the production or development tenant has completed the activation process.
- Once the activation completes, you can only change content repository settings within the tenant.
Before you set up a remote repository
- If you are changing your remote repository settings, back up existing content to your local computer by navigating to Settings → Configurations → General → Server Settings → Custom Content and click Export all custom content.
- You must have Instance Administrator or Account Admin permission to set up a Cortex XSIAM remote repository.
Set up a built-in remote repository
Set up the Cortex XSIAM built-in remote repository to manage and synchronize content across production and development tenants. Use the scenarios below to configure push and pull tenant roles.
Once enabled, development tenants have a red banner on the top left showing DEV.
Set up a built-in repository for a new development tenant
In this scenario, activate the production tenant as standalone first. Then enable the built-in remote repository in the production pull tenant. The first development tenant becomes the push tenant. Any additional development tenants become pull tenants.
Perform the following procedures in the order listed below.
Task 1. Enable the built-in remote repository in the production tenant.
- In the production tenant, go to Settings → Configurations → General → Remote Repository Settings and toggle the Content repository slider to enable the remote repository. When set to On, the sync direction is Pull.
- In the Repository type field, select Built-in, and save the settings.
Task 2. Activate a Cortex XSIAM development tenant in Cortex Gateway.
- In Cortex Gateway , locate the Cortex XSIAM production tenant where you enabled the built-in repository in task 1.
- Hover over the Cortex XSIAM tenant and click Activate Dev Tenant.
- Define the following fields:
| Name | Details |
|---|---|
| DEV TENANT NAME | Give the Cortex XSIAM dev tenant an easily recognizable name. Choose a name that is 59 or fewer characters and is unique across your company account. |
| REGION | Select the region in which you want to set up the Cortex XSIAM dev tenant. |
| DEV TENANT SUBDOMAIN | Give your Cortex XSIAM dev instance an easy to recognize name that is used to access the tenant directly using the full URL (https://_<subdomain>_xsiam._<region>_.paloaltonetworks.com). |
- Select ENABLE CONTENT REPOSITORY.
- Accept the terms and conditions and activate the tenant.
- Repeat this task to activate any additional development tenants in Cortex Gateway. They will automatically be set to pull.
Set up a built-in repository for existing tenants
In this scenario, production and development tenants were managed separately with different content. Because they are already activated in Cortex Gateway, update their remote repository settings within each tenant.
The first tenant that is enabled pushes its content to the remote repository first. For example, these instructions describe enabling the production tenant first, so the remote repository will initially contain production tenant content. You can enable a development tenant first if you want the remote repository to initially contain the content from the development tenant.
Perform the following procedures in the order listed below.
Task 1. Enable the built-in remote repository in the production tenant.
- In the production tenant, go to Settings → Configurations → General → Remote Repository Settings and toggle the Content repository slider to enable the remote repository. When set to On, the sync direction is Pull.
- In the Repository type field, select Built-in, and save the settings.
Task 2. Enable the built-in remote repository in the development tenants.
Once enabled, the first development tenant becomes the push tenant automatically. For details about Cortex XSIAM push and pull tenants, see cortex-xsiam-development-tenant.
- In the development tenant, go to Settings → Configurations → General → Remote Repository Settings and toggle the Content repository slider to enable the remote repository. When set to On, the sync direction for the first development tenant is Push. The sync direction for any additional development tenants is Pull.
- In the Repository type field, select Built-in, and save the settings.
- Select which content to keep and which to overwrite. If there are any discrepancies between the development tenant and remote repository (which in this example initially contains the production tenant content after it is enabled), the Specified repository is not empty window opens. Options are:
- Existing content on your tenant: Keeps the existing content on your tenant and replaces the content on the specified repository. Cortex XSIAM checks if any other tenants are using the remote repository. If yes, this option is disabled. In this example, the remote repository was already enabled in the production tenant, so the remote repository holds production content. If you want to keep the content on the development tenant:
- Disable the remote repository in any additional enabled tenants. In this case, for the first development tenant, only the production tenant must be disabled.
- Select Existing content on your tenant for this tenant.
- Complete synchronization.
- Re-enable the remote repository in any additional tenants and select Existing content on the specified repository in each additional tenant.
- Existing content on the specified repository: Deletes the existing content on your tenant and replaces it with content from the specified repository.
- Click Continue.
Set up a Private Remote Repository
Set up a private Git remote repository in Cortex XSIAM to manage and synchronize content across development and production tenants. Configure connectivity through Cortex XSIAM or an engine with repository access.
Before you begin, verify network connectivity from Cortex XSIAM to the private remote repository. All communication goes through Cortex XSIAM. If direct access is unavailable, use an engine that can access the repository.
TIP
Due to security concerns, there is a closed allow list of approved URLs for private repositories. If you want to use a URL that is excluded from the allow list, use an engine (engine groups are not supported).
Use the following scenarios to configure a private remote repository for a production tenant and one or more development tenants.
Once enabled, the development push tenant has a red banner on the top left showing DEV.
Set up a private repository for a new development tenant
In this scenario, activate the production tenant as standalone first. Then enable the private remote repository in the production pull tenant. The first development tenant becomes the push tenant. Any additional development tenants become pull tenants.
Perform the following procedures in the order listed below.
Task 1. Enable the private remote repository for the production tenant
- In the production tenant, go to Settings → Configurations → General → Remote Repository Settings and toggle the Content repository slider to enable the remote repository. When set to On, the sync direction is Pull.
- In the Repository type field, select Private, and save the settings.
- Define the Git settings using HTTPS or SSH.
- For repository vendors that use tokens, enter the token type in the username field and the token in the password field. Verify details with your vendor.\
If your private Git remote repository uses personal access tokens instead of usernames and passwords, enter the token type in the username field and the access token in the password field. For example, if you use an OAuth2 token, enteroauth2in the username field. For Github, enter your username in the username field. - If using SSH, RSA or ed25519 algorithm private keys are supported. If your SSH connection uses a port other than port 22 (the default SSH port), you must include the SSH string and port number in the Repository URL field. In the following example, we use port 20017:\
ssh://git@content.demisto.com:20017/~/my-project.git
- Select the active branch on which you will be working.
- In the Advanced section, the engine is set by default. You can change the engine by selecting from the list of available engines.
You can't add an engine that has been added to a Load-Balancing Group.
Task 2. Activate a Cortex XSIAM development tenant in Cortex Gateway
- In Cortex Gateway , locate the Cortex XSIAM production tenant where you enabled the private repository in Task 1.
- Hover over the Cortex XSIAM tenant and click Activate Dev Tenant.
- Define the following fields:
| Name | Details |
|---|---|
| DEV TENANT NAME | Give the Cortex XSIAM dev tenant an easily recognizable name. Choose a name that is 59 or fewer characters and is unique across your company account. |
| REGION | Select the region in which you want to set up the Cortex XSIAM dev tenant. |
| DEV TENANT SUBDOMAIN | Give your Cortex XSIAM dev instance an easy-to-recognize name that is used to access the tenant directly using the full URL (https://_<subdomain>_xsiam._<region>_.paloaltonetworks.com). |
- Accept the terms and conditions and activate the tenant.
Task 3. Configure the private Git repository in development tenants
The first development tenant automatically becomes the push tenant. For details about Cortex XSIAM push and pull tenants, see cortex-xsiam-development-tenant.
- In the development tenant, go to Settings → Configurations → General → Remote Repository Settings and toggle the Content repository slider to enable the remote repository. When set to On, the sync direction for the first development tenant is Push. The sync direction for any additional development tenants is Pull.
- In the Repository type field, select Private.
- Define the private Git repository settings using HTTPS or SSH.
- Select the active branch on which you will be working.\
You can either use the same branch as for the pull tenant (production or additional development tenant), or a different branch. If using a different branch, you need to define a manual or automatic merge between branches which is done outside Cortex XSIAM. - In the Advanced section, the engine is set by default. You can change the engine by selecting from the list of available engines.
- Select the active branch on which you will be working.\
- If your private Git remote repository uses personal access tokens instead of usernames and passwords, enter the access token in the password field and leave the username field blank.
- For repository vendors that use tokens, the token type is entered in the username field, and the token is entered in the password field. Verify details with your vendor.
- If using SSH, only RSA private keys are supported. If your SSH connection uses a port other than port 22 (the default SSH port), you must include the SSH string and port number in the Repository URL field. In the following example, we use port 20017:\
ssh://git@content.demisto.com:20017/~/my-project.git
- Save the settings.
- Repeat tasks 2 and 3 to enable the private remote repository in each additional development tenant. They will automatically be set to pull.
Set up a private repository for existing tenants
In this scenario, production and development tenants were managed separately with different content. Because they are already activated in Cortex Gateway, update their remote repository settings within each tenant.
The first tenant that is enabled pushes its content to the remote repository first. For example, these instructions describe enabling the production tenant first, so the remote repository will initially contain production tenant content. You can enable a development tenant first if you want the remote repository to initially contain the content from the development tenant.
Perform the following procedures in the order listed below.
Task 1. Enable the private remote repository for the production tenant
- In the production tenant, go to Settings → Configurations → General → Remote Repository Settings and toggle the Content repository slider to enable the remote repository. When set to On, the sync direction is Pull.
- In the Repository type field, select Private, and save the settings.
- Define the Git settings using HTTPS or SSH.
- For repository vendors that use tokens, enter the token type in the username field and the token in the password field. Verify details with your vendor. If your private Git remote repository uses personal access tokens instead of usernames and passwords, enter the token type in the username field and the access token in the password field. For example, if you use an OAuth2 token, enter
oauth2in the username field. For Github, enter your username in the username field. - If using SSH, RSA or ed25519 algorithm private keys are supported. If your SSH connection uses a port other than port 22 (the default SSH port), you must include the SSH string and port number in the Repository URL field. In the following example, we use port 20017:\
ssh://git@content.demisto.com:20017/~/my-project.git
- Select the active branch on which you will be working.
- In the Advanced section, the engine is set by default. You can change the engine by selecting from the list of available engines.\
You can't add an engine that has been added to a Load-Balancing Group.
Task 2. Enable the private remote repository in the development tenants.
Once enabled, the first development tenant automatically becomes the push tenant. For details about Cortex XSIAM push and pull tenants, see cortex-xsiam-development-tenant.
- In the development tenant, go to Settings → Configurations → General → Remote Repository Settings and toggle the Content repository slider to enable the remote repository. When set to On, the sync direction for the first development tenant is Push. The sync direction for any additional development tenants is Pull.
- In the Repository type field, select Private.
- Define the private Git repository settings using HTTPS or SSH.
- Select the active branch on which you will be working.
- In the Advanced section, add any engines you want to connect.
- If your private Git remote repository uses personal access tokens instead of usernames and passwords, enter the access token in the password field and leave the username field blank.
- For repository vendors that use tokens, the token type is entered in the username field and the token is entered in the password field. Verify details with your vendor.
- If using SSH, only RSA private keys are supported. If your SSH connection uses a port other than port 22 (the default SSH port), you must include the SSH string and port number in the Repository URL field. In the following example, we use port 20017:\
ssh://git@content.demisto.com:20017/~/my-project.git
- Select which content to keep and which to overwrite. If there are any discrepancies between the development tenant and remote repository (which in this example initially contains the production tenant content after it is enabled), the Specified repository is not empty window opens. Options are:
- Existing content on your tenant: Keeps the existing content on your tenant and replaces the content on the specified repository. Cortex XSIAM checks if any other tenants are using the remote repository. If yes, this option is disabled. In this example, the remote repository was already enabled in the production tenant, so the remote repository holds production content. If you want to keep the content on the development tenant:
- Disable the remote repository in any additional enabled tenants. In this case, for the first development tenant, only the production tenant must be disabled.
- Select Existing content on your tenant for this tenant.
- Complete synchronization.
- Re-enable the remote repository in any additional tenants and select Existing content on the specified repository in each additional tenant.
- Existing content on the specified repository: Deletes the existing content on your tenant and replaces it with content from the specified repository.
- Click Continue.
Push and pull content
Use a Cortex XSIAM remote repository to push and pull content between development and production tenants. Synchronize playbooks, scripts, automation logic, and integrations after testing them in a development environment.
Push Cortex XSIAM content from a development tenant
When developed content is ready for production, push the content update from the development tenant to the remote repository.
Cortex XSIAM content push considerations
- Push
- Role-level requirements: The ability to push playbooks and scripts to a remote repository is governed by a specific set of RBAC permissions. Your role must have Scripts and Playbooks enabled (under Investigation & Response → Automations with Edit Public selected for both) and Cases and Issues (under Cases & Issues) set to View/Edit.
- Push scope: When a push is initiated, the system synchronizes all custom content, such as all playbooks and scripts, within the tenant to the remote repository.
For more information, see Manage access to playbooks and scripts, including the Remote Repositories (Push/Pull) section.
- Manual export: Do not manually export content from the development tenant to import to the production tenant. Use only the procedures outlined in the documentation to ensure that your content is properly updated in the production tenant.
- Version compatibility: We do not recommend pushing content from a development tenant to a production tenant if they have different versions. This helps avoid compatibility conflicts, versioning errors, and unintended behavior in the production environment.
Deploy content across different Cortex XSIAM versions
Separating development and production environments into deployment phases lets you test an upgrade version before production deployment. New features might not work in a pre-upgrade environment. Cortex XSIAM displays warnings, visual indicators, and collapsible release notes for incompatible items.
Push content from a Cortex XSIAM development tenant
On each page you can decide whether to include or exclude items, which prevents them from being pushed to production, on a temporary or permanent basis. You can only exclude individual content items, not content packs.
- In the development tenant, select Settings → Configurations → Remote Repository Content → User-Defined Content.
- Under the Included for Prod tab, search for the items you want to push. The results are displayed in a table according to:
- NAME: The name of the content item.
- TYPE: The content type, for example playbook, script, issue layout, and issue field.
- STATUS: The date the content item was created.
- MESSAGE: Additional details about the content item that were added by the content owner.
- BY: The content item of the person who performed the commit for the change or creation of the content.
- Select the items you want to push to production, and click Push to Prod.
- If the items have dependencies, review the contents and click Push.\
Sometimes you may not want to push all content, content pack dependencies, etc. For example, when a user makes a change in a playbook that includes a script dependency to which another user is adding a feature, and the change does not require the new feature (version) of the script, you can push the playbook without the new script. - In the dialog box, add an optional message and click Push. You can now pull the content into the production tenant as explained below.
Pull Cortex XSIAM content into a production tenant
After you push content from the development tenant, the production tenant displays Remote Repository Content Available. For content conflicts, choose whether to keep local content or replace it.
Cortex XSIAM content pull considerations
When pulling content from a remote repository, Cortex XSIAM handles ownership differently depending on whether the content is new or already exists in the environment:
- Existing playbooks and scripts: If the playbook or script already exists in the target environment, the content is updated while the current ownership and access configurations remain unchanged.
- New playbooks and scripts (access and ownership): New playbooks and scripts always arrive in a Restricted state, regardless of the access or sharing permissions they had in the development tenant. Ownership assignment depends on your Remote Repository Settings for access to new content as explained in the task below.
In a production (pull) tenant, manual editing of synchronized content is blocked:
- Users cannot be granted Editor permissions.
- Any existing Editor permissions (set before the tenant was configured for remote repository synchronization) are effectively treated as Viewer access. These capabilities are removed from Cortex XSIAM and blocked by the system regardless of role-level permissions.
PREREQUISITE
When pulling playbooks or scripts from a remote repository into a production tenant, you must define how ownership and access are assigned for the incoming object's new content.
- Select Settings → Configurations → General → Remote Repository Settings.
- Under Access to new content, choose how to assign ownership for pulled content:
- Keep the original owner: Select this when the user managing access is the same in both tenants. This user is designated as the Owner in the production tenant. Recommended option when the same users exist in both the pushing tenant and the pulling one.
- Owner is the user pulling content into the production tenant (default): Select this when users pulling content should also manage their access. The user who manually triggers the pull action is designated as the Owner.
- Assign new content to this user: Select this when a specific user is responsible for managing access to new content. An administrator specifies a specific user as the Owner of all playbooks and scripts included in the pull.
- Set the General access state:
- Restricted: Private to the new Owner.
- Public: Visible to all authorized users.
Pull content into a Cortex XSIAM production tenant
- If you click Remote Repository Content Available in the navigation bar, the Content update available window opens with a list of content available for installation, including content packs and content items.
- Click Check for new content or Install content.
- If conflicts appear, click Resolve conflicts.
- In the Action column, select one of the following:
- Skip: Keeps the local content in your production environment.
- Replace: Deletes the local content and installs the content from the content repository.
- Click Continue to install the content.
Remote repository troubleshooting
Use this guide to resolve common Cortex XSIAM remote repository configuration issues. These issues include non-empty Git branches and repository type changes.
Resolve non-empty branch errors when enabling a tenant
When you configure a Cortex XSIAM tenant to use a remote repository, choose one of these options:
- Overwrite all content in the tenant with content from the repository.
- Overwrite all content in the remote repository with content from the tenant.
To overwrite the remote repository with tenant content, use an empty branch. A non-empty branch produces an error that prompts you to select an empty branch. Alternatively, overwrite tenant content with content from the remote repository.
Switch between built-in and private remote repositories
Switching between built-in and private remote repository types can remove version history. Cortex XSIAM displays a warning before you make the change.
To retain content history, select Existing content on your tenant. This overwrites remote repository content with tenant content.
Customize cases and issues
External integrations
You can integrate external threat intelligence services with Cortex XSIAM that provide additional verification sources for each key artifact in a case. Cortex XSIAM supports the following integrations:
Threat intelligence
| Integration | Description |
|---|---|
| WildFire | <p>Cortex XSIAM automatically includes WildFire threat intelligence in the case and issue investigation.</p><p>WildFire detects known and unknown threats, such as malware. The WildFire verdict contains detailed insights into the behavior of identified threats. The WildFire verdict is displayed next to relevant Key Artifacts in the Cases page. See Review WildFire analysis details for more information.</p> |
| VirusTotal | <p>VirusTotal provides aggregated results from over 70 antivirus scanners, domain services included in the block list, and user contributions. The VirusTotal score is represented as a fraction. For example, a score of 34/52 means out of 52 queried services, 34 services determined the artifact to be malicious.</p><p>To view VirusTotal threat intelligence in cases, you must obtain the license key for the service and add it to the Cortex XSIAM Configuration. When you add the service, the relevant VirusTotal (VT) score is displayed in the Cases page under Key Artifacts.</p> |
Case management
| Integration | Description |
|---|---|
| Third-party ticketing systems | To manage cases from the application of your choice, you can use the Cortex XSIAM API Reference to send issues and issue details to an external receiver. After you generate your API key and set up the API to query Cortex XSIAM, external apps can receive case updates, request additional data about cases, and make changes such as setting the status and changing the severity or assigning an owner. To get started, see the Cortex XSIAM API Reference guide. |
Set up case scoring
Set up Cortex XSIAM case scoring to prioritize cases and issues. Enable SmartScore and configure user-defined scoring rules that match your investigation criteria.
Enable Cortex XSIAM SmartScore
Enable SmartScore before you configure Cortex XSIAM case scoring rules.
- Select Settings → Configurations → Cortex XSIAM- Analytics and click Enable.
- Select Cases & Issues → Case Configuration → Case Scoring and enable SmartScore.
On the first activation, it can take up to 48 hours for SmartScore to calculate and display the score.
Enabling SmartScore subsequently impacts the User Score.
Create case and issue scoring rules
-
Select Cases & Issues → Case Configuration → Case Scoring → Scoring Rules and enable User Scoring Rules.
The Scoring Rules table displays the user-defined rules and sub-rules.
- Click Add Scoring Rule.
- In the Create New Scoring Rule dialog, define the rule criteria:
- Score = 30
- Base Rule = Root
-
Filters:
Issue Source=XDR BIOC AND Severity=Critical
-
Click Create.
You are automatically redirected to the Scoring Rules table.
-
In the Scoring Rules table, click Save to save your scoring rule.
For scoped users, a small lock icon indicates that you don't have permissions to edit a rule.
Manage existing case scoring rules
In the Scoring Rules table, take the following actions to review your rules and sub-rules:
- Use the arrows to rearrange rule priorities. Click Save after any changes.
- Select one or more rules and right-click to see the available actions.
Scope-Based Access Control for case scoring
Case scoring supports Scope-Based Access Control (SBAC). If you're a scoped user, a small lock icon indicates that you cannot edit a rule. The following parameters apply when you edit a scoring rule:
- If Scope-Based Access Control (SBAC) is enabled and Endpoint Scoping Mode is set to restrictive mode, you can edit a rule if you are scoped to all tags in the rule.
- If Scope-Based Access Control (SBAC) is enabled and Endpoint Scoping Mode is set to permissive mode, you can edit a rule if you are scoped to at least one tag listed in the rule.
- To change the order of a rule, you must have permissions to the other rules of which you want to change the order.
- If a rule was added when set to restrictive mode, and then changed to permissive (or vice versa), you will only have view permissions.
Create a starring configuration
Create a Cortex XSIAM starring configuration to automatically flag priority issues and linked cases. Define issue-based criteria to focus investigations on the most relevant cases.
Create an issue and case starring rule
- Select Cases & Issues → Case Configuration → Starred Issues.
- Select Add Starring Configuration.
- Under Configuration Name, enter a name for the issue and case starring rule.
- (Optional) Under Comment, enter a descriptive comment.
-
In the issue table, use the filters to define the issue attributes you want to include in the match criteria. For example, you can select issues with High severity, issues by category, or issues associated with certain assets or asset providers.
Tip
Right-click an issue field to add it as match criteria.
- Click Create.
Scope-Based Access Control for starring configurations
Case starring supports Scope-Based Access Control (SBAC). The following parameters apply when you edit a starring configuration:
- If Scope-Based Access Control (SBAC) is enabled and the Endpoint Scoping Mode is set to restrictive mode, you can edit a configuration if you are scoped to all tags in the configuration.
- If Scope-Based Access Control (SBAC) is enabled and the Endpoint Scoping Mode is set to permissive mode, you can edit a configuration if you are scoped to at least one tag listed in the configuration.
- If a policy was added when set to restrictive mode, and then changed to permissive (or vice versa), you will only have view permissions.
Create custom case statuses and resolution reasons
Before you begin
Before you create a custom status, review the built-in options. For more information, see Resolution reasons for cases and issues.
We recommend using the built-in statuses and resolution reasons where possible. Custom statuses and resolution reasons might not be supported by all content, and status syncing can take time.
In addition, custom statuses affect Cortex XSIAM’s ability to learn, correctly identify, and score future cases.
Create custom case statuses and resolution reasons that match your workflow. These settings apply to cases and issues. You can also use them in playbooks.
Creating custom case statuses and resolution reasons requires the View/Edit RBAC permission for Case Properties under Configurations → Object Setup.
After creation, custom statuses and resolution reasons cannot be deleted or modified.
Create custom case statuses
-
Go to Configurations → Object Setup → Cases → Properties.
The existing statuses and resolution types are listed.
- In the Add another status field, type a new status and click Save.
- Click Edit to rearrange the order of the statuses. This order is presented when you set a status or select a resolution type.
Create a sync profile
Create Cortex XSIAM sync profiles to map issue fields and synchronize issue data with external applications. Field mapping transfers values such as Status and Description accurately, even when systems use different terminology.
When you link an issue to an external application, such as Jira or ServiceNow, or configure an automation, select the required sync profile. Cortex XSIAM provides default inbound and outbound sync profiles. You can also create custom profiles.
Create a Cortex XSIAM issue sync profile
- Go to Settings → Configurations → Object Setup → Issues → Sync Profiles.
- Click New Profile.
- Type a profile name and description.
- Under Integration, select the external application for field mapping, such as Jira V3 or ServiceNow V2.
-
Under Sync Direction, select Inbound or Outbound.
Inbound maps fields from the external application to Cortex XSIAM. Outbound maps fields from Cortex XSIAM to the external application.
If you use bi-directional syncing, you need to provide both an Inbound and an Outbound sync profile.
- Under Field Mapping, select a field to map and select the corresponding field. For example, Jira: Priority, Cortex: Severity.
-
Define one or more values for each field that you want to map.
- Blank fields are skipped.
- You must define exact values.
- Custom status values are not currently supported.
- Support is currently limited to a specific set of fields.
-
Click Save.
In this example, the sync profile specifies Inbound mapping from Jira v3 fields to Cortex fields.
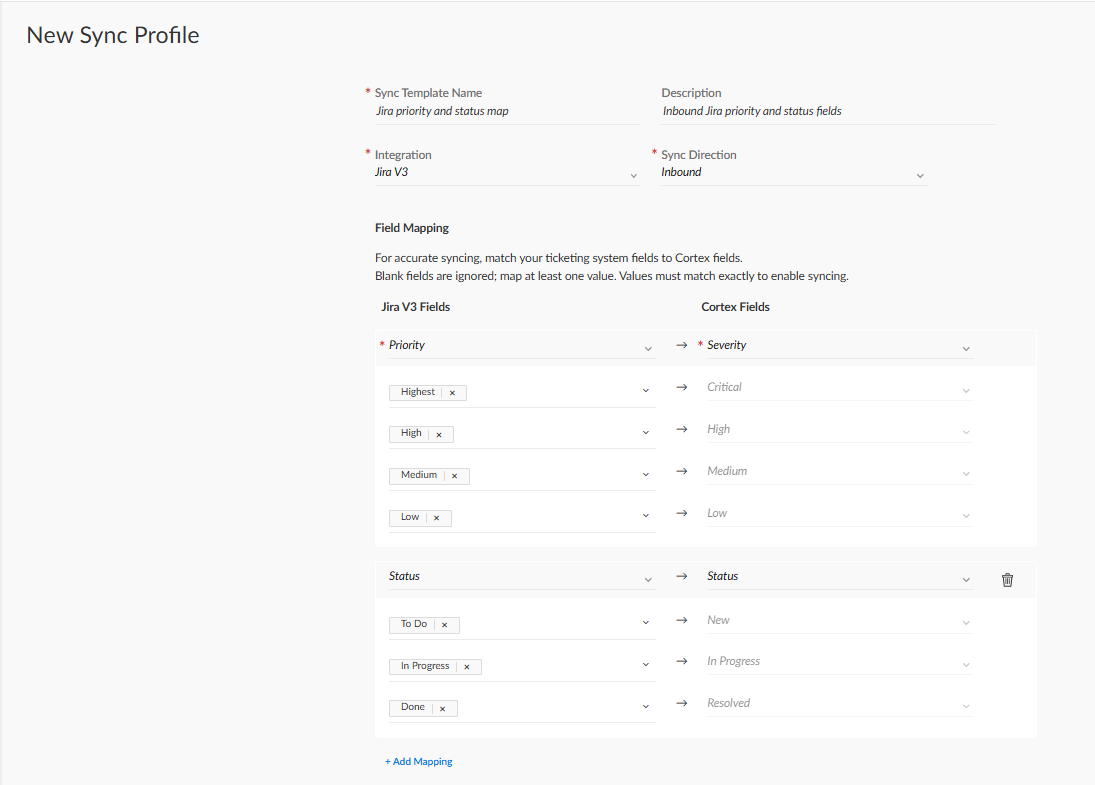
Create a case domain
Before you add a custom domain, please review the built-in options. For more information, see Case and issue domains.
We recommend using the built-in domains where possible. Custom domains might not be supported by all content. In addition, custom domains affect Cortex XSIAM’s ability to learn, correctly identify, and score future cases.
Smart grouping and SmartScore are not supported for custom domains.
Create custom Cortex XSIAM case domains to separate work efforts and organize case management workflows. Each domain can use tailored statuses, resolution reasons, and access controls.
Manage Cortex XSIAM case domains
View all case domains under Configurations → Object Setup → Cases → Domains. You can edit built-in domain properties and create custom domains.
Consider the following information:
- You can't merge cases with different domains.
- SmartScore and smart grouping are not supported for custom domains.
- For SBAC, use the Cases and Issues scoping area to define case and issue domains that enable you to control access to your domains. For more information, see Manage user scope.
- Domains might affect custom content that is connected to cases and issues. Review your custom content to ensure it is associated with the intended domains. This includes:
- Automation Rules
- Starring Rules
- Notifications
- Issue Exclusions
- Scoring Rules
- XQL that accesses the cases or issues datasets in Scheduled Queries and Widgets
Create a custom Cortex XSIAM case domain
- Adding custom domains requires a View/Edit RBAC permission for Case Properties (under Object Setup).
- Once created, a custom case domain cannot be deleted or renamed.
-
Go to Settings → Configurations → Object Setup → Cases → Domains .
The existing domains are listed.
- Click on + New Domain.
- Assign a name and color to the domain, and an optional description.
- In the Status field, select one or more statuses that are relevant to the domain. These statuses will be available for selection in the cases and issues associated with this domain.
- In the Resolution Type field, select one or more resolution reasons that are relevant to the domain. These reasons will be available for selection in the cases and issues associated with this domain.
- Click Save.
- (Optional) Update SBAC scoping to enable access to the domain.
- You can perform the following:
- To enable access to the domain for a User Group, go to Settings → Configurations → Access Management → User Groups.
- To enable access to the domain for a User, go to Settings → Configurations → Access Management → Users.
- To enable access to the domain for an API key, got to Settings → Configurations → Integrations → API Keys.
- When editing an existing User Group, User, or API key, in the Scope tab you can update the granular scoping for the new Endpoints domain.
- Click Save.
- You can perform the following:
Customize case fields and layouts
You can create custom case fields and custom case layouts. Custom case layouts can include both out-of-the-box and custom case fields. Case layouts are applied to cases according to layout rules.
Case fields
Cortex XSIAM includes out-of-the-box case fields, fields from installed content packs, and user-defined custom fields. Use case fields in custom case layouts and the Cases table.
Custom case fields can be exported and imported. To export a single custom case field, right-click on the field in the fields table, and select Export. To export all custom case fields in a single JSON file, click the Export All button above the fields table. System case fields cannot be exported or imported.
After a custom case field is created, it can be edited, deleted, or exported by right-clicking on the row. The field name and field type cannot be changed after the field is created. System fields cannot be edited, deleted, or exported.
Deleting a case field or uninstalling a content pack containing a case field may affect capabilities based on the deleted field, layouts and case scoring.
Case field types
Cortex XSIAM case field types determine how case data is captured, displayed, and used. You can create the following case field types:
| Field | Description |
|---|---|
| Boolean | True or False
|
| Date picker | Adds the date to the field. Supported time formats for validation are ISO 8601 and Epoch. Other values are treated as null. Note You cannot set filters, starring rules, automation rules, layout rules, or issue exclusions based on the values in custom timestamp fields. |
| Grid (table) | Include an interactive, editable grid as a field. For details, see Create a grid field for a case. Note When grid field is shown in the Cases table, if there are values in the field, they do not display in the Cases table. Instead, the column shows Data Available. |
| HTML | Create and view HTML content. Note When an HTML field is shown in the Issues table, if there is a value in the field, it does not display in the Cases table. Instead, the column shows Data Available. |
| Long text |
|
| Markdown | Add markdown-formatted text as a Template which is displayed to users in the field. Markdown lets you add basic formatting to text to provide a better end-user experience. Note When a Markdown field is shown in the Cases table, if there is a value in the field, it does not display in the Cases table. Instead, the column shows Data Available. |
| Multi select / Array | Includes two options:
In the Basic Settings section, enter a comma-separated list of values. |
| Number | Can contain any number. Default is 0. |
| Short Text |
|
| Single select | Select one from a list of options. Add a list of comma-separated values. By default, the first value is used, unless the checkbox for Use first as default is cleared. |
| SLA | SLA can be used to trigger a notification when the status affecting the SLA of a case changes. In this example, if the SLA is breached an email is sent to the owner's supervisor. For more information on SLAs, see Create case timers and SLAs. |
| Timer | Timer fields enable you to view how much time has passed since the timer was started and how much time remains until the timer times out. You can also configure a script to run when a timer times out. |
| URL | Contains a URL. |
Note
If you make changes to case fields you can update the context data by running a playbook, script, or command. For more information, see Update case fields.
To update dynamic custom case fields, such as SLA and Timer fields, see Update case timer and SLA fields.
Create custom case fields
Create custom case fields in Cortex XSIAM to add them to custom case layouts.
You can create custom case fields to:
- Map raw JSON fields from incoming issues.
- Display custom fields data in the Cases table.
- Create correlation rules that generate issues from XQL queries and map the output of the queries to custom case fields.
- Design custom case layouts that include custom case fields.
Create a new custom case field in Cortex XSIAM:
- Select Settings → Configurations → Object Setup → Cases → Fields → New Field.
-
Choose a field type and enter a field name. You can add an optional tooltip to provide users with information about the field.
If adding a grid, see Create a grid field for a case.
- Save your changes.
Custom case fields can be exported and imported. To export a single custom case field, right-click on the field in the fields table, and select Export. To export all custom case fields in a single JSON file, click the Export All button above the fields table.
After a custom case field is created, it can be edited, deleted, or exported by right-clicking on the row. The field name and field type cannot be changed after the field is created.
Create a grid field for a case
In Cortex XSIAM, grid case fields enable you to view and edit tables in a custom case layout.
- Select Settings → Configurations → Object Setup → Cases → Fields → New Field.
- In the New Case Field window Field Type field drop down list, select Grid (table).
-
Complete the following parameters:
Parameter Description Field Name A meaningful name for the grid field. Tooltip (Optional) A brief descriptive message that explains what the field is and how to use it. User can add rows (Optional) Enables users to add/remove rows in the grid. -
In the Grid tab, add or remove the required rows and columns.
How you design the grid determines how it appears to users. If the user can add rows field is selected, the user can add rows but not columns.
-
Configure each column by selecting the required field types, such as short text, Boolean, URL, etc. You can move the columns, rename, add values, etc.
If you select the Lock check box, the value for that field is static (not editable). If you do not select the Lock check box (default), users can perform inline editing.
- Click Save.
Update case fields
Update Cortex XSIAM case fields when an issue changes. Use CLI commands, scripts, or playbooks to automate case data updates during an investigation. For example, you can change a case name, star a case, or update its status.
You can update the following case fields through a playbook, script, or command:
- manual_severity
- starred
- assigned_user_email
- status
- score
- incident_name
- description
Use the following methods to update case fields with the CLI, a script, or a playbook.
Update case fields with the Cortex XSIAM CLI
Run the !setParentIncidentFields command in the issue or case War Room.
When you start typing the CLI provides the available options. If you select an enum field the CLI provides the available values.
Examples
-
To change the name of the case to
Malware, run!setParentIncidentFields incident_name=Malware
-
To change the name of the case to
Malwareand star the case, run!setParentIncidentFields incident_name=Malware starred=true
Update case fields with a script
When a script runs in an issue, its data is added to the issue context data and issue fields. To update case fields, add setParentIncidentFields to the demisto.executeCommand function in a JSON file.
Example
To update the case status to resolved, run
demisto.executeCommand("setParentIncidentFields", {"status":"resolved_other"})
Ensure that you have the required RBAC permission to write scripts.
Update case fields with a playbook
When a playbook runs, data is added to issue context data and issue fields by default. Configure playbook tasks to also add data to case context data and case fields.
The following example explains how to add tasks to a playbook that update the case fields to star a case, and add the key starred: true to the case context data.
Add the following tasks to a new or existing playbook.
- Create a Conditional task to check whether the parent incident fields are starred using the ${parentIncidentFields.starred} key.
- Create a standard task using the setParentIncidentFields script to update the starred field.
- Create a standard task to print the value to the War Room.
- Run the playbook.\
In the case context data, you can see the key starred: true. If running in an issue or a case, after refreshing the case, the case is now starred.
Case layouts
Cortex XSIAM includes default case layouts. The default case layouts and any layouts that are added from content packs, are locked by default and cannot be deleted, edited, exported or duplicated.
You can add customized case layouts, of which you can Edit, Duplicate, Delete or Export. When creating or editing a case layout, you can only add/edit tabs that you created. You cannot edit the default tabs that exist in the layout.
Create custom layouts
Create custom Cortex XSIAM case layouts to control the fields, tabs, sections, and action buttons shown for different case types. Layouts can include custom and out-of-the-box case fields.
Custom tabs can be renamed, hidden, duplicated, or deleted. Hover over a tab name, click the settings button, and select an option. Drag and drop tabs to change their order. Empty fields are hidden by default. To show them, select Show empty fields from the tab settings.
You cannot edit the Overview, Key Assets & Artifacts, Issues & Insights, Timeline, War Room, and Executions system tabs. Select Hide Tab to hide a system tab without deleting it.
Export custom case layouts and duplicated system layouts. To export one case layout, right-click it in the layouts table and select Export. To export all custom layouts and duplicated system layouts as one JSON file, click Export All above the table.
Import a custom case layout by clicking Import and uploading its JSON file.
Create a custom Cortex XSIAM case layout
- Select Settings → Configurations → Object Setup → Cases → Layouts → New Layout.
- Enter a name for the layout.
-
To add a section, click on New or from the Library , under the Sections tab, drag and drop New Section into the new custom tab. You can also add a Notes section to the tab.
By clicking on the pencil icon for a section, you can configure how a section appears, by hiding or showing the section header, as well as configuring the section fields to appear in rows or as cards.
-
To add custom or out-of-the-box case fields to the layout, drag the fields from the Fields tab into existing sections or new sections that you added to the layout.
Limit the number of case fields to 50 in each section. You can create additional sections as needed.
-
Add buttons to the layout.
Buttons allow you to add tasks to your layout, which can assist an analyst. For example, you can add a button to scan a host or kill a process.
- From the Fields and Buttons tab of the Library, drag a buttons into a section of the layout.
- Click to configure.
-
Enter a descriptive name for the button, select a color, and select the script that you want to run when the button is clicked.
For fields (script arguments) that are optional, you can define whether to show them to analysts when they click on buttons. To expose an optional field, select the Ask User checkbox next to the script argument(s) in the button settings page.
The script that runs when an action button is clicked accepts only mandatory arguments through the pop up window and does not provide an option for any non-mandatory arguments to be filled in when the button is clicked. We recommend using a wrapper script to collect and validate arguments in scenarios where there can be a combination of mandatory and non-mandatory arguments for a button.
For information on Filters and Transformers, refer to Filter and transform data.
- Save the layout.
- (Optional) To modify an existing layout, right-click the layout in the layout table and select Edit, Duplicate, Delete, or Export.
Create rules for case layouts
Create Cortex XSIAM case layout rules to apply custom layouts based on case criteria. For example, assign a specific case layout to high-severity cases.
You can create multiple case layout rules. Cortex XSIAM checks each rule until one applies to an incoming case. Content pack layout rules appear first by default. Drag and drop rules to change their order. Filter rules by name, description, rule, layout, or source. If no rule applies, Cortex XSIAM uses the default case layout.
To edit or delete an existing case layout rule, right-click it in the list. Then select Edit or Delete.
Case layout rules support Scope-Based Access Control (SBAC). The following parameters apply to editing access.
- If Scope-Based Access Control (SBAC) is enabled and Endpoint Scoping Mode is set to restrictive mode, you can edit a rule if you are scoped to all tags in the rule.
- If Scope-Based Access Control (SBAC) is enabled and Endpoint Scoping Mode is set to permissive mode, you can edit a rule if you are scoped to at least one tag listed in the rule.
- As a scoped user who has editing permissions to a rule, you can change the order among other rules that are locked.
- If a rule was added when set to restrictive mode, and then changed to permissive (or vice versa), you will only have view permissions.
Create a Cortex XSIAM case layout rule
- Select Settings → Configurations → Object Setup → Cases → Layout Rules → New Rule.
- Enter a Rule Name, select the custom or out-of-the-box Layout to Display if the rule is met, and provide a Description.
- Search for cases matching the case layout rule criteria. For example, search for cases from a specific case source.
- Click Create.
- Repeat as needed to create multiple rules.
- Click Save.
Customize issue fields and layouts
You can create custom issue fields and custom issue layouts. Custom issue layouts can include both out-of-the-box and custom issue fields. Issue layouts are applied to issues according to layout rules.
Topics
Manage Cortex XSIAM issue fields
Use Cortex XSIAM issue fields to support field mapping, correlation rules, custom issue layouts, and investigations. Cortex XSIAM includes system issue fields, content pack fields, and user-defined custom issue fields.
View custom issue fields in the Issues table
All system and custom issue fields are available in the Issues table. New custom fields are hidden by default. To show them, click the three-dot vertical ellipses and select the required columns.
For Grid, HTML, and Markdown fields containing data, the Issues table shows Data Available instead of values. Open the issue and click Investigate to view the full issue layout. For multi-select fields, the table shows the first value and the number of additional values. For example, if a field holds x, y, and z, it shows x + 2 More.
Review issue field history
Cortex XSIAM stores the original and current values when they differ. It does not store intermediate values. For example, if a value changes from x to m to y, Cortex XSIAM stores only x and y. To compare field values, hover over the updated issue fields icon on the right side of an issue row. To revert all fields to their original values, click Restore all fields to their original values. This also restores original values in issue context data. You cannot undo this action.
Import and export custom issue fields
Import and export custom issue fields. To export one field, right-click it in the fields table and select Export. To export all custom fields as one JSON file, click Export All above the table. You cannot import or export system issue fields.
After you create a custom issue field, right-click its row to edit, delete, or export it. You cannot change the field name or field type. You cannot edit, delete, or export system fields.
Deleting an issue field or uninstalling a content pack containing an issue field may affect detection and other capabilities based on the deleted field. For example, correlation, layouts, case scoring, starring rules, and playbook triggers.
Issue field types
You can create the following types of issue fields.
| Field | Description |
|---|---|
| Boolean | True or False
|
| Date picker | Adds the date to the field. Supported time formats for validation are ISO 8601 and Epoch. Other values are treated as null. You cannot set filters, starring rules, automation rules, layout rules, or issue exclusions based on the values in custom timestamp fields. |
| Grid (table) | Include an interactive, editable grid as a field. For details, see Create a grid field for an issue. When a grid field is shown in the Issues table, if there are values in the field, they do not display in the table. Instead, the column shows Data Available. |
| HTML | Create and view HTML content. When an HTML field is shown in the Issues table, if there is a value in the field, it does not display in the Issues table. Instead, the column shows Data Available. The following HTML tags are not permitted: The following CSS tags are not permitted: |
| Long text |
|
| Markdown | Add markdown-formatted text as a Template which is displayed to users in the field. Markdown lets you add basic formatting to text to provide a better end-user experience. When a Markdown field is shown in the Issues table, if there is a value in the field, it does not display in the table. Instead, the column shows Data Available. |
| Multi select / Array | Includes two options:
In the Basic Settings section, enter a comma-separated list of values. |
| Number | Can contain any number. Default is 0. |
| Short Text |
|
| Single select | Select one from a list of options. Add a list of comma-separated values. By default, the first value is used, unless the checkbox for Use first as default is cleared. |
| Timer | Timer fields enable you to view how much time has passed since the timer was started and how much time remains until the timer times out. You can also configure a script to run when a timer times out. |
| URL | Contains a URL. |
Create custom issue fields
Create custom Cortex XSIAM issue fields to map incoming data, support correlation rules, and tailor issue layouts. You can use custom fields to:
- Map raw JSON fields from incoming issues.
- Display custom field data in the Issues table.
- Create correlation rules that generate issues from XQL queries.
- Map XQL query output to custom issue fields.
- Design custom issue layouts that include custom fields.
Create a custom Cortex XSIAM issue field
- Select Settings → Configurations → Object Setup → Issues → Fields → New Field.
-
Choose a field type and enter a field name. For available field types, see issue-field-types. You can add an optional tooltip for users.
If you add a grid, see create-a-grid-field-for-an-issue.
- Click Save.
Import, export, and update custom issue fields
Import and export custom issue fields. To export one field, right-click it in the fields table and select Export. To export all custom fields as one JSON file, click Export All above the table.
After you create a custom issue field, right-click its row to edit, delete, or export it. You cannot change the field name or field type.
Update custom field values with the Set command in the CLI, a script, or a playbook. For more information, see update-issue-fields.
Create a grid field for an issue
The grid field enables you to view and edit a table. You can add a grid field to a custom issue layout.
- Select Settings → Configurations → Object Setup → Issues → Fields → New Field.
- In the New Issue Field window under Field Type, select Grid (table).
-
Complete the following parameters:
Parameter Description Field Name Name for the grid field. Tooltip (Optional) A brief descriptive message that explains what the field is and how to use it. User can add rows (Optional) Enables users to add/remove rows in the grid. -
In the Grid tab, add or remove rows and columns.
How you design the grid determines how it appears to users. If you select user can add rows, the user can add rows but not columns.
-
Configure each column by selecting the required field types, such as short text, Boolean, URL, etc. You can move the columns, rename, and add values.
If you select the Lock check box, the value for that field is static (not editable). If you do not select the Lock check box (default), users can perform inline editing.
- Click Save.
Configure issue timer fields
Configure Cortex XSIAM issue timer fields to track issue response times, service-level agreements (SLAs), and timeout targets. Timer fields are disabled by default. To enable them, go to Settings → Configurations → General → Server Settings → Issues, then enable Timer Field.
Timer fields track reaction times and issue-level metrics. Use separate timers for different stages. For example, track time since the first playbook ran or time waiting for a user response. Timers appear in the Issues table and issue layouts.
Start, stop, or pause timer fields with a playbook, script, or the CLI.
Timer fields count up from the start of an action or task. They can also count down to a target. Configure a risk threshold to identify timers at risk.
Running timers show their total duration. At-risk timers show an at-risk status. Timed-out fields show the total duration and the time past the target.
Timer fields do not trigger actions automatically when they time out. Configure a timer script to run when a timeout occurs.
Automate issue timer timeouts with scripts
Use scripts to act on timeouts, such as sending an email. Scripts can also change an issue field or parent case, such as its owner. Cortex XSIAM includes out-of-the-box scripts, or you can create your own. Scripts must use the SLA tag to work with timer fields. For more information, see automate-changes-to-issue-fields-using-timer-scripts.
Manage issue timers with the CLI
Use the setIssue command in the CLI to set or change issue timers. You can also use commands such as startTimer, stopTimer, and pauseTimer. For more information, see user-issue-timer-field-commands-manually-in-the-cli.
Issue field-triggered scripts
Configure Cortex XSIAM issue fields to run scripts when field values change. Field-change-triggered scripts automate issue workflows throughout the issue lifecycle. Use them to update field values, validate changes, or notify responders when issue severity changes. Scripts can include conditions, such as a required field value.
Create issue automation scripts in Python, PowerShell, or JavaScript on the Scripts page. To use a script as a field trigger, add the field-change-triggered tag. Then add it from the Attributes tab when you create or edit an issue field. Scripts without this tag cannot be selected.
When a script is associated with an issue field, Cortex XSIAM saves field changes after the triggered script finishes. This lets you verify conditions, such as whether a field is completed, before a user resolves an issue.
During a bulk update, a field-triggered script runs in every issue where its assigned field changes.
An issue field-triggered script can modify multiple fields. If a script triggered by field A changes field B, Cortex XSIAM does not trigger a script assigned to field B.
Cortex XSIAM includes the emailFieldTriggered script. It emails the issue owner when the selected field changes. You can also create custom issue automation scripts.
This feature assumes fair and intended usage of field-triggered scripts. In cases of excessive or abusive usage, execution may be restricted or disabled. If script execution is restricted or disabled, fields are still updated, but without the results of the assigned script.
Issue field-triggered script arguments
Issue field-triggered scripts provide the following changed-field information as arguments (args):
| Argument | Description |
|---|---|
associatedToAll |
<p>Whether the field is associated with all or some issues.</p><p>Value: true or false.</p> |
associatedTypes |
An array of the issue types with which the field is associated. |
cliName |
The name of the field when called from the command line. |
description |
The description of the field. |
isReadOnly |
<p>Specifies whether the field is non-editable.</p><p>Value: true or false.</p> |
name |
The name of the field. |
new |
The new value of the field. |
old |
The old value of the field. |
ownerOnly |
<p>Specifies that only the creator of the field can edit.</p><p>Value: true or false.</p> |
placeholder |
The placeholder text. |
required |
<p>Specifies whether this is a mandatory field.</p><p>Value: true or false.</p> |
selectValues |
If this is a multi-select type field, these are the values the field can take. |
system |
Whether it is a Cortex XSIAM defined field. |
type |
The field type. |
unmapped |
Whether it is not mapped to any issue. |
useAsKpi |
Whether it is being used for tracking KPI on an issue page. |
validationRegex |
Whether there is a regex associated validation for the values the field can hold. |
Fields that can hold a list, such as multi-select custom fields, return the delta in an array as a new argument. For example, if a multi-select field value has changed from ["a"] to ["a", "b"], the new argument of the script gets a value of ["b"].
Assign a triggered script to an issue field
After you create an issue field-triggered script in Python, PowerShell, or JavaScript, associate it with an issue field.
- Go to Settings → Configurations → Object Setup → Issues → Fields.
- Right-click the issue field and select Edit.
-
In the Attributes tab, under Script to run when field changes, select the desired issue field-triggered script.
Issue field-triggered scripts must have the
field-change-triggeredtag to appear in the list.Issue field trigger scripts are not supported for all system fields. The following fields are not supported for issue field trigger scripts and may result in failing to populate the issue layout:
- Cases: Case ID, Cases IDs
- Asset Fields: Asset IDs, Asset Names, Asset Classes, Asset Categories, Asset Groups, Asset Regions, Asset Providers, Asset Accounts, Asset Types
- Other: Business Application Names, Findings
Use field-change-triggered scripts with select fields
-
Create and save a single select or multi-select script in the Scripts page.
When creating the script, add the field-change-triggered tag in the script settings.
This is an example of a single select script.
# Mapping of user selection to email addresses owner_mapping = { 'option1': 'alice@example.com', 'option2': 'eled@example.com', 'option3': 'carol@example.com', 'option4': 'dave@example.com', 'option5': 'eve@example.com', } # The value selected by the user when the script is triggered val = demisto.args().get('new') # Get the mapped email address owner_email = owner_mapping.get(val, val) # Set the owner of the incident demisto.executeCommand('setIssue', { 'owner': owner_email }) - Go to Settings → Configurations → Object Setup → Issues → Fields.
- Click New Field and create a new issue field of one of the following types:
- Single select
- Multi-select
-
Click Basic Settings and in the Values section set the values you want to see in the issue layout dropdown list for this field.
For example,
option1,option2,option3,option4,option5. - Click Attributes and in Script to run when field changes, select the script you created in Step 1.
- Go to Settings → Configurations → Object Setup → Issues → Layouts and add the new issue field to an existing layout or create a new layout.
- In the issue layout edit page, click Fields and Buttons and drag the new issue field you created to the layout.
- Save the version.
- Select one of the values. The layout will update with the mapped value as set on the script related to the issue field.
Use triggered scripts with a grid field
You can use scripts to manipulate and populate data in a grid field. In this example, analysts add comments to issues they work on during their shifts. The script automatically populates a column of the grid, logging the timestamp of each comment.
- Create a script called
ShiftSummariesChange. The script operates in the following phases:- The script gets all new rows and sets the Date Logged field to now (current day).
- For each existing row, if the name matches, and the findings column is not updated, the Date Logged column is also updated.
-
After creating a grid field, it is saved with the new values using the
setIssuecommand.var newField = args.new ? JSON.parse(args.new) : []; //if line(s) added, set "datelogged" to now. if (oldField.length < newField.length) { // for each new line change date. for(var i=oldField.length; i < newField.length; i++) { newField[i].datelogged = new Date ().toISOString(); } } var columnName = "findings"; // for each old line if the "columnName" has changed, change date to now. for(var i=0; i < oldField.length; i++) { if (newField[i] && oldField[i].fullname === newField[i].fullname && oldField[i][columnName] !== newField[i][columnName]) { newField[i].datelogged = new Date().toISOString(); } } var newVal = {}; newVal[args.cliName] = newField; executeCommand("setIssue", newVal);
- Add the
field-change-triggeredtag and save the script. -
Create a
Shift Summariesgrid field with the following columns:- Full name
- Findings
- Status
-
Date Logged
Select Date picker with the Lock checkbox, so the script can populate the values for that column. If a column is unlocked (default), the column values can be entered manually (by users), or by a script.
Verify that User can add rows is selected.
Add a row to a grid
During playbook execution, if a malicious finding is discovered, you can add that finding to a grid, using a script in a playbook task.
This Python script requires two arguments:
fieldCliName: The machine name for the field for which you want to add a new row.Row: The new row to add to the grid. This is a JSON object in lowercase characters, with no white space.
fieldCliName = demisto.args().get('field')
currentValue = demisto.incidents()[0]["CustomFields"][fieldCliName];
if currentValue is None:
currentValue = [json.loads(demisto.args().get('row'))]
else:
currentValue.append(json.loads(demisto.args().get('row')))
val = json.dumps({ fieldCliName: currentValue })
demisto.results(demisto.executeCommand("setIssue", { 'customFields': val }))
During playbook execution, if a malicious finding is discovered, you can add that finding to a grid, using a script in a playbook task.
This Python script requires two arguments:
fieldCliName: The machine name for the field for which you want to add a new row.Row: The new row to add to the grid. This is a JSON object in lowercase characters, with no white space.
fieldCliName = demisto.args().get('field')
currentValue = demisto.incidents()[0]["CustomFields"][fieldCliName];
if currentValue is None:
currentValue = [json.loads(demisto.args().get('row'))]
else:
currentValue.append(json.loads(demisto.args().get('row')))
val = json.dumps({ fieldCliName: currentValue })
demisto.results(demisto.executeCommand("setIssue", { 'customFields': val }))
Configure issue timer fields
You can create timer fields that display in the issues table and issue layouts. When you create an issue timer field, you have the option of providing a target for completion and also the option of triggering a script when the timer field has timed out (the target has passed).
If you set a target for a timer field, the Risk Threshold is automatically activated and displayed when the timer is considered at risk. You can customize the timeframe for the Risk Threshold. If you do not provide a target, the timer only counts up from when it was triggered.
You can start, stop, or pause a timer from the CLI, from scripts, and from playbooks.
Create a timer issue field in Cortex XSIAM
- Go to Settings → Configurations → Object Setup → Issues → Fields → New Field.
- Select Timer as the Field Type.
- Type a field name.
-
(Optional) Under Basic Settings, Timer you have the option of setting a target for the timer field. By default, the timer field shows hours and minutes. You can change this to days and hours, by clicking Hours. If you do not enter the number of hours and minutes, the timer only counts up from when it is triggered.
If you set a target in the timer field, by default the Risk Threshold field is activated. You can edit the Risk Threshold value.
-
(Optional) Under Run script on timeout, select the script to run when the target has timed out. For example, you could write a script that sends an email when the target has timed out. For more information, see Automate changes to issue fields using timer scripts.
Only scripts to which you have added the
slatag appear in the list of scripts you can select. To add a tag to a script, create a new script or edit an existing script and enter the tag name in the script settings.When you hover over the machine name (below the Field Name) note the name which is used in the command line or script.
- Save the field.
- (Optional) Add the field to one or more issue layouts. By default, the timer field is available to view in the issues table.
Configure a playbook to run timers
Within a playbook, you can set a timer to start, pause, or stop at a specific section header or task. For example, you can create a timer called Pending user response and have it start in a playbook when an email is sent to a user. If the user does not respond within the target timeframe, then you can automatically send an additional reminder to the user or run a different task.
To select a timer in a task or section header, in the Timers tab select the action that you want the timer to perform for the task. You can add multiple timers to a task or section header, so in the same task you can stop one timer and start another.
When a task or section has a timer configured, it displays the hourglass icon.
The following table describes the timer options:
| Option | Description |
|---|---|
Timer.start | Starts the timer. Timers are not started automatically when a case is created. |
Timer.pause | Pauses the timer. A paused timer can be started again without being reset. |
Timer.stop | Stops the timer. Information about the timer is still displayed in the issue layout and/or issues table, but the status displays as Ended. If you stop a timer before the issue is closed, you must reset the timer using the |
Some playbooks, such as Phishing - Generic v3, come out-of-the-box with timer tasks included. If you need the same timers across use cases, create a sub-playbook based on your use case or conditions such as issue severity.
If you want to stop or pause a timer in a playbook, you can use an existing task or create a new section header/task. When you select Timer.stop, the run is considered finished and cannot be restarted without setting it to zero. If you plan to restart the timer, select Timer.pause so you do not lose the accumulated time. By default, all timers stop when the case closes.
Automate changes to issue fields using timer scripts
Scripts in Cortex XSIAM enable you to automate processes. You can create scripts that perform specific actions when a timer field times out. Scripts used with timers must have the SLA tag.
You can use an out-of-the-box or custom script and attach it to an timer issue field.
A common use of scripts for timer fields is to send an email when a timer is breached. You can create a custom script that sends an email to specific users when the script is triggered. You can add this to any timer issue field as needed.
Use issue timer field commands in the CLI
You can manage the timers for a specific issue by running commands manually in the CLI. By running CLI command you can to manage timers on a more granular level within specific issues when the need arises. For example, for a high severity issue you might need to decrease the response time.
Set timer fields in Cortex XSIAM
Use the setIssue command to set a specific issue due date, or to set a specific timer field in an issue. If you add the sla parameter to the command, it sets the time for the issue's due date. If you also add the slaField you set the timer for the issue field.
To change the Time to Assignment field target to 30 minutes in the current issue, run the following command:
!setIssue sla=30 slaField=timetoassignment
To change the timer to February 1, 2024, at 11.12 am, run the following command:
!setIssue sla=2024-02-01T11:12
When defining the values for the slaField use the machine name for the field, which is lowercase and without spaces. You can check the machine name by editing the issue field.
Start or stop timer fields in Cortex XSIAM
Run the following commands in the CLI:
| Command | Description |
startTimer | Starts the timer. This command can also be used to restart a paused timer. !startTimer timerField=timetoassignnment Timer fields are not started automatically when an issue is created unless run in a playbook. |
pauseTimer | Pauses the timer. Use this command when a timer field has already started. !pauseTimer timerField=timetoassignment |
stopTimer | Stops the timer. !stopTimer timerField=timetoassignment After a timer field is stopped, before you can start the timer again you must reset the timer using the resetTimer command. Timers are automatically stopped when an issue is closed. |
resetTimer | Clears all fields for the timer. This command must be used before restarting a timer that was stopped. !resetTimer timerField=timetoassignment |
When running commands in the CLI, you can specify the alertID to change the timer for a different issue.
Issue layouts
Manage Cortex XSIAM issue layouts to control the information displayed during issue investigation. Cortex XSIAM includes default layouts. Add layouts through content packs, duplicate system layouts, or create custom layouts. Issue layout rules apply layouts to incoming issues.
View issue layouts in the Investigate panel
Issue layouts control information displayed in the Investigate panel. To view the applied layout, click Layout Info  in the upper-right corner. Empty layout fields are hidden by default. Select Show empty fields to display them.
Customize system and content pack issue layouts
Default and content pack issue layouts are locked. You cannot delete, edit, or export them. To view a system layout, right-click its row and select View.
To edit a system layout, detach or duplicate it from the issue layout table. A detached layout does not receive content updates until you reattach it. To reattach a system layout, right-click its row and select Attach. Reattaching can overwrite changes. Detached layouts can be edited or duplicated, but not deleted or exported. Duplicated layouts can be edited, deleted, or exported like custom issue layouts.
Edit issue fields in a layout
Users with editing permissions can edit most issue fields inline. Click the check mark to save a change. Some system fields, such as Source Instance, cannot be edited.
Manage custom issue layouts
To manage a custom issue layout, go to Settings → Configurations → Object Setup → Issues → Layouts. Right-click the layout in the table, then select Edit, Duplicate, Delete, or Export.
Create custom issue layouts
Custom issue layouts let you choose the specific fields and buttons that are displayed for different types of issues. You can create custom issue layouts that include both custom and out-of-the-box issue fields, and add buttons with tasks that can assist and guide analysts in their investigation.
You can import a custom issue layout by clicking Import and uploading the JSON file. You can also modify or task actions on an existing layout existing layout by right-clicking the layout in the layout table.
Create a custom issue layout in Cortex XSIAM
- Go to Settings → Configurations → Object Setup → Issues → Layouts → New Layout.
- Enter a name for the layout.
-
(Optional) Add new tabs to the layout, and drag them to change the order in which they appear.
The Issue Info tab and any new tabs you create can be renamed, hidden, duplicated, or deleted. Hover over the tab name and click the settings button to see the available options. You cannot edit or delete the War Room and Work Plan tabs in the issue layout, but you can hide them by clicking the settings button, and selecting Hide tab.
By default, empty fields within the tab are hidden in the issue layout. To show empty fields, hover over the tab name, click the settings button, and select Show empty fields.
-
Add new sections to the Issue Info tab, or click +New tab.
To add a new section, from the Sections tab of the Library drag a New Section into a tab. You can also add the predefined sections, such as Malicious or Suspicious Indicators and War Room Entries.
-
Customize the section
Clicking the pencil icon for a section, to configure how a section appears. You can hide or show the section header, and configure the section fields to appear in rows or as cards.
Some sections have additional configuration options. If you add a Malicious or Suspicious Indicators section, you can configure an indicator search query. If you add a War Room Entries section, you can filter by type of entry, such as chats, notes, or files.
The General Purpose Dynamic Section enables you to configure a section that displays the results of a script. Only scripts to which you have added the
dynamic-sectiontag appear in the dropdown list. You can use the General Purpose Dynamic Section to display widgets, text, markdown, or HTML. For an example of how to add a widget with this section, see Add a custom widget to an issue layout. -
Add custom or out-of-the-box issue fields to the layout.
From the Fields and Buttons tab of the Library, drag fields into sections of the layout.
Limit the number of issue fields to 50 in each section. You can create additional sections as needed.
-
Add buttons to the layout.
Buttons allow you to add tasks to your layout, which can assist an analyst. For example, you can add a button to scan a host or kill a process.
- From the Fields and Buttons tab of the Library, drag a buttons into a section of the layout.
- Click to configure.
-
Enter a descriptive name for the button, select a color, and select the script that you want to run when the button is clicked.
For fields (script arguments) that are optional, you can define whether to show them to analysts when they click on buttons. To expose an optional field, select the Ask User checkbox next to the script argument(s) in the button settings page.
The script that runs when an action button is clicked accepts only mandatory arguments through the pop up window and does not provide an option for any non-mandatory arguments to be filled in when the button is clicked. We recommend using a wrapper script to collect and validate arguments in scenarios where there can be a combination of mandatory and non-mandatory arguments for a button.
- Save the layout.
Export issue layouts in Cortex XSIAM
You can export custom issue layouts and duplicates of system issue layouts
To export a single issue layout, right-click on the layout in the layouts table, and select Export. To export all custom issue layouts and duplicates of system issue layouts in a single JSON file, click the Export All button above the layouts table.
Add a custom widget to an issue layout
You can add a custom or system widget to a custom issue layout by uploading an auto script and using it in a General Purpose Dynamic Section in your layout.
The following example shows how to add an Indicator Widget Bar. This custom widget script shows the severity of indicators in an issue, as a bar chart.
-
Add the Indicator Widget Bar script to Cortex XSIAM.
- Go to Investigation & Response → Automation → Scripts and upload the following script:
commonfields: id: ee3b9604-324b-4ab5-8164-15ddf6e428ab version: 49 name: IndicatorWidgetBar script: |- # Constants HIGH = 3 SUSPICIOUS = 2 LOW = 1 NONE = 0 indicators = [] scores = {HIGH: 0, SUSPICIOUS: 0, LOW: 0, NONE: 0} incident_id = demisto.incidents()[0].get('id') foundIndicators = demisto.executeCommand("findIndicators", {"query":'investigationIDs:{}'.format(incident_id), 'size':999999})[0]['Contents'] for indicator in foundIndicators: scores[indicator['score']] += 1 data = { "Type": 17, "ContentsFormat": "bar", "Contents": { "stats": [ { "data": [ scores[HIGH] ], "groups": None, "name": "high", "label": "incident.severity.high", "color": "rgb(255, 23, 68)" }, { "data": [ scores[SUSPICIOUS] ], "groups": None, "name": "medium", "label": "incident.severity.medium", "color": "rgb(255, 144, 0)" }, { "data": [ scores[LOW] ], "groups": None, "name": "low", "label": "incident.severity.low", "color": "rgb(0, 205, 51)" }, { "data": [ scores[NONE] ], "groups": None, "name": "unknown", "label": "incident.severity.unknown", "color": "rgb(197, 197, 197)" } ], "params": { "layout": "horizontal" } } } demisto.results(data) type: python tags: - dynamic-section enabled: true scripttarget: 0 subtype: python3 runonce: false dockerimage: demisto/python3:3.7.3.286 runas: DBotWeakRole- Click Save
- Go to Settings → Configurations → Object Setup → Issues → Layout Rules → New Rule.
- Enter a rule name, select the layout to use if the rule is met, and provide a description.
- Search for issues that match the criteria you want to use for the layout rule. For example, you can search for issues from a specific issue source.
- Click Create.
- Repeat as needed to create multiple rules.
- Click Save.
Create issue layout rules
Create Cortex XSIAM issue layout rules to assign custom layouts based on issue criteria. For example, apply a specific layout to issues generated by a correlation rule.
You can create multiple issue layout rules. Cortex XSIAM checks each rule until one applies to an incoming issue. Content pack layout rules appear first by default. Drag and drop rules to change their order. Filter rules by name, description, rule, layout, or source. If no rule applies, Cortex XSIAM uses the default issue layout.
To edit or delete an existing issue layout rule, right-click it in the list. Then select Edit or Delete.
Create a Cortex XSIAM issue layout rule
- Go to Settings → Configurations → Object Setup → Issues → Layout Rules → New Rule.
- Enter a rule name, select the layout to use if the rule is met, and provide a description.
- Search for issues matching the issue layout rule criteria. For example, search for issues from a specific issue source.
- Click Create.
- Repeat as needed to create multiple rules.
- Click Save.
Scope-Based Access Control for issue layout rules
Issue layout rules support Scope-Based Access Control (SBAC). The following parameters apply to editing access.
- If Scope-Based Access Control (SBAC) is enabled and Endpoint Scoping Mode is set to restrictive mode, you can edit a rule if you are scoped to all tags in the rule.
- If Scope-Based Access Control (SBAC) is enabled and Endpoint Scoping Mode is set to permissive mode, you can edit a rule if you are scoped to at least one tag listed in the rule.
- As a scoped user who has editing permissions to a rule, you can change the order among other rules that are locked.
- If a rule was added when set to restrictive mode, and then changed to permissive (or vice versa), you will only have view permissions.
Create SLAs for case and issue resolution
Create Cortex XSIAM resolution SLAs to set time-based goals for case and issue resolution. Service Level Agreements (SLAs) define expected service levels between teams or service providers. Resolution timers track the time required to resolve cases and issues.
Why use Cortex XSIAM resolution SLAs?
Resolution SLAs give analyst teams a framework for prioritizing remediation. Key benefits include:
- Meet compliance requirements: Regulatory frameworks, such as PCI or HIPAA, mandate timely issue resolution. For example, PCI may require critical issues be fixed within a month, while HIPAA sets a 15-day limit for critical findings.
- Manage risk for critical assets: Organizations set SLAs based on the sensitivity and criticality of assets. For example, a hospital would prioritize fixing issues impacting patient medical records or payment systems over non-essential displays.
- Report and measure remediation efforts: SLAs allow leadership to track the effectiveness of security programs and report progress toward the goal of zero SLA violations.
Create a Cortex XSIAM resolution SLA rule
To configure a resolution SLA for cases or issues, create an SLA rule that defines:
- A time-based goal.
- The specific cases or issues the goal applies to.
Once created, the SLA rule is automatically applied to all matching existing and future cases or issues.
Create a resolution SLA rule
- Select Settings → Configurations → Object Setup → Cases or Issues.
- Select the SLA Rules tab.
- Select Create SLA Rule.
- Provide the following information, and then click Next.
- SLA Rule Name
- Description (optional)
- SLA Goal: Define the SLA goal, which is the maximum time allowed to resolve issues. SLAs must be at least 30 minutes.
- Define criteria to identify the cases or issues that the SLA will apply to.
-
Select the filter icon to define which cases or issues this SLA rule applies to.
Warning
If no criteria are defined, the rule doesn’t match any cases or issues.
-
Review the list of cases or issues that match your filtering criteria. If the list is correct, select Next.
-
-
On the Summary page, review the information about the new SLA rule. If it is correct, click Done.
The new SLA rule will appear in the table on the SLA Rules tab.
-
Set the order of evaluation for the new SLA rule. The first SLA rule that matches a case or issue will be the rule that applies to the relevant (case or issue) Resolution SLA.
By default new SLA rules are added to the bottom of the list. To move a rule up or down in the list, click and hold the arrows in the Name column and drag the rule to the desired position in the list.
Reorder Cortex XSIAM resolution SLA rules
SLA rule order is important. Rules use a stop-on-first-match evaluation. The first rule matching an issue determines its SLA. When you reorder rules, existing issues matching a higher-priority rule use the new SLA.
- Navigate to Settings → Configurations → Object Setup → Cases or Issues and select the SLA Rules tab.
- Change the order of the SLA rules by dragging the table rows into place. To drag a table row, click and hold an arrow in the Name column and drag the row to the desired position in the table.
Monitor Cortex XSIAM resolution SLA status
Use the following resolution SLA fields on the Cases and Issues pages to filter and sort issues:
- Resolution SLA: Indicates the amount of time left to meet the SLA deadline. Also indicates the amount of time past the SLA deadline for issues that are overdue.
- Resolution Timer: Indicates how long it took to resolve the issue. The timer starts when the issue status is New, and stops when the issue status is changed to Resolved.
Monitor case resolution SLA status
Monitor case resolution SLA status in a case header or the cases table.
Tip
The case header shows all active SLAs. In addition to the built-in resolution SLA, you can create SLAs for separate milestones. For more information, see create-case-timers-and-slas.
- Navigate to Cases & Issues → Cases, click Display and select Table.
- Filter on Resolution SLA > 0 or Resolution Timer > 0 to find cases that are within the SLA.\
These filters support filtering of whole days only, for example Resolution SLA > 1 filters for cases that have a Resolution SLA of greater than one day. - Filter on Resolution SLA < 0 or Resolution Timer < 0 to find cases that have exceeded the SLA.
Monitor issue resolution SLA status
- Navigate to Cases & Issues → Issues.
-
Filter on Resolution SLA > 0 or Resolution Timer > 0 to find issues that are within the SLA.
Note
These filters support filtering of whole days only, for example Resolution SLA > 1 filters for issues that have a Resolution SLA of greater than one day.
- Filter on Resolution SLA < 0 or Resolution Timer < 0 to find issues that have exceeded the SLA.
You can also view the issue resolution SLA widgets on the Vulnerability Management dashboard.
Resolution SLA and resolution timer are filterable XQL fields. Their XQL schemas include derived fields. Use them to build queries, correlation rules, and dashboards that track SLA compliance.
Create additional case timers and SLAs
Create Cortex XSIAM case timers and custom SLAs to monitor key performance indicators (KPIs). Case SLAs track response-time goals, provide operational insights, and support established objectives.
Tip
You don't need to build a resolution SLAs and timers from scratch. The following built-in fields are available in the Cases table:
- Resolution Timer: Works automatically out-of-the-box to measure elapsed case duration.
- Resolution SLA: Pre-positioned in the system, but requires you to configure your specific time goals to begin tracking compliance.
In addition to the default Resolution Timer and Resolution SLA fields, create timer and SLA fields for separate milestones. For example, track initial response times or enforce targets for specific customer tiers.
All active case SLAs are displayed in the case header.
Case SLAs are based on case timer fields. When a case matches defined criteria, the timer starts. When linked to an SLA, the timer tracks case progress against the SLA goal. The timer field counts up, and the SLA field counts down.
Prerequisite
Before you can create a case SLA, you must first create a timer field. A timer field can be associated with a single case SLA.
Create a Cortex XSIAM case timer
Take the following steps to create a case timer field:
- Go to Settings → Configurations → Object Setup → Case and open the Fields tab.
- Click New Field.
- Under Field Type, select Timer.
- Type a field name.
- Under Tooltip, enter a description to pop-up when you hover over the field.
-
Under Case Filter, click Set Filter and define the subset of cases for which the timer will be activated. For example, you can define timers for specific domains or case source types.
Note
If you edit this filter after creation, the timer and associated SLA will be removed from any case that no longer qualifies, even if the timer is already running.
- Under Conditions, add filters that define when the timer will start and end. To add a pause condition to the timer, click Pause and define the pause criteria.
- Under When case is reopened, select the action that you want Cortex XSIAM to take.
- Click Save.
The following timer measures the amount of time a security case is waiting in New status before an analyst starts investigating.
| Field | Value |
|---|---|
| Field Type | Timer |
| Field Name | Security case response |
| Tooltip | Measure time from case opening to analyst response. |
| Cases Filter | Case Domain = Security |
| Start when | Status = New |
| End when | Status = Under Investigation |
| When case is reopened | Reset timer |
Create a custom case SLA field
Take the following steps to create a case SLA. You can set up multiple goals for an SLA.
- Go to Settings → Configurations → Object Setup → Cases and open the Fields tab.
- Click New Field.
- Under Field Type, select SLA.
- Type a name to identify the SLA.
- Under Tooltip, enter a description to pop-up when you hover over the field.
- Under Timer, select the timer field with which to associate the SLA.
-
Under Goals, click Add SLA Goal.
The default goal applies to all cases that meet the filter criteria specified in the timer field. You can set up addition goals that apply to subsets of the defined cases.
- In the SLA goal, type a goal name and set filter criteria.
- In the Days, Hours, or Minutes fields, define the time conditions for to the SLA goal.
- Arrange the SLA goals by dragging them in order of goal priority.
- Click Save.
The following SLA field sets goals for analyst response times for security cases with Critical and High severity. This SLA is based on the timer field created in the previous example. Because the timer field is set up with the filter Case Domain = Security, this SLA will apply to security cases only.
The first SLA goal applies to security cases with a severity level of Critical. The SLA specifies that an analyst must respond to critical severity cases within one hour.
The second SLA goal applies to security cases with a severity level of High. The SLA specifies that an analyst must respond to high severity cases within two hours.
| Field | Value |
|---|---|
| Field Type | SLA |
| Field Name | Security case response SLA |
| Tooltip | Measure time from case opening to analyst response. |
| Timer | Security case response |
| Goals | <ul><li>Name: Critical severity cases</li><li>Minutes: 60</li><li>Filter: severity = Critical</li></ul> |
| <ul><li>Name: High severity cases</li><li>Minutes: 120</li><li>Filter: severity = High</li></ul> |
Display case timer and SLA fields
After creating new timer and SLA fields, you can add them to the Cases table layout and view them in the Cases detailed view:
- In the Cases table view, add the timer and SLA fields to the Layout tab in the Table Setting Menu.
-
In the Cases detailed view, use the Sort By field to filter the cases list by the SLA field. Details of the SLA are shown in the list.
In addition, create a custom case layout with a tab displaying SLA fields. For more information, see case-layouts.
Example case timer and SLA fields
This example is based on the fields created in the previous procedures:
- The Security case response timer field displays the number of minutes since case creation. When the case status moves from New to Under Investigation, the timer stops.
- The Security case response SLA field starts counting backwards to show the remaining time to meet the SLA. If the field is shown in red with a minus time, the SLA is breached.
- For case 001, the critical severity case has been in New status for 5 minutes. An analyst must respond within the remaining 55 minutes.
- For case 002, the high severity case has been in New status for 20 minutes. An analyst must respond within the remaining 1 hour and 40 minutes.
- For case 003, an analyst did not respond within 60 minutes and therefore the SLA was breached. The Security case response SLA field displays a minus value and a red icon.
| Case ID | Severity | Security case response | Security case response SLA |
|---|---|---|---|
| 001 | Critical | 5m | 55m 25s  |
| 002 | High | 20m | 1h 40m 30s |
| 003 | Critical | 65m | - 5m 23s  |
Case timer and SLA considerations
Consider the following information when working with timer and SLA fields:
- When a case is resolved, the timer calculation stops.
- Updating timer logic affects open and new cases. Therefore, the timer and associated SLA will be removed from any case that no longer qualifies, even if the timer is already running.
- If you delete a timer field, the SLA associated to the timer is also deleted.
Update case timer and SLA fields
Refresh Cortex XSIAM case timer and SLA fields by running the following CLI command in the War Room:
!RefreshIncidentDynamicCustomFields
Create issue exceptions
Prerequisites
- To create issue exception rules, delete or disable exception rules, and view the All Exception Rules page you must have at least View permissions for the following roles under Exception Configurations:
- Exception Management Admin
- Exception Approver Admin
- You must have Exception Approver Admin permission to add or delete issue exception approvers and to turn off and on approver functionality.
What is an issue exception?
An issue exception is a formal, documented, and time-bound decision to defer the remediation of a confirmed security issue. It is an active decision to accept the risk associated with a known issue, rather than remediating it within the standard timeline dictated by corporate policy. Issue exceptions are configured with Exception Rules that pause specified issue Service Level Agreement (SLA) timers for a defined grace period of up to one year. Issue exceptions help reduce issue fatigue and allow you to focus on high-priority, actionable threats while acknowledging unavoidable delays.
Common use cases for issue exceptions
- Vendor Dependency: The vulnerability exists within a third-party commercial product or library. Remediation is technically blocked until the vendor releases an official patch.
- High Risk of Disruption: The technical difficulty or potential operational downtime caused by remediation outweighs the security risk itself. For example, applying a required patch would break a critical legacy application.
- Compensating Controls: Alternative security measures are deployed and actively mitigate the vulnerability's threat. For example, a vulnerable web server is shielded by a strictly configured Web Application Firewall (WAF) that blocks specific exploit techniques.
- Planned Remediation (Grace Periods): Remediation is approved but delayed due to a scheduled maintenance window, or the issue exists in a newly deployed environment requiring a temporary grace period before standard production SLAs are enforced.
- Asset Decommissioning: The affected service or asset is in the process of being decommissioned, rendering standard remediation efforts unnecessary.
Issue Exceptions vs. Exclusions
An issue exception is a temporary acceptance of a known, real vulnerability due to a business or technical constraint. An exclusion is permanent acceptance of an issue with no intention of ever resolving it.
Issue exception approval workflow in Cortex XSIAM
To maintain strict security governance, the issue exceptions rely on a structured, automated approval workflow. When an exception rule is created, an exception rule request is sent to an authorized approver via email. The approver has up to seven days to evaluate the risk, review any compensating controls, and formally approve or reject the request.
An exception rule does not go into effect until the approver has approved it. Once the exception rule request has been approved, the rule becomes active, the relevant issue SLA timer is paused. And the status of the rule is Approved. If an approver rejects the exception rule request, the status of the rule will be Rejected.
If an approver does not approve or reject an exception rule request within seven days, the request expires.
Every step of the approval process, from the initial request to the final decision, is recorded in the system's audit logs to ensure full compliance and accountability.
Issue exception behavior in Cortex XSIAM
- Issue Status: When an exception rule is approved, the underlying status of the impacted issues do not change, for example, an excepted issue in the New state will stay in the New state. The system identifies excepted issues in the Issues list in the Excepted field, so you can easily filter for Excepted = YES to find excepted issues.
- Issue creation: Issue exceptions do not prevent new issues from being created. New issues that match exception rules will have service-level agreement (SLA) timers paused and will indicate Excepted = Yes in the Issues list.
- SLA Impact: The primary operational effect of an active exception is that it pauses the Service Level Agreement (SLA) timer for the affected issues. This prevents the system from triggering SLA breach alerts while the organization is managing the known business constraint.
-
Exception expiration: When an issue exception expires, the issue loses its excepted status. In the Issues list, the value of the Excepted field will change to No, and the SLA timer will automatically resume.
- Issue exceptions apply specifically to issues, not individual findings.
- Issue exceptions do not automatically update standard dashboards, reporting widgets, or compliance reporting profiles. To view the aggregate impact of exceptions, you must manually filter the issues table.
- Exceptions do not alter Attack Path policies.
- Exceptions do not bypass any preventative blocking actions executed by XDR or AppSec agents.
Prerequisites
- You must have Exception Approver Admin permission to add or delete issue exception approvers and to turn off and on approver functionality.
- You must have Exception Management Admin permission to create issue exception rules, delete or disable exception rules, and view the All Exception Rules page.
Configure the issue exception approval workflow
The following sections describe how to add or delete issue exception approvers and how to disable the issue exception approval workflow entirely, so that exception rules can be created without approvals.
Add issue exception rule approvers in Cortex XSIAM
An exception rule approver must be added to the list of approvers in the system before an exception rule request can be sent to them. Exception approvers are not required to be Cortex XSIAM users. When you add a new approver to the list, that approver is sent an email notification indicating that they have been added to the approver list.
You can not be the approver of your own issue exception rule request.
Prerequisite
You must have Exception Approver Admin permission to add or delete approvers.
- Navigate to Settings>Configurations>Server Settings and scroll down to the Exception Management section.
- Enter the approver’s name and email address, and then click Add New Approver.
The system will send the approver an email indicating that they have been added as an exception rule approver.
Delete an issue exception rule approver in Cortex XSIAM
Consider the following restrictions when deleting issue exception rule approvers from the approver list:
- When the approval workflow is enabled, you cannot delete an approver if they are the only approver in the list. You must add a second approver before you can delete an approver.
- If an approver is linked to active or pending issue exception rules, you must disable those rules before you can delete the approver.
Prerequisite
You must have Exception Approver Admin permission to add or delete approvers.
How to delete an issue exception rule approver
- Navigate to Settings → Configurations → Server Settings and scroll to the Exception Management section.
- Under List of Approvers, click the X next to the approvers name to delete them from the list.
- Save the update.
Disable the issue exception approval workflow in Cortex XSIAM
Disable the issue exception approval workflow to allow issue exceptions to be created without an approval.
Prerequisite
You must have the Exception Approver Admin permission to disable or re-enable the issue exception approval workflow.
- Navigate to Settings → Configuration → General → Server Settings and scroll to the Exception Management section.
- Toggle Off Approval Required.
You can re-enable the issue exception approval workflow by toggling on Approval Required.
Create issue exception rules
You create an issue exception by creating an exception rule. The following steps describe how to create an exception rule on the All Exceptions Rules page.
You can create a maximum of 10 issue exceptions per day.
- Navigate to Settings → Exceptions Configuration and click on the Exception Rules tab to display the All Exception Rules page.
- Click + Add Exception, select Create new exception, and then click Next.
- Complete the following fields, and then click Next:
- Rule Name
- Approver: Select an approver from the dropdown list.
- Exception End Date: The exception will expire on this date and the SLA timer will start to count down.
- Justification: Describe the business justification for creating this rule.
- Reason Category: Select a reason category from the dropdown list.
- External Exception ID: (Optional) Enter a ticket number or other tracking record.
-
Click Add filters, and then use the dropdown lists to create a filter that identifies the issues you want the exception rule to apply to.
The query must return fewer than 100,000 issues.
Click Next.
-
Review the summary of the proposed rule. If it is correct, click Create.
The proposed exception rule will now appear in the All Exception Rules list with the status Pending Decision, and, if the Exception Rule Approval workflow is enabled, an Exception Rule Request email will be sent to the approver. The exception rule will not take effect until the request has been approved.
Create an exception rule from an issue
You can create an issue exception directly from an issue on the Issues page. This will result in an issue exception rule for a specific issue ID.
You can create a maximum of 10 issue exception rules per day.
- Navigate to Cases & Issues>Issues.
- Right-click on the issue that you want to create an exception for, select Manage Issue>Except Issue.
- Complete the following fields, and then click Next:
- Rule Name
- Approver: Select an approver from the dropdown list.
- Exception End Date: The exception will expire on this date and the SLA timer will start to count down.
- Justification: Describe the business justification for creating this rule.
- Reason Category: Select a reason category from the dropdown list.
- External Exception ID: (Optional) Enter a ticket number or other tracking record.
- Verify that the correct issue appears in the table, and click Next.
-
Review the summary of the proposed rule. If it is correct, click Create.
The proposed exception rule will now appear in the All Exception Rules list with the status Pending Decision, and, if the Exception Rule Approval workflow is enabled, an Exception Rule Request email will be sent to the approver. The exception rule will not take effect until the request has been approved.
View issue exception rules
View Cortex XSIAM issue exception rules on the All Exception Rules page. Review rule status, affected issues, approvers, expiration dates, and approval workflow details.
To open the All Exception Rules page, go to Settings → Exceptions Configuration → Exception Rules.
All Exception Rules field descriptions
The table below describes each field in the All Exception Rules table.
| Field | Description |
|---|---|
| Approver Email | Email address of the approver. |
| Approver Name | Name of the approver. |
| Backward Scan Status | <p>Processing status of the exception rule. It indicates whether or not the exception has taken effect.</p><p>Possible values include:</p><ul><li>Pending: the system has not started excepting issues.</li><li>In progress: the system is actively updating the issues.</li><li>Failed: issue exception failed</li><li>Done: all affected issues have been marked as excepted</li></ul> |
| Decision Justification | Justification provided by the approver for approving or rejection the exception rule request. |
| Exception ID | Unique ID for the exception rule. |
| Expiration Date | Date the exception expires. This is the Exception End Date that was specified when the exception rule was created. |
| External Exception ID | Optional reference provided when the rule was created. |
| Impacted Issues | Number of issues impacted by the exception request. |
| Justification | Description of the business justification for this exception. |
| Justification Category | High-level category of the business justification. |
| Name | Name of the rule. |
| Requestor Email | Email address of the person who created the exception rule. |
| Requestor Name | Name of the person who created the exception rule. |
| Rule | The issue ID or other issue identifiers used to define which issues the exception applies to. |
| Status | The current workflow status for the rule. Refer to the Exception Rule status descriptions table for a description of each status. |
Issue exception rule status descriptions
The following table describes issue exception rule status values.
| Status | Description |
|---|---|
| Approved | The rule has been approved and is active. |
| Disabled | The rule has been manually disabled. |
| Expired | The Exception End Date for the rule has passed. |
| No Decision Made | The approver did not respond to the issue exception rule request within seven days, so the request timed out. |
| Pending Decision | The issue exception rule request was sent to the approver. The approver has not yet responded but the request is still within the seven-day response window. |
| Rejected | The approver rejected the issue exception rule request. |
| Self Approved | The rule was created when the Exceptions Require Approval setting was toggled “off”. |
Disable issue exception rules
Disabling an issue exception rule turns the exception rule off so that it no longer creates issue exceptions.
You cannot delete issue exception rules. You can disable them so that they no longer create issues.
You cannot re-enable an issue exception rule after it has been disabled.
- Navigate to Settings → Exceptions → Configuration → Exception Rules.
- Right-click a rule and select Disable.
View excepted issues
You can view excepted issues by sorting or filtering the Issues page.
- Navigate to Cases & Issues → Issues.
- Filter the list of issues by Excepted = Yes to see the complete list of excepted issues.
- View the Remaining Exception Period field to see how much time is left until the exception expires.
Optimize case grouping in correlations
Optimize Cortex XSIAM case grouping by mapping correlation rule fields that influence grouping and prioritization. When custom detections generate issues, related issues might not automatically group into cases.
Case grouping uses Cortex XSIAM machine learning and grouping logic. It evaluates relationships, context, and shared artifacts across issues.
Map specific correlation rule fields to influence case grouping and prioritization.
Why correlation rule field mapping matters for case grouping
Cortex XSIAM grouping and machine learning models use mapped fields to construct grouping artifacts. These artifacts help evaluate whether issues are related or part of an ongoing activity.
Not all fields influence grouping. To contribute effectively to grouping and prioritization, your correlation rules must supply one or more of the relevant fields in a supported format that Cortex XSIAM can interpret. In addition, ensure that the mapped fields adhere to the correct field structure, and expected formatting requirements.
If these fields are missing, incorrectly mapped, or improperly formatted, Cortex XSIAM may be unable to correlate related issues accurately. This can reduce grouping effectiveness and lead to unnecessary issue fragmentation across multiple cases.
Benefits of proper grouping configuration:
- Correlate related custom issues into a single investigative workflow
- Reduce issue and case fragmentation
- Reduce over grouping of issues in cases
- Improve investigation efficiency
- Strengthen ML-based prioritization and correlation
- Align custom detections with organizational context
Field mapping does not guarantee grouping.
Cortex XSIAM grouping uses machine learning and platform logic that evaluates confidence, context, relationships, and additional case signals. Field mapping helps influence grouping by contributing relevant artifacts, but final grouping decisions are determined by the platform’s overall grouping logic.
For more information about case grouping behavior, see Case grouping.
Configure field mapping to optimize grouping
To optimize grouping for issues generated by correlation rules, take the following steps:
- Create or edit a correlation rule: Define the logic that triggers the issue based on your specific security requirements. For full instructions on creating correlation rules, see Create a correlation rule.
- Map fields to influence grouping: Map your data to the fields for which you want to group (e.g., IP Artifact, Actor Artifact, User). The grouping engine uses these fields to identify commonalities across different issues.
For details of the specific fields that influence case grouping and their expected formatting requirements, see the table below.
Case grouping field-mapping best practices
- Use stable identifiers that are likely to remain consistent across related detections
- Ensure field values match expected Cortex formats
- Avoid overly broad mappings that may unintentionally group unrelated issues
- Use the same mapping strategy across related custom rules when consistent grouping is desired
Case grouping artifact field mapping reference
The following table presents the full set of fields that influence case grouping, their descriptions, and the expected formats.
| Artifact type | Details |
|---|---|
| Actor Artifact |
|
| Causality Artifact |
|
| Process Artifact |
|
| File Artifact |
|
| IP Artifact |
|
| IPv6 Artifact |
|
| Domain Artifact |
|
| Cmd Artifact |
|
| HOST |
|
| AGENT_ID |
|
| USER |
|
| URL |
|
| External Grouping Artifact |
|
Correlation rule case grouping examples
Example 1:
Group multiple suspicious login detections by user
The correlation rule detects:
- Impossible travel login
- Multiple failed logins
- Privileged login from new location
Map:
- User name → (e.g. jsmith@company.com)
Result: Issues that share the same user are more likely to group into a single case.
Example 2:
Group endpoint persistence detections by host
The correlation rule detects:
- Registry persistence
- Suspicious scheduled task
- New service installation
Map:
Host Name→ (e.g. DESKTOP-ABC123)Agent ID→ <Agent_ID>
Result: Issues on the same endpoint are more likely to group into a shared case for endpoint investigation.
Example 3:
Group phishing detections by sender domain
The correlation rule detects:
- Suspicious attachment
- Spoofed sender
- Credential harvesting link
Map:
DNS Query Name→ Domain (e.g malicious-site.com)
Result: Related phishing activity tied to the same domain may group more effectively.
Run indicator extraction in the CLI
Use Cortex XSIAM issue War Room CLI commands to extract indicators, enrich existing indicators, and run reputation checks. The following commands run at the issue level:
Extract indicators in the War Room CLI
-
!extractIndicatorsIf you want to extract indicators from non-War-Room-entry sources (such as extracting from files), use the
!extractIndicatorscommand from the issue War Room CLI. The command does not create indicators but extracts them only. Use the command to do the following:- Validate regex: Test a specific string to see if the relevant indicators are extracted correctly, such as a URL.
- In a playbook or automation: The command extracts indicators in a playbook or automation non-war-room-source, and potentially also creates and enriches them (if required).
You can extract from the following:
- A specified entry (an entry ID)
- Investigation (Investigation ID)
- Text
- File path
For example, type
!extractIndicators text="some text 1.1.1.1 something" Auto extract=inline. The entry text contains the text of the indicators, which is extracted and enriched. You can also extract indicators by adding the auto-extract parameter with the script and the mode for which you are setting it up. For example,!ReadFile entryId=826@101 auto-extract=inline. Usually, when using the CLI, you want to disable indicator extraction. For example, if you return internal/private data to the War Room, and you do not want it to be extracted and enriched in third-party services, add auto-extract=none to your CLI command.
Enrich indicators in the War Room CLI
-
!enrichIndicatorsThe
!enrichIndicatorscommand is usually used when you want to batch enrich indicators. This command works on existing indicators only (it does not create them on its own). When running the command, the relevant enrichment command is triggered (such as!ip), which is based on the indicator type that is found. The data is saved to context and to the indicator.
Triggering enrichment on a substantial amount of indicators can take time (since it's activating all enrichment integrations per indicator) and can result in performance degradation.
Run indicator reputation commands
- Reputation commands, such as
!ip, can work on existing and non-existing indicators. If extraction is on, data is saved to the indicator and issue context. Otherwise, it is saved only to context because enrichment commands always trigger the mapping flow. Playbook tasks usenoneas the default extraction configuration.\
The indicator does not need to exist to run the reputation command, as the command uses a third-party threat intel integration, such as Unit 42 Intelligence, IPinfo, etc. You can also click the Enrich indicator button in the indicator layout.
XQL query management
You can find Query Management options under Settings → Configurations → General → Query Management. These options enable administrators to set controls on running queries.
Set query limits in Cortex XSIAM
Setting query limits requires View/Edit permissions for Configurations → Query Management.
Administrators can set query limits that control user-generated XQL queries within a tenant. Setting query limits helps to prevent resource strain and optimize tenant performance. You can control the following query settings:
-
Concurrent queries per user
Prevent system overload by setting a maximum number of concurrent queries that a user can run.
The concurrent query limit is applied per user.
If a user is running a high number of queries and is approaching the concurrent query limit, a system message warns that a high query load is impacting their performance. If a user exceeds the defined limit of concurrent queries, new queries are blocked until the number of active queries drops below the limit.
The user can view all of their In Progress queries from the Query Center, and cancel active queries to avoid being blocked and improve query performance. For more information, see Overview of the Query Center.
If a user is blocked, other users of the tenant can continue to run queries. By default, query limits apply to all users of the tenant, but you can exclude specific roles and groups from these limits.
Queries that are included in the concurrent queries calculation include:
- Cortex Query Language (XQL) investigation queries, including cold and hot storage, XDM templates, XDR templates, free text search, and queries from the query library.
-
Scheduled queries and scheduled reports.
A scheduled query or report is run on behalf of the user that created it, even if it is edited and run by another user.
- XQL widget queries in dashboards and reports
- XQL public API queries (cold and hot storage)
- BIOC test queries.
- Correlation rule test queries.
- XQL queries run from playbook tasks.
- Queries run by correlation rules are not restricted by the query limit.
- Very short queries do not count towards concurrent queries.
-
Query duration timeout
Prevent long-running queries by setting a timeout duration for queries to automatically stop long-running queries and reserve tenant resources.
Only integer values are supported for this field. In addition, the query timeout is an approximate value.
To ensure optimal system performance, all queries (user-generated and otherwise) adhere to a default timeout limit of 60 minutes that is defined by Palo Alto and takes priority over the administrator-defined value. Therefore, regardless of the value specified in this field, queries will be stopped after 60 minutes.
You can override the default timeout limit by including the
config max_runtime_minutesstage in your query to increase the query timeout value, up to the administrator-defined value.
Set a query limit
- Go to Settings → Configurations → General → Query Management.
- Under Query Limits select Enabled.
-
Under Concurrent Queries Per User, specify the maximum number of queries a user is allowed to run concurrently. Queries exceeding this limit will be blocked.
Important considerations:
- A value of 0 will prevent all queries from running.
- Setting a very low or very high limit could adversely affect overall query execution speed and system resources.
-
Under Query Timeout, specify the maximum duration (in minutes) that any query can run.
By default, the query duration timeout is set to 60 minutes for all queries regardless of the value specified in this field. For more information, see the explanation above regarding Query timeout duration.
- Under Excluded User Groups or Roles, choose specific user groups or roles that should be excluded from the query limits.
- Click Save.
- Changes to the query limit settings are recorded in the Management Audit Logs.
Restrict query visibility in Cortex XSIAM
Administrators can restrict non-admin users and API keys to viewing and managing only their own query history, which enhances tenant privacy and reduces operational noise. By limiting access to users' own search activities, you can secure sensitive investigations and ensure that API usage adheres to strict visibility controls.
The following areas in the Query Builder are affected when you restrict query visibility:
- Query History tab: Users and API keys see an access only the queries they initiated. Queries which are run implicitly on their behalf, such as background reports, BIOCs, or dashboards, are hidden from this view to reduce noise and maintain focus.
- Active Queries tab: Users and API keys view and manage any query they initiated, regardless of the source, including dashboards and widgets, allowing them to cancel operations they triggered.
- Scheduled Queries tab: Users see only the queries they personally scheduled.
Query restriction use cases
Restricting the access of users and APIs to only their own queries addresses specific operational and security needs:
- Reduce operational noise: Restricting visibility to only user-initiated Investigation or Simple Search sources in Query History makes the view more relevant to the analyst's immediate workflow.
- Prevent insider threat visibility: When investigating another user within the same tenant, restricting visibility prevents the individual being examined from seeing queries about themselves. Enabling this restriction protects the integrity of internal investigations.
- Secure API keys: Restricting API key access to their own queries prevents users from retrieving results using execution ID guessing. This aligns API privacy standards with the User Interface.
Query visibility is subject to Role-Based Access Control (RBAC); users can't see queries for datasets they do not have permission to access.
Enable query visibility restrictions in Cortex XSIAM
- Go to Settings → Configurations → General → Query Management.
- Under Enforce query privacy for non-admins,
- Enable: Non-admin users can only see and manage their own query activity.
- Disable: Non-admin users can view all queries in the tenant.
- Click Save.
Changes to the query visibility settings are recorded in the Management Audit Logs.
Multi-Tenant
What is Cortex XSIAM multi-tenant?
Cortex XSIAM multi-tenant is designed for managed security service providers (MSSPs) and enterprises that require strict data segregation, but also need the flexibility to share and manage critical security practices across tenants. In Cortex XSIAM, MSSPs and enterprises can benefit from central licensing management and have access to a variety of configuration options for their child tenants. These options include defining which Cortex add-ons to include and configuring the number of endpoints and gigabytes per tenant. This flexibility allows multi-tenants to tailor security operations to meet the specific needs of each child tenant.
Multi-tenancy enables you to manage multiple tenants from a single console. For a multi-tenant deployment, you create and manage the main account and child tenants from the Cortex Gateway.
In the main account, you can see all alerts across all child tenants.
Multi-tenant architecture in Cortex XSIAM
Multi-tenancy architecture is based on the platform's ability to run separate instances (process and data) of Cortex XSIAM, linking each child tenant to a main tenant. Each deployment consists of a main account and child tenants. All child tenants are associated with the main tenant. While tenant alerts can be searched from the main tenant, no data is stored on the main tenant.
| Component | Description |
|---|---|
| Main tenant | The main tenant, also referred to as the parent tenant, is used to access and administer your environment. |
| Child tenant | A child tenant is an instance of Cortex XSIAM that serves an end customer, such as the customer of an MSSP, and is associated with the main tenant. Each tenant has customer-specific data, which are stored separately. |
Note
By default, multi-tenant licenses include one child tenant.
MSSP multi-tenant
Cortex XSIAM supports pairing multiple Cortex XSIAM environments with a single main account enabling MSSPs to easily manage security on behalf of their clients.
The following license options are available for MSSP multi-tenants:
| Option | Description |
|---|---|
| Central licensing management | The MSSP acquires a license for the main tenant (parent account) with resource allocations of total endpoints and/or GB for child tenants. From the main tenant, the administrator can then dynamically create child tenants and allocate the resources among its child tenants. All child tenants are automatically paired to the main tenant and the licenses are all owned by the main tenant. |
| Customer-owned license | The MSSP acquires a license for its parent tenant. All end customers must acquire their own licenses in a separate contract. The child tenants must be manually paired to the main tenant. |
Enterprise multi-tenant
In addition to multi-tenant for MSSPs, enterprises can use multi-tenancy to segregate data across subdivisions while allowing for co-management of environments with potentially diverse security stacks. With enterprise multi-tenant, there is central visibility of threats from the main account while providing varying levels of independence to the child tenants. Central licensing management and dynamic allocation of resources from the main account allow for flexibility according to changing needs.
Multi-tenant central licensing management
The central licensing management for MSSP and enterprise multi-tenant allows the MSSP or enterprise to own and manage their child tenants dynamically from the Cortex Gateway. The Cortex Gateway displays the main account with its child tenants and the number of endpoints , employees, and GBs available to allocate to child tenants. The Admin user of the main account can add and delete child tenants, edit allocation of resources to child tenants, and change the child tenant subdomain.
The following are the minimum license requirements for central licensing management:
| Option | Description |
|---|---|
| MSSP multi-tenant | A multi-tenant deployment enables MSSPs to centrally manage multiple tenants and their resources from the Cortex Gateway. |
| Enterprise multi-tenant | Large enterprises can have many subdivisions and want to manage their tenant allocation and resources centrally from a main tenant while maintaining complete data separation. |
In MSSP or enterprise multi-tenant, the license specifies the maximum number of child tenants that can be created. Once this limit is reached, no additional tenants can be created, even if there remains allocation for endpoints or GBs.
Onboard Cortex multi-tenant
This section describes how to get up and running with Cortex XSIAM multi-tenant, including how to activate parent and child tenants and manage child tenants.
Onboarding checklists
Onboarding checklist for multi-tenant central licensing deployments
We recommend that you review the following steps to successfully deploy and onboard Cortex XSIAM with central licensing management. For MSSP multi-tenant environments with customer-owned licenses, see Onboarding checklist for multi-tenant customer-owned license deployments.
This checklist enables you to set up a multi-tenant deployment. After onboarding, you should configure Cortex XSIAM to suit your needs. For more information, see Configure Cortex XSIAM.
| Step | Details | See More |
|---|---|---|
| Step 1. Activate the parent tenant | <ul><li>Activate Cortex XSIAM in Cortex Gateway for the parent tenant</li><li>Enable access to Palo Alto Network resources</li></ul> | See topic |
| Step 2. Create a child tenant | Create and activate a child tenant in Cortex Gateway. | See topic |
| Step 3. Set up users and roles | Set up users, roles, user groups, and user authentication. | See topic |
Step 1. Activate Cortex XSIAM (main account)
To set up Cortex XSIAM multi-tenant, you need to activate the main account in Cortex Gateway. Cortex Gateway is a centralized portal for activating and managing tenants, users, roles, and user groups. After activating the tenant you can then access the tenant. You will need to repeat this task for each tenant if you have multiple tenants. The activation process includes accessing Cortex Gateway, activating the tenant, and then accessing the tenant.
Before you begin, make sure you have the following:
- Cortex XSIAM activation email.
-
Customer Support Portal Super User role is assigned to your account.
Before activating your Cortex XSIAM tenant, you need to set up your Customer Support Portal account. See How to Create Your Customer Support Portal User Account. When you create a Customer Support Portal account you can set up two-factor authentication (2FA) to log into the Customer Support Portal, by using one of the following:
- Okta Verify
- Google Authenticator (non-FedRAMP accounts)
Users who create the Customer Support Portal account are granted the Super User role. If you are the first user to access Cortex Gateway with the Customer Support Portal Super User role, you are automatically granted Account Admin permissions for the gateway.
You can activate Cortex XSIAM new tenants, access existing tenants, and create and manage role-based access control (RBAC) for all of your tenants.
Activate Cortex XSIAM (Main Account)
- Enable and verify access to Cortex XSIAM communication servers, storage buckets, and various resources in your firewall configuration. For more information, see Enable access to required PANW resources.
-
Go to Cortex Gateway.
You can also access the link from the activation email.
-
Enter your username and password or multi-factor authentication (if set up) by using your Customer Support Portal account credentials to sign in.
Once signed in, you can view the following:
- Tenants that are allocated to your Customer Support Portal account and ready for activation. After activation, you cannot move your tenant to a different Customer Support Portal account.
- Tenant details such as license type, number of endpoints, and purchase date.
- Tenants that were activated and are now available. If you have more than one Customer Support Portal account, the tenants are displayed according to the Customer Support Portal account name.
- In the Available for Activation section, use the serial number to locate the tenant that needs activation, and then click Activate.
- On the Tenant Activation page, define the following:
- Tenant Name: Enter a name for the tenant. Use a name that is unique across your company account and up to 59 characters long.
- Region: Geographic location where your tenant will be hosted. For more information, see Cortex XSIAM supported regions.
-
Tenant Subdomain: DNS record associated with your tenant. Enter a name that will be used to access the tenant directly using the full URL:
https://<xsiam-tenant>.xdr.<region>.paloaltonetworks.com -
(Optional) If you want to bring your own keys for encrypting your data, under Advanced, select BYOK and follow the instructions of the wizard in Encryption Method:
Cortex XSIAM enables you to select the method used to encrypt your tenant data at rest. You can select the encryption method of your tenant only when creating new tenants. Select the encryption method in Advanced → Encryption Method.
- Default encryption (recommended): All data stored by Cortex XSIAM is encrypted at rest using a dedicated key management system. Cortex XSIAM provides strict key access controls and auditing, and encrypts user data at rest according to AES-256 encryption standards. We recommend all our customers use this default system.
- BYOK (Bring your own keys): BYOK (Bring Your Own Keys) enables you to generate your own encryption keys and securely import and manage them via Cortex Gateway to retain greater control over your tenant data and encryption. This requires further setup.
- Select I agree to the terms and conditions of the Privacy Policy.
-
Click Activate.
The activation process can take about an hour and does not require that you remain on the activation page. Cortex XSIAM sends a notification to your email when the process is complete.
- After activation, in Cortex Gateway, in the Available Tenants, when hovering over the activated tenant, do the following:
- Ensure that you can successfully access the tenant by clicking the Cortex XSIAM tenant name (when the tenant is active).
- In the dialog box, view the tenant status, region, serial number, and license details.
Create a child tenant
Create Cortex XSIAM child tenants in Cortex Gateway after setting up the main account. Allocate licensed employee, storage, and add-on resources to each child tenant. The number of child tenants depends on your license.
- The main account is labeled in Cortex Gateway, but child tenants are not labeled.
- Cortex enables parent-child pairing between tenants located in different geographical regions. To enable this capability, contact your support team.
- To create a child tenant, ensure that you have Account Admin permissions.
In Cortex Gateway, you can view all the available tenants. If you want to create more child tenants than your license permits, contact Customer Support.
- In the Cortex Gateway, hover over the main account you activated previously until the three-dot menu appears and click Add Child Tenant.
-
Add the following details:
Parameter Description Child Tenant Name <p>Give the Cortex XSIAM tenant an easily recognizable name.</p><p>Choose a name that is 59 or fewer characters and is unique across your company account.</p> Region View the region for the child tenant. Child Tenant Subdomain <p>Give your Cortex XSIAM instance an easy-to-recognize name that is used to access the tenant directly using the full URL.</p><p>https://<subdomain>.crtx.<region>.paloaltonetworks.com</p><p>This is a public FQDN, so be careful with sensitive information such as the company name.</p><p>After activating a child tenant, you can only change the child tenant subdomain once.</p> Child Units Allocation <p>Assign the number of employees and Gigabytes you want to allocate to this child tenant. The amount used and the total amount available to this multi-tenant environment are displayed.</p><p>Ensure that you meet the minimum requirements for child tenant allocation.</p> Add Ons If any license add-ons were purchased with your multi-tenant license, they are listed here. If you acquired compute units (CU) or forensics, you can allocate how many units to allocate to this child tenant. -
Confirm approval of the terms and conditions of the privacy policy and click Activate.
Activation can take up to an hour. You should receive notification by email that the child tenant has completed the activation process.
-
(Optional) Add another child tenant by repeating steps 1 and 2 or access your newly created tenant.
In the Cortex Gateway, under your main account, you can see the total number of tenants you are licensed for and how many you have created.
If you reach your limit for child tenants, depending on your license, you may be able to create more tenants. You may be charged for additional tenants. Contact Customer Support if you are approaching your authorized limit.
Child tenant minimum resource allocations
The following are the minimum employee and storage allocations for each Cortex XSIAM child tenant. You cannot create or update a child tenant below these minimum allocations.
| Multi-tenant environment | Child tenant minimum allocation |
|---|---|
| MSSP multi-tenant | 100 employees AND 50 Gigabytes. |
| Enterprise multi-tenant | 100 employees AND 50 Gigabytes. |
Onboarding checklist for multi-tenant customer-owned license deployments
We recommend that you review the following steps to successfully deploy and onboard Cortex XSIAM with customer-owned licenses. For MSSP multi-tenant environments with central licensing management, see Onboarding checklist for multi-tenant central licensing deployments.
This checklist enables you to set up a multi-tenant deployment. After onboarding, you should configure Cortex XSIAM to suit your needs. For more information, see Configure Cortex XSIAM.
| Step | Details | See More |
|---|---|---|
| Step 1. Activate Cortex XSIAM parent and child tenants | Activate parent and child tenants in Cortex Gateway. | See topic |
| Step 2. Define access configurations and role permissions | Ensure the users have the appropriate role permissions in the CSP and the correct access configurations in Cortex Gateway. | See topic |
| Step 3. Pair parent tenant with child tenant | Use Cortex XSIAM Tenant Management in the parent tenant to pair the child tenant. | See topic |
Step 1. Active Cortex XSIAM (parent and child tenants)
To set up Cortex XSIAM multi-tenant in a customer-owned license deployment, you need to activate the parent and child tenants in Cortex Gateway. Cortex Gateway is a centralized portal for activating and managing tenants, users, roles, and user groups. After activating the tenants, you can then access the tenant. You will need to repeat this task for each tenant if you have multiple tenants. The activation process includes accessing Cortex Gateway, activating the tenant, and then accessing the tenant.
Before you begin, make sure you have the following:
- Cortex XSIAM activation email.
-
Customer Support Portal Super User role is assigned to your account.
Before activating your Cortex XSIAM tenant, you need to set up your Customer Support Portal account. See How to Create Your Customer Support Portal User Account. When you create a Customer Support Portal account you can set up two-factor authentication (2FA) to log into the Customer Support Portal by using one of the following:
- Okta Verify
- Google Authenticator (non-FedRAMP accounts)
Users who create the Customer Support Portal account are granted the Super User role. If you are the first user to access Cortex Gateway with the Customer Support Portal Super User role, you are automatically granted Account Admin permissions for the gateway.
You can activate Cortex XSIAM new tenants, access existing tenants, and create and manage role-based access control (RBAC) for all of your tenants.
How to activate Cortex XSIAM
- Enable and verify access to Cortex XSIAM communication servers, storage buckets, and various resources in your firewall configuration. For more information, see Enable access to required PANW resources.
-
Go to Cortex Gateway.
You can also access the link from the activation email.
-
Enter your username and password or multi-factor authentication (if set up) by using your Customer Support Portal account credentials to sign in.
Once signed in, you can view the following:
- Tenants that are allocated to your Customer Support Portal account and ready for activation. After activation, you cannot move your tenant to a different Customer Support Portal account.
- Tenant details such as license type, number of endpoints, and purchase date.
- Tenants that were activated and are now available. If you have more than one Customer Support Portal account, the tenants are displayed according to the Customer Support Portal account name.
- In the Available for Activation section, use the serial number to locate the tenant that needs activation, and then click Activate.
- On the Tenant Activation page, define the following:
- Tenant Name: Enter a name for the tenant. Use a name that is unique across your company account and up to 59 characters long.
- Region: Geographic location where your tenant will be hosted. For more information, see Cortex XSIAM supported regions.
-
Tenant Subdomain: DNS record associated with your tenant. Enter a name that will be used to access the tenant directly using the full URL:
https://<xsiam-tenant>.xdr.<region>.paloaltonetworks.com -
(Optional) If you want to bring your own keys for encrypting your data, under Advanced, select BYOK and follow the instructions of the wizard as detailed in Encryption Method.
Encryption Method
Cortex XSIAM enables you to select the method used to encrypt your tenant data at rest. You can select the encryption method of your tenant only when creating new tenants. Select the encryption method in Advanced → Encryption Method.
- Default encryption (recommended): All data stored by Cortex XSIAM is encrypted at rest using a dedicated key management system. Cortex XSIAM provides strict key access controls and auditing, and encrypts user data at rest according to AES-256 encryption standards. We recommend all our customers use this default system.
- BYOK (Bring your own keys): BYOK (Bring Your Own Keys) enables you to generate your own encryption keys and securely import and manage them via Cortex Gateway to retain greater control over your tenant data and encryption.
- Select I agree to the terms and conditions of the Privacy Policy.
-
Click Activate.
The activation process can take about an hour and does not require that you remain on the activation page. Cortex XSIAM sends a notification to your email when the process is complete.
- After activation, from Cortex Gateway, in the Available Tenants when hovering over the activated tenant, do the following:
- Ensure that you can successfully access the tenant by clicking the Cortex XSIAM tenant name (when the tenant is active).
- In the dialog box, view the tenant status, region, serial number, and license details.
Step 2. Define access configuations and role permissions
To set up manual pairing in a customer-owned license multi-tenant deployment, after the parent and child Cortex XSIAM tenants are activated, you must define correct access configuration in the Customer Support Portal (CSP) and role permissions in Cortex Gateway.
The following table describes the access configurations and role permissions needed:
| Tenant | Application | Action |
|---|---|---|
| Parent | Customer Support Portal (CSP) Account | Ensure the parent user name has Super User role permissions. |
| Cortex Gateway | Ensure the user name added to the child tenant’s CSP account has Admin role permissions on the parent Cortex XSIAM instance. | |
| Child | Customer Support Portal (CSP) Account | Add the user name from the parent tenant who is initiating the parent-child pairing and ensure the user name has Super User role permissions. |
| Gateway | Provide the user name added in CSP with Admin role permissions to access the child Cortex XSIAM instance. |
Step 3. Pair a parent tenant with a child tenant
After you set up the correct access configurations and role permissions, you should pair the parent tenant with the child tenants.
Cortex enables parent-child pairing between tenants located in different geographical regions. To enable this capability, contact your support team.
Pairing a Parent and Child Tenant in Cortex XSIAM
-
Log in to the Cortex XSIAM tenant that has been assigned as the parent tenant and select Settings → Configurations → Tenant Management.
The Tenant Management table displays:
- Tenant Name: Name of the child tenant.
- Pairing Status: State of a pairing request: Paired, Pending, Failed, Rejected.
- Account Name: CSP account to which the child tenant is associated.
- Last Sync: Timestamp of when the parent tenant last made contact with child tenant.
- Managed Security Actions: A column for each security action with a status: Configuration name or Unmanaged. Unmanaged status means that a configuration for the security action has not yet been selected.
- Region: Shows the region of the child tenant.
This field is not enabled by default. To enable this, contact your support team.
-
Click + Pair Tenant.
You can pair tenants across different regions.
-
In the Pair Tenant window, select the child tenant you want to pair.
Child tenants are grouped according to:
- Unpaired: Children that have not yet been paired and are available. If another parent has requested to pair with the child but the child has not yet agreed, the tenant will appear.
- Paired: Children that have already been paired to this parent.
- Paired with others: Children that have been paired with other parents.
- Pending: Children with a pending pairing request.
-
Pair the tenant.
Cortex XSIAM then sends a Request for Pairing to the specified child tenant.
- In the child tenant Cortex XSIAM console, a child tenant user with Admin role permissions needs to approve the pairing by navigating to Notifications , locate the Request for Pairing notification, and selecting Approve.
-
Verify the parent-child pairing.
After pairing has been approved, in the child tenant’s Cortex XSIAM app, when navigating to a page managed by a parent configuration, the child user is notified by a flag who is managing their security.
In the child tenant, pages that you manage appear with a read-only banner. Child tenant users cannot perform any actions from these pages, but can view the configurations you create on their behalf.
Dynamic license allocation
In a multi-tenant environment with central licensing management, in Cortex Gateway you can edit child tenant allocations, add child tenants, and delete child tenants. When you delete a child tenant, the tenant's allocations of endpoints, employees, and GBs are returned to the main account's pool and can immediately be used for existing child tenants or for creating new child tenants.
Edit tenant allocations in Cortex XSIAM
You can edit the child tenant allocations by increasing or decreasing the amount of endpoints, employees, and GBs allocated to the tenant. The total available count for the multi-tenant environment is updated accordingly.
Note
Changing the tenant's allocations might result in a short downtime of your tenant.
- In Cortex Gateway, locate the main account and then hover over the child tenant until the three-dot menu appears and click Edit Tenant Allocations.
- In the Edit Tenant Allocations window, assign the number of Gigabytes and endpoints you want to allocate to this child tenant. The amount used and the total amount available to this multi-tenant environment are displayed. Ensure you meet the minimum allocation requirements. Click Done.
Add a child tenant in Cortex XSIAM
When you have enough license allocations available in your multi-tenant central licensing environment, you can add a child tenant to the main account in Cortex Gateway.
- In the Cortex Gateway, hover over the main account you activated previously until the three-dot menu appears and click Add Child Tenant.
-
Add the following details:
Parameter Description Child Tenant Name <p>Give the Cortex XSIAM tenant an easily recognizable name.</p><p>Choose a name that is 59 or fewer characters and is unique across your company account.</p> Region View the region for the child tenant. Child Tenant Subdomain <p>Give your Cortex XSIAM instance an easy-to-recognize name that is used to access the tenant directly using the full URL.</p><p>https://<subdomain>.crtx.<region>.paloaltonetworks.com</p><div data-gb-custom-block data-tag="hint" data-style="info" class="hint hint-info"><p>Note</p><p>This is a public FQDN, so be careful with sensitive information such as the company name.</p><p>After activating a child tenant, you can only change the child tenant subdomain once.</p></div> Child Units Allocation <p>Assign the number of employees and Gigabytes you want to allocate to this child tenant. The amount used and the total amount available to this multi-tenant environment are displayed.</p><div data-gb-custom-block data-tag="hint" data-style="info" class="hint hint-info"><p>Note</p><p>Ensure that you meet the minimum requirements for child tenant allocation.</p></div> Add Ons If any license add-ons were purchased with your multi-tenant license, they are listed here. If you acquired compute units (CU) or forensics, you can allocate how many units to allocate to this child tenant. -
Confirm approval of the terms and conditions of the privacy policy and click Activate.
Activation can take up to an hour. You should receive notification by email that the child tenant has completed the activation process.
-
(Optional) Add another child tenant by repeating steps 1 and 2 or access your newly created tenant.
In the Cortex Gateway, under your main account, you can see the total number of tenants you are licensed for and how many you have created.
Note
If you reach your limit for child tenants, depending on your license, you may be able to create more tenants. You may be charged for additional tenants. Contact Customer Support if you are approaching your authorized limit.
Delete a child tenant in Cortex XSIAM
Deleting a child tenant deletes all of its data and content permanently. The child tenant's license allocations are returned to the total available in the multi-tenant environment and can be allocated to other child tenants.
Note
In a multi-tenant central licensing management environment, you cannot unpair a child tenant from the main account. The only way to remove the connection to the main account is to delete the tenant.
- In Cortex Gateway, locate the main account and then hover over the child tenant until the three-dot menu appears and click Delete Tenant.
- In the Delete Tenant window, confirm that you want to delete the child tenant by typing 'Delete' and click Confirm Deletion.
Child tenant management
You can manage, track, and investigate child tenant data from the parent tenant.
Manage a child tenant in Cortex XSIAM
Multi-tenancy enables you to view and investigate Cortex XSIAM data of a child tenant and initiate security actions on their behalf.
In Cortex XSIAM, you have access to view the following pages:
- Cases
- Issues
- Query Builder
- Query Center and Results
- Causality View
- Timeline View
To initiate security actions on your child tenant, you need to create a Configuration. Security actions are managed by configurations you create in Cortex XSIAM and then assign to each of the child tenants. Each action requires its own configuration and allocation to a child tenant.
Once a configuration is created, Cortex XSIAM resets the child tenant data and synchronizes the security actions configured in the parent tenant.
You can create configurations for the following actions:
- Starred Issue Policies
- Issue Exclusions
- Profiles
- Allow/Block Lists
Track your tenant management
To view child tenant details, in Cortex XSIAM, select Settings → Configurations → Tenant Management.
The Tenant Management page displays the following information about each of your child tenants:
| Field | Description |
|---|---|
 (Status Indicator) (Status Indicator) |
Identifies whether the child tenant is connected. |
| Tenant ID | The Cortex XSIAM tenant ID. |
| Tenant name | Name you defined during the pairing process or during child tenant activation. |
| Account ID | The CSP account ID. |
| Account name | Name of the parent tenant. |
| Pairing status | <p>Status of the child paring process:</p><ul><li>Pending</li><li>Paired</li><li>Approved</li><li>Declined</li><li>Pending</li><li>Paired to another</li><li>Not Paired</li></ul> |
| Last sync | Timestamp of the last security action sync initiated by the parent tenant. |
| BIOC Rules & exceptions | Name of the configuration managing the BIOC rules and exceptions actions. |
| Starred incidents policy | Name of the configuration managing the starred incidents policy actions. |
| Alert exclusion | Name of the configuration managing the alert exclusion actions. |
| Profiles | Name of the configuration managing the profile actions. |
| Region | <div data-gb-custom-block data-tag="hint" data-style="info" class="hint hint-info"><p>Note</p><p>This field is not enabled by default. To enable this, contact your support team.</p></div><p>Region of child tenant.</p> |
Investigate child tenant data
With Cortex XSIAM multi-tenancy, you can investigate the Cortex XSIAM child tenant data.
By default, Cortex XSIAM displays data for your tenant. To display data for your child tenant, select the tenant from the drop-down.
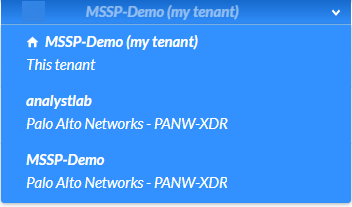
Some common tasks that you might perform include:
- Investigate cases on a child tenant.
- Investigate issues on a child tenant.
Create and allocate configurations
To manage security actions on behalf of your child tenant, you need to first create and allocate an action configuration.
- Navigate to each of the following Cortex XSIAM pages and follow the detailed steps:
- Settings → Issue Exception and Exclusion → All Issue Exception & Exclusion Rule page.
- Case & Issues → Case Configuration → Starred Issues → Starred Issues page.
- Inventory → Endpoints → Policy Management → Prevention → Profiles → Prevention Profiles page.
- Investigation & Response → Response → Action Center → Applied Actions → Block List/Allow List → Allow List/Block List page.
- On the corresponding page, add the relevent configuration.
- Enter the configuration Name and Description.
-
Create.
The new configuration appears in the Configuration pane.
- Navigate to Settings → Tenant Management.
- In the Tenant Management table, right-click a child tenant row and Edit Configurations.
-
Assign the configuration you want to use to manage each of the security actions.
Note
You can configure Profiles only as Managed or Unmanaged. All profiles you create are automatically cloned to your child tenants.
-
Update.
The Tenant Management table is updated with your assigned configurations.
Create a security managed action
After you have created and assigned a configuration for each of your child tenant’s security actions, you can define the specific managed action on behalf of the child tenant.
- Navigate to each of the following Cortex XSIAM pages and follow the detailed steps:
- Settings → Issue Exception and Exclusion → All Issue Exception & Exclusion Rule page.
- Case & Issues → Case Configuration → Starred Issues → Starred Issues page.
- Inventory → Endpoints → Policy Management → Prevention → Profiles → Prevention Profiles page.
- Investigation & Response → Response → Action Center → Applied Actions → Block List/Allow List → Allow List/Block List page.
-
In the corresponding Configuration panel, select the action configuration you created and allocated to your child tenant.
The corresponding security action Table displays the actions managing the child tenant.
-
Depending on the security action, select:
- Add an exclusion to create an issue exclusion.
- Add a starring configuration to create a starred issue inclusion.
- Add a new profile to create a new endpoint profile.
Profiles you create are automatically cloned to your child tenants.
About managed threat hunting
Cortex XSIAM provides the Managed Threat Hunting service as an add-on security service. To use Managed Threat Hunting, you must purchase a Managed Threat Hunting license and have a license with a minimum of 500 endpoints.
Managed Threat Hunting augments your security by providing 24/7, year-round monitoring by Palo Alto Networks threat researchers and Unit 42 experts. The Managed Threat Hunting teams proactively safeguard your organization and provide threat reports for critical security incidents and impact reports for emerging threats that provide an analysis of exposure in your organization. In addition, the Managed Threat Hunting team can identify incidents and provide in-depth review of related threat reports.
Set up Managed Threat Hunting
To get started with Managed Threat Hunting:
- Open the Cortex XSIAM tenant and approve the pairing request sent to your tenant.
- Navigate to Notifications and locate the Request for Pairing notification.
-
Select Approve and then Yes to confirm.
After the request is approved, Cortex XSIAM displays the Managed Threat Hunting label at the top of the page.
- Configure notification emails for the impact reports and threat inquiries you want to send.
- Select Settings → Configurations → Managed Services.
- Enter one or more email addresses to which you want to send reports and inquires and ADD each one.
- Save your changes.
- Test the email, by going to your defined email address mailbox, and locate the Welcome to the Palo Alto Networks Cortex XSIAM Managed Threat Hunting Service email. If you did not receive the email, contact Customer Support.
-
(Optional) If desired, forward Managed Threat Hunting alerts to external sources such as email or slack from the Settings → Configurations → General → Notifications page.
This forwards the alert and the detailed report in a PDF format.
Investigate Managed Threat Hunting reports
The Managed Threat Hunting team proactively scans, identifies, and analyzes your Cortex XSIAM tenant for possible threats and creates detailed threat and impact reports to help you track and manage your Cortex XSIAM data.
Cortex XSIAM displays the reports in a dedicated page that allows you to investigate and communicate with your Managed Threat Hunting team. When a new report is sent, MTH send a notification to your Notification Center. MTH type notifications will appear at the top of your notification list and offer the following options:
- Open—Pivot to report in the Managed Threat Hunting table.
- Dismiss—Delete the notification from your Notifications list.
The MTH page is available for users with the Managed Threat Hunting license and have the necessary permission to view and triage alerts and incidents in Cortex XSIAM.
To investigate your reports:
-
In the Cortex XSIAM console, select MTH.
The Managed Threat Hunting page displays a side-by-side view of all your reports and their corresponding report details and communication.
-
In the left-pane, select the report you want to investigate. You can sort the list according to the report Type, Insert Time, or Severity, and use the search bar to help you locate reports.
After selecting a report, the right-pane view displays a summary of the Managed Threat Hunting findings along with an attachment of the complete report.
-
In the right-pane, investigate the report findings and add your comments.
The comments are a way for you to communicate directly with the Managed Threat Hunting without the need to send separate emails. When you post a comment, the Managed Threat Hunters team is notified and can see and reply to your comments. Comments are listed chronologically and are visible to all the Cortex XSIAM tenant users with access to the MTH page and the Managed Threat Hunting team. You can attach up to ten PDF or image format files with a maximum of 10MB per file in each comment. Editing and deleting a comments is available only on comments you wrote.
Managed Services configuration in Cortex
Managed Services configuration
The Managed Services configuration page in Cortex XSIAM governs how the Unit 42 Managed Services team engages with your environment when the team hunts, investigates, and responds to threats on your behalf.
The Managed Services page is available to Cortex XSIAM customers subscribed to Unit 42 Managed Services.
The Managed Services page is identifiable by the Unit42 Managed Services banner with a lock icon, displayed at the top of the page. The banner indicates that the settings govern the operations performed by the Unit 42 Managed Services team in your tenant.
The Managed Services page contains two tabs:
- General: Configures the email distribution list for Managed Services reports and the actions permissions matrix, which defines how the Unit 42 Managed Services team operates in your environment.
- Escalation contacts: Maintains the ordered list of contacts that the Managed Services team contacts during an incident.
Configure report forwarding
Configure the email distribution list that receives Managed Services reports from the Unit 42 Managed Services team.
Prerequisites
- Access to the Managed Services configuration page.
- An email address or distribution list intended to receive Managed Services reports.
- Navigate to Settings → Configuration → Managed Services.
- In the General tab, under Report forwarding, in the User email field, enter the email address or distribution list that receives Managed Services reports.
- Click Save to save the email address to the system.
The Unit 42 Managed Services team sends Managed Services reports to the configured email distribution list.
Configure actions permissions
Configure how Unit 42 Managed Services performs Cortex XSIAM endpoint response actions. Set a permission level for each action and asset type.
The response permissions matrix on the General tab governs eight endpoint response actions. Configure each action separately for Server and Workstation assets. This enables stricter control for higher-criticality assets.
Cortex XSIAM response permission levels
There are three permission levels to choose from:
| Permission level | Description |
|---|---|
| Inform | Requires approval from your designated escalation contacts before any action is taken. No action will be performed until approval is received. |
| No | Does not authorize our team to perform the specified action in your environment. |
| Yes | Authorizes our team to act without prior approval. |
Note
When a permission level is set to Inform, configure at least one entry on the Escalation contacts tab so the Unit 42 Managed Services team can request approval before performing the action.
Managed Services endpoint response actions
Set the permission level for each of the response actions for Server and Workstation.
| Action | Description |
|---|---|
| Retrieve endpoint files | Extract files from a managed asset for forensic analysis. |
| Initiate live terminal | Open an interactive terminal session on a managed asset for investigation. |
| Isolate endpoint | Disconnect a managed asset from the network to contain a threat. |
| Run endpoint script | Execute a script on a managed asset for remediation or data collection. |
| Destroy file | Permanently delete a file from a managed asset. This action is irreversible. |
| Retrieve technical support files | Collect system logs and diagnostic data from a managed asset. |
| Terminate process | Stop a running process on a managed asset. |
| Quarantine files | Isolate a file to prevent execution while preserving the file for analysis. |
The Unit 42 Managed Services team operates in accordance with the configured permission level for each response action on each asset type. Actions set to Inform trigger an approval request to the escalation contacts before execution. Actions set to No are not performed.
Manage escalation contacts
Maintain the list of escalation contacts that the Unit 42 Managed Services team contacts during a case or when an action set to Inform requires approval.
Escalation contacts are sorted by creation date. During a case, the Managed Services team attempts to contact the listed escalation contacts in the order provided. If a contact does not respond, the team proceeds to the next contact in the list.
Add an escalation contact
- Open the Managed Services configuration page and select the Escalation contacts tab.
-
Select Add. The Add Contact dialog opens with the Contact Details section and required fields.
Note
All fields are mandatory.
Field Description Contact name Enter first and last name (both are required). Role Add the role as defined by the organization. Email Add email address. Phone number Add contact phone number, including country code. - Click Add to save the contact details.
- Right-click on the contact to edit, delete, or copy.
Protect your endpoints
Endpoint security
This section outlines how Cortex XSIAM, with its integration of the Cortex XDR agent, provides comprehensive protection for your endpoints. It details the key features and functionalities that enable you to prevent sophisticated attacks, rapidly detect and investigate threats, and automate response actions across all your endpoints, whether on-premises or remote.
Requires one of the following licenses
- Cortex XSIAM Premium
- Cortex XSIAM Enterprise
- Cortex XSIAM NG-SIEM with the Cloud Runtime Security add-on or the Enterprise Runtime Security add-on
Endpoint protection
Cortex XSIAM endpoint protection uses the Cortex XDR agent to prevent malware, exploits, and zero-day threats. It combines endpoint security controls with AI analysis to stop attacks before they execute.
How endpoint attacks work
Cyberattacks target endpoints to steal data, disrupt operations, or gain system control. Attackers can trick users into running malicious executable files, known as malware. They can also exploit vulnerabilities in legitimate applications to run code without user knowledge.
Limits of traditional antivirus
Traditional signature-based antivirus (AV) compares files, dynamic-link libraries (DLLs), and other code against known threat signatures. New threats remain undetected until signatures are created and distributed. This delay leaves endpoints exposed to zero-day malware and exploits.
Cortex XSIAM malware and exploit protection
Cortex XSIAM endpoint protection uses a multi-method prevention approach. Exploit protection modules block attacks against software vulnerabilities. Malware protection modules inspect executable files, DLLs, and macros for malicious signatures and behavior.
Together with AI analysis, these controls prevent known and unknown threats at attack entry points. This approach reduces reliance on traditional antivirus and improves endpoint security.
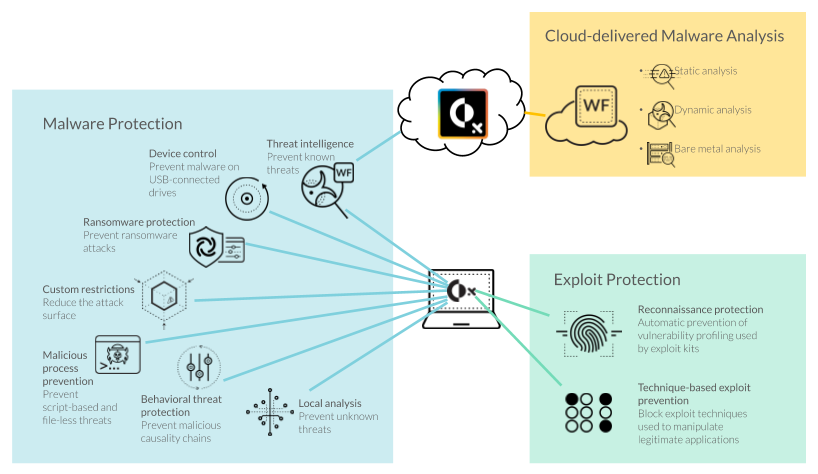
Malware protection
Cortex XSIAM malware protection uses the Cortex XDR agent and Malware Prevention Engine to block known and unknown malware. It protects endpoints from malicious files, ransomware, credential theft, web shells, and other endpoint threats.
Malware can be disguised as or embedded in legitimate files. It can gain system control, collect sensitive information, or disrupt operations. Cortex XSIAM applies layered malware prevention controls across supported endpoint platforms.
Malware protection by platform
The available malware protection methods vary by operating system and endpoint type.
Windows
| Malware protection type | Description |
|---|---|
| Anti tampering protection | Enables Cortex XSIAM to protect against tampering attempts. |
| Anti webshell protection | Enables Cortex XSIAM to protect endpoint processes from dropping malicious web shells. |
| ASP and ASPX file protection | Enables Cortex XSIAM to protect endpoint from malicious ASP and ASPX files being written to the file system. |
| Credential gathering protection | Enables Cortex XSIAM to protect endpoints from processes trying to access or steal passwords and other credentials. |
| Cryptominers protection | Enables Cortex XSIAM to protect against attempts to locate or steal cryptocurrencies. |
| Dynamic kernel protection | Enables Cortex XSIAM to protect endpoints from kernel-level threats such as bootkits, rootkits, and susceptible drivers. |
| Endpoint scanning | Enables Cortex XSIAM to scan endpoints and attached removable drives for dormant, inactive malware. |
| Financial malware threat protection | Enables Cortex XSIAM to protect against techniques specific to financial and banking malware. |
| Global behavioral threat protection rules | Enables Cortex XSIAM to use rules to protect endpoints from malicious causality chains. |
| IIS protection | Enables Cortex XSIAM to protect against Internet Information Server (IIS) attacks. |
| In-process shellcode protection | Enables Cortex XSIAM to protect against in-process shellcode attack threats. |
| JScript file examination | Enables Cortex XSIAM to detect and prevent malicious JScript files from being executed or written to disk on Windows-based endpoints. |
| JAVA files examination | Enables Cortex XDR to detect and prevent malicious JAVA files from being executed or written to disk. |
| LDAP query protection | Enables Cortex XSIAM to analyze and act upon suspicious LDAP queries sent by the agent to a Domain Controller, to detect and block Active Directory reconnaissance attacks. |
| Malicious causality chain response | Enables Cortex XSIAM to respond automatically when malicious causality chains are identified. |
| Malicious child process protection | Enables Cortex XSIAM to prevent script-based attacks. Such attacks can be used to deliver malware by blocking targeted processes that are commonly used to bypass traditional security methods. |
| Malicious device protection | Enables Cortex XSIAM to protect against the connection of potentially malicious devices to endpoints. |
| Network packet inspection | Enables Cortex XSIAM to analyze network packet data for malicious behavior. |
| Office files with macros examination | Enables Cortex XSIAM to analyze and prevent malicious macros embedded in Microsoft Office files (Word, Excel) from running on Windows endpoints. |
| On-demand file examination | Enables Cortex XSIAM to scan endpoints and attached removable drives for dormant, inactive malware. |
| On-write file examination | Enables Cortex XSIAM to monitor and take action on malicious files during the on-write process. |
| Password theft protection | Enables Cortex XSIAM to prevent attacks that extract passwords from memory using the Mimikatz tool. |
| Portable executable and DLL | Enables Cortex XSIAM to analyze and prevent malicious executable files and DLL files from running on Windows endpoints. |
| PowerShell script file examination | Enables Cortex XSIAM to analyze and prevent malicious PowerShell script files from running on Windows endpoints. |
| Ransomware protection | Enables Cortex XSIAM to protect against encryption-based activity associated with ransomware attacks. |
| Security measure bypass protection | Enables Cortex XSIAM to protect endpoints from malicious actors attempting to bypass Windows built-in security controls. |
| UAC bypass prevention | Enables Cortex XSIAM to protect against the User Access Control (UAC) bypass mechanism that is associated with privilege elevation attempts. |
| UEFI protection | Enables Cortex XSIAM to protect endpoints from Unified Extensible Firmware Interface (UEFI) manipulation attempts. |
| VB script file protection | Enables Cortex XSIAM to protect endpoints from malicious VB script files. |
macOS
| Malware protection type | Description |
|---|---|
| Anti tampering protection | Enables Cortex XSIAM to protect against tampering attempts. |
| Anti webshell protection | Enables Cortex XSIAM to protect endpoint processes from dropping malicious web shells. |
| Credential gathering protection | Enables Cortex XSIAM to protect endpoints from processes trying to access or steal passwords and other credentials. |
| Cryptominers protection | Enables Cortex XSIAM to protect against attempts to locate or steal cryptocurrencies. |
| DMG file examination | Enables Cortex XSIAM to check DMG files for malware. |
| Endpoint scanning | Enables Cortex XSIAM to scan endpoints and attached removable drives for dormant, inactive malware. |
| Financial malware threat protection | Enables Cortex XSIAM to protect against techniques specific to financial and banking malware. |
| Global behavioral threat protection rules | Enables Cortex XSIAM to use rules to protect endpoints from malicious causality chains. |
| Local file threat examination | Enables Cortex XSIAM to detect malicious files on the endpoint. |
| Mach-O file examination | Enables Cortex XSIAM to check Mach-O files for malware upon loading, and upon execution. |
| Malicious child process protection | Enables Cortex XSIAM to prevent script-based attacks. Such attacks can be used to deliver malware by blocking targeted processes that are commonly used to bypass traditional security methods. |
| Malicious device protection | Enables Cortex XSIAM to identify and block potentially malicious Human Interface Devices (HIDs), to prevent attacks that exploit device trust. |
| Network Packet Inspection Engine | Enables to detect abnormal network traffic patterns and prevent malicious activity. |
| Ransomware protection | Enables Cortex XSIAM to protect against encryption-based activity associated with ransomware attacks. |
Linux
| Malware protection type | Description |
|---|---|
| Anti webshell protection | Enables Cortex XSIAM to protect endpoint processes from dropping malicious web shells. |
| Container escaping protection | Enables Cortex XSIAM to protect against container-escaping attempts. |
| Credential gathering protection | Enables Cortex XSIAM to protect endpoints from processes trying to access or steal passwords and other credentials. |
| Cryptominers protection | Enables Cortex XSIAM to protect against attempts to locate or steal cryptocurrencies. |
| ELF file examination | <ul><li>Enables Cortex XSIAM to detect and prevent malicious ELF files from being executed or written to disk on Linux-based endpoints.</li><li>On-write file examination - Enables Cortex XSIAM to monitor and take action on malicious files during the on-write process.</li></ul> |
| ELF files loading | <ul><li>Enables Cortex XDR to intercept ELF files and Shared Objects at the moment they are loaded into a process.</li><li>On-load file examination - Enables Cortex XDR to monitor and take action on malicious files during the on-load process.</li></ul> |
| Endpoint scanning | Enables Cortex XSIAM to scan endpoints and attached removable drives for dormant, inactive malware. |
| Financial malware threat protection | Enables Cortex XSIAM to protect against techniques specific to financial and banking malware. |
| Global threat behavioral threat protection rules | Enables Cortex XSIAM to use rules to protect endpoints from malicious causality chains. |
| JAVA files examination | Enables Cortex XDR to detect and prevent malicious JAVA files from being executed or written to disk. |
| Local file threat examination | Enables Cortex XSIAM to detect malicious files on the endpoint. |
| Malicious child process protection | Enables Cortex XSIAM to prevent process creation based on examination of suspicious relations between parent and child processes. |
| Reverse shell protection | Enables Cortex XSIAM to prevent attempts to redirect standard input and output streams to network sockets. |
iOS
| Malware protection type | Description |
|---|---|
| Call and messages blocking | Enables Cortex XSIAM to act on incoming calls and messages from known spam numbers. |
| Network and EDR security module | This module lets you configure granular control and monitoring of network traffic on iOS-based supervised devices. The devices' profiles must be also configured for this on the MDM side as explained in the Cortex XDR Agent iOS Guide. |
| Safari browser security module | This security module can provide proactive gating of suspicious sites accessed using Safari, and provides informative site analysis to the device user. This option is recommended for iOS devices that do not belong to your organization and do not use the Network Shield feature. |
| Spam reports | Enables Cortex XSIAM to report calls and messages as spam. |
| URL filtering | Enables Cortex XSIAM to analyze and block or report malicious URLs, and to block or allow custom URLs. |
Android
| Malware protection type | Description |
|---|---|
| APK files examination | <p>Enables Cortex XSIAM to analyze and prevent malicious APK files from running on endpoints.</p><div data-gb-custom-block data-tag="hint" data-style="info" class="hint hint-info"><p>Note</p><p>From Cortex XDR agent for Android version 9.0 and later, part of this module, which performs local analysis on the Android device itself, is deprecated. APK analysis will be handled only by Wildfire.</p></div> |
Exploit protection
An exploit is a sequence of commands that takes advantage of a bug or vulnerability in software or hardware to gain unauthorized access or control.
To combat an attack in which an attacker takes advantage of a software exploit or vulnerability, Cortex XSIAM employs Endpoint Protection Modules (EPM). Each EPM targets a specific exploit type in the attack chain. Some capabilities that Cortex XSIAM EPMs provide are reconnaissance prevention, memory corruption prevention, code execution prevention, and kernel protection.
The following table lists the types of exploits for which Cortex XSIAM provides protection.
| Exploit protection type | Description |
|---|---|
| Reconnaissance prevention | Prevents attackers from probing the network for vulnerabilities while preserving the option to perform internal reconnaissance testing. |
| Memory corruption prevention | Prevents adversaries from exploiting memory corruption vulnerabilities. |
| Code execution prevention | Prevents malicious code that could allow attackers to deploy additional malware to steal sensitive data. |
| Kernel protection | Protects the kernel against kernel threats and exploits. |
File analysis and protection flow
The Cortex XDR agent uses multi-method endpoint protection to prevent known and unknown malware and software exploits. Cortex XSIAM analyzes files, applies prevention policies, and reports endpoint security events.
Exploit protection for protected processes
In a typical attack scenario, an attacker attempts to gain control of a system by first corrupting or bypassing memory allocation or handlers. Using memory-corruption techniques, such as buffer overflows and heap corruption, a hacker can trigger a bug in the software or exploit a vulnerability in a process. The attacker must then manipulate a program to run code provided or specified by the attacker while evading detection. If the attacker gains access to the operating system, the attacker can then upload malware, such as Trojan horses (programs that contain malicious executable files), or can otherwise use the system to their advantage. The Cortex XDR agent prevents such exploit attempts by employing roadblocks—or traps—at each stage of an exploitation attempt.
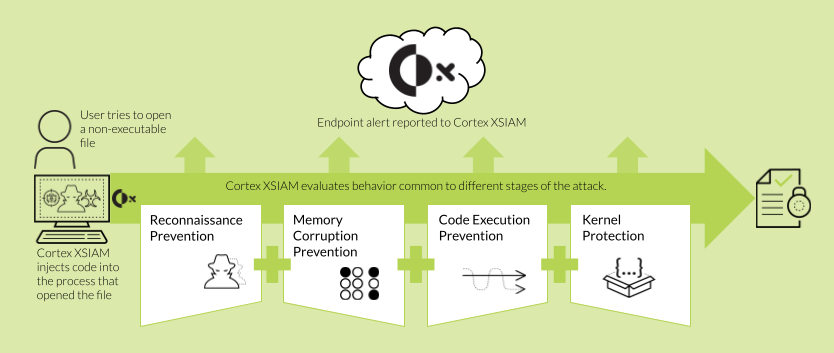
When a user opens a non-executable file, such as a PDF or Word document, and the process that opened the file is protected, the Cortex XDR agent seamlessly injects code into the software. This occurs at the earliest possible stage before any files belonging to the process are loaded into memory. The Cortex XDR agent then activates one or more protection modules inside the protected process. Each protection module targets a specific exploitation technique and is designed to prevent attacks on program vulnerabilities based on memory corruption or logic flaws.
In addition to automatically protecting processes from such attacks, the Cortex XDR agent reports any security events to Cortex XSIAM and performs additional actions as defined in the endpoint security policy. Common actions performed by the Cortex XDR agent include collecting forensic data and notifying the user about the event.
The default endpoint security policy protects the most vulnerable and most commonly used applications but you can also add other third-party and proprietary applications to the list of protected processes.
Malware protection flow
The Cortex XDR agent provides malware protection in a series of four evaluation phases:
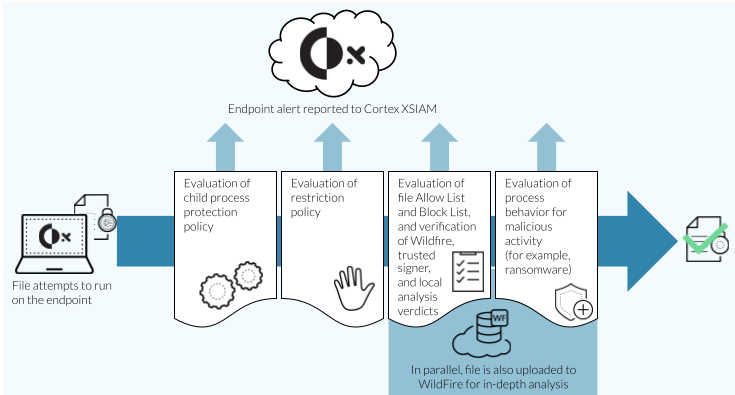
Phase 1: Child process protection policy
When a user attempts to run an executable, the operating system attempts to run the executable as a process. If the process tries to launch any child processes, the Cortex XDR agent first evaluates the child process protection policy. If the parent process is a known targeted process that attempts to launch a restricted child process, the Cortex XDR agent blocks the child processes from running and reports the security event to Cortex XSIAM. For example, if a user tries to open a Microsoft Word document (using the winword.exe process) and the document has a macro that tries to run a blocked child process (such as WScript), the Cortex XDR agent blocks the child process and reports the event to Cortex XSIAM. If the parent process does not try to launch any child processes or tries to launch a child process that is not restricted, the Cortex XDR agent next moves to Phase 2: Evaluation of the restriction policy.
Phase 2: Restriction policy
The Cortex XDR agent verifies that the executable file does not violate any restriction rules. For example, you might have a restriction rule that blocks executable files launched from network locations. If a restriction rule applies to an executable file, the Cortex XDR agent blocks the file from executing and reports the security event to Cortex XSIAM and, depending on the configuration of each restriction rule, the Cortex XDR agent can also notify the user about the prevention event.
If no restriction rules apply to an executable file, the Cortex XDR agent next moves to Phase 3: Hash verdict determination.
Phase 3: Hash verdict determination
The Cortex XDR agent calculates a unique hash using the SHA-256 algorithm for every file that attempts to run on the endpoint. Depending on the features that you enable, the Cortex XDR agent performs additional analysis to determine whether an unknown file is malicious or benign. The Cortex XDR agent can also submit unknown files to Cortex XSIAM for in-depth analysis by WildFire.
To enhance performance and efficiency, hash verdict requests from the Cortex XDR agent will be routed to the WildFire service with the lowest latency. File uploads for analysis will strictly adhere to the designated Cortex XSIAM and WildFire regions, ensuring data remains within the appropriate geographical boundaries.
To determine a verdict for a file, the Cortex XDR agent evaluates the file in the following order:
-
Hash exception: A hash exception enables you to override the verdict for a specific file without affecting the settings in your Malware Security profile. The hash exception policy is evaluated first and takes precedence over all other methods to determine the hash verdict.
For example, you may want to configure a hash exception for any of the following situations:
- You want to block a file that has a benign verdict.
- You want to allow a file that has a malware verdict to run. In general, we recommend that you only override the verdict for malware after you use available threat intelligence resources—such as WildFire—to determine that the file is not malicious.
- You want to specify a verdict for a file that has not yet received an official WildFire verdict.
After you configure a hash exception, Cortex XSIAM distributes it at the next heartbeat communication with any endpoints that have previously opened the file.
When a file launches on the endpoint, the Cortex XDR agent first evaluates any relevant hash exception for the file. The hash exception specifies whether to treat the file as malware. If the file is assigned a benign verdict, the Cortex XDR agent permits it to open.
If a hash exception is not configured for the file, the Cortex XDR agent next evaluates the verdict to determine the likelihood of malware.
- Highly trusted signers (Windows and Mac): The Cortex XDR agent distinguishes highly trusted signers such as Microsoft from other known signers. To keep parity with the signers defined in WildFire, Palo Alto Networks regularly reviews the list of highly trusted and known signers and delivers any changes with content updates. The list of highly trusted signers also includes signers that are included in the allow list from Cortex XSIAM. When an unknown file attempts to run, the Cortex XDR agent applies the following evaluation criteria: Files signed by highly trusted signers are permitted to run, and files signed by prevented signers are blocked, regardless of the WildFire verdict. Otherwise, when a file is not signed by a highly trusted signer or by a signer included in the block list, the Cortex XDR agent next evaluates the WildFire verdict. For Windows endpoints, evaluation of other known signers takes place if the WildFire evaluation returns an unknown verdict for the file.
-
WildFire verdict: If a file is not signed by a highly trusted signer on Windows and Mac endpoints, the Cortex XDR agent performs a hash verdict lookup to determine if a verdict already exists in its local cache.
If the executable file has a malware verdict, the Cortex XDR agent reports the security event to Cortex XSIAM , and, depending on the configured behavior for malicious files, the Cortex XDR agent performs one of the following actions.
- Blocks the file.
- Blocks and quarantines the file.
- Notifies the user about the file but still allows the file to execute.
- Logs the issue without notifying the user and allows the file to execute.
If the verdict is benign, the Cortex XDR agent moves on to Phase 4: Evaluation of malware security policy.
If the hash does not exist in the local cache or has an unknown verdict, the Cortex XDR agent next evaluates whether the file is signed by a known signer.
-
Local analysis: When an unknown executable, DLL, or macro attempts to run on a Windows or Mac endpoint, the Cortex XDR agent uses local analysis to determine if it is likely to be malware. On Windows endpoints, if the file is signed by a known signer, the Cortex XDR agent permits the file to run and does not perform additional analysis. For files on Mac endpoints and files that are not signed by a known signer on Windows endpoints, the Cortex XDR agent performs local analysis to determine whether the file is malware. Local analysis uses a static set of pattern-matching rules that inspect multiple file features and attributes, and a statistical model that was developed with machine learning on WildFire threat intelligence. The model enables the Cortex XDR agent to examine hundreds of characteristics for a file and issue a local verdict (benign or malicious) while the endpoint is offline or Cortex XSIAM is unreachable. The Cortex XDR agent can rely on the local analysis verdict until it receives an official WildFire verdict or hash exception.
Local analysis is enabled by default in a Malware Security profile. Because local analysis always returns a verdict for an unknown file, if you enable the Cortex XDR agent to Block files with unknown verdict, the agent only blocks unknown files if a local analysis error occurs or local analysis is disabled. To change the default settings (not recommended), see Set up malware prevention profiles.
Phase 4: Malware security policy
If the prior evaluation phases do not identify a file as malware, the Cortex XDR agent observes the behavior of the file and applies additional malware protection rules. If a file exhibits malicious behavior, such as encryption-based activity common with ransomware, the Cortex XDR agent blocks the file and reports the security event to the Cortex XSIAM.
If no malicious behavior is detected, the Cortex XDR agent permits the file (process) to continue running but continues to monitor the behavior for the lifetime of the process.
Endpoint protection capabilities
Each security profile provides a tailored list of protection capabilities that you can configure for the platform you select. The following table describes the protection capabilities you can customize in a security profile. The table also indicates which platforms support the protection capability (a dash (—) indicates the capability is not supported).
| Protection capability | Windows | Mac | Linux | Android | iOS |
|---|---|---|---|---|---|
| Agent security profiles | |||||
| <p>Agentic Endpoint Security (AES) AI agents, AI coding tools, MCP servers, IDE extensions, browser plugins, and code packages such as npm and pip create a non-binary endpoint attack surface that traditional antivirus tools do not cover. By enabling this capability, the Cortex XDR agent discovers agentic software running on the endpoint and remediates risks based on your AES policy. Learn more about Agentic Endpoint Security with Koi.</p> |
 |
|
— | — | — |
| Exploit security profiles | |||||
| <p>Browser exploits protection</p><p>Browsers can be subject to exploitation attempts from malicious web pages and exploit kits that are embedded in compromised websites. By enabling this capability, the Cortex XDR agent automatically protects browsers from common exploitation attempts.</p> | |
|
— | — | — |
| <p>Logical exploits protection</p><p>Attackers can use existing mechanisms in the operating system—such as DLL-loading processes or built in system processes—to execute malicious code. By enabling this capability, the Cortex XDR agent automatically protects endpoints from attacks that try to leverage common operating system mechanisms for malicious purposes.</p> | |
|
— | — | — |
| <p>Known vulnerable processes protection</p><p>Common applications in the operating system, such as PDF readers, Office applications, and even processes that are a part of the operating system itself can contain bugs and vulnerabilities that an attacker can exploit. By enabling this capability, the Cortex XDR agent protects these processes from attacks which try to exploit known process vulnerabilities.</p> | |
|
|
— | — |
| <p>Exploit protection for additional processes</p><p>To extend protection to third-party processes that are not protected by the default policy from exploitation attempts, you can add additional processes to this capability.</p> | |
|
|
— | — |
| <p>Operating system exploit protection</p><p>Attackers commonly leverage the operating system itself to accomplish a malicious action. By enabling this capability, the Cortex XDR agent protects operating system mechanisms such as privilege escalation and prevents them from being used for malicious purposes.</p> | |
|
|
— | — |
| <p>Unpatched vulnerabilities protection</p><p>If you have Windows endpoints in your network that are unpatched and exposed to a known vulnerability, Palo Alto Networks strongly recommends that you upgrade to the latest Windows Update that has a fix for that vulnerability. If you choose not to patch the endpoint, the Unpatched Vulnerabilities Protection capability allows the Cortex XDR agent to apply a workaround to protect the endpoints from the known vulnerability.</p> | |
— | — | — | — |
| Malware security profiles | |||||
| <p>Behavioral threat protection</p><p>Prevents sophisticated attacks that leverage built-in OS executables and common administration utilities by continuously monitoring endpoint activity for malicious causality chains.</p> | |
|
|
— | — |
| <p>Credential gathering protection</p><p>Targets attempts to access and harvest passwords and credentials.</p> | |
|
|
— | — |
| <p>Anti webshell protection</p><p>Prevents web shell attacks by continuously monitoring endpoints for processes that try to drop malicious files.</p> | |
|
|
— | — |
| <p>Financial malware threat protection</p><p>Targets attempts to access or steal financial or banking information.</p> | |
|
|
— | — |
| <p>Cryptominers protection</p><p>Prevents cryptomining by monitoring for processes which attempt to locate or steal cryptocurrencies.</p> | |
|
|
— | — |
| <p>In-process shellcode protection</p><p>Targets attempts to run in-process shellcodes that load malicious code.</p> | |
— | — | — | — |
| <p>Ransomware protection</p><p>Targets encryption based activity associated with ransomware to analyze and halt ransomware before any data loss occurs.</p> | |
|
— | — | — |
| <p>Prevent malicious child process execution</p><p>Prevents script-based attacks used to deliver malware by blocking known targeted processes from launching child processes commonly used to bypass traditional security approaches.</p> | |
|
|
— | — |
| <p>Portable executables and DLLs examination</p><p>Analyzes and prevents malicious executable and DLL files from running.</p> | |
|
|
— | — |
| <p>ELF files examination</p><p>Analyzes and prevents malicious ELF files from being executed or written to disk.</p> | — | — | |
— | — |
| <p>Local file threat examination</p><p>Analyzes and quarantines malicious PHP files arriving from the web server.</p> | — | — | |
— | — |
| <p>Office files examination</p><p>Analyzes and prevents malicious macros embedded in Microsoft Office files from running.</p> | |
— | — | — | — |
| <p>JScript files examination</p><p>Analyzes and prevent malicious JScript files from being executed or written to disk.</p> | |
— | — | — | — |
| <p>Mach-O files examination</p><p>Analyzes and prevents malicious mach-o files from loading and running.</p> | — | |
|
— | — |
| <p>DMG files examination</p><p>Analyzes and prevents malicious DMG files from running.</p> | — | |
— | — | — |
| <p>APK files examination</p><p>Analyzes and prevents malicious APK files from running.</p> | — | — | — | |
— |
| <p>Reverse shell protection</p><p>Detects suspicious or abnormal network activity from shell processes and terminate the malicious shell process.</p> | — | — | |
— | — |
| <p>Network packet inspection engine</p><p>Analyzes network packet data to detect malicious behavior.</p> | |
|
— | — | — |
| <p>Dynamic kernel protection</p><p>Protect the endpoint from kernel-level threats such as bootkits, rootkits, and susceptible drivers.</p> | |
— | — | — | — |
| <p>SMS and MMS malicious URL filtering</p><p>Filter, report, or block (iOS only) malicious URLs received in SMS/MMS messages.</p> | — | — | — | — | |
| Spam reports | — | — | — | — | |
| Call and messages blocking | — | — | — | — | |
| Container-escaping attempts | — | — | |
— | — |
| <p>Network URL filtering</p><p>URL filtering for supervised devices</p> | — | — | — | — | |
| <p>Cryptocurrency wallets protection</p><p>Protection for cryptocurrency wallets stored on endpoints.</p> | |
|
— | — | — |
| <p>LDAP query protection</p><p>Analyze and act upon suspicious LDAP queries sent by the agent to a Domain Controller, to detect and block Active Directory reconnaissance attacks.</p> | |
— | — | — | — |
| <p>Malicious device protection</p><p>Protect your systems from unauthorized hardware attacks and malicious USB devices. The Malicious Device Prevention module identifies and blocks Human Interface Device (HID) tools, such as the "USB Rubber Ducky", that exploit device trust to inject unauthorized keystrokes and similar actions. This feature reduces the physical attack surface, and prevents hardware-based social engineering threats from compromising data.</p> | — | |
— | — | — |
| Restrictions security profiles | |||||
| <p>Execution paths</p><p>Many attack scenarios are based on writing malicious executable files to certain folders such as the local temp or download folder and then running them. Use this capability to restrict the locations from which executable files can run.</p> | |
— | — | — | — |
| <p>Network locations</p><p>To prevent attack scenarios that are based on writing malicious files to remote folders, you can restrict access to all network locations except for those that you explicitly trust.</p> | |
— | — | — | — |
| <p>Removable media</p><p>To prevent malicious code from gaining access to endpoints using external media such as a removable drive, you can restrict the executable files, that users can launch from external drives attached to the endpoints in your network.</p> | |
— | — | — | — |
| <p>Optical drive</p><p>To prevent malicious code from gaining access to endpoints using optical disc drives (CD, DVD, and Blu-ray), you can restrict the executable files, that users can launch from optical disc drives connected to the endpoints in your network.</p> | |
— | — | — | — |
Endpoint protection modules
Each security profile applies multiple security modules to protect your endpoints from a wide range of attack techniques. While the settings for each security module are not configurable, the Cortex XDR agent activates a specific protection module depending on the type of attack, the configuration of your security policy, and the operating system of the endpoint.
When a security event occurs, the Cortex XDR agent logs details about the event including the security module employed by the Cortex XDR agent to detect and prevent the attack based on the technique. To help you understand the nature of the attack, the alert identifies the protection module the Cortex XDR agent employed.
The following table lists the modules and the platforms on which they are supported. A dash (—) indicates that the module is not supported.
| Module | Windows | Mac | Linux | Android |
|---|---|---|---|---|
| <p>Anti-Ransomware</p><p>Targets encryption-based activity associated with ransomware and have the ability to analyze and halt ransomware activity before any data loss occurs.</p> | |
|
— | — |
| <p>APC protection</p><p>Prevents attacks that change the execution order of a process by redirecting an asynchronous procedure call (APC) to point to the malicious shellcode.</p> | |
— | — | — |
| <p>Behavioral threat</p><p>Prevents sophisticated attacks that leverage built-in OS executables and common administration utilities by continuously monitoring endpoint activity for malicious causality chains.</p> | |
|
|
— |
| <p>Brute force protection</p><p>Prevents attackers from hijacking the process control flow by monitoring memory layout enumeration attempts.</p> | — | — | |
— |
| <p>Child process protection</p><p>Prevents script-based attacks that are used to deliver malware, such as ransomware, by blocking known targeted processes from launching child processes that are commonly used to bypass traditional security approaches.</p> | |
|
|
— |
| <p>Container escaping protection</p><p>Prevents container-escaping attempts</p> | — | — | |
— |
| <p>CPL protection</p><p>Protects against vulnerabilities related to the display routine for Windows Control Panel Library (CPL) shortcut images, which can be used as a malware infection vector.</p> | |
— | — | — |
| <p>Data Execution Prevention (DEP)</p><p>Prevents areas of memory defined to contain only data from running executable code.</p> | |
— | — | — |
| <p>DLL hijacking</p><p>Prevents DLL-hijacking attacks where the attacker attempts to load dynamic-link libraries on Windows operating systems from unsecured locations to gain control of a process.</p> | |
— | — | — |
| <p>DLL security</p><p>Prevents access to crucial DLL metadata from untrusted code locations.</p> | |
— | — | — |
| <p>Dylib hijacking</p><p>Prevents Dylib-hijacking attacks where the attacker attempts to load dynamic libraries on Mac operating systems from unsecured locations to gain control of a process.</p> | — | |
— | — |
| <p>Exploit kit fingerprint</p><p>Protects against the fingerprinting technique used by browser exploit kits to identify information: such as the OS or applications which run on an endpoint—that attackers can leverage when launching an attack to evade protection capabilities.</p> | |
— | — | — |
| <p>Font protection</p><p>Prevents improper font handling, a common target of exploits.</p> | |
— | — | — |
| <p>Gatekeeper enhancement</p><p>Enhances the macOS gatekeeper functionality that allows apps to run based on their digital signature. This module provides an additional layer of protection by extending gatekeeper functionality to bundles and child processes so you can enforce the signature level of your choice.</p> | — | |
— | — |
| <p>Hash exception</p><p>Halts execution of files that an administrator identified as malware regardless of the WildFire verdict.</p> | |
|
|
|
| <p>Hot patch protection</p><p>Prevents the use of system functions to bypass DEP and address space layout randomization (ASLR).</p> | |
— | — | — |
| <p>Java deserialization</p><p>Blocks attempts to execute malicious code during the Java objects deserialization process on Java-based servers.</p> | |
— | |
— |
| <p>JIT</p><p>Prevents an attacker from bypassing the operating system's memory mitigations using just-in-time (JIT) compilation engines.</p> | |
|
— | — |
| <p>Kernel Integrity Monitor (KIM)</p><p>Prevents rootkit and vulnerability exploitation on Linux endpoints. On the first detection of suspicious rootkit behavior, the behavioral threat protection (BTP) module generates a Cortex XDR Agent alert. Cortex XSIAM stitches logs about the process that loaded the kernel module with other logs relating to the kernel module to aid in the alert investigation. When the Cortex XDR agent detects subsequent rootkit behavior, it blocks the activity.</p> | — | — | |
— |
| <p>LDAP query protection</p><p>Analyzes and acts upon suspicious LDAP queries received by the Domain Controller, to detect and block Active Directory reconnaissance attacks.</p> | |
— | — | — |
| <p>Local analysis</p><p>Examines hundreds of characteristics of an unknown executable file, DLL, or macro to determine if it is likely to be malware. The local analysis module uses a static set of pattern-matching rules that inspect multiple file features and attributes, and a statistical model that was developed using machine learning on WildFire threat intelligence.</p> | |
|
|
— |
| <p>Local Threat Evaluation Engine (LTEE)</p><p>Protects against malicious PHP files arriving from the web server.</p> | — | — | |
— |
| <p>Local privilege escalation protection</p><p>Prevents attackers from performing malicious activities that require privileges that are higher than those assigned to the attacked or malicious process.</p> | |
|
|
— |
| <p>Malicious device protection</p><p>Protects your systems from unauthorized hardware attacks and malicious Human Interface Devices (HIDs) such as malicious USB devices.</p> | — | |
— | — |
| <p>Master Boot Record (MBR) Model</p><p>Protects against malicious Master Boot Record (MBR) manipulations.</p> | |
— | — | — |
| <p>Network packet inspection engine</p><p>Analyze network packet data to detect malicious behavior already at the network level. The engine leverages both Palo Alto Networks NGFW content rules, and new Cortex XDR content rules created by the Research Team which are updated through the security content.</p> | |
|
— | — |
| <p>Null dereference</p><p>Prevents malicious code from mapping to address zero in the memory space, making null dereference vulnerabilities unexploitable.</p> | |
— | — | — |
| <p>Restricted execution - local path</p><p>Prevents unauthorized execution from a local path.</p> | |
— | — | — |
| <p>Restricted execution - network location</p><p>Prevents unauthorized execution from a network path.</p> | |
— | — | — |
| <p>Restricted execution - removable media</p><p>Prevents unauthorized execution from removable media.</p> | |
— | — | — |
| <p>Reverse shell protection</p><p>Blocks malicious activity where an attacker redirects standard input and output streams to network sockets.</p> | — | — | |
— |
| <p>ROP</p><p>Protects against the use of return-oriented programming (ROP) by protecting APIs used in ROP chains.</p> | |
|
|
— |
| <p>SEH</p><p>Prevents hijacking of the structured exception handler (SEH), a commonly exploited control structure that can contain multiple SEH blocks that form a linked list chain, which contains a sequence of function records.</p> | |
— | — | — |
| <p>Shellcode protection</p><p>Reserves and protects certain areas of memory commonly used to house payloads using heap spray techniques.</p> | — | — | |
— |
| <p>ShellLink</p><p>Prevents shell-link logical vulnerabilities.</p> | |
— | — | — |
| <p>SO hijacking protection</p><p>Prevents dynamic loading of libraries from unsecured locations to gain control of a process.</p> | — | — | |
— |
| <p>SysExit</p><p>Prevents using system calls to bypass other protection capabilities.</p> | |
— | — | — |
| <p>UASLR</p><p>Improves or altogether implements ASLR (address space layout randomization) with greater entropy, robustness, and strict enforcement.</p> | |
— | — | — |
| <p>UEFI BTP</p><p>Reinforces the malware protection from pre-boot attacks.</p> | |
— | — | — |
| <p>Vulnerable drivers protection</p><p>Detect attempts to load vulnerable drivers.</p> | |
— | — | — |
| <p>WildFire</p><p>Leverages WildFire for threat intelligence to determine whether a file is malware. In the case of unknown files, Cortex XDR can forward samples to WildFire for in-depth analysis.</p> | |
|
|
|
| <p>WildFire post-detection (malware and grayware)</p><p>Identifies a file that was previously allowed to run on an endpoint that is now determined to be malware. Post-detection events provide notifications for each endpoint on which the file is executed.</p> | |
|
|
|
Processes protected by exploit security policy
By default, your exploit security profile protects endpoints from attack techniques that target specific processes. Each exploit protection capability protects a different set of processes that Palo Alto Networks researchers determine are susceptible to attack. The following tables display the processes that are protected by each exploit protection capability for each operating system.
Windows processes protected by the exploit security policy
| Browser exploits protection | ||
|---|---|---|
| <ul><li>[updated version of Adobe Flash Player for Firefox installed on endpoint]</li><li>browser_broker.exe</li><li>chrome.exe</li><li>firefox.exe</li></ul> | <ul><li>flashutil_activex.exe</li><li>iexplore.exe</li><li>microsoftedge.exe</li><li>microsoftedgecp.exe</li><li>opera_plugin_wrapper.exe</li></ul> | <ul><li>opera.exe</li><li>plugin-container.exe</li><li>safari.exe</li><li>webkit2webprocess.exe</li></ul> |
| Logical exploits protection | ||
| <ul><li>cliconfg.exe</li><li>dism.exe</li><li>dllhost.exe</li></ul> | <ul><li>excel.exe</li><li>migwiz.exe</li><li>mmc.exe</li></ul> | <ul><li>powerpnt.exe</li><li>sysprep.exe</li><li>winword.exe</li></ul> |
| Known vulnerable processes protection | ||
| <ul><li>7z.exe</li><li>7zfm.exe</li><li>7zg.exe</li><li>acrobat.exe</li><li>acrord32.exe</li><li>acrord32info.exe</li><li>allplayer.exe</li><li>applemobiledeviceservice.exe</li><li>apwebgrb.exe</li><li>armsvc.exe</li><li>blazehdtv.exe</li><li>bsplayer.exe</li><li>cmd.exe</li><li>eqnedt32.exe</li><li>excel.exe</li><li>flashfxp.exe</li><li>fltldr.exe</li><li>fontdrvhost.exe</li><li>foxit reader.exe</li><li>foxitreader.exe</li><li>groovemonitor.exe</li><li>hxmail.exe</li><li>i_view32.exe</li><li>infopath.exe</li></ul> | <ul><li>ipodservice.exe</li><li>itunes.exe</li><li>ituneshelper.exe</li><li>journal.exe</li><li>jqs.exe</li><li>microsoft.photos.exe</li><li>msaccess.exe</li><li>mspub.exe</li><li>mstsc.exe</li><li>nginx.exe</li><li>notepad++.exe</li><li>nslookup.exe</li><li>outlook.exe</li><li>powerpnt.exe</li><li>pptview.exe</li><li>qttask.exe</li><li>quicktimeplayer.exe</li><li>rar.exe</li><li>reader_sl.exe</li><li>realconverter.exe</li><li>realplay.exe</li><li>realsched.exe</li><li>skype.exe</li><li>skypeapp.exe</li><li>skypehost.exe</li></ul> | <ul><li>SLMail.exe</li><li>soffice.exe</li><li>sqlservr.exe</li><li>telnet.exe</li><li>unrar.exe</li><li>vboxservice.exe</li><li>vboxsvc.exe</li><li>vboxtray.exe</li><li>video.ui.exe</li><li>visio.exe</li><li>vlc.exe</li><li>vmware-authd.exe</li><li>vmware-hostd.exe</li><li>vmware-vmx.exe</li><li>vpreview.exe</li><li>vprintproxy.exe</li><li>wab.exe</li><li>w3wp.exe</li><li>winrar.exe</li><li>winword.exe</li><li>wireshark.exe</li><li>wmplayer.exe</li><li>wmpnetwk.exe</li><li>xpsrchvw.exe</li></ul> |
| Operating system exploit protection | ||
| <ul><li>ctfmon.exe</li><li>dllhost.exe</li><li>dns.exe</li><li>lsass.exe</li><li>msmpeng.exe</li></ul> | <ul><li>runtimebroker.exe</li><li>spoolsv.exe</li><li>svchost.exe</li><li>taskeng.exe</li></ul> | <ul><li>taskhost.exe</li><li>wmiprvse.exe</li><li>wmiprvse.exe</li><li>wwahost.exe</li></ul> |
Mac processes protected by the exploit security policy
| Browser exploits protection | ||
|---|---|---|
| <ul><li>com.apple.safariservices</li><li>com.apple.webkit.plugin</li><li>com.apple.webkit.plugin.64</li><li>com.apple.webkit.webcontent</li></ul> | <ul><li>firefox</li><li>firefox-bin</li><li>google chrome helper</li><li>google chrome</li></ul> | <ul><li>plugin-container</li><li>safari</li><li>seamonkey</li></ul> |
| Logical exploits protection | ||
| <ul><li>adobereader</li><li>app drive for google drive</li><li>app drop for dropbox</li><li>app for dropbox</li><li>app for facebook</li><li>app for google drive</li><li>app for googledocs</li><li>app for instagram</li><li>app for linkedin</li><li>app for youtube</li><li>com.apple.safariservices</li><li>com.apple.webkit.plugin</li><li>com.apple.webkit.plugin.64</li><li>com.apple.webkit.webcontent</li><li>document writer</li></ul> | <ul><li>firefox</li><li>firefox-bin</li><li>google chrome helper</li><li>google chrome</li><li>itunes helper</li><li>itunes</li><li>mail+ for yahoo</li><li>microsoft excel</li><li>microsoft outlook</li><li>microsoft powerpoint</li><li>microsoft remote desktop</li><li>microsoft word</li><li>miniwriterfree</li><li>parallels client</li><li>pdf reader pro free</li></ul> | <ul><li>pdf reader x</li><li>plugin-container</li><li>quicktime player</li><li>safari</li><li>seamonkey</li><li>slack</li><li>sonicwall mobile connect</li><li>textwrangler</li><li>vlc</li><li>vmware fusion services</li><li>vmware fusion</li><li>vpn shield</li><li>winmail.dat file viewer</li></ul> |
| Known vulnerable processes protection | ||
| <ul><li>adobereader</li><li>airmail</li><li>app drive for google drive</li><li>app drop for dropbox</li><li>app for dropbox</li><li>app for facebook</li><li>app for google drive</li><li>app for googledocs</li><li>app for instagram</li><li>app for linkedin</li><li>app for youtube</li><li>bbedit</li><li>c-lion</li><li>cisco anyconnect secure mobility client</li><li>com.apple.cloudphotosconfiguration</li></ul> | <ul><li>document writer</li><li>itunes helper</li><li>itunes</li><li>jump desktop</li><li>mail</li><li>mail+ for yahoo</li><li>messages</li><li>microsoft excel</li><li>microsoft outlook</li><li>microsoft powerpoint</li><li>microsoft remote desktop</li><li>microsoft word</li><li>miniwriterfree</li><li>parallels client</li><li>pdf reader pro free</li><li>pdf reader x</li></ul> | <ul><li>photos</li><li>photoshop</li><li>quickbooks</li><li>quicktime player</li><li>signal</li><li>slack</li><li>sonicwall mobile connect</li><li>telegram</li><li>textmate</li><li>textwrangler</li><li>thunderbird</li><li>vlc</li><li>vmware fusion services</li><li>vmware fusion</li><li>vpn shield</li><li>winmail.dat file viewer</li></ul> |
Linux processes protected by the exploit security policy
| Known vulnerable processes protection | ||
|---|---|---|
| <ul><li>anacron</li><li>apache2</li><li>authproxy</li><li>bluetoothd</li><li>charon</li><li>chronyd</li><li>couriertcpd</li><li>cron</li><li>crond</li><li>cupsd</li><li>cyrus_pop3d</li><li>danted</li><li>dhcpd</li><li>dovecot</li><li>exim</li><li>ftpd</li><li>httpd</li><li>ibserver</li><li>identd</li><li>lighttpd</li><li>java</li><li>kamailio</li></ul><p>chronyd is injected in some scenarios, depending on the OS.</p> | <ul><li>mailman</li><li>master</li><li>mongod</li><li>mysqld</li><li>mysqld_safe</li><li>named</li><li>ndsd</li><li>nginx</li><li>nmbd</li><li>node</li><li>nscd</li><li>php</li><li>php5-fpm</li><li>pmmasterd</li><li>pop2d</li><li>pop3d</li><li>postgres</li><li>proftpd</li><li>qmgr</li><li>rpcbind</li><li>rsync</li></ul> | <ul><li>samba</li><li>saned</li><li>sendmail</li><li>sendmail.sendmail</li><li>smartd</li><li>smbd</li><li>snmpd</li><li>squid</li><li>squid3</li><li>starter</li><li>syslog-ng</li><li>tinyproxy</li><li>vsftpd</li><li>wickedd-dhcp4</li><li>wickedd-dhcp6</li><li>winbindd</li><li>xinetd</li></ul> |
File Integrity Monitoring (FIM)
File Integrity Monitoring (FIM) serves as a security control designed to detect unauthorized or anomalous modifications to files and folders in the file system. Any change, such as, a new file being created or an existing file being modified, will trigger an event that is sent to the Cortex Platform.
Cortex XDR agent integrates FIM capabilities directly into its endpoint detection and response engine, enhancing the fidelity and actionable intelligence derived from file events. This also allows seamless deployment of FIM capabilities over workstations and servers with the XDR agent installed.
File Integrity Monitoring requires a Cortex XDR agent with version 8.9.0 and above. FIM capabilities can be enabled on the following platforms and environments. See Where can I install the Cortex XDR agent? for full platform options.
| Platform | Available Implementation |
|---|---|
| Windows | Servers and workstations |
| Linux | User mode and Kernel mode |
| Kubernetes | Containerized environments |
Configuration and implementation
FIM rules are used to define which files and folders should be monitored, and FIM rule groups are used to consolidate multiple FIM rules into a single entity.
Creating, modifying and viewing FIM rule groups and rules is be done in the Rule Groups page, located at the Inventory → Endpoints → File Integrity Monitoring menu.
First, create a rule group by choosing + New Group. See Add a new FIM rule group.
After defining the general settings of the group, set up FIM rules in the Rules section by selecting + Add rule with the following properties:
- Description: a brief description of the rule and its purpose
- Path: the path of the file or folder to monitor. See File and Folder path configuration.
- Events To Monitor: type of events that should be monitored. Any will capture all events on the defined file path, Specific events allows the selection of specific event types as Delete, Create, Modify. When choosing Any, new types of events that may be added in the future will also be monitored.
Once created, a FIM rule group must be assigned to a specific File Integrity Monitoring extension profile. See Apply File Integrity Monitoring profiles to your endpoint policies.
It is recommended to create a policy that targets only the necessary files and folders.
Add a new FIM rule group
Add a new FIM rule group
Create a new FIM rule group, then set up FIM rules in the Rules section by selecting + Add rule
- In Endpoints → File Integrity Monitoring → Rule groups, select +New Group.
- Fill in the General Settings.
- Assign a profile Name
- Add a brief Description to describe the rule group and its purpose.
-
Select the Platform.
- For Linux, define the monitoring mode: Host or Containers
Note
Platform cannot be changed once a rule group has been created
- For each rule, add an optional description and the required path. See File and Folder path configuration.
- Specify the events to monitor.
- Any will capture all events on the defined file path. New types of events that may be added in the future will also be monitored.
- Specific events allow the selection of the event types: Delete, Create, Modify.
Note
A rule group can contain up to 100 rules.
Add a new FIM rule group profile
- In Inventory → Endpoints → Policy management → Extensions → Profiles, select +Add Profile and then select either Create New or Import from File.
- Select a Platform and click File Integrity Monitoring → Next.
-
Fill in the General Information.
Assign the profile Name and add an optional Description.
- Select the Platform. For Linux, define the monitoring mode, Host or Containers
-
In FIM Rule Group Select +Manage Group.
Select the required FIM Rule Groups.
- To save the FIM rule group definitions, click Create.
- It is allowed to add up to ten rule groups to a profile.
Apply File Integrity Monitoring profiles to your endpoint policies
Apply File Integrity Monitoring profiles to your endpoint policies
After you define the required File Integrity Monitoring profiles, configure policies with File Integrity Monitoring and enforce them on your endpoints. Cortex XSIAM applies File Integrity Monitoring policies on endpoints from beginning to end, as you’ve ordered them on the page. The first policy that matches the endpoint is applied. If no policies match, the default policy that enables all devices is applied.
-
In Inventory → Endpoints → Policy management → Extensions → Policy Rules, select + New Policy or Import from File.
Note
When importing a policy, select whether to enable the associated policy targets. Rules within the imported policy are managed as follows:
- New rules are added to the top of the list.
- Default rules override the default rule in the target tenant.
- Rules without a defined target are disabled until the target is specified.
- Configure settings for the File Integrity Monitoring policy.
- Assign a policy name and select the platform. You can add a description.
- Assign the File Integrity Monitoring profile you want to use in this rule.
- Click Next.
-
Select the target endpoints on which to enforce the policy.
Use filters or manual endpoint selection to define the exact target endpoints of the policy rules. If exists, the Group Name is filtered according to the groups within your defined user scope.
- Click Done.
-
Configure policy hierarchy.
Drag the policies in the desired order of execution. The default policy that enables all devices on all endpoints is always the last one on the page and is applied to endpoints that don’t match the criteria in the other policies.
-
Save the policy hierarchy.
After the policy is saved and applied to the agents, Cortex XSIAM enforces the File Integrity Monitoring policies on your environment.
-
(Optional) Manage your policy rules.
In the Prevention Policy Rules table, you can view and edit the policy you created and the policy hierarchy.
- View your policy hierarchy.
- Right-click to View Policy Details, Edit, Save as New, Disable, and Delete.
- Select one or more policies, right-click and select Export Policies. You can choose to include the associated Policy Targets, Global Exceptions, and endpoint groups.
File and Folder path configuration
| Platform | Path restrictions |
|---|---|
| Windows | <ul><li>Must start with a valid root (e.g., C:\ or *</li></li><li>Has at least one valid segment or wildcard (asterisk) after each slash</li><li>Cannot end in a bare slash unless followed by a filename or wildcard (asterisk)</li><li>Cannot contain invalid characters: < > : "</li></ul> |
| Linux | <ul><li>Must start with a valid root (/)</li><li>Rules used to monitor folders must end with a forward slash (/)</li><li>Wildcard (asterisk) is supported by regex, but only at the last element of the path (basename)</li><li>Cannot contain invalid characters: < > : "</li></ul> |
View File Integrity Monitoring events
After you apply File Integrity Monitoring rules in your environment, use the Inventory → Endpoints → File Integrity Monitoring page to monitor events. The most recent events are displayed on the page. You can sort the results and use the filters menu to narrow down the results.
Use XQL to view all FIM events by querying the ‘xdr_dataset’ with the filter ‘fim_event = TRUE’.
Note
It is possible to ingest up to 15,000 events per day (24 hours) for each host/container.
CaaS Workloads
Deploy the Cortex XDR container-embedded agent on Container as a Service (CaaS) environments to extend runtime security and vulnerability scanning to containerized workloads. The container-embedded Cortex XDR agent provides malware prevention, exploit protection, vulnerability assessment, and altered binary execution restriction for containers running on managed container services.
The Cortex XDR container-embedded agent is a purpose-built agent designed for containerized environments. The agent embeds directly into your existing workflows.
The container-embedded agent is embedded directly into your container image during the Docker build process. The agent runs as an entry point within your application container, providing runtime security and vulnerability scanning without requiring a separate container.
This topic explains the process of how to embed the Cortex XDR agent in your dockerfile.
Notice
This feature requires a Cloud Runtime Security or Cortex XSIAM Premium license. Every 10 container-embedded agents will consume a single Cortex Runtime Security license.
CaaS container-embedded agent installer
The following managed container services are supported. See the prerequisites tables below for the requirements for each container service.
- AWS ECS Fargate; containers using x86_64 and AArch64 architecture
- Azure Container Instances (ACI); containers using x86_64 architecture
- Google Cloud Run (GCR); containers using x86_64 architecture
Prerequisites
Before you deploy the container-embedded agent, verify the following:
| Prerequisite | Details |
|---|---|
| Supported Environment | AWS ECS Fargate; containers using x86_64 and aarch64 architecture |
| Requirements | Cortex XDR agent version 9.2.0 or later Required resources per container:
Dockerfile requirements:
Assets discovery: Onboard the relevant AWS environments Drift detection: Container registry image scanning |
| Limitations |
|
| Prerequisite | Details |
|---|---|
| Supported Environment | Azure Container Instances (ACI) containers using x86_64 architecture |
| Requirements | Cortex XDR agent version 9.3.0 or later In your YAML deployment file, define the following: a) Required resources per container:
b) Azure container registry credentials imageRegistryCredentials: Server: Full ACR Username: Access Key Admin Username Password: Access Key Admin User Password c) There are two valid identity options, one of these identities must be defined:
d) The relevant identity must have Reader and AcrPull permissions
f) For the User Identity option, assign the following Environment Variables:
|
| Supported deployments |
|
| Prerequisite | Details |
|---|---|
| Supported Environment | Google Cloud Run (GCR) containers using x86_64 architecture |
| Requirements | Cortex XDR agent version 9.3.0 or later a) Required resources per container:
b) Dockerfile requirement: For log retention, set the environment variable path: XDR_LOG_DIR = </opt/traps/log> Note: Do not use /var/log or any subdirectories from it. |
| Supported deployments |
|
| Limitations |
|
To create the Cortex XDR container-embedded agent Dockerfile via API.
See the API reference guide: Create distributions
To create the Cortex XDR container-embedded agent Dockerfile via user interface:
- In your Cortex management console, navigate to Inventory → Endpoints → Installations, click Create.
- Select CaaS as the Package Type and in Metadata, select Container Embedded as the Deployment Type.
- Define the configuration settings for version and proxy (optional).
- Upload your Dockerfile. Cortex XSIAM validates your Dockerfile against the prerequisites.
- A new Agent Installation instance will be created- right-click it and download the newly generated Dockerfile.
Embed the Cortex XDR container-embedded agent Dockerfile into your container image:
- Select the newly generated Dockerfile.
- Re-build your container image using the newly generated Dockerfile.
- During the build process, the agent binary will be fetched from the Cortex repository and baked into the image.
- Once the build process is successfully finished, you are ready to use the new container image in your CaaS environments, based on the prerequisites above.
WildFire analysis concepts
Cortex XSIAM uses WildFire analysis to inspect unknown files and return security verdicts. The Cortex XDR agent uses these verdicts to prevent malware and protect endpoints.
File forwarding to WildFire
Cortex XSIAM sends unknown samples for in-depth analysis to WildFire. WildFire accepts up to 1,000,000 sample uploads per day and up to 1,000,000 verdict queries per day from each Cortex XSIAM tenant. The daily limit resets at 23:59:00 UTC. Uploads that exceed the sample limit are queued for analysis after the limit resets. WildFire also limits sample sizes to 300 MB. For more information, see the WildFire documentation.
For samples that the Cortex XDR agent reports, the agent first checks its local cache of hashes to determine if it has an existing verdict for that sample. If the Cortex XDR agent does not have a local verdict, the Cortex XDR agent queries Cortex XSIAM to determine if WildFire has previously analyzed the sample. If the sample is identified as malware, it is blocked. If the sample remains unknown after comparing it against existing WildFire signatures, Cortex XSIAM forwards the sample for WildFire analysis.
File type analysis
The Cortex XDR agent analyzes files based on the type of file, regardless of the file’s extension. For deep inspection and analysis, you can also configure your Cortex XSIAM to forward samples to WildFire. A sample can be:
- Any Portable Executable (PE) file including (but not limited to):
- Executable files
- Object code
- FON (Fonts)
- Microsoft Windows screensaver (.scr) files
- Microsoft Office files containing macros opened in Microsoft Word (winword.exe) and Microsoft Excel (excel.exe):
- Microsoft Office 2003 to Office 2016—.doc and .xls
- Microsoft Office 2010 and later releases—.docm, .docx, .xlsm, and .xlsx
- Dynamic-link library files including (but not limited to):
- .dll files
- .ocx files
- Android application package (APK) files
- Mach-o files
- DMG files
- Linux (ELF) files
For information on file-examination settings, see Set up malware prevention profiles.
WildFire verdicts
WildFire delivers verdicts to identify samples it analyzes as safe, malicious, or unwanted (grayware is considered obtrusive but not malicious):
- Unknown: Initial verdict for a sample for which WildFire has received but has not analyzed.
- Benign: The sample is safe and does not exhibit malicious behavior. If Low Confidence is indicated for the Benign verdict, Cortex XSIAM can treat this hash as if the verdict is unknown and further run Local Analysis to get a verdict with higher confidence.
- Malware: The sample is malware and poses a security threat. Malware can include viruses, worms, Trojans, Remote Access Tools (RATs), rootkits, botnets, and malicious macros. For files identified as malware, WildFire generates and distributes a signature to prevent future exposure to the threat.
- Grayware: The sample does not pose a direct security threat but might display otherwise obtrusive behavior. Grayware typically includes adware, spyware, and Browser Helper Objects (BHOs).
Note
In cases when the Cortex XSIAM agent gets a failed status from the WF service due to a general error or unsupported file type, and the Local Analysis is set to disabled or not applicable, Cortex XSIAM will not generate an alert on the file.
When WildFire is not available, or integration is disabled, the Cortex XDR agent can also assign a local verdict for the sample using additional methods of evaluation. When the Cortex XDR agent performs local analysis on a file, it uses pattern-matching rules and machine learning to determine the verdict. The Cortex XDR agent can also compare the signer of a file with a local list of trusted signers to determine whether a file is malicious:
- Local analysis verdicts:
- Benign: Local analysis determined the sample is safe and does not exhibit malicious behavior.
- Malware: The sample is malware and poses a security threat. Malware can include viruses, worms, Trojans, Remote Access Tools (RATs), rootkits, botnets, and malicious macros.
- Trusted signer verdicts:
- Trusted: The sample is signed by a trusted signer.
- Not Trusted: The sample is not signed by a trusted signer.
Local verdict cache
The Cortex XDR agent stores hashes and the corresponding verdicts for all files that attempt to run on the endpoint in its local cache. The local cache scales in size to accommodate the number of unique executable files opened on the endpoint. On Windows endpoints, the cache is stored in the C:\ProgramData\Cyvera\LocalSystem folder on the endpoint. When service protection is enabled (see Set up agent settings profiles), the local cache is accessible only by the Cortex XDR agent and cannot be changed.
Each time a file attempts to run, the Cortex XDR agent performs a lookup in its local cache to determine if a verdict already exists. If known, the verdict is either the official WildFire verdict or manually set as a hash exception. Hash exceptions take precedence over any additional verdict analysis.
If the file is unknown in the local cache, the Cortex XDR agent queries Cortex XSIAM for the verdict. If Cortex XSIAM receives a verdict request for a file that was already analyzed, Cortex XSIAM immediately responds to the Cortex XDR agent with the verdict.
If Cortex XSIAM does not have a verdict for the file, it queries WildFire and optionally submits the file for analysis. While the Cortex XDR agent attempts to wait for an official WildFire verdict, it can use File analysis and protection flow to evaluate the file. After Cortex XSIAM receives the verdict, it responds to the Cortex XDR agent that requested the verdict.
For information on file-examination settings, see Set up malware prevention profiles.
Guidelines for keeping Cortex XDR agents and content updated
Cortex XSIAM helps you manage Cortex XDR agent upgrades and security content updates across endpoints. Use a phased rollout to reduce production risk while delivering current endpoint protection capabilities.
Why keep agents and content updated
Keeping Cortex XDR agents up-to-date is essential for protecting against evolving threats and vulnerabilities. Regular updates ensure the latest security features for malware and exploit prevention, and compatibility with the latest software environments, which helps reduce the risk of attacks. This can also help organizations meet regulatory standards while maintaining strong overall protection.
Content updates, such as new threat intelligence or detection logic, are critical for defending against newly discovered cyber threats and malware and are designed to ensure that systems remain protected against the latest attacks. Content updates, released on a weekly basis, address compatibility issues as well, helping to achieve smooth operations alongside the Cortex XDR agent. Without regular content updates, security solutions may fail to detect new or evolving threats, leaving systems vulnerable to attacks.
The Cortex XDR agent can retrieve content updates immediately as they become available, or after a pre-configured delay period of up to 30 days. In addition, to expedite testing and evaluation, the staging content provides a preview of the content update a week before it is published to GA.
Important
When planning Cortex XDR agent upgrades and content updates, consult with the appropriate stakeholders and teams and follow the change management strategy in your organization.
Cortex XSIAM can be configured to manage the deployment of agent and content updates by adjusting the following settings:
Agent settings per endpoint:
- Agent Auto-Upgrade is disabled by default. Before enabling agent auto-upgrade for Cortex XDR agents, make sure to consult with all relevant stakeholders in your organization. Enabling this option allows you to define the scope of the automatic updates, such as upgrading to the latest agent release, one release prior, only maintenance releases, or maintenance releases within a specific version.
- Upgrade Rollout includes two options: Immediate, where the Cortex XDR agent automatically receives new releases, including maintenance updates and features, and Delayed, which lets you set a delay of 7 to 45 days after a version is released before upgrading endpoints.
- Agent Upgrade Scheduler allows the upgrade task to be scheduled for specific days of the week and a specific time range.
Global agent settings: Configure the number of parallel upgrades to apply to all endpoints in your organization.
Content updates per endpoint:
- Content Auto-Update is enabled by default and automatically retrieves the latest content before deploying it on the endpoint. If you disable content updates, the agent will stop fetching updates from the Cortex XSIAM tenant and will continue to operate with the existing content on the endpoint.
- Content Rollout: The Cortex XDR agent can retrieve content updates immediately as they become available, after a pre-configured delay period of up to 30 days. Utilize the staging content for early evaluation on test environments before the content is released to production.
Global content updates: Configure the content update cadence and bandwidth allocation within your organization. To enforce immediate protection against the latest threats, enable minor content updates. Otherwise, the content updates in your network occur only on major releases.
Plan Cortex XDR agent upgrades
Use a phased rollout plan by creating batches for deploying updates. The specifics may vary based on your organization and its structure. Start with a control group, then deploy to 10% of your organization. Subsequently, allocate the remaining upgrades in batches that best suit your organization until achieving a full 100% rollout.
The following is an example of a rollout plan for deploying a Cortex XDR agent upgrade:
Phase 1: Control group rollout: Start by selecting a control group of endpoints as early adopters. This group should consist of a diverse range of operating systems, devices, applications, and servers, with a focus on low-risk endpoints. After a defined testing period, such as one week, assess for any issues. If no problems are found, move to the next phase.
Phase 2: 10% rollout: Expand the rollout to 10% of the organization’s endpoints. This group should maintain the same variety as the control group but include low- to medium-risk endpoints. Monitor performance during the set period. If the rollout is successful with no issues, proceed to the next phase.
Phase 3: 40% rollout: After confirming the success of the 10% rollout, extend the deployment to 40% of the organization. Continue including a variety of endpoints while gradually incorporating some medium-risk endpoints. Ensure thorough testing during this phase before moving forward.
Phase 4: 80% rollout: Extend the deployment to 80% of the organization's endpoints. This batch should include a wide variety of endpoints, incorporating both medium and high-risk systems. After a careful monitoring period and confirmation that everything is stable, move to the final phase.
Phase 5: Full rollout: Complete the rollout by updating the remaining 20% of the organization’s endpoints. By this point, the majority of systems should have been thoroughly tested, reducing the risk of issues in the final stage. Once complete, 100% of the organization will be updated.
Plan content updates
Content updates consist of detection rules and operational logic, and are typically released on a weekly basis. Staging content provides a preview of the content update a week before the published GA.
Use a phased rollout plan by creating batches for deploying updates. Start with a control group, then deploy to 10% of your organization. Subsequently, allocate the remaining upgrades in batches that best suit your organization until achieving a full 100% rollout.
For early evaluation, select a small test group or a lab environment for enabling the staging content preview.
The following is an example of a rollout plan over a period of one week for deploying content updates:
Phase 1: Control group rollout: Keep the default configuration set to deploy content updates immediately.
Phase 2: 10% rollout: Content is automatically deployed on day 2 following a delay period defined in the profile.
Phase 3: 60% rollout: Content is automatically deployed on day 3 following a delay period defined in the profile.
Phase 4: Full rollout: Increase the deployment to include medium- and high-risk systems, until the entire organization is updated.
Configure agent and content updates
The following information will help you select and configure the update settings.
Cortex XDR agent upgrades
Configure one or more of the settings described in this section to keep your Cortex XDR agents up-to-date.
Distribute agent upgrades to selected endpoints
-
Create an agent installation package for each operating system version for which you want to upgrade the Cortex XDR agent.
Note the installation package names.
-
Select Inventory → Endpoints → All Endpoints.
If needed, filter the list of endpoints. To reduce the number of results, use the endpoint name search and filters at the top of the page.
-
Select the endpoints you want to upgrade.
You can also select endpoints running different operating systems to upgrade the agents at the same time.
-
Right-click your selection and select Endpoint Control → Upgrade Agent Version.
For each platform, select the name of the installation package you want to push to the selected endpoints.
You can install the Cortex XDR agent on Linux endpoints using a package manager. If you do not want to use the package manager, clear the option Upgrade to installation by package manager.
When you upgrade an agent on a Linux endpoint that is not using a package manager, Cortex XSIAM upgrades the installation process by default according to the endpoint Linux distribution.
Note
The Cortex XDR agent keeps the name of the original installation package after every upgrade.
-
Upgrade.
Cortex XSIAM distributes the installation package to the selected endpoints at the next heartbeat communication with the agent. To monitor the status of the upgrades, go to Investigation and Response → Response → Action Center.
From the Action Center you can also view additional information about the upgrade (right-click the action and select Additional data) or cancel the upgrade (right-click the action and select Cancel Agent Upgrade).
Note
- Custom dashboards that include upgrade status widgets, and the All Endpoints page display upgrade status.
- During the upgrade process, the endpoint operating system might request a reboot. However, you do not have to perform the reboot for the Cortex XDR agent upgrade process to complete it successfully.
- After you upgrade on an endpoint with Cortex XSIAM Device Control rules, you need to reboot the endpoint for the rules to take effect.
Agent settings per endpoint
Note
These profiles can be configured on one or more endpoints, static/dynamic groups, tags, IP ranges, endpoint names, or other parameters that allow the creation of logical endpoint groups. See how to define endpoint group.
- Go to Inventory → Endpoints → Policy Management → Profiles, and then edit an existing profile, add a new profile, or import from a file.
-
If you're adding a new profile, select the operating system and Agent Settings. Then click Next.
If you want to edit an existing profile, hover over Agent Settings for the operating system and click View Profile.
-
Select Agent Upgrade. By default, this option is disabled.
Caution
Before enabling Auto-Update for Cortex XDR agents, make sure to consult with all relevant stakeholders in your organization.
The following table describes the available Agent Auto-Upgrade options:
| Item | Options | Description |
|---|---|---|
| Automatic Upgrade Scope | <ul><li>Latest agent release (Default)</li><li>One release before the latest one</li><li>Only maintenance releases</li><li>Only maintenance releases in a specific version</li></ul> | <p>For One release before the latest one, Cortex XSIAM upgrades the agent to the previous release before the latest, including maintenance releases. Major releases are numbered X.X, such as release 8.0, or 8.2. Maintenance releases are numbered X.X.X, such as release 8.2.2.</p><p>For Only maintenance releases in a specific version, select the required release version.</p> |
| Upgrade Rollout | <ul><li>Immediate (Default)</li><li>Delayed</li></ul> | <p>The Cortex XDR agent automatically fetches any new agent release, maintenance and new features.</p><p>For Delayed, set the delay period (number of days) to wait after the version release before upgrading endpoints. Choose a value between 7 and 45.</p> |
| Scheduling | <ul><li>Hours</li><li>Days of the week</li></ul> | Schedule the upgrade task for specific time and days of the week. |
Global agent settings
Configure the Cortex XDR agent upgrade scheduler and the number of parallel upgrades to apply to all endpoints in your organization.
- Go to Settings → Configurations → Agent Configurations, and scroll to Agent upgrade.
-
Configure the Cortex XDR agent upgrade scheduler and the number of parallel upgrades.
Item Description Amount of parallel upgrades <p>During the first week of a new Cortex XDR agent release rollout, only a single batch of agents is upgraded. After that, auto-upgrades continue to be deployed across your network with the number of parallel upgrades as configured.</p><p>Set the number of parallel agent upgrades, where the maximum is 500 agents.</p>
Content updates
When a new content update is available, Cortex XSIAM notifies the Cortex XDR agent. The Cortex XDR agent then randomly chooses a time within a six-hour window during which it will retrieve the content update from Cortex XSIAM. By staggering the distribution of content updates, Cortex XSIAM reduces the bandwidth load and prevents bandwidth saturation due to the high volume and size of the content updates across many endpoints. You can view the distribution of endpoints by content update version from the dashboard.
You can configure whether to update content per endpoint or use the global settings.
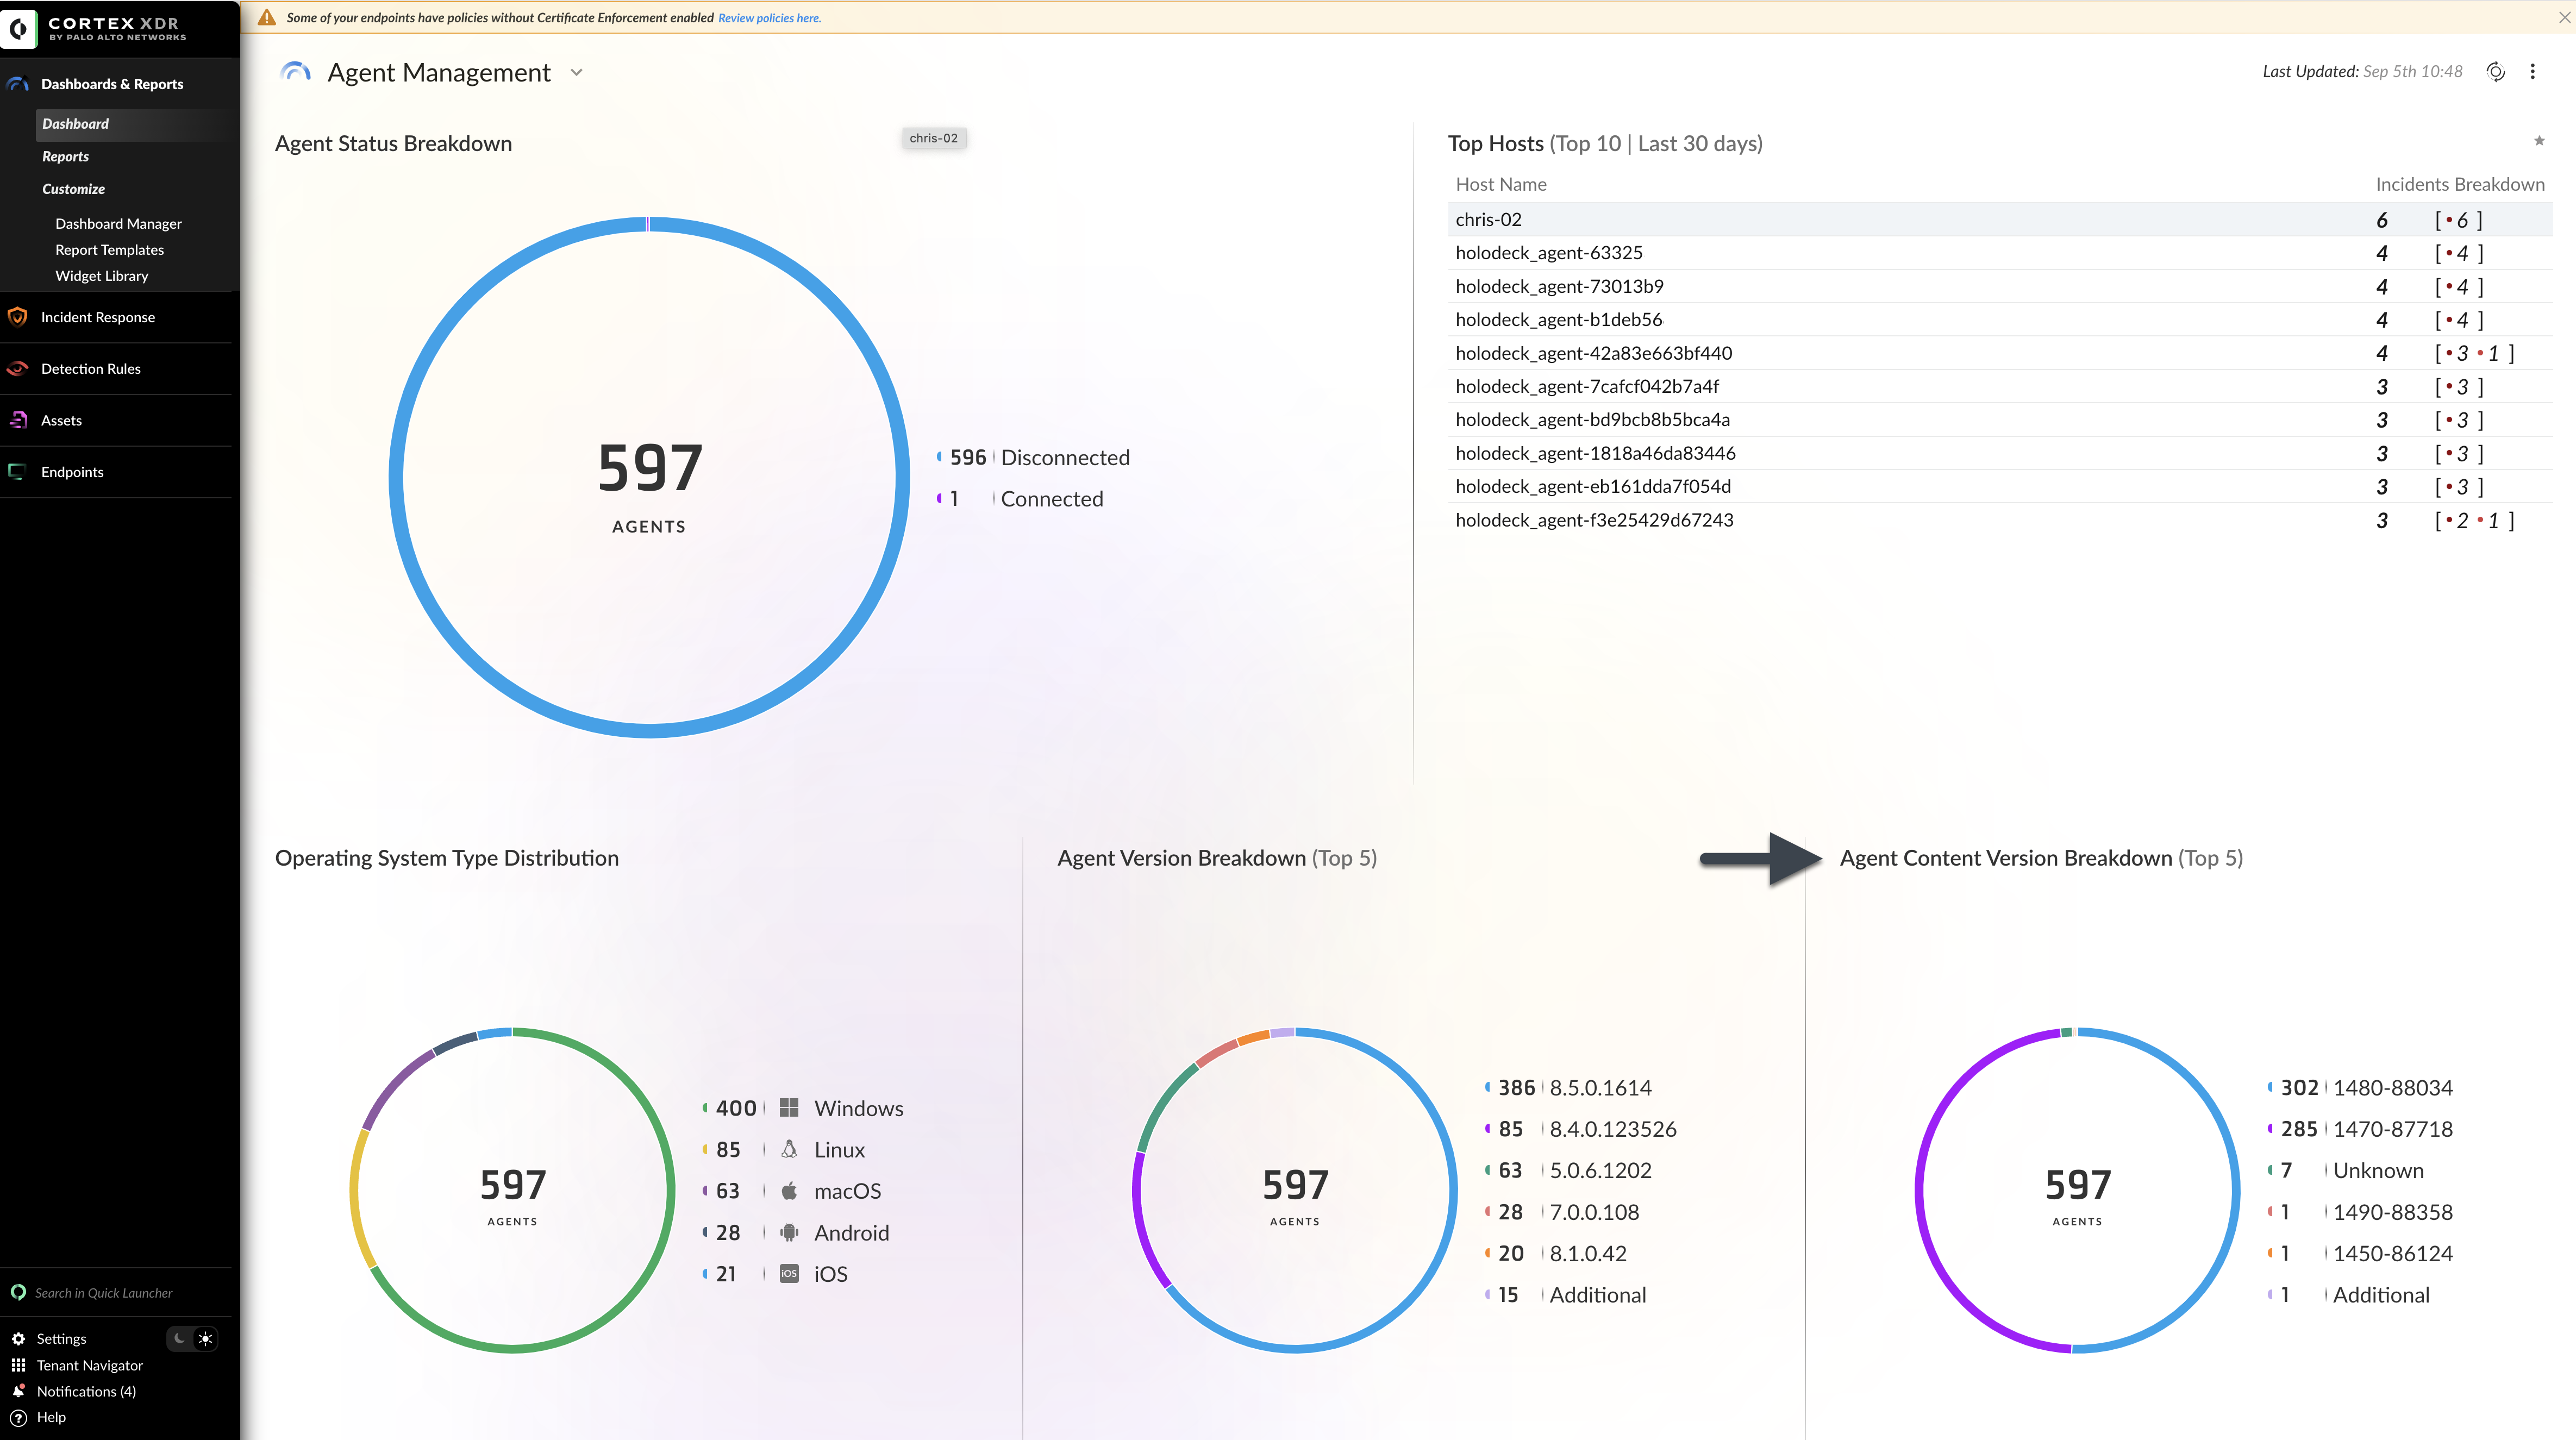
Content update settings per endpoint
Configure content update options for agents within the organization to ensure it is always protected with the latest security measures.
Note
These profiles can be configured on one or more endpoints, static/dynamic groups, tags, IP ranges, endpoint names, or other parameters that allow the creation of logical endpoint groups.
The following table describes the available Content Configuration options:
- Go to Inventory → Endpoints → Policy Management → Profiles, and then edit an existing profile, add a new profile, or import from a file.
-
If you're adding a new profile, select the operating system and Agent Settings. Then click Next.
If you want to edit an existing profile, hover over Agent Settings for the operating system and click View Profile.
- Select Content Configuration. By default, this option is Enabled.
| Item | Options | More details |
|---|---|---|
| Content Auto-Update | <ul><li>Enabled (Default)</li><li>Disabled</li></ul> | <p>When Content Auto-Update is enabled, the Cortex XDR agent retrieves the most updated content and deploys it on the endpoint.</p><p>If you disable content updates, the agent stops retrieving them from the Cortex XSIAM tenant, and keeps working with the current content on the endpoint.</p> |
| Staging Content | <ul><li>Enabled</li><li>Disabled (Default)</li></ul> | Enable users to deploy agent staging content on selected test environments. Staging content is released before production content, allowing for early evaluation of the latest content update. |
| Content Rollout | <ul><li>Immediate (Default)</li><li>Delayed</li><li>Specific</li></ul> | <p>The Cortex XDR agent can retrieve content updates immediately as they are available, after a pre-configured delay period of up to 30 days, or you can select a specific version.</p><p>When you delay content updates, the Cortex XDR agent will retrieve the content according to the configured delay. For example, if you configure a delay period of two days, the agent will not use any content released in the last 48 hours.</p> |
Global content update settings
- Go to Settings → Configurations → Agent Configurations, and scroll to Content Management.
-
Configure the content update cadence and bandwidth allocation within your organization.
Item Description Enable bandwidth control Based on the number of agents you want to update with content and upgrade packages, active or future agents, the Cortex XSIAM calculator configures the recommended amount of Mbps (Megabits per second) required for a connected agent to retrieve a content update over a 24 hour period or a week. Cortex XSIAM supports between 20 - 10000 Mbps, you can enter one of the recommended values or enter one of your own. For optimized performance and reduced bandwidth consumption, it is recommended that you install and update new agents with Cortex XDR agents 7.3 and later include the content package built in using SCCM. XDR Calculator for Recommended Bandwidth <p>Based on the number of agents you want to update with content and upgrade packages, active or future agents, the Cortex XSIAM calculator configures the recommended amount of Mbps (Megabits per second) required for a connected agent to retrieve a content update over 24 hours or a week. This calculation is based on connected agents and includes an overhead for large content update.</p><p>Cortex XSIAM supports between 20 - 10000 Mbps.</p><p>It is recommended to allocate a minimum of 20 Mbps, or you can enter a value.</p> Enable minor content version updates To enforce immediate protection against the latest threats, enable minor content updates. Otherwise, the content updates in your network occur only on major releases.
About content updates
To increase security coverage and quickly resolve any issues in policy, Palo Alto Networks can seamlessly deliver software packages for Cortex XSIAM called content updates. Content updates can contain changes or updates to any of the following:
Cortex XSIAM delivers the content update to the agent in parts and not as a single file, allowing the agent to retrieve only the updates and additions it needs.
- Default security policy including exploit, malware, restriction, and agent settings profiles
- Default compatibility rules per module
- Protected processes
- Local analysis logic
- Trusted signers
- Processes included in your block list by signers
- Behavioral threat protection rules
- Ransomware module logic including Windows network folders susceptible to ransomware attacks
- Event Log for Windows event logs and Linux system authentication logs
- Python scripts provided by Palo Alto Networks
- Python modules supported in script execution
- Maximum file size for hash calculations in File search and destroy
- List of common file types included in File search and destroy
- Network Packet Inspection Engine rules
When a new update is available, Cortex XSIAM notifies the Cortex XDR agent. The Cortex XDR agent then randomly chooses a time within a six-hour window during which it will retrieve the content update from Cortex XSIAM. By staggering the distribution of content updates, Cortex XSIAM reduces the bandwidth load and prevents bandwidth saturation due to the high volume and size of the content updates across many endpoints. You can view the distribution of endpoints by content update version from the dashboard.
The Cortex XSIAM research team releases more frequent content updates in-between major content versions to ensure your network is constantly protected against the latest and newest threats in the wild. When you enable minor content updates, the Cortex XSIAM agent receives minor content updates, starting with the next content release. Otherwise, if you do not wish to deploy minor content updates, your Cortex XDR agents will keep receiving content updates for major releases which usually occur on a weekly basis. The content version numbering format remains XXX-YYYY, where XXX indicates the version and YYYY indicates the build number. To distinguish between major and minor releases, XXX is rounded up to the nearest ten for every major release, and incremented by one for a minor release. For example, 1280-<build_num> and 1290-<build_num> are major releases, and 1281-<build_num> , 1282-<build_num>, and 1291-<build_num> are minor releases.
To adjust content update distribution for your environment, you can configure the following optional settings:
- Content management settings as part of the Cortex XSIAM global agent configurations.
- Content download source, as part of the Cortex XSIAM agent setting profile.
Otherwise, if you want the Cortex XDR agent to retrieve the latest content from the server immediately, you can force the Cortex XDR agent to connect to the server using one of the following methods.
- (Windows and Mac only) Perform manual check-in from the Cortex XDR agent console.
- Initiate a check-in using the
Cytool checkincommand.
Endpoint data collection
When the Cortex XDR agent generates an issue on endpoint activity, a minimum set of metadata about the endpoint is sent to the server.
When you enable behavioral threat protection or EDR data collection in your endpoint security policy, the Cortex XDR agent can also continuously monitor endpoint activity for malicious event chains identified by Palo Alto Networks. The endpoint data that the Cortex XDR agent collects when you enable these capabilities varies by platform type.
Metadata collected for Cortex XDR agent issues
When the Cortex XDR agent generates an issue on endpoint activity, the following metadata is sent to the server:
| Field | Description |
|---|---|
| Absolute timestamp | Kernel system time |
| Relative timestamp | Uptime since the computer started |
| Thread ID | ID of the originating thread |
| Process ID | ID of the originating process |
| Process creation time | Part of the process unique ID per boot session (PID + creation time) |
| Sequence ID | Unique integer per boot session |
| Primary user SID | Unique identifier of the user |
| Impersonating user SID | Unique identifier of the impersonating user, if applicable |
EDR data collected for Windows endpoints
| Category | Events | Attributes |
|---|---|---|
| Mount a device (volume and hardware) | <ul><li>Mount</li><li>Unmount</li></ul> | <ul><li>Storage device name</li><li>Storage device class GUID</li><li>Storage device class name</li><li>Storage device bus type</li><li>Storage device volume GUID</li><li>Storage device mount point</li><li>Storage device drive type</li><li>Storage device vendor ID</li><li>Storage device product ID</li><li>Storage device serial number</li><li>Storage device virtual volume image</li></ul> |
| Executable metadata | Process start | <ul><li>File size</li><li>File access time</li></ul> |
| Files | <ul><li>Create</li><li>Write</li><li>Delete</li><li>Rename</li><li>Move</li><li>Modification</li><li>Symbolic links</li><li>Read</li></ul> | <ul><li>Full path of the modified file before and after modification</li><li>SHA256 and MD5 hash for the file after modification</li><li>SetInformationFile for timestamps</li><li>File set security (DACL) information</li><li>Resolve hostnames on local network</li><li>Symbolic-link/hard-link and reparse point creation</li><li>File device type (regular file or Named Pipe)</li></ul> |
| Image (DLL) | Load | <ul><li>Full path</li><li>Base address</li><li>Target process-id/thread-id</li><li>Image size</li><li>Signature</li><li>SHA256 and MD5 hash for the DLL</li><li>File size</li><li>File access time</li></ul> |
| Process | <ul><li>Create</li><li>Terminate</li></ul> | <ul><li>Process ID (PID) of the parent process</li><li>PID of the process</li><li>Full path</li><li>Command line arguments</li><li>Integrity level to determine if the process is running with elevated privileges</li><li>Hash (SHA256 and MD5)</li><li>Signature or signing certificate details</li></ul> |
| Thread | Injection | <ul><li>Thread ID of the parent thread</li><li>Thread ID of the new or terminating thread</li><li>Process that initiated the thread if from another process</li></ul> |
| Network | <ul><li>Accept</li><li>Connect</li><li>Create</li><li>Listen</li><li>Close</li><li>Bind</li></ul> | <ul><li>Source IP address and port</li><li>Destination IP address and port</li><li>Failed connection</li><li>Protocol (TCP/UDP)</li><li>Resolve hostnames on local network</li></ul> |
| Network protocols | <ul><li>DNS request and UDP response</li><li>HTTP connect</li><li>HTTP disconnect</li><li>HTTP proxy parsing</li></ul> | <ul><li>Origin country</li><li>Remote IP address and port</li><li>Local IP address and port</li><li>Destination IP address and port if proxy connection</li><li>Network connection ID</li><li>IPv6 connection status (true/false)</li><li>External hostname</li></ul> |
| Network statistics | <ul><li>On-close statistics</li><li>Periodic statistics</li></ul> | <ul><li>Upload volume on TCP link</li><li>Download volume on TCP link</li></ul><p>Traps sends statistics both when a connection is closed, and at periodic intervals while the connection remains open.</p> |
| Registry | <ul><li><p>Registry value:</p><ul><li>Deletion</li><li>Set</li></ul></li><li><p>Registry key:</p><ul><li>Creation</li><li>Deletion</li><li>Rename</li><li>Addition</li><li>Modification (set information)</li><li>Restore</li><li>Save</li></ul></li></ul><div data-gb-custom-block data-tag="hint" data-style="info" class="hint hint-info"><p>Important</p><p>Registry key is collected as a real key name, and not as a symbolic link.</p><p>Example. **null Example. **null </p></div> |
<ul><li>Registry path of the modified value or key</li><li>Name of the modified value or key</li><li>Data of the modified value</li></ul> |
| Session | <ul><li>Log on</li><li>Log off</li><li>Connect</li><li>Disconnect</li></ul> | <ul><li>Interactive log-on (log-on at a computer console using credentials such as a username and password)</li><li>Session ID</li><li>Session State (equivalent to the event type)</li><li>Local (physically on the computer) or remote (connected using a terminal services session)</li></ul> |
| Host status | <ul><li>Boot</li><li>Suspend</li><li>Resume</li></ul> | <ul><li>Host name</li><li>OS Version</li><li>Domain</li><li>Previous and current state</li></ul> |
| Agent status | Agent start | |
| User presence | User Detection | Detection when a user is present or idle per active user session on the computer. |
| RPC calls | <ul><li>RpcCall</li><li>RpcPreCall</li></ul> | <ul><li>action_rpc_interface_uuid</li><li>action_rpc_interface_version_major</li><li>action_rpc_interface_version_minor</li><li>action_rpc_func_opnum</li><li>action_rpc_func_str_call_fields (optional)</li><li>action_rpc_func_int_call_fields (optional)</li><li>action_rpc_interface_name</li><li>action_rpc_func_name</li></ul> |
| System calls | Syscall types change frequently, and can be observed in each event's data. | <ul><li>action_syscall_string_params</li><li>action_syscall_int_params</li><li>action_syscall_target_instance_id</li><li>action_syscall_target_image_path</li><li>action_syscall_target_image_name</li><li>action_syscall_target_os_pid</li><li>action_syscall_target_thread_id</li><li>address_mapping</li></ul> |
| Event log | See the table below for the list of Windows Event Logs that can be sent to the server. | |
| .Net events | <ul><li>.NET DLL Loaded</li><li>.NET DLL Loaded From Buffer</li><li>Amsi Bypass Attempt</li><li>Suspicious .NET To Win32 Calls</li><li>.NET To Native Shellcode Execution Attempt</li><li>Malicious C# Compilation and Execution Attempt</li><li>Powershell Script Execution</li><li>Obfuscated Powershell Execution Attempt</li><li>Deserialization Exploit Attempt</li><li>Webshell Execution Attempt</li><li>Suspicious ASPX execution</li><li>Exchange Vulnerability Attempt</li><li>SharePoint JWT Vulnerability Attempt</li></ul> | <ul><li>DotNetCommon_DotnetCallstack</li><li>DotNetCommon_CLRVersion</li><li>DotNetCommon_ContentVersion</li><li>DotNetCommon_EdrAssemblyVersion</li><li>DotNetCommon_AppDomainId</li><li>Other attributes may be added, depending on the event type and context.</li></ul> |
Windows event logs collected for Windows endpoints
Cortex XDR agents can send the following Windows Event Logs to the tenant.
Cortex XSIAM saves the Windows event logs both in xdr_data and in the microsoft_windows_raw datasets.
For more information on how to set up Windows event logs collection, see Microsoft Windows security auditing setup.
| Path | Provider | Event IDs and Description |
|---|---|---|
| Application | EMET | |
| Application | Windows Error Reporting | Only for Windows Error Reporting (WER) events when an application stops unexpectedly |
| Application | Microsoft-Windows-User Profiles Service | <ul><li>1511: A user logged on with a temporary profile because Windows could not find the user's local profile.</li><li>1518: A profile could not be created using a temporary profile</li></ul> |
| Application | Application Error | 1000: Application unexpected stop/hang events, similar to WER/1001. These events include the full path to the EXE file, or to the module with the fault. |
| Application | Application Hang | 1002: Application unexpected stop/hang events, similar to WER/1001. These events include the full path to the EXE file, or to the module with the fault. |
| Microsoft-Windows-LDAP-client | 30: Windows Event Collector (WEC) recommended event | |
| Microsoft-Windows-CAPI2/Operational | <p>Windows CAPI2 logging events:</p><ul><li>11: Build Chain</li><li>70: A Private Key was accessed</li><li>90: X509 object</li></ul> | |
| Microsoft-Windows-DNS-Client/Operational | 3008: A DNS query was completed without local machine name resolution events, and without empty name resolution events. | |
| Microsoft-Windows-DriverFrameworks-UserMode/Operational | 2004: Detection of User-Mode drivers loading, for potential BadUSB detection | |
| Microsoft-Windows-PowerShell/Operational | <ul><li>4103: Block an activity</li><li>4104: Remote command</li><li>4105: Start command</li><li>4106: Stop command</li></ul> | |
| Microsoft-Windows-PrintService | Microsoft-Windows-PrintService | |
| Microsoft-Windows-TaskScheduler/Operational | Microsoft-Windows-TaskScheduler | 106, 129, 141, 142, 200, 201 |
| Microsoft-Windows-TerminalServices-RDPClient/Operational | 1024: A terminal service (TS) attempted to connect to a remote server | |
| Microsoft-Windows-Windows Defender/Operational | <ul><li>1006: Microsoft Defender Antivirus detected suspicious behavior</li><li>1009: Microsoft Defender Antivirus restored an item from quarantine</li></ul> | |
| Microsoft-Antimalware-Scan-Interface | 1101: Anti-Malware Scan Interface (AMSI) content scan event | |
| Microsoft-Windows-Windows Defender/Operational | <ul><li>1116: Microsoft Defender Antivirus detected malware or other potentially unwanted software</li><li>1117: Microsoft Defender has taken a protective action. Usually seen after code 1116</li><li>1119: Microsoft Defender Antivirus encountered a critical error when taking action on malware or other potentially unwanted software</li></ul> | |
| Microsoft-Windows-Windows Firewall With Advanced Security/Firewall | Microsoft-Windows-Windows Firewall With Advanced Security | 2004, 2005, 2006, 2009, 2033: Windows Firewall With Advanced Security Local Modifications (Levels 0, 2, 4) |
| Security | 1102: The Security log cleared events | |
| Security | Microsoft-Windows-Eventlog | Event log service events specific to the Security channel |
| Security | <ul><li>4880: Certificate Authority Service stopped</li><li>4881: Certificate Authority Service started</li><li>4896: Certificate Authority database rows were deleted</li><li>4898: A Certificate Authority template was loaded</li></ul> | |
| Security | <p>Routing and Remote Access Service (RRAS) events (these are only generated on Microsoft IAS server)</p><ul><li>6272: User access was granted.</li><li>6280: User account unlocked</li></ul> | |
| Security | Microsoft-Windows-Security-Auditing | <ul><li>4624: Successful logon</li><li>4625: Failed logon</li><li>4634: Logoff</li><li>4647: User initiated logoff</li><li>4648: Logon attempted, explicit credentials</li><li>4649: Replay attack</li><li>4672: Special privileges attempted login</li><li>4768: Kerberos TGT request</li><li>4769: Kerberos service ticket requested</li><li>4770: Kerberos service ticket renewal</li><li>4771: Kerberos pre-authentication failed</li><li>4776: Domain controller validation attempt</li><li>4778: Session was reconnected to a Windows station</li><li>4800: Workstation locked</li><li>4801: Workstation unlocked</li><li>4802: Screensaver was invoked</li><li>4803: Screensaver was dismissed</li></ul> |
| Security | Microsoft-Windows-Security-Auditing | <ul><li>4720: A user account was created</li><li>4722: A user account was enabled</li><li>4723: An attempt was made to change an account's password</li><li>4724: An attempt was made to reset an account’s password</li><li>4725: A user account was disabled</li><li>4726: A user account was deleted</li><li>4727, 4731, 4754: Creation of Groups</li><li>4728, 4732, 4756: Group member additions</li><li>4729, 4733, 4757: Group member removals</li><li>4735, 4737, 4755, 4764: Group changes</li><li>4738: A user account was changed</li><li>4740: A user account was locked out</li><li>4741: A computer account was created</li><li>4742: A computer account was changed</li><li>4743: A computer account was deleted</li><li>4765, 4766: SID history</li><li>4767: A user account was unlocked</li><li>4780: ACL set on accounts</li><li>4781: The name of an account was changed</li><li>4799: Group membership enumeration</li></ul> |
| Security | Microsoft-Windows-Security-Auditing | <ul><li>4616: System time was changed</li><li>4821: Kerberos service ticket was denied</li><li>4822, 4823: New Technology LAN Manager (NTLM) authentication failed</li><li>4824: Kerberos pre-authentication failed</li><li>4825: A user was denied access to Remote Desktop</li><li>5058: Key file operation</li><li>5059: Key migration operation</li></ul> |
| Security | Microsoft-Windows-Security-Auditing | <ul><li>4698: A scheduled task was created</li><li>4702: A scheduled task was updated</li><li>4886: Certificate Services received a certificate request</li><li>4887: Certificate Services approved a certificate request</li><li>4899: A Certificate Services template was updated</li><li>4900: Certificate Services template security was updated</li><li>5140: A network share object was accessed</li></ul> |
| Security | Microsoft-Windows-Security-Auditing | 4713: Kerberos policy was changed on a domain controller |
| Security | Microsoft-Windows-Security-Auditing | 4662: An operation was performed on an Active Directory object |
EDR data collected for Mac endpoints
| Category | Events | Attributes |
|---|---|---|
| Files | <ul><li>Create</li><li>Write</li><li>Delete</li><li>Rename</li><li>Move</li><li>Open</li></ul> | <ul><li>Full path of the modified file before and after modification</li><li>SHA256 and MD5 hash for the file after modification</li></ul> |
| Process | <ul><li>Start</li><li>Stop</li></ul> | <ul><li>Process ID (PID) of the parent process</li><li>PID of the process</li><li>Full path</li><li>Command line arguments</li><li>Integrity level to determine if the process is running with elevated privileges</li><li>Hash (SHA256 and MD5)</li><li>Signature or signing certificate details</li></ul> |
| Network | <ul><li>Accept</li><li>Connect</li><li>Connect Failure</li><li>Disconnect</li><li>Listen</li><li>Statistics</li></ul> | <ul><li>Source IP address and port</li><li>Destination IP address and port</li><li>Failed connection</li><li>Protocol (TCP/UDP)</li><li>Aggregated send/receive statistics for the connection</li></ul> |
| Event log | <ul><li>Authentication</li></ul> | <ul><li>Provider Name</li><li>Data fields</li><li>Message</li></ul> |
EDR data collected for Linux endpoints
| Category | Events | Attributes |
|---|---|---|
| Files | <ul><li>Create</li><li>Open</li><li>Write</li><li>Delete</li></ul> | <ul><li>Full path of the file</li><li>Hash of the file</li></ul><div data-gb-custom-block data-tag="hint" data-style="info" class="hint hint-info"><p>Note</p><p>For specific files only and only if the file was written.</p></div> |
| <ul><li>Copy</li><li>Move (rename)</li></ul> | <ul><li>Full paths of both the original and the modified files</li></ul> | |
| <ul><li>Change owner (chown)</li><li>Change mode (chmod)</li></ul> | <ul><li>Full path of the file</li><li>Newly set owner/attributes</li></ul> | |
| Network | <ul><li>Listen</li><li>Accept</li><li>Connect</li><li>Connect failure</li><li>Disconnect</li></ul> | <ul><li>Source IP address and port for explicit binds</li><li>Destination IP address and port</li><li>Failed TCP connections</li><li>Protocol (TCP/UDP)</li></ul> |
| Process | <ul><li>Start</li></ul> | <ul><li>PID of the child process</li><li>PID of the parent process</li><li>Full image path of the process</li><li>Command line of the process</li><li>Hash of the image (SHA256 & MD5)</li></ul> |
| <ul><li>Stop</li></ul> | <ul><li>PID of the stopped process</li></ul> | |
| Event log | <ul><li>Authentication</li></ul> | <ul><li>Provider Name</li><li>Data fields</li><li>Message</li></ul> |
IT performance metrics
| Field | Description |
|---|---|
| Time | <ul><li>Generated time</li><li>Timestamp</li></ul> |
| Agent information | <ul><li>Agent ID</li><li>Agent hostname</li><li>Agent OS type</li><li>Agent host boot time</li><li>Agent session start time</li><li>Agent request time</li></ul> |
| Event information | <ul><li>Event ID</li><li>Event type</li><li>Event subtype</li><li>Event version</li><li>Event timestamp</li></ul> |
| Actor information | Actor process instance ID |
| OS actor information | <ul><li>OS actor process instance ID</li><li>OS actor process OS PID</li><li>OS actor process OS name</li></ul> |
| Sample information | <ul><li>Sample start</li><li>Sample end</li></ul> |
| CPU usage information | <ul><li>CPU max</li><li>CPU average</li><li>CPU 90th percentile</li></ul> |
| Memory usage information | <ul><li>Memory max</li><li>Memory average</li><li>Memory 90th percentile</li></ul> |
| Vendor | Vendor name |
| Product | Product name |
| ZIP | ZIP ID |
| Server information | Server request time |
Install and manage endpoints
Endpoint protection starts with the Cortex XDR agent that is installed on each endpoint in your environment. The agent package that you install on endpoints contains many settings that are configured by default, out-of-the-box, to enable you to get protection up and running quickly. However, these settings can also be modified and used in different combinations, by using profiles, which are then mapped to policies, and by configuring global settings.
Several endpoint management tasks can be performed remotely by administrators, from Cortex XSIAM. These include tasks such as applying tags and aliases to endpoints, upgrading the Cortex XDR agent, uninstalling and deleting the Cortex XDR agent, and more.
To stay up to date with the latest policy and endpoint status, Cortex XSIAM communicates regularly with your Cortex XDR agents. For example, when you upgrade your endpoints to the latest release, Cortex XSIAM creates an installation package and distributes it to the agent on their next communication. Similarly, the agent can send back data from the endpoint to Cortex XSIAM, such as data gathered on the endpoint or tech support files. In Cortex XSIAM, there are two types of communication.
Set up endpoint protection
Set up endpoint protection profiles and policies, exceptions, endpoint hardening, and other endpoint settings.
Set up endpoint profiles and exception rules
Cortex XSIAM provides default security profiles that you can use out-of-the-box to immediately begin protecting your endpoints from threats. These profiles are applied to endpoints by mapping them to policies, and then mapping the policies to endpoints.
While security rules enable you to block or allow files to run on your endpoints, security profiles help you customize and reuse settings across different groups of endpoints. When the Cortex XDR agent detects behavior that matches a rule defined in your security policy, the Cortex XDR agent applies the security profile that is attached to the rule for further inspection.
Profiles associated with one or more targets that are beyond the scope of your defined user permissions are locked and cannot be edited.
Set up malware prevention profiles
Malware prevention profiles protect against the execution of malware including trojans, viruses, worms, and grayware. Malware prevention profiles serve two main purposes: to define how to treat behavior common with malware, such as ransomware or script-based attacks, and to define how to treat known malware and unknown files.
You can configure the action that Cortex XDR agents take when known malware, macros, and unknown files try to run on endpoints. By default, the Cortex XDR agent will receive the default profile that contains a pre-defined configuration for each malware protection capability supported by the platform. The default setting for each capability is shown in parentheses in the user interface. To fine-tune your malware prevention policy, you can override the configuration of each capability to block the malicious behavior or file, allow but report it, or disable the module.
For each setting that you override, clear the Use Default option, and select the setting of your choice.
In this profile, the Report options configure the endpoints to report the corresponding suspicious files, actions, processes, or behaviors to Cortex XSIAM, without blocking them. The Disabled options configure the endpoints to neither analyze nor report the corresponding malware or behavior.
The tasks below are organized according to the operating systems used by your organization's endpoints.
Windows
- Add a new profile and define basic settings.
-
From Cortex XSIAM, select Inventory → Endpoints → Policy Management → Prevention → Profiles. Click +Add Profile, and select whether to create a new profile, or to import a profile from a file.
Note
New profiles based on imported profiles are added, and do not replace existing ones.
- Select the Windows platform, and Malware as the profile type.
- Click Next.
- For Profile Name, enter a unique name for the profile. The name can contain only letters, numbers, or spaces, and must be no more than 30 characters. The name will be visible from the list of profiles when you configure a policy rule.
- For Description, to provide additional context for the purpose or business reason for creating the profile, enter a profile description. For example, you might include a case identification number or a link to a help desk ticket.
-
-
Configure Portable Executable and DLL Examination. The Cortex XDR agent can analyze and prevent malicious executable files and DLL files from running on Windows endpoints.
Note
As part of the anti-malware security flow, the Cortex XDR agent leverages the operating system's capability to identify revoked certificates for executables, and DLL files that attempt to run on the endpoint by accessing the Windows Certificate Revocation List (CRL). To allow the Cortex XDR agent access the CRL, you must enable internet access over port 80 for Windows endpoints. If the endpoint is not connected to the internet, or you experience delays with executables and DLLs running on the endpoint, contact Customer Support.
Item Options More details Action Mode <ul><li>Block</li><li>Report</li><li>Disabled</li></ul> When the Cortex XDR agent detects attempts to run malware, it performs the configured action. Quarantine Malicious Executables <ul><li>Disabled</li><li>Quarantine WildFire malware verdict</li><li>Quarantine WildFire and Local Analysis malware verdict</li></ul> <p>By default, the Cortex XDR agent blocks malware from running, but does not quarantine the file. You can enable one of the options to quarantine files, depending on the verdict issuer.</p><div data-gb-custom-block data-tag="hint" data-style="info" class="hint hint-info"><p>Note</p><p>The Quarantine Malicious Executables feature is not available for malware identified on network drives.</p></div> Action when file is unknown to WildFire <ul><li>Allow</li><li>Run Local Analysis</li><li>Block</li></ul> <p>Allow: Unknown files are not blocked and local verdicts are not issued for them.</p><p>Run Local Analysis: The Cortex XDR agent uses embedded machine learning to determine the likelihood that an unknown file is malware, and issues a local verdict for the file.</p><p>Block: Block unknown files but do not run local analysis. In this case, unknown files remain blocked until the Cortex XDR agent receives an official WildFire verdict.</p> Action when file is benign with low confidence <ul><li>Allow</li><li>Run Local Analysis</li><li>Block</li></ul> <p>Select the action to take when a file with a Benign Low Confidence verdict from WildFire tries to run on the endpoint. When local analysis is enabled, the Cortex XDR agent uses embedded machine learning to determine the likelihood that an unknown file is malware, and issues a local verdict for the file. If you block this file but do not run a local analysis, the file remains blocked until the Cortex XDR agent receives a high-confidence WildFire verdict.</p><p>To enable this capability, ensure that WildFire analysis scoring is also enabled in Global Agent Settings.</p><div data-gb-custom-block data-tag="hint" data-style="warning" class="hint hint-warning"><p>Warning</p><p>For optimal user experience, we recommend that you set the action mode to either Allow or Run Local Analysis.</p></div> Upload unknown files to WildFire <ul><li>Enabled</li><li>Disabled</li></ul> <p>When enabled, the Cortex XDR agent sends unknown files to Cortex XSIAM, and Cortex XSIAM sends the files to WildFire for analysis.</p><p>The file types that the Cortex XDR agent analyzes depend on the platform type. WildFire accepts files up to 300 MB in size.</p> Treat Grayware as Malware <ul><li>Enabled</li><li>Disabled</li></ul> <p>When enabled, Cortex XSIAM treats all grayware with the same Action Mode as configured for malware.</p><p>When disabled, grayware is considered benign, and is not blocked.</p> -
Configure options for Office Files with Macros Examination. The Cortex XDR agent can analyze and prevent malicious macros embedded in Microsoft Office files (Word, Excel) from running on Windows endpoints.
Item Options More details Action Mode <ul><li>Block</li><li>Report</li><li>Disabled</li></ul> When the Cortex XDR agent detects attempts to run malware, it performs the configured action. Action when file is unknown to WildFire <ul><li>Allow</li><li>Run Local Analysis</li><li>Block</li></ul> <p>Select the action to take when a file is not recognized by WildFire. When local analysis is enabled, the Cortex XDR agent uses embedded machine learning to determine the likelihood that an unknown file is malware, and issues a local verdict for the file.</p><p>If you block unknown files, but do not run local analysis, unknown files remain blocked until the Cortex XDR agent receives an official WildFire verdict.</p> Action when WildFire verdict is Benign Low Confidence <ul><li>Allow</li><li>Run Local Analysis</li><li>Block</li></ul> <p>Select the action to take when a file with a Benign Low Confidence verdict from WildFire tries to run on the endpoint. When local analysis is enabled, the Cortex XDR agent uses embedded machine learning to determine the likelihood that an unknown file is malware, and issues a local verdict for the file.</p><p>If you block this file but do not run a local analysis, the file remains blocked until the Cortex XDR agent receives a high-confidence WildFire verdict.</p><p>To enable this capability, ensure that WildFire analysis scoring is also enabled in Global Agent Settings.</p><div data-gb-custom-block data-tag="hint" data-style="warning" class="hint hint-warning"><p>Warning</p><p>For optimal user experience, we recommend that you set the action mode to either Allow or Run Local Analysis.</p></div> Upload unknown files to WildFire <ul><li>Enabled</li><li>Disabled</li></ul> <p>When enabled, the Cortex XDR agent sends unknown files to Cortex XSIAM, and Cortex XSIAM sends the files to WildFire for analysis. For macro analysis, the Cortex XDR agent sends the Microsoft Office file containing the macro.</p><p>The file types that the Cortex XDR agent analyzes depend on the platform type. WildFire accepts files up to 300 MB in size.</p> Examine Office files from network drives <ul><li>Enabled</li><li>Disabled</li></ul> You can enable the Cortex XDR agent to examine Microsoft Office files on network drives when they contain a macro that attempts to run. -
Configure JScript File Examination to protect endpoints from JScript-based attacks by detecting and preventing malicious JScript files from being executed or written to disk.
Item Options More details Action Mode <ul><li>Block</li><li>Report</li><li>Disabled</li></ul> When the Cortex XDR agent detects attempts to run malware, it performs the configured action. Quarantine Malicious Script Files <ul><li>Disabled</li><li>Quarantine WildFire malware verdict</li><li>Quarantine WildFire and Local Analysis malware verdict</li></ul> By default, the Cortex XDR agent blocks malware from running, but does not quarantine the file. You can enable one of the options to quarantine files, depending on the verdict issuer. Action when file is unknown to WildFire <ul><li>Allow</li><li>Run Local Analysis</li><li>Block</li></ul> <p>Allow: Unknown files are not blocked and local verdicts are not issued for them.</p><p>Run Local Analysis: The Cortex XDR agent uses embedded machine learning to determine the likelihood that an unknown file is malware, and issues a local verdict for the file.</p><p>Block: Block unknown files but do not run local analysis. In this case, unknown files remain blocked until the Cortex XDR agent receives an official WildFire verdict.</p> Upload unknown files to WildFire <ul><li>Enabled</li><li>Disabled</li></ul> <p>When enabled, the Cortex XDR agent sends unknown files to Cortex XSIAM, and Cortex XSIAM sends the files to WildFire for analysis.</p><p>The file types that the Cortex XDR agent analyzes depend on the platform type. WildFire accepts files up to 300 MB in size.</p> -
Configure PowerShell Script Files to analyze and prevent malicious PowerShell script files from running on Windows-based endpoints.
Item Options More details Action Mode <ul><li>Block</li><li>Report</li><li>Disabled</li></ul> When the Cortex XDR agent detects attempts to run malicious PowerShell script files, it performs the configured action. Quarantine Malicious Script Files <ul><li>Disabled</li><li>Quarantine WildFire malware verdict</li><li>Quarantine WildFire and Local Analysis malware verdict</li></ul> <p>By default, the Cortex XDR agent blocks malware from running, but does not quarantine the file. You can enable one of the options to quarantine files, depending on the verdict issuer.</p><div data-gb-custom-block data-tag="hint" data-style="info" class="hint hint-info"><p>Note</p><p>The Quarantine Malicious Script Files feature is not available for malware identified on network drives.</p></div> Action when file is unknown to WildFire <ul><li>Allow</li><li>Run Local Analysis</li><li>Block</li></ul> <p>Allow: Unknown files are not blocked and local verdicts are not issued for them.</p><p>Run Local Analysis: The Cortex XDR agent uses embedded machine learning to determine the likelihood that an unknown file is malware, and issues a local verdict for the file.</p><p>Block: Block unknown files but do not run local analysis. In this case, unknown files remain blocked until the Cortex XDR agent receives an official WildFire verdict.</p> Upload unknown files to WildFire <ul><li>Enabled</li><li>Disabled</li></ul> <p>When enabled, the Cortex XDR agent sends unknown files to Cortex XSIAM, and Cortex XSIAM sends the files to WildFire for analysis.</p><p>The file types that the Cortex XDR agent analyzes depend on the platform type. WildFire accepts files up to 300 MB in size.</p> - For On-Write File Examination settings, configure the actions that Cortex XSIAM should take during the on-write process for various file types.\
When a file type is enabled, the Cortex XDR agent monitors for malicious files during the on-write process, and if it finds any, it generates issues and quarantines the files.
Note
- If on-write actions were configured in earlier versions of Cortex XSIAM, the same configuration has been preserved and applied globally for all file types.
- On-write file protection may have an impact on the resources required by the Cortex XDR agent.
| Item | Options | More details |
|---|---|---|
| Portable Executable and DLL Examination | <ul><li>Enabled</li><li>Disabled</li></ul> | |
| Office files with macros | <ul><li>Enabled</li><li>Disabled</li></ul> | |
| PowerShell script files | <ul><li>Enabled</li><li>Disabled</li></ul> | |
| ASP & ASPX files | <ul><li>Enabled</li><li>Disabled</li></ul> | |
| VBScript files | <ul><li>Enabled</li><li>Disabled</li></ul> | |
| JScript files | <ul><li>Enabled</li><li>Disabled</li></ul> | |
| <p>Java files (JSP & JSPX files)</p><ul><li>Java Application Examination</li><li>Jakarta Server Pages</li></ul> | <ul><li>Enabled</li><li>Disabled</li></ul> |
-
Configure ASP & ASPX Files to analyze and prevent malicious ASP and ASPX files from being written to the file system. If you want to enable this capability, enable On-write File Examination.
Item Options More details Action Mode <ul><li>Block</li><li>Report</li><li>Disabled</li></ul> <p>When the Cortex XDR agent detects attempts to write malicious ASP and ASPX files, it performs the configured action.</p><p>When Action Mode is set to Block, quarantine is enabled.</p> Action when file is unknown to WildFire <ul><li>Allow</li><li>Run Local Analysis</li><li>Block</li></ul> <p>Allow: Unknown files are not blocked and local verdicts are not issued for them.</p><p>Run Local Analysis: The Cortex XDR agent uses embedded machine learning to determine the likelihood that an unknown file is malware, and issues a local verdict for the file.</p><p>Block: Block unknown files but do not run local analysis. In this case, unknown files remain blocked until the Cortex XDR agent receives an official WildFire verdict.</p> Upload unknown files to WildFire <ul><li>Enabled</li><li>Disabled</li></ul> <p>When enabled, the Cortex XDR agent sends unknown files to Cortex XSIAM, and Cortex XSIAM sends the files to WildFire for analysis.</p><p>The file types that the Cortex XDR agent analyzes depend on the platform type. WildFire accepts files up to 300 MB in size.</p> -
Configure On-demand File Examination to scan endpoints and attached removable drives for dormant, inactive malware.
Note
On-demand file protection may have an impact on the resources required by the Cortex XDR agent.
Item Options More details End-User Initiated Local Scan <ul><li>Enabled</li><li>Disabled</li></ul> When enabled, the endpoint user can perform a local scan on the endpoint. Periodic Scan <ul><li>Enabled</li><li>Disabled</li></ul> <div data-gb-custom-block data-tag="hint" data-style="info" class="hint hint-info"><p>Note</p><p>We recommend that you disable scheduled scanning. VDI machine scans are based on the golden image and additional files will be examined upon execution.</p></div><p>Periodic scanning enables you to scan endpoints on a recurring basis without waiting for malware to run on the endpoint. When enabled, you can set the time interval (weekly or monthly) and the day and time at which to start scanning. In addition, you can choose to enable or disable scanning of removable media drives.</p><p>Periodic scanning is persistent, and if the scan is scheduled to start while the endpoint is turned off, the scan will be initiated when the endpoint is turned on again. The scheduling of future scans is not affected by this delay.</p><div data-gb-custom-block data-tag="hint" data-style="info" class="hint hint-info"><p>Note</p><p>When periodic scanning is enabled in your profile, the Cortex XDR agent initiates an initial scan when it is first installed on the endpoint, regardless of the periodic scanning scheduling time.</p></div> -
Configure VB Scripts Examination to analyze and prevent malicious VB script files from running.
Item Options More details Action Mode <ul><li>Block</li><li>Report</li><li>Disabled</li></ul> When the Cortex XDR agent detects attempts to run malicious VB script files, it performs the configured action. Quarantine Malicious Files <ul><li>Disabled</li><li>Quarantine WildFire malware verdict</li><li>Quarantine WildFire and Local Analysis malware verdict</li></ul> <p>The Cortex XDR agent can quarantine VB script files that WildFire or local analysis determine are malware.</p><p>When disabled, the Cortex XDR agent does not quarantine malicious VB script files.</p> Action when file is unknown to WildFire <ul><li>Allow</li><li>Run Local Analysis</li><li>Block</li></ul> <p>Allow: Unknown files are not blocked and local verdicts are not issued for them.</p><p>Run Local Analysis: The Cortex XDR agent uses embedded machine learning to determine the likelihood that an unknown file is malware, and issues a local verdict for the file.</p> Upload unknown files to WildFire <ul><li>Enabled</li><li>Disabled</li></ul> <p>When enabled, the Cortex XDR agent sends unknown files to Cortex XSIAM, and Cortex XSIAM sends the files to WildFire for analysis.</p><p>The file types that the Cortex XDR agent analyzes depend on the platform type. WildFire accepts files up to 300 MB in size.</p> -
Configure LDAP Protection to analyze and act upon suspicious LDAP queries sent by the agent to a Domain Controller. This feature is designed to detect and block Active Directory reconnaissance attacks.
Notice
Requires the ITDR add-on.
Note
This feature only comes into effect after a restart.
Item Options More details Action Mode <ul><li>Block</li><li>Report</li><li>Disabled</li></ul> When the Cortex XDR agent detects suspicious attempts to query a Domain Controller, it performs the configured action. Monitor and Collect Domain Controller LDAP Events <ul><li>Enabled</li><li>Disabled</li></ul> When set to Enabled, the Cortex XDR agent collects information about LDAP queries and creates events for them. These events can be used investigate suspicious LDAP queries. -
Configure the Global Behavioral Threat Protection Rules. Use these rules to protect endpoints from malicious causality chains.
Item Options More details Action Mode <ul><li>Block</li><li>Report</li><li>Disabled</li></ul> The Cortex XDR agent protects against malicious causality chains, using behavioral threat protection rules. When the action mode is set to Block, the Cortex XDR agent terminates all processes and threads in the event chain up to the causality group owner (CGO). Quarantine Malicious Files <ul><li>Enabled</li><li>Disabled</li></ul> <p>When enabled, the Cortex XDR agent quarantines the processes and the artifacts, such as files, related to the CGO.</p><p>When disabled, the Cortex XDR agent does not quarantine the CGO of an event chain, nor any scripts or files called by the CGO.</p> Action Mode for Vulnerable Drivers Protection <ul><li>Block</li><li>Report</li><li>Disabled</li></ul> Behavioral threat protection rules can also detect attempts to load vulnerable drivers which can be used to bypass the Cortex XDR agent. As with other rules, Palo Alto Networks threat researchers can deliver changes to vulnerable driver rules with content updates. Advanced API Monitoring <ul><li>Enabled</li><li>Disabled</li></ul> When enabled, the Cortex XDR agent adds additional hooks in user mode processes for increased coverage of anti-exploit and anti-malware modules. -
Configure Credential Gathering Protection to protect endpoints from processes trying to access or steal passwords and other credentials.
Item Options More details Action Mode <ul><li>Block</li><li>Report</li><li>Disabled</li></ul> <p>The Cortex XDR agent protects against all processes and threads in the event chain up to the credential gathering process or file.</p><p>When this module is disabled, the Cortex XDR agent does not analyze the event chain and does not block credential gathering.</p> Quarantine Malicious Files <ul><li>Enabled</li><li>Disabled</li></ul> When enabled, the Cortex XDR agent quarantines the process or file related to the credential gathering event chain. -
Configure Anti Webshell Protection to protect endpoint processes from dropping malicious web shells.
Item Options More details Action Mode <ul><li>Block</li><li>Report</li><li>Disabled</li></ul> In a causality chain, when the Cortex XDR agent detects a process that attempts to drop malicious web shells, it performs the configured action. Quarantine Malicious Files <ul><li>Enabled</li><li>Disabled</li></ul> When enabled, the Cortex XDR agent quarantines the processes or files that are related to the web shell drop event chain, and any scripts or files called by the web shell dropping process. -
Configure Financial Malware Threat Protection to protect against techniques specific to financial and banking malware.
Item Options More details Action Mode <ul><li>Block</li><li>Report</li><li>Disabled</li></ul> In a causality chain, when the Cortex XDR agent detects a process that attempts to access or steal financial or banking information, the Cortex XDR agent performs the configured action. Quarantine Malicious Files <ul><li>Enabled</li><li>Disabled</li></ul> When enabled, the Cortex XDR agent quarantines the processes or files related to the financial information gathering event chain, and scripts or files called by the financial information gathering process. Crypto Wallet Protection <ul><li>Enabled</li><li>Disabled</li></ul> When enabled, provides protection for cryptocurrency wallets that are stored on endpoints. Cryptocurrency wallets store private keys that are used to access crypto assets. -
Configure Cryptominers Protection to protect against attempts to locate or steal cryptocurrencies.
Item Options More details Action Mode <ul><li>Block</li><li>Report</li><li>Disabled</li></ul> In a causality chain, when the Cortex XDR agent detects a cryptomining process or file, the Cortex XDR agent performs the configured action. Quarantine Malicious Files <ul><li>Enabled</li><li>Disabled</li></ul> When enabled, the Cortex XDR agent quarantines the process or file detected during a cryptocurrency gathering attempt. -
Configure In-process shellcode protection to protect against in-process shellcode attack threats.
Item Options More details Action Mode <ul><li>Block</li><li>Report</li><li>Disabled</li></ul> In a causality chain, when the Cortex XDR agent detects a process that attempts to run in-process shellcodes to load malicious code, the Cortex XDR agent performs the configured action. Quarantine Malicious Files <ul><li>Enabled</li><li>Disabled</li></ul> When enabled, the Cortex XDR agent quarantines the in-process shellcode processes or files related to a causality chain. Process Injection 32 Bit <ul><li>Enabled</li><li>Disabled</li></ul> <p>When enabled, the Cortex XDR agent quarantines 32 bit in-process shellcode processes or files related to a causality chain.</p><p>Process injection 32 bit is set to Enabled by default for all new tenants created after 25 June 2023. For tenants created before this date, the default was set to Disabled.</p> Shellcode AI Protection <ul><li>Enabled</li><li>Disabled</li></ul> When enabled, Precision AI-based detection rules use machine learning to detect and prevent in-memory shellcode attacks.When enabled, Precision AI-based detection rules use machine learning to detect and prevent in-memory shellcode attacks. -
Configure Malicious Device Prevention to protect against the connection of potentially malicious devices to endpoints.
Item Options More details Action Mode <ul><li>Block</li><li>Report</li><li>Disabled</li></ul> When the Cortex XDR agent detects the connection of potentially malicious external device to an endpoint, the Cortex XDR agent performs the configured action. -
Configure UAC Bypass Prevention to protect against the User Access Control (UAC) bypass mechanism that is associated with privilege elevation attempts.
Item Options More details Action Mode <ul><li>Block</li><li>Report</li><li>Disabled</li></ul> When the Cortex XDR agent detects a UAC bypass mechanism, the Cortex XDR agent performs the configured action. The Block option blocks all processes and threads in the event chain up to the UAC bypass mechanism. Quarantine Malicious Files <ul><li>Enabled</li><li>Disabled</li></ul> When enabled, the Cortex XDR agent quarantines the UAC bypass processes or files related to the chain, and any scripts or files released to the UAC bypass mechanism. -
Configure Anti Tampering Protection to protect against tampering attempts.
Item Options More details Action Mode <ul><li>Block</li><li>Report</li><li>Disabled</li></ul> <p>When the Cortex XDR agent detects a tampering attempt, including modification and/or termination of the Cortex XDR agent, it performs the configured action.</p><p>If you choose the Block option, you must also enable XDR Agent Tampering Protection in the Agent Settings profile, and ensure that both profiles are assigned to the same endpoints.</p> Quarantine Malicious Files <ul><li>Enabled</li><li>Disabled</li></ul> When enabled, the Cortex XDR agent quarantines the processes or files that are related to the tampering attempt. Malicious Safe Mode Rebooting Protection <ul><li>Block</li><li>Report</li><li>Disabled</li></ul> Define the action to take when the Cortex XDR agent detects safe mode reboot attempts made suspiciously by other apps. -
Configure IIS Protection to protect against Internet Information Server (IIS) attacks.
Item Options More details Action Mode <ul><li>Block</li><li>Report</li><li>Disabled</li></ul> When the Cortex XDR agent detects a threat that targets an Internet Information Server (IIS), the Cortex XDR agent performs the configured action. Quarantine Malicious Files <ul><li>Enabled</li><li>Disabled</li></ul> When enabled, the Cortex XDR agent quarantines the processes or files that are related to the IIS attack. -
Configure UEFI Protection, to protect the endpoint from Unified Extensible Firmware Interface (UEFI) manipulation attempts.
Item Options More details Action Mode <ul><li>Block</li><li>Report</li><li>Disabled</li></ul> When the Cortex XDR agent detects UEFI manipulation attempts, it performs the configured action. When Block is selected, the Cortex XDR agent blocks all processes and threads in the event chain, up to the UEFI threat. Quarantine Malicious Files <ul><li>Enabled</li><li>Disabled</li></ul> When enabled, the Cortex XDR agent quarantines the processes or files that are related to the UEFI threat. -
Configure Ransomware Protection to protect against encryption-based activity associated with ransomware attacks.
Item Options More details Action Mode <ul><li>Block</li><li>Report</li><li>Disabled</li></ul> When the Cortex XDR agent detects ransomware activity locally on the endpoint or in pre-defined network folders, the Cortex XDR agent performs the configured action. Quarantine Malicious Process <ul><li>Enabled</li><li>Disabled</li></ul> <p>When enabled, the Cortex XDR agent quarantines the processes that are related to the ransomware activity.</p><p>The Quarantine Malicious Process option is only available if Action Mode is set to Block.</p> Protection Mode <ul><li>Normal</li><li>Aggressive</li></ul> By default, Protection Mode is set to Normal, where the decoy files on the endpoint are present, but do not interfere with benign applications and end user activity on the endpoint. If you suspect your network has been infected with ransomware, and you need to provide better coverage, you can apply the Aggressive protection mode. Aggressive mode exposes more applications in your environment to the Cortex XDR agent decoy files. However, it also increases the likelihood that benign software is exposed to decoy files, generating false ransomware issues, and impairing user experience. -
Configure Malicious Child Process Protection to prevent script-based attacks. Such attacks can be used to deliver malware by blocking targeted processes that are commonly used to bypass traditional security methods.
Item Options More details Action Mode <ul><li>Block</li><li>Report</li><li>Disabled</li></ul> When the Cortex XDR agent detects known suspicious parent-child relationships that are used to bypass security, the Cortex XDR agent performs the configured action. When Block is selected, known suspicious child processes are blocked from starting. - To prevent attacks that extract passwords from memory using the Mimikatz tool, set Password Theft Protection to Enabled.
-
Configure Respond to Malicious Causality Chains options, which define the automatic response actions taken by the Cortex XDR agent when it identifies malicious causality chains.
Item Options More details Terminate Connection and Block IP Address of Remote Causality Group Owner <ul><li>Enabled</li><li>Disabled</li></ul> When the Cortex XDR agent identifies a remote network connection that attempts to perform malicious activity—such as encrypting endpoint files—the agent can automatically block the IP address to close all existing communication, and to block new connections from this IP address to the endpoint. When Cortex XSIAM blocks an IP address per endpoint, that address remains blocked throughout all agent profiles and policies, including any host-firewall policy rules. You can view the list of all blocked IP addresses per endpoint from the Action Center, as well as unblock them to re-enable communication as appropriate. -
Configure the Network Packet Inspection Engine to analyze network packet data for malicious behavior.
Item Options More details Action Mode <ul><li>Terminate session</li><li>Report</li><li>Disabled</li></ul> <p>By analyzing the network packet data, the Cortex XDR agent can already detect malicious behavior at the network level, and provide protection to the growing corporate network boundaries. The engine leverages both Palo Alto Networks NGFW content rules, and new Cortex XDR content rules created by the Cortex XDR Research Team. The Cortex XDR content rules are updated through the security content. This feature focuses on detecting outbound C2 activity.</p><p>The Terminate session option configures Cortex XDR agents to analyze connections and to drop the malicious connections.</p><p>The Report option configures XDR agents to analyze connections, to allow the transmission of packets in your network, but to report them to Cortex XSIAM.</p> -
Configure Dynamic Kernel Protection to protect the endpoint from kernel-level threats such as bootkits, rootkits, and susceptible drivers.
Item Options More details Action Mode <ul><li>Block</li><li>Report</li><li>Disabled</li></ul> When set to Block, this protection module loads during the boot process to protect the endpoint against malicious processes running at boot time. -
Configure Dynamic Driver Protection to protect the endpoint against the abuse of Kernel drivers.
Item Options More details Action Mode <ul><li>Block</li><li>Report</li><li>Disabled</li></ul> When set to Block, runtime prevention of driver-based attacks that attempt to escalate privileges or exploit the kernel. Quarantine Malicious Files <ul><li>Enabled</li><li>Disabled</li></ul> When enabled, the Cortex XDR agent quarantines the drivers that are a threat. -
Configure Security Measures Bypass to protect the endpoint from malicious actors attempting to bypass Windows built-in security controls.
Item Options More details Action Mode <ul><li>Block</li><li>Report</li><li>Disabled</li></ul> When set to Block, this protection module blocks techniques used by attackers to bypass endpoint security controls. Quarantine Malicious Files <ul><li>Enabled</li><li>Disabled</li></ul> When enabled, the Cortex XDR agent quarantines the processes that are related to bypass techniques. -
Configure Breach and Attack Simulation (BAS) Tools settings.
Item Options More details Action Mode <ul><li>Enabled</li><li>Disabled (default)</li></ul> <p>When BAS mode is enabled, BAS tools will receive special handling. Only the simulation itself is terminated.</p><p>When BAS mode is disabled, BAS tools are treated like any other malicious process. Based on the profile settings, BAS tools will face the same prevention measures as all other threats</p><div data-gb-custom-block data-tag="hint" data-style="info" class="hint hint-info"><p>Note</p><p>When you are actively evaluating with BAS tools, it is recommended to enable the BAS mode setting only for the duration of your evaluation, and for a limited number of agents.</p></div> Note
BAS tools mode with content older than version 1850 cannot be configured, the agent will be treated as Enabled.
- To save the profile, click Create.
What to do next
If you are ready to apply your new profile to endpoints, you do this by adding it to a policy rule. If you still need to define other profiles, you can do this later. During policy rule creation or editing, you select the endpoints to which to assign the policy. There are different ways of doing this, such as:
macOS
- Add a new profile and define basic settings.
-
From Cortex XSIAM, select Inventory → Endpoints → Policy Management → Prevention → Profiles. Click +Add Profile, and select whether to create a new profile, or to import a profile from a file.
Note
New profiles based on imported profiles are added, and do not replace existing ones.
- Select the macOS platform, and Malware as the profile type.
- Click Next.
- For Profile Name, enter a unique name for the profile. The name can contain only letters, numbers, or spaces, and must be no more than 30 characters. The name will be visible from the list of profiles when you configure a policy rule.
- For Description, to provide additional context for the purpose or business reason for creating the profile, enter a profile description. For example, you might include a case identification number or a link to a help desk ticket.
-
-
Configure Respond to Malicious Causality Chains. This is the agent's automatic response actions to malicious causality chains.
Item Options More details Terminate connection and block IP address of remote causality group owner <ul><li>Enabled</li><li>Disabled</li></ul> When enabled, the Cortex XDR agent terminates the connection and blocks the IP address of a remote causality group owner. -
Configure the Network Packet Inspection Engine to detect malicious behavior.
Item Options More details Action Mode <ul><li>Terminate Session</li><li>Report</li><li>Disabled</li></ul> When the Cortex XDR agent detects malicious behavior, it performs the configured action. -
Configure the Global Behavioral Threat Protection Rules. These rules can be used to protect endpoints from malicious causality chains.
Item Options More details Action Mode <ul><li>Block</li><li>Report</li><li>Disabled</li></ul> The Cortex XDR agent protects against malicious causality chains, using behavioral threat protection rules. When the action mode is set to Block, the Cortex XDR agent terminates all processes and threads in the event chain up to the causality group owner (CGO). Quarantine Malicious Files <ul><li>Enabled</li><li>Disabled</li></ul> <p>When enabled, the Cortex XDR agent quarantines the processes and the artifacts, such as files, related to the CGO.</p><p>When disabled, the Cortex XDR agent does not quarantine the CGO of an event chain, nor any scripts or files called by the CGO.</p> -
Configure Credential Gathering Protection to protect endpoints from processes trying to access or steal passwords and other credentials.
Item Options More details Action Mode <ul><li>Block</li><li>Report</li><li>Disabled</li></ul> <p>The Cortex XDR agent protects against all processes and threads in the event chain up to the credential gathering process or file.</p><p>When this module is disabled, the Cortex XDR agent does not analyze the event chain and does not block credential gathering.</p> Quarantine Malicious Files <ul><li>Enabled</li><li>Disabled</li></ul> When enabled, the Cortex XDR agent quarantines the process or file related to the credential gathering event chain. -
Configure Anti Webshell Protection to protect endpoint processes from dropping malicious web shells.
Item Options More details Action Mode <ul><li>Block</li><li>Report</li><li>Disabled</li></ul> In a causality chain, when the Cortex XDR agent detects a process that attempts to drop malicious web shells, it performs the configured action. Quarantine Malicious Files <ul><li>Enabled</li><li>Disabled</li></ul> When enabled, the Cortex XDR agent quarantines the processes or files that are related to the web shell drop event chain, and any scripts or files called by the web shell dropping process. -
Configure Financial Malware Threat Protection to protect against techniques specific to financial and banking malware.
Item Options More details Action Mode <ul><li>Block</li><li>Report</li><li>Disabled</li></ul> In a causality chain, when the Cortex XDR agent detects a process that attempts to access or steal financial or banking information, the Cortex XDR agent performs the configured action. Quarantine Malicious Files <ul><li>Enabled</li><li>Disabled</li></ul> When enabled, the Cortex XDR agent quarantines the processes or files related to the financial information gathering event chain, and scripts or files called by the financial information gathering process. Crypto Wallet Protection <ul><li>Enabled</li><li>Disabled</li></ul> When enabled, provides protection for cryptocurrency wallets that are stored on endpoints. Cryptocurrency wallets store private keys that are used to access crypto assets. -
Configure Cryptominers Protection to protect against attempts to locate or steal cryptocurrencies.
Item Options More details Action Mode <ul><li>Block</li><li>Report</li><li>Disabled</li></ul> In a causality chain, when the Cortex XDR agent detects a cryptomining process or file, the Cortex XDR agent performs the configured action. Quarantine Malicious Files <ul><li>Enabled</li><li>Disabled</li></ul> When enabled, the Cortex XDR agent quarantines the process or file detected during a cryptocurrency gathering attempt. -
Configure Malicious Device Protection to identify and block potentially malicious Human Interface Devices (HIDs), such as the USB Rubber Ducky. This capability allows organizations to significantly reduce their physical attack surface and defend against social engineering-based hardware threats.
Item Options More details Action Mode <ul><li>Block</li><li>Report</li><li>Disabled</li></ul> <p>When set to Block, the Cortex XDR agent blocks malicious HIDs.</p><p>When set to Report, an issue is generated, but no action is taken.</p> -
Configure Anti Tampering Protection to protect against tampering attempts.
Item Options More details Action Mode <ul><li>Block</li><li>Report</li><li>Disabled</li></ul> <p>When the Cortex XDR agent detects a tampering attempt, including modification and/or termination of the Cortex XDR agent, it performs the configured action.</p><p>If you choose the Block option, you must also enable XDR Agent Tampering Protection in the Agent Settings profile, and ensure that both profiles are assigned to the same endpoints.</p> Quarantine Malicious Files <ul><li>Enabled</li><li>Disabled</li></ul> When enabled, the Cortex XDR agent quarantines the processes or files that are related to the tampering attempt. -
Configure Ransomware Protection to protect against encryption-based activity associated with ransomware attacks.
Item Options More details Action Mode <ul><li>Block</li><li>Report</li><li>Disabled</li></ul> When the Cortex XDR agent detects ransomware activity locally on the endpoint or in pre-defined network folders, the Cortex XDR agent performs the configured action. Quarantine Malicious Files <ul><li>Enabled</li><li>Disabled</li></ul> When enabled, the Cortex XDR agent quarantines the files that are related to the ransomware activity. -
Configure Malicious Child Process Protection to prevent script-based attacks. Such attacks can be used to deliver malware by blocking targeted processes that are commonly used to bypass traditional security methods.
Item Options More details Action Mode <ul><li>Block</li><li>Report</li><li>Disabled</li></ul> When the Cortex XDR agent detects known suspicious parent-child relationships that are used to bypass security, the Cortex XDR agent performs the configured action. When Block is selected, known suspicious child processes are blocked from starting. Quarantine Malicious Files <ul><li>Enabled</li><li>Disabled</li></ul> When enabled, the Cortex XDR agent quarantines the files that are related to a malicious child process. -
Configure On-demand File Examination to scan endpoints and attached removable drives for dormant, inactive malware.
Item Options More details Periodic Scan <ul><li>Enabled</li><li>Disabled</li></ul> <div data-gb-custom-block data-tag="hint" data-style="info" class="hint hint-info"><p>Note</p><p>We recommend that you disable scheduled scanning. VDI machine scans are based on the golden image and additional files will be examined upon execution.</p></div><p>Periodic scanning enables you to scan endpoints on a recurring basis without waiting for malware to run on the endpoint. When enabled, you can set the time interval (weekly or monthly) and the day and time at which to start scanning. In addition, you can choose to enable or disable scanning of removable media drives.</p><p>Periodic scanning is persistent, and if the scan is scheduled to start while the endpoint is turned off, the scan will be initiated when the endpoint is turned on again. The scheduling of future scans is not affected by this delay.</p><div data-gb-custom-block data-tag="hint" data-style="info" class="hint hint-info"><p>Note</p><p>When periodic scanning is enabled in your profile, the Cortex XDR agent initiates an initial scan when it is first installed on the endpoint, regardless of the periodic scanning scheduling time.</p></div> -
Configure Mach-O Execution Examination to check Mach-O files for malware upon execution.
Item Options More details Action Mode <ul><li>Block</li><li>Report</li><li>Disabled</li></ul> When the Cortex XDR agent detects attempts to run malware, it performs the configured action. Quarantine malicious Mach-O files <ul><li>Disabled</li><li>Quarantine WildFire malware verdict</li><li>Quarantine WildFire and Locals Analysis malware verdict</li></ul> <p>By default, the Cortex XDR agent blocks malware from running, but does not quarantine the file. You can enable one of the options to quarantine files, depending on the verdict issuer.</p><div data-gb-custom-block data-tag="hint" data-style="info" class="hint hint-info"><p>Note</p><p>The Quarantine Malicious Mach-O Files feature is not available for malware identified on network drives.</p></div> Action on unknown Mach-O files to WildFire <ul><li>Allow</li><li>Run Local Analysis</li><li>Block</li></ul> <p>Allow: Unknown files are not blocked and local verdicts are not issued for them.</p><p>Run Local Analysis: The Cortex XDR agent uses embedded machine learning to determine the likelihood that an unknown file is malware, and issues a local verdict for the file.</p><p>Block: Block unknown files but do not run local analysis. In this case, unknown files remain blocked until the Cortex XDR agent receives an official WildFire verdict.</p> Action when WildFire verdict is Benign Low Confidence <ul><li>Allow</li><li>Run Local Analysis</li><li>Block</li></ul> <p>Select the action to take when a file with a Benign Low Confidence verdict from WildFire tries to run on the endpoint. When local analysis is enabled, the Cortex XDR agent uses embedded machine learning to determine the likelihood that an unknown file is malware, and issues a local verdict for the file. If you block this file but do not run a local analysis, the file remains blocked until the Cortex XDR agent receives a high-confidence WildFire verdict.</p><div data-gb-custom-block data-tag="hint" data-style="warning" class="hint hint-warning"><p>Warning</p><p>For optimal user experience, we recommend that you set the action mode to either Allow or Run Local Analysis.</p></div> Upload Mach-O files for cloud analysis <ul><li>Enabled</li><li>Disabled</li></ul> <p>When enabled, the Cortex XDR agent sends unknown files to Cortex XSIAM, and Cortex XSIAM sends the files to WildFire for analysis.</p><p>The file types that the Cortex XDR agent analyzes depend on the platform type. WildFire accepts files up to 300 MB in size.</p> Treat Grayware as Malware <ul><li>Enabled</li><li>Disabled</li></ul> <p>When enabled, Cortex XSIAM treats all grayware with the same Action Mode as configured for malware.</p><p>When disabled, grayware is considered benign, and is not blocked.</p> -
Configure Mach-O Loading Examination to detect and prevent execution of malicious Mach-O files when being loaded on macOS-based endpoints.
Item Options More details Action Mode <ul><li>Block</li><li>Report</li><li>Disabled</li></ul> When the Cortex XDR agent detects attempts to run malware, it performs the configured action. Quarantine malicious Mach-O files <ul><li>Disabled</li><li>Quarantine WildFire malware verdict</li><li>Quarantine WildFire and Locals Analysis malware verdict</li></ul> By default, the Cortex XDR agent blocks malware from running, but does not quarantine the file. You can enable one of the options to quarantine files, depending on the verdict issuer. Action on unknown Mach-O files to WildFire <ul><li>Allow</li><li>Run Local Analysis</li><li>Block</li></ul> <p>Allow: Unknown files are not blocked and local verdicts are not issued for them.</p><p>Run Local Analysis: The Cortex XDR agent uses embedded machine learning to determine the likelihood that an unknown file is malware, and issues a local verdict for the file.</p><p>Block: Block unknown files but do not run local analysis. In this case, unknown files remain blocked until the Cortex XDR agent receives an official WildFire verdict.</p> Action when WildFire verdict is Benign Low Confidence <ul><li>Allow</li><li>Run Local Analysis</li><li>Block</li></ul> <p>Select the action to take when a file with a Benign Low Confidence verdict from WildFire tries to run on the endpoint. When local analysis is enabled, the Cortex XDR agent uses embedded machine learning to determine the likelihood that an unknown file is malware, and issues a local verdict for the file. If you block this file but do not run a local analysis, the file remains blocked until the Cortex XDR agent receives a high-confidence WildFire verdict.</p><div data-gb-custom-block data-tag="hint" data-style="warning" class="hint hint-warning"><p>Warning</p><p>For optimal user experience, we recommend that you set the action mode to either Allow or Run Local Analysis.</p></div> Upload Mach-O files for cloud analysis <ul><li>Enabled</li><li>Disabled</li></ul> <p>When enabled, the Cortex XDR agent sends unknown files to Cortex XSIAM, and Cortex XSIAM sends the files to WildFire for analysis.</p><p>The file types that the Cortex XDR agent analyzes depend on the platform type. WildFire accepts files up to 300 MB in size.</p> Treat Grayware as Malware <ul><li>Enabled</li><li>Disabled</li></ul> <p>When enabled, Cortex XSIAM treats all grayware with the same Action Mode as configured for malware.</p><p>When disabled, grayware is considered benign, and is not blocked.</p> -
Configure Local File Threat Examination to enable detection of malicious files on the endpoint.
Note
This module is supported by Cortex XDR agent 8.1.0 and later releases.
Item Options More details Action Mode <ul><li>Enabled</li><li>Disabled</li></ul> When enabled, the Local Threat-Evaluation Engine (LTEE) analyzes the endpoint for PHP files arriving from a web server and generates issues about any malicious PHP scripts. Terminate Malicious Processes <ul><li>Enabled</li><li>Disabled</li></ul> When enabled, the Cortex XDR agents terminates malicious PHP files on the endpoint. Quarantine Malicious Files <ul><li>Enabled</li><li>Disabled</li></ul> When enabled, the Cortex XDR agent quarantines malicious files on the endpoint and does not quarantine updated files. -
Configure DMG File Examination to check DMG files for malware.
Item Options More details Action Mode <ul><li>Block</li><li>Report</li><li>Disabled</li></ul> When the Cortex XDR agent detects attempts to run malware in DMG files, it performs the configured action. Quarantine Malicious Executables <ul><li>Enabled</li><li>Disabled</li></ul> <p>When enabled, the Cortex XDR agent quarantines malicious executable DMG files.</p><div data-gb-custom-block data-tag="hint" data-style="info" class="hint hint-info"><p>Note</p><p>The Quarantine Malicious Executables feature is not available for malware identified on network drives.</p></div> Upload unknown files to WildFire <ul><li>Enabled</li><li>Disabled</li></ul> <p>When enabled, the Cortex XDR agent sends unknown files to Cortex XSIAM, and Cortex XSIAM sends the files to WildFire for analysis.</p><p>The file types that the Cortex XDR agent analyzes depend on the platform type. WildFire accepts files up to 300 MB in size.</p> -
Configure Breach and Attack Simulation (BAS) Tools settings.
Item Options More details Action Mode <ul><li>Enabled</li><li>Disabled (default)</li></ul> <p>When BAS mode is enabled, BAS tools will receive special handling. Only the simulation itself is terminated.</p><p>When BAS mode is disabled, BAS tools are treated like any other malicious process. Based on the profile settings, BAS tools will face the same prevention measures as all other threats</p><div data-gb-custom-block data-tag="hint" data-style="info" class="hint hint-info"><p>Note</p><p>When you are actively evaluating with BAS tools, it is recommended to enable the BAS mode setting only for the duration of your evaluation, and for a limited number of agents.</p></div> Note
BAS tools mode with content older than version 1850 cannot be configured, the agent will be treated as Enabled.
- To save the profile, click Create.
What to do next
If you are ready to apply your new profile to endpoints, you do this by adding it to a policy rule. If you still need to define other profiles, you can do this later. During policy rule creation or editing, you select the endpoints to which to assign the policy. There are different ways of doing this, such as:
Linux
- Add a new profile and define basic settings.
-
From Cortex XSIAM, select Inventory → Endpoints → Policy Management → Prevention → Profiles. Click +Add Profile, and select whether to create a new profile, or to import a profile from a file.
Note
New profiles based on imported profiles are added, and do not replace existing ones.
- Select the Linux platform, and Malware as the profile type.
- Click Next.
- For Profile Name, enter a unique name for the profile. The name can contain only letters, numbers, or spaces, and must be no more than 30 characters. The name will be visible from the list of profiles when you configure a policy rule.
- For Description, to provide additional context for the purpose or business reason for creating the profile, enter a profile description. For example, you might include an incident identification number or a link to a help desk ticket.
-
-
Configure ELF Execution Examination to analyze ELF files on endpoints and prevent malicious ELF files from being executed.
Item Options More details Action Mode <ul><li>Block</li><li>Report</li><li>Disabled</li></ul> When the Cortex XDR agent detects attempts to run malware in ELF files, it performs the configured action. Quarantine malicious ELF files <ul><li>Disabled</li><li>Quarantine WildFire malware verdict</li><li>Quarantine WildFire and Local Analysis malware verdict</li></ul> <p>By default, the Cortex XDR agent blocks malware from running, but does not quarantine the file. You can enable one of the options to quarantine files, depending on the verdict issuer.</p><div data-gb-custom-block data-tag="hint" data-style="info" class="hint hint-info"><p>Note</p><p>The Quarantine Malicious ELF Files feature is not available for malware identified on network drives.</p></div> Action on unknown ELF files to WildFire <ul><li>Allow</li><li>Run Local Analysis</li><li>Block</li></ul> <p>Allow: Unknown files are not blocked and local verdicts are not issued for them.</p><p>Run Local Analysis: The Cortex XDR agent uses embedded machine learning to determine the likelihood that an unknown file is malware, and issues a local verdict for the file.</p><p>Block: Block unknown files but do not run local analysis. In this case, unknown files remain blocked until the Cortex XDR agent receives an official WildFire verdict.</p> Upload ELF files for cloud analysis <ul><li>Enabled</li><li>Disabled</li></ul> <p>When enabled, the Cortex XDR agent sends unknown files to Cortex XSIAM, and Cortex XSIAM sends the files to WildFire for analysis.</p><p>The file types that the Cortex XDR agent analyzes depend on the platform type. WildFire accepts files up to 300 MB in size.</p> Treat Grayware as Malware <ul><li>Enabled</li><li>Disabled</li></ul> <p>When enabled, Cortex XSIAM treats all grayware with the same Action Mode as configured for malware.</p><p>When disabled, grayware is considered benign, and is not blocked.</p> -
Configure Loaded Kernel Modules Examination to determine what Kernel modules have been installed on the endpoint.
Item Options More details Action Mode <ul><li>Block</li><li>Report</li><li>Disabled</li></ul> When the Cortex XDR agent detects Kernel modules, it performs the configured action. -
Configure Local File Threat Examination to enable detection of malicious files on the endpoint.
Note
This module is supported by Cortex XDR agent 8.1.0 and later releases.
Item Options More details Action Mode <ul><li>Enabled</li><li>Disabled</li></ul> When enabled, the Local Threat-Evaluation Engine (LTEE) analyzes the endpoint for PHP files arriving from a web server and generates issues about any malicious PHP scripts. Quarantine Malicious Files <ul><li>Enabled</li><li>Disabled</li></ul> When enabled, the Cortex XDR agent quarantines malicious files on the endpoint and does not quarantine updated files. -
Configure On-write file examination to scan and take action on cross-platform files during the write process.
Item Options More details ELF files <ul><li>Enabled</li><li>Disabled</li></ul> <p>When enabled, the Cortex XDR agent monitors for malicious ELF files during the on-write process, and if it finds any, it generates issues and quarantines the files.</p><p>ELF file examination is based on the extension, only.</p> Portable executable files (Windows) <ul><li>Enabled</li><li>Disabled</li></ul> <p>When enabled, the Cortex XDR agent monitors for portable executable files during the on-write process, and if it finds any, it generates issues. It can also perform these actions:</p><ul><li>Quarantine malicious executables: you can enable an option to quarantine files, depending on the verdict.</li><li>Treat grayware as malware: When enabled, a grayware verdict is considered malware. When disabled, grayware is considered benign.</li></ul> Mach-O files (macOS) <ul><li>Enabled</li><li>Disabled</li></ul> <p>When enabled, the Cortex XDR agent monitors for malicious Mach-O files during the on-write process, and if it finds any, it generates alerts. It can also perform the following actions:</p><ul><li>Quarantine malicious executables: you can enable an option to quarantine files, depending on the verdict.</li><li>Treat grayware as malware: When enabled, a grayware verdict is considered malware. When disabled, grayware is considered benign.</li></ul> -
Configure On-demand File Examination to scan endpoints for dormant, inactive malware.
Note
Enabling on-demand scanning will automatically scan these core system directories:
/etc,/tmp,/home,/usr,/bin,/sbin,/lib,/var,/opt,/dev,/root,/boot.Item Options More details Periodic Scan <ul><li>Enabled</li><li>Disabled</li></ul> <div data-gb-custom-block data-tag="hint" data-style="info" class="hint hint-info"><p>Note</p><p>We recommend that you disable scheduled scanning. VDI machine scans are based on the golden image and additional files will be examined upon execution.</p></div><p>Periodic scanning enables you to scan endpoints on a recurring basis without waiting for malware to run on the endpoint. When enabled, you can set the time interval (weekly or monthly) and the day and time at which to start scanning.</p><p>Periodic scanning is persistent, and if the scan is scheduled to start while the endpoint is turned off, the scan will be initiated when the endpoint is turned on again. The scheduling of future scans is not affected by this delay.</p><div data-gb-custom-block data-tag="hint" data-style="info" class="hint hint-info"><p>Note</p><p>When periodic scanning is enabled in your profile, the Cortex XDR agent initiates an initial scan when it is first installed on the endpoint, regardless of the periodic scanning scheduling time.</p></div> Scan Timeout Number of hours If a scan exceeds the number of hours configured here, the Cortex XDR agent stops the scan. Scan Additional Directories <p>1. If you want to scan additional directories, click +Add.</p><p>2. Enter a directory path. Use ? to match a single character or * to match any string of characters in the directory path.</p><p>3. Press Enter or click the check mark.</p><p>4. To add additional folders, repeat these steps.</p> -
Configure the Global Behavioral Threat Protection Rules. These rules can be used to protect endpoints from malicious causality chains.
Item Options More details Action Mode <ul><li>Block</li><li>Report</li><li>Disabled</li></ul> The Cortex XDR agent protects against malicious causality chains, using behavioral threat protection rules. When the action mode is set to Block, the Cortex XDR agent terminates all processes and threads in the event chain up to the causality group owner (CGO). Quarantine Malicious Files <ul><li>Enabled</li><li>Disabled</li></ul> <p>When enabled, the Cortex XDR agent quarantines the processes and the artifacts, such as files, related to the CGO.</p><p>When disabled, the Cortex XDR agent does not quarantine the CGO of an event chain, nor any scripts or files called by the CGO.</p> -
Configure Credential Gathering Protection to protect endpoints from processes trying to access or steal passwords and other credentials.
Item Options More details Action Mode <ul><li>Block</li><li>Report</li><li>Disabled</li></ul> <p>The Cortex XDR agent protects against all processes and threads in the event chain up to the credential gathering process or file.</p><p>When this module is disabled, the Cortex XDR agent does not analyze the event chain and does not block credential gathering.</p> Quarantine Malicious Files <ul><li>Enabled</li><li>Disabled</li></ul> When enabled, the Cortex XDR agent quarantines the process or file related to the credential gathering event chain. -
Configure Financial Malware Threat Protection to protect against techniques specific to financial and banking malware.
Item Options More details Action Mode <ul><li>Block</li><li>Report</li><li>Disabled</li></ul> In a causality chain, when the Cortex XDR agent detects a process that attempts to access or steal financial or banking information, the Cortex XDR agent performs the configured action. Quarantine Malicious Files <ul><li>Enabled</li><li>Disabled</li></ul> In a causality chain, when the Cortex XDR agent detects a process that attempts to access or steal financial or banking information, the Cortex XDR agent performs the configured action. -
Configure Cryptominers Protection to protect against attempts to locate or steal cryptocurrencies.
Item Options More details Action Mode <ul><li>Block</li><li>Report</li><li>Disabled</li></ul> In a causality chain, when the Cortex XDR agent detects a cryptomining process or file, the Cortex XDR agent performs the configured action. Quarantine Malicious Files <ul><li>Enabled</li><li>Disabled</li></ul> When enabled, the Cortex XDR agent quarantines the process or file detected during a cryptocurrency gathering attempt. -
Configure Container Escaping Protection to protect against container-escaping attempts.
Item Options More details Action Mode <ul><li>Block</li><li>Report</li><li>Disabled</li></ul> When the Cortex XDR agent detects container escaping attempts, it performs the configured action. -
Configure Reverse Shell Protection to prevent attempts to redirect standard input and output streams to network sockets.
Item Options More details Action Mode <ul><li>Block</li><li>Report</li><li>Disabled</li></ul> When the Cortex XDR agent detects attempts to redirect standard input and output streams to network sockets, it performs the configured action. -
Configure Anti Webshell Protection to protect endpoint processes from dropping malicious web shells.
Item Options More details Action Mode <ul><li>Block</li><li>Report</li><li>Disabled</li></ul> In a causality chain, when the Cortex XDR agent detects a process that attempts to drop malicious web shells, it performs the configured action. Quarantine Malicious Files <ul><li>Enabled</li><li>Disabled</li></ul> When enabled, the Cortex XDR agent quarantines the processes or files that are related to the web shell drop event chain, and any scripts or files called by the web shell dropping process. -
Configure Malicious Child Process Protection to prevent process creation based on examination of suspicious relations between parent and child processes. For this option, we support User Mode, and Kernel Mode for kernel versions 4.4 and later.
Item Options More details Action Mode <ul><li>Block</li><li>Report</li><li>Disabled</li></ul> When the Cortex XDR agent detects known suspicious parent-child relationships that are used to bypass security, the Cortex XDR agent performs the configured action. When Block is selected, known suspicious child processes are blocked from starting. Quarantine Malicious Files <ul><li>Enabled</li><li>Disabled</li></ul> When enabled, the Cortex XDR agent quarantines the files that are related to a malicious child process. -
Configure Breach and Attack Simulation (BAS) Tools settings.
Item Options More details Action Mode <ul><li>Enabled</li><li>Disabled (default)</li></ul> <p>When BAS mode is enabled, BAS tools will receive special handling. Only the simulation itself is terminated.</p><p>When BAS mode is disabled, BAS tools are treated like any other malicious process. Based on the profile settings, BAS tools will face the same prevention measures as all other threats</p><div data-gb-custom-block data-tag="hint" data-style="info" class="hint hint-info"><p>Note</p><p>When you are actively evaluating with BAS tools, it is recommended to enable the BAS mode setting only for the duration of your evaluation, and for a limited number of agents.</p></div> Note
BAS tools mode with content older than version 1850 cannot be configured, the agent will be treated as Enabled.
- To save the profile, click Create.
What to do next
If you are ready to apply your new profile to endpoints, you do this by adding it to a policy rule. If you still need to define other profiles, you can do this later. During policy rule creation or editing, you select the endpoints to which to assign the policy. There are different ways of doing this, such as:
Android
- Add a new profile and define basic settings.
-
From Cortex XSIAM, select Inventory → Endpoints → Policy Management → Prevention → Profiles. Click +Add Profile, and select whether to create a new profile, or to import a profile from a file.
Note
New profiles based on imported profiles are added, and do not replace existing ones.
- Select the Android platform, and Malware as the profile type.
- Click Next.
- For Profile Name, enter a unique name for the profile. The name can contain only letters, numbers, or spaces, and must be no more than 30 characters. The name will be visible from the list of profiles when you configure a policy rule.
- For Profile Name, enter a unique name for the profile. The name can contain only letters, numbers, or spaces, and must be no more than 30 characters. The name will be visible from the list of profiles when you configure a policy rule.
-
-
Configure APK Files Examination, to analyze and prevent malicious APK files from running on endpoints.
Note
From Cortex XDR agent for Android version 9.0 and later, part of this module, which performs local analysis on the Android device itself, is deprecated. APK analysis will be handled only by Wildfire.
Item Options More details Action Mode <ul><li>Block</li><li>Report</li><li>Disabled</li></ul> When the Cortex XDR agent detects attempts to run malicious APK files, it performs the configured action. Action on unknown APK files to WildFire <ul><li>Allow</li><li>Run Local Analysis</li><li>Block</li></ul> <p>Allow: Unknown files are not blocked and local verdicts are not issued for them.</p><p>Run Local Analysis: The Cortex XDR agent uses embedded machine learning to determine the likelihood that an unknown file is malware, and issues a local verdict for the file.</p><p>Block: Block unknown files but do not run local analysis. In this case, unknown files remain blocked until the Cortex XDR agent receives an official WildFire verdict.</p> Upload APK files for cloud analysis <ul><li>Enabled</li><li>Disabled</li></ul> <p>When enabled, the Cortex XDR agent sends unknown files to Cortex XSIAM, and Cortex XSIAM sends the files to WildFire for analysis.</p><p>The file types that the Cortex XDR agent analyzes depend on the platform type. WildFire accepts files up to 300 MB in size.</p> Treat Grayware as Malware <ul><li>Enabled</li><li>Disabled</li></ul> <p>When enabled, Cortex XSIAM treats all grayware with the same Action Mode as configured for malware.</p><p>When enabled, Cortex XSIAM treats all grayware with the same Action Mode as configured for malware.</p> - To save the profile, click Create.
What to do next
If you are ready to apply your new profile to endpoints, you do this by adding it to a policy rule. If you still need to define other profiles, you can do this later. During policy rule creation or editing, you select the endpoints to which to assign the policy. There are different ways of doing this, such as:
iOS
- Add a new profile and define basic settings.
-
Select Inventory → Endpoints → Policy Management → Prevention → Profiles. Click +Add Profile, and select whether to create a new profile, or to import a profile from a file.
Note
New profiles based on imported profiles are added, and do not replace existing ones.
- Select the iOS platform, and Malware as the profile type.
- Click Next.
- For Profile Name, enter a unique name for the profile. The name can contain only letters, numbers, or spaces, and must be no more than 30 characters. The name will be visible from the list of profiles when you configure a policy rule.
- For Description, to provide additional context for the purpose or business reason for creating the profile, enter a profile description. For example, you might include a case identification number or a link to a help desk ticket.
-
-
Configure URL filtering to analyze and block or report malicious URLs, and to block or allow custom URLs.
Note
Blocking functionality is different for each security module. For SMS/MMS, Cortex XDR agent will move detected messages containing such URLs from unknown senders to the Junk folder.
Item Options More details Action Mode <ul><li>Block</li><li>Report</li><li>Disabled</li></ul> <p>When the Cortex XDR agent detects malicious URLs, the Cortex XDR agent performs the configured action.</p><p>To add numbers to the Block List, click +Add and enter the URL. Press Enter to add more URLs.</p><p>To add URLs to the Allow List, define a list on the Legacy Agent Exceptions page.</p> -
Configure Spam Reports to report calls and messages as spam.
Item Options More details Spam Report <ul><li>Enabled</li><li>Disabled</li></ul> Configure reporting of spam calls and messages to Cortex analysts. -
Configure Call and Messages Blocking for incoming calls and messages from known spam numbers.
Item Options More details Action Mode <ul><li>Block</li><li>Report</li><li>Disabled</li></ul> <p>When the Cortex XDR agent detects incoming calls or messages from known spam numbers, the Cortex XDR agent performs the configured action.</p><ul><li>To add numbers to the Block List, click +Add and enter the phone number. Press Enter to add more numbers.</li><li>To add numbers to the Allow List, define a list on the Legacy Agent Exceptions page.</li></ul><div data-gb-custom-block data-tag="hint" data-style="info" class="hint hint-info"><p>Note</p><p>Ensure that the same numbers are not added multiple times with different leading zeros.</p></div> -
Configure Safari Browser Security Module. This security module can provide proactive gating of suspicious sites accessed using Safari, and provides informative site analysis to the device user. This option is recommended for iOS devices that do not belong to your organization and do not use the Network Shield feature.
Note
To fully enable the Safari browser security module on the device side, each iOS device user must enable the Safari Safeguard module on the device, and grant it permission to work on all websites. If the iOS device user does not do this, the endpoint's operation status is reported as Partially Protected.
The Safari browser security module will only function when the URL filtering module (see earlier in this procedure) is set to Block.
Item Options More details Enforce use of Safari Security Module <ul><li>Enabled</li><li>Disabled</li></ul> <p>When set to Enabled, the Safari Safeguard security module displays "Required" on the Modules screen of the app. Full protection for Safari will only be active after the iOS device user has also activated it on the device. When this module is also activated on the device, issue notifications are forwarded to the tenant.</p><p>When set to Disabled, and users decide to enable the module on their devices, issue notifications are visible locally on the iOS device only, and are not forwarded to the tenant.</p> Safari malicious JS blocking <ul><li>Enabled</li><li>Disabled</li></ul> When set to Enabled, the Cortex XDR agent blocks the entire page in Safari where malicious JS files are detected. -
Configure Network and EDR Security Module. This module lets you configure granular control and monitoring of network traffic on iOS-based supervised devices. The devices' profiles must be also configured for this on the MDM side as explained in the Cortex XDR Agent iOS Guide.
Note
Cortex XDR agent version 8.4 or higher are required for this feature.
Item Options More details Auto detected malicious URL filtering <ul><li>Enabled</li><li>Disabled</li></ul> When set to Enabled, the Cortex XDR agent automatically filters known malicious URLs. URL filtering <ul><li>Enabled</li><li>Disabled</li></ul> When set to Enabled, the Cortex XDR agent filters URLs according to the lists of allowed and blocked URLs configured in the URL Filtering section above. Predefined Blocked Apps List of apps A list of commonly known apps that your organization may be interested in blocking on supervised devices is provided here. The Cortex XDR agent will block use of the selected apps. You can select one or more apps. Blocked Bundle IDs <p>A Bundle ID is an app's unique identifier, in string format, that is used to identify the app in an app store. Communication will be blocked for any process with exactly the Bundle ID defined here, or for a Bundle ID that has the defined string as a suffix.</p><p>For example, the Calculator app's Bundle ID is: com.apple.calculator. When you add com.apple.calculator to the list, the Cortex XDR agent app will block all of these Bundle IDs:</p><ul><li>com.apple.calculator</li><li>H3DT34.com.apple.calculator</li><li>widget.com.apple.calculator</li></ul><p>To block apps according to Bundle ID, enter a Bundle ID and press Enter. To add another Bundle ID to the list, click +Add and repeat this process.</p> Block List of Remote IPV4/IPV6 IP Address <p>The Cortex XDR agent will block the IP addresses that you add to this field. Both IPV4 and IPv6 addresses are supported.</p><p>To block apps according to IP address, enter an IP address with a subnet mask, a range, or an individual IP address, and press Enter. To add another IP address to the list, click +Add and repeat this process.</p> Digest issues <ul><li>Enabled</li><li>Disabled</li></ul> <p>Digest issues are issues that contain a summary of blocked network activity over a prolonged time period.</p><p>When set to Enabled, the Cortex XDR agent sends a digest to the tenant.</p> Digest issues max frequency 1 to 7 days When Digest issues is enabled, you can limit the digest to no more than one per <selected number of days>. Max issues per app <ul><li>Hours</li><li>Minutes</li></ul> Limit issue notifications by the Cortex XDR agent app to one issue for each app per <selected period of time>. Max user notifications Hours Limit issue notifications by the Cortex XDR agent app to one user notification per <selected number of hours>. - To save the profile, click Create.
Set up exploit prevention profiles
Exploit prevention profiles block attempts to exploit system flaws in browsers and in the operating system. For example, exploit prevention profiles help protect against exploit kits, illegal code execution, and other attempts to exploit process and system vulnerabilities.
You can configure the action that the Cortex XDR agent takes when attempts to exploit software vulnerabilities or flaws occur. To protect against specific exploit techniques, you can customize exploit protection capabilities in each exploit prevention profile. Default settings are shown in parentheses. To fine-tune your exploit prevention policy, you can override the configuration of each capability to block the malicious exploit, allow but report it, or disable the module.
To view which processes are protected by each capability, see Processes Protected by Exploit Security Policy.
For each setting that you override, clear the corresponding option to Use Default, and select the setting of your choice.
In this profile, the Report options configure the endpoints to report the corresponding exploit attempts to Cortex XSIAM, without blocking them. The Disabled options configure the endpoints to neither analyze nor report the corresponding malware or behavior.
The tasks below are organized according to the operating systems used by your organization's endpoints.
Windows
- Add a new profile and define basic settings.
-
From Cortex XSIAM, select Inventory → Endpoints → Policy Management → Prevention → Profiles. Click +Add Profile, and select whether to create a new profile, or to import a profile from a file.
Note
New profiles based on imported profiles are added, and do not replace existing ones.
- Select the Windows platform, and Exploit as the profile type.
- Click Next.
- For Profile Name, enter a unique name for the profile. The name can contain only letters, numbers, or spaces, and must be no more than 30 characters. The name will be visible from the list of profiles when you configure a policy rule.
- For Description, to provide additional context for the purpose or business reason for creating the profile, enter a profile description. For example, you might include a case identification number or a link to a help desk ticket.
-
-
Configure Browser Exploits Protection, to protect endpoints from malicious or compromised websites.
Item Options More details Action Mode <ul><li>Block</li><li>Report</li><li>Disabled</li></ul> When the Cortex XDR agent detects attempts to exploit browser processes for malicious purposes, it performs the configured action. -
Configure Logical Exploits Protection to prevent execution of malicious code using common operating system mechanisms.
Item Options More details Action Mode <ul><li>Block</li><li>Report</li><li>Disabled</li></ul> When the Cortex XDR agent detects attempts to execute malicious code using operating system mechanisms, it performs the configured action. Block List DLLs <p>The block list blocks the specified DLLs when they are run by a protected process, using the DLL Hijacking module.</p><p>1. Click +Add to configure entries in your Block List.</p><p>2. Enter the name of the process that you want to block.</p><p>3. Enter the associated DLL name.</p><p>The DLL folder or file must include the complete path. To complete the path, you can use environment variables or the asterisk () as a wildcard to match any string of characters (for example, /windows32/).</p> -
Configure Known Vulnerable Processes Protection to automatically protect endpoints from attacks that try to leverage common operating system mechanisms for malicious purposes.
Item Options More details Action Mode <ul><li>Block</li><li>Report</li><li>Disabled</li></ul> Attackers can use existing mechanisms in the operating system to execute malicious code. When you set this option to Block, in order to block such code, you can also configure Java Deserialization Protection. Java Deserialization Protection <ul><li>Enabled</li><li>Disabled</li></ul> When enabled, the same action mode defined for the Known Vulnerable Process Protection is inherited here. -
Configure Operating System Exploit Protection to prevent attackers from using operating system mechanisms for malicious purposes.
Item Options More details Action Mode <ul><li>Block</li><li>Report</li><li>Disabled</li></ul> When the Cortex XDR agent detects attempts to use the operating system's own mechanisms to perform an attack, the Cortex XDR agent performs the configured action. -
Configure Exploit Protection for Additional Processes to protect third-party processes running on endpoints.
Item Options More details Action Mode <ul><li>Block</li><li>Report</li><li>Disabled</li></ul> <p>The Cortex XDR agent can protect third-party processes from exploitation. To protect these processes, define them in the Processes list below this field. If you select the Block option, we recommend that you perform testing and validation to ensure that there are no compatibility issues with the third-party processes that you have defined.</p><div data-gb-custom-block data-tag="hint" data-style="info" class="hint hint-info"><p>Note</p><p>In exploit prevention profiles, if you change the action mode for processes, you must restart the protected processes for the following security modules to take effect on the process and its forked processes:</p><ul><li>Brute Force Protection</li><li>Java Deserialization</li><li>ROP</li><li>SO Hijacking</li></ul></div> Processes <p>If you want to add exploit protection for one or more additional third-party processes, add them here.</p><p>1. Click +Add to configure entries in your Processes list.</p><p>2. Enter the file name of the process that you want to block, and press ENTER.</p><p>3. For additional processes, repeat the previous steps.</p> -
Configure Unpatched Vulnerabilities Protection to provide a temporary workaround for protecting unpatched endpoints from known vulnerabilities.
Note
This step provides a temporary workaround for the following publicly known information-security vulnerabilities and exposures: CVE-2021-24074, CVE-2021-24086 and CVE-2021-24094.
If you choose not to patch the endpoint, the Unpatched Vulnerabilities Protection capability allows the Cortex XDR agent to apply a workaround to protect the endpoints from the known vulnerability. It takes the Cortex XDR agent up to 6 hours to enforce your configured policy on the endpoints.
Note
If you have Windows endpoints in your network that are unpatched and exposed to a known vulnerability, we strongly recommend that you upgrade to the latest Windows Update that has a fix for that vulnerability.
Item Options More details Modify IPv4 and IPv6 Settings <ul><li>Do not modify system settings</li><li>Modify settings until the endpoint is patched</li><li>Revert system settings to your previous settings</li></ul> <p>To address known vulnerabilities CVE-2021-24074, CVE-2021-24086, and CVE-2021-24094, you can Modify IPv4 and IPv6 settings as follows:</p><ul><li>Do not modify system settings (default): Do not modify the IPv4 and IPv6 settings currently set on the endpoint, whether the current values are your original values or values that were modified as part of this workaround.</li><li><p>Modify system settings until the endpoint is patched: If the endpoint is already patched, this option does not modify any system settings. For unpatched endpoints, the Cortex XDR agent runs the following commands to temporarily modify the IPv4 and IPv6 settings until the endpoint is patched. After the endpoint is patched for CVE-2021-24074, CVE-2021-24086, and CVE-2021-24094, all modified Windows system settings as part of this workaround are automatically reverted to their values before modification. Palo Alto Networks strongly recommends that you review these commands before applying this workaround in your network to ensure your critical business components are not affected or harmed:</p><p> netsh int ipv6 set global reassemblylimit=0</p><p>This command disables IPv6 fragmentation on the endpoint.</p><p>netsh int ipv4 set global sourceroutingbehavior=drop</p><p>This command disables LSR / loose source routing for IPv4.</p></li><li>Revert system settings to your previous settings: Revert all Windows system settings to their values before modification as part of this workaround, regardless of whether the endpoint was patched or not.</li></ul><div data-gb-custom-block data-tag="hint" data-style="warning" class="hint hint-warning"><p>Warning</p><p>This workaround applies only to the specific Windows versions listed as exposed to these CVEs, and requires a Cortex XDR agent release 7.1 or later and content 167-51646 or later. This workaround is not recommended for non-persistent, stateless, or linked-clone environments. In some cases, enabling this workaround can affect the network functionality on the endpoint.</p></div> - To save the profile, click Create.
What to do next
If you are ready to apply your new profile to endpoints, you do this by adding it to a policy rule. If you still need to define other profiles, you can do this later. During policy rule creation or editing, you select the endpoints to which to assign the policy. There are different ways of doing this, such as:
macOS
- Add a new profile and define basic settings.
-
From Cortex XSIAM, select Inventory → Endpoints → Policy Management → Prevention → Profiles. Click +Add Profile, and select whether to create a new profile, or to import a profile from a file.
Note
New profiles based on imported profiles are added, and do not replace existing ones.
- Select the macOS platform, and Exploit as the profile type.
- Click Next.
- Enter a unique Profile Name for the profile. The name can contain only letters, numbers, or spaces, and must be no more than 30 characters. The name will be visible from the list of profiles when you configure a policy rule.
- For Description, to provide additional context for the purpose or business reason for creating the profile, enter a profile description. For example, you might include a case identification number or a link to a help desk ticket.
-
-
Configure Browser Exploits Protection, to protect endpoints from malicious or compromised websites.
Item Options More details Action Mode <ul><li>Block</li><li>Report</li><li>Disabled</li></ul> When the Cortex XDR agent detects attempts to exploit browser processes for malicious purposes, it performs the configured action. -
Configure Logical Exploits Protection to prevent execution of malicious code using common operating system mechanisms.
Item Options More details Action Mode <ul><li>Block</li><li>Report</li><li>Disabled</li></ul> When the Cortex XDR agent detects attempts to execute malicious code using operating system mechanisms, it performs the configured action. -
Configure Known Vulnerable Processes Protection to automatically protect endpoints from attacks that try to leverage common operating system mechanisms for malicious purposes.
Item Options More details Action Mode <ul><li>Block</li><li>Report</li><li>Disabled</li></ul> Attackers can use existing mechanisms in the operating system to execute malicious code. When you set this option to Block, in order to block such code, you can also configure Java Deserialization Protection. -
Configure Operating System Exploit Protection to prevent attackers from using operating system mechanisms for malicious purposes.
Item Options More details Action Mode <ul><li>Block</li><li>Report</li><li>Disabled</li></ul> When the Cortex XDR agent detects attempts to use the operating system's own mechanisms to perform an attack, the Cortex XDR agent performs the configured action. -
Configure Exploit Protection for Additional Processes to protect third-party processes running on endpoints.
Item Options More details Action Mode <ul><li>Block</li><li>Report</li><li>Disabled</li></ul> <p>The Cortex XDR agent can protect third-party processes from exploitation. To protect these processes, define them in the Processes list below this field. If you select the Block option, we recommend that you perform testing and validation to ensure that there are no compatibility issues with the third-party processes that you have defined.</p><div data-gb-custom-block data-tag="hint" data-style="info" class="hint hint-info"><p>Note</p><p>In exploit prevention profiles, if you change the action mode for processes, you must restart the protected processes for the following security modules to take effect on the process and its forked processes:</p><ul><li>Brute Force Protection</li><li>Java Deserialization</li><li>ROP</li><li>SO Hijacking</li></ul></div> Processes <p>If you want to add exploit protection for one or more additional third-party processes, add them here.</p><p>1. Click +Add to configure entries in your Processes list.</p><p>2. Enter the file name of the process that you want to block, and press ENTER.</p><p>3. For additional processes, repeat the previous steps.</p> -
Configure Kernel Privilege Escalation Protection to provide deep visibility into user-to-kernel interactions to block escalation attempts at the source. Supported on Cortex XDR agent 9.2 and later.
Item Options More details Action mode <ul><li>Block</li><li>Report</li><li>Disabled</li></ul> Risky Profile Status: Setting the action to Block is the recommended security posture. If you set Report or Disabled, the platform may flag the profile as Risky. Quarantine malicious files <ul><li>Enabled</li><li>Disabled</li></ul> - To save the profile, click Create.
What to do next
If you are ready to apply your new profile to endpoints, you do this by adding it to a policy rule. If you still need to define other profiles, you can do this later. During policy rule creation or editing, you select the endpoints to which to assign the policy. There are different ways of doing this, such as:
Linux
- Add a new profile and define basic settings.
-
From Cortex XSIAM, select Inventory → Endpoints → Policy Management → Prevention → Profiles. Click +Add Profile, and select whether to create a new profile or to import a profile from a file.
Note
New profiles based on imported profiles are added and do not replace existing ones.
- Select the Linux platform, and Exploit as the profile type.
- Click Next.
- Enter a unique Profile Name for the profile. The name can contain only letters, numbers, or spaces, and must be no more than 30 characters. The name will be visible from the list of profiles when you configure a policy rule.
- For Description, to provide additional context for the purpose or business reason for creating the profile, enter a profile description. For example, you might include a case identification number or a link to a help desk ticket.
-
-
Configure Known Vulnerable Processes Protection to automatically protect endpoints from attacks that try to leverage common operating system mechanisms for malicious purposes.
Item Options More details Action Mode <ul><li>Block</li><li>Report</li><li>Disabled</li></ul> Attackers can use existing mechanisms in the operating system to execute malicious code. When you set this option to Block, in order to block such code, you can also configure Java Deserialization Protection. -
Configure Operating System Exploit Protection to prevent attackers from using operating system mechanisms for malicious purposes.
Item Options More details Action Mode <ul><li>Block</li><li>Report</li><li>Disabled</li></ul> When the Cortex XDR agent detects attempts to use the operating system's own mechanisms to perform an attack, the Cortex XDR agent performs the configured action. -
Configure Exploit Protection for Additional Processes to protect third-party processes running on endpoints.
Item Options More details Action Mode <ul><li>Block</li><li>Report</li><li>Disabled</li></ul> <p>The Cortex XDR agent can protect third-party processes from exploitation. To protect these processes, define them in the Processes list below this field. If you select the Block option, we recommend that you perform testing and validation to ensure that there are no compatibility issues with the third-party processes that you have defined.</p><div data-gb-custom-block data-tag="hint" data-style="info" class="hint hint-info"><p>Note</p><p>In exploit prevention profiles, if you change the action mode for processes, you must restart the protected processes for the following security modules to take effect on the process and its forked processes:</p><ul><li>Brute Force Protection</li><li>Java Deserialization</li><li>ROP</li><li>SO Hijacking</li></ul></div> Processes <p>If you want to add exploit protection for one or more additional third-party processes, add them here.</p><p>1. Click +Add to configure entries in your Processes list.</p><p>2. Enter the file name of the process that you want to block, and press ENTER.</p><p>3. For additional processes, repeat the previous steps.</p> - To save the profile, click Create.
What to do next
If you are ready to apply your new profile to endpoints, you do this by adding it to a policy rule. If you still need to define other profiles, you can do this later. During policy rule creation or editing, you select the endpoints to which to assign the policy. There are different ways of doing this, such as:
Set up agent settings profiles
Use agent settings profiles to customize Cortex XDR agent settings for different platforms and groups of users.
The tasks below are organized according to the operating systems used by your organization's endpoints.
Windows
- Add a new profile and define basic settings.
-
Select Inventory → Endpoints → Policy Management → Prevention → Profiles. Click +Add Profile, and select whether to create a new profile or import a profile from a file.
Note
New profiles based on imported profiles are added, and do not replace existing ones.
- Select the Windows platform, and Agent Settings as the profile type.
- Click Next.
- For Profile Name, enter a unique name for the profile. The name can contain only letters, numbers, or spaces, and must be no more than 30 characters. The name will be visible from the list of profiles when you configure a policy rule.
- For Description, to provide additional context for the purpose or business reason for creating the profile, enter a profile description. For example, you might include a case identification number or a link to a help desk ticket.
-
- For Disk Quota, configure the amount of disk space to allot for Cortex XDR agent logs. Specify a value in MB from 100 to 10,000 (default is 5,000).
-
Configure the User Interface options for Cortex XSIAM.
By default, Cortex XSIAM uses the settings specified in the default agent settings profile and displays the default configuration in parentheses. When you select a setting other than the default, you override the default configuration for the profile.
Item Options More details Tray Icon <ul><li>Visible (default)</li><li>Hidden</li></ul> Choose whether you want the Cortex XDR agent icon to be Visible or Hidden in the notification area (system tray). XDR Agent Console Access <ul><li>Enabled</li><li>Disabled</li></ul> When enabled, allows access to Cortex XSIAM. XDR Agent User Notifications <ul><li>Enabled</li><li>Disabled</li></ul> <p>Enable this option to operate display notifications in the notifications area on the endpoint. When you enable notifications, you can use the default notification messages that are displayed for each option, or provide custom text for each notification type. You can also customize a notification footer. Options include:</p><ul><li><p>Device Control Violation Notifications</p><div data-gb-custom-block data-tag="hint" data-style="info" class="hint hint-info"><p>Note</p><p>Disabling Device Control Violation notifications is only supported on endpoints running Cortex XDR agent version 8.6 and above.</p></div></li><li>Live Terminal User Notifications: You can select to Request end-user permission to start the session. If the end user denies the request, you will not be able to initiate a Live Terminal session on the endpoint.</li><li>Live Terminal Active Session Indication: Enable this option to display a blinking light (  ) on the tray icon for the duration of the remote session to indicate to the end user that a Live Terminal session is in progress.</li><li>Persistent Isolation Notification</li><li>Endpoint Network Isolation Notification</li><li>Endpoint Network Un-Isolation Notification</li><li>Blocked Connectivity Notification</li><li>Exploit/Malware Events Set to Block</li><li>Restriction Events Set to Block</li><li>Restriction Events Set to Notify User</li><li>Notification Footer Text</li><li>USB Device Was Blocked</li><li>USB Disk Drive Was Allowed in Read-Only Mode</li></ul><div data-gb-custom-block data-tag="hint" data-style="info" class="hint hint-info"><p>Note</p><p>You can enable the option to maintain a persistent notification regarding the disconnection of the endpoint from the network. The settings Persistent Isolation Notification and Blocked Connectivity Notification must be enabled. Until the threat on the endpoint has been removed, the endpoint remains disconnected from the network.</p></div>
 -
Customize Agent Security settings. By default, the Cortex XDR agent protects all agent components. However, you can configure protection with more granularity for Cortex XDR agent services, processes, files, registry values, and tampering protection.
Note
In Traps 5.0.6 and later releases, when protection is enabled, access will be read-only. In earlier Traps releases, enabling protection disables all access to services, processes, files, and registry values.
-
Enable XDR Agent Tampering Protection.
Note
If you choose the Enable option, you must also enable XDR Agent Tampering Protection in the malware profile and set it to Block. Ensure that both profiles are assigned to the same endpoints.
-
You can customize the following options:
Item Options More details Service Protection <ul><li>Enabled</li><li>Disabled</li></ul> Protects against stopping agent services. When this protection is enabled, agent services won't accept operating system stop requests. Process Protection <ul><li>Enabled</li><li>Disabled</li></ul> Protects against attempts to tamper with agent processes; injecting into them, terminating them, reading, or writing into their virtual memory. File Protection <ul><li>Enabled</li><li>Disabled</li></ul> Protects against attempts to tamper with agent files; deleting, replacing, renaming, moving, or writing files/directories. Registry Protection <ul><li>Enabled</li><li>Disabled</li></ul> Protects against attempts to tamper with agent registry settings and agent policies, such as deleting, adding, and renaming registry keys or values which belong to the agent. Pipe Protection <ul><li>Enabled</li><li>Disabled</li></ul> Protects against attempts to tamper with the agent's pipe-based inter-process communication (IPC) mechanism. -
-
For Uninstall Password, configure an uninstall password.
Define and confirm an encrypted password that the user must specify to uninstall the Cortex XDR agent. The uninstall password, also known as the supervisor password, is also used to protect against tampering attempts using Cytool commands. The password must contain:
- 8 to 32 characters
- At least one of each of the following:
- Lower-case letter
- Upper-case letter
- Number
- Special character: !@#%
-
Configure Windows Security Center Integration.
The Windows Security Center is a reporting tool that monitors the system health and security state of Windows endpoints on Windows 7 and later releases.
Note
When you enable Cortex XDR agent registration with the Windows Security Center, Windows automatically shuts down Microsoft Defender on Windows-based workstation endpoints. If you still want to allow Microsoft Defender to run on a workstation endpoint where Cortex XSIAM is installed, you must use the Disable option. However, Palo Alto Networks does not recommend running Windows Defender and the Cortex XDR agent on the same endpoint, because this might cause performance and incompatibility issues with Global Protect and other applications.
On Windows-based servers, ensure that Windows Defender is disabled. This can be done using a Group Policy Object (GPO) or another group management tool of your choice.
Item Options More details Windows security Integration Enabled <p>The Cortex XDR agent registers with the Windows Security Center as an official Antivirus (AV) software product. As a result, Windows automatically shuts down Microsoft Defender on the endpoint, except for endpoints that are running Windows Server versions.</p><p>To avoid performance issues, Palo Alto Networks recommends that you disable or remove Windows Defender from Windows Server-based endpoints where the Cortex XDR agent is installed.</p> Windows security integration Enabled No patches (Traps 5.0 release only) Select this option if you want to register the agent with the Windows Security Center, but prevent Windows from automatically installing Meltdown/Spectra vulnerability patches on the endpoint. Windows security integration Disabled The Cortex XDR agent does not register with the Windows Action Center. As a result, Windows Action Center might indicate that virus protection is off, depending on other security products that are installed on the endpoint. Report Agent Out of Date Status to Windows Security Center <ul><li>Enabled</li><li>Disabled</li></ul> <p>When enabled, the Cortex XDR agent will report every time that the connection to the server is lost for more than seven days. Each time that the agent reconnects, the count restarts.</p><p>This setting is available when Windows Security Integration is set to either Enabled or Enabled No Patches.</p> -
Configure Issues Data collection options.
When the Cortex XDR agent generates issues for process-related activity on the endpoint, the agent collects the contents of memory and other data about the event, in what is known as an issue data dump file. You can configure the Cortex XDR agent to automatically upload issue data dump files to Cortex XSIAM.
Item Options More details Issue Data Dump File Size <ul><li>Small</li><li>Medium</li><li>Full</li></ul> The Full option creates the largest and most complete set of information. Automatically Upload Issue Data Dump File <ul><li>Enabled</li><li>Disabled</li></ul> During event investigation, if automatic upload was disabled, you can still manually retrieve this data. -
Enable XDR Pro Endpoint Capabilities, and then configure the capabilities required by your organization. The Cortex XDR Pro features are hidden until you enable this option.
Notice
Requires a Cortex XDR Pro per Endpoint license. When you enable this feature, a Cortex XDR Pro per Endpoint license is consumed.
Item Options More details Monitor and Collect Enhanced Endpoint Data <ul><li>Enabled</li><li>Disabled</li></ul> By default, the Cortex XDR agent collects information about events that occur on the endpoint. If you enable Behavioral Threat Protection in a Malware security profile, the Cortex XDR agent also collects information about all active file, process, network, and registry activity on an endpoint. When you enable the Cortex XDR agent to monitor and collect enhanced endpoint data, Cortex XSIAM shares the detailed endpoint information with other Cortex apps. The information can help to provide the endpoint context when a security event occurs, so that you can gain insight into the overall event scope during an investigation. The event scope includes all activities that took place during an attack, the endpoints that were involved, and the damage caused. When disabled, the Cortex XDR agent will not share endpoint activity logs. Enable Host Insights Capabilities <ul><li>Enabled</li><li>Disabled</li></ul> <div data-gb-custom-block data-tag="hint" data-style="info" class="hint hint-info"><p>Notice</p><p>Requires Host Insights add-on.</p></div><p>When enabled, the various host insight capabilities can be configured.</p> Endpoint Information Collection <ul><li>Enabled</li><li>Disabled</li></ul> When enabled, the Cortex XDR agent collects host inventory information such as users, groups, services, drivers, hardware, and network shares, as well as information about applications installed on the endpoint, including CVE and installed KBs for Vulnerability Assessment. File Search and Destroy Action Mode <ul><li>Enabled</li><li>Disabled</li></ul> <p>When enabled, the Cortex XDR agent collects detailed information about files on the endpoint to create a files inventory database. The agent locally monitors any actions performed on these files and updates the local files inventory database in real-time.</p><p>With this option you can also select the File Search and Destroy Monitored File Types where Cortex XSIAM monitors all the files on the endpoint, or only common file types. If you choose Common file types, Cortex XSIAM monitors the following file types:</p><p> bin, msi, doc, docx, docm, rtf, xls, xlsx, xlsm, pdf, ppt, pptx, pptm, ppsm, pps, ppsx, mpp, mppx, vsd, xsdxandwsf.</p><p>A hash will also be computed for these file types:zip, pe,andole.</p><p>File size is limited to 30 MB by default. Searches of files larger than 30 MB by hash are not supported.</p><p>Additionally, you can exclude files that exist under a specific local path on the endpoint from inclusion in the files database.</p>Monitor and Collect Forensics Data <ul><li>Enabled</li><li>Disabled</li></ul> <div data-gb-custom-block data-tag="hint" data-style="info" class="hint hint-info"><p>Notice</p><p>Requires Forensics Add-on.</p></div><p>When enabled, the Cortex XDR agent collects detailed information about what happened on your endpoint, to create a forensics database. Define the following to enable collection and collection time intervals for the following entity types:</p><ul><li>Process Execution</li><li>File Access</li><li>Persistence</li><li>Command History</li><li>Network</li><li>Remote Access</li><li>Search Collections</li></ul><p>Data collected by the agent is displayed on the tenant's Forensics page.</p> Distributed Network Scan <ul><li>Enabled</li><li>Disabled</li></ul><div data-gb-custom-block data-tag="hint" data-style="info" class="hint hint-info"><p>Note</p><p>To enable access to these options, scroll down to Network Location Configuration, and set Action Mode to Enabled.</p></div> <p>When enabled, the Cortex XDR agent scans your network using Ping or Nmap to provide updated identifiers of your unmanaged network assets. Ping scans return the IP address, MAC address, Hostname, and Platform, whereas Nmap will scan the most common ports for the IP address, Hostname, Platform, and OS version.</p><p>Ping is a lighter scan, that generates icmp requests to peers and does not use external tools. Nmap will make more noise on the network, but the resulting can be better, and also supports operating system detection.</p><p>Ping scans are performed in 30 minute intervals. Nmap scans are performed in 60 minute intervals.</p><p>The scan is performed according to the subnets detected in each network interface found on the endpoint, and up to a maximum of ~1K IP addresses calculated according to agent_ip/22. For example, an agent with the IP address 121.121.121.121 will be assigned the scan range: 121.121.120.1 - 121.121.123.254 (1024 addresses). Each agent is assigned scan ranges randomly from all the scannable subnets, so the same agent can scan multiple subnets.</p><p>The following criteria affect the scan:</p><ul><li>There must be at least two endpoints detected in order to assign a scan.</li><li>Network Location Configuration must be enabled.</li><li>Subnet masking settings and service name configurations influence the scan.</li><li>Excluded IP address ranges are not scanned.</li></ul><p>1. In the Network Location Configuration section, set the Action Mode to Enabled.</p><p>2. In the Distributed Network Scan section, set the Action Mode to Enabled.</p><p>3. In Scan Mode, select Nmap or Ping.</p><div data-gb-custom-block data-tag="hint" data-style="info" class="hint hint-info"><p>Note</p><p>When using Nmap, the Cortex XDR agent downloads an Nmap driver for the duration of the scan and removes the driver upon completion. If an Nmap scan is in process, Cortex XSIAM identifies the Nmap driver and places any additional scans in a queue.</p></div><p>The scan is performed according to the subnets detected in each network interface found on the endpoint.</p><p>4. If you want to exclude IP address ranges, select Excluded IP Address Ranges. The IP address ranges are populated from your network configurations.</p><p>5. If you selected Nmap, enable or disable OS Fingerprinting of the IP address.</p><p>Depending on the type of scan you defined, the agent Ping scan takes 30 minutes, and Nmap takes 60 minutes. Following each scan, Cortex XDR aggregates the IP addresses that were collected, and displays the results in the Asset Management table.</p> -
Configure XDR Cloud for hosts running on cloud platforms. By default (auto-detect mode), the agent detects whether an endpoint is a cloud-based (container) installation or a permanent installation, and uses license allocation accordingly.
Item Options More details XDR Cloud <ul><li>Auto-detect</li><li>Enabled</li></ul> If you set this to Enabled in the profile, any agent using this profile will be treated as if it is a cloud-based agent for licensing purposes. -
Configure Response Actions for specific applications or processes, using an Allow list.
If you need to isolate an endpoint, but want to allow access for a specific application or process, add it to the Network Isolation Allow List. Keep the following considerations in mind:
- When you add a specific application to your allow list from network isolation, the Cortex XDR agent continues to block some internal system processes. This is because some applications, for example, ping.exe, can use other processes to facilitate network communication. As a result, if the Cortex XDR agent continues to block an application you included in your allow list, you may need to perform additional network monitoring to determine the process that facilitates the communication, and then add that process to the allow list.
- For VDI sessions, use of the network isolation response action can disrupt communication with the VDI host management system, thereby stopping access to the VDI session. Therefore, before using the response action, you must add the VDI processes and corresponding IP addresses to your allow list.
- Click Add to add an entry to the allow list.
- Specify the Process Path that you want to allow, and the IPv4 or IPv6 address of the endpoint. Use the
*wildcard on either side to match any process or IP address. For example, specify*as the process path and an IP address to allow any process to run on the isolated endpoint with that IP address. Conversely, specify*as the IP address and a specific process path to allow the process to run on any isolated endpoint that receives this profile. - Click the check mark.
-
Configure Backup Management to back up endpoint data.
Item Options More details Shadowcopy Activation <ul><li>Enabled</li><li>Disabled</li></ul> When enabled, the Cortex XDR agent automatically turns on the system protection of the endpoint. This ensures that the data is backed up and may be recovered in cases of any security breaches or loss of data. Disk Space Limitation Disk space in MB Limits the amount of disk space in MB that can be used for endpoint data backup. -
Configure the method used to update content on your endpoints.
Warning
If you disable or delay automatic content updates provided by Palo Alto Networks, it may affect the security level in your organization.
Note
- If you disable content updates for a newly installed agent, the agent retrieves the content for the first time from Cortex XSIAM, and then disables content updates on the endpoint.
- When you add a Cortex XDR agent to an endpoint group with a disabled content auto-upgrades policy, the policy is applied to the added agent as well.
Item Options More details Content Auto-update <ul><li>Enabled</li><li>Disabled (default)</li></ul> <p>By default, the Cortex XDR agent always retrieves the most updated content and deploys it on the endpoint, to ensure that it is always protected with the latest security measures.</p><p>If you disable content updates, the agent stops retrieving them from the Cortex XSIAM tenant, and keeps working with the current content on the endpoint.</p> Content Staging <ul><li>Enabled</li><li>Disabled (default)</li></ul> Enable users to deploy agent staging content on selected test environments. Staging content is released before production content, allowing for early evaluation of the latest content update. Content Rollout <ul><li>Immediately</li><li>Delayed</li></ul> The Cortex XDR agent can retrieve content updates immediately as they are available, or after a pre-configured delay period. When you delay content updates, the Cortex XDR agent will retrieve the content according to the configured delay. For example, if you configure a delay period of two days, the agent will not use any content released in the last 48 hours. -
Agent Auto-Upgrade is disabled by default. Before enabling Auto-Update for Cortex XDR agents, make sure to consult with all relevant stakeholders in your organization.
Note
Automatic upgrades are not supported with non-persistent VDI and temporary sessions.
Item Options More details Agent Auto-Upgrade <ul><li>Enabled</li><li>Disabled (Default)</li></ul> Automatic Upgrade Scope <ul><li>Latest agent release</li><li>One release before the latest one</li><li>Only maintenance releases</li><li>Only maintenance releases in a specific version</li></ul> <p>For One release before the latest one, Cortex XSIAM upgrades the agent to the previous release before the latest, including maintenance releases. Major releases are numbered X.X, such as release 8.0, or 8.2. Maintenance releases are numbered X.X.X, such as release 8.2.2.</p><p>For Only maintenance releases in a specific version, select the required release version.</p> Upgrade Rollout <ul><li>Immediate</li><li>Delayed</li></ul> <p>For Delayed, set the delay period (number of days) to wait after the version release before upgrading endpoints. Choose a value between 7 and 45.</p><p>To control the number of parallel upgrades in your network, configure Global Agent Settings.</p><div data-gb-custom-block data-tag="hint" data-style="info" class="hint hint-info"><p>Note</p><p>The delay timer starts from the date of the target agent version's availability in the tenant.</p></div> Scheduling <ul><li>Hours</li><li>Days of the week</li></ul> Schedule the upgrade task for a specific time and days of the week. -
Specify a Download Source, or multiple sources, from which the Cortex XDR agent retrieves agent and content updates. The options provided help you to reduce external network bandwidth loads during updates. When all sources are selected, the download sources are prioritized in the following order: P2P > Broker VM > Cortex XSIAM Server.
To ensure your agents remain protected, the Cortex Server download source is always enabled to allow all Cortex XDR agents in your network to retrieve the content directly from the Cortex XSIAM server on their next heartbeat.
Note
Limitations in the content download process:
- When you install the Cortex XDR agent, the agent retrieves the latest content update version available. A freshly installed agent can take between five and ten minutes (depending on your network and content update settings) to retrieve the content for the first time. During this time, your endpoint is not protected.
- When you upgrade a Cortex XDR agent to a newer Cortex XDR agent version, if the new agent cannot use the content version running on the endpoint, the new content update will start within one minute in P2P and within five minutes from Cortex XSIAM.
Item Options More details Select all <ul><li>Selected</li><li>Clear</li></ul> When selected, all download source options are enabled. P2P <ul><li>33221 (default port)</li><li>custom port</li></ul> <p>Cortex XSIAM deploys serverless peer-to-peer distribution to Cortex XDR agents in your LAN network by default. Within the six hour randomization window during which the Cortex XDR agent attempts to retrieve the new version, it will broadcast its peer agents on the same subnet twice: once within the first hour, and once again during the following five hours. If the agent did not retrieve the files from other agents in both queries, it will proceed to the next download source defined in your profile.</p><p>To enable P2P, you must enable UDP and TCP over the port specified for P2P Port. By default, Cortex XSIAM uses port 33221. You can change the port number, if required by your organization.</p> Broker VM <ul><li>Select all</li><li>Brokers</li><li>Clusters</li></ul><p>(only Broker VMs that are connected and configured for caching can be selected)</p> <p>(Requires Broker VM 12.0 and later)</p><p>If you have a Palo Alto Networks Broker VM in your network, you can leverage the Local Agent Settings applet to cache release upgrades and content updates. When the Broker VM is enabled and configured appropriately (refer to Activate Local Agent Settings) , it retrieves the latest installers and content files every 15 minutes, downloading them only if they are not already stored locally. The Broker VM stores this content for 7 days and agent installers for up to 30 days from the agent's last request.</p><p>If the files are not available on the Broker VM at the time of the request, the agent proceeds to download the files directly from the Cortex XSIAM server.</p><p>When you select multiple Broker VMs, the agent chooses a Broker VM randomly for each download request.</p> -
Configure Network Location Configuration for your Cortex XDR agents. If you configure host firewall rules in your network, you must:
- Enable Network Location Configuration Action Mode, so that Cortex XSIAM can test the network location of your device.
- Configure your network's DNS name and its internal IP address.
If the Cortex XDR agent detects a network change on the endpoint, the agent triggers the device location test and re-calculates the policy according to the new location.
Item Options More details Action Mode <ul><li>Enabled</li><li>Disabled</li></ul> When Enabled, a domain controller (DC) test checks whether the device is connected to the internal network or not. If the device is connected to the internal network, it is determined to be in the organization. If the DC test fails or returns an external domain, Cortex XSIAM performs a DNS connectivity test. DNS Name Your network's DNS name The Cortex XDR agent tests network location by submitting a Domain Name Server (DNS) name that is known only to the internal network. If the DNS returns the pre-configured internal IP address, the device is determined to be within the organization. If the DNS IP address cannot be resolved, the device is deemed to be located elsewhere. IP Address Your network's DNS internal IP address Enter the internal DNS IP address to be used by the DNS test. -
Define Agent Proxy Settings.
Select whether to Enable or Disable Direct Server Access for the agent when connected using a proxy.
-
Configure Agent Certificates. For improved security, enforce the use of root CA that is provided by Palo Alto Networks rather than on the local machine.
Item Options More details Certificate Enforcement <ul><li>Enabled</li><li>Disabled</li><li>Disabled (Notify)</li></ul> <p>When enabled, certificate enforcement is enabled.</p><div data-gb-custom-block data-tag="hint" data-style="info" class="hint hint-info"><p>Note</p><p>If the Cortex XDR agent is initially unable to communicate without the local store, enforcement is not enabled and the agent will show as partially protected.</p></div><p>When set to Disabled (Notify), Cortex XDR agents with this policy will trigger a banner in the server to notify customers about potential risk, and will direct them to change the certificate and the setting. The Last Certificate Enforcement Fallback column of the All Endpoints table is updated, and management audit logs related to the local store fallback are received by the server.</p><p>When set to Disabled, Cortex XDR agents with this policy will trigger a banner in the server to notify customers about potential risk, and will direct them to change the certificate and the setting. The Last Certificate Enforcement Fallback column of the All Endpoints table is not updated, and no management audit logs related to the local store fallback are received by the server.</p> -
Configure IT Metrics, to define settings for collecting IT metrics on the endpoint.
Item Options More details Collect IT Data <ul><li>Enabled</li><li>Disabled</li></ul> When enabled, the Cortex XDR agent collects IT data that provides visibility into IT performance on the agent. -
Configure Data Generation Providers to define data generation provider types from which endpoints collect data. By default, all data generation provider types are enabled. We do not recommend disabling data generation providers unless really necessary, because it has an impact on the security coverage of your endpoints. Consult with Customer Support before you disable any of these options.
Item Options More details Disable Specific Data Generation Providers <ul><li>Data Generation Module</li><li>Event Log Provider</li><li>System Call Provider</li><li>Remote Procedure Call Provider</li><li>.NET Provider</li><li>Device Driver IO Control Provider</li></ul> To disable data collection from specific data generation provider types, select one or more options. If you select Data Generation Module, all provider types are disabled. -
Configure Agentic Endpoint Security (AES) to secure the non-binary endpoint attack surface, including AI agents, AI coding tools, MCP servers, IDE extensions, browser plugins, and code packages such as npm and pip. The Cortex XDR agent discovers agentic software running on the endpoint and remediates risks based on your AES policy. To learn more, or for information about AES policies, discovered agentic software, and remediating findings, see Agentic Endpoint Security with Koi.
License Type
Requires the Agentic Endpoint Security (AES) add-on license. AES is supported on Platform XDR and XSIAM tenants only (legacy tenants are not supported).
Note
You configure this setting per platform. AES is supported on Windows and Mac endpoints only.
Item Options More Details AES run-mode <p>Disabled (default)
AES only
XDR + AES</p><p>Configure the integration run-mode for the AES module in Cortex XDR. The run-mode determines how the Cortex XDR agent operates on the endpoint. Changes take effect on each endpoint at its next check-in.
Disabled (default). AES is not active on the endpoint. If you change the run-mode from an active state (AES only or XDR + AES) to Disabled, the Cortex XDR agent runs the AES uninstall scripts on next check-in to remove AES-related persistent data and local artifacts from the endpoint. AES data already collected and sent to your AES tenant is retained on the AES side and is not affected by the endpoint cleanup.
AES only. The endpoint runs a lightweight agent configuration that provides only AES functionality plus agent management functions such as heartbeats, policy and content updates, and upgrades. No event collection or prevention modules run in this mode. The tray icon and Check-in option remain available, but the Cortex XDR agent Console UI is disabled on AES-only endpoints. Agent version downgrade is not supported from AES-only mode (mode changes back to XDR + AES or Disabled are supported).
XDR + AES. The endpoint runs the full Cortex XDR agent with all XDR protection modules, plus the AES module for agentic endpoint security. Cortex XDR anti-tampering protection covers the AES scripts along with the rest of the agent. Use this run-mode on endpoints that need both endpoint protection and AES.
You can switch between the three run-modes at any time by re-editing the Agent Settings profile and re-applying the policy. Switching from AES only to XDR + AES or from XDR + AES to AES only preserves AES data on the endpoint; only switching to Disabled (or uninstalling the Cortex XDR agent) removes it.
To restore the default value, select Use Default (Disabled).</p> - To save the profile, click Create.
What to do next
If you are ready to apply your new profile to endpoints, you do this by adding it to a policy rule. If you still need to define other profiles, you can do this later. During policy rule creation or editing, you select the endpoints to which to assign the policy. There are different ways of doing this, such as:
macOS
- Add a new profile and define basic settings.
-
Select Inventory → Endpoints → Policy Management → Prevention → Profiles. Click +Add Profile, and select whether to create a new profile or import a profile from a file.
Note
New profiles based on imported profiles are added, and do not replace existing ones.
- Select the macOS platform, and Agent Settings as the profile type.
- Click Next.
- Enter a unique Profile Name for the profile. The name can contain only letters, numbers, or spaces, and must be no more than 30 characters. The name will be visible from the list of profiles when you configure a policy rule.
- For Description, to provide additional context for the purpose or business reason for creating the profile, enter a profile description. For example, you might include a case identification number or a link to a help desk ticket.
-
- For Disk Quota, configure the amount of disk space to allot for Cortex XDR agent logs. Specify a value in MB from 100 to 10,000 (default is 5,000).
-
Configure the User Interface options for Cortex XSIAM.
By default, Cortex XSIAM uses the settings specified in the default agent settings profile and displays the default configuration in parentheses. When you select a setting other than the default, you override the default configuration for the profile.
Item Options More details Tray Icon <ul><li>Visible (default)</li><li>Hidden</li></ul> Choose whether you want the Cortex XDR agent icon to be Visible or Hidden in the notification area (system tray). XDR Agent Console Access <ul><li>Enabled</li><li>Disabled</li></ul> When enabled, allows access to Cortex XSIAM. XDR Agent User Notifications <ul><li>Enabled</li><li>Disabled</li></ul> <p>Enable this option to operate display notifications in the notifications area on the endpoint. When you enable notifications, you can use the default notification messages that are displayed for each option, or provide custom text for each notification type. You can also customize a notification footer. Options include:</p><ul><li><p>Device Control Violation Notifications</p><div data-gb-custom-block data-tag="hint" data-style="info" class="hint hint-info"><p>Note</p><p>Disabling Device Control Violation notifications is only supported on endpoints running Cortex XDR agent version 8.6 and above.</p></div></li><li><p>Live Terminal User Notifications: You can select to Request end-user permission to start the session. If the end user denies the request, you will not be able to initiate a Live Terminal session on the endpoint.</p><p>You can select to Request end-user permission to start the session. If the end user denies the request, you will not be able to initiate a Live Terminal session on the endpoint.</p></li><li>Live Terminal Active Session Indication: Enable this option to display a blinking light ( ) on the status bar for the duration of the remote session to indicate to the end user that a Live Terminal session is in progress.</li><li>Persistent Isolation Notification</li><li>Endpoint Network Isolation Notification</li><li>Endpoint Network Un-Isolation Notification</li><li>Blocked Connectivity Notification</li><li>Exploit/Malware Events Set to Block</li><li>Restriction Events Set to Block</li><li>Restriction Events Set to Notify User</li><li>Notification Footer Text</li><li>USB Device Was Blocked</li><li><p>USB Disk Drive Was Allowed in Read-Only Mode</p><div data-gb-custom-block data-tag="hint" data-style="info" class="hint hint-info"><p>Note</p><p>You can enable the option to maintain a persistent notification regarding the disconnection of the endpoint from the network. The settings Persistent Isolation Notification and Blocked Connectivity Notification must be enabled. Until the threat on the endpoint has been removed, the endpoint remains disconnected from the network.</p></div></li></ul> -
For Agent Security, configure XDR Agent Tampering Protection (default is Enabled). By default, the Cortex XDR agent protects all agent components.
Note
If you choose the Enabled option, you must also set Anti Tampering Protection in the malware security profile to Block, and ensure that both profiles are assigned to the same endpoints.
Note
When protection is enabled, access to services, processes, files, and registry values will be read-only.
-
For Uninstall Password, configure an uninstall password.
Define and confirm an encrypted password that the user must specify to uninstall the Cortex XDR agent. The uninstall password, also known as the supervisor password, is also used to protect against tampering attempts via Cytool commands. The password must contain:
- 8 to 32 characters
- At least one of each of the following:
- Lower-case letter
- Upper-case letter
- Number
- Special character: !@#%
-
Configure Issues Data collection options.
When the Cortex XDR agent generates issues for process-related activity on the endpoint, the agent collects the contents of memory and other data about the event, in what is known as an issue data dump file. You can configure the Cortex XDR agent to automatically upload issue data dump files to Cortex XSIAM.
Item Options More details Issue Data Dump File Size <ul><li>Small</li><li>Medium</li><li>Full</li></ul> The Full option creates the largest and most complete set of information. Automatically Upload Issue Data Dump File <ul><li>Enabled</li><li>Disabled</li></ul> During event investigation, if automatic upload was disabled, you can still manually retrieve this data. -
Notice
Requires a Cortex XDR Pro per Endpoint license. When you enable this feature, a Cortex XDR Pro per Endpoint license is consumed.
Enable XDR Pro Endpoint Capabilities, and then configure the capabilities required by your organization. The Cortex XDR Pro features are hidden until you enable this option.
Item Options More details Monitor and Collect Enhanced Endpoint Data <ul><li>Enabled</li><li>Disabled</li></ul> By default, the Cortex XDR agent collects information about events that occur on the endpoint. If you enable Behavioral Threat Protection in a Malware security profile, the Cortex XDR agent also collects information about all active file, process, network, and registry activity on an endpoint. When you enable the Cortex XDR agent to monitor and collect enhanced endpoint data, Cortex XSIAM shares the detailed endpoint information with other Cortex apps. The information can help to provide the endpoint context when a security event occurs, so that you can gain insight into the overall event scope during an investigation. The event scope includes all activities that took place during an attack, the endpoints that were involved, and the damage caused. When disabled, the Cortex XDR agent will not share endpoint activity logs. Enable Host Insights Capabilities <ul><li>Enabled</li><li>Disabled</li></ul> <div data-gb-custom-block data-tag="hint" data-style="info" class="hint hint-info"><p>Notice</p><p>Requires Host Insights add-on.</p></div><p>When enabled, the various host insight capabilities can be configured.</p> Endpoint Information Collection <ul><li>Enabled</li><li>Disabled</li></ul> When enabled, the Cortex XDR agent collects Host Inventory information such as users, groups, services, drivers, hardware, and network shares, as well as information about applications installed on the endpoint, including CVE and installed KBs for Vulnerability Assessment. File Search and Destroy Action Mode <ul><li>Enabled</li><li>Disabled</li></ul> <p>When enabled, the Cortex XDR agent collects detailed information about files on the endpoint to create a files inventory database. The agent locally monitors any actions performed on these files and updates the local files inventory database in real-time.</p><p>With this option you can also select the File Search and Destroy Monitored File Types where Cortex XSIAM monitors all the files on the endpoint, or only common file types. If you choose Common file types, Cortex XSIAM monitors the following file types:</p><p> acm, apk, ax, bat, bin, bundle, csv, dll, dmg, doc, docm, docx, dylib, efi, hta, jar, js, jse, jsf, lua, mpp, mppx, mui, o, ocx, pdf, pkg, pl, plx, pps, ppsm, ppsx, ppt, pptm, pptx, py, pyc, pyo, rb, rtf, scr, sh, vds, vsd, wsf, xls, xlsm, xlsx, xsdx,andzip.</p><p>Additionally, you can exclude files that exist under a specific local path on the endpoint from inclusion in the files database.</p>Monitor and Collect Forensics Data <ul><li>Enabled</li><li>Disabled</li></ul> <div data-gb-custom-block data-tag="hint" data-style="info" class="hint hint-info"><p>Notice</p><p>Requires Forensics Add-on.</p></div><p>When enabled, the Cortex XDR agent collects detailed information about what happened on your endpoint, to create a forensics database. Define the following to enable collection and collection time intervals for the following entity types:</p><ul><li>Process Execution</li><li>File Access</li><li>Persistence</li><li>Command History</li><li>Network</li><li>Search Collections</li></ul><p>Data collected by the agent is displayed on the tenant's Forensics page.</p> -
Configure XDR Cloud for hosts running on cloud platforms. By default (auto-detect mode), the agent detects whether an endpoint is a cloud-based (container) installation or a permanent installation, and uses license allocation accordingly.
Item Options More details XDR Cloud <ul><li>Auto-detect</li><li>Enabled</li></ul> If you set this to Enabled in the profile, any agent using this profile will be treated as if it is a cloud-based agent for licensing purposes. -
Configure Response Actions for specific applications or processes, using an Allow list.
If you need to isolate an endpoint, but want to allow access for a specific application or process, add it to the Network Isolation Allow List. Keep the following considerations in mind:
When you add a specific application to your allow list from network isolation, the Cortex XDR agent continues to block some internal system processes. This is because some applications, for example, ping.exe, can use other processes to facilitate network communication. As a result, if the Cortex XDR agent continues to block an application you included in your allow list, you may need to perform additional network monitoring to determine the process that facilitates the communication, and then add that process to the allow list.
- Click Add to add an entry to the allow list.
- Specify the Process Path that you want to allow, and the IPv4 or IPv6 address of the endpoint. Use the
*wildcard on either side to match any process or IP address. For example, specify*as the process path and an IP address to allow any process to run on the isolated endpoint with that IP address. Conversely, specify*as the IP address and a specific process path to allow the process to run on any isolated endpoint that receives this profile. - Click the check mark.
-
Configure Backup Management.
Item Options More details Time Machine Activation <ul><li>Enabled</li><li>Disabled</li></ul> When enabled, this option automatically turns on the Time Machine setting of the endpoint. This ensures that the data is backed up and may be recovered in cases of any security breaches or loss of data. -
Configure the method used to update content on your endpoints.
Warning
If you disable or delay automatic content updates provided by Palo Alto Networks, it may affect the security level in your organization.
Note
If you disable content updates for a newly installed agent, the agent retrieves the content for the first time from Cortex XSIAM, and then disables content updates on the endpoint.
Item Options More details Content Auto-update <ul><li>Enabled (default)</li><li>Disabled</li></ul> <p>By default, the Cortex XDR agent always retrieves the most updated content and deploys it on the endpoint, to ensure that it is always protected with the latest security measures.</p><p>If you disable content updates, the agent stops retrieving them from the Cortex XSIAM tenant, and keeps working with the current content on the endpoint.</p> Staging Content <ul><li>Enabled</li><li>Disabled (default)</li></ul> Enable users to deploy agent staging content on selected test environments. Staging content is released before production content, allowing for early evaluation of the latest content update. Content Rollout <ul><li>Immediately</li><li>Delayed</li></ul> The Cortex XDR agent can retrieve content updates immediately as they are available, or after a pre-configured delay period. When you delay content updates, the Cortex XDR agent will retrieve the content according to the configured delay. For example, if you configure a delay period of two days, the agent will not use any content released in the last 48 hours. -
Agent Auto-Upgrade is disabled by default. Before enabling Auto-Update for Cortex XDR agents, make sure to consult with all relevant stakeholders in your organization.
Note
Automatic upgrades are not supported with non-persistent VDI and temporary sessions.
When a Cortex XDR agent is added to an endpoint group, it inherits the group's policy, including the disabled content auto-upgrades setting.
Item Options More details Agent Auto-Upgrade <ul><li>Enabled</li><li>Disabled (Default)</li></ul> Automatic Upgrade Scope <ul><li>Latest agent release</li><li>One release before the latest one</li><li>Only maintenance releases</li><li>Only maintenance releases in a specific version</li></ul> <p>For One release before the latest one, Cortex XSIAM upgrades the agent to the previous release before the latest, including maintenance releases. Major releases are numbered X.X, such as release 8.0, or 8.2. Maintenance releases are numbered X.X.X, such as release 8.2.2.</p><p>For Only maintenance releases in a specific version, select the required release version.</p> Upgrade Rollout <ul><li>Immediate</li><li>Delayed</li></ul> <p>For Delayed, set the delay period (number of days) to wait after the version release before upgrading endpoints. Choose a value between 7 and 45.</p><p>To control the agent auto upgrade scheduler and number of parallel upgrades in your network, configure Global Agent Settings.</p><div data-gb-custom-block data-tag="hint" data-style="info" class="hint hint-info"><p>Note</p><p>The delay timer starts from the date of the target agent version's availability in the tenant.</p></div> Scheduling <ul><li>Hours</li><li>Days</li><li>Weeks</li></ul> Schedule the upgrade task for a specific time and days of the week. -
Specify a Download Source, or multiple sources, from which the Cortex XDR agent retrieves agent and content updates. The options provided help you to reduce external network bandwidth loads during updates. When all sources are selected, the download sources are prioritized in the following order: P2P > Broker VM > Cortex XSIAM Server.
To ensure your agents remain protected, the Cortex Server download source is always enabled to allow all Cortex XDR agents in your network to retrieve the content directly from the Cortex XSIAM server on their next heartbeat.
Note
Limitations in the content download process:
- When you install the Cortex XDR agent, the agent retrieves the latest content update version available. A freshly installed agent can take between five and ten minutes (depending on your network and content update settings) to retrieve the content for the first time. During this time, your endpoint is not protected.
- When you upgrade a Cortex XDR agent to a newer Cortex XDR agent version, if the new agent cannot use the content version running on the endpoint, the new content update will start within one minute in P2P and within five minutes from Cortex XSIAM.
Item Options More details Select all <ul><li>Selected</li><li>Clear</li></ul> When selected, all download source options are enabled. P2P <ul><li>33221 (default port)</li><li>custom port</li></ul> <p>Cortex XSIAM deploys serverless peer-to-peer distribution to Cortex XDR agents in your LAN network by default. Within the six hour randomization window during which the Cortex XDR agent attempts to retrieve the new version, it will broadcast its peer agents on the same subnet twice: once within the first hour, and once again during the following five hours. If the agent did not retrieve the files from other agents in both queries, it will proceed to the next download source defined in your profile.</p><p>To enable P2P, you must enable UDP and TCP over the port specified for P2P Port. By default, Cortex XSIAM uses port 33221. You can change the port number, if required by your organization.</p> Broker VM <ul><li>Select all</li><li>Brokers</li><li>Clusters</li></ul><p>(only Broker VMs that are connected and configured for caching can be selected)</p> <p>(Requires Broker VM 12.0 and later)</p><p>If you have a Palo Alto Networks Broker VM in your network, you can leverage the Local Agent Settings applet to cache release upgrades and content updates. When the Broker VM is enabled and configured appropriately (refer to Activate the Local Agent Settings) , it retrieves the latest installers and content every 6 hours. The Broker VM stores them for a 24-hour retention period since an agent last asked for them.</p><p>If the files are not available on the Broker VM at the time of the request, the agent proceeds to download the files directly from the Cortex XSIAM server.</p><p>When you select multiple Broker VMs, the agent chooses a Broker VM randomly for each download request.</p> -
Configure Network Location Configuration for your Cortex XDR agents. If you configure host firewall rules in your network, you must:
- Enable Network Location Configuration Action Mode, so that Cortex XSIAM can test the network location of your device.
- Configure your network's DNS name and its internal IP address.
If the Cortex XDR agent detects a network change on the endpoint, the agent triggers the device location test and re-calculates the policy according to the new location.
Item Options More details Action Mode <ul><li>Enabled</li><li>Disabled</li></ul> When Enabled, a domain controller (DC) test checks whether the device is connected to the internal network or not. If the device is connected to the internal network, it is determined to be in the organization. If the DC test fails or returns an external domain, Cortex XSIAM performs a DNS connectivity test. DNS Name Your network's DNS name The Cortex XDR agent tests network location by submitting a Domain Name Server (DNS) name that is known only to the internal network. If the DNS returns the pre-configured internal IP address, the device is determined to be within the organization. If the DNS IP address cannot be resolved, the device is deemed to be located elsewhere. IP Address Your network's DNS internal IP address Enter the internal DNS IP address to be used by the DNS test. -
Define Agent Proxy Settings.
Select whether to Enable or Disable Direct Server Access for the agent when connected using a proxy.
-
Configure Agent Certificates. For improved security, enforce the use of the root CA that is provided by Palo Alto Networks rather than on the local machine.
Item Options More details Certificate Enforcement <ul><li>Enabled</li><li>Disabled</li><li>Disabled (Notify)</li></ul> <p>When enabled, certificate enforcement is enabled.</p><div data-gb-custom-block data-tag="hint" data-style="info" class="hint hint-info"><p>Note</p><p>If the Cortex XDR agent is initially unable to communicate without the local store, enforcement is not enabled and the agent will show as partially protected.</p></div><p>When set to Disabled (Notify), Cortex XDR agents with this policy will trigger a banner in the server to notify customers about potential risk, and will direct them to change the certificate and the setting. The Last Certificate Enforcement Fallback column of the All Endpoints table is updated, and management audit logs related to the local store fallback are received by the server.</p><p>When set to Disabled, Cortex XDR agents with this policy will trigger a banner in the server to notify customers about potential risk, and will direct them to change the certificate and the setting. The Last Certificate Enforcement Fallback column of the All Endpoints table is not updated, and no management audit logs related to the local store fallback are received by the server.</p> -
Configure Agentic Endpoint Security (AES) to secure the non-binary endpoint attack surface, including AI agents, AI coding tools, MCP servers, IDE extensions, browser plugins, and code packages such as npm and pip. The Cortex XDR agent discovers agentic software running on the endpoint and remediates risks based on your AES policy. To learn more, or for information about AES policies, discovered agentic software, and remediating findings, see Agentic Endpoint Security with Koi.
License Type
Requires the Agentic Endpoint Security (AES) add-on license. AES is supported on Platform XDR and XSIAM tenants only (legacy tenants are not supported).
Note
You configure this setting per platform. AES is supported on Windows and Mac endpoints only.
Item Options More Details AES run-mode <p>Disabled (default)
AES only
XDR + AES</p><p>Configure the integration run-mode for the AES module in Cortex XDR. The run-mode determines how the Cortex XDR agent operates on the endpoint. Changes take effect on each endpoint at its next check-in.
Disabled (default). AES is not active on the endpoint. If you change the run-mode from an active state (AES only or XDR + AES) to Disabled, the Cortex XDR agent runs the AES uninstall scripts on next check-in to remove AES-related persistent data and local artifacts from the endpoint. AES data already collected and sent to your AES tenant is retained on the AES side and is not affected by the endpoint cleanup.
AES only. The endpoint runs a lightweight agent configuration that provides only AES functionality plus agent management functions such as heartbeats, policy and content updates, and upgrades. No event collection or prevention modules run in this mode. The tray icon and Check-in option remain available, but the Cortex XDR agent Console UI is disabled on AES-only endpoints. Agent version downgrade is not supported from AES-only mode (mode changes back to XDR + AES or Disabled are supported).
XDR + AES. The endpoint runs the full Cortex XDR agent with all XDR protection modules, plus the AES module for agentic endpoint security. Cortex XDR anti-tampering protection covers the AES scripts along with the rest of the agent. Use this run-mode on endpoints that need both endpoint protection and AES.
You can switch between the three run-modes at any time by re-editing the Agent Settings profile and re-applying the policy. Switching from AES only to XDR + AES or from XDR + AES to AES only preserves AES data on the endpoint; only switching to Disabled (or uninstalling the Cortex XDR agent) removes it.
To restore the default value, select Use Default (Disabled).</p> - To save the profile, click Create.
What to do next
If you are ready to apply your new profile to endpoints, you do this by adding it to a policy rule. If you still need to define other profiles, you can do this later. During policy rule creation or editing, you select the endpoints to which to assign the policy. There are different ways of doing this, such as:
Linux
- Add a new profile and define basic settings.
-
Select Inventory → Endpoints → Policy Management → Prevention → Profiles. Click +Add Profile, and select whether to create a new profile or import a profile from a file.
Note
New profiles based on imported profiles are added, and do not replace existing ones.
- Select the Linux platform, and Agent Settings as the profile type.
- Click Next.
- Enter a unique Profile Name for the profile. The name can contain only letters, numbers, or spaces, and must be no more than 30 characters. The name will be visible from the list of profiles when you configure a policy rule.
- For Description, to provide additional context for the purpose or business reason for creating the profile, enter a profile description. For example, you might include a case identification number or a link to a help desk ticket.
-
- For Disk Quota, configure the amount of disk space to allot for Cortex XDR agent logs. Specify a value in MB from 100 to 10,000 (default is 5,000).
-
Configure Issues Data collection options.
When the Cortex XDR agent generates issues for process-related activity on the endpoint, the agent collects the contents of memory and other data about the event, in what is known as an issue data dump file. You can configure the Cortex XDR agent to automatically upload issue data dump files to Cortex XSIAM.
Item Options More details Issue Data Dump File Size <ul><li>Small</li><li>Medium</li><li>Full</li></ul> The Full option creates the largest and most complete set of information. Automatically Upload Issue Data Dump File <ul><li>Enabled</li><li>Disabled</li></ul> During event investigation, if automatic upload was disabled, you can still manually retrieve this data. -
Notice
Requires a Cortex XDR Pro per Endpoint license. When you enable this feature, a Cortex XDR Pro per Endpoint license is consumed.
Enable XDR Pro Endpoint Capabilities, and then configure the capabilities required by your organization. The Cortex XDR Pro features are hidden until you enable this option.
Item Options More details Monitor and Collect Enhanced Endpoint Data <ul><li>Enabled</li><li>Disabled</li></ul> By default, the Cortex XDR agent collects information about events that occur on the endpoint. If you enable Behavioral Threat Protection in a Malware security profile, the Cortex XDR agent also collects information about all active file, process, network, and registry activity on an endpoint. When you enable the Cortex XDR agent to monitor and collect enhanced endpoint data, Cortex XSIAM shares the detailed endpoint information with other Cortex apps. The information can help to provide the endpoint context when a security event occurs, so that you can gain insight into the overall event scope during an investigation. The event scope includes all activities that took place during an attack, the endpoints that were involved, and the damage caused. When disabled, the Cortex XDR agent will not share endpoint activity logs. Enable Host Insights Capabilities <ul><li>Enabled</li><li>Disabled</li></ul> <div data-gb-custom-block data-tag="hint" data-style="info" class="hint hint-info"><p>Notice</p><p>Requires Host Insights add-on</p></div><p>When enabled, the various host insight capabilities can be configured.</p> Endpoint Information Collection <ul><li>Enabled</li><li>Disabled</li></ul> When enabled, the Cortex XDR agent collects Host Inventory information such as users, groups, services, drivers, hardware, and network shares, as well as information about applications installed on the endpoint, including CVE and installed KBs for Vulnerability Assessment. Enable Compliance Collection <ul><li>Enabled</li><li>Disabled</li></ul> -
Configure XDR Cloud for hosts running on cloud platforms. By default (auto-detect mode), the agent detects whether an endpoint is a cloud-based (container) installation or a permanent installation, and uses license allocation accordingly.
Item Options More details XDR Cloud <ul><li>Auto-detect</li><li>Enabled</li></ul> If you set this to Enabled in the profile, any agent using this profile will be treated as if it is a cloud-based agent for licensing purposes. -
Configure Response Actions for specific applications or processes, using an Allow list.
If you need to isolate an endpoint, but want to allow access for a specific application or process, add it to the Network Isolation Allow List. Keep the following considerations in mind:
- When you add a specific application to your allow list from network isolation, the Cortex XDR agent continues to block some internal system processes. This is because some applications, for example, ping.exe, can use other processes to facilitate network communication. As a result, if the Cortex XDR agent continues to block an application you included in your allow list, you may need to perform additional network monitoring to determine the process that facilitates the communication, and then add that process to the allow list.
- Click Add to add an entry to the allow list.
- Specify the Process Path that you want to allow, and the IPv4 or IPv6 address of the endpoint. Use the
*wildcard on either side to match any process or IP address. For example, specify*as the process path and an IP address to allow any process to run on the isolated endpoint with that IP address. Conversely, specify*as the IP address and a specific process path to allow the process to run on any isolated endpoint that receives this profile. - Click the check mark.
- Configure settings to automatically Revert Endpoint Isolation of an agent. When this feature is enabled, agent isolation will be cancelled when a connection with the managing server is lost for the defined continuous period of time.
- Either keep the recommended default setting (Enabled), or change it by selecting Disabled in the Revert Isolation field.
- Set a time unit and enter the number of hours or days. We recommend 24 hours (default).
-
Configure the method used to update content on your endpoints.
Warning
If you disable or delay automatic content updates provided by Palo Alto Networks, it may affect the security level in your organization.
Note
- If you disable content updates for a newly installed agent, the agent retrieves the content for the first time from Cortex XSIAM, and then disables content updates on the endpoint.
- When you add a Cortex XDR agent to an endpoint group with a disabled content auto-upgrades policy, the policy is applied to the added agent as well.
Item Options More details Content Auto-update <ul><li>Enabled (default)</li><li>Disabled</li></ul> <p>By default, the Cortex XDR agent always retrieves the most updated content and deploys it on the endpoint, to ensure that it is always protected with the latest security measures.</p><p>If you disable content updates, the agent stops retrieving them from the Cortex XSIAM tenant, and keeps working with the current content on the endpoint.</p> Staging Content <ul><li>Enabled</li><li>Disabled (default)</li></ul> Enable users to deploy agent staging content on selected test environments. Staging content is released before production content, allowing for early evaluation of the latest content update. Content Rollout <ul><li>Immediately</li><li>Delayed</li></ul> The Cortex XDR agent can retrieve content updates immediately as they are available, or after a pre-configured delay period. When you delay content updates, the Cortex XDR agent will retrieve the content according to the configured delay. For example, if you configure a delay period of two days, the agent will not use any content released in the last 48 hours. -
Agent Auto-Upgrade is disabled by default. Before enabling Auto-Update for Cortex XDR agents, make sure to consult with all relevant stakeholders in your organization.
Note
Automatic upgrades are not supported with non-persistent VDI and temporary sessions.
Note
Automatic upgrades are not supported for XDR agents running on K8s.
Item Options More details Agent Auto-Upgrade <ul><li>Enabled</li><li>Disabled (Default)</li></ul> Automatic Upgrade Scope <ul><li>Latest agent release</li><li>One release before the latest one</li><li>Only maintenance releases</li><li>Only maintenance releases in a specific version</li></ul> <p>For One release before the latest one, Cortex XSIAM upgrades the agent to the previous release before the latest, including maintenance releases. Major releases are numbered X.X, such as release 8.0, or 8.2. Maintenance releases are numbered X.X.X, such as release 8.2.2.</p><p>For Only maintenance releases in a specific version, select the required release version.</p> Upgrade Rollout <ul><li>Immediate</li><li>Delayed</li></ul> <p>For Delayed, set the delay period (number of days) to wait after the version release before upgrading endpoints. Choose a value between 7 and 45.</p><p>To control the agent auto upgrade scheduler and number of parallel upgrades in your network, configure Global Agent Settings.</p><div data-gb-custom-block data-tag="hint" data-style="info" class="hint hint-info"><p>Note</p><p>The delay timer starts from the date of the target agent version's availability in the tenant.</p></div> -
Specify a Download Source, or multiple sources, from which the Cortex XDR agent retrieves agent and content updates. The options provided help you to reduce external network bandwidth loads during updates. When all sources are selected, the download sources are prioritized in the following order: P2P > Broker VM > Cortex XSIAM Server.
To ensure your agents remain protected, the Cortex Server download source is always enabled to allow all Cortex XDR agents in your network to retrieve the content directly from the Cortex XSIAM server on their next heartbeat.
Note
Limitations in the content download process:
- When you install the Cortex XDR agent, the agent retrieves the latest content update version available. A freshly installed agent can take between five and ten minutes (depending on your network and content update settings) to retrieve the content for the first time. During this time, your endpoint is not protected.
- When you upgrade a Cortex XDR agent to a newer Cortex XDR agent version, if the new agent cannot use the content version running on the endpoint, the new content update will start within one minute in P2P and within five minutes from Cortex XSIAM.
Item Options More details Select all <ul><li>Selected</li><li>Clear</li></ul> When selected, all download source options are enabled. P2P <ul><li>33221 (default port)</li><li>custom port</li></ul> <p>Cortex XSIAM deploys serverless peer-to-peer distribution to Cortex XDR agents in your LAN network by default. Within the six hour randomization window during which the Cortex XDR agent attempts to retrieve the new version, it will broadcast its peer agents on the same subnet twice: once within the first hour, and once again during the following five hours. If the agent did not retrieve the files from other agents in both queries, it will proceed to the next download source defined in your profile.</p><p>To enable P2P, you must enable UDP and TCP over the port specified for P2P Port. By default, Cortex XSIAM uses port 33221. You can change the port number, if required by your organization.</p> Broker VM <ul><li>Select all</li><li>Brokers</li><li>Clusters</li></ul><p>(only Broker VMs that are connected and configured for caching can be selected)</p> <p>(Requires Broker VM 12.0 and later)</p><p>If you have a Palo Alto Networks Broker VM in your network, you can leverage the Local Agent Settings applet to cache release upgrades and content updates. When the Broker VM is enabled and configured appropriately (refer to Activate the Local Agent Settings) , it retrieves the latest installers and content every 6 hours. The Broker VM stores them for a 24-hour retention period since an agent last asked for them.</p><p>If the files are not available on the Broker VM at the time of the request, the agent proceeds to download the files directly from the Cortex XSIAM server.</p><p>When you select multiple Broker VMs, the agent chooses a Broker VM randomly for each download request.</p> -
Define Agent Proxy Settings.
Select whether to Enable or Disable Direct Server Access for the agent when connected using a proxy.
-
Configure Advanced Vulnerability Scanning for periodic Active Vulnerability Analysis (AVA) scans. This option is only available for tenants that are paired with Prisma Cloud.
Item Options More details Advanced Vulnerability Scanning <ul><li>Enabled</li><li>Disabled</li></ul> Periodic Scan <ul><li>24 Hours</li><li>Custom</li></ul> <p>For the default setting, select 24 Hours.</p><p>For other time frames, select Custom, and then configure the desired time frame. Where relevant, select the start day and time for the periodic scans. If you select monthly scans, you can also configure a timeout period, in hours.</p> -
Configure Agent Operation Mode. Three modes of operation exist:
- Kernel module-based operation, offering synchronous anti-malware protection, event collection from kernel level, and anti-LPE protection
- User Space Agent: user mode agent, for agents running Linux kernel 5.0.0 or higher, offering synchronous anti-malware and event collection from kernel level
- Neither of the above. When working in Kernel module-based operation running on an endpoint with an unsupported kernel, or installing with the installation flag
--no-km, or when working in User Space Agent mode on a Linux kernel older than 5.0.0, the agent will run in Asynchronous mode. In such cases, the anti-malware protection is asynchronous, and there is no event collection, no BTP, no EDR, and no anti-lpe. This operation mode frequently shows "partially protected" endpoints. To avoid this, you can configure the profile to give preference to Kernel mode, but to switch to User Space Agent mode when the kernel module for an endpoint is not supported by a content update, and switch back when the kernel module in use is supported in a newer content update.
Endpoints running the Cortex XDR agent in Kernel mode can now be configured to automatically fall back to User Space Agent mode when a content update does not contain a kernel module for the kernel used by an endpoint.
Item Options More details Mode <ul><li>Kernel</li><li>User Space Agent</li></ul> <p>We recommend using Kernel mode.</p><div data-gb-custom-block data-tag="hint" data-style="warning" class="hint hint-warning"><p>Danger</p><p>User Space Agent mode requires Linux kernel 5.0.0 or higher.</p></div> When Kernel Mode is unavailable, use User Space Mode <ul><li>Enabled</li><li>Disabled</li></ul> <p>When Kernel mode is used, to ensure continued full protection when a kernel version is not supported by a content update, select the Enabled option.</p><div data-gb-custom-block data-tag="hint" data-style="info" class="hint hint-info"><p>Note</p><p>User Space Agent mode requires Linux kernel 5.0.0 or higher. Endpoints running an older Linux kernel version with this fallback enabled, will not start using User Space Agent mode, and will operate asynchronously.</p></div><p>When a newer content update supports the endpoint's kernel module, fallback is canceled, and Kernel mode is automatically resumed.</p> - To save the profile, click Create.
What to do next
If you are ready to apply your new profile to endpoints, you do this by adding it to a policy rule. If you still need to define other profiles, you can do this later. During policy rule creation or editing, you select the endpoints to which to assign the policy. There are different ways of doing this, such as:
Android
- Add a new profile and define basic settings.
- Select Inventory → Endpoints → Policy Management → Prevention → Profiles. Click +Add Profile, and select whether to create a new profile or import a profile from a file.
- Select the Android platform, and Agent Settings as the profile type.
- Click Next.
- For Profile Name, enter a unique name for the profile. The name can contain only letters, numbers, or spaces, and must be no more than 30 characters. The name will be visible from the list of profiles when you configure a policy rule.
- For Description, to provide additional context for the purpose or business reason for creating the profile, enter a profile description. For example, you might include a case identification number or a link to a help desk ticket.
-
Configure the method used to update content on your endpoints.
Warning
If you disable or delay automatic content updates provided by Palo Alto Networks, it may affect the security level in your organization.
Note
- If you disable content updates for a newly installed agent, the agent retrieves the content for the first time from Cortex XSIAM, and then disables content updates on the endpoint.
- When you add a Cortex XDR agent to an endpoint group with a disabled content auto-upgrades policy, the policy is applied to the added agent as well.
Item Options More details Content Auto-update <ul><li>Enabled</li><li>Disabled</li></ul> <p>By default, the Cortex XDR agent always retrieves the most updated content and deploys it on the endpoint, to ensure that it is always protected with the latest security measures.</p><p>If you disable content updates, the agent stops retrieving them from the Cortex XSIAM tenant, and keeps working with the current content on the endpoint.</p> Content Rollout <ul><li>Immediately</li><li>Delayed</li></ul> The Cortex XDR agent can retrieve content updates immediately as they are available, or after a pre-configured delay period. When you delay content updates, the Cortex XDR agent will retrieve the content according to the configured delay. For example, if you configure a delay period of two days, the agent will not use any content released in the last 48 hours. -
Configure network usage preferences.
When the option Upload Using Cellular Data is enabled, the Cortex XDR agent uses cellular data to send unknown apps to the Cortex XSIAM for inspection. Standard data charges may apply. When this option is disabled, the Cortex XDR agent queues any unknown files and sends them when the endpoint connects to a Wi-Fi network. If configured, the data usage setting on the Android endpoint takes precedence over this configuration.
- To save the profile, click Create.
What to do next
If you are ready to apply your new profile to endpoints, you do this by adding it to a policy rule. If you still need to define other profiles, you can do this later. During policy rule creation or editing, you select the endpoints to which to assign the policy. There are different ways of doing this, such as:
iOS
- Add a new profile and define basic settings.
-
Select Inventory → Endpoints → Policy Management → Prevention → Profiles. Click +Add Profile, and select whether to create a new profile or import a profile from a file.
Note
New profiles based on imported profiles are added, and do not replace existing ones.
- Select the iOS platform, and Agent Settings as the profile type.
- Click Next.
- For Profile Name, enter a unique name for the profile. The name can contain only letters, numbers, or spaces, and must be no more than 30 characters. The name will be visible from the list of profiles when you configure a policy rule.
- For Description, to provide additional context for the purpose or business reason for creating the profile, enter a profile description. For example, you might include a case identification number or a link to a help desk ticket.
-
-
Configure the following notifications that can be pushed to the iOS device.
Item Options More details App Notifications <ul><li>Enabled</li><li>Disabled</li></ul> Select whether to enable or disable notifications from the app on the iOS device. Jailbreak Detection <ul><li>Enabled</li><li>Disabled</li></ul> Select whether to enable or disable Jailbreak Detection notification to the device. Restart Recommendation <ul><li>Enabled</li><li>Disabled</li></ul> Select whether to enable or disable a reboot notification to the device. An option can be set for a reminder every number of days. The default is 15 days. Stationary Device Indicators <ul><li>Enabled</li><li>Disabled</li></ul> <p>Select whether to enable or disable notifications for stationary iOS devices, such as iPads that are expected to remain in a fixed location. Options include:</p><ul><li>Significant location change</li><li>Unplugged from power</li><li>Low battery. You can configure a threshold for the device's remaining charge level (10% - 90%).</li><li>Significant network change</li><li>Show Stationary Device indication on its home screen</li></ul> - To save the profile, click Create.
What to do next
If you are ready to apply your new profile to endpoints, you do this by adding it to a policy rule. If you still need to define other profiles, you can do this later. During policy rule creation or editing, you select the endpoints to which to assign the policy. There are different ways of doing this, such as:
Set up restrictions prevention profiles
Restriction prevention profiles limit the locations from which executables can run on an endpoint.
Windows
By default, the Cortex XDR agent receives a default profile that contains a pre-defined configuration for each restriction capability. The default setting for each capability is shown in parentheses in the user interface. To fine-tune your restrictions prevention policy, you can override the default configuration of each capability as follows. For each setting that you override, clear the Use Default option, and select the setting of your choice.
- Block: Block file execution.
- Notify: Allow file execution, but notify the user that the file is attempting to run from a suspicious location. The Cortex XDR agent also reports the event to Cortex XSIAM.
- Report: Allow file execution, but report it to Cortex XSIAM.
- Disabled: Disable the module, and do not analyze or report execution attempts from restricted locations.
To customize the configuration for specific Cortex XDR agents, configure a new restrictions prevention profile and assign it to one or more policy rules. You can restrict files from running from specific local folders, or from removable media.
- Add a new profile and define basic settings.
-
From Cortex XSIAM, select Inventory → Endpoints → Policy Management → Prevention → Profiles. Click +Add Profile, and select whether to create a new profile or import a profile from a file.
Note
New profiles based on imported profiles are added, and do not replace existing ones.
- Select the Windows platform, and Restrictions as the profile type.
- Click Next.
- For Profile Name, enter a unique name for the profile. The name can contain only letters, numbers, or spaces, and must be no more than 30 characters. The name will be visible from the list of profiles when you configure a policy rule.
- For Description, to provide additional context for the purpose or business reason for creating the profile, enter a profile description. For example, you might include a case identification number or a link to a help desk ticket.
-
-
Configure Executable Files to restrict file execution to pre-defined locations.
Item Option More details Action Mode <ul><li>Block</li><li>Notify</li><li>Report</li><li>Disabled</li></ul> <p>When the Cortex XDR agent detects execution of files from outside the pre-defined locations, it performs the configured action.</p><ul><li><p>To add files or folders to the Block List, click +Add, enter the path, and press Enter. To add more files or folders, click +Add again.</p><ul><li>You can use a wildcard to match a partial name for the folder and environment variables.</li><li>Use ?to match any single character, or to match any string of characters.</li><li>To match a folder, you must terminate the path with * to match all files in the folder (for example,c:\temp).</li></ul></li><li>To add files or folders to the Allow List, define a list on the Legacy Agent Exceptions page.</li></ul> -
Configure Network Location Files to restrict access to all network locations except for explicitly trusted ones.
Item Option More details Action Mode <ul><li>Block</li><li>Notify</li><li>Report</li><li>Disabled</li></ul> <p>When the Cortex XDR agent detects execution of files from network locations that are not trusted, it performs the configured action.</p><p>To add files or folders to the Allow List, define a list on the Legacy Agent Exceptions page.</p> -
Configure Removable Media Files to restrict file execution launched from external drives that are attached to endpoints in your network.
Item Option More details Action Mode <ul><li>Block</li><li>Notify</li><li>Report</li><li>Disabled</li></ul> <p>When the Cortex XDR agent detects execution of files from removable media,it performs the configured action.</p><p>To add files or folders to the Allow List, define a list on the Legacy Agent Exceptions page.</p> -
Configure Optical Drive Files to restrict file execution launched from optical disc drives that are attached to endpoints in your network.
Item Option More details Action Mode <ul><li>Block</li><li>Notify</li><li>Report</li><li>Disabled</li></ul> <p>When the Cortex XDR agent detects execution of files from an optical disc drive, it performs the configured action.</p><p>To add files or folders to the Allow List, define a list on the Legacy Agent Exceptions page.</p> -
Configure Custom Prevention Rules.
Item Option More details Action Mode <ul><li>Enabled</li><li>Disabled</li></ul> <p>When user-defined BIOC prevention rules are present in the system, you can enable them here. Ensure that the user-defined BIOC prevention rules that you want to enable only contain the following:</p><p>Investigation types:</p><ul><li>file_event</li><li>process_execution</li><li>remote_code_execution</li><li>network_event</li><li>windows_event_log</li><li>module_event</li></ul><p>Subtypes:</p><ul><li>file_event</li><li>network_event</li><li>registry_event</li><li>windows_event_log</li></ul><p>Other event subtypes are not supported here, and rules containing them will not be available for selection.</p><div data-gb-custom-block data-tag="hint" data-style="info" class="hint hint-info"><p>Note</p><p>Configure custom BIOC prevention rules here:</p><p>Detection & Threat Intel → Detection Rules → BIOC</p></div> -
Configure Custom Indicator Prevention Rules.
If you want to create custom indicator rules for prevention purposes, you enable their use here in the profile, and then create them in the Detection & Threat Intel area of Cortex XSIAM.
Notice
A Threat Intel Management (TIM) license is required for this feature.
Item Option More details Action Mode <ul><li>Enabled</li><li>Disabled</li></ul> <p>When user-defined prevention Indicator Rules are present in the system, you can enable them here.</p><div data-gb-custom-block data-tag="hint" data-style="info" class="hint hint-info"><p>Note</p><p>Configure this as follows:</p><p>1. Prepare this restriction profile first, make a note of its name for later, and set it to Enabled.</p><p>2. Prepare the prevention Indicator Rule (go to Detection & Threat Intel → Indicator Rules, ensuring to select Prevention when creating the rule), and while preparing it, map it to your restriction profile.</p></div> - To save the profile, click Create.
What to do next
If you are ready to apply your new profile to endpoints, you do this by adding it to a policy rule. If you still need to define other profiles, you can do this later. During policy rule creation or editing, you select the endpoints to which to assign the policy. There are different ways of doing this, such as:
macOS
- Add a new profile and define basic settings.
-
From Cortex XSIAM, select Inventory → Endpoints → Policy Management → Prevention → Profiles. Click +Add Profile, and select whether to create a new profile or import a profile from a file.
Note
New profiles based on imported profiles are added, and do not replace existing ones.
- Select the macOS platform, and Restrictions as the profile type.
- Click Next.
- For Profile Name, enter a unique name for the profile. The name can contain only letters, numbers, or spaces, and must be no more than 30 characters. The name will be visible from the list of profiles when you configure a policy rule.
- For Description, to provide additional context for the purpose or business reason for creating the profile, enter a profile description. For example, you might include a case identification number or a link to a help desk ticket.
-
-
Configure Custom Prevention Rules.
Item Option More details Action Mode <ul><li>Enabled</li><li>Disabled</li></ul> <p>When user-defined BIOC prevention rules are present in the system, you can enable them here. Ensure that the user-defined BIOC prevention rules that you want to enable only contain the following:</p><p>Investigation types:</p><ul><li>file_event</li><li>process_execution</li><li>remote_code_execution</li><li>network_event</li><li>windows_event_log</li><li>module_event</li></ul><p>Subtypes:</p><ul><li>file_event</li><li>network_event</li><li>registry_event</li><li>windows_event_log</li></ul><p>Other event subtypes are not supported here, and rules containing them will not be available for selection.</p><div data-gb-custom-block data-tag="hint" data-style="info" class="hint hint-info"><p>Note</p><p>Configure custom BIOC prevention rules here:</p><p>Detection & Threat Intel → Detection Rules → BIOC</p></div> -
Configure Custom Indicator Prevention Rules.
If you want to create custom indicator rules for prevention purposes, you enable their use here in the profile, and then create them in the Detection & Threat Intel area of Cortex XSIAM.
Notice
A Threat Intel Management (TIM) license is required for this feature.
Item Option More details Action Mode <ul><li>Enabled</li><li>Disabled</li></ul> <p>When user-defined prevention Indicator Rules are present in the system, you can enable them here.</p><div data-gb-custom-block data-tag="hint" data-style="info" class="hint hint-info"><p>Note</p><p>Configure this as follows:</p><p>1. Prepare this restriction profile first, make a note of its name for later, and set it to Enabled.</p><p>2. Prepare the prevention Indicator Rule (go to Detection & Threat Intel → Indicator Rules, ensuring to select Prevention when creating the rule), and while preparing it, map it to your restriction profile.</p></div> - To save the profile, click Create.
What to do next
If you are ready to apply your new profile to endpoints, you do this by adding it to a policy rule. If you still need to define other profiles, you can do this later. During policy rule creation or editing, you select the endpoints to which to assign the policy. There are different ways of doing this, such as:
Linux
- Add a new profile and define basic settings.
-
From Cortex XSIAM, select Inventory → Endpoints → Policy Management → Prevention → Profiles. Click +Add Profile, and select whether to create a new profile or import a profile from a file.
Note
New profiles based on imported profiles are added, and do not replace existing ones.
- Select the Linux platform, and Restrictions as the profile type.
- Click Next.
- For Profile Name, enter a unique name for the profile. The name can contain only letters, numbers, or spaces, and must be no more than 30 characters. The name will be visible from the list of profiles when you configure a policy rule.
- For Description, to provide additional context for the purpose or business reason for creating the profile, enter a profile description. For example, you might include a case identification number or a link to a help desk ticket.
-
-
Configure Custom Prevention Rules.
Item Option More details Action Mode <ul><li>Enabled</li><li>Disabled</li></ul> <p>When user-defined BIOC prevention rules are present in the system, you can enable them here. Ensure that the user-defined BIOC prevention rules that you want to enable only contain the following:</p><p>Investigation types:</p><ul><li>file_event</li><li>process_execution</li><li>remote_code_execution</li><li>network_event</li><li>windows_event_log</li><li>module_event</li></ul><p>Subtypes:</p><ul><li>file_event</li><li>network_event</li><li>registry_event</li><li>windows_event_log</li></ul><p>Other event subtypes are not supported here, and rules containing them will not be available for selection.</p><div data-gb-custom-block data-tag="hint" data-style="info" class="hint hint-info"><p>Note</p><p>Configure custom BIOC prevention rules here:</p><p>Detection & Threat Intel → Detection Rules → BIOC</p></div> -
Configure Custom Indicator Prevention Rules.
If you want to create custom indicator rules for prevention purposes, you enable their use here in the profile, and then create them in the Detection & Threat Intel area of Cortex XSIAM.
Notice
A Threat Intel Management (TIM) license is required for this feature.
Item Option More details Action Mode <ul><li>Enabled</li><li>Disabled</li></ul> <p>When user-defined prevention Indicator Rules are present in the system, you can enable them here.</p><div data-gb-custom-block data-tag="hint" data-style="info" class="hint hint-info"><p>Note</p><p>Configure this as follows:</p><p>1. Prepare this restriction profile first, make a note of its name for later, and set it to Enabled.</p><p>2. Prepare the prevention Indicator Rule (go to Detection & Threat Intel → Indicator Rules, ensuring to select Prevention when creating the rule), and while preparing it, map it to your restriction profile.</p></div> - To save the profile, click Create.
What to do next
If you are ready to apply your new profile to endpoints, you do this by adding it to a policy rule. If you still need to define other profiles, you can do this later. During policy rule creation or editing, you select the endpoints to which to assign the policy. There are different ways of doing this, such as:
Serverless Function
The profile configuration for serverless functions provides runtime protection across processes, networking and file type resources in your cloud environment.
The configuration of each of the resources is based on allow/deny lists.
- Denied list (default): The system allows all resources to go through.
- Denied with exceptions: The system allows all resources to go through except those specified in the list.
- Allowed list : The system denies all resources to go through.
- Allowed with exceptions: The system denies all resources to go through except those specified in the list.
- Add a new profile and define basic settings.
-
From Cortex XSIAM, select Inventory → Endpoints → Policy Management → Prevention → Profiles. Click +Add Profile, and select whether to create a new profile or import a profile from a file.
Note
New profiles based on imported profiles are added, and do not replace existing ones.
- Select the Serverless Function platform, and Restrictions as the profile type and then click Next.
- For Profile Name, enter a unique name for the profile. The name can contain only letters, numbers, or spaces, and must be no more than 30 characters. The name will be visible from the list of profiles when you configure a policy rule.
- For Description, to provide additional context for the purpose or business reason for creating the profile, enter a profile description.
-
-
Configure Restrictions.
Item Method Setting details Process List <p>Allowed list</p><p>Denied list</p> <p>Add process</p><p>**Example 137. **null
</p>Networking <p>Allowed list</p><p>Denied list</p> Listing Ports <p>Add ports</p><p>**Example 138. **null
</p>Outbound Internet Ports <p>Add ports</p><p>**Example 139. **null
</p>Outbound IPs <p>Add IPs</p><p>**Example 140. **null
</p>Domains <p>Add domains</p><p>**Example 141. **null
</p>Files & Folders <p>Allowed list</p><p>Denied list</p> <p>Add file paths and/or folders</p><p>**Example 142. **null
</p>
What to do next
If you are ready to apply your new profile to endpoints, you do this by adding it to a policy rule. If you still need to define other profiles, you can do this later. During policy rule creation or editing, you select the endpoints to which to assign the policy. There are different ways of doing this, such as:
Set up exception profiles and rules
Exception profiles override the security policy in scenarios such as:
- Allow a process or a file to run on an endpoint
- Allow a known digital signer
- Allow access to specific URLs (via Safari) or telephone numbers
- Disable a specific behavioral threat protection (BTP) rule
- Import exceptions from the Cortex XSIAM support team
Add a legacy exception rule for endpoints
Legacy Exception rules enable you to configure an exception to prevention and protection modules on endpoints for selected profiles.
Items included in allow lists may continue to generate Cortex XSIAM security events. If you want to exclude event reporting, configure this on the Issue Exclusions page (Settings → Exception Configurations → Issue Exclusions).
Keep in mind the following:
- Prior to Cortex XSIAM version 1.3, legacy exceptions were configured through profiles.
- Starting with version 1.3, Cortex XSIAM enables you to manage the malware security exceptions from a central location and easily apply them across multiple profiles in the Legacy Agent Exceptions Management page.
To manage the prevention profile exceptions from Exception Configuration, you must first migrate your existing exceptions configured via the prevention profiles.
Your migrated rules are displayed on the Settings → Exception Configurations → Legacy Agent Exceptions page. For more information about the migration, see Exception configuration.
- Select Settings → Exception Configurations → Legacy Agent Exceptions, and then click + Add Rule.
- Select the platform for which you want to create an agent exception.
-
Select the module for which you want to create an exception. Optionally, select Select all to apply the exception to all profiles for this module or select specific profiles.
Type Module Platform Parameters Malware Respond to Malicious Causality Chains <p>Windows,</p><p>MacOS</p> Add to your allow list specific and known safe IP address or IP address ranges that you do not want Cortex XSIAM to block. Behavioral Threat Protection Windows, MacOS, Linux Add to your allow list the file or folder path you want to exclude from evaluation. Use ? to match a single character or * to match any string of characters. Office Files with Micros Examination Windows Add to your allow list the file or folder path you want to exclude from evaluation. Use ? to match a single character or * to match any string of characters. Portable Executable and DLL Examination Windows Add to your allow list the file or folder path and the signers you want to exclude from evaluation. Use ? to match a single character or * to match any string of characters. Malicious Child Process Protection Windows, MacOS, Linux Add to your allow list the parent processes that can launch child processes to your allow list with optional execution criteria. Specify the allow list criteria including the Parent Process Name, Child Process Name, and Command Line Params. Use ? to match a single character or * to match any string of characters. Endpoint Scanning Windows, MacOS, Linux Add to your allow list the file or folder path and the signers you want to exclude from evaluation. Use ? to match a single character or * to match any string of characters. PDF Examination Windows Add to your allow list the file or folder paths to exclude from evaluation. Use ? to match a single character or * to match any string of characters. Credential Gathering Protection Windows, MacOS, Linux Add to your allow list the file or folder paths to exclude from evaluation. Use ? to match a single character or * to match any string of characters. Anti Webshell Protection Windows, MacOS, Linux Add to your allow list the file or folder paths to exclude from evaluation. Use ? to match a single character or * to match any string of characters. Financial Malware Threat Protection Windows, MacOS, Linux Add to your allow list the file or folder paths to exclude from evaluation. Use ? to match a single character or * to match any string of characters. Cryptominers Protection Windows, MacOS, Linux Add to your allow list the file or folder paths to exclude from evaluation. Use ? to match a single character or * to match any string of characters. In-process Shellcode Protection Windows Add to your allow list the file or folder paths to exclude from evaluation. Use ? to match a single character or * to match any string of characters. Malicious Device Prevention Windows Add to your allow list the file or folder paths to exclude from evaluation. Use ? to match a single character or * to match any string of characters. UAC Bypass Prevention Windows Add to your allow list the file or folder paths to exclude from evaluation. Use ? to match a single character or * to match any string of characters. Anti Tampering Protection Windows, MacOS Add to your allow list the file or folder paths to exclude from evaluation. Use ? to match a single character or * to match any string of characters. UEFI Protection Windows Add to your allow list the file or folder paths to exclude from evaluation. Use ? to match a single character or * to match any string of characters. PowerShell Script Files Windows Add to your allow list the file or folder paths to exclude from evaluation. Use ? to match a single character or * to match any string of characters. Mach-O Execution Examination MacOS Add to your allow list the file or folder paths to exclude from evaluation. Use ? to match a single character or * to match any string of characters. Mach-O Loading Examination MacOS Add to your allow list the file or folder paths to exclude from evaluation. Use ? to match a single character or * to match any string of characters. DMG File Examination MacOS Add to your allow list the file or folder paths to exclude from evaluation. Use ? to match a single character or * to match any string of characters. Local File Threat Examination Linux Add to your allow list the file or folder paths to exclude from evaluation. Use ? to match a single character or * to match any string of characters. ELF File Examination Linux Add to your allow list the file or folder paths to exclude from evaluation. Use ? to match a single character or * to match any string of characters. Reverse Shell Protection Linux Specify the Process Path. Local IP Address and port, and the Remote IP Address and port of the process you want to allow. Use ? to match a single character or * to match any string of characters. Loaded Kernel Modules Examination Linux <p>Add to your allow list the file or folder paths to exclude from evaluation.Use ? to match a single character or * to match any string of characters.</p><p>Please note that the exception applies to the kernel module, not the process that loads it.</p> APK Files Examination Android Specify the signers you want to exclude from evaluation. Use ? to match a single character or * to match any string of characters. SMS and MMS Malicious URL filtering Allow list iOS Add to your allow list and known safe URLs that you do not want Cortex XSIAM to block. Call and Messages Blocking Allow list iOS Add to your allow list names and phone numbers of contacts that you do not want Cortex XSIAM to block. Dynamic Kernel Protection Windows Add to your allow list the file or folder path you want to exclude from evaluation. Use ? to match a single character or * to match any string of characters. ASP and ASPX File Examination Windows Add to your allow list the file or folder paths to exclude from evaluation. Use ? to match a single character or * to match any string of characters. VB Scripts Examination Windows Add to your allow list the file or folder paths to exclude from evaluation. Use ? to match a single character or * to match any string of characters. JScript File Examination Windows Add to your allow list the file or folder paths to exclude from evaluation. Use ? to match a single character or * to match any string of characters. LDAP Query Protection Windows <p>Add to your allow list specific and known safe IP address or IP address ranges that you do not want Cortex XSIAM to block.</p><p>Add to your allow list users whom you do not want to block.</p> Operational Agent Exceptions Windows <p>Add to your allow list the file or folder paths to exclude from evaluation. Use ? to match a single character or * to match any string of characters.</p><div data-gb-custom-block data-tag="hint" data-style="info" class="hint hint-info"><p>Note</p><p>This exception prevents the agent from examining the specified file. Use with caution, as it may unintentionally allow unwanted or malicious behavior to go undetected.</p></div> Portable executable files (Windows) Linux Add to your allow list the file or folder paths to exclude from evaluation. Use ? to match a single character or * to match any string of characters. Mach-O files (macOS) Linux Add to your allow list the file or folder paths to exclude from evaluation. Use ? to match a single character or * to match any string of characters. Restrictions Executable Files Windows Add to your allow list the file or folder paths to exclude from evaluation. Use ? to match a single character or * to match any string of characters. Network Location Files Windows Add to your allow list the file or folder paths to exclude from evaluation. Use ? to match a single character or * to match any string of characters. Optical Drive Files Windows Add to your allow list the file or folder paths to exclude from evaluation. Use ? to match a single character or * to match any string of characters. Removable Media Files Windows Add to your allow list the file or folder paths to exclude from evaluation. Use ? to match a single character or * to match any string of characters. Exceptions Process Exceptions Windows, MacOS, Linux Add to your allow list the process and the module names to exclude from evaluation. Use ? to match a single character or * to match any string of characters. Operational Agent Exceptions Windows <p>This option excludes any intervention from a given list of processes, which are specified by their full path.</p><p>When you create this exception rule, it will disable the following modules:</p><ul><li>All anti-exploitation modules for the process.</li><li>All anti-malware modules, by disabling triggers such as on-execution, on-load, on-access, on-write, and on-demand.</li><li>Most event collection operations based on tracking the process (some event collection operations might still occur, such as process events).</li></ul><p>Perform these steps:</p><p>1. For Target Properties Process Path, enter the path of the process that you want to exclude, and press ENTER. To add additional processes, repeat this step.</p><p>2. For Scope, select a rule scope.</p><ul><li>Global: Apply this rule to all profiles</li><li>Profiles (existing or new): Apply this rule to a specific profile, or to multiple profiles. You can create a new profile from here, if necessary.</li></ul><p>3. Go to step 6.</p> - For each module, enter the file or folder path that you want to add to the exception rule, and press ENTER. Repeat this step to add additional paths to the rule.
- Select the endpoint profiles to which you want to apply this rule.
- Click Next.
- Review the rule, and then select the warning message checkbox.
- Click Create.
Important
If you don't migrate the legacy exceptions, you can continue to create exceptions through the profiles.
Exception configuration
To allow full granularity, Cortex XSIAM enables you to create exceptions from your baseline policy. With these exceptions, you can remove specific folders or paths from evaluation, or disable specific security modules. You can configure exception rules for Cortex XSIAM protection and prevention actions in a centralized location, and apply them across multiple profiles. The exceptions can be configured from Settings → Exception Configuration.
- Issue Exclusion rules specify match criteria for issues that you want to suppress.
- IOC/BIOC Suppression rules exclude one or more indicators from an IOC or BIOC rule that takes action on specific behaviors.
- Disable Injection and Prevention rules specify exceptions that bypasses a process from prevention modules and injections.
- Disable Prevention rules specify granular exceptions to prevention actions triggered for your endpoints.
- Legacy Agent Exceptions define prevention profile exception rules for all endpoints.
- Support Exception rules generate exceptions based on files provided by the support team.
Cortex XSIAM enables you to manage the Legacy Agent Exceptions and Support Exception configurations from a central location and easily apply them across multiple profiles in the Agent Exceptions Management page.
To manage the Prevention profile exceptions from Exception Configuration, you must first migrate your existing exceptions configured via profiles. Your existing exception profiles are migrated per module.
Cortex XSIAM simulates the migration to enable you to review the results before activating the migration.
How to migrate existing exceptions
- Select Settings → Exception Configuration → Legacy Exceptions and click Start Simulation.
- Review the Legacy Agent Exceptions and the Support Exception Rules.
- You can then Activate the new agent management page or Cancel to continue using the Prevention Profiles to configure individual exceptions.
If you don't migrate the legacy exceptions, you can continue to create exceptions through the profiles.
- Add a new exceptions security profile
- Add a global endpoint policy exception
- Set up exploit prevention profiles
- Set up malware prevention profiles
- Set up restrictions prevention profiles
After the migration, you can Add a support exception rule or Add a legacy exception rule.
Issue exclusions
The Settings → Exception Configuration → Issue Exclusions page displays the issue exclusion rules in Cortex XSIAM.
An Issue Exclusion is a rule that contains a set of issue match criteria for issues that you want to suppress in Cortex XSIAM. You can add an Issue Exclusion rule from scratch, or base the exclusion on issues that you investigate in a case. After you create an exclusion rule, Cortex XSIAM excludes the issues that match the criteria from cases and search query results, and no longer saves any of the matching issues that are generated in the future. If you select to apply the policy to historic results as well as future alerts, Cortex XSIAM displays the historic alerts as unavailable.
Note
- The agent continues to generate excluded issues on the endpoint, but they are not saved or displayed in Cortex XSIAM. Configuration of an issue exclusion does not remove or delete any of the logs that would have triggered the issue notification.
- You can also set up issue exceptions by creating global endpoint policy exceptions. For more information, see Add a global endpoint policy exception.
- Cortex XSIAM supports exclusion of up to 100,000 issues.
The following table describes both the default fields and additional optional fields that you can add to the issue exclusions table, and lists the fields in alphabetical order.
| Field | Description |
|---|---|
 |
Checkbox to select one or more issue exclusions on which you want to perform actions. |
| Backward Scan Status | Exclusion policy status for historic data, either enabled if you want to apply the policy to previous issues, or disabled if you don’t want to apply the policy to previous issues. |
| Comment | Administrator-provided comment that describes the purpose or reason for the exclusion policy. |
| Description | Text summary of the policy that displays the match criteria. |
| Modification Date | Date and time when the exclusion policy was created or modified. |
| Name | Descriptive name provided to identify the exclusion policy. |
| Policy ID | Unique ID assigned to the exclusion policy. |
| Status | Exclusion policy status, either enabled or disabled. |
| User | User that last modified the exclusion policy. |
| User Email | The administrative user's email address. |
Add an issue exclusion rule
Through the process of triaging issues or resolving a case, you may determine that a specific issue does not indicate a threat. If you want Cortex XSIAM to exclude the display of issues that match certain criteria, you can create an issue exclusion rule.
After you create an exclusion rule, Cortex XSIAM hides any future issues that match the criteria, and excludes the issues from cases and search query results. If you choose to apply the rule to historic results as well as future issues, the app marks any historic issues as unavailable.
Note
If a case only contains issues with exclusions, Cortex XSIAM changes the case status to Resolved - False Positive and sends an email notification to the issue assignee (if set).
There are two ways to create an exclusion rule. You can define the exclusion criteria when you investigate a case, or you can create an issue exclusion from scratch.
Note
You can also set up issue exceptions by creating global endpoint policy exceptions. For more information, see Add a global endpoint policy exception.
Issue exclusions support Scope-Based Access Control (SBAC). For more information, see Manage user scope.
The following parameters are considered when editing a rule:
- If Scope-Based Access Control (SBAC) is enabled and Endpoint Scoping Mode is set to restrictive mode, you can edit a rule if you are scoped to all tags in the rule.
- If Scope-Based Access Control (SBAC) is enabled and Endpoint Scoping Mode is set to permissive mode, you can edit a rule if you are scoped to at least one tag listed in the rule.
- If a rule was added when set to restrictive mode, and then changed to permissive (or vice versa), you will only have view permissions.
Build an issue exclusion policy from issues in a case
If after reviewing the case details, you want to suppress one or more issues from appearing in the future, create an exclusion policy based on the issues in the case. When you create a case from the Cases view, you can define the criteria based on the issues in the case. If desired, you can also create an issue exclusion policy from scratch.
- On the Cases page, expand the case, click the case's menu icon and, select Create Exclusion.
- Enter a name for your issue exclusion rule.
- Describe the reason or purpose of the rule.
-
Use the issue filters to add any match criteria for the issue exclusion policy.
You can also right-click a specific value in the issue to add it as match criteria. The app refreshes, to show you which issues in the case will be excluded. To see all matching issues, including those not related to the case, clear the option to Show only issues in the named case.
-
Click Create to create the exclusion rule and confirm the action.
If you need to make changes later, you can view, modify, or delete the exclusion rule from the Settings → Exception Configuration → Issue Exclusions page.
Build an issue exclusion rule from scratch
Build your own issue exclusion rule.
- Select Settings → Exception Configuration → Issue Exclusions.
- Select + Add an Issue Exclusion Rule.
- Enter a name for your issue exclusion rule.
- Describe the reason or purpose of the rule.
-
Define the exclusion criteria.
- Use the filters at the top of the table to build your exclusion criteria.
- Use existing issue values to populate your exclusion criteria. To do so, right-click the column value on which you want to base your rule, and select Add issues with <value> to configuration.
As you define the criteria, the app filters the results to display matches.
-
Review the results.
The issues in the table will be excluded from appearing in the app after the rule is created, and optionally, any existing issue matches will be displayed as unavailable.
Caution
This action is irreversible. All historically excluded issues will remain excluded if you disable or delete the rule.
- Click Create to create the issue exception rule.
Add an IOC or BIOC rule exception
If you want to create a rule to take action on specific behaviors but also want to exclude one or more indicators from the rule, you can create an IOC or BIOC rule exception. An indicator can include the SHA256 hash of a process, process name, process path, vendor name, user name, causality group owner (CGO) full path, or process command-line arguments. For more information about these indicators, see What are detection rules?. For each exception, you also specify the rule scope to which the exception applies.
In case you need to map fields returned in an XQL process query to your exception configuration, the following table provides a matrix for the criteria mentioned in this procedure to the fields returned in a process query.
| IOC/BIOC suppression rule conditions | Process query result fields |
|---|---|
| Process Sha256 | actor_process_image_sha256 |
| Process Name | actor_process_image_name |
| Process Path | actor_process_image_path |
| Signed By Vendor | actor_process_signature_vendor |
| User Name | actor_effective_username |
| Cgo Full Path | actor_process_command_line |
| Process Cmd | causality_actor_process_image_path |
Note
Cortex XSIAM only supports exceptions with one attribute. See Add an issue exclusion rule to create advanced exceptions based on your filtered criteria.
- Select Settings → Exceptions Configuration → IOC/BIOC Suppression Rules.
- Click + New Exception.
- Specify a rule name and an optional description.
-
Configure the indicators and conditions that define the exception.
You can use wildcards to match the command line.
-
Select the scope of the exception, whether the exception applies to IOCs, BIOCs, or both.
By default, all BIOC rules that match the criteria are excluded. To exclude only specific BIOC rules, select them from the provided rule list. You can add multiple rules.
-
Save the exception rule.
By default, activity matching the indicators does not trigger any rule. As an alternative, you can select one or more rules. After you save the exception, the Exceptions count for the rule increments. If you edit the rule later, you will also see the exception defined in the rule summary.
Export a rule exception
You can choose to export a BIOC rule exception.
- Select Settings → Exceptions Configuration → IOC/BIOC Suppression Rules.
- In the Exceptions table, locate the exception rule you want to export. You can select multiple rules.
-
Right-click the rule or rules, and select Export.
If one or more of the selected exceptions are applied to a specific BIOC rule, select one of the following options:
- Export anyway
- Export only non-specific Exceptions: Only export exceptions are applied on all BIOC rules
- Export all Exceptions as non-specific: Export and apply specific exceptions to BIOC rules
Add a disable prevention rule for endpoints
You can create granular exceptions to prevention actions defined for your endpoints. In your disable prevention rules, you can specify hash types, file/folder paths, signers, certificate thumbprint, command line, or processes to exclude from the prevention actions triggered by specific security modules. These rules may be useful when you have processes that are essential to your organization, and must not be terminated. To cover all your endpoints, you can configure different exception rules per platform. Cortex XSIAM still generates issues from the disabled rules.
Important
- All applicable prevention actions are skipped for the files and process that match the properties defined in the rule.
- Consider the consequences of disabling a prevention rule before you add the exception, and monitor it over time.
- You can only apply a Disable Prevention Rule to endpoints running Cortex XDR agents version 7.9 and later.
- Go to Settings → Exception Configuration → Disable Prevention Rules.
- Click +Add Rule.
- For Rule Name, enter a meaningful name for the rule.
- (Optional) Enter a description for the business reason or intent for the rule.
- Click Next.
- For Platform, select the operating system that you require.
-
Under Target Properties, you can configure any combination of parameters. If a parameter is not specified, all values are allowed.
When you specify two or more values, the exception is applied only if the file satisfies all the specified target properties.
You can use wildcards for matching the Command Line or Files/Folders path.
- Hash: enter a specific SHA256 hash
- Files/Folders: specify the path to the required files or folders
- Command Line: specify a command line argument
- Signer Name: specify a trusted signer
- Certificate Thumbprint: specify a certificate thumbprint
-
For Modules, select one or more security modules that won't trigger prevention actions.
The actions triggered by the other modules are not affected.
- For Scope, select the scope for the rule:
- If you want to apply the rule to all endpoints, select Global (all endpoints).
- If you want to apply the rule to only specific exception profiles, click Exception Profiles, and then select them from the list.
- Click Next.
- Review the configurations for the exception, and if the risks are acceptable to you, select I understand the risk, and then click Create.
Add a disable injection and prevention rule
You can generate a temporary exception to bypass a process from prevention modules and injections. You can specify paths, or command line, from both prevention and injection. This may be useful when you have processes that are essential to your organization and must not be terminated. Cortex XSIAM still generates issues from data collections.
Important
- Exceptions are limited up to 48 hours.
- Consider the consequences of disabling a prevention rule before you add the exception and monitor it over time.
- You can only apply a Disable Prevention Rule to agents version 7.9 and later.
- Select Settings → Exception Configuration → Disable Injection and Prevention.
- Click +Add Injection Rule.
- Specify a rule name and an optional description.
- Select the platform. To cover all your endpoints, you can prevent different exception rules per platform.
- Add the Process Name , and specify the Path to bypass.
- Select the time limit for the exception rule.
- Select the Scope for the rule. If you want to apply the rule to only specific Exception Profiles, select them from the list.
- Enable the rule.
- Click Yes, to confirm that you acknowledge that the selected rules will be disabled.
Add a support exception rule for endpoints
You can define and manage exceptions based on files received from the customer support team. You can apply the rule across all of your endpoints or to specific profiles.
Keep in mind the following:
- Prior to Cortex XSIAM version 1.3, support exceptions were configured through profiles.
- Starting with version 1.3, Cortex XSIAM enables you to manage the support exceptions from a central location and easily apply them across multiple profiles on the Support Exception Rules page.
To manage the prevention profile exceptions from Exception Configuration, you must first migrate your existing exceptions configured via the Prevention profiles.
Your migrated rules are displayed on the Settings → Exception Configurations → Support Exception Rules page. For more information about the migration, see Exception configuration.
- From Settings → Exception Configuration → Support Exception Rules, click + Import from file.
- Locate the JSON file you received from the customer support team.
- Select to apply the rule to specific Profiles or select Global to apply to all endpoints.
Important
If you don't migrate the legacy exceptions, you can continue to create exceptions through the profiles.
Add a legacy exception rule for endpoints
Legacy Exception rules enable you to configure an exception to prevention and protection modules on endpoints for selected profiles.
Items included in allow lists may continue to generate Cortex XSIAM security events. If you want to exclude event reporting, configure this on the Issue Exclusions page (Settings → Exception Configurations → Issue Exclusions).
Keep in mind the following:
- Prior to Cortex XSIAM version 1.3, legacy exceptions were configured through profiles.
- Starting with version 1.3, Cortex XSIAM enables you to manage the malware security exceptions from a central location and easily apply them across multiple profiles in the Legacy Agent Exceptions Management page.
To manage the prevention profile exceptions from Exception Configuration, you must first migrate your existing exceptions configured via the prevention profiles.
Your migrated rules are displayed on the Settings → Exception Configurations → Legacy Agent Exceptions page. For more information about the migration, see Exception configuration.
- Select Settings → Exception Configurations → Legacy Agent Exceptions, and then click + Add Rule.
- Select the platform for which you want to create an agent exception.
- Select the module for which you want to create an exception. Optionally, select Select all to apply the exception to all profiles for this module or select specific profiles.
- For each module, enter the file or folder path that you want to add to the exception rule, and press ENTER. Repeat this step to add additional paths to the rule.
- Select the endpoint profiles to which you want to apply this rule.
- Click Next.
- Review the rule, and then select the warning message checkbox.
- Click Create.
Important
If you don't migrate the legacy exceptions, you can continue to create exceptions through the profiles.
Add a new exceptions security profile
You can configure exceptions that apply to specific groups of endpoints or you can add a global endpoint policy exception.
Important
Starting with version 1.3, Cortex XSIAM enables you to manage the exception security rules from a central location and easily apply them across multiple profiles in the Legacy Agent Exceptions management page.
To manage the exceptions from Exception Configuration, you must first migrate your existing exceptions configured via the exceptions security profiles.
To create new exception security profile rules using the Legacy Agent Exceptions management page, see Add a legacy exception rule for endpoints.
If you don't migrate the legacy exceptions, you can continue to create exceptions as described below.
How to create an endpoint-specific exception
- Add a new profile.
-
From Cortex XSIAM, select Inventory → Endpoints → Policy Management → Prevention → Profiles → +Add Profile and select whether to Create New or Import from File a new profile.
Note
New imported profiles are added and not replaced.
- Select the platform to which the profile applies and Exceptions as the profile type.
- Click Next.
-
- Define the basic settings.
- Select a unique Profile Name to identify the profile. The name can contain only letters, numbers, or spaces, and must be no more than 30 characters. The name will be visible from the list of profiles when you configure a policy rule.
- To provide additional context for the purpose or business reason for creating the profile, specify a profile Description. For example, you might include a case identification number or a link to a help desk ticket.
- Configure the exceptions profile.
Configure a process exception
- Select the operating system.
- Enter the process name.
- Select the endpoint protection modules that allow the process to run.
- Select All to apply the exception across all security modules.
- Select Disable Injection to apply the exception across these exploit modules: APC Guard, CPL Execution Protection, DEP, DLL Hijacking Protection, DLL Security, EPM D02, Exception Heap Spray Check, Exception SysExist Check, Exploit Kit Fingerprinting Protection, Font Protection, Hot Patch Protection, JIT Mitigation, Library Preallocation, Memory Limit Heap Spray Check, Null Dereference Protection, Password Theft Protection, ROP Mitigation, SEH Protection, Shellcode Preallocation, and UASLR.
- Click the adjacent arrow.
- After adding all processes, select Create.
You can later edit these settings from the Process Execution profile.
Configure a support exception
- Import the JSON file from Palo Alto Networks Support. Browse for it or drag it onto the page.
- Click Create.
Configure module-specific exceptions for the selected profile platform
- Behavioral Threat Protection Rule Exception: Right-click a Behavioral Threat alert and select Create alert exception. Review the platform and rule name. Select CGO hash, CGO signer, CGO process path, or CGO command arguments as needed. Select Profile from Exception Scope, then click Create.
- Digital Signer Exception: Right-click a Digital Signer Restriction issue and select Create issue exception. Set Exception Scope to Profile, select the exception profile name, then click Add.
- Java Deserialization Exception: Right-click a benign Suspicious Input Deserialization issue and select Create issue exception. Set Exception Scope to Profile, select the exception profile name, then click Add.
- Local File Threat Examination Exception: Right-click a PHP file issue and select Create issue exception. Set Exception Scope to Profile, select the exception profile name, then click Add.
- Gatekeeper Enhancement Exception: Right-click the issue and select Create issue exception. Set Exception Scope to Profile, select the exception profile name, then click Add. This keeps enforcement active for other child processes.
At any point, click the Generating Issue ID to return to the issue that generated the exception. You cannot edit module-specific exceptions.
-
Apply profiles to endpoints.
To remove an exceptions profile, go to the Profiles page, right-click the profile, then select Delete.
Add a global endpoint policy exception
Learn how to define and manage global endpoint policy exceptions in Cortex XSIAM.
As an alternative to endpoint-specific policy exceptions, define global exceptions for all endpoints. On the Global Exceptions page, manage organization-wide exceptions for every platform. Profiles assigned to targets outside your user scope are locked.
Important
- Starting with version 1.3, manage Global Endpoint Policy exceptions centrally in Legacy Agent Exceptions management.
- Before managing prevention profile exceptions from Exception Configuration, migrate existing global exceptions.
- Migrated rules appear in Settings → Exception Configurations → Legacy Agent Exceptions. See Exception configuration.
- To create new global endpoint policy exceptions from Legacy Agent Exceptions, see Add a legacy exception rule for endpoints.
- If you do not migrate legacy exceptions, continue adding exceptions as described here.
Add a global process exception
Configure centralized exception rules for Cortex XSIAM protection and prevention actions.
- Go to Inventory → Endpoints → Policy Management → Policy Exceptions.
- Select Process exceptions.
- Select the operating system.
- Enter the process name.
- Select the endpoint protection modules that allow the process to run. The list contains modules relevant to the selected operating system.
- Select All to apply the exception to all security modules.
- Select Disable Injection to apply the exception to all exploit security modules.
- Click the adjacent arrow to add the exception.
- After adding all exceptions, select Save.
The new exception applies across all rules and policies. To edit or delete it, select the exception and click the relevant icon.
Add a global support exception
Configure centralized support exception rules for Cortex XSIAM protection and prevention actions.
- Go to Inventory → Endpoints → Prevention → Global Exceptions.
- Select Support Exceptions. Import the JSON file from Palo Alto Networks Support. Browse for the file or drag and drop it onto the page.
- Click Save.
The new support exception applies across all rules and policies.
Add a behavioral threat protection rule exception
Create a global exception for a Behavioral Threat rule you want to allow.
- Right-click the BTP issue and select Create issue exception.
- Review the platform and rule name. Choose the required exception criteria.
- From Scope, select Global or select a profile.
- Click Create.
The exception applies across all rules and policies. Click Generating Issue ID to return to the source issue. To delete an exception, select it and click X.
You cannot edit global exceptions generated from BTP security events.
Use recommended exception criteria
Use Cortex XSIAM recommended fields to define precise exception criteria.
-
Select the criterion that triggered the alert.
Select only one criterion per alert. Create a separate exception for each additional criterion.
- Select one or more displayed parameters relevant to the exception.
-
Edit an editable parameter if needed.
Select at least one parameter. Cortex XSIAM validates entered values. Wildcards are supported, but use specific values. Some parameters are not editable.
Use CGO information
Select CGO attributes to define general exception criteria:
- CGO hash: Causality Group Owner (CGO) hash value.
- CGO signer: CGO signer entity. Available for Windows and Mac only.
- CGO process path: Directory path of the CGO process.
- CGO command arguments: Available only with CGO process path and Cortex XDR Agent 7.5 or later. Check each relevant command argument's full path in quotation marks. Edit displayed paths if needed.
Add a global credential gathering protection exception
- Right-click the Credential Gathering Protection issue and select Create issue exception.
- Review the platform and module name. Select the required options:
- CGO hash: Causality Group Owner hash value.
- CGO signer: CGO signer entity. Available for Windows and Mac only.
- CGO process path: Directory path of the CGO process.
- CGO command arguments: Available only with CGO process path. Check each relevant command argument's full path in quotation marks. Edit displayed paths if needed.
- From Exception Scope, select Global.
- Click Create.
The exception applies across all rules and policies. Click Generating Issue ID to return to the source issue. To delete it, select it and click X.
You cannot edit global exceptions generated from Credential Gathering Protection security events.
Add a global anti webshell protection exception
- Right-click the Anti Webshell Protection issue and select Create issue exception.
- Review the platform and module name. Select CGO hash, CGO signer, CGO process path, or CGO command arguments as needed. Command arguments require CGO process path and Cortex XDR Agent 7.5 or later. From Exception Scope, select Global.
- Click Create.
The exception applies across all rules and policies. Click Generating Issue ID to return to the source issue. To delete it, select it and click X.
You cannot edit global exceptions generated from Anti Webshell Protection security events.
Add a global local analysis rules exception
- Right-click the Local Analysis issue and select Create issue exception.
- Review the platform and rule name, then set Exception Scope to Global.
- Click Add.
The exception applies across all rules and policies. It allows every rule that triggered the issue. You cannot allow only selected rules. Click Generating Issue ID to return to the source issue. To delete the exception, select it and click X. You cannot edit exceptions generated from local analysis security events.
Review advanced analysis exceptions
Advanced Analysis provides secondary validation for exploit protection issues. Cortex XSIAM analyzes issue data sent by the Cortex XDR agent. When an issue is benign, Cortex XSIAM can automatically create exceptions and distribute updated policy to endpoints.
Enable automatic Advanced Analysis exceptions in Settings → Configurations → General → Agent Configurations.
Each exception displays the platform, exception name, and relevant issue ID. Click Generating Issue ID to view issue details.
Add a global digital signer exception
- Right-click a trusted Digital Signer Restriction issue and select Create issue exception.
- Review the platform, signer, and issue ID. Set Exception Scope to Global.
- Click Add.
The exception applies across all rules and policies. Click Generating Issue ID to return to the source issue. To delete it, select it and click X. You cannot edit exceptions generated from Digital Signer Restriction security events.
Add a global Java deserialization exception
- Right-click a Suspicious Input Desensitization issue and select Create issue exception.
- Review the platform, process, Java executable, and issue ID. Set Exception Scope to Global.
- Click Add.
The exception applies across all rules and policies. Click Generating Issue ID to return to the source issue. To delete it, select it and click X. You cannot edit exceptions generated from Java deserialization security events.
Add a global local file threat examination exception
- Right-click a Local Threat Detected issue for a PHP file and select Create issue exception.
- Review the process, path, and hash. Set Exception Scope to Global.
- Click Add.
The PHP file exception applies across all rules and policies. Click Generating Issue ID to return to the source issue. To delete it, select it and click X. You cannot edit exceptions generated from local file threat examination security events.
Add a global Gatekeeper Enhancement exception
Create an exception for a specific bundle or source-child combination. Gatekeeper Enhancement remains active for other child processes.
- Right-click the Gatekeeper Enhancement issue and select Create issue exception.
- Review the platform, source process, target process, and issue ID. Set Exception Scope to Global.
- Click Add.
The source and target process exception applies across all rules and policies. Click Generating Issue ID to return to the source issue. To delete it, select it and click X. You cannot edit exceptions generated from Gatekeeper Enhancement security events.
Import and export exceptions
Select + Import/Export to export the exceptions list or import exceptions from a file.
Exported files use Base64 encoding and cannot be edited.
Set up Identity profiles
Prerequisites
- Requires the ITDR add-on.
- Available only as a Windows profile.
The Identity Profile centralizes identity security policies for Domain Controllers. It supports consistent security controls across your environment. After configuration, this profile must be mapped to policies for Domain Controller endpoints.
Note
Identity Profile requires Cortex XSIAM 3.5, Cortex XDR 5.1, or Cortex Cloud Runtime 2.1 or later. It also requires Cortex XDR agent 9.1 or later. It is unavailable for Cortex XSIAM 2.x and Cortex XDR 3.x tenants.
Policies can contain an Identity Profile in mixed-agent environments. Agents earlier than version 9.1 ignore these settings.
To customize settings for specific agents, create an Identity Profile and assign it to policy rules for Domain Controller endpoints.
- Add a profile and define its basic settings.
-
Go to Inventory → Endpoints → Policy Management → Prevention → Profiles. Select + Add Profile, then select whether to create or import a profile.
Imported profiles are added. They do not replace existing profiles.
- Select the Windows platform and Identity profile type.
- Click Next.
- Enter a unique Profile Name. Use only letters, numbers, or spaces. Names must contain 30 characters or fewer.
- Add a Description with the profile's purpose or business reason. For example, include a case ID or help desk ticket link.
-
-
Use the toggle to enable or disable AD-SPM.\
Use Active Directory Security Posture Management to monitor Active Directory for risky account configurations, weak or compromised passwords, unused accounts, and excessive privileges. Use Weak Password to identify weak passwords used in Active Directory and define the scan frequency.When enabled, both Weak Password and AD-SPM are both enabled.
-
Use the toggle to enable or disable Conditional Access. When enabled, configure these options:
Item Options More details Silent Logging Mode OnOffWhen set to On, you can observe the impact of this profile before enforcing policies. Service Availability Fail-Mode Allow AccessBlock AccessDefines global system behavior when the entire Conditional Access service is unavailable and rule evaluation is impossible. Allow Access minimizes disruption and helps prevent user lockout. Block Access maximizes security. Conditional Access Policy — Open the Identity Access Rules page to view or change current Conditional Access policies. -
Configure LDAP Protection to analyze and act on suspicious LDAP queries sent to Domain Controllers. This feature detects and blocks Active Directory reconnaissance attacks. Use the toggle to enable or disable it.
LDAP Protection takes effect after an agent restart.
Item Options More details Action Mode Block, Report, Disabled The Cortex XDR agent performs this action when it detects suspicious Domain Controller queries. Monitor and Collect Domain Controller LDAP Events Enabled, Disabled When enabled, the agent collects LDAP query information and creates events for investigating suspicious queries. - Click Create to save the profile.
What to do next
Apply the new profile by adding it to a policy rule. You can also define other profiles first. Policy rules let you select the endpoints that receive the policy.
Create a policy rule from the Prevention Profiles page
- Go to Inventory → Endpoints → Policy Management → Prevention → Profiles.
- Right-click the new profile and select Create a new policy rule using this profile.
- Configure the policy rule.
Edit an existing policy rule from the Policy Rules page
- Go to Inventory → Endpoints → Policy Management → Prevention → Policy Rules.
- Right-click an existing policy and select Edit.
- Add the new profile to the policy rule.
Create a new policy rule from the Policy Rules page
- Go to Inventory → Endpoints → Policy Management → Prevention → Policy Rules.
- Click Add Policy.
- Configure a policy that includes the new profile.
Define endpoint groups
You can define an endpoint group and then apply policy rules and manage specific endpoints. If you set up Cloud Identity Engine, you can also leverage your Active Directory user, group, and computer details to define endpoint groups.
Do one of the following:
- Create a dynamic group by enabling Cortex XSIAM to populate your endpoint group dynamically using endpoint characteristics, such as an endpoint tag, partial hostname or alias, full or partial domain or workgroup name, IP address, range or subnets, installation type (VDI, temporary session or standard endpoint), agent version, endpoint type (workstation, server, mobile), user or operating system version.
- Create a static group by selecting a list of specific endpoints.
Note
Configuration based on user granular policy is optimized for VDI and session-persistent environments; it is not recommended for decentralized or traditional endpoint architectures.
After you define an endpoint group, you can then use it to target policy and actions to specific recipients. The Endpoint Groups page displays all endpoint groups along with the number of endpoints and policy rules linked to the endpoint group.
How to define an endpoint group
- Select Inventory → Endpoints → Groups → +Add Group.
- Select one of the following:
- Create New to create an endpoint group from scratch
- Upload From File using plain text files with a new line separator, to populate a static endpoint group from a file containing IP addresses, hostnames, or aliases.
- Enter a Group Name and optional description to identify the endpoint group. The name you assign to the group will be visible when you assign endpoint security profiles to endpoints.
-
Determine the endpoint properties for creating an endpoint group:
- Dynamic: Use the filters to define the criteria you want to use to dynamically populate an endpoint group. Dynamic groups support multiple criteria selections and can use AND or OR operators. For endpoint names and aliases, and domains and workgroups, you can use
*to match any string of characters. As you apply filters, Cortex XSIAM displays any registered endpoint matches to help you validate your filter criteria. -
Static: Select specific registered endpoints that you want to include in the endpoint group. Use the filters, as needed, to reduce the number of results.
When you create a static endpoint group from a file, the IP address, hostname, or alias of the endpoint must match an existing agent that has registered with Cortex XSIAM. You can select up to 250 endpoints.
Note
Disconnecting Cloud Identity Engine in your Cortex XSIAM deployment can affect existing endpoint groups and policy rules based on Active Directory properties.
- Dynamic: Use the filters to define the criteria you want to use to dynamically populate an endpoint group. Dynamic groups support multiple criteria selections and can use AND or OR operators. For endpoint names and aliases, and domains and workgroups, you can use
-
Create the endpoint group.
After you save your endpoint group, it is ready for use to assign security profiles to endpoints and in other places where you can use endpoint groups.
At any time, you can return to the Groups page to view and manage your endpoint groups. To manage a group, right-click the group and select the desired action:
- Edit: View the endpoints that match the group definition, and optionally refine the membership criteria using filters.
- Delete: Remove the endpoint group.
- Save as new: Duplicate the endpoint group and save it as a new group.
- Export group: Export the list of endpoints that match the endpoint group criteria to a tab separated values (TSV) file.
- View endpoints: Pivot from an endpoint group to a filtered list of endpoints on the All Endpoints page where you can quickly view and initiate actions on the endpoints within the group.
Configure global agent settings
In addition to the customizable Agent Settings Profiles for each Operating System and different endpoint targets, you can configure global Agent Configurations that apply to all the endpoints in your network.
From Cortex XSIAM, select Settings → Configurations → General → Agent Configurations.
Set global uninstall password.
The uninstall password is required to remove a Cortex XDR agent and to grant access to the agent security component on the endpoint. You can use the default uninstall Password1 defined in Cortex XSIAM or set a new one and Save. This global uninstall password applies to all the endpoints (excluding mobile) in your network. If you change the password later on, the new default password applies to all new and existing profiles to which it applied before. If you want to use a different password to uninstall specific agents, you can override the default global uninstall password by setting a different password for those agents in the Agent Settings profile. The selected password must satisfy the requirements enforced by Password Strength indicator.
A new password must satisfy the following Password Strength indicator requirements:
- It must be 8 to 32 characters.
- It must contain at least one upper-case, at least one lower-case letter, at least one number, and at least one of the following characters:
!@#%.
Manage the content updates bandwidth and frequency in your network.
- Enable bandwidth control: Palo Alto Networks enables you to control your Cortex XDR agent network consumption by adjusting the bandwidth it is allocated. Based on the number of agents you want to update with content and upgrade packages, active or future agents, the Cortex XSIAM calculator configures the recommended amount of Mbps (Megabits per second) required for a connected agent to retrieve a content update over 24 hours or a week. Cortex XSIAM supports between 20 - 10000 Mbps, you can enter one of the recommended values or enter one of your own. For optimized performance and reduced bandwidth consumption, we recommend that you install and update new agents with the latest version, and include the content package built in using SCCM.
- Enable minor content version updates: The Cortex XSIAM research team releases more frequent content updates in-between major content versions to ensure your network is constantly protected against the latest and newest threats in the wild. Enabled by default, the Cortex XDR agent receives minor content updates, starting with the next content releases. To learn more about the minor content numbering format, refer to About content updates.
Configure content bandwidth allocated for all endpoints.
To control the amount of bandwidth allocated in your network to Cortex XSIAM content updates, assign a Content bandwidth management value between 20-10,000 Mbps. To help you with this calculation, Cortex XSIAM recommends the optimal value of Mbps based on the number of active agents in your network, and including overhead considerations for large content updates. Cortex XSIAM verifies that agents attempting to download the content update are within the allocated bandwidth before beginning the distribution. If the bandwidth has reached its cap, the download will be refused and the agents will attempt again at a later time. After you set the bandwidth, Save the configuration.
Configure the Cortex XDR agent number of parallel upgrades.
If Agent auto upgrades are enabled for your Cortex XDR agents, you can control the automatic upgrade process in your network. To better control the rollout of a new Cortex XDR agent release in your organization, during the first week only a single batch of agents is upgraded. After that, auto-upgrades continue to be deployed across your network with number of parallel upgrades as configured.
- Amount of Parallel Upgrades: Set the number of parallel agent upgrades, where the maximum is 2000 agents. When you configure this, keep in mind your organization's bandwidth usage and resource consumption.
Configure automated Advanced Analysis of Cortex XDR Agent alerts raised by exploit protection modules.
Advanced Analysis is an additional verification method you can use to validate the verdict issued by the Cortex XDR agent. In addition, Advanced Analysis also helps Palo Alto Networks researchers tune exploit protection modules for accuracy.
To initiate additional analysis, you must retrieve data about the alert from the endpoint. You can do this manually on an alert-by-alert basis or you can enable Cortex XSIAM to automatically retrieve the files.
After Cortex XSIAM receives the data, it automatically analyzes the memory contents and renders a verdict. When the analysis is complete, Cortex XSIAM displays the results in the Advanced Analysis field of the Additional data view for the data retrieval action on the Action Center. If the Advanced Analysis verdict is benign, you can avoid subsequent blocked files for users that encounter the same behavior by enabling Cortex XSIAM to automatically create and distribute exceptions based on the Advanced Analysis results.
- Configure the desired options:
- Enable Cortex XSIAM to automatically upload defined alert data files for advanced analysis. Advanced Analysis increases the Cortex XSIAM exploit protection module accuracy.
- Automatically apply Advanced Analysis exceptions to your Global Exceptions list. This will apply all Advanced Analysis exceptions suggested by Cortex XSIAM, regardless of the alert data file source.
- Save the Advanced Analysis configuration.
Configure the Cortex XDR Agent license revocation and deletion period.
This configuration applies to standard endpoints only and does not impact the license status of agents for VDIs or Temporary Sessions.
- Configure the desired options:
- Connection Lost (Days): Configure the number of days after which the license should be returned when an agent loses the connection to Cortex XSIAM. Default is 30 days; Range is 2 to 60 days. Day one is counted as the first 24 hours with no connection.
- Agent Deletion (Days): Configure the number of days after which the agent and related data is removed from the Cortex XSIAM management console and database. Default is 180 days; Range is 3 to 360 days and must exceed the Connection Lost value. Day one is the first 24 hours of lost connection.
- Click Save to save the Agent Status configuration.
Enable WildFire analysis scoring for files with Benign verdicts.
The WildFire analysis score for files with a Benign verdict is used to indicate the level of confidence WildFire has in the Benign verdict. For example, a file by a trusted signer or a file that was tested manually gets a high confidence Benign score, whereas a file that did not display any suspicious behavior at the time of testing gets a lower confidence Benign score. To add verification method to such files, enable this setting. After this, when Cortex XSIAM receives a Benign Low Confidence verdict, the agent enforces the Malware Security profile settings you currently have in place (Run local analysis to determine the file verdict, Allow, or Block).
Disabling this capability takes immediate effect on new hashes, fresh agent installations, and existing security policies. It could take up to a week to take effect on existing agents in your environment pending agent caching.
Enable Informative BTP Alerts.
Behavioral threat protection (BTP) alerts have been given unique and informative names and descriptions to provide immediate clarity into the events without having to drill down into each alert. Enable to display of the informative BTP rule alert names and descriptions. After you update the settings, new alerts include the changes while already existing alerts remain unaffected.
If you have any Cortex XSIAM filters, starring policies, exclusion policies, scoring rules, log forwarding queries, or automation rules configured for XSOAR/3rd party SIEM, we advise you to update those to support the changes before activating the feature. For example, change the query to include the previous description that is still available in the new description, instead of searching for an exact match.
Configure settings for periodic cleanup of duplicate entities in the endpoint administration table.
When enabled, Periodic duplicate cleanup removes all duplicate entries of an endpoint from the endpoint table based on the defined parameters, leaving only the last occurrence of the endpoint reporting to the server. This enables you to streamline and improve the management of your endpoints. For example, when an endpoint reconnects after a hardware change, it may be re-registered, leading to confusion in the endpoint administration table regarding the real status of the endpoint. The cleanup leaves only the latest record of the endpoint in the table.
- Define whether to clean up according to Host Name, Host IP Address, MAC Address, or any combination of them. If not selected, the default is Host Name. When you select more than one parameter, duplicate entries are removed only if they include all the selected parameters.
- Configure the frequency of the cleanup: every 6 hours, 12 hours, 1 day, or 7 days. You can also select to perform an immediate One-time cleanup.
Data for a deleted endpoint is retained for 90 days since the endpoint’s last connection to the system. If a deleted endpoint reconnects, Cortex XSIAM recovers its existing data.
Apply profiles to endpoints
Cortex XSIAM provides out-of-the-box protection for all registered endpoints with a default security policy customized for each supported platform type. To customize your security policy, create or edit one or more security profiles, and then attach the profiles to a new or existing policy.
Each policy you create must apply to one or more endpoints or endpoint groups. The Prevention Policy Rules table lists all the policy rules per operating system. Rules associated with one or more targets that are beyond your defined user scope are locked and cannot be edited.
From Cortex XSIAM, create a policy rule.
Do one of the following:
-
Select Inventory → Endpoints → Policy Management → Prevention → Policy Rules, and select + New Policy or Import from File.
When importing a policy, select whether to enable the associated policy targets. Rules within the imported policy are managed as follows:
- New rules are added to the top of the list.
- Default rules override the default rule in the target tenant.
- Rules without a defined target are disabled until the target is specified.
-
Select Inventory → Endpoints → Policy Management → Prevention → Profiles, right-click the profile you want to assign and click Create a new policy rule using this profile.
Define a Policy Name and optional Description that describes the purpose or intent of the policy.
Select the Platform for which you want to create a new policy.
Select the desired Exploit, Malware, Restrictions, and Agent Settings profiles you want to apply in this policy.
If you do not specify a profile, the Cortex XDR agent uses the default profile.
Click Next.
Use the filters to assign the policy to one or more endpoints or endpoint groups.
Cortex XSIAM automatically applies the platform filter you selected and, if it exists, the Group Name according to the groups within your defined user scope.
Click Done.
In the Policy Rules table, change the rule position, if needed, to order the policy relative to other policies.
The Cortex XDR agent evaluates policies from top to bottom. When the Cortex XDR agent finds the first match it applies that policy as the active policy. To move the rule, select the arrows and drag the policy to the desired location in the policy hierarchy.
Right-click to select one of the following options: View Policy Details, Edit, Save as New, Disable, and Delete.
If you want to export policies, select one or more policies, right-click and select Export Policies. You can include the associated Policy Targets, Global Exceptions, and endpoint groups.
The exported file is encoded in Base64 and cannot be edited.
Create an agent installation package
To install the Cortex XDR agent on the endpoint for the first time, create an agent installation package. Review Where can I install the Cortex XDR agent for supported versions and operating systems.
To install the Cortex XDR agent software, you must use a valid installation package that exists in your Cortex XSIAM management console. If you delete an installation package, new agents installed from this package are not able to register to Cortex XSIAM, however, existing agents may re-register using the Agent ID generated by the installation package.
- From Cortex XSIAM, select Inventory → Endpoints → Agent Installations.
- Click Create to create a new installer.
- Select the Package:
- Standalone: Use for fresh installations and to upgrade agents on a registered endpoint that is connected to Cortex XSIAM.
- (Linux only) Kubernetes: Use for fresh installations and upgrades of Cortex XDR agents running on Kubernetes clusters. #guidelines-for-kubernetes-installer
- Helm: Use this package for fresh installations and upgrades of Cortex XDR agents running on Kubernetes clusters.
- CaaS: Create the Cortex XSIAM container-embedded agent Dockerfile. For installer instructions and guidelines see CaaS workloads.
- Amazon ECS EC2: Create an installation package to deploy the agent on Amazon ECS clusters with EC2 launch types. Guidelines for Amazon ECS EC2 installer
- Serverless: Create an installation package for serverless function to deploy to your runtime platform. #guidelines-for-serverless-installer
Guidelines for Kubernetes installer
Installer configuration:
- Settings for the Kubernetes installer cannot be changed after you create the installation package.
-
For Version, select the desired Cortex XDR agent version.
If the option Always deploy the latest agent version is displayed, do not select it.
- For the Agent Daemonset Namespace, it is recommended to use the default cortex-xdr namespace.
- For a more granular deployment, enter any labels or selectors in the Node Selector. The Cortex XDR agent will be deployed only on these nodes.
- To configure the Cortex XDR agent to communicate through a proxy, enter either the IP address and port number or enter the FQDN and port number. When you enter the FQDN, you can use both lowercase and uppercase letters. Avoid using special characters or spaces. Use commas to separate multiple addresses.
Guidelines for Amazon ECS EC2 installer
When you create a Cortex XDR agent installation package for Linux on AWS ECS EC2 clusters, the package downloads as a JSON task definition file that you deploy to your cluster. Once running, the agent provides the same protection as a standard Cortex XDR agent for Linux.
Cortex issues a license for every node running the agent and revokes it when you remove the agent or delete the node. The Cortex management console identifies processes running within containers, including the container name, ID, and image.
Prerequisites
| Requirement | Description |
|---|---|
| System Architecture | <ul><li>Supports X86_64 and ARM64 architectures. Hybrid clusters and Windows are unsupported.</li><li>Cortex XDR agent 9.1 or later.</li></ul> |
| AWS IAM Roles | <p>The following roles and policies are required for communication and logging:</p><ul><li>ecsTaskExecutionRole: Required to pull images and send logs to CloudWatch.</li><li>AmazonECSTaskExecutionRolePolicy: Grants the ECS agent permission to act for your task. This includes pulling container images from Amazon ECR and sending logs to Amazon CloudWatch.</li><li>CloudWatchLogsFullAccess: Recommended for viewing container standard output.</li><li>ecsInstanceRole: Grants the ECS agent on the EC2 instance permission to communicate with the ECS service.</li><li>AWSServiceRoleForECS: Allows ECS to manage resources, such as load balancers and container instances.</li></ul> |
Installer configuration
- For Version, select Cortex XDR agent 9.1 or later.
- For Family, enter the AWS task definition name.
- For Cluster, enter the ECS cluster name.
- Download the installer as a valid JSON task definition file. Use it to deploy the agent in AWS ECS.
Deploy the agent task definition and service
- In the AWS ECS console, go to Task Definitions.
- Select Create new task definition with JSON.
- Paste the JSON from the Cortex XDR installer. Save the new revision.
- Go to your ECS cluster and select the Services tab.
- Select Create.
- In Deployment Configuration, set Launch type to EC2.
- Important: Select Daemon as the service type. This runs one Cortex XDR agent task on every container instance in the cluster.
- Complete the creation process. AWS runs a CloudFormation stack in the background to deploy the service.
When the service is stable, verify the deployment:
- In the Cortex management console, check the All Endpoints table. The endpoint type appears as Amazon ECS EC2.
- The Protection Status column shows Protected.
Guidelines for serverless installer
Installer configuration:
- For Version, select the required Cortex agent version.
- For Cloud Provider, AWS is configured for this release.
- For Runtime, select one of the environments:
- node.js
- python
- For Deployment Type, select the type:
- Embedded
- AWS Layers
- If node.js and the deployment type, AWS Layers are selected, select one of the Modules:
- ECMAScript
- CommonJS
- For Embed Default Profile From, select from the profile rules configured for serverless functions.
The profile will be applied if the security policy cannot be retrieved in real-time.
The package is created and ready to be deployed.
Deploy the package to your runtime environment
- From Cortex XSIAM, go to Inventory+Endpoints+Installations and from the Agent Installations page, right click and select View Installation Instructions.
- Depending on the runtime environment, the instructions are slightly different.
- Agent installation package for embedded python:
- Download the serverless agent bundle.
- Log in to your AWS Management Console.
- Navigate to the AWS Lambda service, and unzip the serverless agent bundle in the main folder.
-
Add the serverless agent to the function by importing the Cortex library and wrapping the function’s handler.
The Cortex serverless library must be imported after other libraries to activate the hooks that enable auditing.
- Agent installation package for embedded node.js:
- Download the serverless agent bundle.
- Log in to your AWS Management Console.
- Navigate to the AWS Lambda service, and unzip the serverless agent bundle in the main folder.
- Add the serverless agent to the function by importing the Cortex library and wrapping the function’s handler.
- Agent installation package for node.js using AWS Layers in ECMAScript (JavaScript) runtime/Agent installation package for node.js in AWS Lambda using AWS Layers with CommonJS module format:
- Download the serverless agent bundle.
- Log in to your AWS Management Console.
- Navigate to the AWS Lambda service, and upload the layer and add it to the function’s configuration.
- Save the current Lamba handler setting in the ORIGINAL_HANDLER environment variable.
- Change the Lambda handler setting to cortex.handler.
- Agent installation package for python using AWS Layers in python runtime/Agent installation package for python in AWS Lambda using AWS Layers with python module format:
- Download the serverless agent bundle.
- Log in to your AWS Management Console.
- Create a new AWS layer with the downloaded bundle, copy the new layer ARN value, and add the new layer using the copied ARN.
- Save the current Lamba handler setting in the ORIGINAL_HANDLER environment variable.
- Change the Lambda handler setting to cortex.handler.
- Agent installation package for embedded python:
-
In Parameters, enter a unique name and an optional description to identify the installation package.
The package name can contain letters, numbers, hyphens, underscores, commas, and spaces, and should not exceed 100 characters.
- In Metadata, define the appropriate settings for the package type, and then click Create.
-
Download your installation package.
When the status of the package shows
Completed, right-click the package, and click Download.
For the Kubernetes Connect instructions see Onboard the Kubernetes Connector
Manage an agent installation package
You can manage agent installation packages on the Agent Installations page. To manage a specific package, right-click the agent version, and select the desired action:
- Edit the package name or description.
-
Delete the installation package. Deleting an installation package does not uninstall the Cortex XDR agent software from any endpoints.
Since Cortex XSIAM relies on the installation package ID to approve agent registration during the installation, we recommend that you don't delete the installation package of active endpoints. If you install the Cortex XDR agent from a package after you delete it, Cortex XSIAM denies the registration request leaving the agent in an unprotected state. Hiding the installation package removes it from the default list of available installation packages, and can be useful for preventing confusion within the management console main view. The hidden installation can be viewed by removing the default filter.
- Copy text to clipboard to copy the text from a specific field in the row of an installation package.
- Hide installation packages. Using the Hide option provides a quick method to filter out results based on a specific value in the table. You can also use the filters at the top of the page to build a filter from scratch. To create a persistent filter, save () it.
Harden endpoint security
You can extend the security on your endpoints beyond the Cortex XDR agent built-in prevention capabilities to provide increased network security coverage within your organization. By leveraging existing mechanisms and added capabilities, the Cortex XDR agent can enforce additional protections on your endpoints to provide a comprehensive security posture.
From Inventory → Endpoints → Policy Management → Extensions → Profiles, you can create profiles for the following hardened endpoint security capabilities.
The Extensions Profiles table lists the profile details per operating system. Profiles associated with one or more targets that are beyond your defined user scope are locked and cannot be edited.
| Field | Description |
|---|---|
| Associated Targets | Targets associated with the profile |
| Created By | Administrative user who created the profile |
| Created Time | Date and time at which the profile was created |
| Description | Optional description entered by an administrator to describe the profile |
| Modification Time | Date and time at which the profile was modified |
| Modified By | Administrative user who modified the profile |
| Name | Name provided to identify the security profile |
| Platform | Platform type of the profile |
| Summary | Summary of profile configuration |
| Type | Profile type |
| Usage Count | Number of policy rules that use the profile |
To apply the profiles, from Inventory → Endpoints → Policy Management → Extensions → Policy Rules, you can view all the policy rules per operating system. Rules associated with one or more targets that are beyond your defined user scope are locked and cannot be edited.
The following table describes for each capability the supported platforms and minimal agent version. A dash (—) indicates the setting is not supported.
Hardened endpoint security capabilities are not supported for Android or iOS endpoints.
| Module | Windows | Mac | Linux |
|---|---|---|---|
| <p>Device Control</p><p>Protects endpoints from loading malicious files from USB-connected removable devices (CD-ROM, disk drives, floppy disks, and Windows portable devices drives) and Bluetooth devices.</p><p>Protects endpoints from malicious print jobs.</p> | <p>✓</p><p>(Bluetooth from Cortex XDR agent version 8.6, print jobs from version 8.5)</p> | <p>✓</p><p>(Bluetooth from Cortex XDR agent version 8.7, print jobs from version 8.5)</p> | – |
| <p>Host Firewall</p><p>Protects endpoints from attacks originating in network communications to and from the endpoint.</p> | ✓ | ✓ | – |
| <p>Disk Encryption</p><p>Provides visibility into endpoints that encrypt their hard drives using BitLocker or FileVault.</p> | ✓ | ✓ | – |
Device control
Cortex XSIAM device control manages peripheral device access on Windows and macOS endpoints. Use device control policies to allow or block USB devices, Bluetooth devices, SD cards, and print jobs. These controls help reduce endpoint exposure to malicious files on removable devices.
Device control capabilities
Using device control policies, you can:
- (Windows and macOS) Block all supported USB-connected devices for an endpoint group.
- (Windows and macOS) Block a USB device type but add a specific vendor from that list to your allow list that will be accessible from the endpoint.
- (Windows and macOS) Block connections to Classic Bluetooth devices or Low Energy Bluetooth services. These are two different Bluetooth protocols used for short-range wireless connections.
- Some examples of Classic Bluetooth devices include: laptop computers, tablets, telephones, audio/video devices, wearables, peripherals, imaging devices, health devices, toys, and so on.
- Some examples of Low Energy Bluetooth devices include: telephone alert status, microphone control, health sensors, insulin delivery, location and navigation, object transfer, and so on.
- Temporarily block only some device types on an endpoint.
- USB devices (Windows and macOS)
- Bluetooth devices (Windows and macOS)
- (Windows and macOS from agent 9.2 and later) Block or allow SD Cards connected on the PCI/PCIe bus.
- (Windows and macOS) Block some or all print jobs to local or network printers, or to file.
- Operating systems report on devices in different ways. Sometimes, the same BLE device will report different services and interfaces, depending on the host's operating system. This may have an effect on the specific BLE services that are blocked for each operating system.
- Depending on your defined user scope permissions, creating device profiles, policies, exceptions, and violations may be disabled.
Device control prerequisites
The following prerequisites apply when enforcing device control policies:
| Platform | Prerequisites |
|---|---|
| Windows | <p>For VDI:</p><ul><li>For VMware Horizon, you must disable Sharing → Allow access to removable storage in your VMware Horizon client settings.</li></ul> |
| Mac | No prerequisites |
| Linux | Not supported |
| Android | Not supported |
| iOS | Not supported |
Device control limitations
The following limitations apply to device control on your endpoints:
| Platform | Device Type | Limitation |
|---|---|---|
| Windows | VDI | <ul><li>Virtual environments leverage different stacks that might not be subject to the Device Control policy rules that are enforced by the Cortex XDR agent and, therefore, could lead to USB devices that are allowed to connect to the VDI instance in contrast to the configured policy rules.</li><li>The Cortex XDR agent provides best-effort enforcement of the Device Control policy rules on VDI instances that are running on physical endpoints where a Cortex XDR agent is not deployed.</li><li>For Citrix Virtual Apps and Desktops, Cortex XDR Device Control is supported on generic virtual channels only.</li></ul> |
| Windows | Bluetooth | <ul><li>Serial number queries are not supported.</li><li>If a profile is set to block specific Bluetooth Low Energy (BLE) services, Cortex XSIAM only blocks the services set to Block, and not the functionality of the entire device. This means that if a device has multiple services, some of them might still be accessible, while others are blocked.</li><li>Cortex XSIAM attempts to aggregate all related BLE services so that they appear under a single logical Bluetooth device control violation report. However, some Bluetooth devices might be reported in a separate violation report due to the way these devices are paired in the Windows operating system and because they reside outside the device container.</li><li>Cortex XSIAM cannot block low energy services or report device control violations on devices that do not report any LE services. The devices can, however, be blocked completely by setting the entire Bluetooth device to Block.</li><li>Exceptions can only be created when the Vendor field for the device is available in a violation report.</li><li>Exceptions for specific BLE devices cannot be created from a violation report. Exceptions for such devices can only be created by disabling the the blocked LE services in the policy.</li><li>If a Bluetooth device vendor is registered as a Vendor (with ID) in the regulatory organization that supervises USB devices, but is not registered as a Bluetooth device, exceptions cannot be created from a violation report. An alternate method for creating an exception is to create a separate profile for the endpoints using the BLE devices, and allow use of specific major and minor classes for these devices.</li></ul> |
| macOS | Bluetooth | <ul><li>Cortex XSIAM cannot block low energy services or report device control violations on devices that do not report any LE services. The devices can, however, be blocked completely by setting the entire Bluetooth device to Block.</li><li>Exceptions can only be created when the Vendor field for the device is available in a violation report.</li><li>Exceptions for specific BLE devices cannot be created from a violation report. Exceptions for such devices can only be created by disabling the the blocked LE services in the policy.</li><li>If a Bluetooth device vendor is registered as a Vendor (with ID) in the regulatory organization that supervises USB devices, but is not registered as a Bluetooth device, exceptions cannot be created from a violation report. An alternate method for creating an exception is to create a separate profile for the endpoints using the BLE devices, and allow use of specific major and minor classes for these devices.</li><li>In some cases, when LE devices are blocked by Cortex XSIAM, the host's user interface might not reflect this, and they might appear as connected, when in fact they are blocked. In such cases, these devices retain their pairing status, even though they are blocked.</li><li>Some Apple devices, such as iPhones or iPads, might not be blocked because they employ protocols other than Bluetooth for inter-device communication.</li><li>Some complex Bluetooth and BLE devices, such as earphones with pre-paired charging cases, may not be blocked.</li></ul> |
| Linux | - | Not supported |
| Android | - | Not supported |
| iOS | - | Not supported |
Device control profiles
To apply device control in your organization, define device control profiles that determine which device types Cortex XSIAM blocks and which it permits. There are two types of profiles:
| Profile | Description |
|---|---|
| Configuration Profile | <p>Allow or block these device type groups:</p><ul><li>Disk Drives (USB-connected)</li><li>CD-Rom Drives (USB-connected)</li><li>Floppy Disk Drives (USB-connected)</li><li>(Windows only) Windows Portable Devices (USB-connected)</li><li><p>(Windows only) Bluetooth Devices (block, allow, or custom types)</p><ul><li><p>The Custom option includes configuration options for specific Bluetooth Classes (Bluetooth Classic) device types, and for Low Energy Services (Bluetooth Low Energy).</p><p>When you select an option in Bluetooth Classes, the right pane of the dialog box provides a detailed list of device types that belong to the selected class. You can choose all, or some of the items in this list.</p></li></ul></li><li>SD Cards connected on the PCI/PCIe bus (Windows and macOS from agent 9.2 and later)</li><li><p>Print Jobs (all, or custom types)</p><ul><li>When set to Block, all print jobs sent from the endpoint will be blocked.</li><li><p>When set to Custom, the following options are available:</p><p>Network printer jobs only when outside Corp. network blocks print jobs sent to network printers while the endpoint is not on the corporate network.</p><p>Network printer jobs (internal/VPN) blocks print jobs sent to network printers while the endpoint is connected to the network via VPN or an internal connection.</p><p>Local printer jobs blocks print jobs sent to a printer which is directly connected to an endpoint.</p><p>Printing to file (Windows only) blocks print jobs that are saved as a file. This option only blocks the print driver.</p></li></ul></li><li><p>For network printer print jobs, ensure that you also configure the Agent Settings profile, Network Location Configuration option. This setting must be set to Enabled, and configured.</p><p>If you do not enable and configure this setting, all network printer operations will be treated as internal network print jobs.</p></li><li><p>The Print Job option does not block connections to a printer, but blocks print jobs according to the type of print job. You cannot block use of a specific printer with this feature.</p><p>Any print job that is not sent via the endpoint's printer spooler, such as a file uploaded to a remote software based printing service, will not be blocked.</p></li><li>Cortex XSIAM relies on the device class assigned by the operating system.</li></ul><p>Add a new device configuration profile.</p><p>The Cortex XDR agent relies on the device class assigned by the operating system. For Windows endpoints only, you can configure additional device classes.</p><p>Add a custom device class.</p> |
| Exceptions Profile | <p>Allow specific devices according to device types and vendor. You can further specify a specific product and/or product serial number.</p><p>Add a new device exceptions profile.</p> |
Device Configuration and Device Exceptions profiles are configured for each operating system. After you configure a device control profile, apply device control profiles to your endpoints.
Add a new device configuration profile
- In Endpoints → Policy management → Extensions → Profiles, select + Add Profile. Then select Create New or Import from File.
- Select a platform. Select Device Configuration → Next.
-
Complete the general information.
Assign a profile name. You can add a description. Cortex XSIAM sets the profile type and platform.
-
Configure device settings.
For each device type group, select an action. Leave Use Default selected to use Palo Alto Networks defaults.
- For Disk Drives, you can allow read-only access.
- For Print Jobs, select Custom and choose print job types.
- For Bluetooth Devices, select Custom and choose Bluetooth Classes or Low Energy Services.
The current default is Use Default (Allow). Palo Alto Networks can change this default.
To capture USB connect and disconnect events in XQL Search, set Device Configuration to Block. Events are also captured when blocked device groups have permanent or temporary exceptions.
-
Select Create to save the profile.
You can later edit, delete, or duplicate the profile.
You cannot edit or delete default Cortex XSIAM profiles.
- Optional: define exceptions in a Device Exceptions profile.
- Apply the device control profiles to your endpoints.
Add a new device exceptions profile
- In Endpoints → Policy management → Extensions → Profiles, select + New Profile or Import from File.
- Select a platform. Select Device Exceptions → Next.
-
Complete the general information.
Assign a profile name. You can add a description. The system sets the profile type and platform.
-
Configure device exceptions.
Add devices to the allow list with vendor, product, and serial number identifiers.
- Type: Select Bluetooth, CD-ROM, Disk Drive, Floppy Disk, or Windows Portable Devices. Windows Portable Devices are Windows-only.
- Permission: For disk drives, select Read only or Read/Write.
- Vendor: Select a vendor or enter its hexadecimal vendor ID.
- Product: Optionally select a vendor product or enter its hexadecimal product ID.
- Serial Number: Optionally enter a product serial number. Quote serial numbers that end with a space. For example,
"K04M1972138 ".
-
Select Create to save the exceptions profile.
You can later edit, delete, or duplicate the profile.
You cannot edit or delete predefined Cortex XSIAM profiles.
- Apply the device control profiles to your endpoints.
Apply device control profiles to your endpoints
After defining configuration and exceptions profiles, configure Device Control policies and enforce them on endpoints. Cortex XSIAM evaluates policies in page order. The first matching policy applies. If none match, the default policy enables all devices.
-
In Endpoints → Policy management → Extensions → Policy Rules, select + New Policy or Import from File.
When importing, choose whether to enable associated policy targets. New rules are added first. Default rules override the tenant default. Rules without targets remain disabled.
- Configure the Device Control policy.
- Assign a policy name and platform. You can add a description.
- Assign the Device Type profile for this rule.
- Select Next.
-
Select target endpoints.
Use filters or manual endpoint selection. Group Name filtering respects your user scope.
- Select Done.
-
Configure the policy hierarchy.
Drag policies into execution order. The default policy always remains last. It applies when no other policy matches.
-
Save the policy hierarchy.
After the policy reaches agents, Cortex XSIAM enforces it.
-
Optional: manage policy rules.
In the Protection Policy Rules table, view and edit policies and their hierarchy.
- View the policy hierarchy.
- Right-click a policy to view details, edit, save as new, disable, or delete it.
- Select policies and choose Export Policies. You can include policy targets, global exceptions, and endpoint groups.
-
Monitor device control violations.
Use Endpoints → Device Control Violations to view blocked device and print job attempts. Sort results or filter the list.
Violations can include:
- ID, timestamp, endpoint host name, platform, agent ID, user name, and IP address.
- Device type, GUID, vendor ID, vendor, product name, and serial number.
- Print job type, document name, additional information, major class, minor class, and vendor type.
Serial numbers are not supported for Bluetooth devices on Windows endpoints.
Right-click a violation to add the device to permanent exceptions, temporary exceptions, or a profile exception.
-
Tune device control exceptions.
Allow-list entries require a device category, vendor, and permission. Optionally specify a product or serial number.
- Permanent exceptions apply across all Device Control policies and profiles. They apply across platforms.
- Temporary exceptions apply for up to 30 days.
- Profile exceptions apply within an existing Device Exceptions profile.
Create a permanent exception
Permanent exceptions apply to all devices, regardless of endpoint platform.
If you know the device in advance:
- Go to Endpoints → Policy Management → Extensions → Device Permanent Exceptions.
- Select the type, permission, and vendor.
- Optional: select a product or enter a serial number.
- Select the adjacent arrow and then Save.
The exception applies at the next heartbeat.
To create one from a violation:
- On Device Control Violations, right-click the relevant violation.
- Select Add device to permanent exceptions.
- Review the data and select Save.
Create a temporary exception
- On Device Control Violations, right-click the relevant violation.
- Select Add device to temporary exceptions.
- Review the data. Choose the target endpoints and identifiers.
- Set a time frame of up to 30 days.
- Select Save.
The exception applies at the next heartbeat.
Create an exception within a profile
- On Device Control Violations, right-click the relevant violation.
- Select the profile.
- Select Save.
The exception applies at the next heartbeat.
Add a custom device class
Windows only: add USB-connected device classes beyond Disk Drive, CD-ROM, Windows Portable Devices, and Floppy Disk Drives. For example, add USB-connected network adapters.
Supply the official ClassGuid identifier from Microsoft. If a device has a configured GUID value, use that value.
After adding a class, view it in Device Management. You can enforce device control rules and exceptions for it.
-
Go to Endpoints → Policy Management → Settings → Device Management.
This page lists custom USB-connected devices.
-
Select + New Device.
Set a name and a valid, unique GUID Identifier. Each GUID can define only one class type.
-
Select Save.
The new class is available with other Cortex XSIAM device classes.
Add a custom user notification
Personalize the Cortex XSIAM endpoint notification shown when users connect blocked USB devices. You can also customize notifications for read-only devices.
Configure notifications in the Agent Settings profile.
Disabling Device Control Violation notifications requires Cortex XDR agent version 8.6 or later.
Ingest connect and disconnect events of USB devices
This feature requires a Cortex XSIAM Pro license.
XQL ingests USB connect and disconnect events reported by the agent. Set the endpoint profile's Device Configuration to Block to capture these events. Events are also captured for blocked device groups with permanent or temporary exceptions.
Use XQL Search with the xdr_data dataset to:
- Display devices by vendor ID, vendor name, product ID, and product name.
- Find hosts connected to a device by serial number.
- Find USB devices connected to specific hosts or host groups.
The following query returns action_device_usb_product_name for USB plug events:
dataset = xdr_data | filter event_type = DEVICE and event_sub_type = DEVICE_PLUG | fields action_device_usb_product_name
The following query returns action_device_usb_vendor_name from the device_control preset:
preset = device_control | filter event_type = DEVICE | fields action_device_usb_vendor_name
Host firewall
The Cortex XSIAM host firewall enables you to control communications on your endpoints. To use the host firewall, you set rules that allow or block traffic on the devices and apply them to your endpoints using host firewall policy rules. Additionally, you can configure different sets of rules based on the current location of your endpoints - within or outside your organization's network. The Cortex XSIAM host firewall rules leverage the operating system firewall APIs and enforce these rules on your endpoints, but not your Windows or Mac firewall settings.
The following apply Cortex XSIAM host firewall policy rules on your endpoints:
| Platform | Requirements and Limitations |
|---|---|
| Windows | <ul><li>By default, Cortex firewall is disabled and Windows firewall has control. Enforcing Cortex firewall rules will take control away from Windows Firewall, and Windows firewall rules will no longer apply.</li><li>It is recommended to disable the windows firewall on endpoints running Windows 7 SP1 before applying the Cortex XSIAM host firewall profile.</li></ul> |
| Mac | <ul><li>After you disable or remove the Cortex XSIAM host-firewall policy on the endpoint, the system firewall on the endpoint is disabled.</li><li><p>You cannot configure the following Mac host firewall settings with the Cortex XSIAM host firewall.</p><ul><li>Automatically allow built-in software to receive incoming connections.</li><li>Automatically allow downloaded signed software to receive incoming connections.</li></ul></li></ul> |
| Linux | Not supported. |
Host firewall for Windows
Cortex XSIAM host firewall policies control inbound and outbound network communications on Windows endpoints. Reusable rule groups support hierarchical policy enforcement across host firewall profiles. Host firewall rules integrate with Windows Security Center and use Windows firewall APIs without changing operating system firewall settings.
Use the Host Firewall Events table to monitor enforcement events and network connections.
Host firewall setup workflow
To configure the Cortex XSIAM host firewall, follow this workflow:
- Ensure you meet the host firewall requirements and prerequisites.
- Create rules within rule groups: Create host firewall rule groups that you can reuse across all host firewall profiles. Add rules to each group and prioritize the rules from top to bottom to create an enforcement hierarchy.
- Configure a profile: Select one or more rule groups into a host firewall enforcement profile that you later associate with an enforcement policy. The profile can enforce different rules when the endpoint is located within the organization’s internal network, and when it is outside. Prioritize the groups within the profile from top to bottom to create an enforcement hierarchy.
- Configure a policy: Add your host firewall profile to a new or existing policy that will be enforced on selected target endpoints.
- Monitor and troubleshoot: View aggregated host firewall enforcement events, or all single-host firewall activities the agent performed in your network. Cortex XSIAM Pro customers can also query the host firewall events using the new
host_firewall_eventsdataset in XQL Search for data and network analysis.
Set up the host firewall
Set up your rule groups and host firewall profile.
Create a rules group
Group rules into Rules Groups that you can reuse across all host firewall profiles. A host firewall group includes one or more host firewall unique rules. The rules are enforced according to their order of appearance within the group, from top to bottom. After you create a rules group, you can assign the group to a host firewall profile. When you edit, re-prioritize, disable, or delete a rule from a group, the change takes effect in all policies where this group is included. To support this scalability and structure, every rule in Cortex XSIAM is assigned a unique ID and must be contained within a group. Additionally, you can import existing firewall rules into Cortex XSIAM, or export them in JSON format.
- Create a group.\
From Inventory → Endpoints → Host Firewall → Host Firewall Rules Groups, click +New Group on the upper bar. - Fill in general information.\
Enter the rule name and optional description. To enforce the rules within the group in all policies they are associated with, enable the group. When Disabled, the group exists but is not enforced. -
Create rules within the rules group.\
Create rules within rules groups to allow or block traffic on the endpoint. Use a variety of parameters to fine-tune your policy, such as specific protocols, applications, services, and more. For every group, you need to create its own list of rules. Each rule is assigned a unique ID and can be associated with a single group only.\
Note: A rule is always part of a rules group. It cannot stand on its own. A rule can belong to one rules group only and cannot be reused in different groups.-
Configure rule settings.\
A host firewall rule allows or blocks communication to and/or from an endpoint. Enter the rule Name, optional Description, and select the Platforms you want to associate the rule with.\
Fine-tune the rule by applying the action to the following parameters:- Protocol: Select any of the 256 internet protocols:
- Any
- Custom
- TCP
- UDP
- ICMPv4
- iCMPv6
Once you select one of the available protocols or enter the protocol number, you will be able to specify additional parameters per protocol as needed. For example, for TCP(6) you can set local and remote ports, whereas for ICMPv4(1) you can add the ICMP type and code.\
Note: When selecting the ICMP protocol, you must enter the ICMP Type and Code. Without these values, the ICMP protocol is ignored by the Windows and macOS Cortex XDR agents.- Direction: Select the direction of the communication this rule applies to: Inbound communication to the endpoint, Outbound communication from the endpoint, or Both.
- Action: Select whether the rule action is to Allow or Block the communication on the endpoint.
- Local/Remote IP Address: Configure the rule for specific local or remote IP addresses s and/or Ports. You can set a single IP address, multiple IP addresses separated by a comma, range of IP addresses separated by a hyphen, or a combination of these options.
- Depending on the type of platform you selected, define the Application, Service, and Bundle IDs of the Windows Settings and/or macOS Settings—Configure the rule for all applications/services or specific ones only by entering the full path and name. If you use system variables in the path definition, you must re-enforce the policy on the endpoint every time the directories and/or system variables on the endpoint change.
- Report Matched Traffic: When Enabled, enforcement events captured by this rule are reported periodically to Cortex XDR and displayed in the Host Firewall Events table, whether the rule is set to Allow or Block the traffic. When Disabled, the rule is applied, but enforcement events are not reported periodically.
- Protocol: Select any of the 256 internet protocols:
b. Save rule.\
After you fill in all the details, you need to save the rule. If you know you need to create a similar rule, click Create another to save this rule and leave the specified parameters available for editing for the next rule. Otherwise, to save the rule and exit, click Create. -
- Prioritize rules.\
The rules within the group are enforced by priority from top to bottom. By default, every new rule is added to the top of the already existing rules in the group, meaning it is assigned the highest priority and will be enforced first. To change the rule's priority and order of enforcement within the group, click the rule priority number and drag the rule up or down the table to the proper row. Repeat this process to prioritize all the rules. - Save.\
When you are done, click Create. The new rules group is created and can be associated with a host firewall profile.
Manage rules groups
After you create a group, you can perform additional actions. From Inventory+Endpoints → Host Firewall → Host Firewall Rules Groups, click a group:
- View group data: From the Host Firewall Rules Groups table you can view details about all the existing rules groups in your organization. The table lists high level information about the group such as name, mode, and number of rules included. To view all rules within a group and all the profiles the group is associated with, click the expand icon.
- Edit group: Right-click the group and Edit its settings.
- Delete/Disable: To stop enforcing the rules within this group, right-click the group and Delete/Disable it. On the next heartbeat, its rule will be removed/disabled from all profiles this group is associated with.
- Import/Export group rules: Using a JSON file, you can import rules into the Cortex XDR host firewall or export them. Right-click the rule and Import/Export.
Manage rules
After you create a host firewall rule and assign it to a rules group, you can manage the rule settings and enforcement as follows.
- View/Edit: Right-click the rule to view it or edit its parameters.
- Change priority: Change the rule priority within the group by dragging its row up and down the rules list.
- Delete/Disable: To stop enforcing the rule, you can right-click the rule and Delete/Disable it. On the next heartbeat, the rule will be removed/disabled in all profiles where this rules group is included.
Create a host firewall profile
Configure host firewall profiles that contain one or more rules groups. The groups are enforced according to their order of appearance within the profile, from top to bottom (and within each group, the rules are also enforced from top to bottom). You can also configure profiles based on the device location within your internal network. When you edit, re-prioritize, disable, or delete a rules group from a profile, the change takes effect on the next heartbeat in all policies where this profile is included.
- Create a profile.
From Inventory → Endpoints → Policy Management → Extensions and select + Add Profile or Import from File.
- Select the platform and click Host Firewall → Next.
- Fill in General Information.
Enter the profile name and optional description.
- Configure Report Settings.
When the profile operates in report mode, Cortex XDR overrides all rules set to Block traffic. Instead, the traffic is allowed to go through, and the enforcement event is reported as Override Block. You can configure a profile in report mode if you need for example to test new block rules before you actually apply them.
- Configure Internal and External Rule Groups.
To apply location-based host firewall rules, you must first enable network location configuration in your Agent Settings Profile. When enabled, Cortex XDR enforces the host firewall rules based on the current location of the device within the internal organization network (Internal Rules), enabling you for example to enforce more strict rules when the device is outside the office and in a public place (External Rules). If you disable the Location Based option, your policy will apply the internal set of rules only, and that will be applied to the device regardless of its location.Set up agent settings profiles
Create a new rule or add a rules group to the Internal/External Groups:
- Click +Add Group.
- Select one or more groups, and click Add.
To quickly apply the exact same rules in both cases, select Add as external/internal rules groups as well.
- Review the rule group field details.
The groups are listed according to the order of enforcement from top to bottom. To change this order, click on the group priority number and drag the group to the desired row.
| Field | Description |
|---|---|
| Applicable Rules Count | Displays the number of rules in the specific group that are associated with the platform profile |
| Created by | Displays the email address of the user that created the rule |
| Creation Time | Date and time of when the rule was created |
| Description | Description of the rule, if available |
| Group ID | Unique rules group ID |
| Group Name | Name of the group rules group |
| Mode | Displays whether the rules group is enabled |
| Modified by | Displays the email address of the last user that made changes to the group |
| Modification Time | Date and time of when the group was modified |
- (Optional) Select View Rules to view a list of all the rule details within the rules group. The table is filtered according to the rules associated with the platform profile you are creating.
- Allow or Block the Default Action for Inbound/Outbound Traffic in the profile if you want to allow all network connections that have not been matched to any other rule in the profile.
- Save the profile.
When you are done, click Create. You can now configure a host firewall policy.
Manage policy rules
After you create the host firewall extensions profile, you can perform additional actions. The changes take effect on the next heartbeat. From Inventory → Endpoints → Policy Management → Extensions → Policy Rules, right-click to:
- Edit: Change the profile settings and Save. The change takes effect in all policies enforcing this profile.
- Delete: The profile is deleted from all policies it was associated with, while the rules groups are not deleted and are still available in Cortex XSIAM.
- Save As New: Duplicate the profile, edit, and save as new.
- Export Profile: Select one or more policies, right-click, and select Export Policies. You can choose to include the associated Policy Targets, Global Exceptions, and endpoint groups.
Create a host firewall policy
After you define the required host firewall profiles, configure host firewall policies that will be enforced on your target endpoints. You can associate the profile with an existing policy, or create a new one.
- Create a policy.
From Inventory → Endpoints → Policy Management → Extensions → Policy Rules, click +New Policy or Import from File.
Note: When importing a policy, select whether to enable the associated policy targets. Rules within the imported policy are managed as follows. New rules are added to the top of the list. Default rules override the default rule in the target tenant. Rules without a defined target are disabled until target is specified.
- Fill in general information.
Enter the policy name, description, and platform. Click Next.
- Select profile.
Select the desired profile for host firewall from the drop-down list, and any other profiles you want to include in this policy. Click Next.
- Select endpoints.
Select the target endpoints on which to enforce the policy. Use filters or manual endpoint selection to define the exact target endpoints of the policy. Click Done.
- Configure policy hierarchy.
Drag and drop the policies in the desired order of execution, from top to bottom.
- Save the policy.
After the policy is saved and applied to the agents, Cortex XDR enforces the host firewall policies in your environment.
Monitor host firewall activity in your network
The Host Firewall Events table provides an aggregated view of the host firewall enforcement events in your network. An enforcement event represents the number of rule hits per endpoint in 60 minutes.
Note: The data is aggregated and reported periodically every 60 minutes since the first time the host firewall policy was enforced on the endpoint, not every round hour. The table lists enforcement events only for rules set to Report Matching Traffic .
Every enforcement event includes additional data such as the time of the first rule hit, the rule action, protocol, and more.
Collect detailed log files
To gain deeper visibility into all the host firewall activity that occurred on an endpoint, you can retrieve a log file listing all single actions the agent performed for all rules (whether set to Report Matched Traffic or not). The logs are stored in a cyclic 50MB file on the endpoint, which is constantly being re-written and overridden older logs. When you upload the file, the logs are loaded to the Host Firewall Events table. You can filter the table using the Event Source field to view only the aggregated periodic logs, or only non-aggregated on-demand logs.
To collect the log file, right-click the event containing the endpoint you are interested in and select Collect Detailed Host Firewall Logs. Alternatively, you can perform this action for multiple endpoints from Endpoints Administration.
Host firewall for macOS
The Cortex XSIAM host firewall enables you to control communications on your endpoints. To use the host firewall, you set rules that allow or block the traffic on the devices and apply them to your endpoints using Cortex XSIAM host firewall policy rules. Additionally, you can configure different sets of rules based on the current location of your endpoints - within or outside your organization network. The Cortex XSIAM host firewall rules leverage the operating system firewall APIs and enforce these rules on your endpoints, but not your Windows or Mac firewall settings.
To configure the Cortex XSIAM host firewall in your network, follow this high-level workflow. Ensure you meet the host firewall requirements.
Enable network location configuration
If you want to apply location-based host firewall rules, you must first enable network location configuration in your agent settings profile. On every heartbeat, and if the Cortex XDR agent detects a network change on the endpoint, the agent triggers the device location test and re-calculates the policy according to the new location.
Add a new host firewall profile
Configure host firewall profiles that contain one or more rules groups. The groups are enforced according to their order of appearance within the profile, from top to bottom (and within each group, the rules are also enforced from top to bottom). You can also configure profiles based on the device location within your internal network. When you edit, re-prioritize, disable, or delete a rules group from a profile, the change takes effect on the next heartbeat in all policies where this profile is included.
Rules that were created on macOS 10 and Cortex XDR agent 7.5 and prior are managed only in the Legacy Host Firewall Rules and do not appear in the Rule Groups tables.
- From Inventory → Endpoints → Policy Management → Extensions Profiles → Profiles, select +New Profile or Import from File. Select the Platform and click Host Firewall → Next.
-
Fill-in the General Information for the new profile.
Assign a Profile Name and optional description to the profile.
-
Define your Report Settings.
When the profile operates in report mode, Cortex XSIAM overrides all rules set to Block traffic. Instead, the traffic is allowed to go through, and the enforcement event is reported as Override Block. You can configure a profile in report mode if you need for example to test new block rules before you actually apply them.
-
Configure Internal and External Rule Groups.
To apply location-based host firewall rules, you must first enable network location configuration in your agent settings profile. When enabled, Cortex XDR enforces the host firewall rules based on the current location of the device within the internal organization network (Internal Rules), enabling you for example to enforce more strict rules when the device is outside the office and in a public place (External Rules). If you disable the Location Based option, your policy will apply the internal set of rules only, and that will be applied to the device regardless of its location.
Create a new rule or add a rules group to the Internal/External Groups.
- Click +Add Group.
-
Select one or more groups, and click Add.
To quickly apply the exact same rules in both cases, select Add as external/internal rules groups as well.
-
Review the rule group field details.
The groups are listed according to the order of enforcement from top to bottom. To change this order, click on the group priority number and drag the group to the desired row.
Field Description Applicable Rules Count Displays the number of rules in the specific group that are associated with the platform profile Created by Displays the email address of the user that created the rule Creation Time Date and time of when the rule was created Description Description of the rule, if available Group ID Unique rules group ID Group Name Name of the group rules group Mode Displays whether the rules group is enabled or not Modified by Displays the email address of the last user that made changes to the group Modification Time Date and time of when the group was modified -
(Optional) Select View Rules to view a list of all the rule details within the rules group. The table is filtered according to the rules associated with the platform profile you are creating.
Any type protocol and specific ports cannot be edited. If saved as a new rule, the specific ports previously defined are removed from the cloned rule.
- Allow or Block the Default Action for Inbound/Outbound Traffic in the profile if you want to allow all network connections that have not been matched to any other rule in the profile.
-
(Optional) Manage Legacy Host Firewall Rules.
Manage Host Firewall Rules created on macOS 10 and Cortex XDR agent 7.5 and earlier.
- Enable Manage Host Firewall to allow Cortex XDR to manage the host firewall on your Mac endpoints.
-
Configure the host firewall Internal and External settings.
The host firewall settings allow or block inbound communication on your Mac endpoints. Enable or Disable the following actions:
- Stealth Mode: Hide your mac endpoint from all TCP and UDP networks by enabling the Apple Stealth mode on your endpoint.
- Block All Incoming Connections: Select where to block all incoming communications on the endpoint or not.
- Application Exclusions: Allow or block specific programs running on the endpoint using a Bundle ID.
If the profile is location-based, you can define both internal and external settings.
-
Save your profile.
When you’re done, Create your host firewall profile.
- Apply host firewall profiles to your endpoints.
Apply host firewall profiles to your endpoints
After you define the required host firewall profiles, configure the Protection Policies and enforce them on your endpoints. Cortex XSIAM applies Protection policies on endpoints from top to bottom, as you’ve ordered them on the page. The first policy that matches the endpoint is applied. If no policies match, the default policy that enables all communication to and from the endpoint is applied.
-
From Inventory → Endpoints → Policy Management → Extensions → Policy Rules, select +New Policy or Import from File.
When importing a policy, select whether to enable the associated policy targets. Rules within the imported policy are managed as follows:
- New rules are added to the top of the list.
- Default rules override the default rule in the target tenant.
- Rules without a defined target are disabled until the target is specified.
-
Configure settings for the host firewall policy.
- Assign policy name, an optional description, and operating system.
- Assign the host firewall profile you want to use in this rule.
- Click Next.
-
Select the target endpoints on which to enforce the policy.
Use filters or manual endpoint selection to define the exact target endpoints of the policy rules.
- Click Done.
Alternatively, you can associate the host firewall profile with an existing policy. Right-click the policy and select Edit. Select the Host Firewall profile and click Next. If needed, you can edit other settings in the rule, such as target endpoints and description. When you’re done, click Done.
-
Configure policy hierarchy.
Drag the policies in the desired order of execution.
-
Save the policy hierarchy.
After the policy is saved and applied to the agents, Cortex XDR enforces the host firewall policies on your environment.
Monitor the host firewall activity on your endpoint
To view only the communication events on the endpoint to which the Cortex XDR host firewall rules were applied, you can run the Cytool firewall show command.
Additionally, to monitor the communication on your macOS endpoint, you can use the following operating system utilities: From the endpoint System Preferences → Security and Privacy → Firewall → Firewall options, you can view the list of blocked and allowed applications in the firewall. The Cortex XSIAM host firewall can be defined to block incoming communications on Mac endpoints, while still allowing outbound communication initiated from the endpoint. To restrict outgoing traffic, you can create specific rules to block targeted outbound connections as needed.
Disk encryption
Cortex XSIAM provides full visibility into encrypted Windows and Mac endpoints that were encrypted using BitLocker and FileVault, respectively. Additionally, you can apply Cortex XSIAM Disk Encryption rule on the endpoints by creating disk encryption rules and policies that leverage BitLocker and FileVault capabilities.
Before you start applying disk encryption policy rules, ensure you meet the following requirements and refer to these known limitations:
| Requirement / Limitation | Windows | Mac |
|---|---|---|
| Endpoint Prerequisites | <ul><li>The endpoint must be running a Microsoft Windows version that supports BitLocker.</li><li>The endpoint must be within the organization's network domain.</li><li>To allow the agent to encrypt the endpoint, Trusted Platform Module (TPM) must be supported and enabled on the endpoint.</li><li>Active Directory Domain Services is required for recovery key backup.</li></ul> | <ul><li>The endpoint must be running a macOS version that supports FileVault.</li></ul> |
| Disk Encryption Scope | You can enforce XDR disk encryption policy rules only on the Operating System volume. | <ul><li>You can enforce XDR disk encryption policy rules only on the Operating System volume.</li><li>The Cortex XDR Disk Encryption profile for Mac can encrypt the endpoint disk, however, it cannot decrypt it. After you disable the Cortex XDR policy rule on the endpoint, you can decrypt the endpoint manually.</li></ul> |
| Other | <p>Group Policy configuration:</p><ul><li>Make sure the GPO configuration applying to the endpoint enables Save BitLocker recovery information to AD DS for operating system drives.</li><li>Make sure your Cortex XDR disk encryption policy does not conflict with the GPO configuration to Choose drive encryption method and cipher strength.</li></ul> | <ul><li>Provide a FileVaultMaster certificate / institutional recovery key (IRK) that is signed by a valid authority.</li><li>It can take the agent up to 5 minutes to report the disk encryption status to Cortex XDR if the endpoint was encrypted through Cortex XDR, and up to one hour if it was encrypted through another MDM.</li><li>In line with the operating system requirements, the Cortex XDR encryption profile will take place on the endpoint after the user logs off and back on, and approves the prompt to enable the endpoint encryption.</li><li>Palo Alto Networksrecommends that you do not apply an encryption enforcement from another MDM on the endpoint together with the Cortex XDR encryption profile.</li></ul> |
Follow this high-level workflow to deploy the Cortex XSIAM disk encryption in your network:
Monitor the endpoint encryption status
You can monitor the Encryption Status of an endpoint in the Inventory → Endpoints → Disk Encryption Visibility table. For each endpoint, the table lists both system and custom drives that were encrypted.
The following table describes both the default and additional optional fields that you can view in the Disk Encryption Visibility table per endpoint. The fields are in alphabetical order.
| Field | Description |
|---|---|
| Encryption Status | <p>The endpoint encryption status can be: * Applying Policy: Indicates that the Cortex XDR disk encryption policy is in the process of being applied on the endpoint. * Compliant: Indicates that the Cortex XDR agent encryption status on the endpoint is compliant with the Cortex XDR disk encryption policy. * Not Compliant: Indicates that the Cortex XDR agent encryption status on the endpoint is not compliant with the Cortex XDR disk encryption policy. * Not Configured: Indicates that no disk encryption rules are configured on the endpoint. * Not Supported: Indicates that the operating system running on the endpoint is not supported by Cortex XDR. * Unmanaged: Indicates that the endpoint encryption is not managed by Cortex XDR.</p> |
| Endpoint ID | Unique ID assigned by Cortex XDR that identifies the endpoint. |
| Endpoint Name | Hostname of the endpoint. |
| Endpoint Status | Status of the endpoint, for more information, see Manage endpoints. |
| IP Address | Last known IPv4 or IPv6 address of the endpoint. |
| Last Reported | Date and time of the last change in the agent’s status, for more information, see Manage endpoints. |
| MAC Address | MAC address of the endpoint. |
| Operating System | Platform running on the endpoint. |
| OS Version | Name of the operating system version running on the endpoint. |
| Volume Status | Lists all the disks on the endpoint along with the status per volume, Decrypted or Encrypted. For Windows endpoints, Cortex XDR includes the encryption method. |
You can also monitor the endpoint Encryption Status in your Endpoint Administration table.
Configure a disk encryption profile
- Under Inventory → Endpoints → Policy Management → Extensions → Profiles, select + New Profile or Import from File. Choose the Platform and select Disk Encryption. Click Next.
-
Fill-in the general information for the new profile.
Assign a name and an optional description to the profile.
-
Enable disk encryption.
To enable the Cortex XDR agent to apply disk encryption rules using the operating system disk encryption capabilities, Enable the Use disk encryption option.
-
Configure Encryption details.
- For Windows:
- Encrypt or decrypt the system drives.
- Encrypt the entire disk or only the used disk space.
- For Mac:
Inline with the operating system requirements, when the Cortex XDR agent attempts to enforce an encryption profile on an endpoint, the endpoint user is required to enter the login password. Limit the number of login attempts to one or three. Otherwise, if you do not force log in attempts, the user can continuously dismiss the operating system pop-up and the Cortex XDR agent will never encrypt the endpoint.
- For Windows:
-
(Windows only) Specify the Encryption methods per operating system.
For each operating system (Windows 7, Windows 8-10, Windows 10 (1511), and above), select the encryption method from the corresponding list.
Note: You must select the same encryption method configured by the Microsoft Windows Group Policy in your organization for the target endpoints. Otherwise, if you select a different encryption method than the one already applied through the Windows Group Policy, Cortex XDR displays errors.
-
(Mac only) Upload the FileVaultMaster certificate.
To enable the Cortex XDR agent to encrypt your endpoint, or to help users who forgot their password to decrypt the endpoint, you must upload to Cortex XDR the FileVaultMaster certificate / institutional recovery key (IRK). You must ensure the key is signed by a valid authority and upload a CER file only.
-
Save your profile.
When you’re done, Create your disk encryption profile.
- Apply disk encryption profile to your endpoints.
Apply disk encryption profile to your endpoints
After you define the required disk encryption profiles, configure Protection Policies and enforce them on your endpoints. Cortex XSIAM applies Protection policies on endpoints from top to bottom, as you’ve ordered them on the page. The first policy that matches the endpoint is applied. If no policies match, the default policy that enables all communication to and from the endpoint is applied.
-
Under Inventory → Endpoints → Policy Management → Extensions → Policy Rules, select +New policy or Import from File.
Note: When importing a policy, select whether to enable the associated policy targets. Rules within the imported policy are managed as follows: New rules are added to the top of the list. Default rules override the default rule in the target tenant. Rules without a defined target are disabled until the target is specified.
-
Configure settings for the disk encryption policy.
-
Assign a policy name and optional description.
The platform will automatically be assigned to Windows.
- Assign the disk encryption profile you want to use in this rule.
- Click Next.
-
Select the target endpoints on which to enforce the policy.
Use filters or manual endpoint selection to define the exact target endpoints of the policy rules. If exists, the Group Name is filtered according to the groups within your defined user scope.
- Click Done.
Alternatively, you can associate the disk encryption profile with an existing policy. Right-click the policy and select Edit. Select the Disk Encryption profile and click Next. If needed, you can edit other settings in the rule, such as target endpoints and description. When you’re done, click Done.
-
-
Configure policy hierarchy.
Drag and drop the policies in the desired order of execution.
-
Save the policy hierarchy.
After the policy is saved and applied to the agents, Cortex XSIAM enforces the disk encryption policies on your environment.
- Select one or more policies, right-click and select Export Policies. You can choose to include the associated Policy Targets, Global Exceptions, and endpoint groups.
- Monitor the endpoint encryption status.
Host Inventory
Cortex XSIAM Host Inventory, also called Host Insights, provides endpoint asset inventory and operational visibility. Review hardware, software, services, and autoruns across endpoints to identify IT and security issues, such as suspicious services or new autoruns.
Host Inventory data collection
The Cortex XDR agent scans the endpoint every 24 hours for any updates and displays the data found over the last 30 days. Alternatively, you can rescan the endpoint to retrieve the most updated data. It can take Cortex XSIAM up to 6 hours to collect initial data from all endpoints in your network.
Host Inventory prerequisites
The following requirements apply when enabling Host Inventory:
| Requirement | Description |
|---|---|
| Supported Platforms | Windows, Mac, and Linux. |
| Setup and Permissions | Ensure Host Inventory Data Collection is enabled for your Cortex XDR agent. |
Host Inventory entities
Cortex XSIAM Host Inventory includes the following endpoint entities by operating system:
| Entity | Windows | Mac | Linux |
|---|---|---|---|
| Accessibility | – | ✓ | – |
| Applications | ✓ | ✓ | ✓ |
| Autoruns | ✓ | ✓ | ✓ |
| Daemons | – | ✓ | ✓ |
| Disks | ✓ | ✓ | ✓ |
| Drivers | ✓ | – | ✓ |
| Extensions | – | ✓ | – |
| Groups | ✓ | ✓ | ✓ |
| Mounts | – | ✓ | ✓ |
| Services | ✓ | – | – |
| Shares | ✓ | ✓ | ✓ |
| System Information | ✓ | ✓ | ✓ |
| Users | ✓ | ✓ | – |
| Users to Groups | ✓ | ✓ | ✓ |
For each entity, Cortex XSIAM lists all the details about the entity, and the details about the endpoint it applies to. For example, the default Services view lists a separate row for every service on every endpoint:
Alternatively, to better understand the overall presence of each entity on the total number of endpoints, you can switch to an aggregated view (click ) and group the data by the main entity. You can also sort and filter according to the number of affected endpoints. For example, in the Services aggregated view, you can sort by the number of affected endpoints to identify the least commonly deployed service in your network. To get a closer view of all endpoints, right-click and select View affected endpoints.
View Host Inventory
To view the Host inventory, go to Inventory → Endpoints → Host Inventory. You can export the tables and respective asset views to a tab-separated values (TSV) file.
If you have Cloud Posture Security, Cloud Runtime Security, or Cortex XSIAM Premium licenses, go to Inventory → Host Insights → Host Inventory.
| Data | Description |
|---|---|
| Accessibility | Details about installed applications that require and were allowed special permissions to enable a camera, microphone, accessibility features, full disk access, or screen captures. |
| Applications | <p>Details about all applications installed on your endpoints.</p><p>For each application, Cortex XSIAM lists the existing CVEs and the vulnerability severity score that reflects the highest NIST vulnerability score detected for the application.</p><p>To further examine these vulnerabilities, see Application Analysis.</p> |
| Autoruns | <p>Details about executables that start automatically when the user logs in or boots the endpoint.</p><p>Cortex XSIAM displays information about autoruns that are configured in the endpoint Registry, startup folders, scheduled tasks, services, drivers, daemons, extensions, Crond tasks, login items, login, and logout hooks.</p><p>For each autorun, Cortex XSIAM lists the autorun type and configuration, such as startup method, CMD, user details, and image path.</p> |
| Daemons | <p>Details about all daemons that exist on the endpoint.</p><p>For each daemon, Cortex XSIAM lists the following details.</p><ul><li>Information about the daemon, such as the name, type, and path</li><li>Daemon state, indicating whether it is loaded, running, or not running</li></ul> |
| Disks | <p>Details about the disk volumes that exist on an endpoint.</p><p>For each disk that exists on an endpoint, Cortex XSIAM lists details such as the drive type, name, file system, free space, and total size.</p> |
| Drivers | <p>Details about all the drivers installed on an endpoint.</p><p>For each driver, Cortex XSIAM lists all the following details:</p><ul><li>Information about the driver, such as the driver name, type, and path.</li><li><p>Listing details about the driver runtime configuration:</p><ul><li>Driver type</li><li>Whether the driver is currently running, in which mode, and the runtime state</li></ul></li></ul> |
| Extensions | <p>Details about the system and kernel extensions currently running on your Mac endpoints.</p><p>For each extension, Cortex XSIAM lists the following details:</p><ul><li>Extension type, name, path, and version</li><li>Extension state, indicating whether it is running, requires enabling, or unloaded</li></ul> |
| Groups | <p>Details about all user groups defined on an endpoint.</p><p>For each group, Cortex XSIAM lists identifying details, such as name, SID/GID name, and type.</p> |
| Mounts | <p>Details about all the drives, volumes, and disks that were mounted on endpoints.</p><p>For each mount, Cortex XSIAM lists the mount point directory, file system type, mount spec, and GUID.</p> |
| Services | <p>Details about all the services running on an endpoint.</p><p>For each service, Cortex XSIAM lists all the following details:</p><ul><li>Information about the service, such as the service name, type, and path</li><li><p>Listing details about the service runtime configuration and status:</p><ul><li>Whether the service is currently running and what is the runtime state</li><li>Whether you can stop, pause, or delay the service start time</li><li>Whether the service requires interaction with the endpoint desktop</li><li>The name of the user who started the service and the start mode</li></ul></li></ul> |
| Shares | <p>Details about network shared folders defined on an endpoint.</p><p>For each folder, Cortex XSIAM lists all the following details:</p><ul><li>Shared network folder type: Disk Drive, Print Queue, Device, IPC, Disk Drive Admin, Print Queue Admin, Device Admin, IPC Admin</li><li>Identifying details such as folder name, description, and path</li><li>Whether the folder is limited to a maximum number of shares, and the maximum number of allowed shares</li></ul> |
| System Information | <p>General system information about an endpoint.</p><p>For each endpoint, Cortex XSIAM lists all the following details:</p><ul><li>Information about the endpoint hardware, such as manufacturer, model, physical memory, processor architecture, and CPU</li><li>The operating system name and release running on the endpoint</li></ul> |
| Users | <p>List of users whose credentials are stored on the endpoint.</p><p>For each user, Cortex XSIAM lists all the following details.</p><ul><li>Identifying details about the user, such as name and SID/UID</li><li>Details about the account, such as whether the account is active and the account type</li><li>Information about the password set for this user account, such as whether it is required to login, has an expiration date or can be changed</li></ul> |
| Users to Groups | <p>A list mapping all the users, local and in your domain, to the existing user groups on an endpoint.</p><ul><li>Cortex XSIAM includes only the first 10,000 results per endpoint.</li><li>Cortex XSIAM lists only users that belong to each group directly, and does not include users who belong to a group within the main group.</li><li>If a local users group includes a domain user (whose credentials are stored on the Domain Controller server and not on the endpoint), Cortex XSIAM includes this user in the user-to-group mapping, but does not include it in the user's insights view.</li></ul> |
Vulnerability Assessment
Cortex XSIAM vulnerability assessment enables you to identify and quantify the security vulnerabilities on an endpoint. After evaluating the risks to which each endpoint is exposed and the vulnerability status of an installed application in your network, you can mitigate and patch these vulnerabilities on all the endpoints in your organization.
The Vulnerability Assessment feature is included with the Host Insights license. If you have a Cortex Cloud Posture Security, Cortex Cloud Runtime Security, Exposure Management, Attack Surface Management, or Cortex XSIAM Premium license, use the Vulnerability Management feature.
You can access the vulnerability assessment feature by navigating to Inventory → Endpoints → Host Insights → Vulnerability Assessment. Cortex XSIAM uses an advanced algorithm to collect extensive details on common vulnerabilities and exposures from comprehensive databases and to produce an in-depth analysis of endpoint vulnerabilities. Cortex XSIAM retrieves the latest information from the NIST public database to calculate the severity score.
Vulnerability Assessment
Vulnerability Assessment uses an advanced algorithm to collect extensive details on CVEs from comprehensive databases and to produce an in-depth analysis of the endpoint vulnerabilities.
Prerequisite
The following are prerequisites for Cortex XSIAM to perform an Enhanced Vulnerability Assessment of your endpoints.
| Requirement | Description |
|---|---|
| Supported Platforms | <ul><li><p>Windows</p><ul><li>Cortex XDR agent 8.3 or a later release.</li><li>Cortex XDR collects all the information about the operating system and the installed applications, and calculates CVE.</li><li>CVEs that apply to applications that are installed by one user aren't detected when another user without the application installed is logged in during the scan.</li></ul></li><li><p>MacOS</p><ul><li>Cortex XDR agent 8.3 or a later release.</li><li>Cortex XDR collects all the information about the operating system and the installed applications, and calculates CVE.</li></ul></li></ul> |
| Setup and Permissions | Ensure Host Inventory Data Collection is enabled for your Cortex XDR agent. |
| Certificates for Windows and macOS | <p>When Advanced Vulnerability and Assessment is enabled, these certificates are a prerequisite for Windows and macOS.</p><p>Download the certificates from here.</p><ul><li>Import the Digicert Trusted Root G4 certificate into the Trusted Root Certification Authorities store in the local machine.</li><li><p>In some environments, if the scan does not initialize, the DigiCert Trusted G4 Code Signing RSA4096 SHA384 2021 CA1 certificate, may also be required.</p><p>Import the signed certificate into the Intermediate Certification Authorities store in the local machine.</p></li></ul> |
| Limitations | <ul><li>Some CVEs may be outdated if the Cortex XDR agent wasn't updated recently.</li><li>Application versions which have reached end-of-life (EOL) may have their version listed as 0. This doesn't affect the detection of the CVEs.</li><li>Some applications are listed twice. One of the instances may display invalid version, however, this doesn't affect the functionality.</li><li>The scanning process may impact performance on the Cortex XDR agent during scanning. The scan may take up to two minutes.</li></ul> |
After enabling the feature for the first time, it may take up to a week to get the updated data into the platform. Re-collecting the data from all endpoints in your network could take up to 6 hours. After that, Cortex XSIAM initiates periodic recalculations to rescan the endpoints and retrieve the updated data. If at any point you want to force data recalculation, click Recalculate. The recalculation performed by any user on a tenant updates the list displayed to every user on the same tenant.
CVE Analysis
- View CVE details: Left-click the CVE to view in-depth details about it on a panel that appears on the right. Use the in-panel links as needed.
- View a complete list of all endpoints in your network that are impacted by a CVE: Right-click the CVE and then select View affected endpoints.
- Learn more about the applications in your network that are impacted by a CVE: Right-click the CVE and then select View applications.
-
Exclude irrelevant CVEs from your endpoints and applications analysis: Right-click the CVE and then select Exclude. You can add a comment if needed, as well as Report CVE as incorrect for further analysis and investigation by Palo Alto Networks. The CVE is grayed out and labeled Excluded and no longer appears on the Endpoints and Applications views in Vulnerability Assessment, or in the Host Insights widgets. To restore the CVE, you can right-click the CVE and Undo exclusion at any time.
The CVE will be removed/reinstated to all views, filters, and widgets after the next vulnerability recalculation.
You can perform the following actions from Cortex XDR as you analyze the existing vulnerabilities:
| Value | Description |
|---|---|
| Affected endpoints | The number of endpoints that are currently affected by this CVE. For excluded CVEs, the affected endpoints are N/A. |
| Applications | The names of the applications affected by this CVE. |
| CVE | <p>The name of the CVE.</p><p>You can click each individual CVE to view in-depth details about it on a panel that appears on the right.</p> |
| Description | The general NIST description of the CVE. |
| Excluded | Indicates whether this CVE is excluded from all endpoint and application views and filters, and from all Host Insights widgets. |
| Platforms | The name and version of the operating system affected by this CVE. |
| Severity | The severity level (Critical, High, Medium, or Low) of the CVE as ranked in the NIST database. |
| Severity score | The CVE severity score is based on the NIST Common Vulnerability Scoring System (CVSS). Click the score to see the full CVSS description. |
For each vulnerability, Cortex XSIAM displays the following default and optional values.
If you have the Identity Threat Module enabled, you can also view the CVE analysis in the Host Risk View. To do so, from Inventory → Assets → Asset Scores, select the Hosts tab, right-click on any endpoint, and select Open Host Risk View.
To evaluate the extent and severity of each CVE across your endpoints, you can drill down into each CVE in Cortex XDR and view all the endpoints and applications in your environment that are impacted by the CVE. Cortex XDR retrieves the latest information from the NIST public database. From Inventory → Endpoints → Host Inventory → Vulnerability Assessment, select CVEs on the upper-right bar. This information is also available in the va_cves dataset, which you can use to build queries in XQL Search.
Endpoint Analysis
- View endpoint details: Left-click the endpoint to view in-depth details about it on a panel that appears on the right. Use the in-panel links as needed.
- View a complete list of all applications installed on an endpoint: Right-click the endpoint and then select View installed applications. This list includes the application name and version of applications on the endpoint. If an installed application has known vulnerabilities, Cortex XSIAM also displays the list of CVEs and the highest Severity.
- (Windows only) Isolate an endpoint from your network: Right-click the endpoint and then select Isolate the endpoint before or during your remediation to allow the Cortex XDR agent to communicate only with Cortex XSIAM.
- (Windows only) View a complete list of all KBs installed on an endpoint: Right-click the endpoint and then select View installed KBs. This list includes all the Microsoft Windows patches that were installed on the endpoint and a link to the Microsoft official Knowledge Base (KB) support article. This information is also available in the
host_inventory_kbspreset, which you can use to build queries in XQL Search. - Retrieve an updated list of applications installed on an endpoint: Right-click the endpoint and then select Rescan endpoint
You can perform the following actions from Cortex XSIAM as you investigate and remediate your endpoints:
| Value | Description |
|---|---|
| CVEs | A list of all CVEs that exist on applications that are installed on the endpoint. |
| Endpoint ID | Unique ID assigned by Cortex XSIAM that identifies the endpoint. |
| Endpoint name | <p>Hostname of the endpoint.</p><p>You can click each individual endpoint to view in-depth details about it on a panel that appears on the right.</p> |
| Last Reported Timestamp | The date and time of the last time the Cortex XDR agent started the process of reporting its application inventory to Cortex XSIAM. |
| MAC address | The MAC address associated with the endpoint. |
| IP address | The IP address associated with the endpoint. |
| Platform | The name of the platform running on the endpoint. |
| Severity | The severity level (Critical, High, Medium, or Low) of the CVE as ranked in the NIST database. |
| Severity score | The CVE severity score based on the NIST Common Vulnerability Scoring System (CVSS). Click the score to see the full CVSS description. |
For each vulnerability, Cortex XSIAM displays the following default and optional values.
To help you assess the vulnerability status of an endpoint, Cortex XSIAM provides a full list of all installed applications and existing CVEs per endpoint and also assigns each endpoint a vulnerability severity score that reflects the highest NIST vulnerability score detected on the endpoint. This information helps you to determine the best course of action for remediating each endpoint. From Inventory → Endpoints → Host Inventory → Vulnerability Assessment, select Endpoints on the upper-right bar. This information is also available in the va_endpoints dataset. In addition, the host_inventory_endpoints preset lists all endpoints, CVE data, and additional metadata regarding the endpoint information. You can use this dataset and preset to build queries in XQL Search.
Application Analysis
- To view the details of all the endpoints in your network on which an application is installed, right-click the application and select View endpoints.
- To view in-depth details about the application, left-click the application name.
From Inventory → Endpoints → Host Inventory, select Applications.
Starting with macOS 10.15, Mac built-in system applications are not reported by the Cortex XDR agent and are not part of the Cortex XDR Application Inventory.
You can assess the vulnerability status of applications in your network using the Host inventory. Cortex XDR compiles an application inventory of all the applications installed in your network by collecting from each Cortex XDR agent the list of installed applications. For each application on the list, you can see the existing CVEs and the vulnerability severity score that reflects the highest NIST vulnerability score detected for the application. Any new application installed on the endpoint will appear in Cortex XSIAM within 24 hours. Alternatively, you can re-scan the endpoint to retrieve the most up-to-date list.
Set a Cortex XDR agent Critical Environment version
After you install the Cortex XDR agent and the agent registers with Cortex XSIAM, you can set endpoints to run with a Cortex XDR agent Critical Environment (CE) version.
CE versions are designed for sensitive and highly regulated environments. These versions receive full content update coverage and contain the same feature set as the standard line it is based on. Please note, that some bug fixes, introducing higher stability risk, may not be incorporated into the maintenance releases of these lines. Support is provided for CE versions for 24 months, while support for standard versions is provided for 9 months.
To ensure the stability of the line, CE versions maintenance release cadence is longer than in the standard line, we recommend that deployment is adjusted accordingly.
Setting an endpoint with a CE agent version requires you to define your agent configurations which then allows you to do the following:
- Create a CE agent installation package
- Define the upgrade and auto-upgrade in the Agent Settings Profile
Define your agent configuration.
- Navigate to Settings → Configurations → General → Agent Configurations. Scroll down to Critical Environment Versions.
- Click Enable Critical Environment Versions to be Created and Installed in the Tenant.
Track endpoints with CE Agent versions.
Navigate to Inventory → Endpoints → All Endpoints. In the table, locate the Version Type field to view whether the endpoint is defined as a Standard or Critical Environment agent.
Manage endpoint protection
The Cortex XDR agent is installed on each of your endpoints, and you can manage the agents using Cortex XSIAM.
The Cortex XDR agent is installed on each of your endpoints, and you can perform various management activities on the agents, using Cortex XSIAM.
Move agents between managing servers
You can move Cortex XDR agents to other Cortex XSIAM managing servers.
You can move existing agents between Cortex XSIAM managing servers directly from Cortex XSIAM. This can be useful during migration, POCs, or to better manage your agent allocation between tenants. When you change the server that manages the agent, the agent transfers to the new managing server as a freshly installed agent, without any data that was stored on the original managing server. After the Cortex XDR agent registers with the new server, it can no longer communicate with the previous one.
Prerequisite:
Consider the following before making changes:
- Endpoint type is not Kubernetes Node.
- Installation type is not VDI.
- Ensure you have administrator privileges for Cortex XSIAM in the hub.
To register to another managing server, the Cortex XDR agent requires a distribution ID of an installation package on the target server in order to identify itself as a valid Cortex XDR agent. The agent must provide an ID of an installation package that matches the same operating system for the same or a previous agent version. For "same" version, this means all the levels of versioning information, including major version, minor version, patch version, and build number. For example, if you want to move a Cortex XDR Agent 8.x for Windows, you can select from the target managing server the ID of an installation package created for a Cortex XDR Agent 5.x for Windows. The operating system version can be different.
Note:
Cortex XSIAM does not support moving agents between FedRamp and commercial tenants.
How to move Cortex XDR agents to other managing servers in Cortex XSIAM
- Obtain an installation package ID from the target managing server.
- Log in to Cortex XSIAM on the target management server, then navigate to Inventory → Endpoints → Agent Installations.
- From the agent installations table, locate a valid installation package you can use to register the agent. Alternatively, you can create a new installation package if required.
- Right-click the ID field and copy the value. Save this value, as you will need it later for the registration process. If the ID column is not displayed in the table, add it.
-
Locate the Cortex XDR agent you want to move.
Log in to the current managing server of the Cortex XDR agent and navigate to Inventory → Endpoints → All Endpoints.
- Change the managing server.
- Select one or more agents that you want to move to the target server.
- Right-click + Alt to open the options menu in advanced mode, and select Endpoint Control → Change managing server. This option is available only for an administrator in a supported Cortex XSIAM version.
- Enter the ID number of the installation package you obtained in Step 1. If you selected agents running on different operating systems, for example, Windows and Linux, you must provide an ID for each operating system. When done, click Move.
- Track the action.
When you track the action in the Action Center, the original managing server will keep displaying In progress (Sent) status also after the action has ended successfully, since the agent no longer reports to this managing server. The new managing server will add this as a new agent registration action.
Manage endpoint tags
Endpoint tags enable multiple layers of segmentation to your endpoints. An endpoint tag is a dynamic entity that is created and assigned to one or more endpoints. The assigned endpoint tags can then be used to create Endpoint Groups, Policies, and Actions.
For endpoint tag tasks, see:
- create-an-endpoint-tag
- remove-an-endpoint-tag
- track-your-endpoint-tags
- permanently-remove-endpoint-tags-from-the-system
- set-an-alias-for-an-endpoint
Note:
The explanations in this section use Windows operating system installation parameters and Cytool argument examples.
Create an endpoint tag
An endpoint tag can be created during installation of the Cortex XDR agent.
An endpoint tag can be created after installation either from the Cortex XDR agent or from Cortex XSIAM.
Add an endpoint tag as an installation parameter of the Cortex XDR agent's installer
Installer parameter: run msiexec /i ... ENDPOINT_TAGS="Name1,Name2,Name3".
Cytool argument: cytool endpoint_tags add "tag1 [,tag2,...,tagN]".
Tag names are case-sensitive.
In Windows and Mac, a tag name can contain spaces.
Linux does not support tag names with spaces as command-line arguments to the shell installer. Instead, tags can be set in the /etc/panw/cortex.conf configuration file, which supports all Linux installers.
Add an endpoint tag after installation
From the machine where the Cortex XDR agent is installed:
- Navigate to the Cytool folder location and open the CLI as an administrator.
- Cytool argument:
cytool endpoint_tags add "tag1 [,tag2,...,tagN]".
Note:
Tag names are case-sensitive and can contain spaces.
From Cortex XSIAM (Server)
- Navigate to Inventory → Endpoints → All Endpoints.
- Select one or more endpoints, right-click, and select Endpoint Control → Assign Endpoint Tags.
- Select Add tag... and choose one or more tags from the list of existing tags or begin typing a new tag name to Create tag.
- (This step requires administrator permissions) To assign the tag to users or user groups, select Add selected tags to Users or Groups, and select the relevant Users and/or User Groups.
When SBAC is enabled, assigning tags may impact user permissions.
- Click Save.
Remove an endpoint tag
Depending on where you created your tag - Server or Agent, you can choose to edit or remove the tag.
Note:
If you remove the tag and there are assigned users or user groups with scope settings, this can impact user permissions in the system.
Remove an Endpoint tag from the Cortex XDR agent
- Navigate to the Cytool folder location and open the CLI as an administrator.
- Cytool Argument:
cytool endpoint_tags remove "tag1 [,tag2,...,tagN]".
Remove an Endpoint tag from Cortex XSIAM
- Navigate to Inventory → Endpoints → All Endpoints → Tags field.
- Select one or more endpoints, right-click, and select Endpoint Control → Remove Endpoint Tags.
- Click Save.
Track your endpoint tags
Use endpoint tags to identify, filter, and manage assigned endpoints in Cortex XSIAM.
List endpoint tags with the Cortex XDR agent
- Navigate to the Cytool folder location and open the CLI as an administrator.
- Cytool Argument:
cytool endpoint_tags list.
View and filter endpoint tags in Cortex XSIAM
- Navigate to Inventory → Endpoints → All Endpoints → Tags field.
All Server and Agent tags assigned to the endpoint are displayed. Tags created in the Cortex XDR agent show a shield icon.
- Filter or search the Tags field to find endpoints with assigned endpoint tags.
Permanently remove Endpoint tags from the system
Using API, you can maintain the available tag list by permanently removing unused endpoint tags from your system.
/public_api/v1/tags/agents/delete_permanently/
Set an alias for an endpoint
To identify one or more endpoints by a name that is different from the endpoint hostname, you can configure an alias. You can set an alias for a single endpoint or set an alias for multiple endpoints in bulk. To quickly search for the endpoints during an investigation and when you need to take action, you can use either the endpoint hostname or the alias.
- Select Inventory → Endpoints → All Endpoints.
- Select one or more endpoints.
- Right-click anywhere in the endpoint rows.
- Select Endpoint Control → Change Endpoint Alias.
- Enter the alias name and click Update.
Tip:
If you change your mind, select Endpoint Control → Change Endpoint Alias again, and delete the required aliases.
- Use the Quick Launcher to search for endpoints by alias across Cortex XSIAM.
Manage endpoint prevention profiles
You can manage the endpoint prevention profiles of your Cortex XDR agent endpoints in various ways, including editing, duplicating, and populating endpoint prevention policy rules.
After you create and customize your endpoint prevention profiles, you can manage them from the Prevention Profiles page as needed.
View the prevention policy rules that use a specific prevention profile
Before you modify or delete a profile, you can check which policy rules, if any, use the profile.
- From Inventory → Endpoints → Policy Management → Prevention → Profiles, right-click the profile and select View policy Rules.
Cortex XSIAM opens the Prevention Policy Rules page on a new tab. This page is filtered, and only displays the rules that use the profile that you selected.
Edit, export, duplicate, or delete an endpoint prevention profile
Edit a profile:
From Inventory → Endpoints → Policy Management → Prevention → Profiles, right-click the profile and select Edit.
Make your changes, and then click Save.
Export a profile:
From Inventory → Endpoints → Policy Management → Prevention → Profiles, right-click the profile and select Export Profile.
Click Export. The profile is downloaded to your computer.
Duplicate a profile:
From Inventory → Endpoints → Policy Management → Prevention → Profiles, right-click the prevention profile and select Save as New. A new profile is displayed, containing the values from the profile that you selected.
Edit the profile name and description, edit any values that you want to change, and then click Create.
Populate a new prevention policy rule with your new profile.
Delete a profile:
If necessary, delete or detach any policy rules that use the profile before attempting to delete it.
From Inventory → Endpoints → Policy Management → Prevention → Profiles, locate the profile that you want to remove. The profile's Usage Count cell must have a 0 (zero) value.
Right-click the prevention profile and select Delete.
To confirm the deletion, click Yes.
Populate a new prevention policy rule with a prevention profile
From Inventory → Endpoints → Policy Management → Prevention → Profiles, right-click the profile and select Create a new policy rule using this profile.
Cortex XSIAM automatically populates the Platform selection based on your profile configuration, and assigns the profile based on the profile type.
For Policy Name, enter a meaningful name, and optionally, add a description for the policy rule.
Assign any additional profiles that you want to apply to your policy rule, and click Next. A list of endpoints is displayed.
Select the target endpoints for the policy rule, or use the filters to define criteria for the policy rule to apply, and then click Next.
Review the policy rule summary, and then click Done.
Create a new prevention policy rule for serverless function
From Inventory → Endpoints → Policy Management → Prevention → Profiles, right-click the profile and select Create a new policy rule using this profile.
Cortex XSIAM automatically populates the Platform selection based on your profile configuration as well as the Restricitons selection with the selected profile.
For Policy Name, enter a meaningful name, and optionally, add a description for the policy rule, and then click Next.
Use the filters to define criteria for the policy rule to apply, and then click Next.
Select from the following function parameters:
- Cloud provider
- Region
- Runtime
- Function version
- Endpoint name
Review the policy rule summary, and then click Done.
The filter is stored within the policy definition and assessed during runtime to extract the functions that match the filter criteria.
View information about your endpoint prevention profiles
The following table displays the fields that are available on the Prevention Profiles page, in alphabetical order. The table includes both default fields and additional fields that are available in the column manager. To view this page, go to Inventory → Endpoints → Policy Management → Prevention → Profiles.
| Field | Description |
|---|---|
| Associated Targets | The endpoints or endpoint groups to which the profile is assigned |
| Created By | The administrator who created the prevention profile |
| Created Time | The date and time at which the prevention profile was created |
| Description | An optional description entered by an administrator to describe the prevention profile |
| Modification Time | The date and time at which the prevention profile was modified |
| Modified By | The administrator who modified the prevention profile |
| Name | The prevention profile name |
| Profile ID | The ID assigned to to the profile by Cortex XSIAM |
| Summary | Summary of prevention profile configuration |
| Type | The prevention profile type, such as Malware or Agent Settings |
| Usage Count | The number of policy rules that use the profile. If you want to delete a profile, ensure that this cell displays "0". |
Upgrade Cortex XDR agents
You can upgrade the Cortex XDR agent software by using the appropriate method for the endpoint operating system.
After you install the Cortex XDR agent and the agent registers with Cortex XSIAM, you can upgrade the Cortex XDR agent software using a method supported by the endpoint platform:
- Android: Upgrade the app directly from the Google Play Store or push the app to your endpoints from an endpoint management system such as AirWatch.
- iOS: Upgrade the app directly from the Apple App Store (agent version 8.6 or later), or push the app to your endpoints from an endpoint management system.
- Windows, Mac, or Linux: Create new installation packages and push the Cortex XDR agent package to up to 5,000 endpoints from Cortex XSIAM.
Important:
The following list includes important points to take into account when upgrading the Cortex XDR agent:
- Review the recommended guidelines for keeping Cortex XDR agents and content updated. Read more here.
- You cannot upgrade the Cortex XDR agent on VDI endpoints or a Golden Image.
- You must reinstall (uninstall and install again) the relevant agent version on the Golden Image,
- Installing a Golden Image for the Citrix App Layering environment must be performed on OS layer only.
- Every new agent version installation must be performed on OS layer's version where the agent was not previously installed. There is no possibility to reinstall agent on the Golden Image for the Citrix App Layering environment.
- You cannot enable auto-upgrade for Mobile, VDI, and TS installations.
Warning:
You must ensure that the System Extensions were approved on the endpoint. Otherwise, if the extensions were not approved, after the upgrade the extensions remain on the endpoint without any option to remove them, which could cause the agent to display unexpected behavior. To check whether the extensions were approved, you can either verify that the endpoint is in Fully Protected state in Cortex XSIAM, or execute the following command line on the endpoint to list the extensions: systemextensionsctl list. If you need to approve the extensions, follow the workflow explained in the Cortex XDR agent administration guide for approving System Extensions.
Upgrades are supported using actions that you can initiate from the Action Center or from All Endpoints as described in this workflow.
How to upgrade Cortex XDR agent software
Create an agent installation package for each operating system version for which you want to upgrade the Cortex XDR agent.
Note the installation package names.
Select Inventory → Endpoints → All Endpoints.
If needed, filter the list of endpoints. To reduce the number of results, use the endpoint name search and filters Filters at the top of the page.
Select the endpoints you want to upgrade.
You can also select endpoints running different operating systems to upgrade the agents at the same time.
Right-click your selection and select Endpoint Control → Upgrade Agent Version.
For each platform, select the name of the installation package you want to push to the selected endpoints.
You can install the Cortex XDR agent on Linux endpoints using a package manager. If you do not want to use the package manager, clear the option Upgrade to installation by package manager.
When you upgrade an agent on a Linux endpoint that is not using a package manager, Cortex XSIAM upgrades the installation process by default according to the endpoint Linux distribution.
Note:
The Cortex XDR agent keeps the name of the original installation package after every upgrade.
Upgrade.
Cortex XSIAM distributes the installation package to the selected endpoints at the next heartbeat communication with the agent. To monitor the status of the upgrades, go to Investigation & Response → Response → Action Center.
From the Action Center, you can also view additional information about the upgrade; right-click the action and select Additional data. Whilst the upgrade status is Pending, it can be canceled; right-click the action and select Cancel Agent Upgrade.
- It is possible to cancel an upgrade if the Status is Pending. Once the Status is In Progress, the action is already received by the agent locally and cannot be canceled from the management console.
- Custom dashboards that include upgrade status widgets and the All Endpoints page display upgrade status.
- During the upgrade process, the endpoint operating system might request a reboot. However, you do not have to perform the reboot for the Cortex XDR agent upgrade process to complete it successfully.
- After you upgrade on an endpoint with Cortex XSIAM Device Control rules, you need to reboot the endpoint for the rules to take effect.
Restart agent
You can restart an agent from the Cortex XSIAM tenant.
This action is hidden by default.
As soon as the action is confirmed, the restart command triggers a restart of the agent on the endpoint.
From Cortex XSIAM, navigate to Inventory → Endpoints → All Endpoints. Select the relevant endpoint to restart and right-click + Alt, select Endpoint Control → Restart Agent, and click OK.
Select I agree, and then click OK to confirm restarting the agent on all selected endpoints.
Uninstall the Cortex XDR agent
Uninstall Cortex XDR agent from one or more endpoints at any time using the Action Center, or one-by-one using the All Endpoints page.
If you want to uninstall the Cortex XDR agent from the endpoint, you can do so from the Cortex XSIAM tenant at any time. You can uninstall them from an unlimited number of endpoints in a single bulk action using the Action Center. You can also uninstall each endpoint one-by-one, using the All Endpoints page. Uninstallation of an endpoint triggers the following lifespan flow:
- When you uninstall the agent from the endpoint, the action is immediate. All agent files and protections are removed from the endpoint, leaving the endpoint unprotected.
- The endpoint status changes to Uninstalled , and the license returns immediately to the license pool. After a retention period of 7 days, the agent is deleted from the database and is displayed in Cortex XSIAM as Endpoint Name -
N/A (Uninstalled). - Data associated with the deleted endpoint is displayed in the Action Center tables and the Causality View for the standard 90-day retention period.
- Issues that already include the endpoint data at the time of the issue creation are not affected.
Note:
- Before upgrading a Cortex XDR agent running on macOS 10.15.4 or later, you must ensure that the System Extensions were approved on the endpoint. Otherwise, if the extensions were not approved, after the upgrade the extensions remain on the endpoint without any option to remove them which could cause the agent to display unexpected behavior. To check whether the extensions were approved, you can verify that the endpoint is in a Fully Protected state in Cortex XSIAM or execute the following command line on the endpoint to list the extensions:
systemextensionsctllist. If you need to approve the extensions, follow the workflow explained in the Cortex XDR agent administration guide for approving System Extensions. - For iOS and Android endpoints, uninstallation will reset account registration and data, but the app itself will remain on the device until removed locally by the user. The endpoint will be disconnected, and the user will no longer be able to connect the app to the tenant account.
Uninstall endpoints using the Action Center
Go to Investigation & Response → Response → Action Center.
Click + New Action.
Select Agent Uninstall.
Click Next.
Select the target endpoints (up to 100) from which you want to uninstall the Cortex XDR agent.
Tip:
If needed, use the filter to filter the list of endpoints by attribute or group name.
Click Next.
Review the action summary and click Done when finished.
To track the status of the uninstallation, return to the Action Center.
Uninstall endpoints using the All Endpoints page
Go to Inventory → Endpoints → All Endpoints.
Find and then right-click the agent that you want to uninstall, and select Endpoint Control → Uninstall Agent.
In the confirmation dialog box that appears, select I agree, and click OK.
Clear agent database
Learn how to clear the Cortex XDR agent database.
If one or more Cortex XDR agents are having issues, you can attempt a reset by clearing the Cortex XDR agent state of one or more endpoints.
Note:
Clearing the agent database is supported on all platforms with Cortex XDR agent version 7.9 or later, and is available only when using the debugging mode.
Clearing the agent database is available only when using the debugging mode, and can be tracked in the Action Center.
Clear Agent Database.
- Navigate to Inventory → Endpoints → All Endpoints and select one or more endpoints for which you want to clear the database.
- In Windows, press ALT and right-click, or in macOS press Option and right-click, to open the context menu in debugging mode.
- Navigate to Endpoint Control → Clear Agent Database.
Track progress of the Clear Database action.
- Navigate to Investigation & Response → Response → Action Center.
- In the All Actions table, filter the Action Type field according to Agent Database Cleanup.
Note:
You can only right-click to cancel the clear agent database for actions with a pending status.
Delete Cortex XDR agents
If you have an endpoint that you no longer want to track through Cortex XSIAM, for example, if the endpoint disconnected from Cortex XSIAM, or an endpoint where the Cortex XDR agent was uninstalled, you can delete the endpoint from the Cortex XSIAM tenant views.
Deleting an endpoint triggers the following lifespan flow:
- The endpoint status changes to Deleted , and the license returns immediately to the license pool. After a retention period of 90 days, the agent is deleted from the database and is displayed in Cortex XSIAM as Endpoint Name -
N/A (Deleted). - Data associated with the deleted endpoint is displayed in the Action Center tables and in the Causality View for the standard 90-day retention period.
- Alerts that already include the endpoint data at the time of alert creation are not affected.
Additionally, Cortex XSIAM automatically deletes agents after a long period of inactivity.
- Standard agents are deleted after 180 days of inactivity. Where day one is the first 24 hours of continuous inactivity.
- VDI and TS agents are deleted after 6 hours of inactivity.
Note:
To reinstate an endpoint, you have to uninstall and reinstall the agent.
The following workflow describes how to delete the Cortex XDR agent from one or more Windows, Mac, or Linux endpoints.
- Select Inventory → Endpoints → All Endpoints.
- Right-click the endpoint you want to remove.
You can also select multiple endpoints if you want to perform a bulk delete.
- Select Endpoint Control → Delete Endpoint.
Manage agent tokens
You can now run some of the agent functions that require administrative passwords using a unique token shared between Cortex XSIAM and Cortex XDR agent.
Two types of tokens can be set:
- Rolling token: Automatically generated per endpoint every fourteen days by the system and then sent to the relevant agent
- Temporary token: Set a temporary token that is valid anywhere from one to twenty-one days.
Note:
Agent tokens are only supported for Windows and Mac.
View agent password
You can view the password of the selected agent. The dialog box indicates whether the password is from a rolling token or a temporary token.
- Select Inventory → Endpoints → All Endpoints → Endpoint Control → View Token.
- Click the copy button to copy the password displayed and then click OK.
You can now use the password to run functions at the agent.
Add a temporary token
You can generate a temporary token for any of the agents for a specified number of days between 1 and 21 days. If the agent is disconnected, it gets the temporary token when the agent connects.
Note:
You can select one or multiple agents to add a temporary token.
- Select Inventory → Endpoints → All Endpoints → Endpoint Control → Set Temporary Token.
- In the Token Expiration field, add the number of days for which to generate a temporary token for the agent, and then click the Add Token Expiration blue arrow.
- Click the copy button to copy the password displayed and then click Create to begin generating the token.
- Go to the Action Center to view which agent received the temporary token.
You can now use the password to run functions on the agent.
Retrieve the token using the token hash from the endpoint
If the endpoint is disconnected from the server at the point the rolling token was updated, it won’t be possible to run agent functions with the updated token from the server. You can still retrieve the password to run functions on the agent.
- From the agent, run the
cytool.exeto run the token query command. This command displays the current token of the endpoint. - Copy the token from the command line interface of the agent.
- In the server, at the top of the page, click Retrieve Token.
- In the Retrieve Token dialog box, in the Hash field, paste the token that you copied from the endpoint.
- Click the copy button to copy the password displayed and then click OK.
You can now use the password to run functions on the agent.
Retrieve support file password
The Cortex XDR agent generates the Tech Support File (TSF) as a password-protected zip archive. The TSF is packaged inside an outer archive that also contains a metadata file with the encrypted token used to retrieve the password. Follow the steps below to retrieve the password and unzip the file.
The TSF is generated in either of two ways:
- Remotely from Cortex XSIAM - The Retrieve Support File action is initiated from the Action Center or from an endpoint's page. The resulting archive is downloaded from the Action Center.
- Locally from the endpoint - The
cytool log collectcommand is run on the endpoint's command line. The resulting archive is saved on the endpoint's local filesystem.
Locate the token
Find the encrypted token inside the archive.
- Open the outer archive that contains the TSF. This is either the file you downloaded from the Action Center or the file saved locally on the endpoint.
- Locate and open the metadata file (typically named
_CRYPTO-INFO). - Copy the encrypted token string it contains.
Retrieve the TSF file password
The next steps depend on how the TSF was generated.
From the Action Center
Follow these steps if the TSF was downloaded from the Action Center.
- Go to Action Center → All Actions.
- Locate your Support File Retrieval action.
- Right-click the action and select Retrieve Support File Password.
- In the Retrieve Support File Password dialog box, in the Encrypted Password field, paste the token that you copied in Step 1.
- Click the copy button to copy the displayed password and then click Ok. Use the password to unzip the TSF file.
From the endpoint
Follow these steps if the TSF was collected locally by running the cytool log collect command on the endpoint's command line.
- Go to Inventory → Endpoints → All Endpoints.
- At the top of the page, click the key icon
 (Tokens and Passwords) and select Retrieve Support File Password.
 - In the Retrieve Support File Password dialog box, in the Encrypted Password field, paste the token that you copied in Step 1.
- Click the copy button to copy the password displayed and then click Ok. Use the password to unzip the TSF file.
Send push notifications to iOS
You can push a notification to the Cortex XDR agent on the iOS device from Cortex XSIAM.
- Navigate to Inventory+Endpoints → All Endpoints and locate the required iOS device or devices.
- Right-click and select Endpoint Control → Send Push Notification.
- Select one of the following notifications to send to the agent:
| Notification | Action |
|---|---|
| Device Checkup | When the App user taps the received notification, the app will open on the device, ready to perform the checkup. Tap Perform Check Up to initiate a device checkup. |
| Verify App Permissions | If the Phone permissions are not set correctly for full protection, the user is instructed to allow permission. The App user must tap Open Permissions Wizard from the iOS device Home screen and follow the wizard to enable and allow the required settings for full protection. |
| Custom message | Admin can send a message with a header and body text to designated App users. The App user will receive this textual message. |
Monitor agent operational status
In Cortex XSIAM, you have full visibility into the Cortex XDR agent operational status on the endpoint, which indicates whether the agent is protecting according to its predefined security policies and profiles. By observing the operational status on the endpoint, you can identify when the agent may suffer from a technical issue or misconfiguration that interferes with the agent’s protection capabilities or interaction with Cortex XDR and other applications. The Cortex XDR agent reports the operational status as follows:
- Protected: Indicates that the Cortex XDR agent is running as configured and did not report any exceptions to Cortex XDR.
- Partially protected: Indicates that the Cortex XDR agent reported one or more exceptions to Cortex XDR.
- Unprotected: Indicates that the Cortex XDR agent is not enforcing protection on the endpoint.
- Local Resource Impact: Indicates that the Cortex XDR agent machine resources currently available for use are not enough for the agent to operate smoothly.
You can monitor the Cortex XDR agent Operational Status in Inventory → Endpoints → All Endpoints. If the Operational Status field is missing, add it.
The operational status that the agent reports varies according to the exceptions reported by the XDR agent.
| Status | Description |
|---|---|
| Protected | <p>Windows, Mac, and Linux: Indicates that all protection modules are running as configured on the endpoint.</p><p>iOS: Indicates that all required configurations are correct, and all required permissions are granted:</p><ul><li>Notifications permission</li><li>Background app refresh permission</li><li>The Cortex XDR widget is in use on the home screen. When the Network Shield is disabled, the Cortex XDR widget is required. The widget is mandatory on unsupervised devices.</li></ul><p>Android: Indicates that communication with the tenant is active.</p> |
| Partially protected | <p>Windows</p><ul><li>XDR data collection is not running, or not set</li><li>Behavioral threat protection is not running</li><li>Malware protection is not running</li><li>Exploit protection is not running</li></ul><p>Mac</p><ul><li>Operating system adaptive mode*</li><li>XDR Data Collection is not running, or not set</li><li>Behavioral threat protection is not running</li><li>Malware protection is not running</li><li>Exploit protection is not running</li></ul><p>Linux</p><ul><li>Kernel module not loaded</li><li>Kernel module compatible but not loaded</li><li>Kernel version not compatible**</li><li>XDR Data Collection is not running, or not set</li><li>Behavioral threat protection is not running</li><li>Anti-malware flow is asynchronous</li><li>Malware protection is not running</li><li>Exploit protection is not running</li></ul><p>iOS</p><ul><li>The device is not fully protected, because some, but not all, of the configuration and permission requirements are fulfilled</li></ul><p>Any of the listed items could lead to a partially protected state. Refer to the Cortex XDR management console for specific reasons for the state.</p> |
| Unprotected | <p>Windows, Mac, and Linux:</p><ul><li>Behavioral threat protection and Malware protection are not running</li><li>Exploit protection and malware protection are not running</li><li>The content is unavailable</li></ul><p>iOS:</p><p>The device is not fully protected, due to one or more of the following reasons:</p><ul><li>Configurations might be incorrect</li><li>The required permissions might not be enabled</li></ul><p>Android:</p><ul><li>The device is not fully protected, because communication between the device and the tenant has been inactive for three or more hours</li></ul> |
| Local Resource Impact | <p>Windows, Mac, Linux</p><ul><li>Machine CPU impact on the agent operation</li><li>Machine memory impact on the agent operation</li></ul><p>In addition to the status, either one of the following sub-statuses appear:</p><ul><li>Low local available memory</li><li>No local available memory</li></ul> |
Status can have the following implications on the endpoint:
- *(
Status): The exploit protection module is not running. - **(
Status):- XDR data collection is not running
- Behavioral threat protection is not running
- Anti-malware flow is asynchronous
- Local privilege escalation protection is asynchronous
Monitor agent activity
The Cortex XDR agent logs entries for events that are monitored by the Cortex XDR agent and hourly reports the logs back to Cortex XDR. Cortex XDR stores the logs for 365 days. To view the Cortex XDR agent logs, select Settings → Agent Audit Logs.
To ensure you and your colleagues stay informed about agent activity, you can configure notification forwarding to forward your Agent Audit log to an email distribution list, Syslog server, or Slack channel. See the Configure Notifications Forwarding section.
You can customize your view of the logs by adding or removing filters to the Agent Audit Logs table. You can also filter the page result to narrow down your search. The following table describes the default and optional fields that you can view in the Cortex XDR Agents Audit Logs table:
| Field | Description |
|---|---|
| Category | <p>The XDR agent logs these endpoint events using one of the following categories:</p><ul><li>Audit: Successful changes to the agent indicating correct behavior.</li><li>Monitoring: Unsuccessful changes to the agent that may require administrator intervention.</li><li>Status: Indication of the agent status.</li></ul> |
| Description | Log message that describes the action. |
| Domain | Domain to which the endpoint belongs. |
| Endpoint ID | A unique ID assigned by the XDR agent. |
| Endpoint Name | Endpoint hostname. |
| Received Time | Date and time when the action was received by the agent and reported back to Cortex XDR. |
| Result | The result of the action (Success, Fail, or N/A) |
| Severity | <p>Severity associated with the log:</p><ul><li>Critical</li><li>High</li><li>Medium</li><li>Low</li><li>Informational</li></ul> |
| Type and Sub-Type | <p>Additional classification of agent log (Type and Sub-Type):</p><ul><li><p>Installation:</p><ul><li>Install</li><li>Uninstall</li><li>Upgrade</li></ul></li><li><p>Policy change:</p><ul><li>Local Configuration Change</li><li>Content Update</li><li>Policy Update</li><li>Process Exception</li><li>Hash Exception</li></ul></li><li><p>Agent service:</p><ul><li>Service start (reported only when the agent fails to start and the RESULT is Fail)</li><li>Service stopped</li><li>Anti-Tampering (reported when anti-tamper protection is disabled locally on an agent)</li></ul></li><li><p>Agent modules:</p><ul><li>Module initialization</li><li>Local analysis module</li><li>Local analysis feature extraction</li></ul></li><li><p>Agent status:</p><ul><li>Fully protected</li><li>OS incompatible</li><li>Software incompatible</li><li>Kernel driver initialization</li><li>Kernel extension initialization</li><li>Proxy communication</li><li>Quota exceeded (reported when old prevention data is being deleted from the endpoint)</li><li>Minimal content</li></ul></li><li><p>Action:</p><ul><li>Endpoint Token</li><li>Scan</li><li>File retrieval</li><li>Terminate process</li><li>Isolate</li><li>Cancel isolation</li><li>Payload execution</li><li>Quarantine</li><li>Restore</li><li>Block IP address</li><li>Unblock IP address</li><li>Tagging</li></ul></li></ul> |
| Timestamp | Date and time when the action occurred. |
| XDR Agent Version | The version of the XDR agent running on the endpoint. |
Monitor agent upgrade status
From Cortex XSIAM, you have full visibility into the Cortex XDR agent upgrade status on the endpoint. You can monitor the Cortex XDR agent statuses in Inventory → Endpoints → All Endpoints. If the upgrade status fields are missing, add them. Cortex XDR agents report upgrade statuses as follows:
| Status | Description |
|---|---|
| Last upgrade status | <p>Displays the last upgrade status for each endpoint, and can be filtered by:</p><ul><li>In Progress: This is the first stage shown when an upgrade is initiated (There is no Pending status).</li><li>Completed Successfully</li><li>Failed</li><li>No Upgrade: No upgrade of any type has been initiated for the endpoint. Newly installed endpoints will also show this status until an upgrade is initiated by one of the upgrade methods.</li></ul> |
| Last upgrade status time | Displays a timestamp for the last time the upgrade status changed for each endpoint. This column can be filtered by date and time. |
| Last upgrade failure reason | When relevant, displays the reason for an upgrade failure. This column can be filtered by free text. |
| Last upgrade source | <p>Displays the source that initiated the last upgrade, and can be filtered by:</p><ul><li>Manual Server Upgrade: The upgrade was manually initiated from the server.</li><li>Auto Upgrade: The endpoint was automatically upgraded according to the upgrade policy.</li><li>Local Manual Upgrade: The upgrade was manually initiated at the endpoint side.</li></ul> |
Endpoint DLP
Cortex XSIAM Endpoint DLP helps prevent sensitive data exfiltration from managed endpoints.
It classifies content and validates true file types. Data-in-motion rules enforce protection across supported endpoint applications.
Use these topics to plan, configure, monitor, and investigate Endpoint DLP:
Cortex Data Loss Prevention (DLP) module overview
Prerequisite
- Endpoint DLP add-on
- Cortex agent 9.1 and above for Windows and macOS
The Cortex Data Loss Prevention (DLP) module provides a unified, flexible solution for preventing the exfiltration of sensitive data. It continuously enforces policies on endpoints (even offline) across web, local, and USB channels, protecting both on-premises and cloud environments.
After endpoint DLP is enabled, the DLP module is downloaded to all eligible endpoints.
This highlights Cortex's benefit of proactively safeguarding sensitive information. Future enhancements will include data-at-rest discovery, adaptive policies, and broader channel support.
Supported platforms and browsers
- Supported platforms:
- Windows: x64 (ARM CPU architecture not supported)
- macOS
- Supported browsers for the Cortex data security extension: Google Chrome and Microsoft Edge (Chrome Enterprise is not supported in MDM mode)
- Either the endpoint must be joined to a domain, or the browser must be managed.
Supported file types and extensions
Windows/macOS supported file types and extensions
| Category/application | Supported formats and extensions |
|---|---|
| Microsoft Office | doc, docx, dotx, ppsx, potx, ppt, pptx, xls, xlsx, xsltx |
| Microsoft Visio | vsd, vsdm, vsdx |
| iWork | key, numbers, pages |
| Standard documents | csv, pdf, rtf, txt, xps, oxps |
| Image files and storage | bmp, jpeg, jpg, png, tif, tiff |
| Source code/development (C-family) | c, cpp, cxx, c++, h, hpp, cs, m |
| Source code/development (scripting and programming) | cgi, jav, java, js, pl, ps1, py, r, rb, vbs |
| Source code/development (hardware and assembly) | asm, s, v, verilog, vh, vhd1, vlg |
| Archived and compressed files (supported from 9.3) | <p>zip, 7z, rar, tar, gz, tar.bz2, tbz2, tar.bz, tbz, tar.xz, txz, tar.zst, tzst</p><p>*tgz - will not be supported in 9.3</p> |
Agent limitations
- Supported platforms: Windows and macOS
- Minimum agent version: 9.1.0
- USB channel on Windows:
- Before Windows 11 version 22H2, tracking is limited to files transferred to USB drives via File Explorer.
- Archive file support: The system can scan up to 50 levels of nested archives. Content beyond this limit is not classified.
- Supported file size: up to 300 MB (Cortex agent 9.3 and later).
- Handwritten text: Detection of handwritten text is currently not supported.
- Local applications:
- On Windows, we only support WebView2-based applications such as WhatsApp, Microsoft Teams, and Zoom starting from agent version 9.2.0.
Use cases
- Protecting personal information: Protects information like names, addresses, and credit card numbers to adhere to privacy policies (like GDPR or HIPAA).
- Guarding company secrets: Prevents valuable designs, formulas, and business plans from falling into the wrong hands (like competitors).
- Meeting legal rules: Helps businesses in specific industries (like healthcare or finance) follow strict laws about handling data.
- Stopping leaks (accidental or intentional): Catches employees trying to email sensitive files to their accounts or upload them to unauthorized websites. It also helps prevent cybercriminals from stealing data.
- Seeing and controlling data: Helps you locate all your important data and allows you to determine who can access it and how it can be utilized.
User roles and permissions
Cortex DLP now includes two new out-of-the-box roles:
- Data security admin: Defines the policy and its key components, including applications.
- Data security viewer: Reviews and analyzes DLP-related issues.
Refer to the Personas workflow for DLP for steps on how to create and manage endpoint DLP in your environment.
Verify that the user has the correct permissions in the linked role for access and configuration permissions to DLP capabilities.
- Go to Settings → Configuration → Access Management → Roles.
- Go to the relevant role, right-click and select Edit Role, and in the Components tab, verify under Data Security that the settings are configured to View/Edit.
Archive file classification
Available from Cortex XDR Agent 9.3.
Archive file classification allows Cortex Data Loss Prevention (DLP) to inspect the contents of archive files (even if compressed). By applying your data-in-motion rules to the files inside, DLP ensures sensitive data remains protected even when packaged in an archive.
How it works
- Archive-Level Enforcement: DLP evaluates the archive as a single entity. If any supported file within the archive matches a data profile in a data-in-motion rule, the rule's designated action (Block, Report, or Allow) is applied to the entire archive. Files inside the archive are not enforced individually.
- Deep Inspection: DLP inspects nested archives up to 50 levels deep. There is no limit on folder depth within the archive.
- Unsupported Files: Any files inside the archive that are not supported for classification are safely skipped and do not impact the overall result.
Supported archive formats
Archive file classification supports common archive formats that vary between operating systems. For a complete list of supported file types, refer to the Supported files documentation.
Note:
Archive inspection is subject to standard file size constraints. The total archive size must remain within the maximum supported file size detailed in the Agent-side limitations.
Partial classification
Archives support partial classification. If DLP cannot fully scan an archive, for example, if the inspection times out, it will still enforce data-in-motion rules based on the contents it successfully classified.
- If a match is found in the scanned portion, DLP applies the matched main action.
- If no rule matches the scanned contents, DLP applies the default action defined in your endpoint DLP settings.
- If the archive is password-protected, it can still match data profiles that use the password-protected filter.
True-file type detection
When Cortex Data Loss Prevention (DLP) scans a file, true file-type detection identifies the file based on its actual internal format rather than relying on its file extension.
This ensures consistent policy enforcement and prevents users from intentionally bypassing DLP rules by masking files.
- Accurate Enforcement: DLP recognizes the sensitive data inside the file and applies the matching data-in-motion rule, regardless of the file's current extension.
- Evasion Prevention: If a user renames a restricted document (for example, changing
report.pdftoreport.log), DLP still identifies the true file type as a PDF, scans the embedded sensitive data, and enforces the appropriate rule.
Supported file scans on Windows and macOS
Personas workflow for DLP
The workflow outlines the responsibilities of the data security administrator and data security viewer in identifying and assessing data protection requirements, creating data-in-motion rules, investigating DLP-related issues, and protecting the organization's assets and data properties.
Data security administrator
The data security administrator views and manages all data security information, including objects and data patterns.
They are responsible for creating and managing data-in-motion rules and identifying and investigating DLP-type threats and attacks within an organization.
Steps:
- Configuring Endpoint DLP Settings: Configure the settings according to your organization's needs.
- Configuring sensitive data definitions: Identify and classify sensitive data (Data Profiles and Data Patterns).
- Configuring policies: Set rules to apply for sensitive data.
- Investigate: Review and analyze DLP-related issues to gather information to reduce false positives, refine policies, and improve incident response and auditing.
- Refine policies: Adjust DLP rules to improve accuracy, reduce false positives, and address new risks.
Data security viewer
The data security viewer reviews and analyzes DLP-related issues to gather information that will help reduce false positives, refine policies, and improve incident response and auditing.
Steps:
- Investigate and remediate: For true incidents, stop the data loss and investigate what happened and why.
- Document and report: Create a record of the incident for legal and compliance purposes.
- Communicate and educate: Speak to the user involved and update security training to prevent future issues.
Best Practices
The following guidelines are best practices for creating a DLP workflow to optimize DLP design and performance. Whether you are starting or building a new rule, we recommend reviewing these recommendations carefully so your DLP plan has a clear, logical flow and runs correctly and efficiently.
When defining a data-in-motion rule, start with a couple of endpoints to verify that the rule you created is working before implementing it for a wider audience.
Use clear rule names and descriptions
Describe rules clearly. Rules should be clear to someone not familiar with the DLP workflow. This applies to rule names and the rule description. When naming a data-in-motion rule, the guideline should be that users can understand what the rule does by reading the rule name alone, without needing to open the rule to view its details.
| Clear | Unclear |
|---|---|
| Block files classified as PII to Google Drive | Block PII file |
| <div data-gb-custom-block data-tag="hint" data-style="info" class="hint hint-info"><p>Note</p><p>A good example would be to add the description from the Raised Issue Name of the specific Data-in-Motion rule.</p></div><p>Block uploads to social networks</p> | Block social network |
Select the appropriate action
Choosing to BLOCK a source will prevent it from reaching its destination. Be sure to consider the consequences before you decide to BLOCK or ALLOW. You can always use the REPORT action before to test that the rule is properly configured to identify the correct conditions and data.
Consider the source, destination, and data scope
If no source is defined, you must select the data scope. The data scope defines the data profile, which constitutes sensitive data for your organization and applies to both files and tables.
The source refers to the data we want to protect. When selecting the source, select the web application from which the file originated. The DLP process inspects data as it's being transmitted and takes action based on the policy.
| Endpoint type | Setting | Example |
|---|---|---|
| Source | Custom web application group | <p>Add a custom web application (should be configured before creating the rule) called Sensitive sources , which contains the following URLs:</p><ul><li>Workday.com</li><li>OurCorporatePortal.de</li></ul><div data-gb-custom-block data-tag="hint" data-style="info" class="hint hint-info"><p>Note</p><p>When adding a source, it becomes a mandatory requirement that must be met for the rule to trigger. You should only apply this setting if you want the rule to take action exclusively when files originate from those specific locations.</p></div> |
| Destination | <ul><li><p>Web destination: None, Any, or Specific Web Application Group</p><p>Any refers to any Web destination</p></li><li>Local destination</li></ul> | <ul><li>Catalog Web application group that includes: AI-meeting-assistant, AI-Writing-assistant categories</li><li>Local application group that includes: Slack, Telegram</li></ul> |
| Data scope | Data profiles | Financial |
Example 143. Process example:
Block files originating from the internal company portal (source) that are moving to the web application WhatsApp web (destination).
Refer to HITS in the data-in-motion table to understand the impact of the rules
HITS show the number of raised issues. This only appears when the BLOCK or REPORT action rules are matched.
Refer to Modules → Data Security → Data Security Issues → Threats, to view the details of the alert or incident that the DLP system has flagged. The issue is raised when a user action or system event matches the conditions of the data-in-motion rule.
A raised issue from DLP is an alert triggered by a DLP system. This alert indicates that someone has performed an action that violates a policy designed to protect sensitive data.
The DLP system automatically detects a policy violation, such as a user trying to download a document containing credit card information from Google Drive. This raises an issue. The issue includes details about the user, the type of data involved, and the action that was attempted.
Depending on the policy, the system might block the action, prompt the user with details on why it was blocked, and allow them to override the action or to add justification, or simply log and send the event to the XDR DLP console. Security teams then investigate these issues to determine if the activity was malicious, accidental, or a legitimate business need.
Verify Endpoint DLP settings
Go to Modules → Data Security → Endpoint Data-in-Motion Rules → Endpoint DLP Settings to configure the tenant settings for DLP.
DLP rule/s can override the End User Dialog settings with more specific definitions and texts.
Configure DLP end-to-end
This section describes how to get up and running with Cortex DLP, including how to define Endpoint DLP settings, add applications and application groups, and define data-in-motion rules.
Onboarding checklist for DLP
We recommend following these steps to ensure all requirements for setting up DLP are met, protecting sensitive data, and maintaining compliance with your organization's standards.
Step 1. Configure endpoint DLP settings
Configure endpoint DLP settings to define your organization's DLP setup.
See Configure endpoint DLP settings.
Step 2. Install the DLP browser extension
Install the DLP browser extension on your endpoint. This extension works with the DLP agent to monitor and enforce security policies on web-based activities.
See Install DLP browser extension on your endpoint.
Step 3. Check permissions for user roles
Verify that Data Security Admin can create, manage, and remove data-in-motion rules.
See Check for permissions for user roles.
Step 4. Add applications
Add local and web applications to the application group when selecting source and destination in the data-in-motion rule.
See Create endpoint applications.
Step 5. Add application groups
Create application groups for the source and destination in the data-in-motion rule.
See Create endpoint application groups.
Step 6. Define DLP rules
Rules control sensitive data transfers based on context. They can block, allow, or report transfers.
See Create data-in-motion rules.
Step 7. DLP status in all endpoints
View the extension and DLP installation status on each endpoint.
See DLP status in all endpoints.
Step 8. Review threats
Track and investigate issues triggered when a data-in-motion rule is violated.
See Cortex DLP threat detection and issues.
Configure endpoint DLP settings in Cortex XSIAM
Configure the endpoint DLP settings to manage your organization's DLP policies.
- In Default Actions & Thresholds, there are two parts.
-
Data-in-motion default action and threshold configurations:
Select the fallback policy for instances when the DLP process fails or times out:
- Allow file movement (fail-open): Allows the file transfer, preventing service interruption.
-
Block file movement (fail-close): Blocks the file transfer.
When a fail-close action occurs, the system creates a Data movement blocked by Endpoint DLP fail-close action issue.
-
Auto disablement of rule threshold
This setting refers to rule suppression. When the number of hits exceeds the set number, the rule is disabled.
Click Reset to revert to the default threshold as configured in the system.
If a rule was suppressed, you can view details in Settings → Management Audit Logs.
-
- For Corporate Account Domain, add the web application resources.
- Cortex Data Security Extension (Web DLP Channel): This option lets you manage browser extension installation and removal. Configure Chrome and Edge separately using one of the two modes. By default, MDM deploys the extension to selected endpoints. See the earlier instructions for installing the DLP browser extension.
-
MDM: This default option distributes and installs the extension using a supported management tool, such as Microsoft Intune for Windows or JAMF for macOS.
After installation, the agent communicates with the extension to activate endpoint DLP.
-
Forced activation (by XDR): This option installs a missing browser extension automatically. The endpoint must be associated with a domain.
- The agent does not force-install the extension if MDM already manages it on the endpoint.
- The XDR agent force-installs the extension on managed and unmanaged browsers. If a browser later becomes organization-managed, redeploy the extension through the central management console.
-
Disable: The extension is disabled.
With MDM, the extension is user-managed. Cortex does not remove an installed MDM extension. It only disables communication with the DLP extension.
-
-
In the End User Dialog section, add the default pop-up message for these events:
-
Enable User Interaction
You can specify the end-user message per rule.
- Reporting Mismatch (FP)
- Rule Override
For each option, enter the default text to display in the end-user dialog.
- In the Title, enter the default dialog name.
- In the Body, enter the dialog message. You can use the system default text. This also applies to Reporting Mismatch and Rule Override.
- In the Admin Email Link field, enter the default admin email to include in the body.
- In the Dialog Main Button Label, enter the text for the button that closes the window.
-
Install the DLP browser extension on your endpoint
To activate DLP, you must install the CDSx browser extension on your endpoint. This extension works with the DLP agent to monitor and enforce security policies on web-based activities.
Note
Extensions are not enabled in Incognito or InPrivate modes in Chrome and Edge. It is recommended to disable these modes in the organization.
Enabling the extension in Cortex XSIAM
- Navigate to Modules → Data Security → Endpoint Data-in-Motion Rules → Endpoint DLP Settings.
- For Cortex Data Security Extension (Web DLP Channel), select the browser extension activation mode. See Configure endpoint DLP settings for more information.
Windows
Use a managed deployment platform like UEM, MDM, or group policy to push the browser extension to the endpoints.
Refer to the steps below to download the registry file (reg file), install, and configure settings to activate the extension on the endpoints.
Important
Endpoints should be linked to the domain.
Select one of the following managed installation options:
1. Managed installation from group policy
Extension ID & URL:
aalncdhjokfcbldaemnehledpfpibopi;file:///C:\ProgramData\Cyvera\Everyone\CDSX\extension.xml
2. Managed installation from Intune
Extension ID & URL:
aalncdhjokfcbldaemnehledpfpibopi;file:///C:\ProgramData\Cyvera\Everyone\CDSX\extension.xml
3. Managed installation on Edge
You must first deploy the CDSx extension from the Microsoft Edge policy.
a. From the Microsoft 365 admin center, navigate to Settings+Microsoft Edge.
b. Select the Configuration policies tab, and select +Create Policy.
c. Enter a name (example: CDSx Extension Deployment), add an optional description, select the Policy type, and then click Next.
d. In Settings, select +Add Setting. Search and select the ExtensionInstallForcelist policy.
e. In Control which extensions are installed silently, paste aalncdhjokfcbldaemnehledpfpibopi;file:///C:\ProgramData\Cyvera\Everyone\CDSX\extension.xml, and then click Next.
f. In Assignments, select the target users or security groups, and then click Next.
g. Review the settings, and then click Review and create.
4. Managed installation from the registry in Windows
a. Install/uninstall the extension using the following files:
b. Instead of step a, you can also add the following to the registry using reg IMPORT <file.reg>:
```programlisting Windows Registry Editor Version 5.00 ; ===== Start CDSX Policy ; Chrome [HKEY_LOCAL_MACHINE\SOFTWARE\Policies\Google\Chrome\ExtensionSettings] [HKEY_LOCAL_MACHINE\SOFTWARE\Policies\Google\Chrome\ExtensionSettings\aalncdhjokfcbldaemnehledpfpibopi] "installation_mode"="force_installed" "update_url"="file:///C:\\ProgramData\\Cyvera\\Everyone\\CDSX\\extension.xml" "toolbar_pin"="force_pinned" ; Edge [HKEY_LOCAL_MACHINE\Software\Policies\Microsoft\Edge\ExtensionSettings] [HKEY_LOCAL_MACHINE\Software\Policies\Microsoft\Edge\ExtensionSettings\aalncdhjokfcbldaemnehledpfpibopi] "installation_mode"="force_installed" "update_url"="file:///C:\\ProgramData\\Cyvera\\Everyone\\CDSX\\extension.xml" "toolbar_state"="force_shown" ; ===== End CDSX Policy ```
macOS
To enable the DLP browser extension on your endpoint, you must either create a configuration profile in JAMF or upload a predefined configuration profile in your MDM solution.
The predefined signed configuration profile includes settings that cannot be modified. An unsigned version is also available for self-signing.
Note
For a comprehensive overview, refer to the Cortex XDR Agent iOS Guide.
The following steps describe how to create a new configuration profile in JAMF to enable the DLP browser extension on your endpoint:
- From Configuration Profiles, click New.
- In the General page, enter a name and description.
- From the left pane, under the Options tab, select Application & Custom Settings and then click Upload.
- Add the following configuration details for each web browser:
- Chrome:
- Preference Domain: com.google.Chrome
-
Property List:
<?xml version="1.0" encoding="UTF-8"?> <!DOCTYPE plist PUBLIC "-//Apple//DTD PLIST 1.0//EN" "http://www.apple.com/DTDs/PropertyList-1.0.dtd"> <plist version="1.0"> <dict> <key>ExtensionSettings</key> <dict> <key>aalncdhjokfcbldaemnehledpfpibopi</key> <dict> <key>installation_mode</key> <string>force_installed</string> <key>toolbar_pin</key> <string>force_pinned</string> <key>update_url</key> <string>file:///Library/Application Support/PaloAltoNetworks/Traps/cdsx/extension.xml</string> </dict> </dict> </dict> </plist>
- Edge:
- Preference Domain: com.microsoft.Edge
-
Property List:
<?xml version="1.0" encoding="UTF-8"?> <!DOCTYPE plist PUBLIC "-//Apple//DTD PLIST 1.0//EN" "http://www.apple.com/DTDs/PropertyList-1.0.dtd"> <plist version="1.0"> <dict> <key>ExtensionSettings</key> <dict> <key>aalncdhjokfcbldaemnehledpfpibopi</key> <dict> <key>installation_mode</key> <string>force_installed</string> <key>toolbar_state</key> <string>force_shown</string> <key>update_url</key> <string>file:///Library/Application Support/PaloAltoNetworks/Traps/cdsx/extension.xml</string> </dict> </dict> </dict> </plist>
- Chrome:
- Click Save.
Create endpoint applications in Cortex XSIAM
An effective data loss prevention (DLP) system allows an organization to define specific applications as sensitive. This enables the system to monitor and control the transmission of critical information, preventing its unauthorized release.
When creating a data-in-motion rule, you can specify the source of the sensitive data, but you must provide the intended destination. For the source and destination for the data-in-motion rule, you must select the relevant application groups ( custom local application group). The application groups comprise of predefined endpoint applications as defined by Palo Alto (local application).
Predefined applications are indicated by Created by: Palo Alto Networks in the All Applications table. For predefined applications, you do not see details such as URLS/Domains, Process names, or signers. You cannot edit or delete these applications.
The user can only create a Custom Web Application.
Endpoint application type:
After creating the application, you can select it from the application groups.
- Predefined local applications: The following apps and services are supported.
- FTP, SFTP and FTPS apps:
- FileZilla
- OpenSSH
- WinSCP
- SSH and RDP apps:
- PuTTY
- FTP, SFTP and FTPS apps:
- Custom Web application: In DLP, a web application refers to any software accessed via a web browser (e.g., cloud services, webmail, social media). Web DLP focuses on inspecting and controlling sensitive data as it travels over these internet-based channels, preventing unauthorized sharing or exfiltration. Palo Alto Networks has its own predefined list of applications. The Palo Alto predefined web applications cannot be edited or removed.
New custom web application
Add a custom web application that appears in the Custom Web-Application Group of the Endpoint Application Groups. You can select the source or destination when defining the data-in-motion rule.
- Navigate to Modules → Endpoint Data-in-Motion Rules → Endpoint Applications.
- Click New Application and select Custom Web Application.
-
In New Custom Web Application, enter the application name, enter the URLs or domain of the web application, and then click
 .
.A web application is added to the list. You can add other custom web applications.
-
After adding all the web applications, click Add.
The web application is successfully added to the All Applications table as Type: Web.
Example:
- Web: custom URLs
- Local application: pre-defined applications
- Catalog: a special group that includes SAAS applications, categories
- Catalog web application groups: a special group that allows you to choose SAAS applications from the PANs catalog and to use the predefined catalog
Create endpoint application groups in Cortex XSIAM
Data-in-motion rules require defining both a source and a destination, which can be specified using your predefined endpoint application groups.
Choose the relevant application group type.
-
Catalog Web Application Group: The catalog includes SAAS applications from PAN's predefined catalog and predefined web application categories.
Note
The catalog lists all supported and tested applications. If an application you need is not on the list, contact support for assistance.
-
Custom Local Application Group: Select the available options from the predefined local applications.
For example: Unsanctioned chat apps.
-
Custom Web Application Group: Select the available options from the custom local applications. You can create a new web application.
For example: AI chatbots.
Create data-in-motion rules in Cortex XSIAM
You can create data-in-motion policies to identify, control, and protect sensitive information as it moves across networks, between systems, or to devices.
Each rule defines an action, Allow, Block, or Report, from a specified source to a web destination. Rule conditions must include the channel destination, data profile, and type of data being accessed or moved. You can also configure responsive user dialogs for enforced events, which can be customized per rule.
To create a data-in-motion rule:
- In Modules → Data Security → Endpoint Data-in-Motion Rules → Data-in-Motion Rules, click Create New Rule.
- On the General page:
- Enter a unique name and description.
- Choose the Action to implement when the rule criteria are met, such as blocking the transfer or notifying relevant parties.
- Select the Action for Partial Classification to implement when partial classification occurs. Partial classification refers to a situation in which the classification process is incomplete, such as due to a timeout or a classification failure.
-
Select the Severity of the rule you are creating.
The Informational action enables logging an activity without interfering with the user’s workflow.
- Enter a Raised Issue Name to use for the issue resulting from policy breaches.
- Select to Disable/Enable Rule as required.
- On the Context & Data page:
-
For Source, select the Custom Web Application Groups.
The source is the origin of the data, whether it resides on a local drive (such as a PDF on a laptop) or within a web application (such as a file in OneDrive).
Without a defined source, this rule applies to every file by default. You can make the policy more targeted by selecting a specific source.
Note
Third-party application behaviour:
- When a file upload is blocked, the local application may display its own generic error message in response to the DLP restriction. In similar cases, some third-party applications might still proceed by sending a dummy file or an error placeholder instead of the actual data.
-
For Destination, select the relevant Application Groups. See the earlier instructions for creating endpoint application groups.
Selecting Allow corporate accounts users to upload lets corporate account users bypass the Block rule action and upload data from the web application.
USB Channel: Select File Write/Copy to USB to enforce the rule on the USB device.
-
For Data Scope, select the relevant Data Profile.
Note
To maximize data security, if you use Microsoft Purview for extensive manual and automated file classification tagging and are looking to integrate those labels directly with the DLP policies to trigger protective actions based on a file's sensitivity, refer to How to use information protection labels in Cortex Cloud Data Security.
-
- On the Target page:
-
For Rule Target, select the endpoints to which this rule will apply.
Note
Distribution of the Endpoint DLP package is restricted to agents assigned to the data-in-motion policy. This ensures that only endpoints requiring DLP functionality are affected, rather than all eligible endpoints in the tenant.
-
- On the User Interaction page, you can add the default pop-up message for each of the following events.
- For End User Dialog, toggle ON/OFF to manage whether users see a message when the policy is violated.
- In the Title, enter the default name for the dialog.
-
In the Body, enter the message to display in the dialog. You can choose to use the system's default text. This is also relevant for Reporting Mismatch and Rule Override.
If enabled, the Rule Override allows the user to override the block policy and temporarily retry the operation (to move the file again) to complete the action. The user's response is recorded as part of the Issue.
- In the Admin Email Link, enter the default admin email to be included in the body.
- In the Dialog Main Button Label, enter the text to use for the button to close the window.
- Click Next to create the rule.
- From the Data-In-Motion Rules table, click Save or move the rule down to change its priority, then click Save.
Rule priority in Cortex XSIAM
Cortex XSIAM processes these rules sequentially from top to bottom. To ensure the correct outcome, place Allow rules above Block rules.
As soon as a first match is found for a data movement event, that rule's action is applied, and no other rules are evaluated for that specific event. Each matched event creates an Issue, and the total number of issues appears as Hits in the rules table.
Modify rule priority by dragging rules. If a conflict arises while setting a rule's priority, for example, if another user updates the policy simultaneously, Cortex saves the rule as a draft to prevent loss of your work.
Example: Creating a data-in-motion rule
An employee at Company X sends an attachment containing financial information to another employee's personal email address. This action violates the company’s data handling policy.
To help prevent this, you can create a data-in-motion rule with the following configuration:
| Field | Description | Example user input |
|---|---|---|
| Rule Name | Provide a descriptive name for easy referencing. | Prevent Financial Data Transfer |
| Action | Specifies how data movement is controlled. Possible actions are: Block, Allow, or Report. | Block |
| Partial Classification | Select a fallback action if classification fails or exceeds a time threshold. | Block |
| Severity | Choose the severity level that the Issue will trigger. Possible options are: Critical, High, Medium, Low, Informational. | High |
| Raised Issue Name | The name appears on the Issues page when filtering for Endpoint DLP Issues. | Blocked Financial File Transfer |
| Source | The web application group the data transfer originates from. You can create and manage these custom groups to suit your preferences. | drive.google |
| Destination | Choose where the data is moving to. Possible options are: None, Any, Specific web application group. | Web Application Group |
| Local Application Groups | Select apps through which users might transfer sensitive data. | Zoom, Slack, TeamViewer, and WhatsApp. |
| Data Profile | <p>Data Profiles are templates that define what kind of sensitive data to detect. Select the data profile to which the rule applies.</p><p>For more information, see How to create and validate a custom data profile.</p> | PHI, CCN (Credit Card Numbers), Financial, and PII. |
DLP status in all endpoints
The All Endpoints page provides a central location from which you can view and manage the endpoints on which the agent is installed. In addition to the extensive information that Cortex XSIAM offers on all its endpoints, you can now view DLP Status and DLP Extension Status. This enables you to track information about the DLP browser extension and its status.
By default, this option is hidden. If you are using DLP, you need to add the fields DLP Status and DLP Extension Status when analyzing the status of endpoints with DLP.
DLP status
DLP Status provides the following statuses:
It is recommended to work with the latest security content.
- Active (Compatible)
- Update required: Indicates that the system's engine version does not match the version defined in the policy, and an update is necessary.
- Failed to start: Indicates that there was an initialization error. This could occur because of the DLP policy, or the DLP engine on the machine is not working.
- Degraded: Indicates that there are specific issues, such as custom detector patterns that require pattern fixes, that is causing DLP not to function.
DLP extension status
The agent monitors the endpoints for information when the extension is installed and performs periodic refreshes to ensure accurate results.
The DLP extension status shows the installation status of the extension on the endpoint:
- Installed (x): The x represents the number of extensions installed.
- Not installed: This indicates that the extension was either uninstalled or was never installed.
- No value: Where DLP is not activated on the endpoint.
-
Installed but unactivated: This indicates that either a supported browser is not being used or the DLP extension has not been activated yet.
Close and reopen your browser to activate the DLP extension.
You can drill down from the endpoint to view details of the DLP Extension Status.
From the selected endpoint, right-click and select Endpoint Data → View DLP Extension Status. This opens a dialog box that shows the extension status for both Chrome and Edge extensions.
Cortex DLP threat detection and issues
The Cortex DLP module prevents sensitive data exfiltration. If instances of data-in-motion rules have been violated, a DLP issue is generated. To view the DLP Issues, go to Data Security → Data Security Issues → Threats. The Detection Method is set to DLP.
DLP issues provide visibility into instances where data-in-motion rules have been violated.
From Data Security → Data Security Issues → Threats, you can view the DLP issues. The Detection Method is set to DLP.
Note
Access to this page is restricted to users with the roles: Data Security Admin, Instance Administrator, and Account Admin.
The parameters configured during rule creation are shown as issue attributes on this page. These include:
- Name: Taken from the Raised Issue Name field defined when creating the rule.
- Severity: The assigned severity level of the Issue.
- Description: The predefined description from the rule.
- Detection method: When an issue arises from a data-in-motion rule violation, its Detection Method is DLP.
- Action: How the rule responded to the issue: Prevented (Blocked), Allow, or Report.
Note
If the default action configured in Endpoint DLP Settings is set to Block file movement (fail-close), an issue is raised where the assigned severity is set to low, and includes the Name Data movement blocked by Endpoint DLP default action
View the DLP issue card panel
Click a DLP issue to open the DLP security card, where you can investigate the issue, take any required actions, and view remediation suggestions.
From the three-dot menu, you can open the issue in a new tab, copy the issue URL, retrieve the file, or view raw data (JSON).
Some other important actions:
- Retrieve File: From the asset card, click
 to obtain a copy of the file that triggered the security alert.\
Note: Files remain available for retrieval until they are deleted. - Click
 to open the related rule that triggered the issue.
At the top of the card, you can view information about the issue, including the severity, detection tags, category, and detection method. In the tabs, you can see more information about the cause of the issue, take any required actions, and view remediation suggestions.
You can also see the details of the user who logged into the browser.
Overview
Displays a description of the issue and provides key information, such as the assignee, status, action taken, and the time that the issue was created and updated.
You can also see the following:
-
Evidence: which includes data classification details such as Data Profiles, Data Patterns, Classification Status, and Profile Indicators.
Click the Profile Indicators link to view the list of sensitive data contained in the file.
The graph enables you to view information on the relevant file and logged-in user details.
-
File that includes the Name, Hash, Path, and Data Volume of the file.
The path shows the full path of the uploaded file.
- Local Applications, which include Process Name, Signer, Application Name, and Application Group Name.
- User Interaction that includes User Response.
War Room
A comprehensive collection of all investigation actions, artifacts, and collaboration. It is a chronological journal of the issue investigation. For information, see Use the War Room in an investigation.
Work Plan
A visual representation of the running playbook that is assigned to the issue. For more information, see Use the Work Plan in an investigation.
Detect, Investigate, and respond to threats
Monitor dashboards and reports
Use Cortex XSIAM dashboards and reports to turn security data into actionable visibility. Dashboards provide interactive, real-time views. Reports capture and distribute scheduled or point-in-time results.
Use dashboards to monitor trends, investigate changes, and focus operational work. Use reports to share consistent findings with stakeholders.
Explore these topics:
- overview-of-dashboards-and-reports
- access-and-visibility-for-dashboards-and-reports
- manage-dashboards-and-reports
- create-dashboards
- create-reports
- advanced-configuration
- dashboard-reference
Overview of dashboards and reports
Dashboards and reports help you monitor system activity and security operations across your environment. They summarize complex tenant activities into digestible graphical or tabular formats, allowing security analysts and administrators to effectively monitor cases, track data ingestion, and evaluate overall operational health.
Dashboards provide an interactive interface for real-time monitoring, while reports deliver static snapshots optimized for historical tracking, auditing, and automated distribution. Access to both features is restricted by Role-Based Access Control (RBAC) and Scope-Based Access Control (SBAC) to maintain data security and tenant isolation.
Dashboard interface basics
You can access your dashboards from Dashboards & Reports > Dashboards, which opens your default dashboard. To switch dashboards, click the current title to open the dashboard menu and select a different one.
Main components of the interface
Each dashboard comprises the following main components:
- Dashboard menu: Click on the current title to open the selection menu. From here, you can browse, search, or apply filters to view specific dashboard types or owners. The menu displays all dashboards you have permission to view.
- Action menu: Located in the right corner of the dashboard header, this menu provides access to specific dashboard operations, including:
- Mark as default: Set the current dashboard as your primary view upon login.
- Edit dashboard: Enter builder mode to modify the layout or widgets.
- Share settings: Manage visibility configurations and user/group permissions.
- Save as report: Convert the active dashboard layout into a functional report template.
- Time range: Located on the right side of the header, this defines the data window for all widgets on the dashboard.
- Data refresh: You can update visual data at multiple levels:
- Dashboard level: Click the Refresh icon in the header to update all widgets simultaneously.
- Widget level: Hover over an individual widget to view its specific refresh rate or to manually trigger a targeted data refresh.
- Pause automatic refresh: Select this option to temporarily stop automatic updates.
- Filters: Predefined dashboard-specific filters are displayed in the header. These filters do not persist when switching between dashboards. If a widget displays a filter icon, this indicates that the widget data is being filtered.
Dashboard types
The platform provides the following categories of dashboards to suit different operational needs. You can access all dashboards from the main dashboard menu.
-
Command Center dashboards: System-provided, interactive views offering high-level overviews of system status, data ingestion, and security operations.
- Drilldowns: Click on elements of interest to drill down into detailed dashboards or associated data pages.
- Read-only: These dashboards cannot be edited, deleted, or used as report templates. They are available in Dark mode only.
- Visibility: Command Centers are always Public and visible to all authorized users.
Note: Some Command Center animations are not fully supported by the Safari web browser. We recommend that you view these dashboards with an alternative web browser.
- System (predefined) dashboards: System-provided, read-only views tailored for common security use cases, such as agent management, data ingestion health, and posture management.
- Read-only: These dashboards cannot be edited or deleted, however you can duplicate and edit them, or use them as report templates.
- Visibility: They are always Public and visible to all authorized users.
- Custom dashboards: User-defined, fully flexible views built to meet specific organizational monitoring requirements. Ownership and access for these dashboards are managed through the Dashboard Manager.
For a list of command center dashboards and system defined dashboards, see Dashboard reference.
Report basics
Reports provide a static snapshot of system metrics and security analytics captured at a specific point in time. They format complex data into downloadable, structured files for distribution, operational auditing, and compliance.
You can access your reports by navigating to Dashboards & Reports > Reports. On this page you can see generated reports and report templates.
You can configure your report templates to run on a schedule and distribute to specific emails or slack channels, or you can run them instantly as a single instance. For more information, see Reports.
Widget Library
The Widget Library is a centralized, shared repository for managing dashboard and report components. You can access the Widget Library as part of the dashboard and report builders, or from Dashboards & Reports > Dashboard Manager > Widget Library.
The Widget library allows you to:
- Browse components: Search and filter existing widgets by name, type, owner, or dataset to add them directly to custom layouts. Hovering over a widget displays its description, and clicking provides a live preview utilizing real or mock data.
- Manage widgets: Organize existing widgets, including editing widget parameters, settings, and transferring ownership.
- Create new widgets: Build new widgets using XQL queries, scripts, or by using AI. For more information, see Create custom widgets.
Access and visibility for dashboards and reports
Access to all dashboard and report data is strictly controlled through Role-Based Access Control (RBAC) and Scope-Based Access Control (SBAC). These permissions determine the objects and data a user can see, and dictate how data behaves when elements are copied or shared across different users:
- RBAC: Controls access to dashboards and reports as separate objects.\
Your role must grant you access to view or edit these objects, as defined by your administrator.\
In addition, your administrator must define specific permissions to enable sharing of custom dashboards and report templates, for more information, see Manage access to objects. - SBAC: Controls the display of data according to your authorized data scope.\
Dashboard and report data is automatically filtered based on your authorized data scope. For example, you will only see information for the asset groups you are permitted to view.\
If you have access to a shared dashboard or report but lack the required data scope for the underlying datasets, the dashboard will load, but the widgets may appear empty or display an error. For more information on defining SBAC, see Manage user scope.
Visibility settings
Dashboards and reports can have the following visibility settings:
- Public: Visible to all users with the appropriate role permissions to view dashboards.
- Restricted: Visible only to the dashboard owner and specific authorized users or groups. Users can be assigned Viewer or Editor permissions.
By default, all newly created or imported dashboards and reports are assigned a Restricted status, making them visible only to the creator (Owner) and system Administrators.
After creation you can change access to the item as follows:
- Grant specific users Viewer or Editor privileges.
- Change the visibility setting to Public.
Access to widgets
Widget sharing is different to dashboards and reports. When creating custom widgets you can set their access level to Public or Restricted. Consider the following information:
- Widgets are not objects: Unlike dashboards, individual widgets are not treated as independent objects. They do not have their own "Share" dialog and cannot be shared independently.\
Within the Widget Library, a widget is set to either Restricted (visible only to the creator) or Public (visible to all with Widget Library access). - Inherited access: Any user who has been granted access to a custom dashboard (as a Viewer or Editor) can see all the widgets contained within that dashboard, including those marked as Restricted. This means you may see a widget on a shared dashboard that you cannot see in the Widget Library.
- Duplicating dashboards and templates: If you duplicate a dashboard or template containing Restricted widgets, you can view the widgets but cannot edit them. To make changes to a Restricted widget, simply duplicate it to create an editable copy. For more information see Duplicate dashboards and reports.
Sharing icons
Icons in the Source column in the Dashboard Manager and Report Templates pages indicate access levels, dashboard origins, and user sharing states:
- :
- A Restricted custom dashboard you created (Owner) that is not currently shared with anyone else.
- A custom dashboard you created that is currently shared with other users or user groups.
- : A custom dashboard created by another user that has been shared with you (either individually or through a user group).
- : A standard system dashboard provided by Palo Alto Networks. These are always Public and can't be deleted, or have their ownership transferred.
Access and sharing cheat sheet
For detailed information on managing access to Dashboards and reports see Manage access to objects.
| Object | RBAC permissions | Visibility settings | Sharing and duplicating |
|---|---|---|---|
| Command centers | • Dashboards & Reports > Dashboards > Enabled and • Command Center Dashboards > View | Public and visible to all authorized users. | Cannot be duplicated, edited, or deleted. |
| System dashboards | Dashboards & Reports > Dashboards > Enabled | Public and visible to all authorized users. | • Cannot be edited or deleted. • Users with access to a dashboard can duplicate it or create report templates from it. |
| Custom dashboards | Dashboards & Reports > Dashboards > Enabled | Restricted by default. | • Owner can grant Editor or Viewer permissions to specific users, groups, or API keys, or change the access level to Public. • If Restricted, users with Editor permission can take actions on the dashboard. • Users with Viewer permission can view, duplicate, or generate reports. |
| System report templates | Dashboards & Reports> Reports > Enabled | Public and visible to all authorized users. | • Cannot be edited or deleted. • Users with access to a template can generate reports or duplicate it. |
| Custom report templates | Dashboards & Reports> Reports > Enabled | Restricted by default. | • Owner can grant Editor or Viewer permissions to specific users, groups, or API keys, or change the access level to Public. • If Restricted, users with Editor permission can take actions on the report. • Users with Viewer permission can view, duplicate, or generate reports. |
| Custom widgets | Dashboards & Reports> Reports > Enabled | Restricted by default | • Owner can change the access level to Public. • If a widget (Public or Restricted) is included on a shared dashboard, users with access to dashboard can view the widget. |
c
Manage dashboards and reports
You can access all pages for managing your dashboards and reports under Dashboards & Reports. Dashboards are managed through the Dashboard Manager, and report templates and generated reports are managed through the Reports page. You can also manage and review your deleted content in the Trash folder.
Dashboard Manager
The Dashboard Manager is your central hub for organizing and managing your dashboards. It lists every dashboard you have access to, including system dashboards, Command Centers, and custom dashboards created by you or shared with you.
From the Dashboard Manager, you can perform the following tasks:
- Create dashboards: Create a new dashboard from scratch or build one from a template.
- Set default dashboard: Select any available dashboard to serve as your primary view upon login.
- Edit dashboards: Rename the dashboard, update its description, adjust the layout, or modify widget data.
- Duplicate: Create a copy of an existing dashboard to use as a starting point for a new version.
- Import: Import dashboard configurations in JSON format.
- Export: Export the dashboard configuration as a JSON file, or save it as a report template.
- Change ownership: Transfer the management and ownership of a dashboard to another user (available to Administrators only).
- Manage access: Share custom dashboards with other users, groups, or API keys. Custom dashboards are Restricted by default but can be assigned the following visibility levels:
- Public: Visible to all users with the appropriate role permissions to view dashboards.
- Restricted: Visible only to the dashboard owner and specific authorized users or groups.
Icons in the Source column can help you to identify the security access and status of your dashboards. For more information, see Access and visibility for dashboards and reports.
Reports
The Reports page is your central hub for organizing and managing your reports. It is split into two tabs, allowing you to quickly browse your report history or configure report templates:
- Generated Reports: View a list of all completed reports and download them as needed. For reports with attachments, the Name field indicates the number of attached files.
- Report Templates: View all report templates you have access to, including system templates and custom templates created by you or shared with you.
From the Reports page, you can perform the following tasks on your report templates:
- Create templates: Create a new report template from scratch in the report builder.
- Generate reports: Run any report template to immediately generate and download a report.
Data scoping: Reports pre-fetch data based on the scope of the user who last saved the template. Ensure the template creator has the appropriate data permissions to provide the intended results for the report recipients.
- Edit templates: Rename the template, update its description, adjust the layout, or modify widget data.
- Duplicate: Create a copy of an existing template to use as a starting point for a new version.
- Import: Import report configurations in JSON format.
- Export: Export the report template configuration as a JSON file.
- Manage access: Share custom templates with other users, groups, or API keys. Custom templates are Restricted by default but can be assigned the following visibility levels:
- Public: Visible to all users with the appropriate role permissions to view reports.
- Restricted: Visible only to the template owner and specific authorized users or groups.
Icons in the Source column can help you to identify the security access and status of your reports. For more information, see Access and visibility for dashboards and reports.
Duplicate dashboards and reports
When you duplicate a dashboard or report, you'll be asked whether you want to duplicate any private Restricted widgets you don't own:
- Duplicate private widgets: Creates copies of the private widgets and makes you the owner of the new copies. These widgets become independent assets in the Widget Library and won't receive future updates made to the original widgets.
- Keep the existing widgets: Copies only the layout. The private widgets remain referenced, but because you don't have access to them, they won't load data and will display a No permission message instead.
Choose the option that best fits your needs. If you don't duplicate the widgets, you can request access to the originals from their owner.
Share custom dashboards and report templates
Note: Sharing of custom dashboards, report templates, and widgets must be enabled by your administrator. For more information, see Manage access to objects.
By default, all new custom dashboards and report templates are Restricted and visible only to you (the Owner). Once created, you can share them with specific users or groups, or make it Public to all authorized users.
Widget sharing behaves differently to dashboards and reports, for more information see Access to widgets.
Open share settings
In the Dashboard Manager or the Report Templates tab, locate your item, right-click its name, and select Share.
Update your visibility settings
- To share globally: Under General access, change the setting to Public so all authorized users in your organization can view it.
- To share selectively: Keep the status as Restricted, add specific users or groups, and assign them a role (Viewer or Editor).
Save your changes
Click Share to apply your settings.
Change ownership to dashboards and report templates
Only administrators can change the ownership of a custom dashboard or report template.
Note: For report templates, when ownership is transferred, any existing report schedules associated with the template are automatically removed. The new Owner must manually redefine the schedule to resume automated report generation.
Open change owner
Right-click the custom dashboard or template and select Change owner.
Select a new owner
Select the new owner from the list of users.
Confirm the change
For templates, review the warning regarding deleted schedules and click Change.
Import and export dashboards and report templates
Administrators can export and import dashboards and report templates as JSON files. This allows you to quickly share configurations, back up content, or migrate settings between different environments. The system supports both single and bulk operations.
To perform these actions, navigate to the Dashboard Manager for dashboards, or the Reports page for report templates.
Risk of data loss: Importing a dashboard or report might overwrite the current version. To prevent accidental data loss, review your existing dashboards and report templates before proceeding with an import.
Exporting dashboards & report templates
Before exporting, review the following requirements and system behaviors:
- Infrastructure restrictions: You cannot export dashboards built on custom infrastructure.
- Access requirements: To export a Restricted dashboard or report, you must have at least Viewer permissions.
- Ownership & permissions stripping: The exported JSON file contains only the configuration of the dashboard or template. It does not include the original access list or ownership data.
Importing dashboards & report templates
When you import a JSON configuration, the system applies the following default rules:
- Ownership: You are automatically designated as the Owner of the imported dashboard or template.
- Visibility: Access is automatically set to Restricted. You must manually adjust the visibility settings if you want to share it. For more information, see Visibility settings.
Troubleshooting "No Data" messages (XQL & Datasets)
Because dashboards rely on XQL (Cortex Query Language) to fetch data, imported widgets may display a No Data message if they reference datasets or log sources that do not exist in your environment.
How to fix it:
- Edit the affected dashboard.
- Locate the broken widgets and edit the XQL query.
- Update the query syntax to match the exact dataset or log source names used in your current instance.
Configure the notification rule for a failed report
You can receive an email or send a notification to a syslog server if a report fails to run due to a timeout or fails to upload to the GCP bucket.
- Under Settings → Configurations → General → Notifications, click Add Forwarding Configuration.
- Enter a name and a description for your rule, and under Log Type, select Management Audit Logs.
- Use a filter to select the Type as Reporting, Subtype as Run Report, and Result as Fail.
- Enter a distribution list to receive notifications by email or select a syslog server.
- Click Next.
- Review settings and click Create.
Deleted content
The Trash folder acts as a safety net for your workspace, enabling the safe deletion and recovery of all deleted dashboards, reports, and widgets. From this folder, you can restore items or permanently delete them. You can access the Trash from the  three dots menu on the Dashboard Manager and Reports page.
Retention Policy
When you delete a dashboard, report, or widget, it is not immediately lost:
- Deleted items are automatically moved to the Trash folder.
- Items remain in the Trash for 30 days.
- After 30 days, items are permanently deleted from the tenant and cannot be recovered.
Create dashboards
You can create fully customized dashboards—start from a blank canvas or choose an existing template.
Dashboard core elements
You can use the following elements to build your dashboards:
- Widgets: The modular building blocks of a dashboard. Drag widgets on to your blank canvas to start building your dashboard. Choose from predefined system widgets or create custom widgets that analyze specific datasets using XQL, Scripts, or by using AI.
- Static elements: Headers, titles, and free text blocks that can help you structure your dashboard.
- Templates: Pre-configured layouts designed for specific use cases (such as SOC overviews or threat hunting) to help you deploy functional dashboards instantly
- Filters: Global filters that allow dashboard users to adjust the dashboard's scope by selecting predefined or dynamic values.
Note: Global filters are available for dashboards that include custom XQL widgets with defined parameters. For more information, see Create XQL widgets.
- Drilldowns: Interactive elements that allow dashboard users to dive deeper into data. Clicking data points can trigger contextual changes, run an XQL search, or link to external URLs, other dashboards, and reports.
Note: Drilldowns are available for dashboards that include custom XQL widgets. For more information, see Create XQL widgets.
Create a dashboard
Use the following high-level workflow to create and distribute a dashboard, guiding you from initial setup through layout design and distribution.
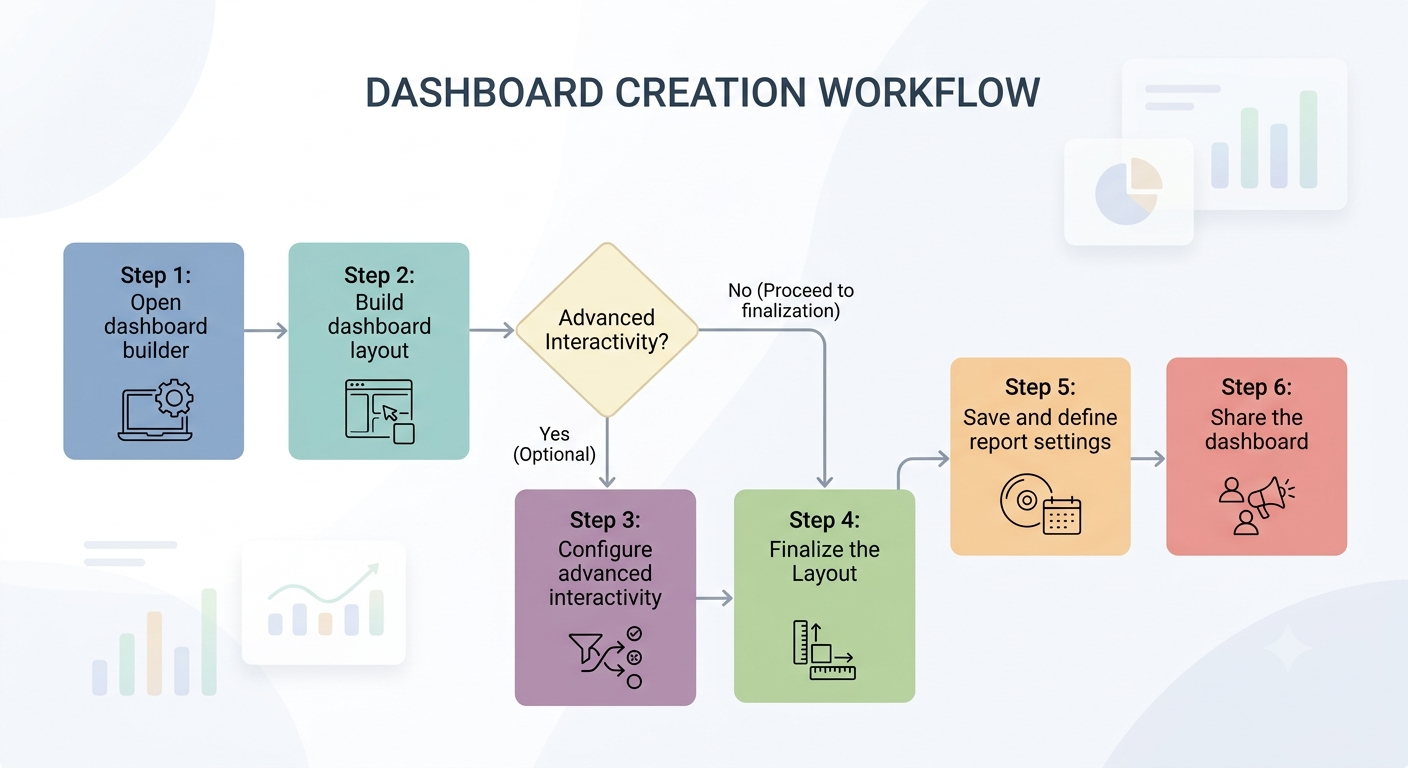
Open the dashboard builder
Depending on your starting point, open the dashboard builder as follows:
- Build a dashboard from scratch: Go to Dashboards & reports > Dashboard Manager and click Create dashboard.
- Use a template: Go to Dashboards & reports > Dashboard Manager and click Create dashboard. In the dashboard builder, click Browse templates to see the available options.
- Duplicate an existing dashboard: In the Dashboard Manager, right-click a dashboard and click Duplicate. Then locate the newly duplicated dashboard and Edit it to make changes. For more information about which dashboards can be duplicated, see Access and sharing cheat sheet.
Build your dashboard layout
- Add or remove widgets from your canvas: Drag widgets directly onto the canvas from the Widget Library:
-
Predefined Widgets: Search the Widget library (filter by Owner, Category, Chart type, or data source) and drag your selected widgets onto the canvas. Click on a widget to see a graphical preview and configuration details.
Tip: To find widgets that can be modified, select the Editable widget only option. These widgets can be duplicated and edited to suit your specific needs without starting from scratch.
-
Custom Widgets: If the library does not contain the widgets you require, you can create custom widgets using XQL queries, scripts, or generate them using AI. For more information, see Create custom widgets.
-
- (Optional) Refine widget data: For certain widgets you can refine the displayed data as follows:
- For agent-related widgets: You can apply an endpoint scope to refine the displayed data to only show results from specific endpoint groups. Select the menu on the top right corner of the widget, select Groups, and select one or more endpoint groups.
- For case-related widgets: You can refine the displayed data to only show results from cases that match a case starring configuration. A purple star indicates that the widget is displaying only starred cases. For more information, see <Case starring>.
Configure advanced interactivity
If your dashboard contains custom XQL widgets with defined parameters, you can add interactive elements to enhance your dashboard:
- To add dashboard filters: Follow the steps in Configure Global Filters.
- To add drilldown actions: Follow the steps in Configure Drilldowns.
Finalize the layout
- Name your dashboard: Enter a unique, descriptive name in the title field.
- (Optional) Add static text: Click Static Elements to add headers, titles, or free text blocks.
- Arrange the layout:
- Use the default Fit to screen layout, or select a specific screen or monitor size.
- In the Settings menu, arrange the widgets manually using the grid or select Auto arrange layout.
The carousel viewing format is no longer supported.
Save and optionally define report settings
- Open save settings: Click the Save button in the dashboard builder header.
- Add a description: Provide a detailed description explaining the purpose of the dashboard to help other users identify its use case.
- (Optional) Save as a report template: Click Save as report to create a report template based on the dashboard. You can also configure automated distribution settings, including email recipients, Slack notifications, delivery scheduling, and CSV data attachments.
- Configure timeframe: Select the timeframe for the widget data.
-
Configure automated distribution and scheduling settings: including email recipients, Slack notifications, delivery, and scheduling.
Note: To send reports to Slack, Slack must be configured as an external application. For more information, see Integrate Slack for outbound notifications
-
Configure CSV data attachments: Select Attach CSV to include raw data from XQL widgets.
From the menu, select one or more of your custom widgets to attach to the report. The CSV files of the widgets are attached to the report along with the report PDF. Depending on how you selected to send the report, the CSV file is attached as follows:
- Email: Sent as separate attachments for each widget. The total size of the attachment in the email cannot exceed 20 MB.
- Slack: Sent within a ZIP file that includes the PDF file.
- Save the dashboard: Click Save to commit all changes.
Share the dashboard
By default, all new custom dashboards are Restricted and visible only to you (the Owner). Once created, you can share the dashboard with specific users or groups, or make it Public to all authorized users.
Note: Sharing of custom dashboards must be enabled by your administrator. For more information, see Manage access to objects.
How to share a dashboard
- Open share settings: In the Dashboard Manager find the dashboard name and select Share from the right-click menu.
- Update your visibility settings:
- To share globally: Under General access, change the setting to Public so all authorized users in your organization can view it.
- To share selectively: Keep the status as Restricted, add specific users or groups, and assign them a role (Viewer or Editor).
- Save your changes: Click Share to apply your settings.
Create reports
You can create report templates using existing dashboards, or create custom reports from scratch with widgets from the Widget Library.
In addition, you can schedule your reports to run regularly or one time only. All generated reports are saved under Dashboards & Reports → Reports → Generated Reports.
For more information about managing report templates see Manage dashboards and reports.
Report core elements
You can use the following elements to build your reports:
- Widgets: The modular building blocks of a dashboard. Drag widgets on to your blank canvas to start building your report. Choose from predefined system widgets or create custom widgets that analyze specific datasets using XQL, Scripts, or by using AI.
- Static elements: Headers, titles, and free text blocks that can help you structure your report
- Templates: Pre-configured layouts designed for specific use cases (such as SOC overviews or threat hunting) to help you deploy functional reports instantly.
- Filters: Global filters that allow dashboard users to adjust the dashboard's scope by selecting predefined or dynamic values.
Global filters are available for reports that include custom XQL widgets with defined parameters. For more information, see Create XQL widgets.
Create a report template from scratch
You can use report templates to standardize and automate your data delivery—allowing you to generate one-time or recurring reports on a schedule and seamlessly distribute them to different user groups or mailing lists.
Use the following high-level workflow to create and distribute a report, guiding you from initial setup through layout design and distribution.
Open the report builder
Depending on your starting point, open the report builder as follows:
- Build a report from scratch: Go to Dashboards & reports > Reports and click Create template.
- Use a system template: Go to Dashboards & reports > Reports and click Create template. In the report builder, click Browse templates to see the available options.
- Save a dashboard as a report template: You can save a dashboard as a report template during dashboard creation, or from the Dashboard Manager choose a dashboard and select Save as report template.
Click Edit to make changes to the template or to run the report without making changes, select Generate report.
Build your report layout
- Add or remove widgets from your canvas: Drag widgets directly onto the canvas from the Widget Library:
- Predefined Widgets: Search the Widget library (filter by Owner, Category, Chart type, or data source) and drag your selected widgets onto the canvas. Click on a widget to see a graphical preview and configuration details.
- Tip: To find widgets that can be modified, select the Editable widget only option. These widgets can be duplicated and edited to suit your specific needs without starting from scratch.
- Custom Widgets: If the library does not contain the widgets you require, you can create custom widgets using XQL queries, scripts, or generate them using AI. For more information, see Create custom widgets.
- Predefined Widgets: Search the Widget library (filter by Owner, Category, Chart type, or data source) and drag your selected widgets onto the canvas. Click on a widget to see a graphical preview and configuration details.
- (Optional) Refine widget data: For certain widgets you can refine the displayed data as follows:
- For agent-related widgets, you can apply an endpoint scope to refine the displayed data to only show results from specific endpoint groups. Select the menu on the top right corner of the widget, select Groups, and select one or more endpoint groups.
- For case-related widgets, you can refine the displayed data to only show results from cases that match a case starring configuration. A purple star indicates that the widget is displaying only starred cases. For more information, see <Case starring>.
Configure filters
If your report contains custom XQL widgets with defined parameters, you can add configure filters to refine the data in your report. Follow the steps in Configure Global Filters.
Finalize the layout
- Name your report: Enter a unique, descriptive name in the title field.
- (Optional) Add static text: Click Static Elements to add headers, titles, or free text blocks.
- Arrange the layout: Reports are formatted in A4 pages. You can scroll all pages in the report in the navigation panel. To optimize the space in the report, select Auto arrange layout from the Settings menu, or arrange the widgets manually.
Save and define report settings
- Open save settings: Click the Save button in the report builder header.
- Add a description: Provide a detailed description explaining the purpose of the report to help other users identify its use case.
- Configure timeframe: Select the timeframe for the widget data.
-
Configure automated distribution and scheduling settings: including email recipients, Slack notifications, delivery, and scheduling.
To send reports to Slack, Slack must be configured as an external application. For more information, see Integrate Slack for outbound notifications.
- Configure CSV data attachments: Select Attach CSV to include raw data from XQL widgets. From the menu, select one or more of your custom widgets to attach to the report. The CSV files of the widgets are attached to the report along with the report PDF. Depending on how you selected to send the report, the CSV file is attached as follows:
- Email: Sent as separate attachments for each widget. The total size of the attachment in the email cannot exceed 20 MB.
- Slack: Sent within a ZIP file that includes the PDF file.
-
Save the report: Click Save to commit all changes.
Tip: You can configure a notification rule to send an email or send a notification to a syslog server if a report fails to run due to a timeout or fails to upload to the GCP bucket. For more information see Configure the notification rule for a failed report.
Share the report template
By default, all new custom report templates are Restricted and visible only to you (the Owner). Once created, you can share the report template with specific users or groups, or make it Public to all authorized users.
Sharing of report templates must be enabled by your administrator. For more information, see Manage access to objects.
How to share a dashboard
- Open share settings: In the Report templates tab, find the template name and select Share from the right-click menu.
- Update your visibility settings:
- To share globally: Under General access, change the setting to Public so all authorized users in your organization can view it.
- To share selectively: Keep the status as Restricted, add specific users or groups, and assign them a role (Viewer or Editor).
- Save your changes: Click Share to apply your settings.
Advanced configuration
The pages in this section explain how to create custom widgets, configure global filters, and configure drilldowns on widgets.
Create custom widgets
Custom widgets let you personalize the data visualizations rendered across your security dashboards and compliance reports, tailoring information to your specific workflows.
You can create custom widgets using the following:
- Using AI with the Agentic Assistant
- XQL query
- Script
You can create widgets through the Widget Library during dashboard or report creation. You can also duplicate and edit specific widgets, search the Widget Library and select the Editable widget only option.
Once created, you can see all of your widgets and the widgets that you have permission to access in the Widget Library. For more information about access and visibility to Restricted and Public widgets, see Access to widgets.
Create widgets using AI
Use natural language prompts to request visual insights by instructing the Agentic Assistant to display its findings as charts or graphs. This makes it easy to visualize data for threat hunting, business intelligence, or investigations without writing XQL queries or manually creating data visualization.
When you request a visualization, the agent generates an XQL query, executes it, and then presents the results in a graph. Agentic Assistant supports all graph types supported by the Cortex Platform.
From the Widget Library, select Create widget > Generate with AI.
Input a natural language prompt describing the security metrics you want to evaluate.
For example: "Show me a bar chart of failed user logins sorted by country over the last week".
The Agentic Assistant parses your request and creates a widget visualization.
(Optional) Provide additional prompts to refine the widget using the Agentic Assistant.
(Optional) Refine the widget manually in XQL.
Click the three dots icon on the widget and Edit in XQL to open the query in the Query Builder. You can edit the query or use the Chart Editor to change the visualization. See Create XQL widgets for instructions.
Save to the Widget Library.
Click the three dots icon on the widget and Save as Widget. You can define the widget name, description, and visibility level (Public or Restricted).
Best practices for prompting\
We recommend using clear specific language to request that the agent create these visualizations. Use terminology such as:
- Create a pie chart showing the distribution of issue severities over the last 7 days.
- Visualize the top 10 targeted assets by malware in a bar chart.
- Generate a line chart tracking the number of failed login attempts per day for the past month.
Create XQL widgets
Custom XQL widgets allow you to build charts based on specific Cortex Query Language (XQL) queries. To create an XQL widget, from the Widget Library click Create widget > XQL widget.
Basic configuration
- Enter a widget name and description.
- Select the visibility level (Public or Restricted).
- Restricted (Default): Leave unselected to keep the widget visible only to you.
- Public: Select this to make the widget visible to all users with Widget Library access.
Note: For more information on how widget access works, see Access to widgets.
Define your query
-
In the query editor, define your XQL query.
Tip: Select XQL Helper to view commonly used commands with example syntax. For more information, see How to build XQL queries.
- (Optional) Add parameters to your query to configure filters and drilldowns on your dashboard. For more information see Add parameters to a custom XQL widget.
-
(Optional) Change the default time period using the time picker at the top right of the window. Select from the following options:
- Standard time frames: Predefined ranges, such as Last 24 hours or Last 30 days.
- Relative time: Define a custom window (e.g., the last
<number>of minutes, hours, or days). - Calendar: Create a customized, static date/time period.
Note: Changing the query window's time period automatically updates the config timeframe, however it is not visible in the query unless you add it manually.
- Click Preview to validate your data results.
Note: XQL queries generated within the Widget Library do not appear in the Query Center; their results are used exclusively to build the custom widget.
Define the graph visualization
In the Widget tab, select Graph and use the Chart Editor to configure the following fields:
- Graph type & Subtype: Select your visualization style (e.g., Area, Column, Pie, Single Value, Table).
- Headers & labels: Define header text and choose whether to display callouts or percentages.
- Axis Mapping: Map your data fields to the X-axis (string values) and Y-axis (numeric values).
- Series (Optional): Specify a field (column) to group chart results based on Y-axis values. Note: This option only appears for supported graph types when a single Y-axis value is selected.
- Group additional values (Optional): Select Group additional values as Others and set the maximum number of values to display. This reduces clutter by limiting the number of data values to display and grouping additional values in an “Others” category.
- Apply default limit (Optional): Select this to limit the number of returned results for optimal loading times. Alternatively, you can add the limit stage directly to your query.
- Baseline (Optional): Add a baseline reference value to the graph (available for select graph types).
- Styling (Optional): Customize colors, fonts, and legend placements as required.
Finalize and save widget
- (Optional) Click Add to query to insert your chart preferences directly into the query syntax.
- Click Save widget to add the widget to your library.
Add parameters to a custom XQL widget
If you want to use filters and drilldowns on your dashboard, one or more widgets on the dashboard must contain parameters. For more information about filters and drilldowns, see Configure global filters and Configure drilldowns.
Parameters can be static or dynamic, and support single or multi-select values.
Create an XQL widget.
Define an XQL query and click Preview.
You can base your filters on fields and values in the query results.
Add parameters to the query using the filter stage, define parameters prefixed with $.
-
For single select filters:
filter <field> = &<parameter>Example:
This filter enables dashboard users to filter the dashboard by a single predefined severity value.filter xdm.issue.severity = &severity) -
For multi select filters:
filter <field> in(&<parameter>)Example:
This filter enables dashboard users to filter the dashboard by one or more domain values (predefined or dynamically generated).filter domain in(&domain)
(Optional) Under Parameters, define default values for your query parameters.
This makes the widget populate automatically on load. You can also define default values when configuring filters in the dashboard or report builder, or leave this blank.
Create script-based widgets
You can use scripts in custom widgets to create dynamic widgets for more complex calculations and to present data from third-party systems. For examples of creating widgets using scripts, see Script-based widget examples.
Before creating a script-based widget in the Widgets Library, you need to create or upload the script to the Scripts page. In the Widgets Library, you can change elements of the visual presentation. Because these widgets can contain unique logic or sensitive data queries, they are now managed as individual items with specific access rules.
To create a script-based widget, your user role must allow you to create scripts and build dashboards. These permissions are set by your administrator. For more information, see Manage access to custom dashboards.
How to create a script-based widget
- Create the script: Select Investigation & Response → Automation → Scripts. You can upload an existing script or create a new one. Cortex XSIAM supports JavaScript, Python and PowerShell. You can create a script for one of the following chart types:
- Pie
- Column
- Line
- Single Value
- Configure for the Widget Library: In the Script Settings, add the widget tag to the script. This tag ensures the script is recognized as a visualization tool and becomes available in the Widget Library.
- Create the Custom Script Widget: Select Dashboards & Reports → Widget Library, click Create custom widget, and select Script.
- Define the widget properties:
- Name and Description: Give your widget a clear name so you can identify it later in the Widget Library.
-
Script: Select the script you created in step 1 from the list.
If you have added arguments to the script, these appear when creating a widget.
- Set visibility: Use the Public widget toggle to determine how the widget appears in the Widget Library. Leave it unselected (default) to keep the widget Restricted (visible only to you) or select it to make the widget Public (visible to all users with Widget Library access).
- Preview and save: Run a preview to ensure the script executes correctly and displays the data as intended, then click Save.
-
Configure the display (Chart Editor): Use the Chart Editor to choose the graph type and the subtype, and to enable or disable the graph legend.
Available options are Pie, Column, Line, and Single Value.
To display the result of the script as a time duration, choose the graph type Single Value and enable Show as Time. You can then select the Time Unit (millisecond, second, minute, or hour) and the Display format.
- Add to reports or dashboards: Once saved to the Widget Library, you can add this script-based widget to any custom dashboard or include it when building a report template.
Script-based widget examples
You can use script-based widgets to perform calculations on and visualize third-party data.
Add the widget tag in the script settings to make the script available for use in script-based widgets. For more information, see Create a script.
The following are sample Python scripts for the graph types Single Value, Pie, Line, and Column.
Single value
This example shows how to use a script with an API call to return a single value in a widget. Use this example to build your own script that pulls in third-party data to display a single value.
If your script returns a time duration, configure the widget with the graph type Single Value and enable Show as Time..
Example:
import requests def main(): api_key = 'PUTYOURKEYHERE' symbol = 'PANW' api_url = f'https://www.alphavantage.co/query?function=GLOBAL_QUOTE&symbol={symbol}&apikey={api_key}' response = requests.get(api_url) data = response.json() price_str = data['Global Quote']['05. price'] price_int = int(float(price_str)) return_results(price_int) if __name__ in ('__main__', '__builtin__', 'builtins'): main()
Pie, Line, or Column Chart
Example 1
The following example script creates random, mock data to simulate a stock price fluctuating over a short period of time. Use this example to build your own script that brings in third-party data and display trends using a pie, line, or column chart.
import random import json from datetime import datetime, timedelta def main(): chart_data = [] start_time = datetime.strptime("13:00", "%H:%M") # Start the price at a realistic value current_price = 202.0 # Simulate 50 data points for i in range(50): # Generate a time label in 1-minute jumps time_label = (start_time + timedelta(minutes=i)).strftime("%H:%M") # Create the data point for the chart data_point = { "name": time_label, "data": [int(current_price)], "groups": [] } chart_data.append(data_point) # Simulate the next price by adding a small change to the current price price_change = random.uniform(-1.5, 1.5) # A small drift up or down current_price += price_change # Return the data formatted exactly as in your working script return_results({ "Type": 1, "ContentsFormat": "json", "Contents": json.dumps(chart_data) }) if __name__ in ('__main__', '__builtin__', 'builtins'): main()
When used in a widget:
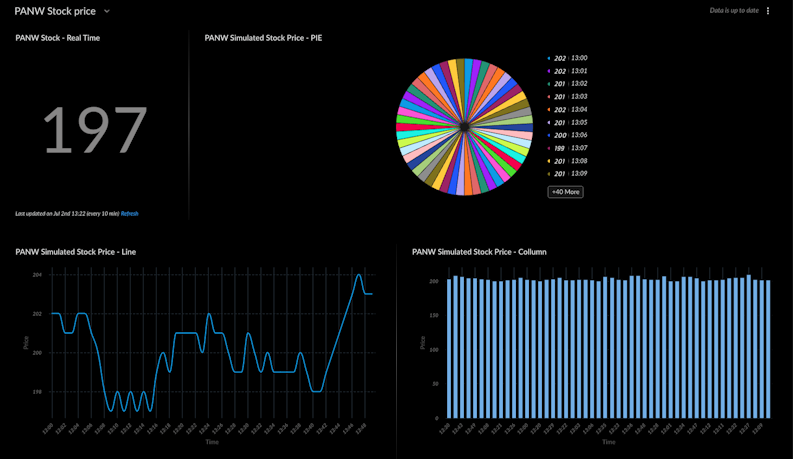
Example 2
The following example script generates simulated data representing the count of security incidents (or other events) broken down by severity level for each day of the week (Monday to Friday). Use this example to build your own script to create a stacked column chart. Configure the widget with graph type Column subtype Stacked.
import json import random def main(): chart_data = [] days = ["Monday", "Tuesday", "Wednesday", "Thursday", "Friday"] severities = ["Critical", "High", "Medium", "Low", "Info"] for day in days: groups_list = [] daily_total = 0 for severity in severities: count = 0 if severity == "Critical": count = random.randint(0, 5) elif severity == "High": count = random.randint(5, 15) elif severity == "Medium": count = random.randint(10, 25) elif severity == "Low": count = random.randint(20, 50) else: count = random.randint(5, 30) daily_total += count groups_list.append({"name": severity, "data": [count]}) chart_data.append({ "name": day, "data": [daily_total], "groups": groups_list }) return_results({ "Type": 1, "ContentsFormat": "json", "Contents": json.dumps(chart_data) })
When used in a widget:
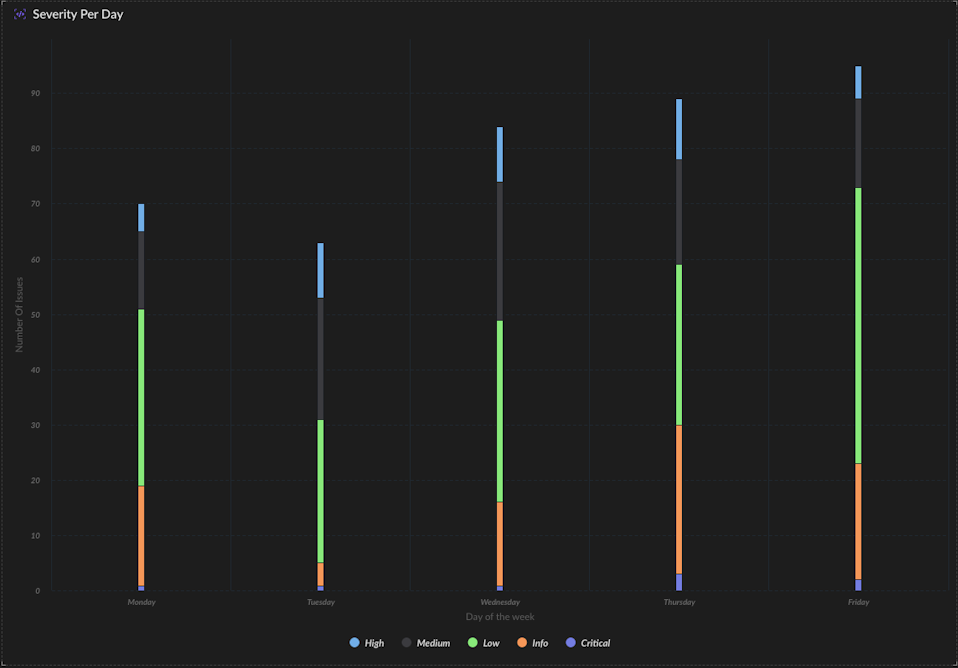
Configure global filters
Define global filters on your dashboards to enable users to alter the scope of the data by selecting from predefined or dynamic values. You can define filters using free text, single-select, or multi-select input values. Once configured, these filters are accessible to anyone viewing the dashboard.
You can configure up to four global filters on a single dashboard or report.
Prerequisite: Before configuring global filters, you must add parameters to one or more custom XQL widgets on your dashboard. For more information, see Add parameters to a custom XQL widget.
Open the dashboard builder.
Select a dashboard from the Dashboard Manager and click Edit.
Open the filter configuration.
In the Widget Library click the Filters & Inputs icon.
Define the Input name.
Enter a name that identifies the parameter for dashboard users.
Select the filter type.
Choose one of the following options:
- Single Select: To specify a single predefined value.
-
Multi Select: To specify multiple predefined or dynamic values.
Note: Multi-select and dynamic filters require the IN operator to be configured within the XQL widget query.
- Free text/number: To specify a single free-text value.
Select the parameter.
From the dropdown, choose the specific parameter from your XQL widgets that you want to configure.
Define dropdown options.
For Single Select or Multi Select filters, specify filter values. When the dashboard is generated, these options will appear in a dropdown list.
-
For Predefined inputs: Manually type the list values.
Guidelines for predefined inputs
- The values must support the parameter type. For example, specify characters for $name and numbers for $num.
- If you uploaded numbers in a string, enclose each number in quotes (e.g.,
"500").
-
For Dynamic inputs: Configure a query to fetch dynamic values. Click Select under Define Query.
Guidelines for dynamic inputs
- The query must include the fields stage to select the specific column name for the dropdown values. All values in this field will be available for selection and will update dynamically.
-
Example:
In this example, the endpoint_name field is configured so users can filter by one or more endpoint names:dataset = endpoints | fields endpoint_name -
Note: If you specify more than one field, only the first field's values will be used.
(Optional) Define a default value.
If you define a default, the widget populates automatically when the dashboard opens. If no default value is defined, the user can select a value when they open the dashboard.
Configure drilldowns
Enable users to dive deeper into data by configuring dashboard drilldowns on individual widgets. Clicking a configured widget can trigger contextual changes, or seamlessly link users to:
- An XQL search
- A custom URL
- Another dashboard
- A report
Once configured, these drilldowns are instantly available to any authorized user.
Prerequisite: Some drilldown options require one or more parameters to be configured within the XQL widget query. For more information see Add parameters to a custom XQL widget.
Open the dashboard builder.
Select a dashboard from the Dashboard Manager and click Edit.
Add the drilldown action.
Identify the widget on which you want to configure a drilldown, click its options menu (the three vertical dots in the widget frame), and select Add drilldown.
Configure your drilldown action.
Choose one of the following configuration options under Action on Click:
- In-Dashboard Drilldown: Interactively filters the active dashboard using parameters defined in your custom XQL widgets.\
&#xNAN;(Requires parameters to be configured within the XQL widget query).
| Field | Action/Description |
|---|---|
| Parameters | Select the parameter to filter by. You can choose any parameter defined in the widget's XQL query. |
| Value | Define the data point that will trigger the filter when a user clicks the widget. You can:
|
Note: Any other XQL widgets on the dashboard sharing this parameter will also filter automatically.
- Link to Dashboard: Navigates the user to a separate target dashboard.
Note: If linking to a Restricted dashboard, users must have at least Viewer access to view it.
| Field | Action/Description |
|---|---|
| Dashboard | Select your target dashboard from the list. |
| Parameters (Optional) | Select parameters to filter the target dashboard. (Available only if the target dashboard's widgets contain defined parameters.) |
| Value (Optional) | If configuring parameters, select values for filtering the target dashboard. You can:
|
- Open XQL Search: Runs a specific XQL query based on the clicked value.
| Field | Action/Description |
|---|---|
| XQL Query | Enter the query you want to execute upon drilldown. Type $ to open the autocomplete menu for available widget variables (e.g., in a table widget, |
Example XQL: This example passes two parameters from a table widget into an XQL query: the specific cell value clicked, and the cell value from the request_url column in that same row.
dataset=xdr_data |filter event_type=$y_axis.value and requestUri=$row.request_url |fields action_download, action_remote_ip as remote_ip, actor_process_image_name as process_name |comp count_distinct(action_download) as total_download by process_name, remote_ip, remote_hostname |sort desc total_download |limit 10 |view graph type=single subtype=standard xaxis=remote_ip yaxis=total_download
- Open Custom URL: Opens an external web page based on the clicked value.
| Field | Action/Description |
|---|---|
| URL Address | Enter the destination URL. To make the link dynamic, insert variables from the Available parameters list. |
Example URL: In this URL, the $x_axis.value variable represents Cortex product names. Clicking a slice in a pie chart replaces the variable with the specific product name:
https://www.paloaltonetworks.com/cortex/cortex-$x_axis.value
- Generate Report: Instantly runs a report using data from the clicked value.
Save the widget.
Click Save on the widget dialog, and ensure you save your overall changes to the dashboard before exiting the editor.
Variables in drilldowns
The following tabs are organized according to widget type and describes the widget variables that are available in drilldowns. The variable defines the value to capture in the drilldown, according to the element that is clicked. The captured value is then configured as a parameter by which to filter data on drilldown.
(Area, Bubble, Column, Funnel, Line, Map, Pie, Scatter, or Word Cloud)
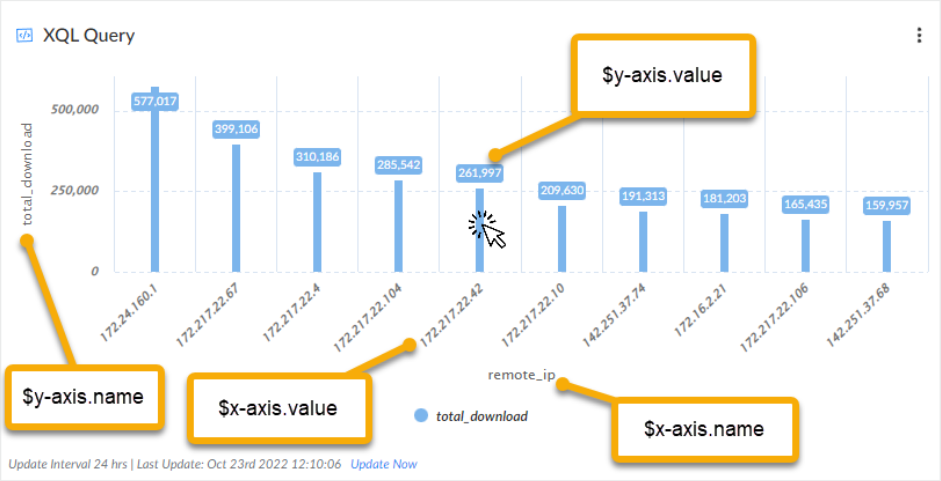
$x_axis.name: Selects the x-axis name.$x_axis.value: Selects the x-axis value for the clicked value.$y_axis.name: Selects the y-axis name.$y_axis.value: Selects the y-axis value for the clicked value.
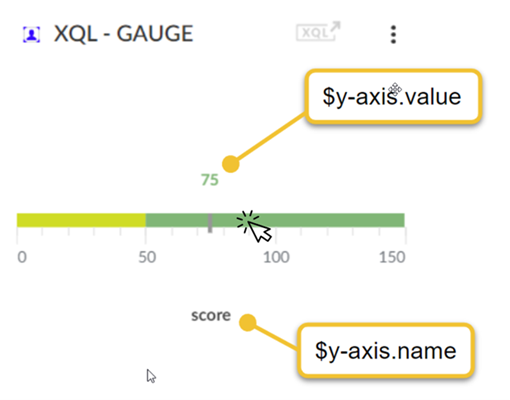
$y_axis.name: Selects the y-axis name that the single value represents.$y_axis.value: Selects the y-axis value for the clicked value.
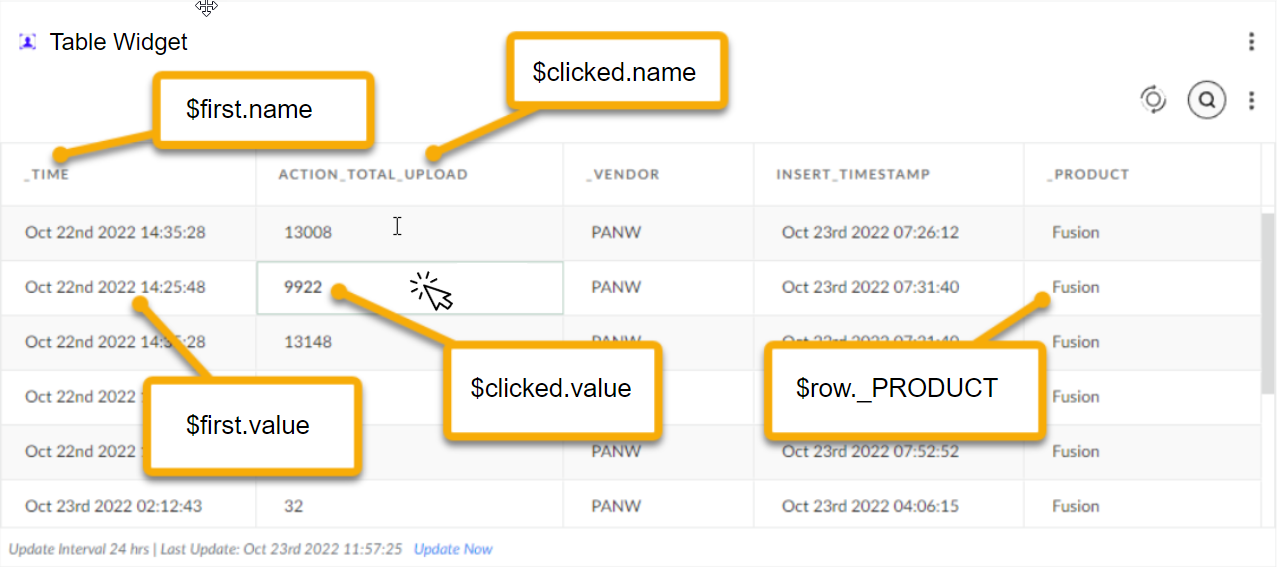
$first.name: Selects the leftmost column name in the table.$first.value: Selects the leftmost value in the clicked table row.$clicked.name: Selects the column name of the clicked value.$clicked.value: Selects the value in the clicked table cell.$row.<field_name>: Selects the field (column) from the clicked table row.
c
Dashboard reference
The following pages list the system provided Command centers and dashboards.
Command Center reference
The platform provides a collection of pre-configured Command Centers designed to give you comprehensive visibility across your enterprise's security architecture.
Note
Access to these dashboards requires RBAC permissions under Dashboards & Reports. The Dashboards component must be Enabled in your role and requires View permissions for Command Center Dashboards. If certain options are unavailable, contact your administrator.
| Command Center | Operational Description |
|---|---|
| Cloud Detection and Response (CDR) Command Center | Investigate and contain cloud threats. Provides a dynamic view of cloud accounts, assets, and active cases to quickly identify attack paths and vulnerabilities. |
| Cloud Security Operations Command Center | Prioritize and resolve high-impact risks. Provides deep visibility into your cloud security posture to help you locate and remediate critical gaps. |
| Cortex Agentic Assistant Dashboard | Maximize AI automation. Monitor how AI agents power your SOC, identify your most active security use cases, and find new opportunities to automate manual tasks. |
| Cortex Cloud Command Center | Monitor cloud status. Functions as a live, single-pane-of-glass workspace showing the overall health and security status of multi-cloud infrastructures. |
| Cortex Command Center | Map your entire attack surface. Provides total visibility across all assets—whether on-prem or in the cloud—to ensure there are no unmanaged coverage gaps. |
| XSIAM Command Center | Manage overall SOC health. Tracks real-time data ingestion rates, alert volumes, and the operational performance of your tenant. Serves as a primary launchpad for interactive drilldowns into the Data Inventory, Dynamic View, and Cases Overview command pages. |
Cortex Command Center
The Cortex Command Center is a unified view for complete asset visibility, providing full organizational visibility across your cloud and enterprise environments. By combining cloud security data with SOC insights, the Cortex Command Center offers a detailed view of cloud and enterprise assets, including asset risk levels and active threats to assets.
Because this is a system-provided dashboard, it is Public by default and visible to all authorized users. It cannot be edited, deleted, or have its ownership transferred.
This dashboard helps you gain key insights into your environment, including:
- A complete overview of your assets: Understand asset distribution across your organization, with a comprehensive breakdown of assets by class, provider, and region.
-
Assets at risk due to posture issues: Identify assets with open posture issues that require attention to prevent threats from occurring in your environment.
Posture issues are associated with risk management activities to detect and mitigate risks to assets in the environment before they occur in runtime, and improve resilience. For example, misconfigurations in cloud instances, over-permissive users, or the detection of secrets or shadow data.
-
Assets with active runtime threats: Identify assets with open security issues that require immediate attention.
Security issues are associated with case response activities for detecting, preventing, and blocking threats as they occur in runtime. For example, identification of malware in a file, a compromised endpoint, or a phishing attempt.
- Assets with active threats and posture issues: Highlight assets with open security and posture issues. These are assets with active threats that might have already been exploited, and require immediate attention.
- Data Ingestion in your environment: See the total amount of ingested data in your environment over the last 24 hours, with a breakdown by data source. Click the widget to see a full breakdown on the Data Ingestion dashboard.
Show me more
When you access the Cortex Command Center, the dashboard displays a view of all monitored assets. On the left side of the dashboard, you can see the total number of monitored assets, and a breakdown by status. On the right side, the radar provides a visual representation of your assets. The data on this dashboard shows the current status of your environment and is updated every 20 minutes. You can take the following actions to investigate your assets:
-
Refine the displayed data: Use the severity filters in the top-right corner. By default, assets with High and Critical issues are displayed. You can also change the radar view to display data by asset class, provider, or region, and drill down on assets by status: assets with active threats, assets at risk from posture issues, and assets with both active threats and posture issues.
Drill down further on an asset class, provider, or region by clicking on the radar to open a side view with a breakdown of the selected option.
- Identify unprotected assets: Filter by asset class Compute to see the number of Compute assets that are being protected by the Cortex Agent. This information can help you to identify unprotected assets, and ensure complete coverage in your environment. Click on the number of agents to see more information on the Agent Management dashboard.
- Investigate open issues for an asset type: Click a group (such as Identity) to see the number of open issues for each asset status. Click on the number of issues to open the Issues page, filtered for the asset type and status.
- See asset details: On the radar, each dot represents a group of assets, color-coded by their collective status. Click a dot to view details about the assets in the group. Use the arrows to click through the assets, click See details to open the asset card for a specific asset or click See All to open the Asset Inventory, filtered to display all assets in the group.
Limitations
The Cortex Command Center currently has the following limitations:
- Only assets that are included in the Asset Inventory are displayed on the dashboard.
- In the region view, the location is based on cloud provider region and its data center location and therefore the map view shows only cloud assets.
- When you click See All assets in the Asset Inventory, the listed assets are limited to 1,000.
Cortex Agentic Assistant dashboard
Danger
The Cortex Agentic Assistant is only available after it is enabled and for tenants in certain regions. For more information, see Cortex Agentic Assistant.
The Cortex Agentix Assistant dashboard enables you to view how Cortex XSIAM uses AI Agentic technology to power your SOC. Use this dashboard to identify key areas of utilization and find opportunities to drive greater adoption and optimize your automation strategies.
Because this is a system-provided dashboard, it is Public by default and visible to all authorized users. It cannot be edited, deleted, or have its ownership transferred.
The primary information displayed on the Cortex Agentix Assistant dashboard is listed below. Start exploring the dashboard by clicking on each element to view a pop-up containing detailed metrics and usage information:
- User Prompts: Clicking on User Prompts shows the number of users who created the user prompts and usage over the past seven days.
- Automation Rules: Playbooks and Quick Actions that were triggered by automation rules. Clicking on Automation Rules shows how many rules were triggered and the top automation rules. For more information about rule-based automation, see Create an automation rule.
- Agent Grid: The grid shows the five AI agents that users engaged with most frequently in the past seven days. Clicking on an agent opens the agent card, which provides more details about the roles that can access the agent and the actions available to the agent. Other Agents represent all other enabled agents, such as system and custom agents. Clicking on Other Agents brings you to the Agentic Assistant Hub, where you can view all agents.
XSIAM Command Center
The XSIAM Command Center dashboard provides a dynamic overview of your security operations processes, and supports drilldowns to additional dashboards and dedicated pages. The dashboard gives a visualization of the current status of your tenant and its activity during the selected time frame. Click on any element to drill down to dashboards or pages displaying data that is filtered by your selection.
In addition, click on Cortex Agentic Assistant to open a dashboard detailing how Cortex XSIAM uses AI Agentic technology in your environment. For more information, see Cortex Agentic Assistant.
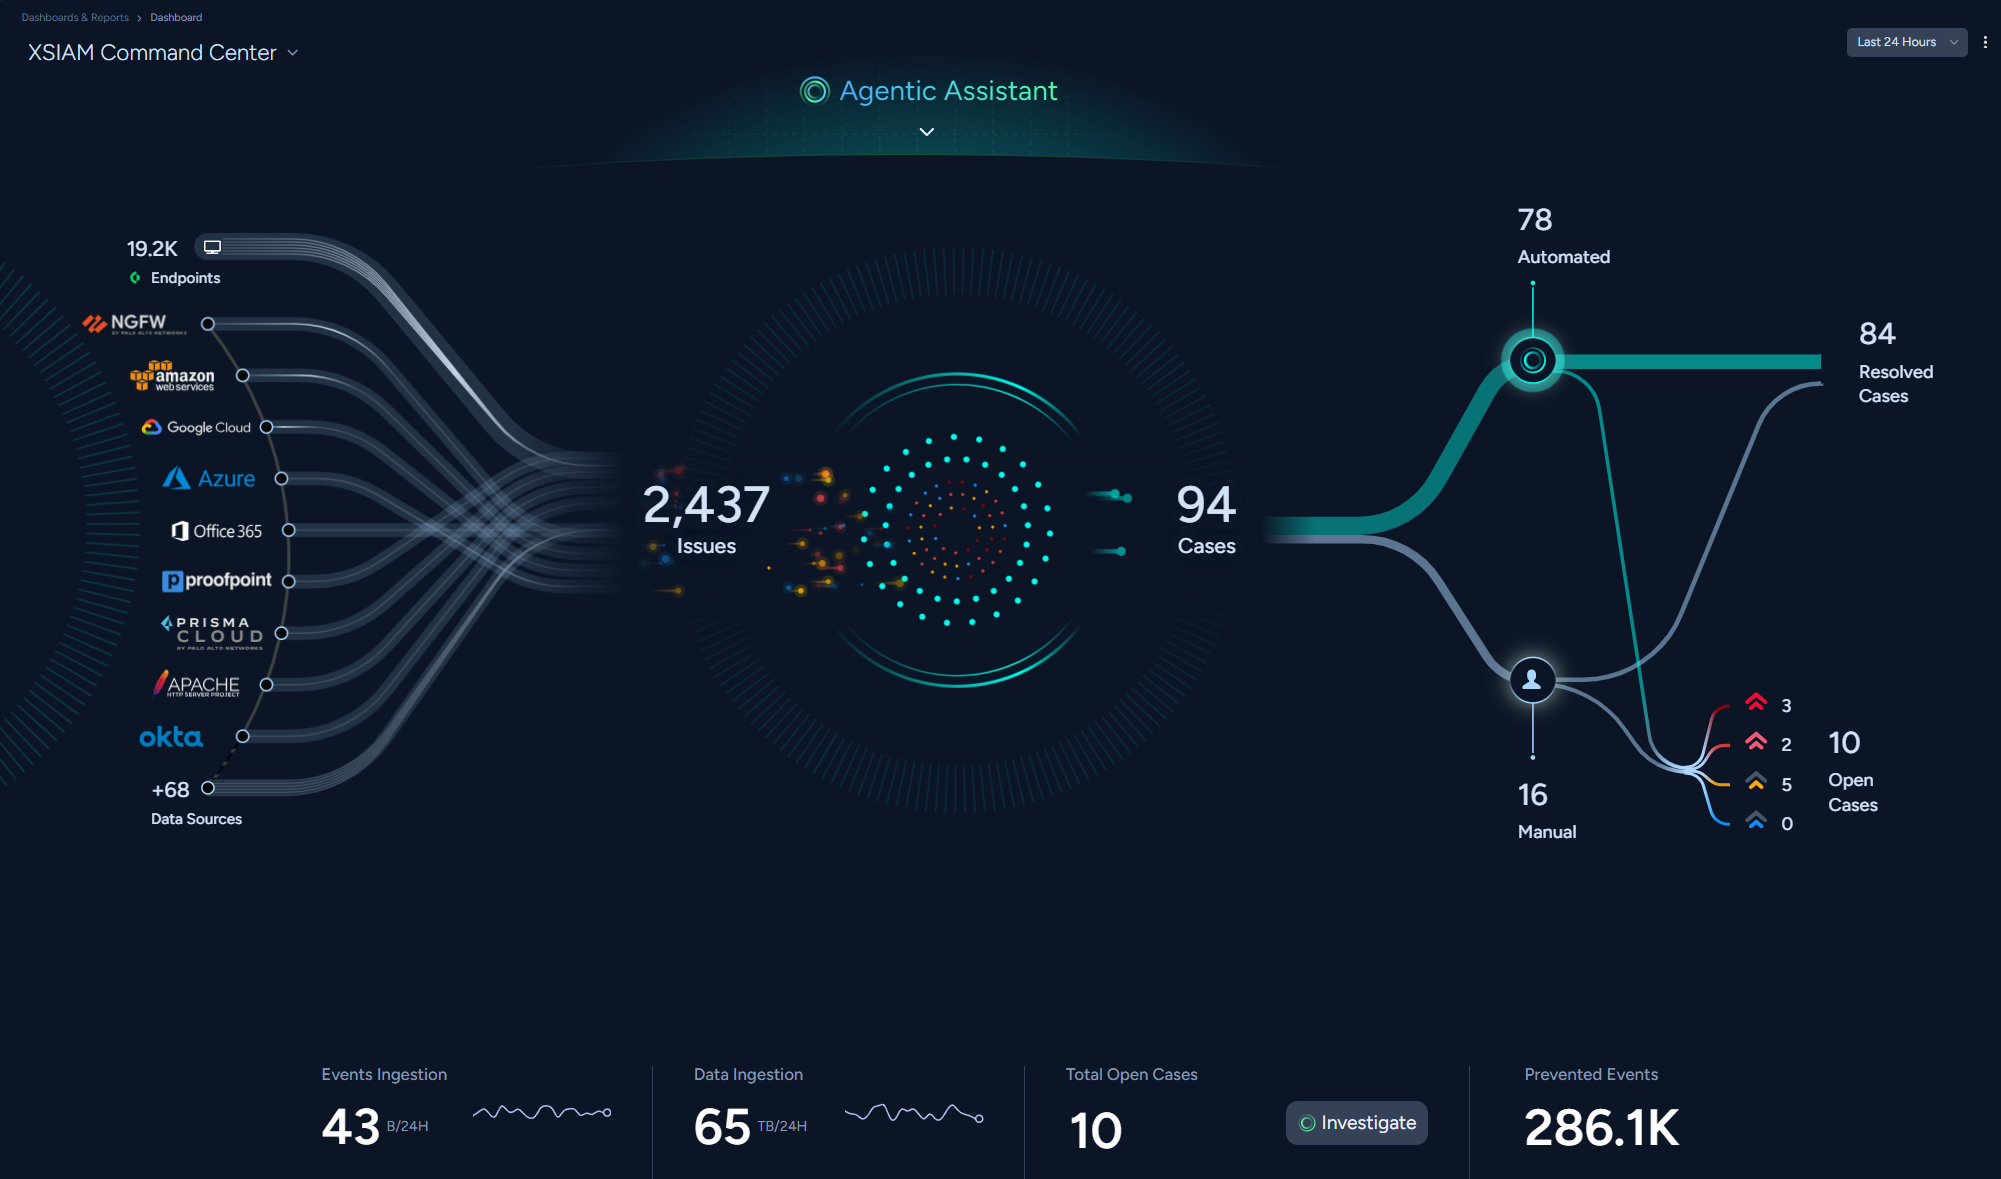
The XSIAM Command Center includes incoming data, cases, and issues, and key performance indicators. The following table describes each of these sections:
| Section | Details |
|---|---|
| Incoming data |
Click on any of these items to explore your Data Inventory. Breakdowns of data ingestion by data source, including ingestion rates, trends, and prevented events, are displayed. |
| Cases and issues |
Click on any of the case metrics to open the Cases Overview , showing a breakdown of your cases. You can also click on the concentric circle to see a live feed of Cortex XSIAM activity on the Dynamic View. |
| Key performance indicators |
Click on the key performance indicators to drill down to dedicated pages for further investigation. You can also click Start Investigation to open the Cortex Agentic Assistant with useful prompts to aid you in the investigation process. The trend percentages for the key performance indicators are calculated by comparing the totals from the current time frame with the totals of the previous time frame. An arrow indicates whether the rates are rising or falling in comparison to the previous time frame's total. |
From the XSIAM Command Center, you can drill down to the following dashboards:
Data Inventory
The Data Inventory provides a dynamic view of the data sources that are ingesting data into Cortex XSIAM. You can see breakdowns of data ingestion by data source, ingestion rates, trends, and prevented events.
You can access the dashboard from the XSIAM Command Center by clicking a data source, the number of Endpoints or VM Brokers/XDRCs. The Data Inventory includes incoming data sources and key performance indicators. The following table describes each of these sections:
| Section | Details |
|---|---|
| Data sources | Data sources are broken down into categories. Depending on the selected data source, the dashboard opens the relevant category. You can expand a category to see details of individual data sources and hover over a data source to see more details. You can also click on a data source to link to a drill down view, filtered by your selection:
|
| Key performance indicators |
Click on the key performance indicators to drilldown to dedicated pages for further investigation. |
Dynamic View
The Dynamic View provides an overview of Cortex XSIAM activity in real-time. You can see the data sources that are sending data to Cortex XSIAM, data sources with connection errors, playbooks being triggered, and the issues and cases being created.
To access the Dynamic View click on the concentric circle in the XSIAM Command Center. The Dynamic View includes the concentric circle, the live feed, and the key performance indicators. The following table describes each of these sections:
| Section | Details |
|---|---|
| Concentric circle | Shows an animation of Cortex XSIAM activity in real-time. Icons represent issues and cases. Data sources are displayed on the outside of the circle, and are color coordinated to represent their connection status. The center of the circle displays statistics about open cases, automatically resolved cases, and manually resolved cases. Click on any of the elements to drilldown to dedicated pages for further investigation. |
| Live feed | Reports the following types of activity on the tenant:
Click on any of the live feed elements to link to dedicated pages that can assist you with your investigation. |
| Key performance indicators | Displays information about data ingested during the time frame, and the number of open cases. The ingestion rate trend percentage is calculated by comparing the ingestion total of the current time frame with the ingestion total of the previous time frame. An arrow indicates whether the rates are rising or falling in comparison to the previous time frame's total. Click on the key performance indicators to drilldown to dedicated pages for further investigation. |
Cases Overview
The Cases Overview provides a breakdown of your cases, including MITRE ATT&CK tactic details, automation suggestions, and top resolving assignees. You can click different elements on the dashboard to link to dedicated pages for further investigation.
You can access the Cases Overview from the XSIAM Command Center by clicking on any of the case metrics. The Cases Overview displays the following information:
| Section | Details |
|---|---|
| Automation suggestions | Displays the number of cases that could have been automated, and the number of playbook recommendations. |
| Resolved cases | Displays the number of resolved cases in the time frame, and provides a breakdown of top resolving assignees. |
| Open cases | Displays a breakdown of open cases by severity, and details of the MITRE ATT&CK tactics identified in the cases. |
| Key performance indicators | Displays information about data ingested during the time frame, and the number of assets affected by the cases. The ingestion rate trend percentage is calculated by comparing the ingestion total of the current time frame with the ingestion total of the previous time frame. An arrow indicates whether the rates are rising or falling in comparison to the previous time frame's total. |
Cloud Detection and Response (CDR) Command Center
The Cloud Detection and Respond (CDR) Command Center dashboard provides a dynamic overview of your cloud-based security operations. It includes details about your cloud assets and projects, related cases, risks, and vulnerabilities. From the dashboard, you can drill down to dedicated views for further investigation into your platform.
Notice
Requires Cortex XSIAM Premium, or any other XSIAM license with the Cloud Runtime Security or the Cloud Posture Security add-on.
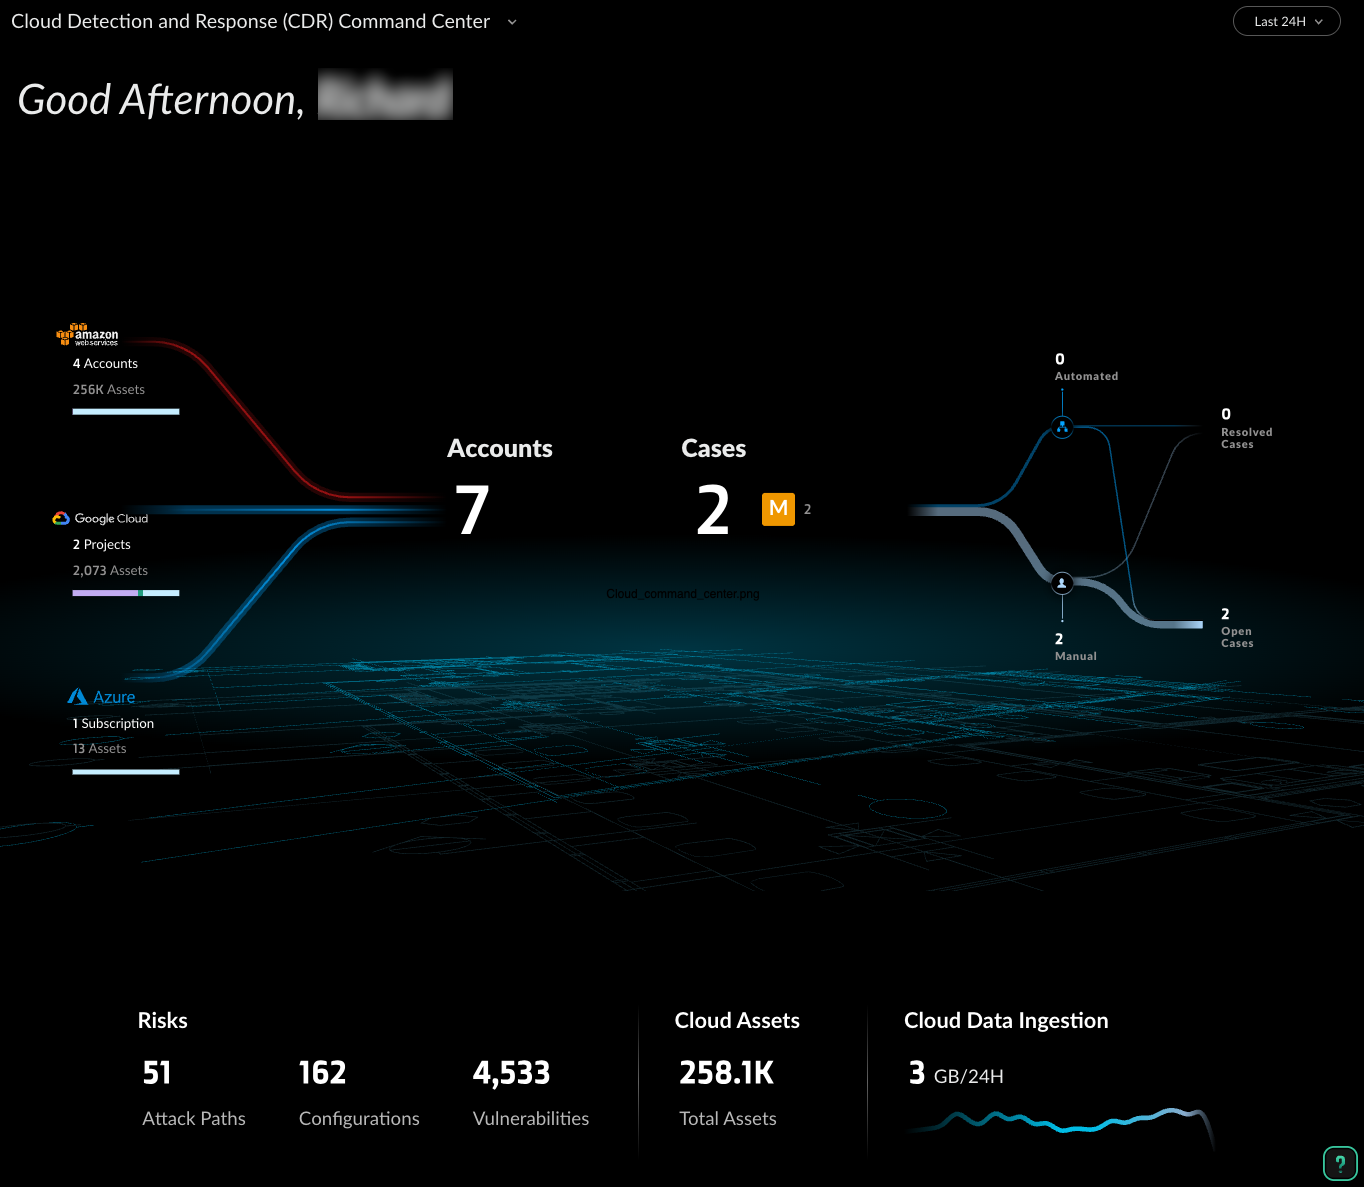
The following table describes each section on the Cloud Detection and Respond (CDR) Command Center:
| Section | Details |
|---|---|
| Accounts | Displays information about your cloud accounts, the total number of assets configured per account, and the total number of cloud projects from your cloud accounts. Hover over the total number of assets to see a breakdown by category, and click on an account to drill down to the assets for the selected account. Line colors represent the connectivity status of the assets. You can hover over the lines to see a breakdown of data ingestion or details of collection errors. |
| Cases | Displays the total number of cases opened in the timeframe that are associated with your cloud assets, broken down by severity. Cases are broken down into automated and manual cases, where automated cases contain at least one playbook. You can also see the top nine open cases as ranked by SmartScore. |
| Key performance indicators |
|
Cortex Cloud Command Center
Cortex Cloud Command Center serves as your centralized landing experience designed to provide immediate visibility into your security posture and current environmental status. It presents a high-level summary of your account health, asset distribution, and assets at risk to help you get a snapshot of your compliance and vulnerability posture. Through a unified view of your security domains, you can monitor open threat cases and posture issues sorted by severity and impact. This interface provides direct pathways to your inventory searches, operational dashboards, graphs, and compliance reports while highlighting top-priority issues.
The following image shows the Cortex Cloud Command Center dashboard:
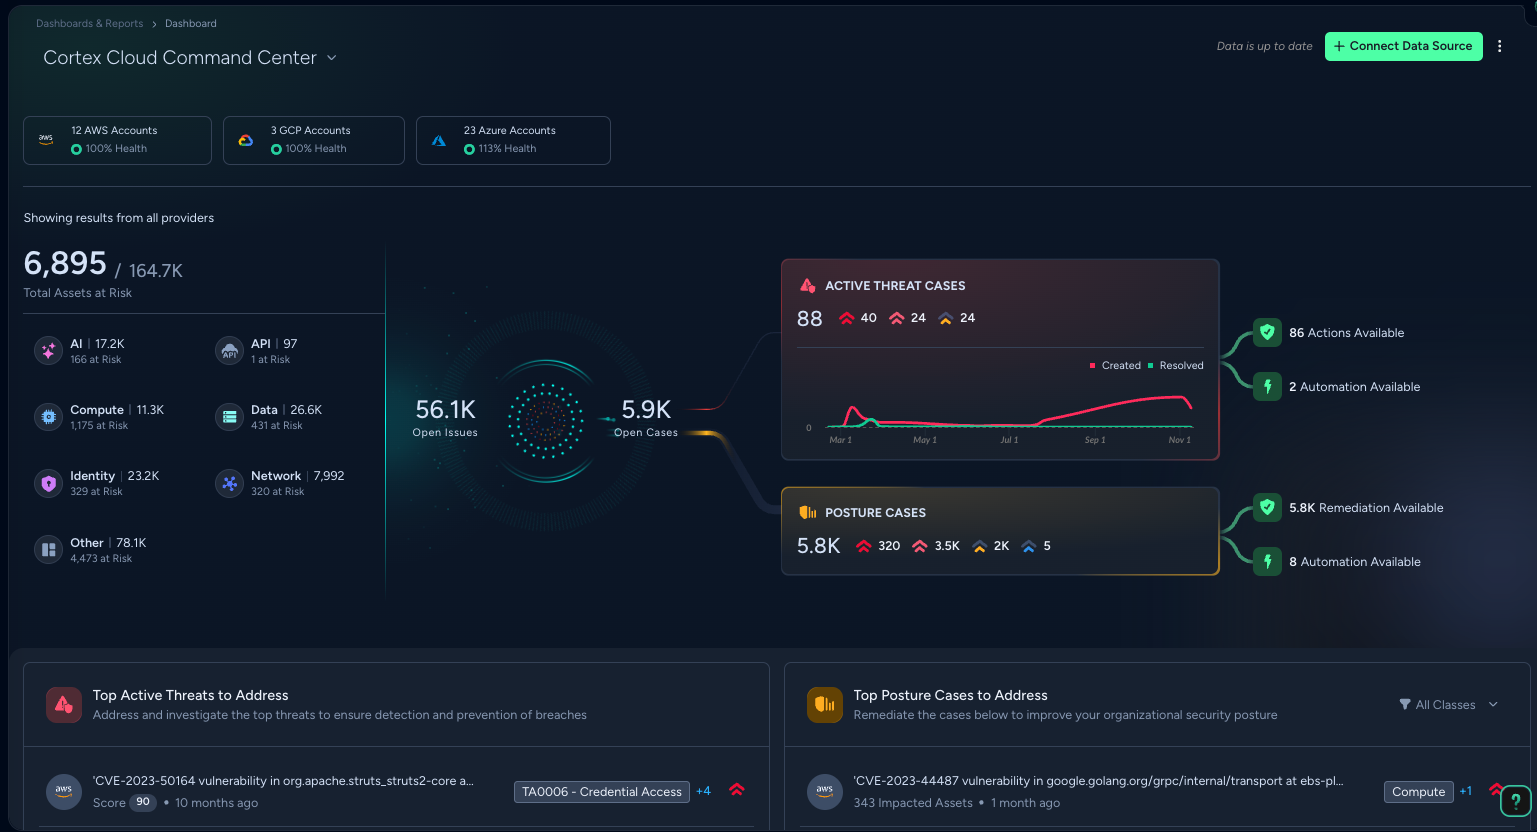
Interactive Navigation and Drilldown
All metrics, status indicators, and list items in Cortex Cloud Command Center are interactive. Selecting a high-level summary element opens a filtered view of the underlying data, allowing you to move from environmental overviews to your asset inventories, threat cases, or remediation workflows.
Environmental Health and Inventory
This section displays your cloud footprint and its operational status.
- Provider health summary: You can monitor your account counts and percentage health across cloud providers to verify scanning status.
- Asset class distribution: This view categorizes your infrastructure into classes such as AI, Compute, Identity, API, Data, and Network, displaying the total count and the number of your assets currently at risk.
Risk and Threat Analysis
These widgets centralize your active security investigations and prioritize your response efforts.
The Cortex case engine consolidates open issues into open cases, which are further analyzed and displayed as follows:
- Active Threat Cases: This component displays your total open threat cases by severity and provides a trend analysis of your created and resolved cases
- Posture Cases: You can review your Posture cases, categorized by severity, with indicators for available manual and automated remediations.
Prioritized Risk and Compliance Summaries
The lower sections of Cortex Cloud Command Center aggregate your high-impact risks and regulatory status to assist in cross-functional prioritization.
- Vulnerability Summary: This section displays a quantitative count of unique risky vulnerability issues, categorized by critical and high severity, weaponized exploits, and available fixes.
- Top Risky Vulnerabilities: You can access a prioritized list of specific vulnerabilities sorted by CVSS and EPSS scores, which includes the publish date and the number of your impacted assets for each entry.
- Compliance Summary: This view provides your overall compliance score and a breakdown of your compliance standards by score.
- Standards Status: You can monitor the specific assessment percentage for individual standards, such as ISO-27001, and see the total number of controls assessed within each framework.
In addition, navigation links are provided, enabling you to select Manage Vulnerabilities or View Compliance Center to transition from these summaries to your specialized management environments.
System dashboards
System dashboards help you monitor and evaluate various aspects of your environment. You can access your default view by navigating to Dashboards & Reports → Dashboard. To change the displayed dashboard, click the dashboard name and select from the dashboard menu.
Because system dashboards are managed by the platform and cannot be edited or deleted, you can duplicate any dashboard in the Dashboard Manager. This creates a customizable version you can modify freely while keeping the original template intact.
| Dashboard | Improved Description |
|---|---|
| Agent Management | Track the status, content versions, and OS distribution of all deployed agents across your organization. NoteRequires Cortex XSIAM Premium, Enterprise, or any license with the Enterprise Runtime or Cloud Runtime Security add-on. |
| AI Security | Assess your organization’s AI ecosystem and security posture to guide governance decisions and prioritize risk-mitigation steps. NoteFor more details, see What is Cortex Cloud AI Security?. |
| API Security Management | Identify and mitigate threats and vulnerabilities across cloud services by monitoring risky API funnels, regional attack patterns, attack traffic trends, and sensitive data exposure. |
| Application Security | Evaluate your application security posture through targeted insights into exposed assets, code vulnerabilities, and CI/CD pipeline issues. |
| Attack Surface Management | Pinpoint internet-exposed assets and analyze related exposure cases to reduce your external attack vector. NoteRequires Cortex XSIAM Premium or any license with the Attack Surface Management (ASM) add-on. |
| Automation Insights | Review high-level automation performance, tracking automatically closed issues and execution trends over time. |
| Cloud Inventory | Audit and manage your organization's cloud-based assets across all environments. NoteRequires a Cortex XSIAM Enterprise Plus license. |
| Compliance Overview | Review your organization’s compliance performance against industry standards and internal security frameworks. NoteFor more details, see Compliance Overview Dashboard. |
| Cortex Cloud Consumption | Track your cloud consumption with a detailed breakdown by workload type, date range, and other usage details across all your cloud accounts. NoteFor more details, see Cortex Cloud Consumption. |
| Cloud Security Operations | Assess and resolve high-impact cloud security issues quickly to maintain a strong security operational posture. NoteFor more details, see Cloud Security Operations. |
| Data Ingestion | Monitor data ingestion rates, vendor/product breakdowns, and daily quota consumption across your system. For more information, see Data Ingestion. NoteData prior to July 2023 is inaccessible on this dashboard due to metric updates, but remains queryable via XQL on the metrics_center dataset. |
| Data Security | Discover and visualize all your data assets across the different cloud services, which will help you understand where the sensitive data is, how it is used and how it is moving across the organization. NoteFor more details, see Cortex Data Security. |
| Identity Security | Secure your identity estate by monitoring your identity inventory, detecting critical findings, identifying the top critical issues and findings in your environment, detecting risky identities, discovering admins and admins at risk, and analyzing 3rd-party access. NoteFor more details, see What is Cloud Identity Security?. |
| IT Metrics | Analyze Cortex XDR agent performance metrics—including CPU/memory utilization, connectivity status, hard reboots, and application crashes. NoteThe Applications Crashing widget is supported for Windows agents only. Requires Cortex XSIAM Premium, Enterprise, or an Enterprise Runtime add-on. |
| KSPM (Kubernetes Security Posture Management) | Investigate Kubernetes clusters, assets, and resources to locate unprotected areas, vulnerabilities, malware, and exposed secrets. NoteFull access requires 'All assets' scoping or Instance Administrator privileges. Restricted access applies under granular SBAC scoping. For details, see Onboard the Kubernetes connector and Manage user scope. |
| MITRE ATT&CK Framework Coverage | Review Cortex XSIAM's content and detection capabilities against the techniques and tactics of the MITRE ATT&CK framework. NoteFor more details, see Review MITRE ATT&CK framework coverage. |
| My Dashboard | Manage personal case assignments and monitor individual Mean Time to Respond (MTTR) performance. |
| Network Traffic Analysis (NTA) | Analyze network traffic patterns and anomalies to highlight potential threats and unusual network behavior. |
| NGFW Ingestion | Track Next-Generation Firewall (NGFW) log ingestion statuses, daily quota consumption, and individual log type breakdowns. |
| Risk Management | Evaluate risk exposure by investigating compromised accounts and insider threats. The issues displayed in this dashboard are tagged by the research as Identity Threat issues or Identity Analytics issues. A case is displayed if any of its associated issues are tagged as an Identity threat or an Identity Analytics threat. NoteRequires the ITDR add-on. |
| Security Manager | Supervise operational case management and agent health across your environment. Monitor 30-day open cases by severity, top 10 open cases, and workload distribution by assignee (aged vs. total open cases), alongside top 5 agent version distributions and overall agent status breakdowns. |
| Threat Intel Management | Investigate malicious or suspicious indicators linked to active security cases. NoteRequires the Cortex XSIAM Premium license or any other XSIAM license with the Threat Intel Management (TIM) add-on. |
| Troubleshooting Instances | Diagnose integration failures by analyzing command and execution errors at the individual instance level. |
| Troubleshooting Playbooks | Debug playbook and task execution errors using focused runtime metrics and failure analysis. |
Cortex Cloud Consumption
The Cloud Consumption Dashboard provides centralized visibility, historical tracking, and granular, account-level auditing for your cloud infrastructure resources. It tracks workload consumption across all connected cloud accounts and providers, breaking the data down by asset type. To simplify multi-cloud deployment tracking, the dashboard normalizes diverse cloud resources into a single, predictable currency called a workload unit.
You can use this dashboard to verify that your cloud workload counts align with your purchased license capacity, to identify which cloud accounts or asset types are driving consumption, and to spot usage trends before they lead to overages.
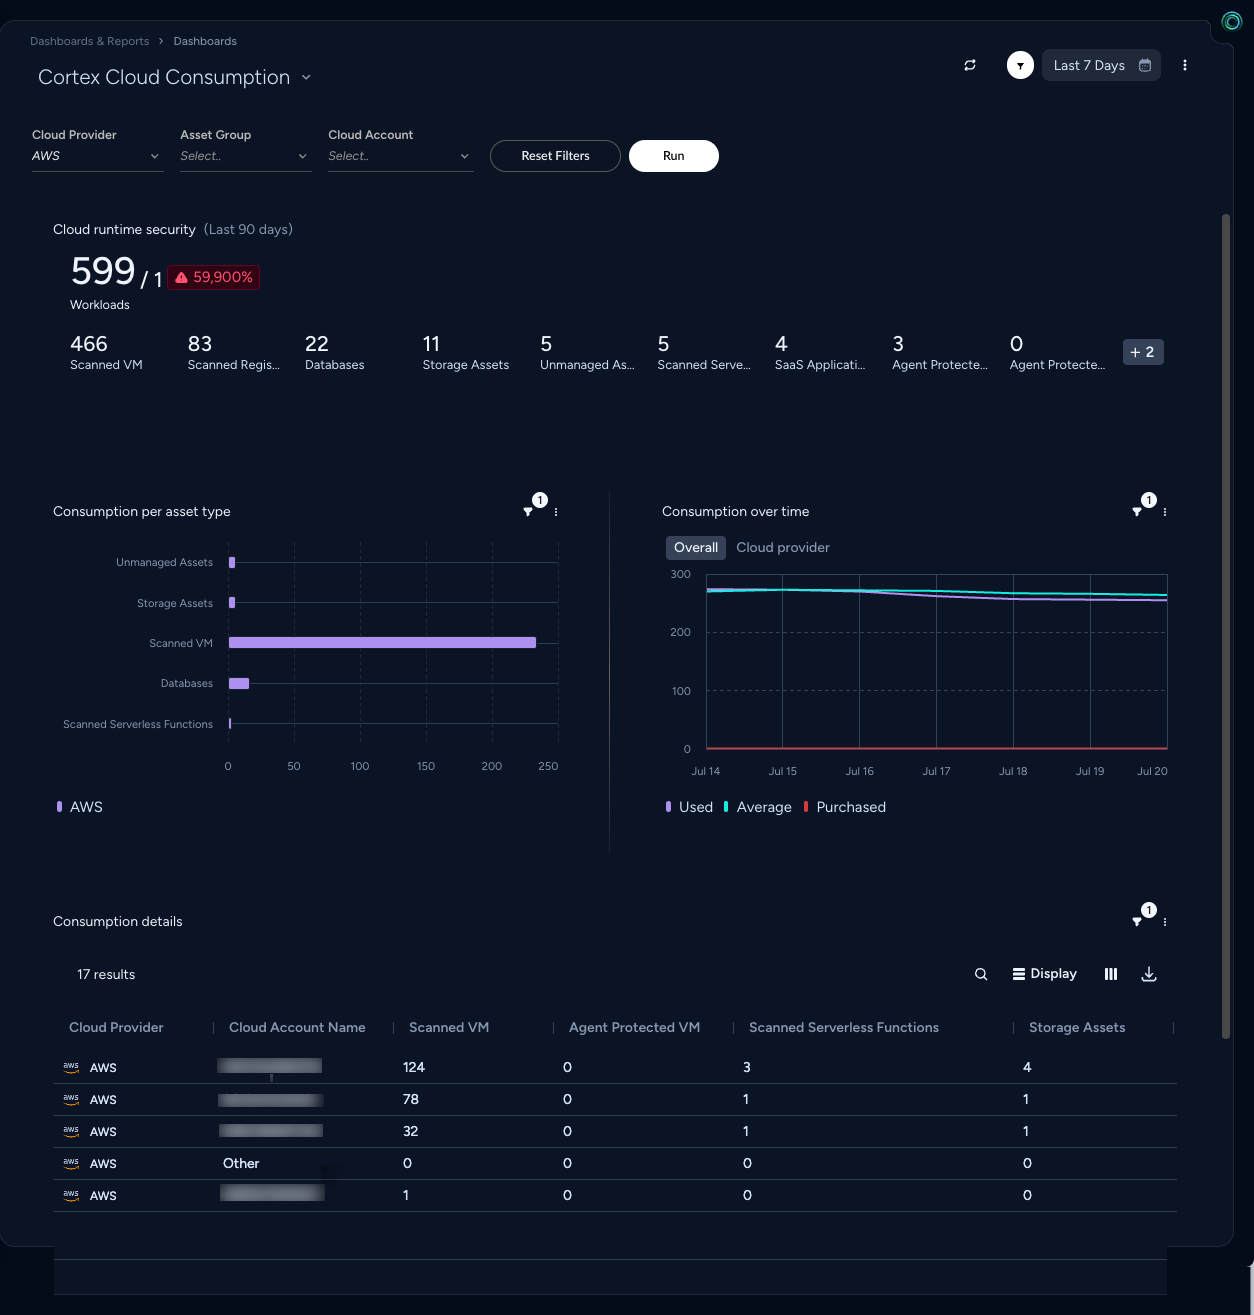
Prerequisites
To view and interact with the dashboard, users and tenants must meet the following conditions:
- Permissions: Users must be assigned the Cloud consumption command center permission. This permission is granted by default to Administrator roles and can be manually delegated to custom roles as needed.
- Licenses: The dashboard automatically populates if your tenant holds active Cloud Posture Security or Cloud Runtime Security licenses, whether purchased as an individual add-on or a core bundle.
- Data Collection: Data must be collected for at least seven days before the Cloud Consumption Dashboard is visible. Historical data is not backfilled in the dashboard.\
\
Once the dashboard is visible, the system progressively matures over 90 days, gradually expanding its available date ranges and filtering capabilities as historical data accumulates. During this initial 90-day transition period, the rolling average calculations scale dynamically based on the number of days of data available since the release date. Eventually, data for the past 365 days is available for custom date ranges.
Workload Unit Conversion
To simplify the complexity of multi-cloud billing, Cortex Cloud normalizes all raw cloud assets into workload units. When counts are aggregated, individual workload unit calculations are mathematically rounded up to ensure precise, predictable billing.
To prevent duplicate charges, workloads discovered by multiple concurrent protection mechanisms (for example, an asset tracked by both a cloud ingestion log and a local host agent) are automatically deduplicated and reported as a single workload unit. Deleted assets and infrastructure managed internally by Palo Alto Networks are excluded from consumption counts.
The following table provides the conversion metrics for mapping protected assets to billable workload units.
| Workload Category | Asset Type | Conversion Metric (= 1 Workload Unit) |
| Compute | Scanned VM | 1 Virtual Machine |
| Agent Protected Endpoint | 1 Endpoint | |
| Containers | Scanned CaaS Instances | 10 Managed Containers |
| Registry Scans | Free Quota: 10 images scanned per deployed workload (VM/CaaS). Beyond Quota: 10 container image scans = 1 Workload. | |
| Serverless | Scanned Serverless Functions | 25 Serverless Functions |
| Storage & DB | Storage Buckets | 10 Cloud Buckets |
| PaaS Databases | 2 PaaS Databases | |
| DBaaS Data Storage | 1 Terabyte (TB) Stored | |
| Other | SaaS Users | 10 SaaS Users |
| Unmanaged Assets | 4 Unmanaged Assets |
Cloud Consumption dashboard sections
Global filters
A unified filter bar at the top of the dashboard allows users to dynamically slice data across all charts and tables simultaneously (excluding the License Summary tiles) by date range, cloud provider, user-defined asset groups (filtered by 'Realm/Account'), and cloud account.
Filtering by date supports data retrieval for the past 365 days.
License and entitlement overview
This section acts as an executive summary, bridging purchased licenses with real-time operational usage.
- Global filters do not apply to these tiles.
- The system uses a 90-day rolling average of hourly snapshots to generate these metrics.
- While top-level widgets display rounded billable numbers, moving your cursor over them triggers a tool-tip explaining the exact conversion math (for example, explaining why 85 storage buckets equal 9 workload units).
- If your tenant holds multiple active licenses (such as Cloud Posture Management and Cloud Runtime Security simultaneously), this section automatically generates a separate, dedicated summary row for each license to allow side-by-side tracking.
Consumption per asset type
This section outlines the composition of your cloud footprint, identifying which technical asset categories are driving expenditures.
- For views under 7 days, the chart uses an average of hourly snapshots. For custom ranges longer than 7 days, the system displays an average of daily snapshots.
- The chart displays the top 5 highest-consuming cloud providers individually. All other active providers are aggregated and displayed under an Additional category.
Consumption over time
This section provides a historical trend line for contract-to-date forecasting, auditing growth trends, and isolating anomalous usage spikes. It charts three distinct boundaries:
- Purchased: A static baseline showing the total allocation threshold of your active contract.
- Used: The daily average of raw hourly counts collected over a 24-hour cycle, representing your environment's real-time elasticity. The Cloud Provider view breaks the Used line into individual trend paths for your top 5 cloud environments.
- Average (true billable metric): A 90-day rolling average of hourly snapshots calculated once daily. This metric is used to evaluate quota compliance and smooths out short-term operational spikes. For the first 90 days after the dashboard release, the final Average values in this chart may differ from the Cloud runtime security overview value.
Consumption details
This section provides data for troubleshooting and resource mapping.
- If an individual cloud account is deleted or modified, the historical ledger row remains intact, substituting the deleted account name with its unique Cloud Account ID.
- You can download filtered data as a standard TSV/CSV file.
- Workload-centric data- unlike standard asset inventory screens, this table displays numbers natively in workload units, not raw asset counts, aligning directly with your billing logic.
- * Advanced search & customization- features a backend-supported search bar to find accounts instantly by name or provider, and an interactive Column Picker to show or hide specific security categories (like CSPM or Agentless) active on each account.
Cloud Security Operations
Notice
Requires Cortex XSIAM Premium, or any other XSIAM license with the Cloud Runtime Security or the Cloud Posture Security add-on.
The Cloud Security Operations dashboard helps you rapidly assess your security posture and resolve issues with the largest impact. As a security architect or engineer, you can leverage the dashboard to assess the efficiency with which your team responds to security issues on an ongoing basis, without spending any extra time gathering and grouping issue details, identifying owners, and kickstarting the remediation process. Contextual views also link to other areas of the Cortex Cloud platform for a deeper security context. With the Cloud Security Operations dashboard, you can:
- Reduce noise and maximize impact: Use the dashboard’s curated views to focus on the most important issues prioritized by criticality and impact, and tasks that maximize the output of your efforts.
- Improve situational awareness and visibility: The dashboard interface helps you learn about your security estate, identify security gaps, and track progress against key performance indicators such as Issue Burn Down and Mean Time To Remediation (MTTR)
- Customize your view: The dashboard provides a default view for each of the widgets while giving you the option to customize views to capture the insights you need.
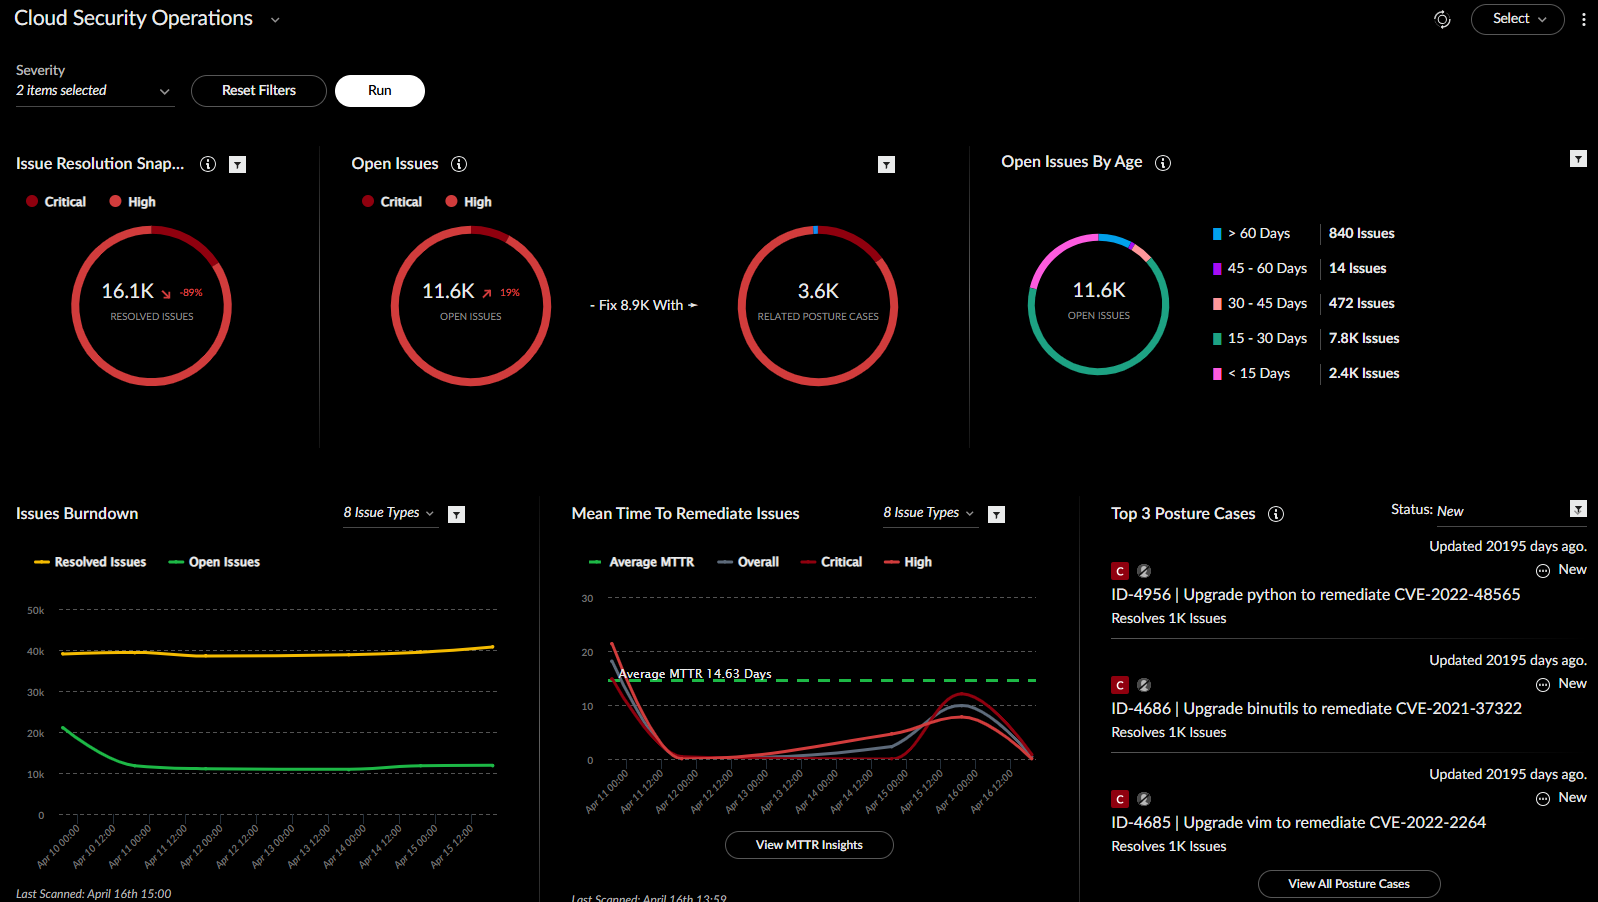
Note
Command Center data may not match the counts on the Issues page, and you may observe inconsistencies. This is because dashboard data is a snapshot of issues identified, whereas the Issues page provides the most up-to-date view of risks across your cloud assets. In addition, the Issues pages do not support all the currently available filters on the Command Center dashboard.
Dashboard Widgets
The Cloud Security Operations dashboard provides the widgets described below to help you rapidly remediate the issues that require immediate attention.
| Widget | Description |
| Posture Issues Resolved | Provides a count of the total number of Posture issues you have resolved over the selected time period across all issue categories and compares it with the number of issues resolved over the previous equivalent time period. By default, the count reflects the number of Critical and High severity issues you have resolved over the last 7 day period, while the percentage change indicates the relative change from the previous 7-day period. Issues are based on rule violations on a specified scope of resources. Select any portion of the issues highlighted to see a list view of resolved issues. |
| Open Posture Issues | Provides a cumulative snapshot count of the total number of Posture issues that remain unresolved in your environment and tracks the relative change in this count over the selected time frame. By default, the count reflects the total number of Critical and High severity issues still unresolved in your environment, while the percentage change indicates the relative change in this count over the last 7 days. Select the Related Posture Cases donut chart to see Critical and High issues grouped into remediable Posture Cases. The displayed count shows you the number of Open Issues that can be addressed by resolving the corresponding Posture Case category. Choose from one of the time-ranges specified in the filter options to narrow your search. |
| Open Posture Issues by Age | Provides a total count of unresolved Posture issues sorted by the time period since they first originated in the system. Select any time range to view a detailed list of Issues defined by how long they have remained unresolved. |
| Posture Issue Burndown | Provides a trendline of the total number of open and resolved Posture issues over time across all issue categories. By default, the trendlines track the number of open and resolved issues over the last 7 days. This daily point in time snapshot captured can be adjusted by severity level. Select the filter option to narrow issues displayed by Issue Type (Attack Paths, Configuration, Data etc.) or Time Range. |
| Mean Time to Remediation Issues (MTTR) | Provides a graphical view of the Mean Time to Remediation (MTTR) for issues across all categories, within the Posture domain, over a selected time range. By default, the chart displays the MTTR trends for Critical and High severity issues, as well as, the combined MTTR across both severities over the last 7-day period. Switch to the table view to compare the 7-day average MTTR with the average across the previous 7-day period. The severity level displayed in the list view is set by the levels selected in the global filter. This can be adjusted on the View MTTR Insights side-panel. The View MTTR Insights side-panel also lists the top ten Accounts/Issues with the highest MTTR for further analysis. Select the filter option to narrow down issues displayed by Issue Type (Attack Paths, Configuration, Data etc.) or Severity. |
| Top 3 Posture Cases | Top 3 unresolved Posture Cases based on the count of Posture issues within the cases with domain as posture. Click on any Posture Case to be redirected to a detailed view of the case. Select the filter option to narrow down issues displayed by Posture Cases status or time range. Select View All Posture Cases to see a comprehensive list of all open Posture Cases containing Crttical and High severity Issues. |
| Open Posture Issues by Type | Provides a breakdown of all open Posture issues listed by all applicable Issue Type (Attack Paths, Configuration, Data, Code, etc.) and Severity. Click on any issue to be redirected to the Issues view. Select the filter option to narrow down issues by a specific time range. You can also toggle between graph and table view here. |
| Top Impacted Assets | Displays the top five assets with the highest number of Posture issues. Additional account and asset details are also provided. Click on any asset to view more details in the Assets side panel. Assets can be filtered by type, category, and time range. Graph and table toggle is also available to customize your view |
| Top Impacted Accounts | Lists the account with the highest number of unresolved Posture issues, sorted by issue count and broken down by severity. Select a filter to narrow your search by time range or issue type. |
Note
The Last updated time indicated on each widget may differ as widget data is gathered at varying intervals.
Generate Reports
You can also share Cloud Security Operations dashboard reports with stakeholders to keep them abreast of the security status of your cloud assets. Select the Save as a report template to create a shareable template. Next, navigate to Report Templates to Edit, Delete, or Generate a Report that can be scheduled for wider distribution.
Filter Options
Use one of the multiple filter options provided to further focus on the most impactful issues. Filter options include:
- Severity Filter: Select a severity level from the drop-down to apply the filter globally across all widgets. Click Run to update all existing widgets to the selected severity level. Severity can also be adjusted individually at the widget level. Filter settings at the widget level are saved, global filters are however not saved.
- Time Range Filter: By default the time range is set to 7 days. This can be updated to 24 hours, 7 or 30 days, and a Custom time frame and applied across all widgets.
Data Ingestion
The Data Ingestion dashboard provides interactive, high-level overviews of your data ingestion health, rates, and storage consumption across different ingestion tiers. You can use this dashboard to monitor the status of your data sources and ensure that logs are being ingested as expected.
What the Data Ingestion dashboard measures
The Data Ingestion dashboard, including the Ingestion Rate widget, reports the volume of data ingested from third-party and external data sources, such as:
- Next-generation firewalls and other network devices
- Cloud providers and SaaS applications
- Syslog and other collectors
- Custom integrations and API-based ingestion
Data collected by the Cortex XDR agent is not included in these figures.
Note\
Endpoint data collected by the Cortex XDR agent is excluded from the Data Ingestion dashboard by design. If your tenant collects data exclusively through Cortex XDR agents, the Ingestion Rate widget displays 0 even though endpoint data is being ingested normally. This does not indicate data loss or an ingestion failure.
Key Features
- Unified monitoring: Displays a unified view of your ingestion health across different storage tiers, such as Analytics and Cortex Data Lake.
- Consumption tracking: Monitors daily data consumption to help you manage license quotas and plan capacity.
- Drill-down capabilities: Allows you to click on widgets to see a full breakdown of ingested data by source or investigate specific ingestion alerts.
Data Ingestion widgets
The dashboard includes several widgets to help you visualize your data pipeline:
- Ingestion Rate: Displays the rate at which logs are ingested by each data source.
- Analytics Daily Consumption: Shows the amount of data consuming your primary Analytics (GB) license quota.
- Data Lake Daily Consumption: Shows data ingested into the low-cost Cortex Data Lake tier for long-term storage and compliance.
- Daily Quota Consumption: Tracks the current data usage against your organization's daily allowance.
- Top Data Sources: A breakdown of the top contributors to your daily billable ingestion volume.
Non-billable data ingestion
To provide comprehensive security visibility without increasing ingestion costs, specific log types are moved to a non-billable status. While these logs continue to be ingested and analyzed, they do not consume your licensed daily ingestion quota and are excluded from the billable totals on this dashboard.
The following data types are non-billable:
- Enhanced Application Logs (EAL): Specialized telemetry from Palo Alto Networks firewalls. EAL data volume is excluded from your daily license consumption totals. To ensure consistency, the EAL category is removed from the NGFW Ingestion Rate graph to align with its non-billable status.
- Cortex Audit Logs (PANW/Cortex Audit): Logs documenting administrative and investigative actions within the Cortex platform. These logs are excluded from the billable daily ingestion quota calculation and are not displayed in the Data Ingestion dashboard widgets to ensure that system auditing does not impact your organization's data allowance.
Important design considerations
When using the Data Ingestion dashboard, keep the following design exclusions in mind:
- Cortex XDR agent data exclusion: By design, data collected from Cortex XDR agents is excluded from the Data Ingestion dashboard and the Ingestion Rate widget . This dashboard focuses on external data sources and integrations rather than endpoint agent telemetry. Data ingested from Cortex XDR agents is licensed under a different model, such as Analytics Enterprise.
- Data source categorization: Data sources are grouped by vendor and product to allow for granular monitoring.
- Ingestion tiers: The dashboard distinguishes between the Analytics and Data Lake tiers. Only data ingested into the Analytics tier counts toward your primary daily quota.
- Stale data: While the system can collect data offline (such as using the Broker VM), the ingestion dashboard focuses on real-time pipeline health. Large uploads of stale data from prolonged disconnections are typically handled to avoid triggering daily ingestion limit alerts.
Verifying Cortex XDR agent data ingestion
Cortex XDR agent data is always ingested into, and queryable from, the xdr_data dataset. To confirm that endpoint data is arriving, run the following XQL query:
dataset = xdr_data | filter _time > to_timestamp(to_epoch(current_time()) - 3600, "SECONDS") | comp count() as events by agent_hostname | sort desc events | limit 50
If the query returns rows, agent data is being ingested as expected, regardless of what the Ingestion Rate widget shows.
Troubleshooting: Ingestion Rate shows 0
If the Ingestion Rate widget shows 0, use this checklist to verify your environment:
- Identify your data sources: If the tenant is connected only to Cortex XDR agents and has no third-party data sources, an Ingestion Rate of 0 is expected.
- Confirm endpoint data is arriving: Query
xdr_dataas shown above. If rows are returned, ingestion is healthy. - Check third-party sources: If you have external data sources configured and the widget still shows 0, verify those integrations under Settings > Data Sources & Integrations.
Note
If you need Cortex XDR agent volume to be reflected in the ingestion dashboard, contact your account team to submit a feature request.
Monitoring and Troubleshooting
You can use the dashboard in conjunction with the Data Ingestion Health page to investigate disruptions. When a significant deviation from normal ingestion patterns is detected, the system triggers health alerts .
From the dashboard, you can:
- Identify sources with zero or unexpected ingestion rates.
- Right-click an alert or widget to Investigate in XQL.
- View related metrics in the
metrics_viewpreset to troubleshoot pipeline issues.
Investigation and response
Overview of cases
Understand how cases work in Cortex XSIAM.
Cases group related security issues, evidence, assets, and response actions.
Use them to prioritize investigations, assign ownership, and track resolution.
Cortex XSIAM - cases preserve context throughout the incident lifecycle.
Explore case concepts
- what-are-cases
- resolving-cases-with-ai
- case-lifecycle
- case-thresholds
- case-scope-and-impact
- case-and-issue-domains
- overview-of-case-teams-and-roles
Prerequisite
To work with cases, an administrator must configure your user role with specific RBAC permissions. Permissions must be enabled in the following order:
- Playbooks: This component (under Investigation & Response → Automations) must be set to Enabled first. Role-level permissions determine your ability to create new playbooks or edit those marked as Public. Specific access to individual custom playbooks and scripts is managed at the object level. For detailed information on the access model, see Access to playbooks.
- Cases and Issues: Once Playbooks are enabled, you can set Cases and Issues (under Cases & Issues) to View or View/Edit. This is also required to view the results of playbooks executed within a case.
For more information on setting RBAC permissions, see Role permissions by component.
What are cases?
A case is a defined problem created by connecting related issues into a single story. It shows the impacted assets and key data in one place, helping you focus on the threats that matter most, reduce noise, and resolve the problem efficiently using automation. Each case is unique and requires its own investigation.
Cases comprise the following objects:
- Issues: Problems detected in your environment that exceed defined thresholds or surpass your organization's accepted level of risk and threat tolerance.
- Assets: Specific entities impacted in a case and how they fit into the case story.
- Artifacts: Objects to which behavior or influence can be attributed, such as filenames, processes, domains, and IP addresses.
To see a list of all cases, go to Cases & Issues → Cases.
While cases are configured to work OOTB, users with specific requirements can customize and tailor their cases.
Case creation
A case can be created automatically from an issue or manually by a user. When new issues are detected, Cortex XSIAM checks them against existing cases. If there is no matching case, a new case is created. When an issue is linked to a case, all associated assets and artifacts are also linked. After case creation, new issues can match the case until the grouping threshold is met.
A case is automatically generated for any issue with Medium severity or higher that falls into one of these categories:
- It is assigned to the Security domain.
- It is assigned to the Posture domain and has a High severity.
- It was generated from the public API or created from correlations.
While most low-severity issues do not create cases, specific analytic rules can trigger case creation for low-severity issues when action is deemed necessary. Low-severity issues created from correlation rules are not grouped into cases.
For more information about how cases are built, see Case grouping.
Resolving cases with AI
To simplify and accelerate case resolution, Cortex XSIAM integrates advanced generative intelligence directly into the case management lifecycle. By leveraging built-in machine learning and intelligent grouping logic, Cortex XSIAM shifts the focus from resolving isolated issues to a holistic approach that resolves the case as a whole:
- Intelligent case grouping: Cortex XSIAM automatically consolidates related issues, assets and artifacts into a single unified case that reveals the full scope of an attack.
- SmartScore prioritization: Each case is assigned a SmartScore based on its severity and calculated risk. This enables teams to focus on the most critical cases first, ensuring that high-impact security threats, posture gaps, or health issues are handled with appropriate urgency.
- AI summarization: Agentic AI is integrated in the case resolution process to automatically summarize context, help you investigate entities, and suggest remediation actions.
- Guided resolution: The Resolution Center guides you to resolution with actionable tasks that are designed to remediate the entire case as a single entity, significantly accelerating the path to resolution.
Agentic AI
Cortex XSIAM leverages Agentic AI to collaborate on investigations and actively accelerate the entire resolution lifecycle.
| Feature | Description |
|---|---|
| AI-generated case summaries | Instantly analyzes the case’s full scope and impact and accelerates triage. |
| Agentic Assistant | <p>The autonomous "brain" of Cortex XSIAM. It utilizes AI agents that plan, reason, and investigate complex threats, such as cloud identity theft or container breaches. These agents have access to case context and can create plans and perform actions such as running commands, playbooks, and scripts.</p><p>The Agentic Assistant chat provides an interactive and intelligent way to simplify and streamline complex security operations. Enter a prompt using natural language, and your agent plans and executes the most relevant actions to fulfill your request.</p> |
| Resolution Center | <p>Provides actionable remediation tasks, recommendations, and progress tracking to guide you step-by-step to a complete resolution.</p><p>With playbook task tracking across all issues and in-context links to the Workplan, you can manage tasks awaiting action, monitor work in progress, and review completed items.</p> |
Case lifecycle
Cortex XSIAM handles cases through a structured process that moves from identification to resolution.
| Stage | Description |
|---|---|
| Detection | Signals or findings surface across the environment. |
| Issue generation | Raw data is converted into structured, defined as Issues. |
| Case grouping | Issues are evaluated for case qualification. If the issue qualifies it is grouped into a case with related issues, or if no match is found, a new case is generated. |
| Case analysis | Examination of context, relationships, and evidence. |
| Response | Application of remediation actions to mitigate the threat. |
| Resolution | Final confirmation that the issues in the case are fully addressed. |

Case thresholds
To keep cases manageable, Cortex XSIAM implements case grouping thresholds. When the case reaches a threshold, it stops accepting issues and groups subsequent related issues in a new case.
- 30 days have passed since case creation.
- 14 days have passed since the last issue was detected.
- A case reaches the 1,000 issue limit.
You can track the threshold status in the Issues Grouping Status field in the cases table.
Auto-resolved cases
If a case is resolved with the status Resolved - Auto Resolved, Cortex XSIAM reopens the case within a six-hour window if a matching issue occurs. The six-hour period is defined by the timestamp of the last issue that was grouped into the case. After the six-hour period, any new issues are linked to a new case for a new investigation.
Case scope and impact
The prioritization and governance of cases are determined by the case Severity, Score, and Domain. Together, these factors define the operational urgency and the investigative boundaries of a case.
- Severity: This attribute reflects the immediate risk level. Cortex XSIAM employs a logic where the overall case severity is dictated by the most critical issue linked to it. This ensures that high-impact threats are instantly visible to responders without being diluted by lower-level activity.
- Score: The case score provides a quantitative measure of risk. While severity indicates the severity of a case, the score offers a granular numerical value used for precise ranking.
- Domain: This categorizes the case context for example Security or Health. The domain determines the case’s scope, directing it to the appropriate specialized team.
By aligning these factors, Cortex XSIAM automates the transition from detection to response, ensuring the most critical risks are addressed by the right experts.
Case and issue domains
Depending on the objects identified in a case or issue, each case and issue is assigned to a domain that reflects the root cause and the system areas of operation.
Domains are a contextual boundary that allow you to manage and prioritize each use case and help you to differentiate between your security use cases and non-security use cases. Domains help you to organize and manage your work efforts, streamline the assignment of cases, and enable you to create tailored experiences for each domain.
When an issue is created, Cortex XSIAM automatically assigns it to a domain, and the same domain is assigned to the associated case. If you create your own case, you can select the domain to which you want to assign it.
Each case and issue is assigned to a single domain. You cannot change the assigned domain, however cases can be linked to issues from different domains.
Built-in domains
Cortex XSIAM provides the following built-in domains:
| Domain | Description |
|---|---|
| Security | For cases and issues that are associated with case response activities for detecting, preventing, and blocking threats as they occur in runtime. For example, the identification of malware in a file, a compromised endpoint, or a phishing attempt. These cases can be assigned to a SOC analyst who specializes in blocking and remediating attacks. |
| Posture | For cases and issues that are associated with risk management activities to detect and mitigate risks to assets in the environment before they occur in runtime, and improve resilience. For example, misconfigurations in cloud instances, over-permissive users, or the detection of secrets or shadow data. These cases can be assigned to an analyst who specializes in strengthening the security posture. The Posture domain has subcategories that define the posture issue (Configurations, Vulnerability, Identity, etc). |
| Health | For cases and issues that are associated with health monitoring activities, to ensure optimal platform performance and gain insights into health drifts. For example, disruptions in data ingestion, collector connectivity errors, correlation rule errors, and event forwarding errors. |
| Hunting | For cases and issues that are associated with identifying and mitigating potential security threats before they cause any damage. For example, monitoring network traffic, analyzing logs, and conducting vulnerability assessments. |
| IT | For cases and issues that are associated with operational activities for ensuring availability and reliability in system performance. For example, server outages, network connectivity issues, application performance problems, or IT tasks. |
Note
You can create your own custom domains to match specific scenarios in your environment. For more information, see Create a case domain.
Overview of case teams and roles
You can assign individual users and entire user groups to a case team in Cortex XSIAM. For sensitive or high-risk cases, you can restrict access to a case so that only assigned case team members can see or take action.
For more information see Assign a case team and restrict access.
Key benefits of case teams
Assigning a case team is beneficial for:
- Staging team assignment prior to final ownership: Engage multiple users and user groups early in the process, allowing team members to collaborate and evaluate the case before assigning a single final owner.
- Defining clear roles and responsibilities: Establish clear boundaries and ownership for everyone involved in the case.
- Restricting access to sensitive or high-risk cases: Assign specific team members and user groups, and restrict case access so that only the defined team can view it.
- Coordinating multi-team efforts: Smoothly coordinate tasks when multiple distinct teams are involved in an investigation.
Case team roles
You can assign the following roles within a case team. These roles serve as labels to indicate a team member's level of involvement and do not grant additional permissions or access.
For the Collaborator and Watcher roles, you can assign individual users or user groups.
| Role | Description |
|---|---|
| Assignee | The primary owner responsible for managing and resolving the case. |
| Collaborator | Team members actively assisting with specific case tasks. |
| Watcher | Users who need to monitor case updates but aren't directly assigned to tasks. |
Case access and visibility
You can control case visibility by adjusting a case’s General Access settings under Manage case team. By default, visibility is set to Case Scope.
Case Scope (Default)
- Organization-wide access: Any user in the organization with the appropriate Scope-Based Access Control (SBAC) scope can view the case.
- Permission requirements: Users still require the appropriate Role-Based Access Control (RBAC) permissions to view, edit, or execute playbooks and automations.
Team Only
Restricts case access exclusively to assigned team members.
- Access Control: Only assigned case team members can view or take action on the case.
- Assigned team: A case must have assigned collaborators or watchers before it can be set to Team Only. If a Team Only case has no assigned team members, its access automatically reverts to Case Scope.
- Management rights: Once a case is set to Team Only, only existing team members can add or remove watchers and collaborators.
- SBAC requirements: Team members gain full access to the case itself. However, access to underlying case data and related objects (such as issues and assets) remains strictly governed by their assigned SBAC role.
- RBAC requirements: Team members must still hold the necessary RBAC permissions to view, edit, or run playbooks and automations on the case.
- Admin access rights: Users with the Instance Admin and Account Admin roles cannot be scoped out of cases. They bypass both Case Scope and Team Only restrictions and will always have full access to all cases.
Case concepts
The topics in this section can help you to understand how cases work in Cortex XSIAM.
Issues, findings, and events
Understand how issues, findings, and events are related to cases in Cortex XSIAM.
Issues
Issues identify the problems that you need to solve in your environment. Cortex XSIAM creates issues when problems occur in your environment that cross defined thresholds, or surpass your organization's accepted level of risk and threat tolerance.
Each issue comprises a defined framework of:
- What happened: A description of the problem
- How is your environment impacted: Affected assets or the impact of this issue in your environment
- Contributing evidence: Data that supports our analysis and observations
- Recommended actions: Automations, playbooks, and manual suggestions
Issues are created from findings or from events that occur in your environment. When an issue is created, Cortex XSIAM assesses the content of the issue and assigns it to a new or existing case. In addition, according to the content of the issue, it is assigned to a domain that reflects the operational use case of the issue, such as Security or Health. Using case grouping logic, Cortex XSIAM then determines whether to link the issue to a case.
When you open a case, you can see all issues that are linked to the case. Review the Grouping graph to see why the issues were grouped together in the case. For more information about how issues are grouped in cases, see Case grouping.
In addition, Cortex XSIAM offers the flexibility to:
- Manually link and unlink issues from cases. Issues can also be linked to multiple cases. For more information, see Investigate issues.
- Mirror Cortex issues with external applications (for example, Atlassian Jira). For more information, see Investigate issues.
- Create issues from custom rules that you define. For example, correlation rules, malware rules, and vulnerability rules. For more information about setting up rules, see What are detection rules?.
Findings and events
Findings and events form the core of our knowledge data lake.
Findings
Findings are non-actionable, informational objects that provide context about the current state of the assets in your environment.
To gather findings, Cortex XSIAM periodically scans the assets in your environment and collects raw data about vulnerabilities, compliance, exposures, malware, secrets, and other posture-related information about the asset. This raw data is processed, saved to datasets, and recorded as findings.
Each time the assets are scanned, the findings are updated to reflect the current state of the assets. Therefore, the finding for an asset will change over time.
Each finding is categorized according to its context, for example Configuration, Vulnerability, Compliance, or Identity, and is related directly to the scanned asset. When you investigate an asset through the Asset Inventory, you can see any findings that were collected for the asset.
Findings themselves are not issues, however findings that match a specific logic can generate issues. You can also set up your own rules to trigger issues when certain types of findings are recorded. For example, you can set up Compliance rules that will create issues if specific compliance fails are identified in compliance findings.
To view findings:
- View all findings. From the the Issues page click Findings.
- See findings for a specific asset. From the Asset Inventory, select a specific asset to open the asset card. If findings are available for the asset you can click to open the finding card.
- Search the
Findingsdata set to see the findings collected over time for an asset.
Events
Events are logged activities that occur in your environment.
Cortex XSIAM collects event logs that audit the activities that occur in your environment. The logs are ingested from various sources, such as Palo Alto Networks Next-Generation Firewall (NGFW), Prisma Access, third-party sources, and EDRs. These logs provide a complete picture of the events that occur in the environment and the activities surrounding the events.
When certain malicious objects (such as malware) are discovered in the event logs, an issue is created. During case investigation, you can query your event logs to see information about the actors and processes that triggered the issue.
Case grouping
Case grouping is a Precision AI™-powered capability that eliminates alert fatigue by automatically consolidating related issues and artifacts into a single unified case. Case grouping links issues that originate from the same attack flow or involve the same entity to reveal the full scope of a case. This approach replaces manual correlation with automated context, allowing you to focus on resolving complete problems rather than triaging isolated events.
Grouping methodologies
The key grouping methodologies of case grouping in Cortex XSIAM are:
- Artifact association: Groups issues that share core artifacts (for example, SHA256, HostName, UserName).
- Exact match detection: Groups similar detections for the same entities.
- Related entities: Groups detections involving related assets within a close timeframe to highlight possible connections.
Case qualification for issues
Not all issues create cases. When a new issue is created, it is evaluated to determine if it meets the criteria for case promotion. If the issue qualifies, the system attempts to correlate it with an existing case; if no match is found, a new case is generated. Issues that do not meet these requirements are categorized as Insights.
The qualification logic varies by domain. For the Security domain, the system promotes issues with Medium severity and above, as well as select Low-severity analytics. Other domains employ more selective promotion based on specific criteria. This logic is dynamic and may be updated to reflect ongoing research and threat relevance.
Cortex XSIAM applies the following logic when building cases:
- Automatic promotion criteria: Issues with the following conditions automatically generate a new case, or join existing cases:
- Assigned to the Security domain with Medium severity or higher
- Assigned to the Posture domain and with High severity.
- Generated from the public API or created from correlations.
- Low severity handling: Most low severity issues do not initiate case creation, unless specific analytic rules deem action necessary. Low severity issues generated from correlation rules are not grouped into cases.
- Case grouping thresholds: To keep cases manageable, Cortex XSIAM enforces specific grouping thresholds. For more information see Case thresholds.
Grouping artifacts
The grouping algorithm evaluates extracted artifacts to determine whether an issue should join an existing case or initiate a new one. Each artifact type is governed by specific logic that accounts for its unique lifecycle and reliability. For example, grouping by Username may be subject to temporal constraints, while IP address logic varies based on whether the address is public, private, or dynamically allocated (DHCP).
These proprietary grouping logics are continuously tuned and updated. As a result, artifact behavior and correlation may change over time.
If you set up custom detections with correlation rules that trigger issues, you can influence the grouping of the triggered issues by mapping specific fields in your configuration. For more information, see Optimize case grouping in correlations.
Integration with SmartScore
Case grouping and SmartScore work together to improve triage efficiency. While case grouping provides the full context of an attack, SmartScore assigns a numerical value to that context, indicating the urgency and impact of the case. This allows you to prioritize the most critical cases first.
Limitations
Case grouping is natively supported within built-in domains only, for example Security.
Case scoring
A case score is a numeric value that indicates the urgency of a case. Scoring can help you to streamline the process of prioritizing and investigating your cases, and help you to identify the cases that require immediate attention.
Types of scoring
Cortex XSIAM uses the following scoring methods:
-
Rule-based scoring: The score is determined by user-defined scoring rules that match the issues linked to the case.
You create scoring rules that define scores for issues with specific attributes or assets. You can base scoring rules on:
- Hostnames
- Asset objects, such as asset names, classes, categories, groups, providers, and business application names.
- IP addresses
- Users
-
Active Directory, or Azure groups and organization units
(Requires the Cloud Identity Engine to be configured).
When an issue is created, Cortex XSIAM searches for scoring rules that match the issue. An issue can match multiple rules or sub-rules. If a match is found, Cortex XSIAM assigns the scores of the matching rules to the issue. If multiple rules match the issue, the issue score is an aggregation of the rule scores. By default, a score is applied only to the first issue in the case that matches the defined rule and sub-rule.
You can create a rule hierarchy by setting up sub-rules. If an issue matches one or more sub-rules, the sub-rule scores are also aggregated in the issue score. However, a sub-rule score is only applied to an issue if the top-level rule was a match.
To determine the case score, Cortex XSIAM calculates the combined issue score total for all issues in the case. You can see a breakdown of the score by clicking on the score in the details pane.
-
SmartScore: The score is automatically calculated, based on machine learning.
SmartScore relies on machine learning, statistical analysis, case attributes, and cross-customer insights to identify high-risk cases. When an issue is created, Cortex XSIAM calculates the SmartScore according to the compiled data.
-
Manual scoring: The score is defined by the user.
How Cortex XSIAM assigns the score
For Cortex XSIAM to provide effective rule-based scores, you must define accurate scoring rules that are suitable for your environment and workflows.
When a case is created, Cortex XSIAM searches for a match between your scoring rules and the issues linked to a case. If a match is found, a rule-based score is assigned.
Note
- SmartScore requires sufficient data to calculate and display the score. On first activation, this can take up to 48 hours. If sufficient data is not available, no score is assigned.
- If no match is found and there is sufficient data available, Cortex XSIAM assigns a SmartScore. If Cortex XSIAM doesn't have sufficient data to assign a score, you can manually assign a score.
- To enable Cortex XSIAM to automatically assign a score to a case, you must enable SmartScore and define scoring rules. For more information, see Set up case scoring.
You can view the assigned score on the Cases page.
Case starring
To help you focus on the most important cases, you can star a case. Starring enables you to narrow down the scope of cases on the Cases page. Cortex XSIAM identifies starred cases with a purple star.
You can star cases manually, or create a starring configuration. A starring configuration automatically categorizes and stars cases that contain issues with specific attributes. For example, you can define a starring configuration that stars all issues containing specific assets, hosts, or business application names. If an issue matches the attributes in the starring configuration, the issue and case linked to the issue are starred.
You can manage all starring configurations under Case & Issues → Case Configuration → Starred Issues. For more information see Create a starring configuration.
SLAs and tracking
Notice
This feature requires a Cortex XSIAM Premium, Cortex XSIAM Enterprise, or Cortex XSIAM NG SIEM license.
In Cortex XSIAM, Service Level Agreements (SLAs) are tracked using a combination of Timer fields and SLA fields. This system allows you to quantify performance and ensure that critical security cases are addressed within defined timeframes.
SLA configuration components
- Timers: These fields count forward to measure the actual duration of an action. For example, a Time to Assignment timer starts when a case is created and stops when an owner is assigned.
- SLA fields: These fields count backward from a predefined goal. They visualize the time remaining until a deadline is breached, changing color, for example to red, if the goal is exceeded.
- Severity-based goals: You can define different SLA targets based on case severity. This ensures that Critical cases receive a faster response than Medium or Low severity cases.
For more information about configuring SLAs and timer fields, see Create additional case timers and SLAs.
What is Causality?
In Cortex XSIAM, Causality is the idea of telling a story in a simple and coherent manner and in a proper context. With the purpose of leading security teams to actionable outcomes.
Palo Alto Networks products, such as Next-Generation Firewall (NGFW) or the Cortex XDR Agent, can be configured to send rich and detailed data about all activities to the Strata Logging Service, not only items related to attacks. This means that millions of data points are collected about every entity every single day. Analyzing so much data as log lines is practically impossible, so Cortex XSIAM takes these data points and continuously stitches them automatically to ‘Causality Chains’. This automates the dot-connection process that an investigator would otherwise have to do manually during an investigation. This process happens constantly for all collected data points, such as processes, files, network connections, and more, regardless of prevention, detection, or alerts of any kind. With causality, when analysts decide to investigate alerts or go on a hunt, they don't need to manually connect the dots getting distracted with millions of irrelevant data points, and instead they can focus only on data related to the investigation.
Even the most complicated investigations take just a few moments for a novice analyst, during which causality reveals answers to critical questions, such as:
- What was the root cause?
- What might be the damage?
- What’s the scope? Are there any related issues?
- Who’s involved?
- Which steps are required to contain, mitigate and recover?
- Are similar threats prevalent in the environment?
- What can be done to reduce the risk of the same thing happening again?
To achieve this, Palo Alto Networks invested and patented the causality engine and the ways it works.
How it works
Causality chains are built using a deep understanding of each operating system (OS) and the way it works, which processes fulfil the various functions and more. Causality chains in Windows, macOS, and Linux work with the same guidelines, with different processes and methods used to decide how to build chains.
There are some processes in the OS that have very specific roles to fill. For example, services.exe and explorer.exe are used mainly to spawn other processes. This means that causality chains don’t show these processes by default and start from their child processes as these are only OS processes doing their job; yet, you can manually add them by right clicking on the Causality Group Owner (CGO) and adding the parent process.
Cortex XSIAM tracks Remote Procedure Call (RPC) requests between processes and it doesn't break the casualty chain into sub chains, so the analyst still sees the full chain of execution, including actions done via RPC. Same goes for code injection, as Cortex XSIAM tracks the new threads that are started as a result of such actions and can tie anything that happens as a result to the original injecting processes and its causality chain.
Spawners
Processes that are used to spawn other sub processes are called spawners. Those processes are known to start other processes as part of the normal flow of the operating system (OS). Examples of such processes are explorer.exe, services.exe, wininit.exe, userinitt.exe, and more. When spawner processes are started by a non-spawner process, they are not considered spawners. In Cortex XSIAM, we don’t distinguish between a Causality Group Owner (CGO) and spawner, calling both CGO.
Example 149.
userinit.exestartsexplorer.exe:explorer.exeis considered a spawner, as this is what we expect to see in the OS.cmd.exestartsexplorer.exe:explorer.exeis NOT considered as a spawner as it’s not the role ofcmd.exeto startexplorer.exe.
The child processes of a spawner are considered as CGOs and they start off the causality chain.
Causality Chain
When a malicious file, behavior, or technique is detected, Cortex XSIAM correlates available data across your detection sensors to display the sequence of activity that led to the alert. This sequence of events is called the causality chain. The causality chain is built from processes, events, insights, and alerts associated with the activity. During the alert investigation, you should review the entire causality chain to fully understand why the alert occurred.
Causality Analysis Engine
The Causality Analysis Engine correlates activity from all detection sensors to establish causality chains that identify the root cause of every alert. The Causality Analysis Engine also identifies a complete forensic timeline of events that helps you to determine the scope and damage of an attack and provide an immediate response. The Causality Analysis Engine determines the most relevant artifacts in each alert and aggregates all alerts related to an event into an incident.
Causality Group Owner (CGO)
The Causality Group Owner (CGO) is the process in the causality chain that the Causality Analysis Engine identified as being responsible for or causing the activities that led to the alert. A CGO is always the child of a spawner, so it’s the first process in the operating system (OS) chain of execution that is not loaded by default as part of what’s expected in a normal OS flow. All sub-processes started by the CGO are linked to it, and help analysts quickly identify the root cause of why something happened.
Note
There are no CGOs in the Cloud Causality View, when investigating cloud Cortex XSIAM alerts and Cloud Audit Logs, or SaaS Causality View, when investigating SaaS-related alerts for 501 audit events, such as Office 365 audit logs and normalized logs.
CID
Each causality chain gets a unique ID called a CID. All actions on this chain, such as process execution, registry changes, and network connections, receive the same ID. This means that whenever the user queries about a given action, for example who connected to a malicious IP, the response not only includes the process who performed it or the user, it includes all actions related to the same CID. This shows the entire chain of execution alongside all other actions performed with the connection to the malicious IP.
This concept is important because any alert that is triggered about any action is also mapped to the same CID, meaning that one chain of execution displays all processes and alerts associated with the relevant CID. Alerts on the same CID is also one of the methods Cortex XSIAM uses to group alerts into an incident.
Analyze and resolve cases
The following sections explain how to review, analyze, and resolve cases in Cortex XSIAM. You can start reviewing the cases in your environment on the Cases page.
Review all cases
The main Cases page is the starting point for monitoring and managing all cases in your Cortex XSIAM environment. It provides visibility into all cases and their current status, helping you track progress, investigate individual cases, and take remediation actions. Severity indicators, scores, and starred icons help you quickly identify your high-priority cases.
When cases are configured with SLAs, the page helps you monitor SLA adherence and ensure cases progress in line with organizational objectives.
You can access the Cases page from Cases & Issues → Cases. By default, all open cases are displayed.
Viewing modes
You can control how data is displayed and how the page behaves by choosing both a display mode and a viewing format.
- Display modes (layout): You can choose how to visualize and interact with data on the page. Click the Display menu to switch between modes. Any changes that you make to the case fields persist between modes.
-
Split view (default)
Displays cases in a split-pane layout that highlights key details and enables you to quickly compare cases, prioritize urgent items, and assess severity and impact at a glance.
-
Table view
Displays cases in a table layout with widgets that summarize the table data. Widgets are customizable, allowing you to tailor the table for structured analysis and review.
-
- Viewing formats (behavior): You can choose how the page functions. To change format from the Actions menu select Switch to xx view.
-
Default mode
Use the latest experience with full support for new features and functionality.
-
Legacy mode
Use the previous experience for backward compatibility. This mode does not support all newly released functionality. The documentation in this guide describes the product in default mode. If you are using legacy mode, see Detailed View.
Note
Administrators can enable or disable legacy mode. Go to Configurations → General → Server Settings → Case display modes.
-
Saved table views
Saved table views are saved filter configurations of table data that help you to focus on the data that most matters to you. You can filter your table data by domain, context, work queue, or other criteria, and save configurations that support your workflow.
The default view on the Cases page is All Cases. Click on the arrow next to All Cases to see all available saved views. If you change the table filters, you will see a Modified label next to the view name. You can create a new saved views. Once you have change the table filters, click the three dots next to the view name to save the new configuration, update an existing saved view, or revert to the original configuration.
MSSP and multi-tenant administrators
For MSSP and multi-tenant administrators, if the Unified Case View is enabled, this view consolidates all cases across your distributed environment, allowing you to view and perform actions on child tenants. If the Unified Case view is disabled, this view displays a single tenant at a time with a drop-down list for moving between tenants in read-only mode.
You can enable this setting from Settings → Configurations → General → Server Settings → Unified Case View.
For more information see Unified case view.
Start case analysis
Note
This section describes the product in default mode and using the Split view. If you are using legacy mode, see Detailed View.
To start analyzing a case, open the case from the main Cases page. In the Split view, click a case to open it in the side panel. To open a case in a full page layout, right-click a case in the list and select View case in new tab.
The case card opens a dedicated workspace where you can fully understand, investigate, and resolve the case from start to finish.
The case card brings together case context, correlated issues, affected assets, and remediation actions in one place. It helps you quickly understand the case context, see how events are connected, and take action with confidence. Click through the view to dive into investigation data, resolution tasks, and AI assistance without switching pages or losing context, keeping your focus on resolution.
Case analysis and resolution process
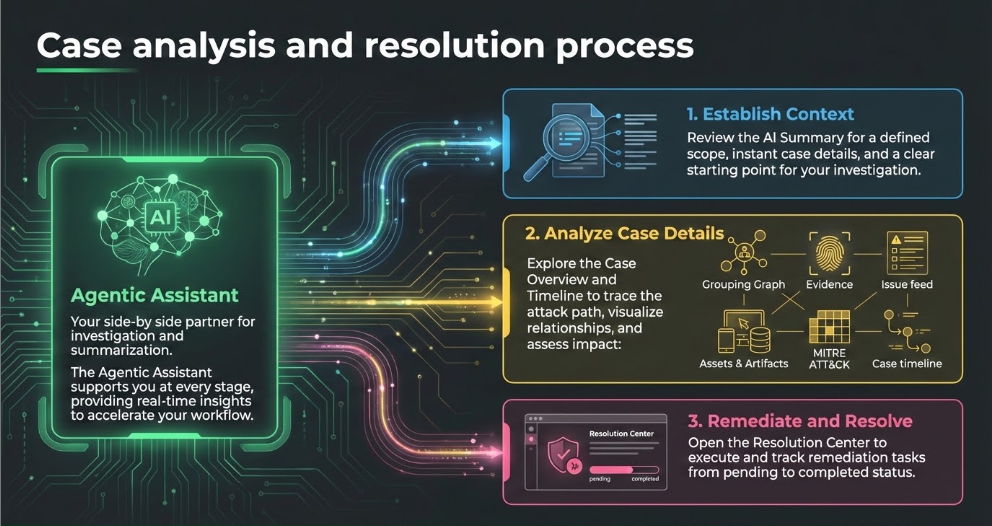
Core components
The following table describes the core components of case analysis and resolution:
| Component | Description | Link to detailed information |
|---|---|---|
| Agentic Assistant | Provides side-by-side support by recognizing case context, delivering advanced summarization, and helping you pivot to additional investigative views. | Agentic Assistant- Case Investigation agent |
| AI-generated case title and description | Helps you quickly understand the scope and nature of the case by summarizing key case details. | AI-generated case summaries |
| Case overview | <p>Breaks down case components to help you understand how the case was built:</p><ul><li>Grouping graph: Illustrates issue relationships</li><li>Evidence: Details casualties and events</li><li>Issue feed: Narrates the case story</li><li>Associated assets, artifacts, and MITRE ATT&CK tactics: Provides additional context and links to detailed views and actions</li></ul> | Analyze case details |
| Case timeline | Provides a chronological record of security events and analyst actions to streamline investigations and evidence management. | Case timeline |
| Detailed view | Provides detailed information about the investigation in a tabular format, for example Timeline and War Room. | Detailed View |
| Resolution Center | Guides you towards resolution by presenting actionable remediation steps and enables you to track all related playbook tasks without opening individual playbooks. | Resolution Center |
Agentic Assistant- Case Investigation agent
The Agentic Assistant is a context-aware, generative intelligence tool embedded directly within the case card. It is designed to act as a side-by-side partner for security analysts, eliminating the need to pivot away from the investigation to consolidate complex data.
When you open the Agentic Assistant you can select the agent that is best suited for each task. The dedicated Case Investigation agent can help you with your case investigation. It specializes in advanced summarization, and recognizes the context of the case, ensuring every insight provided is highly relevant and grounded in the specific issues, assets, and telemetry of the current investigation.
For more information about using other agents in the Agentic Assistant, see Get started with Agentic Assistant chat.
Core functionalities of the Case Investigation agent
To streamline case analysis, the assistant provides the following areas of support:
- Dynamic summarization of log data and issues into clear, actionable narratives, including:
- Executive overviews: High-level summaries that focus on impact and risk.
- Extended technical overviews: Deep-dive summaries that outline the technical progression of the threat.
- Focused contextual inquiries to extract specific details without manual filtering. You can ask targeted questions regarding:
- Issue deep-dives: Understanding the specific triggers and severity of an issue.
- Asset relationships: Identifying which users or devices are at the center of the activity.
- Asset and artifact investigation: Understanding the impact and risk of the assets and artifacts in the investigation.
- Intelligent pivoting and clarification to help you navigate through complex investigations:
- Entity-specific prompts: By clicking Ask AI next to a specific entity (such as an IP address or file hash), the assistant launches with a pre-configured prompt tailored to that specific object.
- Investigation guidance: It suggests potential next steps and actions, and links to detailed views
Establish case context
Before you start analyzing the case, review the case title and description to establish case context. You can also review the case score, the assignee, and decide whether to star the case.
AI-generated case summaries
To gain immediate situational awareness, Cortex XSIAM automatically builds a narrative of the case using AI-generated titles and descriptions. This summarized context allows you to quickly grasp the scope of a case and provides a clear starting point for your investigation.
Leveraging LLM-based summarization, the system analyzes complex data to produce a human-readable overview of:
- The nature of the threat or activity
- The key issues and artifacts involved
- The affected assets or identities
View the AI-generated case summary
When you open a case, the case title and summary is automatically generated. As an investigation evolves, the case context is updated. Each time new data or issues are added, the system regenerates the title and description to ensure your situational awareness reflects the most current information available.
Note
The AI-generated title and description is a calculated value that is regenerated each time you open a case.
This value is not a saved static description, therefore it is not reflected in the saved case names in the list of cases in the Split view , or in the Case Name and Case Description columns in the Table view.
System-generated case titles and descriptions
In addition to the AI-generated case titles and summaries, Cortex XSIAM automatically generates static case titles and descriptions that are stored in the cases dataset. These are generated at the time of case creation based on correlated issues, behaviors, and contextual data.
These static descriptions are used when AI-generated case summaries are unavailable or disabled. In addition, they are reflected in the case title in the List of cases in the Split view, and the Case Name and Case Description columns in the Table view.
You can manually update these values. From the Actions  menu select Edit case details.
Single issue cases
For cases that contain a single issue, the case title and description directly reflect the issue’s title and description. In addition, AI-generated case summaries are not available. If more issues are linked to the case, Cortex XSIAM generates a case title and description to reflect the issues in the case, and an AI case title and summary is available.
Limitations
- Supported regions: AI-generated case titles and summaries are available only in supported regions. For more information, see Cortex Agentic Assistant.
- Supported domains: AI-generated case titles and summaries are only supported for cases assigned to the Security and Posture domains.
- Single-issue cases: For cases that contain a single issue, AI-generated case summaries are not available. Instead, the case title and description directly reflect the issue’s title and description. If more issues are linked to the case, an AI case title and summary are generated.
Enable AI summarization
To enable AI case summarization on your tenant, go to Configurations → General → Server Settings → AI Configuration and enable the following settings:
- Agents & LLM Experience
- AI Case Summarization
You can also turn AI summarization on or off for a specific case. Take the following steps:
- Open the case and click the Actions menu.
- Select Edit case details.
- Switch the Summarize with AI toggle.
Assess case severity and score
You can review the severity and score assigned to the case, and update them if necessary.
Review case severity
In Cortex XSIAM the severity value indicates the urgency of a case. Possible values are Critical, High, Medium, and Low. Click on the assigned severity to change the value.
Review the case score
The assigned case score is displayed in the cases header. This score indicates the urgency and impact of the case.
Click on the case score to see the assigned scoring method. For more information about scoring types and how Cortex XSIAM assigns a score, see Case scoring.
See a breakdown of the score
You can see details about the scoring method and the assigned score.
- On the Cases page, click on the menu icon to switch to the detailed view.
- Click on an assigned score.
If you are not satisfied with the score, you can change the scoring method or overwrite the score by setting the score manually. If you see a discrepancy with the assigned score, consider the following:
- For rule-based scores, revise your scoring rules.
- For SmartScores, help to improve the accuracy of SmartScore. Give feedback by hovering over the displayed score.
Change the scoring method or set the score manually
You can change the default scoring method. In addition, if Cortex XSIAM was unable to assign a score, you can set the score manually.
-
Click on the assigned score.
If no score was assigned, in the case investigation pane, click the more options icon and select Manage Score.
-
Select a different scoring method, or click Set score manually and define a new score.
Update case attributes
When you start reviewing a case, you can update the case title and description, assign the case, and star a case.
Assign a case
You can assign or reassign a case by clicking on the assigned field.
If the case contains unassigned issues, or the issues are not assigned to the case assignee, a dialog opens with options for assigning the issues.
In addition, you can assign case team members as Collaborators or Watchers. For more information,see Overview of case teams and roles.
Update the case title and description
A case title and description is automatically generated for each case. In addition, AI-generated case summaries are automatically generated when you open a case to provide case context.
You can manually update the saved case description, as required.
- Select a case and open the Actions menu.
- Select Edit case details.
-
Update the values in the Case title and Case description fields.
Note
The defined values are shown in the Case Name and Case Description columns in the Table view, and saved to the
casesdataset. The case title is also shown the list of cases in the Split view.These values do not replace the AI-generated case title and summary. If the Summarize with AI toggle is enabled, AI-generated case summaries are automatically generated when you open a case. For more information about how Cortex XSIAM generates case titles and descriptions, see AI-generated case summaries.
- Save your changes.
Star or un-star a case
You can manually star or un-star a case:
- Go to Cases & Issues → Cases and select the case that you want to star.
- Depending on the selected view, take the following action:
- In the Split view, open the Actions menu and select Edit case details. Switch the toggle to star or un-star the case.
- In the Table view, select one or more cases and right-click. Select whether to star or un-star the cases.
Analyze case details
Once you have established the initial context of a case, you can use the case Overview and Timeline to deconstruct the case and understand how its underlying components are connected, and review the full scope of activity.
-
Overview
- Grouping Graph: View a visual mapping of how issues and artifacts are linked together, including details on shared artifacts, to better understand the underlying grouping logic.
- Evidence: Trace issue causality chains and recorded events to follow the attack sequence from the initial root cause to the final recorded activity.
- Issue feed Review the case’s story in a chronological visualization that maps the case lifecycle and highlights key case information, with the option to group by attribute.
- Associated assets and artifacts: Drill down into the specific identities, endpoints, and digital artifacts associated with the case to assess the threat's footprint.
- MITRE ATT&CK tactics and techniques: Review the specific tactics and techniques identified in issues linked to the case to align your investigation with industry-standard adversary behaviors.
Note
If you prefer a tabular or legacy layout, switch the case card to the Detailed view.
This view preserves the legacy tab based format and custom layouts, ensuring full backward compatibility. You can switch between the new case experience and the legacy view based on personal workflow preferences. For more information, see Detailed View.
-
Timeline
View the full lifecycle of a case. You can also add your own records and mark key observations as evidence to be used in formal reporting.
Grouping graph
The Cortex XSIAM Grouping Graph is a visual representation of the logic used to group issues in a case. It provides transparency into why specific issues are linked, illustrating the relationships between data points and the underlying decision-making process of the analysis engine.
By revealing these connections, the graph offers key insights into the case narrative, visualizes the overall scope, and identifies common artifacts for investigation.
Understanding case grouping
Issues and artifacts are automatically matched into a unified case based on a specific grouping logic. This allows you to resolve the entire scope of a case rather than treating detections in isolation. The logic is driven by the following factors:
- Artifact association: Issues sharing core artifacts, for example the same file hash or IP.
- Similarity clustering: Issues with similar detection patterns on the same entities.
- Related entities: Detections on related assets occurring within a close timeframe or context.
- Linked and merged issues: Issues that were manually linked to the case and merged issues.
Related issues are added to the case until a specific grouping threshold is met. In the Grouping Graph you can see whether case grouping is active or inactive. For more information about case grouping and case thresholds, see Case grouping.
Core components of the Grouping Graph
The graph uses a structured hierarchy of edges and nodes to represent the primary elements of a case:
| Component | Description |
|---|---|
| Edges | Represent the relationship between graph entities to show why they were linked. Edges display as lines that link nodes and entities together. Each full line represents a direct relationship. The system defines three edge types:
Edges display as:
|
| Case node | The central anchor node to which all other elements are connected. |
| Issue nodes | Visualized with parent/child relationships to show how primary threats spawned secondary activities. |
| Clusters | Groups of issues that are automatically clustered to keep the visual workspace organized, with details of the total issue count in the cluster and severity breakdown. Issues are clustered if they:
|
| Artifacts | Represent artifacts that are linked to the issues in the case. Artifacts include user names, IPs, and causality chains. Causality chains link issues in the same causality chain to the case. |
Explore the graph
You can interact with the graph to uncover deeper layers of data without leaving the case view:
- Expand and break down: Click elements within the graph to expand clusters and view additional node details, such as severity, domains, and current status. You can also click the expand icon to view the grouping graph in a full page view.
- Review issues and artifacts: Hover over any entity in the graph to open a quick-view panel containing high-level details such as severity, domain, and current status. Hover over a cluster to see a breakdown of the severities contained within it.
- Deep dive into issues: Click an issue node and select Open Issue to view a detailed issue card with granular details about the issue.
Example of the grouping graph
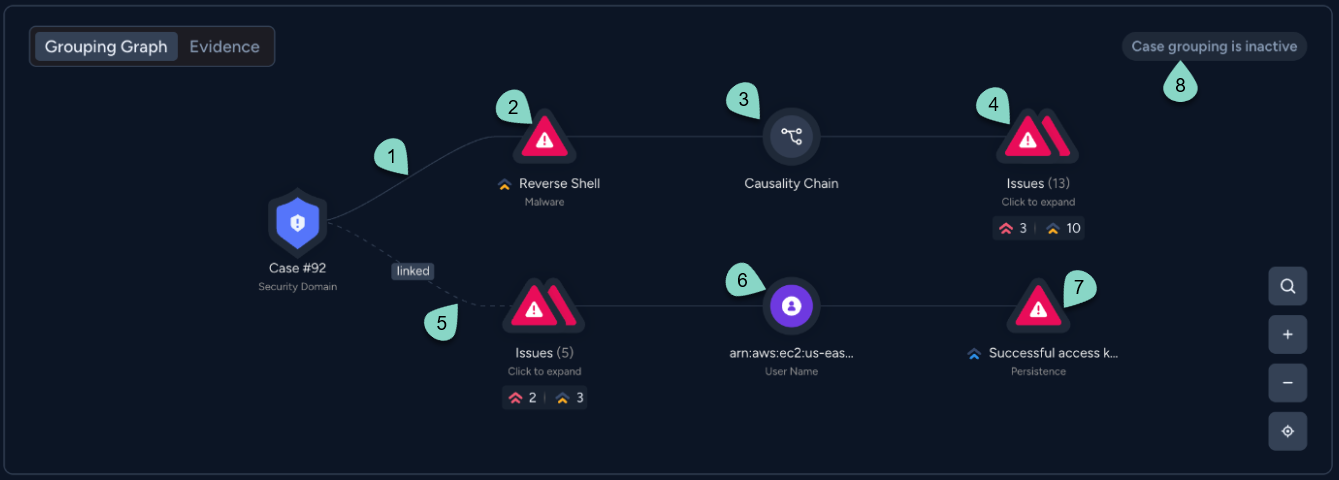
The following table breaks down the components in this example:
| Label | Explanation |
|---|---|
| 1 | Solid edge linking the case node to the issue that initiated case creation. |
| 2 | The issue that initiated case creation. |
| 3 | Casualty chain related to the initial issue. |
| 4 | Cluster of issues. These issues are part of the same causality chain as the initial issue. You can see that there are 13 issues in the cluster, and their severity breakdown. |
| 5 | Broken edge linking to a cluster of issues that were manually linked to the case. This is indicated by the linked label. |
| 6 | User name related to one or more issues in the linked issues cluster. |
| 7 | Issue related to the user name. |
| 8 | Case grouping is inactive label. This indicates that the case is no longer accepting new matching issues, which happens when a case grouping threshold is met. For more information, see Case thresholds. |
Evidence
Evidence consists of data generated by different sources to provide the how and why behind an issue. It provides the technical context necessary for effective action and remediation in Cortex XSIAM.
By mapping these dependencies, you can pinpoint exactly how a threat entered your environment and identify the specific actions taken at each stage of the attack. This insight helps you move beyond seeing what happened to understanding the attacker's path, enabling you to implement more effective containment and remediation strategies.
You can view evidence in the Evidence section of the case Overview, which provides a centralized, schema-based view of technical data and manual notes. You can also see issue specific evidence in the issue card.
Note
In multi-tenant environments, you can view child tenant evidence directly from a parent tenant for streamlined cross-tenant investigations.
Types of evidence
The type of evidence displayed depends on the problem found and will differ between domain, asset types, scanners, and other parameters. The following is a list of the most common types of evidence:
- Causality chains: Sequences tracing events from root cause to final activity to identify attacker paths and actions.
Tip
You can use the causality chain to identify unapproved AI activity, data risks, or malicious AI deployments. For more information, see Causality view.
- Evidence events: Individual security events that triggered or contributed to the issue.
- Standard evidence: Engine-generated JSON payloads containing technical details and specific findings (e.g., process command lines, file hashes, or digital signatures). Within certain configuration issues, evidence highlights misconfigurations and often provides the expected configuration values to help you to remediate the issue.
- Timeline-based evidence: You can mark any timeline record as evidence to centralize findings in the Evidence tab. This includes the following record types:
- System-generated records: Specific events or signals captured automatically by the security engine.
- Manually created notes: Your added observations, query results, and uploaded files—such as screenshots, logs, or reports—supporting various formats including images (PNG, JPG, GIF) and text-based files (TXT, CSV, JSON).
- Graph evidence: Displays an interactive visual map of the connected assets, attributes, and path that triggered the issue.
Evidence lifecycle
The evidence lifecycle ensures that technical proof remains accurate and available from the moment an issue is identified until it is resolved and archived:
- Registration and refresh: Evidence is registered at issue creation and refreshed at the same frequency as the issue to prevent data discrepancies.
- Resolution and retention: Resolved issues retain a final snapshot of the evidence for auditing and data completeness. Evidence is a snapshot in time reflecting the state at the last update.
- Update behavior: If a problem is fixed, the last snapshot is preserved; otherwise, evidence continues to update.
Using evidence in workflows and automation
Evidence is available for use in automated response and API-based retrieval.
Playbooks and quick actions
Use playbooks and quick actions to support your investigation:
- Extract data for logic: Pull technical details directly into automated enrichment, containment, and decision-making workflows.
- Pass payloads to commands: Use evidence data as input parameters for system commands to include technical proof in logs or external security tools.
- Filter by evidence type: Request specific evidence categories to reduce processing overhead for targeted automation tasks.
Exporting and programmatic retrieval
You can export and retrieve evidence to support external analysis and compliance using the following methods:
- Direct download: Manual attachments and files can be downloaded directly for offline use or specialized analysis.
- Table export: Evidence and events can be exported via TSV or CSV formats from the console tables.
Evidence export use cases
Exporting evidence can support your investigation process:
- Confirm detections: Use technical proof to resolve false-positive disputes and verify findings without manual endpoint logins (CWP).
- Provide audit trails: Maintain a permanent, immutable record of the technical data and forensic context required for internal and external auditing.
- Support external analysis: Export data to forensic tools to investigate events from multiple angles and generate post-incident reports.
- Centralize response: Aggregate evidence across engines for a holistic, case-level view of security investigations.
Causality chain evidence
Issues include causality chains if they originate from endpoint data that allows tracking the specific processes. Causality chains are listed according to the Causality Group Owner (CGO), expand the CGO card you want to investigate. Each CGO card displays the CGO name, the following CGO event details, and the causality chain:
- CGO name
- Issue sources associated with the entire causality chain
- Execution time of the causality chain
- Number of issues that include the CGO according to severity.
Expand the causality chain to further investigate in the full Causality view. For more information, see Causality view.
Graph evidence
Graph evidence provides a visual representation of interconnected assets, relationships, and findings that trigger a rule condition. Evaluated against the graph-based engine, it shows the exact path, assets, and attributes involved in an issue.
Attack path vs. graph issues
You can view connected asset paths on the interactive graph canvas for both issue types, but they differ based on who created the rule and how the issue is categorized:
- Attack path issues: Triggered by Out-of-the-Box (OOTB) Rules. They detail specific exploit trajectories, from entry points to sensitive targets.
- Graph issues: Triggered by Graph Rules. They visualize cross-domain posture findings, asset dependencies, and custom graph queries. For more information, see Create detection rules based on graph search.
Locating & Reviewing Graph Evidence
You can find Graph Engine issues in the Issues table using these filters:
- Issue Domain: Posture
- Detection Method: Graph Engine
- Issue Category: Attack Path (OOTB rules) or Cross Domain Detection (Custom rules)
Inspect evidence in the case's Evidence tab or on the Issue card:
- Interactive graph canvas: Select nodes to inspect asset details, metadata, and connected relationships.
- Compliance Controls: Details specific configuration failures along the path (displayed only if compliance controls were defined on the rule). Fixing these violations breaks the path and resolves the issue.
- Archived assets: If an asset is deleted from the tenant, basic details (Name and Type) remain visible for historical context, but side card drill-downs are disabled.
Graph issue lifecycle
An issue generated by the graph engine is automatically resolved if the corresponding graph route is no longer detected during the next scan cycle or if all assets within the evidence path are deleted. If a previously closed issue path is detected again in a subsequent scan, it is automatically reopened using path hash matching rather than generating a duplicate alert.
Example
The following example shows an attack path issue.
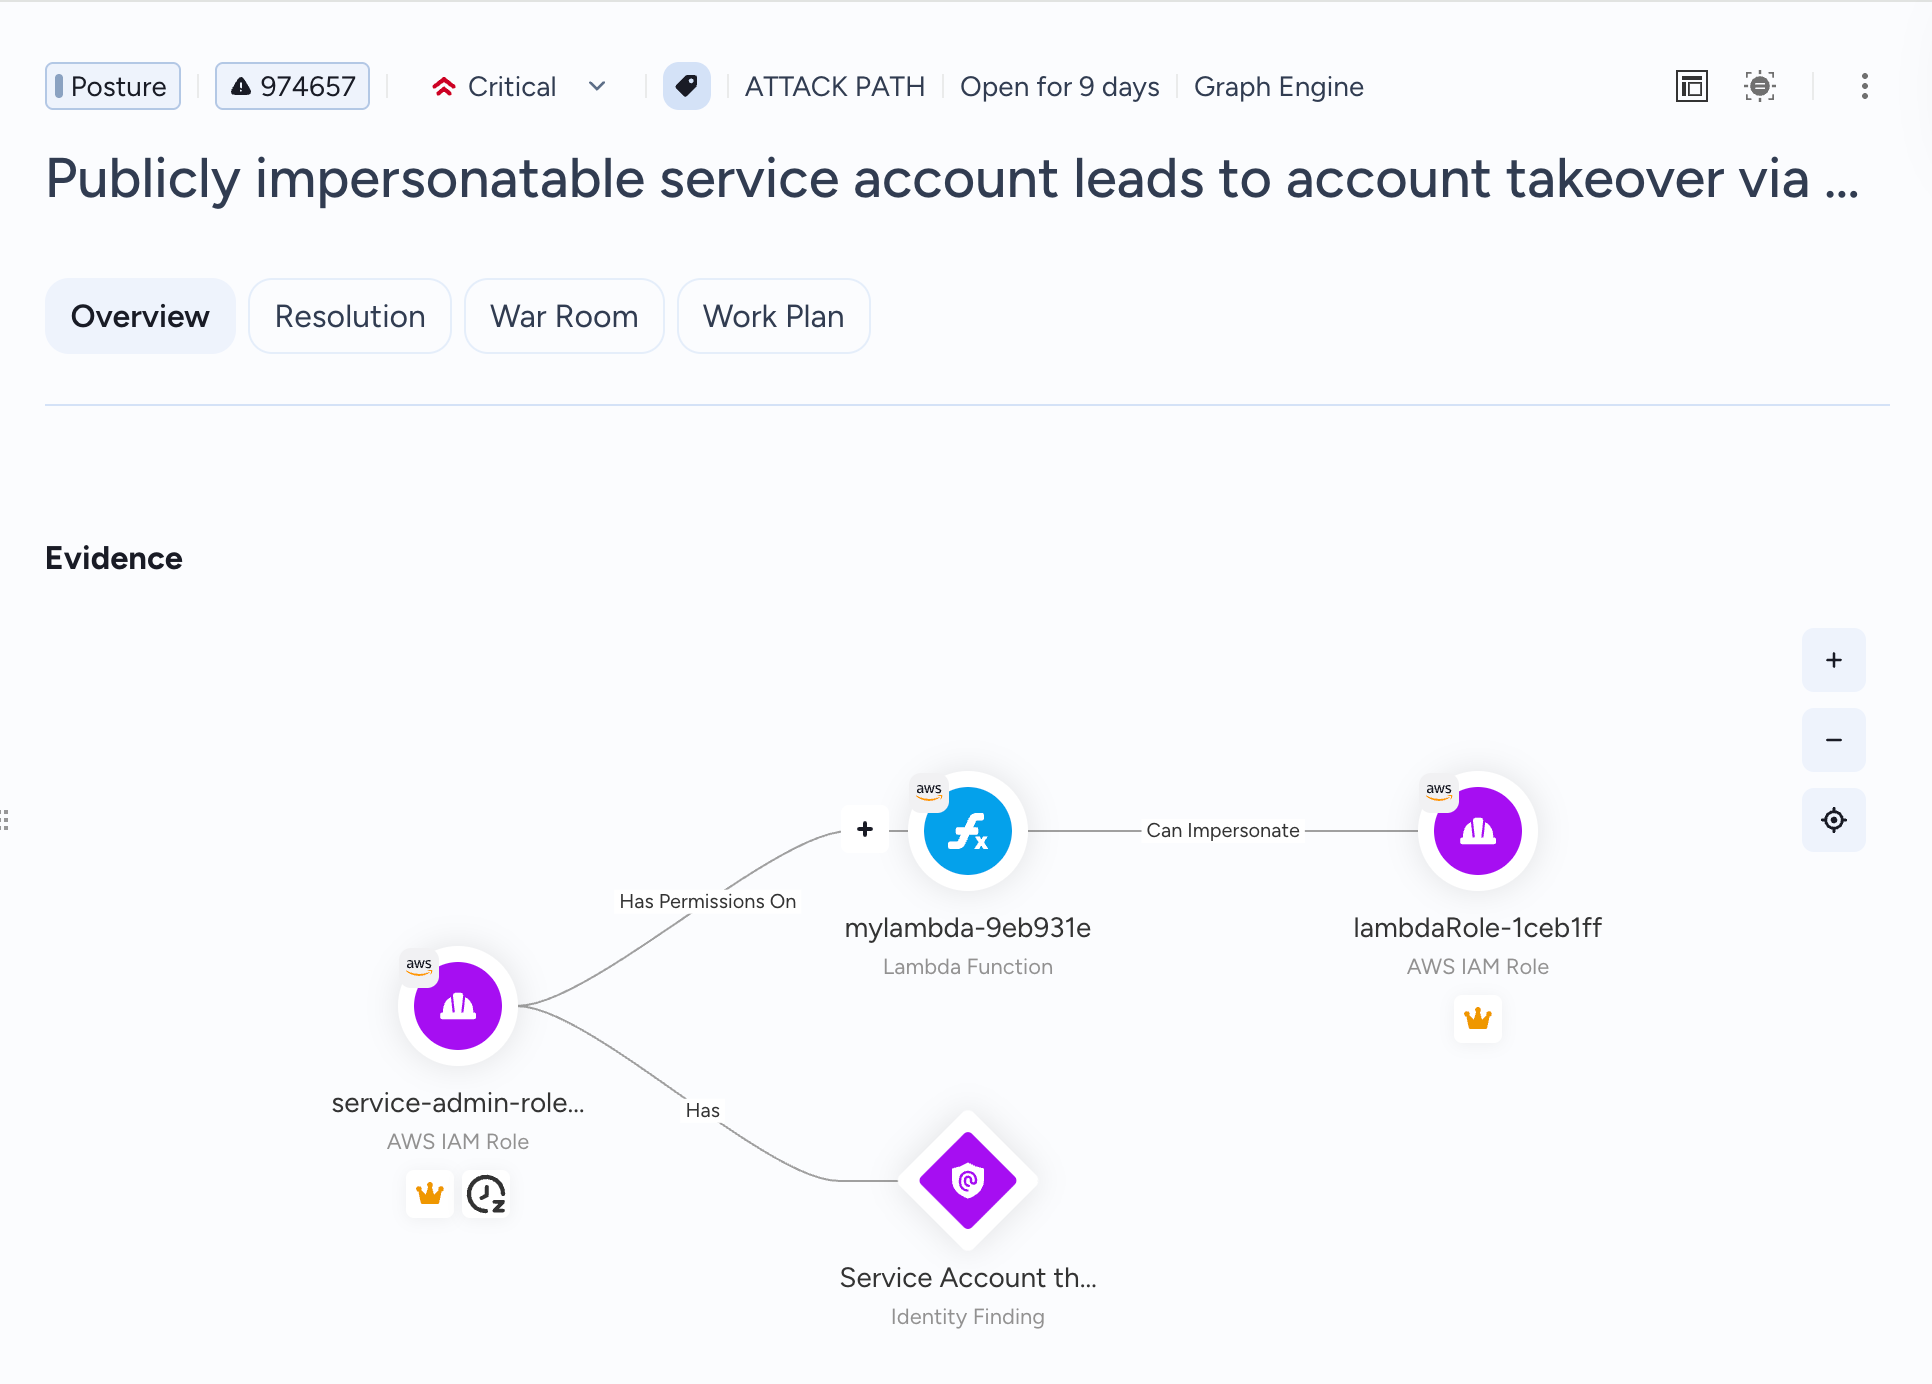
n
Issue feed
In Cortex XSIAM, the issue feed provides a chronological visualization of the case lifecycle, highlighting key case information from initial detection to the most recent activity. Key features include:
- Issue count: See the total number of issues linked to the case.
- High level details: Review issue details in the timeline, or click an issue to open the full issue card. When an issue is resolved, the issue status and title is dimmed.
- Contextual insights: View integrated insights directly within the timeline (when available), providing extra layers of intelligence on why specific events were flagged.
- Unified progression: Gain immediate clarity on the speed of an attack, helping you distinguish between rapid automated threats and slow-moving lateral movement.
- Group issues by attribute: Sort the issues in the timeline with the Group By option that allows you cluster issues and insights by selected criteria, such as category, severity, detection method, or detection rule.
- Browse issues in the feed: Open an issue and use the arrows in the top left corner to browse through the issue cards.
Associated assets and artifacts
The Associated assets and artifacts section displays the technical entities involved in the case, such as endpoints, hosts, IP addresses, and files. Assets and artifacts are organized by class, such as User, Hash, or IP. Malicious artifacts as identified by WildFire are highlighted red.
Hover over an asset or artifact to see key details about the entity. Click on an asset to see full details in the asset card.
To investigate further, click Ask AI next to an asset or artifact to open the Agentic Assistant with an automatically generated prompt tailored to the selected entity. You can also use the Actions menu next to an asset or artifact to drill down to dedicated views or take direct actions on the asset or artifact.
Note
If you do not have permissions to access an asset of a case (which is shown as grayed out and locked), check your scoping permissions in Manage Users or Manage User Groups.
For more information about dedicated asset and artifact views in Cortex XSIAM, see Investigate artifacts and assets.
MITRE ATT&CK tactics and techniques
The MITRE ATT&CK card maps observed behaviors to relevant tactics and techniques associated with the issues linked to the case. For increased visibility, click Insights to include tactics and techniques from low severity insights.
To see a full breakdown by MITRE ATT&CK tactic and technique, including the number of issues in which a tactic was identified, open the full view.
Note
This component is available for cases associated with the Security domain or custom domains.
Compliance standards and controls
License note
Requires Cortex XSIAM Premium or the Cortex Cloud Posture Management or Cortex Cloud Runtime Security add-on.
For Posture cases, you can quickly evaluate regulatory impact and policy compliance by reviewing the compliance standards and violated controls associated with the case.
Tip
While violated compliance controls can also be viewed within individual Issues and Findings cards, reviewing them in the Cases card provides a consolidated view of compliance impact across the entire incident story.
View compliance details in a case
- Open the Cases card and navigate to the Entities & Frameworks section.
- Locate the Compliance subsection, which summarizes high-level compliance activity.
- Click the expand icon to open the Compliance dialog.\
The dialog displays:- Compliance Standards: A comprehensive list of all standards associated with the case (e.g., PCI-DSS, NIST SP 800-53, SOC 2, ISO 27001).
- Violated Controls: A granular breakdown of specific controls breached under each standard.
- To drill down into specific compliance findings, locate the relevant standard and control in the list and click View issues next to the control.\
This automatically redirects you to the Issues & Insights tab in the Detailed View, pre-filtered to display only the issues matching the selected compliance standard and control.
Case timeline
Access the case timeline to see a chronological record of security events and analyst actions in Cortex XSIAM.
Overview of the timeline
The case timeline maps the full lifecycle of a security case by consolidating attack events, analyst activities, and system actions. You can enrich the timeline by adding your own records, including evidence, notes, and relevant information to provide a single source of truth for tracking investigations and auditing actions.
Navigate the timeline using the following modes:
- Journal mode (the default view) offers a chronological, story-like narrative with records displayed as tiles, automatically grouping consecutive activities from the same actor to reduce noise.
- Table mode serves as a detailed working tool where you can efficiently filter, sort, and analyze records in a spreadsheet format to uncover specific patterns or actionable insights.
Access and review the timeline
To access the case timeline, click on Overview or Detailed View and select Timeline from the drop-down menu. In the case timeline, switch between Table view or Journal view by clicking on the respective icons  .
.
Explore your timeline as follows:
- Filter and sort records: You can filter by record type, source, tag, and other fields, and sort records by record creation time or by the time the event occurred.
- Expand clusters: In Journal Mode, records that share the same actor, type and certain subtypes, are clustered together. Expand clusters to see the individual records or click a cluster to open a card showing a summary of the clustered records.
- Review and create custom timelines: Custom timelines allow you to categorize your investigation records and focus on a particular aspect of the investigation. The default case timeline lists all case records. Click Case timeline to see a list of all defined timelines.
-
Review record details: Click any record or table row to open a record card that expands to display full metadata, context, attachments, and linked queries.
You can take the following actions on a record:
- Mark a record as evidence: Use this to prioritize key observations for formal reporting and investigation workflows. Marking a record pins it to the Evidence area in the case overview, ensuring your most critical observations are organized and immediately accessible.
- Add or edit tags: Use tags to add descriptive metadata to your records. This allows you to categorize activities for targeted filtering and search, and helps you organize the timeline into custom views based on specific investigation needs.
Create a new record
You can manually add records to the timeline to document observations or notes.
- Click Add Record.
-
Select a record Type.
The subtype is automatically set to Note added.
- Specify the Occurred at time. This is the date and time when the event actually occurred.
- Provide a name and description of the record. The description is displayed in the Journal view list and helps you identify the record.
- (Optional) Add Tags for categorization.
- (Optional) Add Query Results. You can refer to a specific query execution ID to attach and render results as a table within the record.
- (Optional) Attach files such as screenshots, logs, or documents. Supported formats include images (.png, .jpg, .gif) and text-based files (.txt, .csv, .json). Records with attached files are identified by the Attachments label.
- (Optional) Mark the record as evidence. Use this flag to prioritize key observations. Records marked as evidence are identified by the Evidence label.
Register a playbook task as a case timeline record
You can configure playbook tasks to register the task results in the case timeline record. When creating or editing a playbook task, in the Advanced tab, enable Register as case timeline record. Enter a Record name for the case timeline. You can add an optional Description and Tags, and you can also Mark as Evidence and provide an evidence comment.
Mark a record as evidence
You can mark any timeline record as evidence to prioritize key observations for formal reporting and investigation workflows.
Once marked, the record appears in the Evidence tab in the Case Overview. This area displays record details and evidence metadata, and identifies who flagged the record as evidence. If the record includes attachments in a renderable format (text, image, or PDF), you can preview them inline within the Evidence tab. In this tab, you can choose the specific evidence that you want to view from the drop-down menu in the top right corner.
Take one of the following actions to mark a record as evidence:
- Right-click a record and select Mark as evidence.
- When creating a new record or editing an existing one, select Mark as evidence.
The system automatically populates the Evidence Title with the record name and sets the Evidence Flag Time to the current time.
Note
If you unmark a record as evidence, the evidence flag is removed but the underlying timeline record and its attachments are not deleted.
Custom timelines
Within the case timeline, you can set up additional timelines that act as "quick filters" for sorting and filtering specific records to help you focus on particular aspects of an investigation.
You can add a record to one or more timelines. Take the following steps:
- Right-click the record you want to add and select Add to timeline.
-
In the Add to timeline modal, select one or more timelines from the list.
To create a new timeline, type a name for the new timeline and press Enter.
- Click Add.
Detailed View
The Detailed View in the case card provides a table-based format and custom layouts, ensuring full backward compatibility. You can switch between the Overview and the Detailed View based on your workflow preferences in Cortex XSIAM.
The Detailed View supports deep inspection and manual analysis while maintaining access to the same underlying case data. It includes the following tabs:
| Tab | Description |
|---|---|
| Issues & Insights | Displays a list of issues and insights linked to the case. Click on an issue or insight to open the issue card. |
| Key Assets & Artifacts | Displays asset and artifact information of the key artifacts, hosts, and users associated with the case. Hover over an icon for more information, or click the more options icon to see the available views and actions. For more information about investigating key assets and artifacts, see Investigate artifacts and assets. |
| Timeline | Displays a chronological representation of issues and actions relating to the case. Each timeline entry represents a type of action that was triggered in the issue. Issues that include the same artifacts are grouped into one timeline entry and display the common artifact in an interactive link. Click on an entry to view additional details in the Details pane. You can also filter the timeline by action type. Depending on the type of action, you can select the entry to further investigate and take action on it. |
| Case War Room | The Case War Room is a collection of the Active Response investigation actions, artifacts, and collaboration pieces for an issue or case. It is a chronological journal of the case investigation. You can run commands and playbooks from the War Room and filter the entries for easier viewing. The War Room facilitates real-time investigation. Powered by ChatOps, the War Room helps you perform different tasks related to their case investigation using CLI commands. For example, running real-time security actions through the CLI, without switching consoles, and running security playbooks, scripts, and commands. For more information, see Use the War Room in an investigation. |
| Executions | Displays the causality chains associated with the case. On this tab, you can investigate a causality chain and take actions on a host. For more information, see Causality view. |
Investigate issues and insights
The Issues & Insights tab displays a table of the issues and insights associated with the case.
- Use the toggle to switch between issues and insights, and add filters to the table to refine the displayed entries.
- Click an issue to open the issue investigation panel. This panel provides detailed information about an issue, enables you to take actions on an issue, open the causality, and start remediation.
- If required, you can unlink the issue from the case or link it to other related cases. Click the more options icon and select Manage issue - Link to case or Unlink from case.
Note
When an issue is resolved, it remains linked to a case. Once all of the issues in a case are resolved, the case is automatically closed.
Run an automation on an issue
You can run or rerun an automation on one or more issues. If there is currently an automation running on one or more of the selected issues, the Run Automation option does not appear. If an automation is running on the issue, but has been paused (for example, waiting for a user action), you can select to rerun the automation or select a new automation.
- In the Issues & Insights tab, right-click one or more issues and click Run Automation.
- If the issues have an automation already assigned, choose Rerun current Automation or Choose another Automation. If the playbooks do not have an automation assigned, select a action to run and define the action parameters.
- Run the automation.
Investigate key assets and artifacts
The Key Assets & Artifacts tab displays all the case assets and artifact information of hosts, users, and key artifacts associated with the case.
-
Investigate artifacts.
In the Artifacts section, review the artifacts associated with the case. Each artifact displays, if available, the artifact information and available actions according to the type of artifact: File, IP Address, and Domain.
-
Investigate hosts.
In the Hosts section, review the hosts associated with the case. Each host displays, if available, host information and available actions.
To further investigate the host, select the host name to display the Details panel. The panel is only available for hosts with the agent installed and displays the host name, whether it’s connected, along with the Endpoint Details, Agent Details, Network, and Policy information details. If the Details panel is not available, click the more options icon next to a host name to see the available options.
-
Investigate users.
In the Users section, review the users associated with the case. Each user displays, if available, the user information and available actions
Investigate the case timeline
The Timeline tab is a chronological representation of issues and actions relating to the case.
- Navigate to the Timeline tab and filter the actions according to the action type.
-
Investigate a timeline entry.
Each timeline entry is a representation of a type of action that was triggered in the issue. Issues that include the same artifacts are grouped into one timeline entry and display the common artifact in an interactive link. Depending on the type of action, you can select the entry, host names, and artifacts to further investigate the action:
- Locate the action you want to investigate:
- For Quick Actions and Case Management Actions, you can add and view comments relating to the action.
- For Issues, Automatic Case Updates and Automation actions, click the action to open the Details panel. In the panel, go to the Issues tab to view the issues table filtered by issues ID, the Key Assets to view a list of Hosts and Users associated to the issue, and an option to add Comments.
- Select the Host name to display the endpoint data, if available.
- Select the Artifact to display the following type of information:
- Hash artifact: Displays the Verdict, File name, and Signature status of the hash value. Select the hash value to view the Wildfire Analysis Report, Add to Block list, Add to Allow list and Search file.
- Domain artifact: Displays the IP address and VT score of the domain. Select the domain name to Add to EDL.
- IP address: Display whether the IP address is Internal or External, the Whois findings, and the VT score. Expand Whois to view the findings and Add to EDL.
- In action entries that involved more artifacts, expand Additional artifacts found to further investigate.
- Locate the action you want to investigate:
Investigate case executions
The Executions tab displays all the causality chains associated with the case. The causality chains are aggregated according to the following types of groupings:
- Host Name
- Host with an agent installed
- Host without an agent installed
- Multiple Hosts
- Undetected Host
- User Name
- Username
- Multiple Users
- Undetected Users
Note
- Cloud-related issues are displayed in the User Name grouping.
- Prisma Cloud Compute issues are displayed in the Host Name grouping.
How to investigate case executions
-
Investigate the host causality chains.
In the Executions section, review the hosts associated with the case. Review the host information and click the more options icon to perform actions on the host, or open related views.
-
Investigate a causality chain.
The causality chains are listed according to the Causality Group Owner (CGO), expand the CGO card you want to investigate. Each CGO card displays the CGO name, the following CGO event details, and the causality chain:
- CGO Name
- Issue Sources associated with the entire causality chain
- Execution time of the causality chain
- Number of issues that include the CGO according to severity.
Expand the causality chain to further investigate and perform available Causality View actions. For more information, see Causality view.
Resolve the case
After analyzing a case, you can start remediation in the Cortex XSIAM Resolution Center. This process involves executing specific tasks to address the problems identified in the case. Once the remediation tasks are completed and verified, you can officially close the case to reflect its updated status and maintain an accurate audit trail.
Resolution Center
In Cortex XSIAM, the Resolution Center is the primary workspace for managing and resolving cases. With a focused, action-oriented flow, you can focus on resolving the entire case rather than investigating isolated issues. By removing fragmented navigation, this workspace allows you to work without context switching, enabling you to open and run playbooks within the case context and quickly review the status of all tasks for all issues in the case.
The Resolution Center guides you toward resolution by answering the question, What should I do next? You can track your progress using four specialized tabs:
Pending
Your to-do list for case actions. This tab displays any tasks waiting for execution or tasks that require your input.
- Task details: View the task summary, assignee, and SLA. If SLAs are configured, tasks are sorted by deadline; otherwise, they appear in the order they were created.
-
Play book execution: Each task shows its source (Issue ID and Automation Name). You can click the Issue ID to open the issue card or click the playbook to open the workplan.
If a playbook is already in progress but requires user input, the label shows the status of the playbook. Click the label to open the Workplan and directly execute the playbook task.
Note
Tasks that are already In Progress but require your input will appear in both the Pending and In Progress tabs.
Recommended
Lists suggested playbooks and response actions to help remediate issues linked to the case.
- Task details: View details of recommended tasks, including the name of the source that triggered the recommendation.
- Consolidated tasks: If the same action is recommended for multiple issues, it is only listed once. Review the labels on a task to see the issues for which the task is relevant.
- Playbook execution: Click a playbook to preview and execute it in the Work Plan. If the playbook applies to multiple issues, you can choose which issues to run it against.
- Recommended response actions: Click a recommended action to open a dialog with detailed steps for executing the action.
In Progress
Track automations that are currently running and remediation workflows in real time.
- Real-time tracking: View all active playbooks, including those in the run queue.
- Status details: Each record includes the playbook name, related issue, and current status (Error, Waiting, or Running).
- Navigation: Click a playbook to open the Work Plan or click an Issue ID to view the associated issue card.
Done
Review an audit trail of resolution steps.
You can review a list of completed playbooks, automations, and actions that ran on the issues in the case. Records includes the playbook name, the related issue, the completion time, and the final status.
Collaborative notes and comments
Located within the Resolution Center, the Notepad and Comments panels enable team-wide communication and documentation. This workspace ensures all analysts stay aligned by maintaining a continuous record of the investigation in Cortex XSIAM.
Capabilities include:
- Notepad: Record critical evidence, observations, and investigative steps to maintain a shared history for the case.
- Comments: Share progress updates and discuss the case with team members in real-time.
How to resolve a case
In Cortex XSIAM you can resolve a case in the following ways:
- Manually on the Cases page:
- Click the case status and select Resolved.
- In the Resolve case dialog, select the resolution reason and leave a comment.
- Select whether to resolve all of the issues in the case, and whether to create an exclusion.
- Click Resolve.
- In the War Room or as a playbook task. Run the
!setParentIncidentFieldscommand. - In the API, run the
Update Casecommand .
Note
If a case is resolved with the status Resolved - Auto Resolved, Cortex XSIAM can reopen the case for up-to six hours if a new issue is triggered that matches the case. The six-hour period is defined by the timestamp of the last issue that was grouped into the case. After the six-hour period, any new issues are linked to a new case for a new investigation.
Resolution reasons for cases and issues
When you resolve a case or issue, you must also specify a resolution reason. The following table describes the resolution reasons for selection in Cortex XSIAM.
Note
The displayed resolution reasons are domain-specific. You can see the resolution reasons that are defined for a domain under Configurations → Object Setup → Cases → Domains.
| Resolution reason | Description |
|---|---|
| Resolved - True Positive | The case or issue was correctly identified as a real threat, and the case was successfully handled and resolved. Note Cases and issues resolved as True Positive and False Positive help to identify real threats in your environment by comparing future cases and associated issues to the resolved cases. Therefore, the handling and scoring of future cases is affected by these resolutions. |
| Resolved - False Positive | The case or issue is not a real threat. Note Cases and issues resolved as True Positive and False Positive help to identify real threats in your environment by comparing future cases and associated issues to the resolved cases. Therefore, the handling and scoring of future cases is affected by these resolutions. |
| Resolved - Security Testing | The case or issue is related to security testing or simulation activity, such as a BAS, pentest, or red team activity. |
| Resolved - Known Issue | The case or issue is related to an existing issue or an issue that is already being handled. |
| Resolved - Duplicate Case | The case or issue is a duplicate of another case. |
| Resolved - Risk Accepted | The case or issue is related to a known mitigation or impact. |
If you created a custom resolution, it is also available for selection.
Monitor and track resolution times
By default, the system tracks the resolution of cases and issues using built-in fields: Resolution Timer and Resolution SLA. You can use these fields to monitor deadlines at a glance or sort by SLA status. These fields are available for tracking case resolution on the Cases page, and issue resolution on the Issues page in Cortex XSIAM.
Resolution Timer
Automatically tracks the total duration from creation to resolution. The timer stops when the status changes to Resolved.
Timer behavior after reopening
If a case or issue is reopened, the timer resumes and includes the entire elapsed time, including the period when it was closed.
Resolution SLA
Measures your compliance against defined SLA targets. By default, no SLA rules are preconfigured, giving you the flexibility to define SLAs that work best for your environment.
Once configured, the system evaluates the rules in order and the first matching rule is applied. You can configure SLAs for your cases and issues, as explained in Create an SLA rule.
Case SLAs
To ensure high-level visibility and help you adhere to your organizational goals, all active SLAs are visible directly within the product workflows:
- Real-time visibility: When you open a case, the status of all active SLAs are displayed directly in the case header.
- Parallel SLA tracking: Cases support running multiple SLAs concurrently. While the default Resolution SLA tracks the baseline lifecycle, you can create additional SLA fields to measure separate milestones, such as initial response times, or to enforce unique targets for specific customer tiers. For more information about setting up additional case SLAs, see Create case timers and SLAs.
- Table filtering and sorting: The predefined Resolution SLA field and any additional SLA fields can be monitored in the Cases table, allowing you to filter, sort, and prioritize your queue by custom compliance metrics. For more information, see Monitor the status of issue resolution SLAs.
Cortex Response and Remediation content pack
The Cortex Response and Remediation content pack delivers a powerful collection of automated playbooks designed to streamline incident response and remediation processes, built to support an Autonomous SOC vision in Cortex XSIAM.
The playbooks in this pack are tightly coupled to Issues, leveraging detector logic to provide highly accurate and context-aware responses. This ensures seamless integration with Cortex XSIAM, enabling SOC teams to focus on high-priority threats while automating repetitive tasks.
Key principles of the Cortex Response and Remediation playbooks
- Focused Security Response: Playbooks prioritize high-quality security responses while delegating bureaucratic tasks to incident-level or sub-playbooks.
- Research-Based Design: The playbooks in the Cortex Response and Remediation pack are designed by the Cortex and Prisma Research team with extensive expertise and knowledge in responding to incidents and issues.
- Detector Alignment: Playbooks are tailored to specific Cortex or Prisma issues, ensuring precision by aligning with detector logic.
- Cortex Analytics Integration: Playbooks leverage Cortex analytics capabilities to derive precise verdicts for accurate and effective remediation.
- AI-driven Investigations: Advanced AI capabilities enrich investigations by providing deeper insights and contextual data to improve decision-making.
- Clear Design: Understandable within minutes.
Playbook features
- Prebuilt: Use out-of-the-box (OOTB) playbooks to ensure rapid deployment and reliable functionality.
- Context-aware Actions: Implement responsive actions based on issue triggers.
- Seamless Integrations: Fully compatible with Palo Alto Networks products and compatible with third-party solutions.
- Granular Monitoring: Provides detailed logs for tracking execution.
Integrations in the Cortex Response and Remediation content pack
For a full list and description of each of the integrations in the Cortex Response and Remediation content pack, see the Content tab in Cortex Response And Remediation.
Investigate an issue using Cortex Response and Remediation playbooks
Issues help you to monitor and control the security of your system framework by alerting you to security risks in your framework. Cortex XSIAM generates issues from the following:
- Agents
- Firewalls
- Analytics
- Integrations
By analyzing an issue, you can better understand the cause of the issue, and take actions where required.
Select an issue to investigate
The Issues page displays a table of the issues associated with the incident. By default, the Issues page displays the security issues received over the last seven days. To see detailed information about an issue, click an issue to open the issue panel. You can then investigate the issue further by opening the issue investigation panel.
-
Go to Cases & Issues → Issues.

-
Click the issue and review the information in the issue side panel.
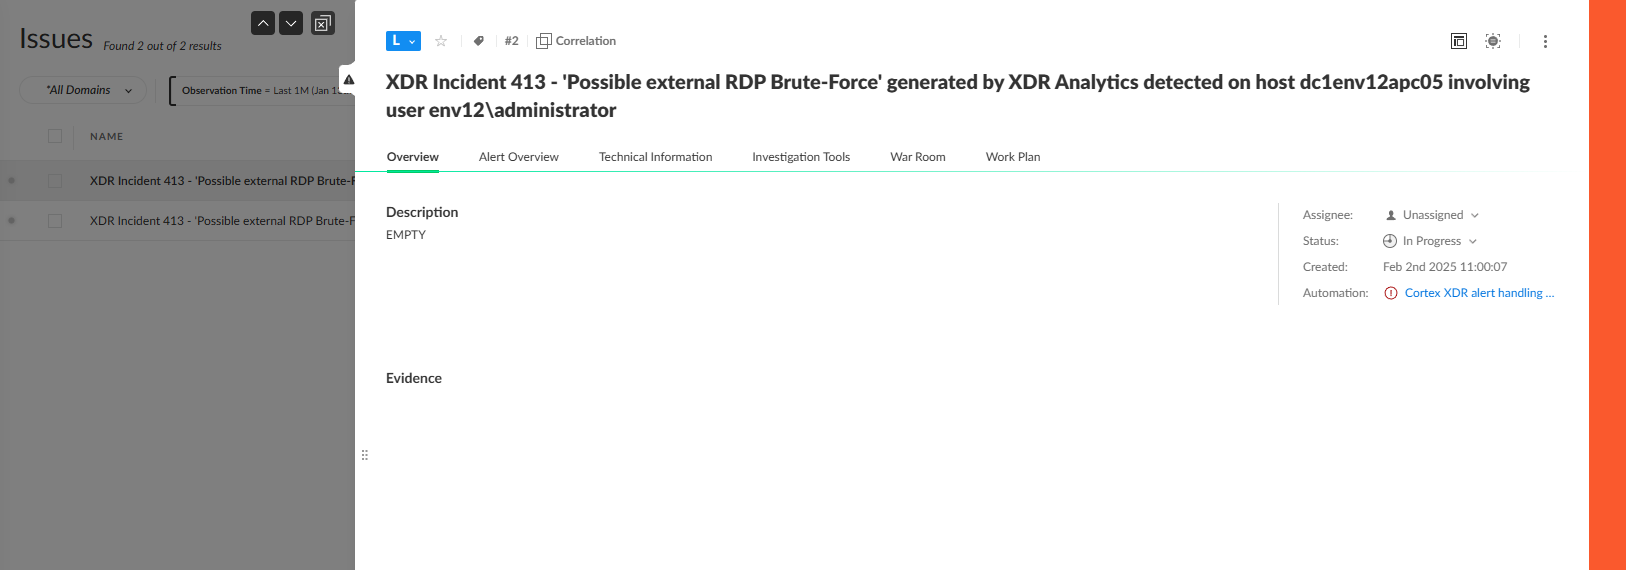
-
To see more information about the issue, click the Issue Overview tab.
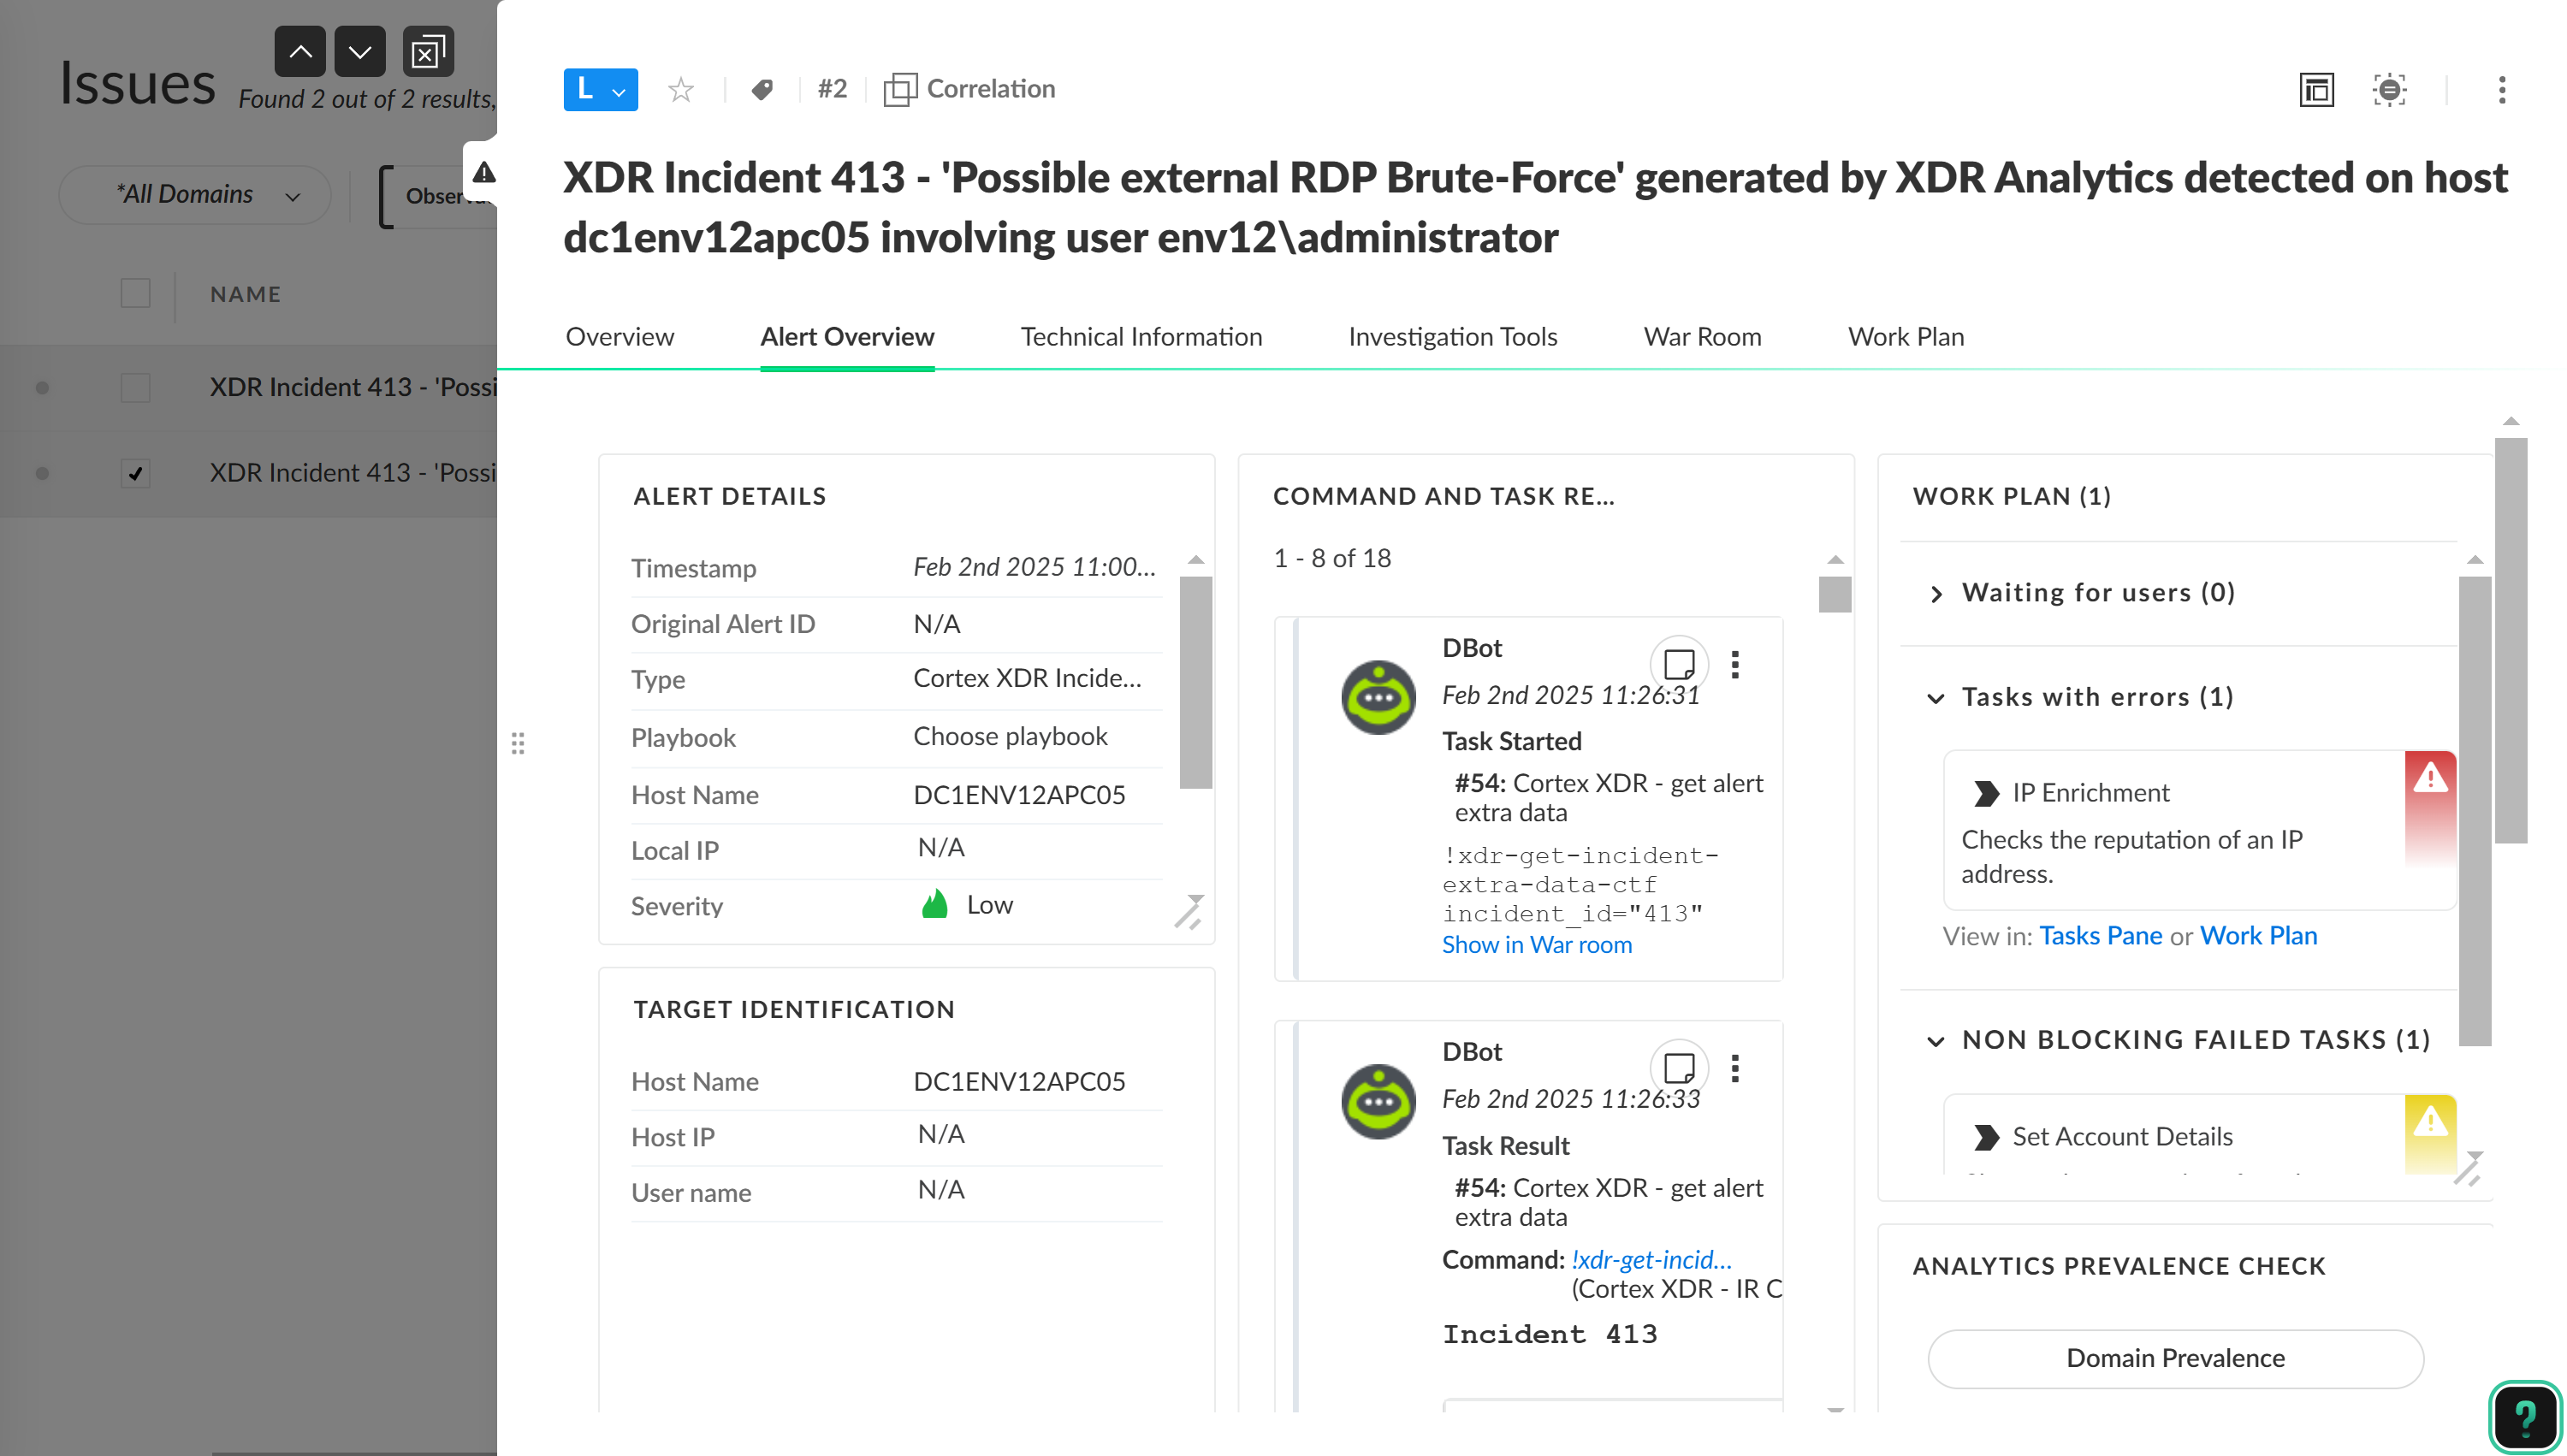
Run a Cortex Response and Remediation playbook
The Cortex Response and Remediation playbooks are a series of tasks, scripts, conditions, commands, and loops that run in a predefined flow to save time and improve the efficiency and results of the investigation and response process. They enable you to automate many security processes, including handling investigations and managing tickets. In the Work Plan tab, you can select a playbook to run on the issue. You can watch the flow of the playbook as it automatically analyzes the issue.
- Go to Cases & Issues → Issues.
- Click the issue and review the information in the issue side panel.
- In the Issue Investigation panel, click the Work Plan tab. A message appears that recommends which Cortex Response and Remediation playbook you should run on this issue.
- Click Run. A single instance of the playbook will run.
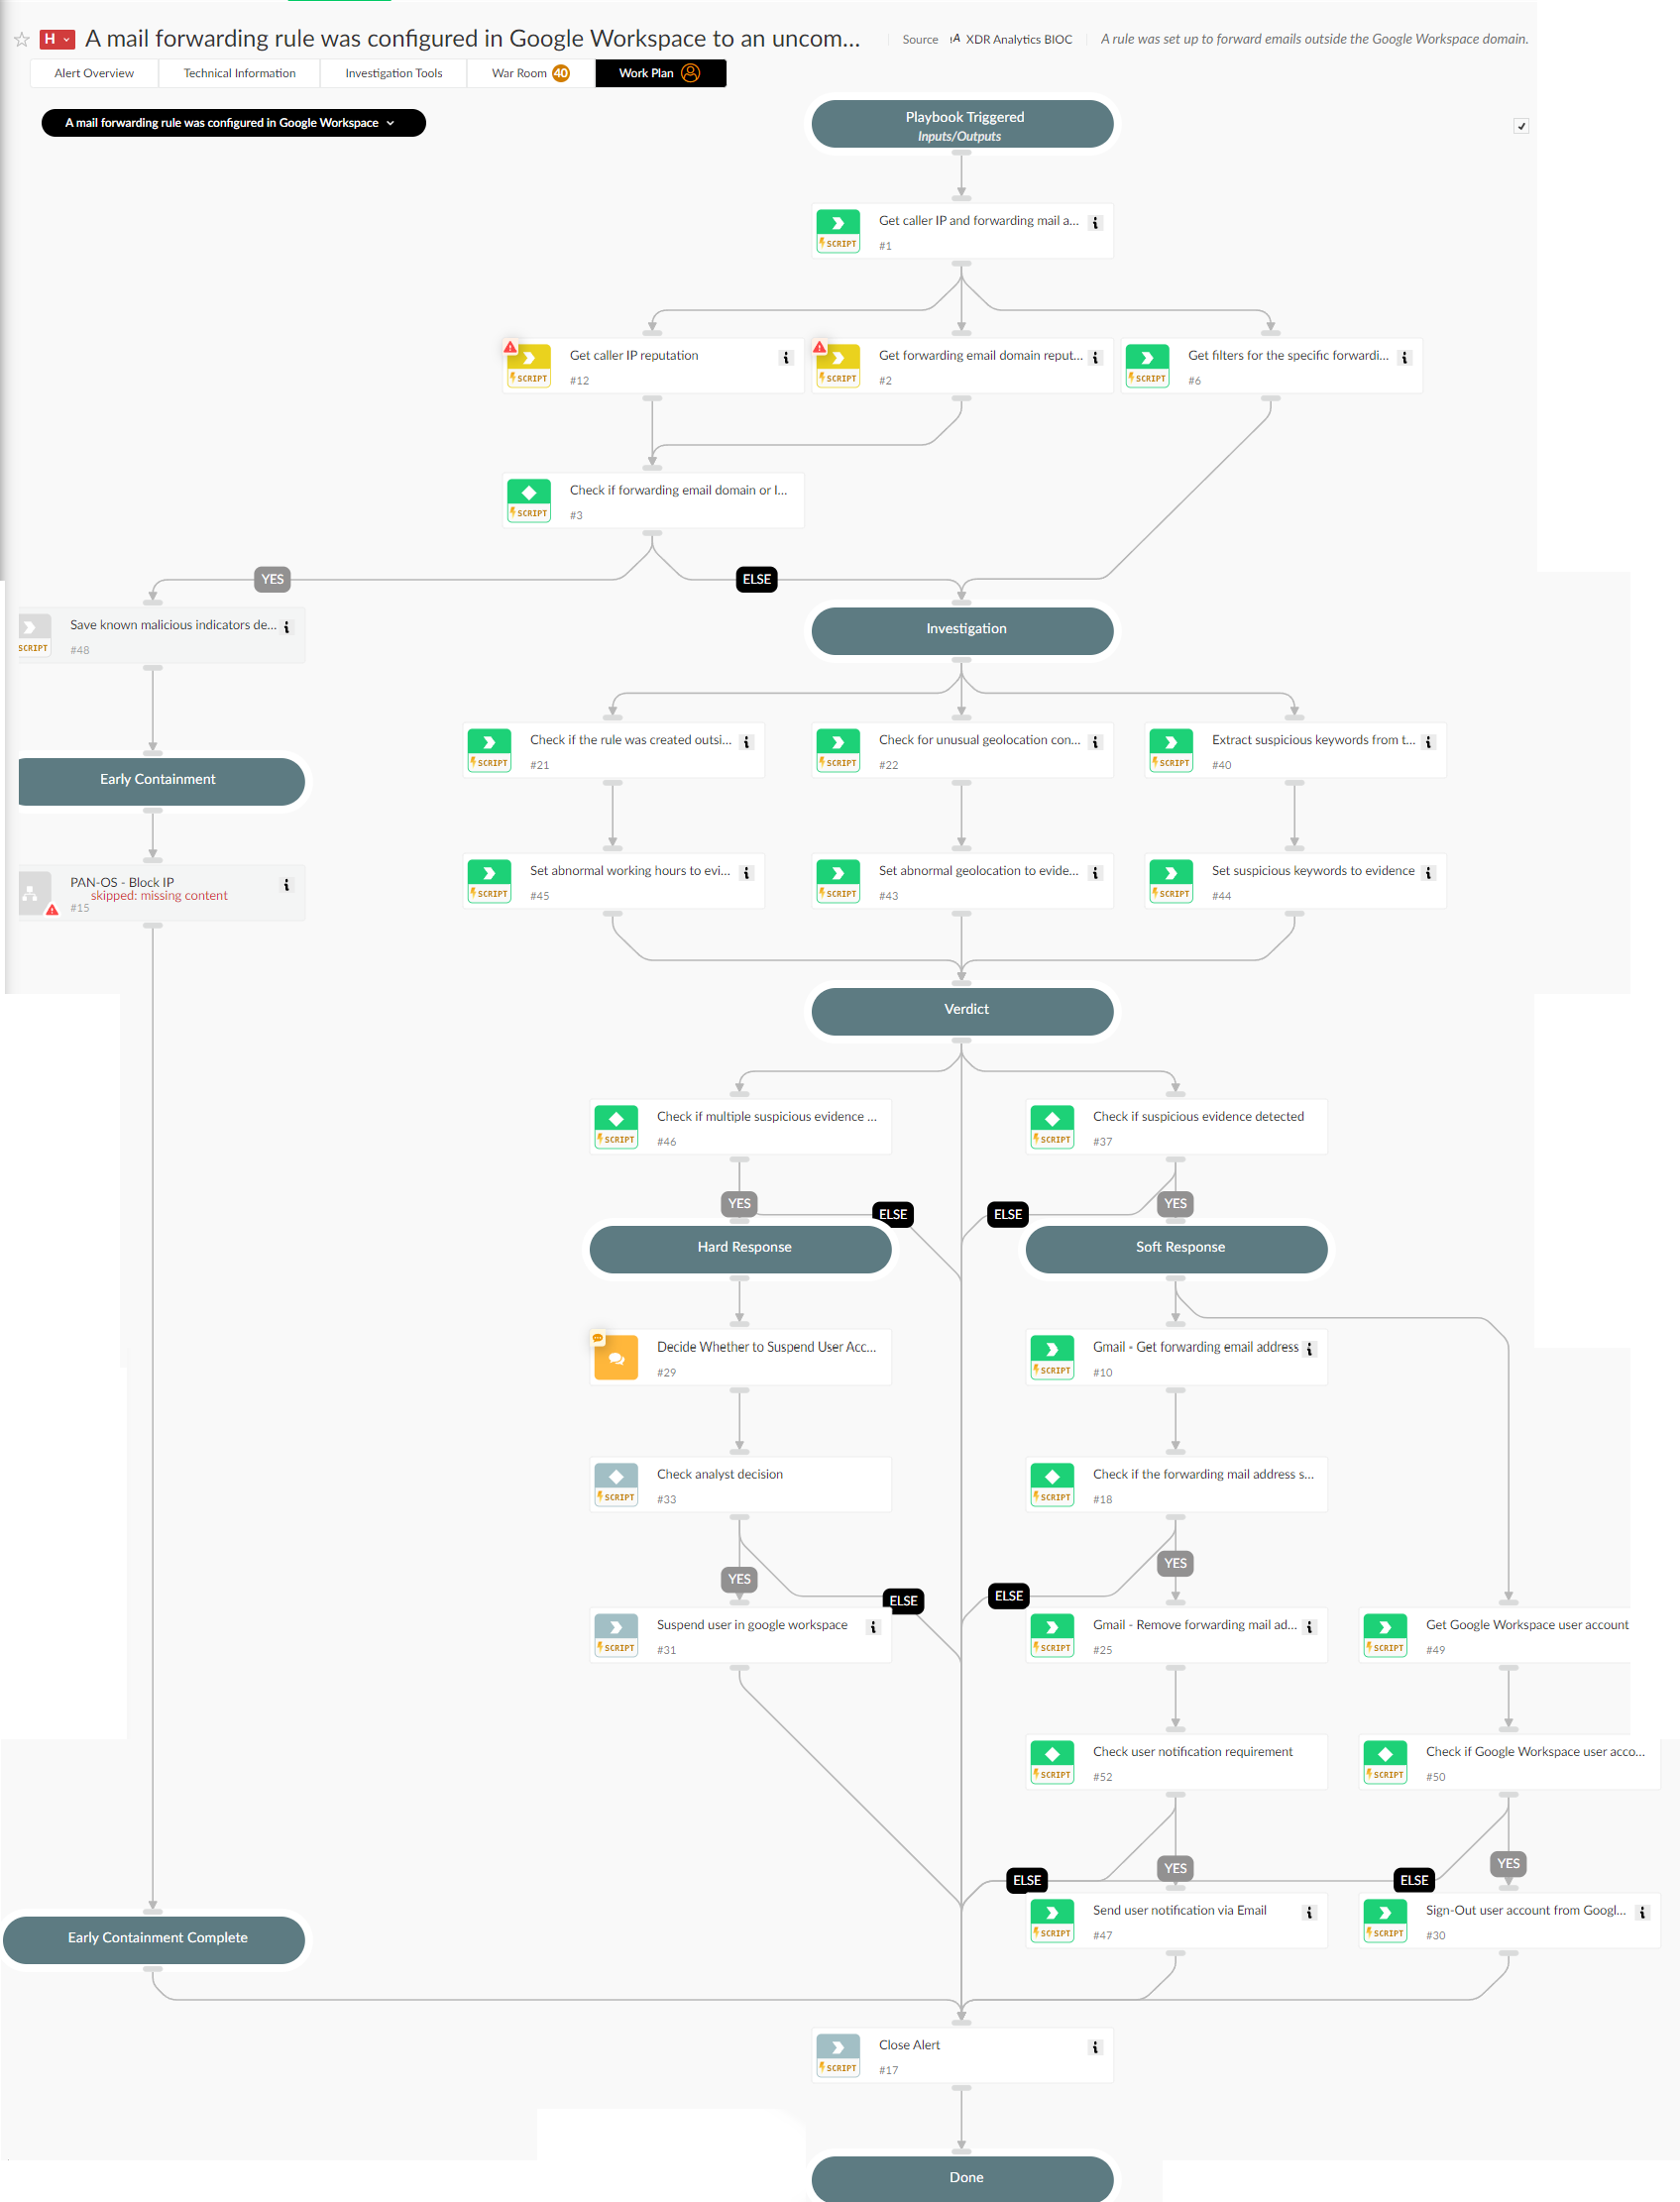
Adopt a automation rule suggestion
An automation rule is a filter on an issue that creates conditions, so if an issue with specific characteristics is created (for example by source, severity, or MITRE TTP), a suitable response is issued via a playbook. This saves the analyst time and expense when investigating an issue.
You can assign a playbook to an issue so that whenever the same issue is triggered in the future, the same playbook will automatically run. You can add an automation rule from the Automation R Recommendations table. These playbooks are recommended to run whenever the issue is triggered. These recommendations are part of the Cortex Response and Remediation content pack.
- Go to Investigation & Response → Automation → Automation Rules.
- Click View Recommendations.
- Select the automation rule you want and click Add selected rules.
Reviewing the playbook response
After running the playbook, you can investigate an issue to gain more information about the cause of the issue, and take any actions required. In the issue investigation panel. The following tabs are common to most issue:
| Tab | Description |
|---|---|
| Issue Overview | A summary of the issue, such as issue details, outstanding tasks, and indicators. Some fields are informational and some are editable. Includes the following sections (depending on the layout):
|
| Technical Information | Displays an overview of the information collected about the investigation, such as indicators, email information, URL screenshots, etc. When you run a playbook, the sections are automatically completed. |
| Investigation Tools | Enables you to take action on the issue , such as converting a JSON file to CSV and check if the IP address is in CIDR. |
| War Room | A comprehensive collection of all investigation actions, artifacts, and collaboration. It is a chronological journal of the issue investigation. Each incident has a unique War Room. For information, see Use the War Room in an investigation. |
| Work Plan | A visual representation of the running playbook that is assigned to the incident. For more information, see Use the Work Plan in an investigation. |
Use the following steps to investigate and triage the issue:
- Review the data shown in the issue such as the command-line arguments (CMD), process info, etc.
-
Analyze the chain of execution in the causality view.
When the app correlates an issue with additional endpoint data, the Issues table displays a green dot to the left of the issue row to indicate the issue is eligible for analysis in the causality view. If the issue has a gray dot, the issue is not eligible for analysis in the causality view. This can occur when there is no data collected for an event, or the app has not yet finished processing the EDR data. To view the reason analysis is not available, hover over the gray dot.
- Review the timeline of the sequence of events over time. The timeline is available for issues that have been stitched with endpoint data.
- If deemed malicious, consider responding by isolating the endpoint from the network.
- Remediate the endpoint and return the endpoint from isolation.
Example use cases
The following are examples of Cortex Response and Remediation use cases in Cortex XSIAM.
SSO password spray
- Detection: Identifies suspicious login attempts against SSO endpoints.
- Triage: The playbook checks the IP reputation and fetches the events related to the SSO login attempts.
- Early Containment: The playbook checks if the IP is suspicious. If it is, the playbook suggests blocking the IP.
- Investigation:
- The playbook assesses the risk score of the user who successfully logged in and examines the legitimacy of the user agent.
- It verifies if the user has MFA configured and analyzes the timestamps of the login attempts to detect potential malicious automated patterns.
- Containment:
- If there is a successful login attempt and the user's risk score is high, or if the user agent is detected as suspicious, or if the time intervals were automated, the playbook clears the user's session.
- If the user doesn't have MFA, the playbook recommends expiring the user's password.
- Requirements: For any response action, you need one of the following integrations:
- Microsoft Graph User
- Okta
Credential dumping using a known tool
- Detection: Recognizes credential dumping activities.
- Response:
- Early Containment: Handles malicious issues by terminating the causality process.
- Remediation: Handles malicious issues by suggesting the analyst to isolate the endpoint. endpoints identified in the detection.
User added to local administrator group using PowerShell
- Detection: Detects unauthorized privilege escalations via PowerShell commands.
- Response:
- Investigation: Check the following parameters to determine if remediation actions are needed:
- Cortex XSIAM issues related to the hostname by MITRE tactics indicating malicious activity.
- Whether the process is unsigned.
- Remediation: Handles malicious issues by terminating the relevant processes and requesting the analyst's approval to remove the user from the local Administrators group. Handles non-malicious issues identified during the investigation.
- Investigation: Check the following parameters to determine if remediation actions are needed:
Additional case actions
The pages in this section describe additional actions you can take on Cortex XSIAM cases.
Create a case
Note
To create a case manually, you must have View/Edit permission for Cases and Issues selected under Settings → Configurations → Access Management → Roles → Components → Cases & Issues.
In Cortex XSIAM, you can create a case directly from the Cases page.
- On the Cases page click New Case.
-
Under Case Details, specify the case domain, name, severity, and (Optional) assignee and description.
The severity of a manually generated case cannot be low.
Note
You can assign a case to a single domain only, and you cannot change the assigned domain. For more information, see Case and issue domains.
-
(Optional) Under Case Fields, select custom case fields.
Cortex XSIAM validates the Host IP, Local IP, and Remote IP fields.
If you select Set fields as default for new <domain> domain cases, the custom case fields that are configured are saved for all users. When a user next creates a case for the same domain, these fields are automatically configured instead of the default field set.
To reset the custom fields to the system default, click Restore Default Field Set.
-
Under Issue Details, select the issues to link to the case, or create a new issue.
Tip
The issues that you link to a case can be linked to multiple cases, and the issue domains do not need to match the case domain.
-
Under Issue Fields, define the following:
Note
This option is only relevant for certain domains.
- MITRE ATT&CK tactics and techniques to assign to the case.
- Custom issue fields.
-
(Optional) Under Playbook, specify playbook run settings. By default, a playbook is run Automatically by trigger.
Note
This option is only relevant for certain domains.
-
Click Create new case.
Each case creation generates one issue. The name, the severity, and the description of the generated issue mirrors the name, the severity, and the description of the case.
Note
You can't attach files to manually created cases.
Merge a case
In Cortex XSIAM, if you find related cases that belong together, you can merge them into a single case to streamline your workflow and consolidate your team's efforts.
Key definitions
Before merging your cases, it is important to understand the two roles involved in this process:
- Target case: The primary case that remains active after the merge. It retains its ID, preserves its original data, and receives the combined information from the other case.
- Source case: The secondary case that is combined into the target case. After the merging process is complete, the source case is permanently deleted from the system.
How to merge cases
- Go to the Cases page.
- Click the Display menu and switch to the Table view.
- Select the checkboxes next to the cases you want to merge.
- Right-click anywhere on the selected cases and select Merge cases from the context menu.
Case merging rules: assignees, teams, scores, and data
When you merge a source case into a target case, the system determines ownership, team roles, scoring, and data retention using the following strict rules:
Case assignees
The target case's assignee always takes priority:
- Target case has an assignee: The target case keeps its assignee. The source case's assignee is automatically added to the target case as a Contributor.
- Target case is unassigned: The target case adopts the source case's assignee.
- Multiple source cases with assignees and target case with no assignee: If you are merging multiple source cases that have assignees into an unassigned target case, one of the source case assignees will be selected for the target case assignee. The remaining assignees are added to the target case as Contributors.
- Both are unassigned: The target case remains unassigned.
Case teams (contributors and watchers)
Unlike assignees, team members are never overwritten or deleted. Instead, they are combined:
- Merged teams: The contributors and watchers from both the source case and the target case are pooled together into the final target case, ensuring no one loses visibility.
Case scoring
Case scores are updated automatically or manually depending on your settings:
- Rule-based score: The system automatically recalculates the overall case score to include the scores and metrics from both the source and target cases.
- Manual score: You can manually enter a score, which will override any automated rule-based calculations.
Context data
Data retention is determined strictly by the target case destination:
- Target data is kept: If the target case has existing context data, it is preserved.
- Source case data is deleted: All context data from the source case is permanently lost upon merging, even if the target case has empty data fields.
⚠️ Always ensure important context data from the source case is manually copied over to the target case before initiating a merge, as the source case is deleted after the merge and its original data cannot be recovered.
Assign a case team and restrict access
In Cortex XSIAM you can assign individual users and entire user groups to specific roles within a case team. For sensitive or high-risk cases, you can also restrict access to a case so that only assigned case team members can see or take action.
For more information about the different team roles, see Overview of case teams and roles.
To change the access settings of a case, you must have the Restrict Case Access permission under Cases & Issues.
How to assign a case team and restrict access
Select the main case assignee
Click the assignee icon and select a user.
This is the primary owner responsible for managing and resolving the case.
Define the case team
- Click Manage case team.
- Add users or user groups, and select their specific roles (Collaborator or Watcher).
Restrict case access
Under General access, select Team Only.
Restricting case access limits visibility exclusively to the main case assignee and any users or user groups assigned to the case team as Collaborator or Watcher.
Save your changes
Alternative methods
You can also run this process using these alternative methods:
- Agentic Assistant: Use natural language prompts in the Agentic Assistant to assign a user or user group to roles in the team, and restrict case access.
- Playbooks: Create a playbook task that assigns team members and changes the default case scope. For more information, see Playbook examples.
- API: Run the setCase command with the following arguments:
setCase arguments
For more detailed information about using these arguments, see setCase.
case_team_operation |
Add, replace, or remove team members |
|---|---|
case_team_ids |
Specify users (email) or user groups (UUID) |
case_team_member_types |
Define the team member type (Individual user or user group) |
case_team_roles |
Set the team member role (contributor or watcher) |
access_mode |
<p>Set case visibility:</p><ul><li>CASE_SCOPE: (default) any user whose scope permits can view the case.</li><li>TEAM_ONLY: restricts access to team members only.</li></ul><div data-gb-custom-block data-tag="hint" data-style="info" class="hint hint-info"><p>You cannot set a case to TEAM_ONLY if no case team has been assigned.</p></div> |
Important considerations
Before restricting access or assigning teams, keep the following rules in mind:
- Permissions required: To change the access settings of a case, you must have the Restrict Case Access permission under Cases & Issues.
- Team management: When case access is restricted to Team Only, only assigned team members have permission to add new team members to the case. For more information see Overview of case teams and roles.
- Automatic reversion: If a case has no assigned team members, the scope automatically reverts to Case Scope.
- Audit trail: Any changes made to the case assignee or the case team are permanently recorded in the Case Timeline.
Playbook examples
The examples in this topic show how you can create playbooks in Cortex XSIAM to assign case teams and restrict access to cases.
Assign case team and restrict case to Team only
This playbook automatically fetches high-severity cases, retrieves system groups, assigns a dedicated team of watchers and contributors, and restricts access to ensure a secure investigation.
Task 1: Get high severity cases
Retrieves all open cases flagged as high severity.
- Script:
getCases (Builtin) - Parameters:
| Parameter key | Value | Description |
|---|---|---|
severities |
high |
Filters for high-severity cases only. |
Task 2: Get system groups
Retrieves all user groups in the system.
- Script:
getSystemGroups (Builtin) - Parameters: This task does not require any input parameters.
Task 3: Assign watchers to cases
Assigns specific user groups to the case team of the retrieved cases and sets the watcher role.
- Script:
setCase (Builtin) - Parameters:
| Parameter key | Value / Source | Description |
|---|---|---|
case_ids |
${Core.Case.case_id} |
Target case IDs from the playbook context (Task 1). |
case_team_ids |
Get Core.SystemGroup.groupId Where Core.SystemGroup.groupName Equals SOCteam1 |
Dynamically selects the group ID for the system group named "SOCteam1". |
case_team_member_types |
user_group |
Defines the member type as a user group. |
case_team_roles |
watcher |
Sets the team role type to watcher. |
case_team_operation |
add |
Adds the selected user group to the case team. |
Task 4: Assign contributors to cases
Assigns specific users to the case team of the retrieved cases and sets the contributor role.
- Script:
setCase (Builtin) - Parameters:
| Parameter key | Value / Source | Description |
|---|---|---|
case_ids |
${Core.Case.case_id} |
Target case IDs from the playbook context (Task 1). |
case_team_ids |
<User1@example.com><User2@example.com> |
Explicitly selects specific target user email addresses. |
case_team_member_types |
user |
Defines the member type as an individual user. |
case_team_roles |
contributor |
Sets the team role type to contributor. |
case_team_operation |
add |
Adds the selected users to the case team. |
Task 5: Restrict case access
Changes the case access scope to Team Only, which restricts access solely to the assigned case team (assignee, contributor, or watcher roles).
This task must always come after defining the case team and roles. You cannot set a case to "Team Only" if no case team has been assigned yet.
- Script:
setCase (Builtin) - Parameters:
| Parameter key | Value | Description |
|---|---|---|
case_ids |
${Core.Case.case_id} |
Target case IDs from the playbook context (Task 1). |
access_mode |
team_only |
Restricts visibility strictly to the assigned case team. |
Remove users and user groups assigned to the case team
This playbook purges context data and removes any existing users or user groups from the assigned case team for high severity cases.
Task 1: Delete context
Deletes all existing context data from the case.
- Script:
DeleteContext - Parameters:
| Parameter key | Value | Description |
|---|---|---|
all |
yes |
Deletes all existing context data from the case. |
Task 2: Get high severity cases
Retrieves all open cases flagged as high severity.
- Script:
getCases (Builtin) - Parameters:
| Parameter key | Value | Description |
|---|---|---|
severities |
high |
Filters for high-severity cases only. |
Task 3: Check if group team exists
A conditional task that checks whether any case team is currently assigned to the retrieved cases.
- Type: Built-in condition
- Conditional paths:
| Path | Condition criteria | Description |
|---|---|---|
| Yes | ${Core.Case.caseTeam.id} is not empty |
Routes to Task 4 if a case team ID exists. |
| Else | ${Core.Case.caseTeam.id} is empty |
Routes to the end of the playbook if no team is assigned. |
Task 4: Clean case team
Removes all user and user group data from the selected case team fields for the target cases. This task runs only if Task 3 resolves to "Yes". After this task completes, the playbook concludes automatically.
- Script:
setCase (Builtin) - Parameters:
| Parameter key | Value / Source | Description |
|---|---|---|
case_ids |
${Core.Case.case_id} |
Target case ID from the playbook context. |
case_team_ids |
${Core.Case.caseTeam.id} |
Selects the active case team IDs found in the context. |
case_team_member_types |
${Core.Case.caseTeam.memberType} |
Targets all assigned member types (both users and user groups). |
case_team_roles |
${Core.Case.caseTeam.teamRole} |
Targets all active team roles (contributors and watchers). |
case_team_operation |
remove |
Completely removes the selected users, groups, and roles from the case. |
Unified case view
License
Requires an MSSP license.
Note
- Requires the following RBAC permissions:
- Cases & Issues
- Investigation & Response → Automation
- This view is available for the parent tenant only.
- To take actions on a child tenant from a parent tenant, you must have the appropriate permissions for both tenants. If you do not have the correct permissions, you can view cases in read-only mode.
For MSSP and multi-tenant administrators, the Unified Case View provides a central location to view and perform actions on child tenants across your distributed environment in Cortex XSIAM. You can see a consolidated view of all cases, easily visualize and triage the cases in your environment, and collaborate with child users.
You can access the Unified Case View from Cases & Issues → Cases.
In the Tenant Name column you can see the name of the parent and child tenants. Use this field to filter the table and see cases from a specific child tenant. When you investigate a case on a child tenant Cortex XSIAM pivots into the child tenant screen so that you can perform actions directly in the case, and run commands in the War Room.
In addition, you can take bulk actions across multiple tenants, such as changing the status and severity, and running playbooks. When running a playbook on an issue, you can select from the playbooks that are available in the child tenant. The Tenant Name column is also displayed on the Issues page, and enables pivoting to the child tenant.
Note
Custom case layouts of child tenants are not visible in the parent tenant.
Limitations
To ensure a streamlined user experience in the Unified Case View, we want to make you aware of the current unsupported functionalities that we are working to improve in the upcoming releases:
- Cases → Table view
- Tags, Original Tags, and Custom fields are not supported and therefore are not displayed in the table.
-
Access Control
When viewing the Unified Case View, SBAC on the Parent Tenant is not enforced.
As a fallback option, you can disable the Unified Case View from Settings → Configurations → Server Settings → Unified Case View.
Investigate issues
Prerequisite
To work with issues, an administrator must configure your user role with specific RBAC permissions. Permissions must be enabled in the following order:
- Playbooks: This component (under Investigation & Response → Automations) must be set to Enabled first. Role-level permissions determine your ability to create new playbooks or edit those marked as Public. Specific access to individual custom playbooks and scripts is managed at the object level. For detailed information on the access model, see Access to playbooks.
- Cases and Issues: Once Playbooks are enabled, you can set Cases and Issues (under Cases & Issues) to View or View/Edit.
For more information on setting RBAC permissions, see Role permissions by component.
Issues help you to monitor and control the security of your system framework by notifying you about risks to security in your framework. Cortex XSIAM generates issues from the following:
- Rules that you set up, such as BIOC, IOC, correlation rules, malware rules, automation rules, and vulnerability rules.
-
Findings
Findings themselves are not issues, but findings that match a specific logic can generate issues.
- Agents
- Firewalls
- Analytics
-
Integrations
Integrations enable you to ingest events, such as phishing emails, SIEM events, from third-party security and management vendors. You might need to configure the integrations to determine how events are classified as events. For example, for email integrations, you might want to classify items based on the subject field, but for SIEM events, you want to classify by event type.
Overview of the Issues page
The Issues page consolidates all non-informational issues from your detection sources in Cortex XSIAM. By default, the Issues page displays the security issues received over the last seven days. To access the Issues page, go to Cases & Issues → Issues.
Each issue is linked to one or more cases. A case provides the full story of a problem by linking related issues, assets, and artifacts in one place. To make sure that you understand the full picture of how an issue fits into the bigger picture, we recommend that you start your investigation from the Cases page. You can see the issues linked to a case in the Issues & Insights tab of the selected case. Click on an issue to open the Issue card. For more information, see Issue card.
For issues associated with the Health domain, these issues are not linked to cases and should be investigated individually. You can also see Health domain issues on the Health Issues page. For more information, see About health issues.
Note
Every 12 hours, the system enforces a cleanup policy to remove the oldest issues once the maximum limit is exceeded. The default issue retention period in Cortex XSIAM is 186 days.
Saved table views
On the Issues page, you can change the displayed information by changing the table view. When you open the page, the Security Domain table view is displayed. Click the displayed table view to see your predefined and custom table views. You can create custom table views from scratch or by editing the predefined options.
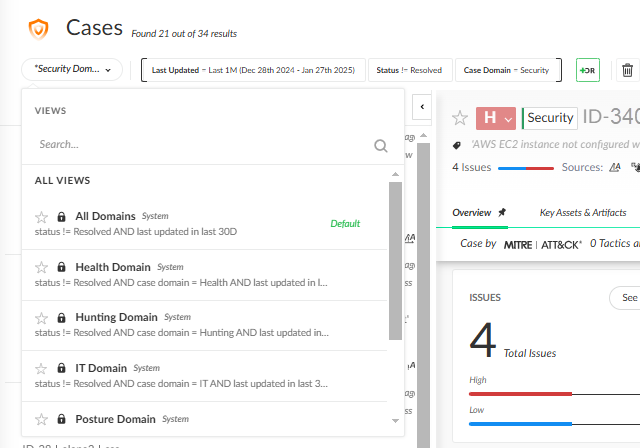
Standardized format of user names in issues
Names of users are processed and displayed the in the following standardized format, also termed “normalized user”.
<company domain>\<username>
As a result, any issue triggered based on network, authentication, or login events displays the User Name in the standardized format in the Issues and Cases pages. This impacts every issue for Cortex XSIAM Analytics and Cortex XSIAM Analytics BIOC, including Correlation, BIOC, and IOC issues triggered on one of these event types.
Deduplicated FW issues
To reduce noise in your environment, if firewall issues with the same name and host are raised within 24 hours, the issues are deduplicated. A label indicates the number of deduplicated issues up to 1,000 issue counts, larger quantities display as 1000+.
For more information, see Issue deduplication.
Featured fields
You can highlight issues that are important to you by tagging specific issue attributes, such as host names, user names, IP addresses, and Active Directory, as featured fields. This can help you track issues. For more information, see Create a featured field.
Issue fields
To see a full list of issue fields and descriptions, run the following query in the Query Builder:
datamodel dataset = issues
Issue card
The Issue card provides a full breakdown of an issue, helping you understand the root cause and take action through relevant evidence, remediation guidance, and response options in Cortex XSIAM.
The issue card supports full case investigation by retaining case context. Once you have finished reviewing an issue, close the card to return to the initial case investigation.
Each issue card adapts to the type of issue you’re investigating, surfacing the most relevant information and tools at every stage of the workflow. While layouts may vary, most issues share a common set of tabs designed to support triage, investigation, and resolution.
Overview
Displays a description of the issue and provides key information, including:
- Assignee
- Status
- Time at which the issue was created and updated
- Suggested automations to run on the issue. Click the automation to open to the Work Plan tab with details of the automation.
- Affected Assets with links to the affected asset cards
- Cases linked to the issue
- Detection rule that triggered the issue and any associated policies. Click to see more details or open the rule or policy directly.
-
Violated compliance standards and specific framework controls associated with the issue.
License Note: Requires Cortex XSIAM Premium or the Cortex Cloud Posture Management or Cortex Cloud Runtime Security add-on.
Click the expand icon to see a list of all standards associated with the issue and a granular breakdown of specific controls breached under each standard.
- If an automation rule triggered an automation (Quick Action, playbook, or agentic agent) to run on the issue, the name of the last automation to run on the issue is displayed.
- (For issues related to Container images) Related Affected Assets displays the assets that are related to the assets listed under Affected Assets. For example, if one of the associated assets is a container image running on a VM, the VM will be listed under this section.
The Evidence section contains information to help you investigate the issue, such as the causality chain.
Note
This section is context-specific and shows data according to the issue context.
Resolution
Displays recommended remediation actions, and pending, in progress, and completed actions. For more information, see Resolution actions.
Issue Information
Displays a summary of the issue, such as issue details , indicators, and outstanding tasks. Some fields are informational and some can be edited. Includes the following sections (depending on the layout):
- Issue details: A summary of the issue, such as type, severity, and when the issue occurred. You can update these fields as required.
- Command and task results: Lists any manual commands and playbook task results.
- Work plan: View or take action on the following:
- Playbook tasks: When a playbook runs, any outstanding tasks appear. You can take various actions here or in the Work Plan tab.
- To-Do Tasks: An ad-hoc item that is not attached to the Work Plan. Create tasks for users to complete as part of an investigation. These are like a To-Do list that you keep in an investigation on an ad-hoc basis, rather than the Work Plan, which follows a pre-defined process. You can view or create To-Do tasks.
- Notes: Helps you understand specific actions taken, and allows you to view conversations between analysts to see how they arrived at a certain decision. You can see the thought process behind identifying key evidence and identifying similar cases.
- Malicious or suspicious indicators: A list of any malicious or suspicious indicators. If you have the Threat Intel add-on, you can pivot to the Indicators page, where you can take further action on the indicator.
- Indicator handling: Take actions on indicators from the displayed options.
Technical Information
Displays an overview of the information collected about the investigation, such as indicators, email information, URL screenshots, etc. When you run a playbook, the sections are automatically completed.
Investigation Tools
Enables you to take action on the issue, such as converting a JSON file to CSV and checking if the IP address is in CIDR.
War Room
A comprehensive collection of all investigation actions, artifacts, and collaboration. It is a chronological journal of the issue investigation. Each issue has a unique War Room. For information, see Use the War Room in an investigation.
Work Plan
A visual representation of the running playbook that is assigned to the issue. For more information, see Use the Work Plan in an investigation.
Resolution actions
The Resolution tab provides a consolidated view of all remediation actions, including recommended playbooks, and pending, in progress, and completed actions.
While actions are issue-specific, they sync automatically to the Resolution Center for the linked case. You can run actions in the Resolution tab for a specific issue, or use the case Resolution Center to apply resolutions to multiple issues. For more information, see Resolution Center.
The options available in the Resolution tab vary depending on the product and the specific type of issue identified.
- View and run playbooks: You can view and run recommended playbooks to help remediate an issue. In addition, you can see pending playbook tasks that require manual intervention. Click a task to open the workplan displaying the full playbook.
Link or unlink issues from a case
You can link and unlink issues from cases. An issue can be assigned to more than one case, and the case domain can be different from the issue domain.
If all issues are unlinked from a case, the case is deleted.
Link issues to a case
From the Issues page, select one or more issues that you want to link, right-click and select Manage Issue → Link to case. You can select one or more case to link the issues.
Unlink an issue from a case
From the Issues page, select the issue that you want to unlink, right-click and select Manage Issue → Unlink from case. You can select one or more cases to unlink the issue. You cannot bulk select issues to unlink.
Run an automation on an issue
You can automate issue investigation and remediation in Cortex XSIAM by running a playbook or Quick Action on one or more issues. Automations can help to improve efficiency by automating and standardizing your workflows, promoting consistent and effective case response and management. For example, automations can automatically remediate a case by interacting with a third-party integration or open tickets in a ticketing system such as Jira.
You can view the playbook that is running on an issue or the playbooks that have already run in the Work Plan for an issue. You can view Quick Actions in the War Room for an issue.
Note
In addition to automation, some playbooks contain manual tasks that prompt the analyst for input. This enables you to enhance an automation workflow with analyst input.
You can run automations in the following ways:
Manually run a playbook or Quick Action on one or more issues
-
Right-click one or more issues in the Issues table and select Run Automation.
If there is currently an automation running on one or more of the selected issues, the Run Automation option does not appear. If an automation is running on the issue, but has been paused (for example, waiting for a user action), you can select to rerun the automation or select a new automation.
- If the issues have an automation already assigned, choose Rerun current Automation or Select another Automation. If the issues do not have an automation assigned, Select Automation.
- If you are not rerunning the current assigned automation, select an automation to run for the selected issue(s).
- Click Run.
Note
You can also manually select a playbook to run from the Issue Work Plan tab.
Apply automation rules
You can create automation rules that automatically run a playbook or Quick Action when an issue is created that meets specific criteria. For more information, see Create an automation rule.
For more information, see Automation in Cortex XSIAM.
Use the War Room in an investigation
Use the War Room in an investigation
The War Room contains an audit trail of all automatic or manual actions that take place in a case or issue. A War Room is where you can review and interact with your case or issue. Cortex XSIAM provides machine learning insights to suggest the most effective analysts and command-sets. Each case and issue has a unique War Room.
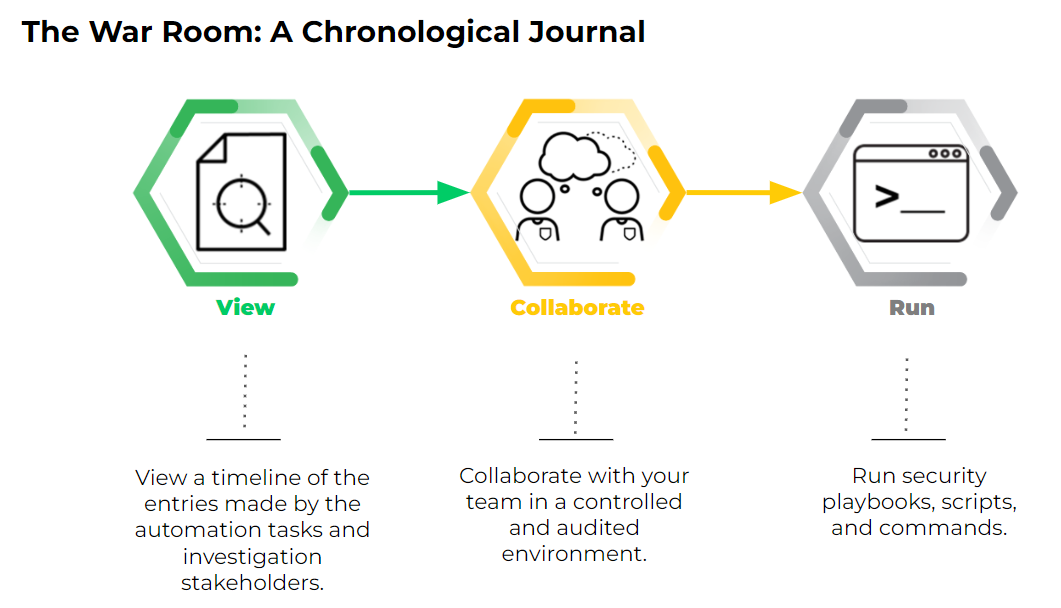
Investigate in the War Room
Within Cortex XSIAM, real-time investigation is facilitated through the War Room, which is powered by ChatOps. In the War Room you can take the following actions:
- Run real-time security actions through the CLI, without switching consoles
- Run security playbooks, scripts, and commands
- Collaborate and execute remote actions across integrated products
- Capture case context from different sources.
- Document all actions in one source.
- Communicate with others for joint investigations.
Note
The case War Room is usually used for communication capabilities, but unlike the issue War Room, it does not include playbook specific entries. The case War Room enables you to investigate an entire case, not just an issue.
Use the Playground
Every case has a War Room, but every user has access, subject to permissions, to a private War Room called the Playground.
The Playground is a non-production environment where you can safely develop and test data, such as scripts, APIs, and commands. It is an investigation area that is not connected to a live (active) investigation.
To access the Playground, do one of the following:
- Go to Investigation & Response → Automation → Playground
- In any browser, type
https://<tenant>.<region>.paloaltonetworks.com/playground
Tip
In the Playground, you can clear the context data, if needed, which deletes everything in the Playground context data, but does not affect the actual issue or case. To clear the context, run !DeleteContext all=yes' from the CLI or click Clear Context Data while viewing the context data.
View War Room entries
When you open the War Room, you can see all the actions taken on a case, such as commands and notes in several formats such as Markdown, and HTML. When Markdown, HTML, or geographical information is received, the content is displayed in the relevant format.
To view specific data entries, you can filter entries by selecting the relevant checkbox, such as:
- Chats: Shows communication between team members.
- Notes: Any entries marked as notes.
- Files: Anything uploaded to the War Room in a playbook, script, or by the analyst.
- Issue History: Any issue field that was modified.
- Commands and playbook tasks: Any actions taken by playbook tasks or run manually by the analyst.
- Tags: Any tags added to the investigation.
Note
Cortex XSIAM does not index notes and chats.
In each War Room entry, you can take the following actions:
| Action | Description |
|---|---|
| Mark as note | Marks the entry as a note, which can help you understand why certain action was taken and assist future decisions. You can also add a note by doing the following:
When marked as a note, it is highlighted, so you can easily find them in the War Room or the Issue Overview tab. |
| View artifact in new tab | Opens a new tab for the artifact. |
| Detach from task | Removes a task from the artifact. |
| Attach to a task | Adds a task to the artifact. |
| Add tags | Add any relevant tags to use that help you find relevant information. |
| Copy to CLI |
To find the entry ID or URL of an entry in the War Room, click on the vertical ellipsis icon at the upper right of the entry, then copy the value. |
Run commands in the War Room CLI
You can run system commands, integration commands, and scripts from an integrated command line interface (CLI), which enables you to make comments in your case (in plain text or Markdown) and to execute automation scripts, system commands, and integration commands. This gives SOC teams the power to execute automations ad-hoc to support their investigations or make notes as they investigate cases.
In the CLI, you can run various commands by typing the following:
| Action | Description |
|---|---|
! | Runs integration commands, scripts, and built-in commands, such as adding evidence and assigning an analyst. |
You can find relevant commands, scripts, and arguments with the CLI’s auto-complete feature. This also includes fuzzy searching to help you find relevant commands based on keywords. If you type the exclamation mark (!) and start typing, autocomplete populates with options that might suit your needs. For example, if you want to work with tasks, type !task, and all commands and scripts that include the task in their name will display.
{% hint style="info" %} Tip: Use the up/down arrow keys in the CLI to search command history. This searches previous commands with the same prefix. {% endhint %}
Special characters
| Characters | Description |
|---|---|
&&, \|\|, !, {, }, [, ], (, ), ~, *, ? |
To use these characters, place them within single or double quotes. An escape character \ is not required. |
\, \n, \t, \r, ", ^, :, comma, and space |
To use these characters, place them within single or double quotes and use an escape character \. |
Common arguments
The following common arguments are available for every script run from the CLI.
| Argument Name | Description |
|---|---|
| auto-extract | Whether/when to extract indicators. Possible values:
|
| execution-password | Supplies a password to run a password-protected script. |
| execution-timeout | Defines how long a command waits in seconds before it times out. |
| extend-context | Select which information from the raw JSON you want to add to the context data. For a single value: For multiple values: |
| ignore-outputs | Possible values: true or false. If set to true, it does not store outputs in the context (besides extend context). |
| raw-response | Possible values: true or false. If set to true, it returns the raw JSON result from the script. |
| retry-count | Determines how many times the script attempts to run before generating an error. |
| retry-interval | Determines the wait time (in seconds) between each script execution. |
| using | Selects which integration instance runs the command. |
| using-brand | Selects which integration runs the command. If the selected integration has multiple instances, the script may run multiple times. Use the using argument to select a single integration instance. |
| using-category | Selects which category of integrations runs the command. If the selected category includes multiple integration instances, the script may run multiple times. Use the using argument to select a single integration instance. |
Access attributes in the Unified Asset Inventory
{% hint style="info" %} License type: This feature is included with a Cortex XSIAM Premium license. It is also included with any other Cortex XSIAM license that has the Cloud Posture Security or Cloud Runtime Security add-on. {% endhint %}
Commands you run in the War Room can automatically populate parameters such as region, account id, and tags, based on asset data. Commands can reference UIA attributes for the relevant asset(s) in the issue context and use those attributes as input. The issue must contain the relevant Asset ID.
The syntax to reference attributes in the UAI is ${asset.xdm.asset.attributename}. To find the property path in the XDM data set, see the asset data card for the asset in the Inventory page. For example, to print the region for the asset, enter !print value=${asset.xdm.asset.cloud.region}. You can also run commands and scripts directly on the asset using ${asset.xdm.asset}.
Run commands in the Automations browser
You can view and run commands and scripts (not system commands, operations, and notifications) in the Automations Browser, by clicking  next to the CLI.
The Automations Browser enables you to run commands and all associated arguments. The scripts and commands are separated into sections such as scripts and built-in commands. In each argument, you can do the following:
- Hardcode the value
-
Use a dynamic value
You can dynamically pass information into the argument by clicking the curly bracket. For example, the
EmailAskUsercommand asks a user a question via email. In theemailargument, rather than typing the user's email address, you can send it to whoever created the case.- In the email field, click the curly brackets.
- In the search box, enter
created. -
Under CASE DETAILS click Created by.
The email argument appears as
${alert.dbotCreatedBy}. -
Run the command.
An email is sent to the user who created the case.
You can use transformers and filters to filter and transform data from the command.
Common arguments when using the Automations browser
| Argument | Description |
|---|---|
| Using | Selects which integration instance runs the command. |
| Extend context | Determines the wait time (in seconds) between each script execution. For a single value: For multiple values: |
| Ignore outputs | Does not store outputs in the context (besides extend context). |
| Execution timeout (seconds) | Defines how long a command waits in seconds before it times out. |
| Number of retries | Determines how many times the script attempts to run before generating an error. |
| Retry interval (seconds) | Determines the wait time (in seconds) between each script execution. |
Examples using the CLI
To run the print script with a value of "hello" and the key a from the context:
!Print value="hello ${a}"
To run the Python command returning Hello World using escape characters:
!py script="demisto.results(\"hello world\")"
To run the Python command returning Hello World using backticks:
!py script=`demisto.results("hello world")`
Use the Work Plan in an investigation
In Cortex XSIAM the Work Plan is a visual representation of the running playbook assigned to the issue. Playbooks enable you to automate many security processes, such as managing your investigations and handling tickets. Work Plans enable you to monitor and manage a playbook workflow, and add new tasks to tailor the playbook to a specific investigation.
In an investigation, when you open the Work Plan tab you can see the playbook, the playbook name, and navigation tools.
By default, the Follow checkbox is checked, which allows you to see the playbook executing in real-time. The playbook moves when a task is completed.
In the Work Plan you can do the following:
| Action | Description |
|---|---|
| Change the default playbook | On the left-hand side of the window, select the playbook you want to run. When changing the playbook, all completed tasks are removed and the new playbook will run. If you select playbooks several times you can view the history of which playbooks ran. |
| Rerun the playbook | When changing the playbook, select the current playbook to run again. |
| View inputs and outputs | View the inputs and outputs of each task that has run. You can't view inputs and outputs of any task that hasn't run. |
| Manage tasks | View, create, and edit a playbook task. For each task, you can do the following:
You can manage these tasks in the CLI by using the |
| Export to a PNG | Export the Work plan to a PNG format for easy analysis. |
Example: For a phishing investigation, after the initial playbook run parses the email and extracts email addresses, as part of the manual investigation, you could use the Email Address Enrichment - Generic v2.1 playbook as an ad-hoc playbook task to get more information about these email addresses.
The color coding and symbols in the Work Plan help you to easily troubleshoot errors or respond to manual steps. The following table displays the playbook tasks and icons in the Work Plan.
A playbook will not continue its execution path if a prior task has failed; you must resolve the failed task before subsequent tasks can run.
Playbook tasks and icons in the Work Plan
| Task | Description |
|---|---|
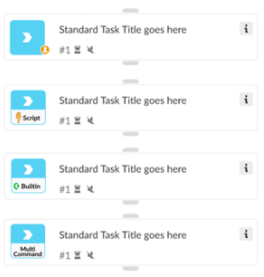 |
An arrow with a light blue square background indicates a standard manual task. The following are kinds of standard tasks.
|
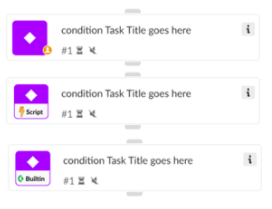 |
A diamond icon in a purple square background indicates a conditional task used as decision trees in your Work Plan. The following are kinds of conditional tasks.
|
|
The speech bubble in a turquoise background indicates a data collection task. This task prompts the receivers to respond to a multi-question form and submit replies, even if they are not Cortex users. A user icon ( |
|
The workflow icon in a blue background indicates that the task is a playbook nested within the parent playbook. You can view the playbook by opening the task and selecting Open sub-playbook. |
 | Task containing an error Scripts or sub-playbooks that have errors are designated by a red triangle. You need to open the script or sub-playbook to review the errors. |
 | Task containing a deprecated script or needs to be updated Scripts or sub-playbooks that have updates or are deprecated are designated by a yellow triangle. You need to update the scripts, integration commands, or sub-playbook tasks to their most current version. |
|
When a task is set to skip, the skip icon will be orange. |
|
When the Work Plan reaches a breakpoint, the task has an orange line at the top to indicate the breakpoint. |
|
When a task is set to have overridden inputs or outputs, the word Input or Output appears in orange. |
 |
When the Work Plan starts to run, all tasks that are about to be performed are gray. |
 |
A spinning circle inside the gray square indicates a running/in progress task. |
 |
The green square indicates a completed task. |
 |
The orange square indicates that the task is pending action. If you hover over the icon on the top left corner, details about the reason the task is in waiting mode appear. The user icon ( A speech bubble icon ( |
 | Failed task The red warning icon indicates that the task failed to complete as expected and requires manual inspection and troubleshooting. Contact your Cortex XSIAM administrator. If you hover on the icon on the top left corner, details about the specific problem appear. If a red warning icon is paired with the clock icon ( |
|
The task will look faded to indicate it was not executed. This can happen if this task was set to be skipped when an error occurs, or if it is in a branch that was not executed if a condition wasn’t met. |
 Standard manual task
 ) indicates the task requires manual inputs.
 Conditional task
 Data collection task / Communication task
 Sub-playbook task
 Set to skip
 Breakpoint
 Pending/in queue task
 Running/ in progress task
 Completed task
 Waiting task
 ) indicates the task is waiting for a questionnaire to be completed.
 ), the task’s SLA is overdue.
 Skipped task
Add ad-hoc tasks to the Work Plan
As part of your issue investigation, within the Work Plan you can create tasks for a specific iteration of a playbook. The task type can be an automation or another playbook. For example, within a manual task, you might need to enrich some data and run an investigation playbook.
When you create a task, add a name, automation, and description. The name and description should be meaningful so that the task corresponds to the data that you are collecting.
- In the Cases page, select the case to update.
- In the Issues & Insights tab, click the issue to add the task to and then click the Work Plan tab.
-
In the Work Plan, go to the task where you want to add a new task and click the + sign at the bottom right-hand corner of the task.
The ad-hoc task is added after the task you clicked.
- Select the task type.
- Standard: Runs a single automation.
-
Playbook: Runs a playbook to enhance the investigation.
The playbook functions as any playbook would and requires you to define the inputs and outputs, as well as any other details.
- Click Save.
- To run the Work Plan again click the Run Again icon.
Issue syncing
You can set up integrations that mirror Cortex XSIAM issues with external applications, such as Atlassian Jira or ServiceNow. When mirroring issues (also referred to as issue syncing), you can make changes in an external application that will be reflected in the platform, and vice versa. If an issue is mirrored with an external application, you have the following options:
- Link the ticket to the issue: If an issue is linked to a ticket, the ticket number is displayed in the Overview section of the issue card. You see details about the status of the ticket by clicking on the ticket number.
- Sync changes between the issue and the ticket: If an issue is synced to a ticket, changes are synchronized in an outbound, inbound, or bi-directional flow.
Multiple tickets can be linked to an issue with outbound syncing. Issues with inbound syncing can be linked to a single ticket only.
Set up an external integration to sync with issues
Before you can sync issues with external applications, you must set up and configure your integration instance. Complete the following steps:
Install the content pack.
- Install the relevant content pack, for example Atlassian Jira or ServiceNow:
- To install from the Data Sources & Integrations page: Navigate to Settings → Data Sources & Integrations, click + Add New, and search for the relevant content pack.
- To install from Marketplace: Navigate to Settings → Configurations → Marketplace. and browse for the relevant content pack.
Connect an integration instance.
- Navigate to Settings → Data Sources & Integrations.
- Search for the relevant data source (for example Atlassian Jira) select it, and click Add Instance.
- Enter instance details in the required fields and click Connect.
Manually create a synced ticket
Prerequisite
You must set up the following before you can sync issues:
- An external integration. For more information, see Set up an external integration to sync with issues.
- A sync profile. For more information, see Create a sync profile.
You can manually sync existing issues with external applications.
- From the Issues page, right-click an issue and select Run Automation → Select Automation.
- Under Quick Actions, select the action you want to configure, such as Create Jira Ticket or Create ServiceNow Ticket.
-
Define the required ticket parameters.
Note
Using issue fields as variables is not currently supported.
-
Under Using, select the name of the instance to execute the command.
Warning
If you leave this field blank, all configured instances will be used.
- Under Sync Configuration, the following options are displayed, depending on your selection:
- Link to issue: select this option if you want the issue to be linked to the created ticket. You must check this option if you want to sync the issue with the ticket.
- Sync Direction: select the syncing configuration:
- Inbound: Sync changes from the external ticket with the Cortex XSIAM issue.
- Outbound: Sync changes from the Cortex XSIAM issue with the external ticket.
- Bi-directional: Sync changes in both directions.
- None: Do not sync changes between the Cortex XSIAM issue with the external ticket. If you select this option, the tickets are still linked, but changes are not synced. You can update this option at any time to start syncing.
-
Define the inbound and/or outbound sync profiles.
Depending on the selected option, select sync profiles that define field mapping between the issue and the external ticket. You can use the default sync profiles or you can create custom profiles. For more information about sync profiles, see Create a sync profile.
Note
You can only define a single inbound profile. If you change the inbound sync profile the current profile is overwritten.
You can define multiple outbound profiles; one issue can update multiple tickets.
-
Click OK.
After ticket creation, the ticket number is shown in the Issue card. Click on the ticket number to see details about the created ticket and syncing configuration. In addition, the execution is recorded in the War Room tab. If there is a error in the requested action, you can see details in the audit.
- View or edit the syncing configuration. For more information, see View, update, or resolve a ticket below.
Example
The following example shows an automation run on an issue to create a ServiceNow ticket that is synced in an outbound flow with the ticket.
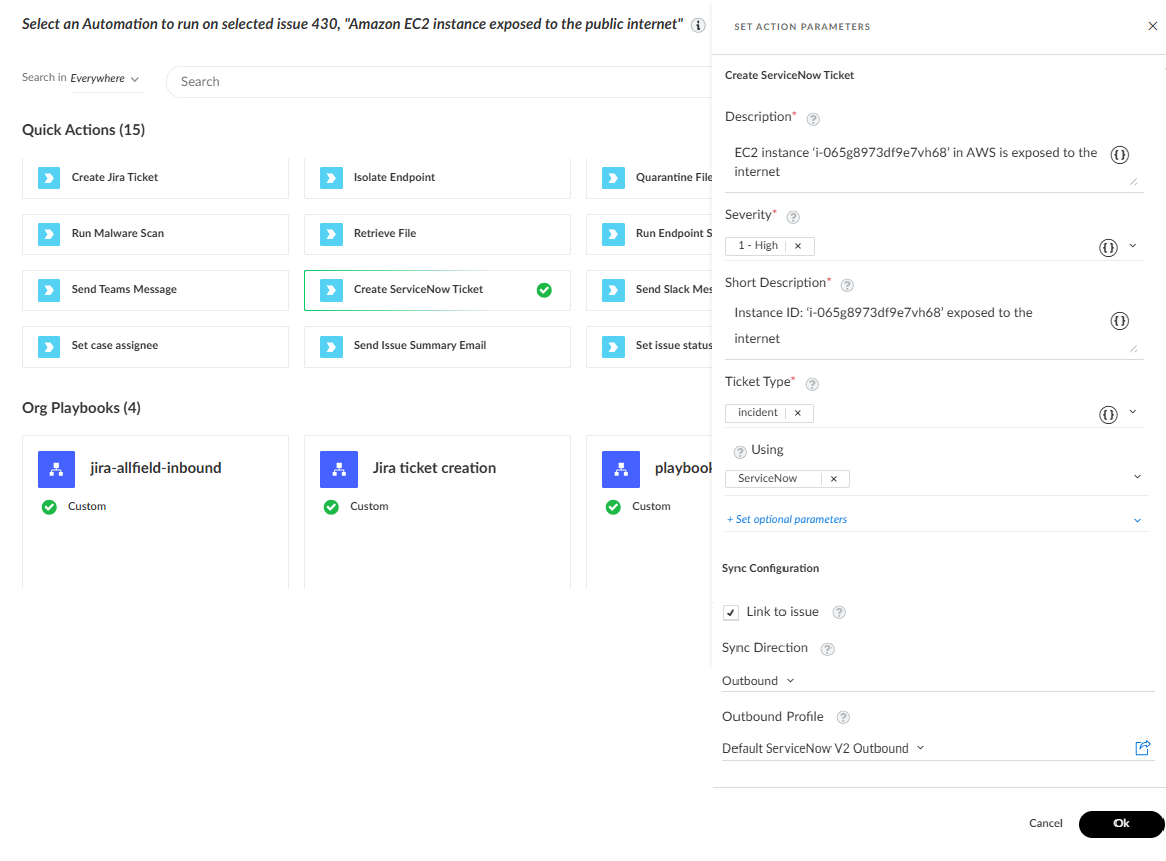
Create an automation rule for syncing issues with external tickets
Prerequisite
You must set up an integration before you can sync issues.
You can set up automation rules that create external tickets when certain issues occur and define the syncing configuration for transferring data between the issues and tickets.
- Go to Investigation & Response → Automation → Automation Rules.
- Click Add Automation Rule.
- Enter a name and description for the rule.
- Select whether to enable the rule after creation.
- Under Rule Conditions, define the WHEN, and IF conditions. For more information about rule conditions, see Create an automation rule.
- Under THEN select the desired automation, such as Create Jira Ticket and complete the following fields:
-
Define the required ticket parameters.
Note
Using issue fields as variables is not currently supported.
-
Under Using, select the name of the instance to execute the command.
Warning
If you leave this field blank, all configured instances will be used.
- Under Sync Configuration, the following options are displayed, depending on your selection:
- Link to issue: select this option if you want the issue to be linked to the created ticket. You must check this option if you want to sync the issue with the ticket.
- Sync Direction: select the syncing configuration:
- Inbound: Sync changes from the external ticket with the Cortex XSIAM issue.
- Outbound: Sync changes from the Cortex XSIAM issue with the external ticket.
- Bi-directional: Sync changes in both directions.
- None: Do not sync changes between the Cortex XSIAM issue with the external ticket. If you select this option, the tickets are still linked, but changes are not synced. You can update this option at any time to start syncing.
-
Define the inbound and/or outbound sync profiles.
Depending on the selected option, select sync profiles that define field mapping between the issue and the external ticket. You can use the default sync profiles or you can create custom profiles. For more information about sync profiles, see Create a sync profile.
Note
You can only define a single inbound profile. If you change the inbound sync profile the current profile is overwritten.
You can define multiple outbound profiles; one issue can update multiple tickets.
-
Click OK.
If a ticket is created, the ticket number is shown in the Issue card. You can click on the ticket number to see details about the created ticket and syncing configuration. In addition, the execution is recorded in the War Room tab. If there is a error in the requested action, you can see details in the audit.
-
-
Click Create.
The rule is added to the Automation Rules page. If required, drag to reorder the rules.
Example
The following example shows an automation rule that creates a Jira ticket with bi-directional syncing when a Critical Posture issue is triggered.
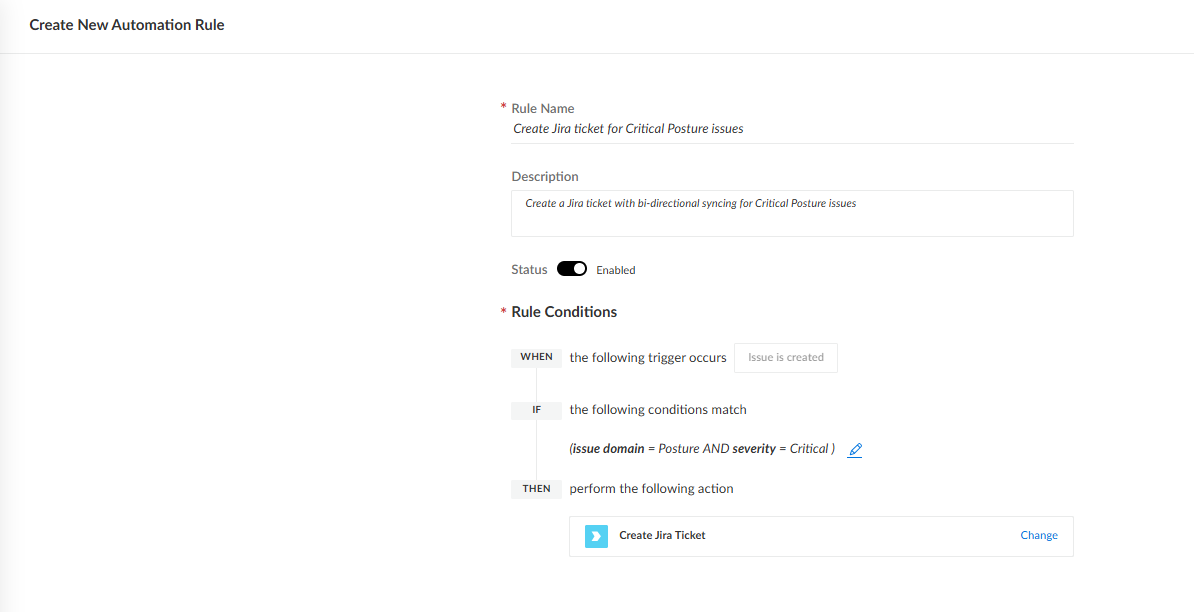
View, update, or resolve a ticket
Once you have set up ticket syncing, you can view, update and resolve the issue and external ticket as required The changes are reflected according to the defined syncing configuration.
-
To open the ticket details, in the Overview section of the issue card, click on the external ticket number.
A panel opens with details of the external ticket. You can see the external ticket number, the sync configuration, and details of the ticket.
- Open the linked ticket by clicking on the external ticket number in the panel.
-
Update the fields as required.
The updates are logged in the ticket history.
Note
- The inbound syncing flow runs every two minutes, and the outbound syncing flow runs every five minutes.
- In a bi-directional set-up, if the same field is updated in both tickets, the most recently updated value is used.
- In the external ticket, the logged history shows updates to the ticket. The user name that is logged with the history reflects the user token of the user who configured the data source.
-
Resolve the ticket.
Note
After an issue is resolved, ticket syncing remains active for up-to seven days. Therefore, you still update, change, or reopen the issue or external ticket and the tickets will continue to sync.
Edit or disable ticket syncing
You can change the syncing configuration between a ticket and an issue from the issue card.
-
In the Overview section of the issue card, click on the external ticket number.
A panel opens with details of the ticket.
- Click on the settings icon.
-
Under Sync Configuration, change the syncing configuration as required.
Note
If you change the selected inbound sync profile, the original sync profile is immediately overwritten.
- To disable ticket syncing, take one of the following actions:
-
To pause ticket syncing, set the Sync Direction value to None.
This temporarily stops the tickets from syncing, but the tickets are still linked. You can update the syncing configuration at any time to resume ticket syncing.
-
To unlink the tickets, uncheck Link to issue.
This action is not reversable.
-
- Click Save.
Limitations of issue mirroring
Consider the following limitations of issue mirroring:
- Issue syncing requires the latest version of Atlassian Jira (V3) and ServiceNow (V2).
- Issue syncing is currently supported in Atlassian Jira (V3) and ServiceNow (V2) only.
- You can sync up to 50K objects.
- You can create a maximum of 200 sync profiles.
- Up to 100 inbound syncs are supported across all synced tickets over a two-minute period. Any additional changes beyond this limit will not be synced.
- If a connector instance is deleted or disabled, tickets are no longer synced and external ticket information is not available.
- Custom statuses are not supported.
- Currently, a specific set of fields is supported.
Issue deduplication
To optimize issue management and reduce noise, Cortex XSIAM employs a deduplication (dedup) mechanism for specific agent-based issues.
What is deduplication?
Deduplication is the process of grouping identical security events that occur on the same endpoint within a specific timeframe. Instead of generating a new entry for every recurring instance of a threat, the system consolidates them into a single actionable issue.
Scope and conditions
Deduplication is strictly applied to issues where the issue_name contains WildFire or Local Analysis. All other issue types are processed individually and will not be deduped.
The deduplication key
The system generates a unique fingerprint or key for each incoming issue. If the key matches an existing active issue within the timeframe, the new event is deduped. The formula is as follows:
{agent_id}_{issue_name}_{hash_id}_{action_status}_{name}_{trigger}
Key components are resolved using a specific fallback hierarchy to ensure a match even if some data is missing:
| Component | Resolution Logic (Fallback Order) |
|---|---|
| hash_id | action_file_sha256 → action_process_image_sha256 → actor_process_image_sha256 |
| name | action_file_name → action_process_image_name → actor_process_image_name |
| action_status | Appended only if issue_action_status is present (e.g., Blocked, Detected). |
| trigger | The prevention trigger value from messageData.trigger (if present). |
Note
Issues are automatically excluded from deduplication if the agent_id is missing, the hash_id is missing, or the hash_id is an all-zero SHA256 string.
Time-to-live (TTL)
The deduplication window is 1 hour. This is a sliding window that starts from the ingestion of the first issue. Identical events arriving within this 60-minute buffer are suppressed; events arriving after the window expires will trigger a new issue.
How to find deduplicated issues
Deduplicated issues are often referred to as "hidden" issues because they do not appear as unique new rows in the issue table. Instead, they are aggregated into the initial "Parent" issue instance.
Locating suppressed events
To identify if an issue was suppressed by the dedup logic, search for the primary issue using the following criteria within a 1-hour window before the timestamp of the expected issue:
- Agent ID: Match the specific
agent_idof the endpoint. - Issue Name: Look for Local Analysis Malware or WildFire Malware.
- File Identification (Hash): Use the SHA256 hierarchy (Action File → Action Process → Actor Process).
- File/Process Name: Match the action_file_name or relevant process name.
- Action Status: Ensure the issue_action_status matches (if it was present on the event).
If you find an issue matching these criteria that occurred less than 60 minutes prior, the "missing" issue has been successfully deduped into that existing entry.
Causality view
The causality view provides an interactive visualization of a Causality Instance (CI) associated with an issue. On this view you can see the causality (cause and effect) of events of the entire process execution chain that led up to the issue. By automating the dot-connection process, Cortex XSIAM helps you to streamline your investigations by providing immediate, actionable insights into security issues and the related processes in the causality chain.
To open the casualty, right-click on an issue in the Cases or Issues pages. The causality view comprises the causality instance chain, Information overview, Forensics highlights, and the All Events table. Click on nodes on the causality chain to see details about each entity in the Information overview and All Events table. You can also take actions on the processes in the chain by clicking Actions or right-clicking a specific node.
Show me more
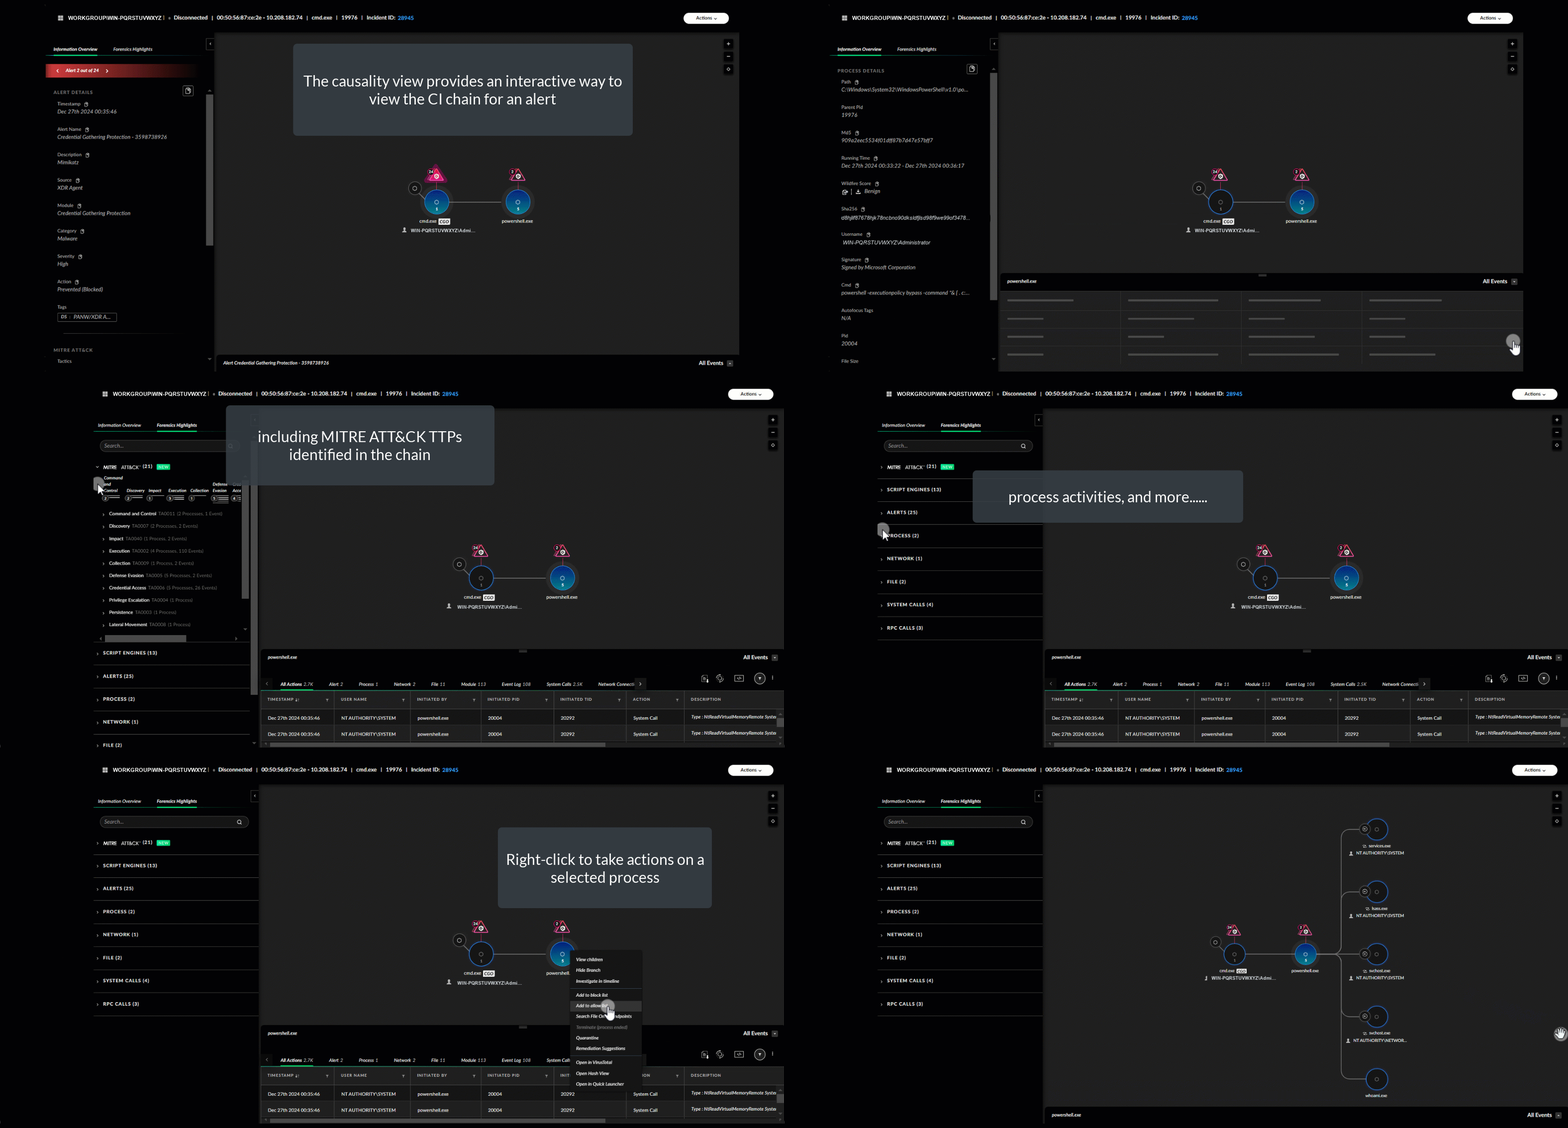
The following sections describe the different areas of the causality view:
Causality instance chain
Includes the graphical representation of the Causality Instance (CI), built from process nodes, events, and issues. The chain presents the process execution and might include events that the processes caused, and issues that were triggered by the events or processes.
The Causality Group Owner (CGO) is displayed on the left side of the chain. The CGO is the process that is responsible for all the other processes, events, and issues in the chain. You need the entire CI to fully understand why the issue occurred. The process node displays icons to indicate when an RPC protocol or code injection event was executed on another process from either a local or remote host.
 Injected Node
 Remote IP address
Causality data is displayed as follows:
- Visualization of the branch between the CGO and the actor process of the issue/event.
- Displays up to nine additional process branches that reveal issues related to the issue/event. Branches containing issues with the nearest timestamp to the original issue/event are displayed first.
- Causality cards that contain more causality data display a Showing Partial Causality flag. You can manually add additional child or parent processes branches by right-clicking on the process nodes displayed in the graph.
Navigation
You can move the chain, extend it, and modify it. To adjust the appearance of the CI chain, use the size controls on the right. You can also move the chain by selecting and dragging it. To return the chain to its original position and size, click  in the lower-right of the CI graph.
Identity Threat data
When the Identity Threat Module is enabled, Cortex XSIAM displays the anomaly that triggered the issue against the backdrop of baseline behavior for some issues. To see the profiles that are generated by the detector, Open Issue Visualization. Each tab displays the factors that triggered the issue, the event and the baseline information in tabular format or in timeline format, depending on the type of event. The graphs display the information in full mode, covering 30 days.
- The tabular view displays the baseline behavior in a table, with the anomaly highlighted and in a separate line.
- The timeline view displays the highlighted atypical value, and if applicable, the minimum, maximum, and average values, for the selected period.
Actions
Hover over a process node to display a Process Information pop-up listing useful information about the process. From any process node, you can also right-click to display additional actions that you can perform during your investigation:
- Show parents and children: If the parent is not presented by default, you can display it. If the process has children, Cortex XSIAM opens a dialog displaying the Children Process Start Time, Name, CMD, and Username details.
- Hide branch: Hide a branch from the causality view.
-
Add to block list or allow list, terminate, or quarantine a process: If after investigating the activity in the CI chain, you want to take action on the process, you can select the desired action to allow or block the process across your organization.
In the causality view of a Detection (Post Detected) type issue, you can also Terminate process by hash.
Information overview
Summarizes information about the selected node in the causality chain.
If you select an issue node, you can see the issue name, source, timestamp, severity, the action taken, the tags assigned to it, and MITRE ATT&CK tactics and techniques identified. If more than one issues is available, you can scroll through the related issues.
If you select a process node, you can see the path, parent Pid, Sha256, associated username, and MITRE ATT&CK details. You can also see the Wildfire Score and download the Wildfire report.
Forensics Highlights
Forensics Highlights serves as the central cockpit for investigating and navigating the entire causality view, offering a comprehensive breakdown of events, processes, and different activities to uncover and respond to potential threats with precision. In each section, you can click on data points to highlight the related process in the CI. Forensic Highlights includes the following sections:
- MITRE ATT&CK: Explore forensic insights aligned with the MITRE ATT&CK framework to correlate adversarial techniques with forensics data.
- Script Engines: Delve into detailed activity logs of script engines to uncover potential execution of malicious scripts and code.
- Issus: Gain clarity on triggered issues for the entire causality chain.
- Process: Investigate process activities to identify unusual behavior or unauthorized process executions.
- Network: Analyze forensic data related to network activities, highlighting potential threats in communication flows.
- File: Uncover file-related forensic evidence to pinpoint suspicious file operations or unauthorized access.
- Registry: Examine registry-level insights to detect tampering or malicious configuration changes.
- System Calls: Track low-level system call activities for signs of exploitation or atypical behavior.
- RPC Calls: Analyze RPC (Remote Procedure Call) forensic data to trace unauthorized remote operations.
All Events table
The All Events table displays up to 100,000 related events for the process node which matches the issue criteria that were not triggered in the issues table, but are informational. The Prevention Actions tab displays the actions Cortex XSIAM takes on the endpoint based on the threat type discovered by the agent.
To continue the investigation, you can perform the following actions from the right-click pivot menu:
- Add <path type> to malware profile allow list from the Process and File table. For example, target_process_path, src_process_path, file_path, or os_parent_path.
- For the behavioral threat protection results, you can take action on the initiator to add it to an allow list or block list, terminate it, or quarantine it.
- Revise the event results to see possible related events near the time of an event using an updated timestamp value to Show rows 30 days prior or 30 days after.
Tip
To view statistics for files on VirusTotal, you can pivot from the Initiator MD5 or SHA256 value of the file on the Files tab.
Identify AI processes in the causality chain
You can identify the use of AI tools in issues to quickly spot unapproved AI activity, data risks, or malicious AI deployments. The causality chain displays distinct AI badges on flagged processes across Windows and Mac endpoints.
Clicking an AI-tagged node opens the Access to AI tools detected section in the Information Overview, providing immediate visibility into the specific AI service name and its execution source.
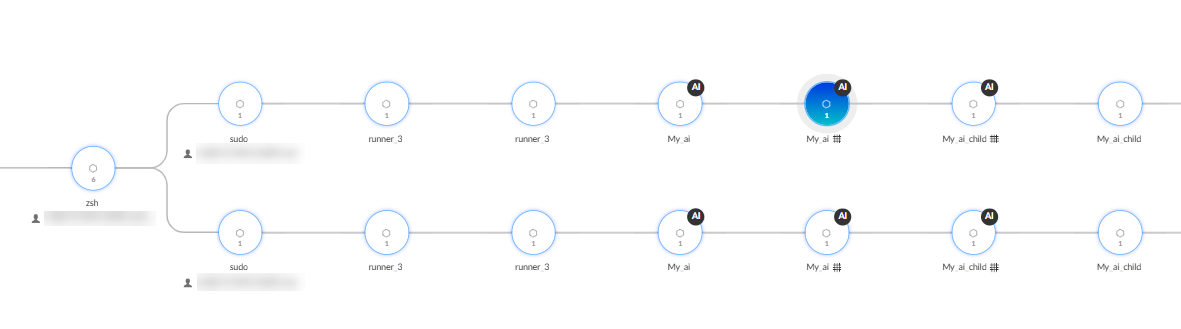
Network causality view
On the network causality view you can analyze and respond to stitched firewall and endpoint issues. On this view you can see the causality (cause and effect) of events of the entire process execution chain that led up to the issue. The network causality view presents the network processes that triggered the issue, generated by Cortex XSIAM, Palo Alto Networks next-generation firewalls, and supported sources, such as 3rd party network sources.
On each node in the CI chain, Cortex XSIAM provides information to help you understand what happened around the issue. The CI chain visualizes the firewall logs, endpoint files, and network connections that triggered issues connected to a security event.
Note
The network causality view displays only the information it collects from the detectors. It is possible that the CI may not show some of the firewall or agent processes.
The following sections describe the different areas of the network causality view:
Causality instance chain
Includes the graphical representation of the Causality Instance (CI) along with other information and capabilities to enable you to conduct your analysis.
The Causality View presents a CI chain for each of the processes and the network connection. The CI chain is built from process nodes, events, and issues. The chain presents the process execution and might also include events that these processes caused and issues that were triggered by the events or processes. The Causality Group Owner (CGO) is displayed on the left side of the chain. The CGO is the process that is responsible for all the other processes, events, and issues in the chain. You need the entire CI to fully understand why the issue occurred.
The color of a process node correlates to the WildFire verdict.
Navigation
You can move the chain, extend it, and modify it. To adjust the appearance of the CI chain, use the size controls on the right. You can also move the chain by selecting and dragging it. To return the chain to its original position and size, click in the lower-right of the CI graph.
Actions
Hover over a process node to display a Process Information pop-up listing useful information about the process. From any process node, you can also right-click to display additional actions that you can perform during your investigation:
- Show parents and children: If the parent is not presented by default, you can display it. If the process has children, Cortex XSIAM opens a dialog displaying the Children Process Start Time, Name, CMD, and Username details.
- Hide branch: Hide a branch from the causality view.
-
Add to block list or allow list, terminate, or quarantine a process: If after investigating the activity in the CI chain, you want to take action on the process, you can select the desired action to allow or block the process across your organization.
In the causality view of a Detection (Post Detected) type issue, you can also Terminate process by hash.
Information Overview
Summarizes information about the issue you are analyzing, including the host name, the process name on which the issue was raised, and the host IP address. For issues raised on endpoint data or activity, this section also displays the endpoint connectivity status and operating system.
Host isolation
You can choose to isolate the host, on which the issue was triggered, from the network or initiate a live terminal session to the host to continue investigation and remediation.
All Events table
Displays all related events for the process node which match the issue criteria that were not triggered in the issue table but are informational. You can also export the table results to a tab-separated values (TSV) file.
For the Behavioral Threat Protection table, right-click to add to allow list or block list, terminate, and quarantine a process.
Tip
To view statistics for files on VirusTotal, you can pivot from the Initiator MD5 or SHA256 value of the file on the Files tab.
Cloud causality view
On the cloud causality view you can analyze and respond to Cortex XSIAM issues and cloud audit logs. On this view you can see the causality (cause and effect) of events of the entire process execution chain that led up to the issue. The cloud causality view presents the event identity and /or IP address and the actions performed by the identity on the cloud resource. On each node in the CI chain, Cortex XSIAM provides information to help you understand what happened around the event.
The following sections describe the different areas of the cloud causality view:
Causality instance chain
Includes the graphical representation of the Causality Instance (CI) along with other information and capabilities to enable you to conduct your analysis.
The view presents a single event CI chain. The CI chain is built from Identity and Resource nodes. The Identity node represents for example keys, service accounts, and users, while the Resource node represents for example network interfaces, storage buckets, or disks. When available, the chain might also include an IP address and issue that were triggered on the Identity and Cloud Resource.
Causality data is displayed as follows:
- Identity node: Displays the name of the identity, generated issue information, and if available the associated IP address.
- IP address node: Displays the IP address associated with the Identity.
- Operations: Lists the type of operations performed by the identity on the cloud resources. Hover over the operation to display the original operation name as provided by the cloud Provider.
- Cloud resource node: Displays the referenced resource on which the operation was performed. For more information about cloud resource icons, see Key of cloud resource icons below.
Navigation
You can move the chain, extend it, and modify it. To adjust the appearance of the CI chain, use the size controls on the right. You can also move the chain by selecting and dragging it. To return the chain to its original position and size, click in the lower-right of the CI graph.
To further investigate the user
- Hover over an Identity node to display, if available, the identity Analytics Profiles.
- Select the Identity node to display in the Entity Data section additional information about the Identity entity.
- Select the issue icon to display additional information in the Forensic Highlights section.
To further investigate the resource
- Hover over a resource node to display, if available, the resource Analytics Profiles and Resource Editors statistics.
- Select the resource node to display in the Entity Data section additional information about the resource entity.
Information Overview
Summarizes information about the issue you are analyzing, including the type of Cloud Provider, Project, and Region on which the event occurred. Select View Raw Log to view the raw log as provided by the Cloud Provider in JSON format.
All Events table
Displays up to 100,000 related events and up to 1,000 related issues. In the All Events table, Cortex XSIAM displays detailed information about each of the related events. To simplify your investigation, Cortex XSIAM scans your Cortex XSIAM data aggregating the events that have the same Identity or Resource and displays the entry with an  aggregated icon. Right-click and select Show Grouped Events to view the aggregated entries.
Entries highlighted in red indicate that the specific event created an issue. To continue the investigation, right-click to View in XQL. To continue the investigation, in the Issues table, right-click an issue to see the available actions.
Key of cloud resource icons
The following table lists the cloud resource icons:
| Icon | Type of Resource |
|---|---|
 |
Compute instance resource |
 |
Disk resource |
 |
General resource |
 |
Image resource |
 |
Network interface resource |
 |
Security group (FW rule) resource |
 |
Storage bucket resource |
 |
Virtual private cloud (VPC) resource |
Cloud causality view for audit log issues
The Cloud causality view presents entity context directly within Cortex XSIAM issues, enabling security analysts to triage and scope cloud incidents in a single location. It displays the following context for a cloud audit log issue:
- Caller IP and network intelligence: The network origin, scope, and reputation of the action.
- Identity information: The acting identity profile, authentication behavior, and access privileges.
- Target cloud asset details: Identifies the specific cloud asset(s) affected by this issue.
In this context, you can see who acted, how the identity was authenticated, what the identity accessed, and where the action originated, without switching tools.
The Cloud causality view shows cloud audit log issues as a source-to-destination graph, linking the identity or caller IP that initiated an action to the affected cloud asset. Cortex XSIAM surfaces this context directly in the UAI by consolidating provider audit logs (Amazon Web Services CloudTrail, Microsoft Azure Activity Logs, and Google Cloud Platform Audit Logs).
The Cloud causality view presents cloud context for investigation and does not modify cloud provider configuration. From a case, drill down to a cloud audit log issue to open the Cloud causality view for that issue.
When the UAI does not resolve an asset for an identity or a cloud resource, the Cloud causality view derives the displayed name from the cloud audit log.
Use cases
- Investigate the identity behind a cloud action: Select the identity node in the Cloud causality view to determine who performed the action and how the identity authenticated, and drill down to the identity name, identity type, cloud provider, and the identity that invoked the action.
- Trace the origin of a cloud action: Select the caller IP node in the Cloud causality view to establish where the action originated, and drill down to the caller IP address, autonomous system number, and geolocation.
- Assess the impact on a cloud resource: Select the destination node in the Cloud causality view to identify the affected cloud resource, and drill down to the resource name, referenced resource ID, resource type, and resource subtype.
- Focus the investigation on a single entity: Select a node in the Cloud causality view to filter the bottom table to the issues related to the selected node, and review the related events with fields such as timestamp, cloud provider, project, region, identity name, and identity type.
- Pivot to the full asset record: For an identity or a cloud resource that resolves to a Unified Assets Inventory (UAI) asset, open the asset card from the node to investigate the asset across the inventory, and review the identity and target cloud asset as the affected assets of the issue.
Supported platforms
The Cloud causality view supports cloud audit log issues and cases from the following cloud providers:
- Amazon Web Services
- Microsoft Azure
- Google Cloud Platform
User roles and permissions
The Cloud causality view is available to users whose role grants access to issues and to cloud audit log data.
Node types
Each node type displays relevant details for your investigation, all conveniently accessible within a single window.
The Cloud causality view provides the caller IP node, identity node, and the destination node.
Caller IP node
Select the caller IP node in the Cloud causality view to display the caller IP overview in the left panel. The caller IP overview establishes where the action originated.
The caller IP overview includes the following information.
| Field | Description |
|---|---|
| Caller IP | Identifies the source IP address that acted. |
| Caller IP ASN | Specifies the autonomous system number associated with the caller IP address. |
| Caller IP geolocation | Indicates the geographic location associated with the caller IP address. |
Identity node
Select the identity node in the Cloud causality view to display the identity overview in the left panel. The identity overview presents the acting identity and the identity that invoked the action, so you can determine the actor and the authentication context in a single view.
The identity overview includes the following information.
| Field | Description |
|---|---|
| Identity name | Specifies the human-readable identifier used to track the identity across cloud audit logs. |
| Identity type | Indicates the nature of the identity: User, Service, or Resource. |
| Identity sub type | Defines the provider-specific classification of the identity |
| Cloud provider | Identifies the ecosystem where the identity is defined and managed, such as Amazon Web Services, Google Cloud Platform, Microsoft Azure, or Oracle Cloud Infrastructure. |
| Identity invoke by name | Displays the name of the identity that invoked the action. |
| Identity invoke by type | Indicates the type of identity that invoked the action. |
| Identity invoked by sub type | Specifies the subtype of the identity that invoked the action. |
| User agent | Details the client and operating system family used to act. |
Additional identity context, such as administrative privilege and multi-factor authentication status, is sourced from the UAI and is available when a UAI asset resolves for the identity.
Destination node
Select the destination node in the Cloud causality view to display the target cloud asset overview in the left panel. The destination node represents the cloud resource affected by the action, so you assess the impact of the issue or case without opening the cloud inventory.
The target cloud asset overview includes the following information.
| Field | Description |
|---|---|
| Resource name | Displays the name of the affected cloud resource. |
| Referenced resource ID | Identifies the cloud provider identifier of the affected resource. |
| Resource type | Indicates the category of the affected cloud resource. |
| Resource sub type | Defines the provider-specific classification of the affected cloud resource. |
When a UAI asset resolves for the source or destination node, the Cloud causality view displays the UAI panel for that node.
All events table
Select a node in the Cloud causality view to filter the bottom table to the issues related to the selected node. Cancel the node selection to return the bottom table to the unfiltered view.
UAI connection
When an identity or a target cloud asset in a cloud audit log issue resolves to an asset in the Unified Assets Inventory (UAI), the Cloud causality view connects the node to that asset. The connection aligns the investigation view with the inventory, so you access the complete asset record without searching the inventory separately. The Cloud causality view connects a node only when the identity or the target cloud asset resolves to an existing UAI asset, and the connection provides navigation and context for investigation without creating or modifying UAI assets.
The Cloud causality view provides the following connections for a node that resolves to a UAI asset:
- Node name: The node displays the name recorded in the UAI, so the entity in the Cloud causality view matches the entity in the inventory.
- Asset details: Selecting the node displays the UAI details for the asset in the left panel.
- Asset card: Right-clicking the node and selecting the Open Asset Card action opens the asset card for the corresponding UAI asset.
For an issue, the identity and target cloud asset that resolve to UAI assets are recorded as the affected assets of the issue and link to the corresponding UAI assets.
When the UAI does not resolve an asset for a node, the node displays the name derived from the cloud audit log and does not link to a UAI asset.
SaaS causality view
The SaaS causality view provides a powerful way to analyze and investigate software-as-a-service (SaaS) related issues for audit stories, such as Office 365 audit logs and normalized logs, by highlighting the most relevant events and issues associated with a SaaS-related issue. To help you identify and investigate SaaS-specific data associated with SaaS-related issues and SaaS audit logs, Cortex XSIAM displays a SaaS causality view, which enables you to swiftly investigate a SaaS issue by displaying the series of events and artifacts that are shared with the issue.
A SaaS causality view is only available when Cortex XSIAM is configured to collect SaaS audit logs and data. For example, this is possible by configuring an Office 365 data collector or Google Workspace data collector with the applicable SaaS audit logs. This enables you to investigate any Cortex XSIAM issue generated from any IOC, BIOC, or correlation rules, including SaaS events. The SaaS causality view is available from the Issues table, or from the Query Results after running a query on the SaaS related data. From both places, you can right-click to pivot to the SaaS causality view.
The scope of the SaaS causality view is the Causality Instance (CI) of an event to which this issue pertains. The SaaS causality view presents the event identity and /or IP address and the actions performed by the identity on the SaaS resource. On each node in the CI chain, Cortex XSIAM provides information to help you understand what happened around the event.
The SaaS causality view contains the following sections:
Information Overview
Summarizes information about the issue you are analyzing, including the type of SaaS provider, project, and region on which the event occurred. Select View Raw Log to view the raw log as provided by the SaaS provider in JSON format.
SaaS causality instance chain
Includes the graphical representation of the SaaS Causality Instance (CI) along with other information and capabilities to enable you to conduct your analysis.
The SaaS causality view presents a single event CI chain. The CI chain is built from Identity and Resource nodes. The Identity node represents for example keys, service accounts, and users, while the Resource node represents for example network interfaces, storage buckets, or disks. When available, the chain can also include an IP address and issues that were triggered on the Identity and SaaS resource.
- Identity node: Displays the name of the identity, generated issue information, and if available the associated IP address.
- IP address node: Displays the IP address associated with the Identity.
- Resource node: Displays the referenced resource on which the operation was performed. Cortex XSIAM displays information on the following resources.
Navigation
You can move the chain, extend it, and modify it. To adjust the appearance of the CI chain, use the size controls on the right. You can also move the chain by selecting and dragging it. To return the chain to its original position and size, click in the lower-right of the CI graph.
To further investigate the user
- Hover over an Identity node to display, if available, the identity Analytics Profiles.
- Select the Identity node to display in the Entity Data section additional information about the Identity entity.
- Select the issue icon to display additional information in the Forensics Highlights tab.
To further investigate the resource
- Hover over a Resource node to display, if available, the resource Analytics Profiles and Resource Editors statistics.
- Select the Resource node to display in the Entity Data section additional information about the Resource entity.
All Events table
Displays up to 100,000 related events and up to 1,000 related issues. In the All Events table, Cortex XSIAM displays detailed information about each of the related events. To simplify your investigation, Cortex XSIAM scans your Cortex XSIAM data aggregating the events that have the same Identity or Resource and displays the entry with an aggregated icon. Right-click and select Show Grouped Events to view the aggregated entries.
Entries highlighted in red indicate that the specific event created an issue. To continue the investigation, right-click to View in XQL. To continue the investigation, in the Issues table, right-click an issue to see the available actions.
Key of SaaS resources
The following table lists the SaaS resource icons:
| Icon | Type of resource |
|---|---|
 | Google Workspace Admin Console |
 | Google Workspace for Google Drive |
 | Microsoft Office 365 Exchange Online |
 | Microsoft 365 Office Groups |
 | Microsoft Office 365 OneDrive |
 | Microsoft Office 365 SharePoint Online |
 | Microsoft Office 365 Skype for Business |
 | Microsoft Office 365 Teams |
Timeline
The Timeline provides a forensic timeline of the sequence of events, issues, and informational BIOCs, and correlation rules involved in an attack. While the causality view of an issue surfaces related events and processes that Cortex XSIAM identifies as important or interesting, the Timeline displays all related events, issues, and informational BIOCs and correlation rules over time.
Note
The Timeline view is not available when investigating cloud Cortex XSIAM issues and cloud audit logs or SaaS-related issues for 501 audit events, such as Office 365 audit logs and normalized logs. Only the applicable cloud causality view and SaaS causality view is available for this data.
The Timeline comprises the following parts:
CGO and process instances that are part of the CGO
Cortex XSIAM displays the Causality Group Owner (CGO) and the host on which the CGO ran in the top left of the timeline. The CGO is the parent process in the execution chain that Cortex XSIAM identified as being responsible for initiating the process tree. In the example above, wscript.exe is the CGO and the host it ran on was HOST488497. You can also click the blue corner of the CGO to view and filter related processes from the Timeline. This will add or remove the process and related events or issues associated with the process from the Timeline.
Timespan
By default, Cortex XSIAM displays a 24-hour period from the start of the investigation and displays the start and end time of the CGO at either end of the timescale. You can move the slide bar to the left or right to focus on any time-gap within the timescale. You can also use the time filters above the table to focus on set time periods.
Activity
Depending on the type of activities involved in the CI chain of events, the activity section can present any of the following three lanes across the page:
- Issues: The issue icon indicates when the issue occurred.
- BIOCs and correlation rules: The category of the issue is displayed on the left (for example tampering or lateral movement). Each BIOC event also indicates a color associated with the issue severity. An informational severity can indicate something interesting has happened but there were not any triggered issues. These events are likely benign but are byproducts of the actual issue.
- Event Information: The event types include process execution, outgoing or incoming connections, failed connections, data upload, and data download. Process execution and connections are indicated by a dot. One dot indicates one connection while many dots indicates multiple connections. Uploads and Downloads are indicated by a bar graph that shows the size of the upload and download.
The lanes depict when the activity occurred and provide additional statistics that can help you investigate. For BIOC, correlation rules, and issues, the lanes also depict activity nodes, highlighted with their severity color: high (red), medium (yellow), low (blue), or informational (gray), and provide additional information about the activity when you hover over the node.
Related events, issues, and informational BIOCs
Cortex XSIAM displays up to 100,000 issues, BIOCs and Correlation Rules (triggered and informational), and events. Click on a node in the activity area of the Timeline to filter the results. You also can create filters to search for specific events.
Causality icons key
The following tables describe the causality chain icons in Cortex XSIAM, broken down by type:
Action icons
Causality action icons mark the actions that were taken on a process or event. Pending actions are shown with a dotted line.
| Icon | Description |
|---|---|
  |
Blocklist |
  |
Quarantine |
  |
Allowlist |
Causality alert icons
Causality alert icons indicate the type of alert that was triggered.
| Icon | Description |
|---|---|
 |
3rd party |
 |
XDR Agent |
 |
Analytics |
 |
BIOC |
 |
Firewall |
 |
General alert |
 |
Identity analytics |
 |
IOC |
Examples
A number next to the alert icon indicates that there are multiple alerts. This icon show that there are three alerts and the selected alert is a BIOC alert. You can scroll through the alerts in the Information Overview.
This example shows AI activity from the Microsoft Copilot was detected.
Cloud event icons
Cloud event icons indicate the type of cloud event or process.
| Icon | Description |
|---|---|
 |
Cloud admin |
 |
Compute disks |
 |
Compute instances |
 |
Container escaped |
 |
Drive |
 |
Exchange |
 |
General resource |
 |
Groups |
 |
Images |
 |
Network |
 |
Onedrive |
 |
Security groups- FW rules |
 |
Sharepoint |
 |
Skype |
 |
Storage buckets |
 |
Subnets |
 |
Teams |
 |
VPCs |
Event icons
Event icons indicate the type of activity that occurred.
| Icon | Description |
|---|---|
 |
AI activity |
 |
DotNet |
 |
Event log |
 |
File |
 |
Firewall |
 |
Host |
 |
Host group |
 |
Identity analytics |
 |
Internet |
 |
Malware |
 |
Mobile |
 |
Module load |
 |
Multi-user |
 |
Network |
 |
Potential prevention |
 |
Range |
 |
Registry |
 |
TCP Protocol |
 |
Server |
 |
Unknown event |
 |
User session |
 |
VOIP |
 |
VPN |
Left node icons
Left node icons provide additional information about a process.
| Icon | Description |
|---|---|
 |
Injected node |
 |
Last actor |
 |
Remote terminal session |
 |
RPC |
 |
Unknown process |
Node icons
Node icons indicate the type of process or event that occurred in the chain.
| Icon | Description |
|---|---|
| Adobe | |
 |
Attachment |
 |
Chrome |
 |
Remote IP Address |
 |
|
 |
Endpoint |
 |
Excel |
 |
Firefox |
 |
Generic process |
 |
Internet Explorer |
 |
IP address |
 |
Link |
 |
mySQL |
 |
Outlook |
 |
Powerpoint |
 |
Putty |
 |
Sender |
 |
Unknown |
 |
User |
 |
Word |
Other icons
| Icons | Description |
|---|---|
 |
Benign |
 |
Container |
 |
Causality Group Owner (CGO). |
 |
Default |
 |
Grayware |
 |
In-evaluation |
 |
Malware |
 |
Quarantine |
 |
Still running |
 |
Unknown sample |
 |
User |
 |
WF download |
 |
WF download unsuccessful |
Examples
The following example shows a XDR Agent alert was triggered on a File.
In this example, a NGFW alert was triggered on a TCP Protocol that called a remote IP address, that created an unknown process.
In this example, the highlighted process node represents the real parent that executed the process. Click on the node for more details about the parent process. The pen icon on the first process nodes indicates that this process is "last actor". The syringe icon on the last process node indicates that this process is an "injected node".
In this example, two alerts were triggered on an email that was sent to two recipients and included attachments and links.
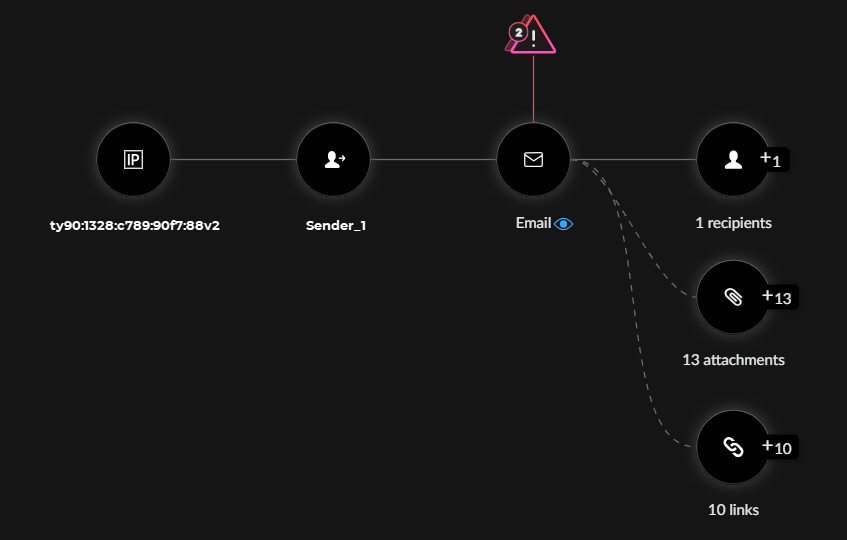
Issue investigation actions
The following topics explain different actions you can take on issues in Cortex XSIAM.
- copy-issues
- analyze-an-issue
- update-issue-fields
- query-case-and-issue-data
- exclude-an-issue
- create-a-featured-field
- export-issue-details-to-a-file
- investigate-contributing-events
- retrieve-additional-issue-details
- view-generating-bioc-or-ioc-rule
- create-profile-exceptions
- add-a-file-path-to-a-malware-profile-allow-list
- close-an-issue
Copy issues
You can copy issue text into memory and paste it into an email. This is helpful if you need to share or discuss a specific issue with someone. If you copy a field value, you can also paste it into a search or begin a query.
How to copy an issue value
- From the Issues page, right-click the issue you want to send.
-
Select one of the following options: .
- Copy text to clipboard
- Copy entire row
- Copy issue URL
Cortex XSIAM saves the copied text to memory.
- Paste the URL into an email or use it as needed to share the information.
Analyze an issue
To help you understand the full context of an issue, Cortex XSIAM provides the issue card and the causality view to help you to quickly make a thorough analysis of the issue.
The causality view is available for XDR agent issue that are based on endpoint data and for issues raised on network traffic logs that have been stitched with endpoint data. In addition, you can use the cloud causality view to analyze cloud Cortex XSIAM issues and cloud audit logs. While the SaaS causality view enables you to analyze and investigate software-as-a-service (SaaS) related issues for audit stories, such as Office 365 audit logs and normalized logs.
How to view issue analysis
- From the Issues table, click in issue to open the issue card, or right-click an issue and select and select Investigate Causality Chain.
- Review the chain of execution and available data for the process and, if available, navigate through the process tree.
Update issue fields
You can update issue fields by running the setIssue and setIssueStatus commands in the CLI, in a script, or a playbook task in Cortex XSIAM.
-
setIssue: Sets values for specific issue fields. The supported fields are presented in the list of arguments.Examples of the setIssue command in the CLI
The following examples show how to run the
setIssuecommand in the CLI. You can run CLI commands in the War Room. When you start typing the CLI provides the available options and if you select an enum field, the CLI provides the available values.-
To change the issue severity to
high, run!setIssue severity=high
-
To change the issue severity to
highand star the issue, run!setIssue severity=high starred=true
-
-
setIssueStatus: Sets the status or resolution value for an issue. This command supports thestatusargument, which presents a list of status and resolution type values. The selected status is set in thecustom_statusfield.If you specify a resolution status, the issue is closed and the
resolution_statusandcloseReasonfields are updated to the same value as thecustom_statusfield. If you specify a New, Reopened, or Under Investigation status, the issue remains open and theresolution_statusandcloseReasonfields are empty.Tip
You can create custom issue statuses and resolution reasons, and use the
setIssueStatuscommand to set these custom statuses for issues.For example, when a user starts investigating an issue, the issue status is automatically changed from New to Under Investigation. In some cases, it is useful to create an interim status, such as Triage. After you create the custom status, the new status will be available for selection. To create a custom status, follow the instructions in Create custom case statuses and resolution reasons.
Examples of using the setIssueStatus command in the CLI
The following examples show how to run the
setIssueStatuscommand in the CLI. You can run CLI commands in the War Room. When you start typing, the CLI provides the available options and if you select an enum field, the CLI provides the available values.-
To change the issue status to
Resolved - Known Issue, run!setIssueStatus status="Resolved - Known Issue"
-
To change the issue status to custom status
Triage, run!setIssueStatus status=Triage
You must create a custom status before you can select it.
Example of using the setIssueStatus command in a playbook
The following example shows how the
setIssueStatuscommand can be used in a playbook task. In this example, the task sets a custom issue status (Triage). The custom issue status was created before setting up the playbook.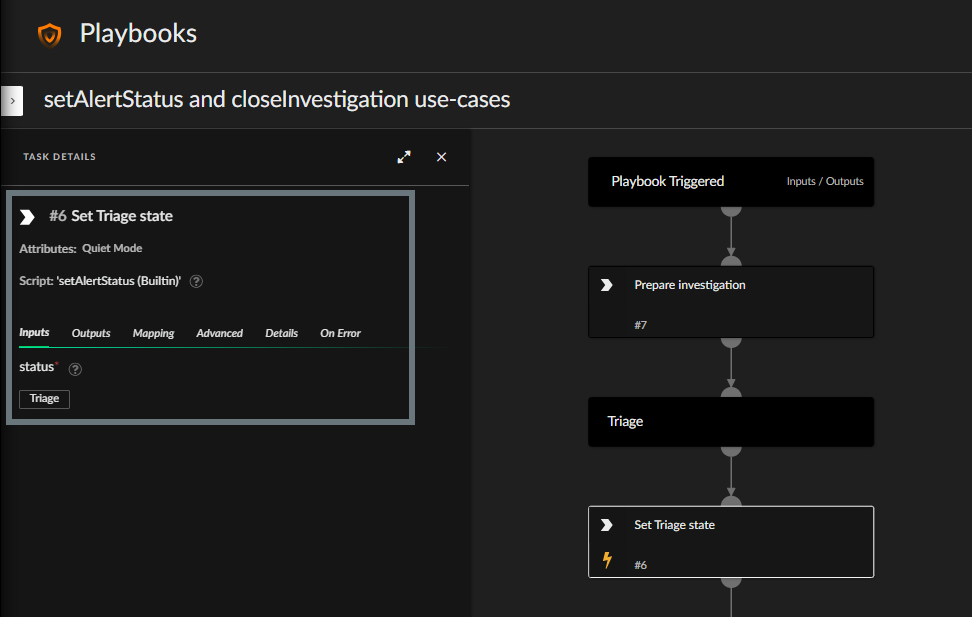
-
Query case and issue data
Cortex XSIAM uses Cortex Query Language (XQL) as the primary language for searching, analyzing, and transforming security data. XQL allows for highly efficient querying across vast amounts of security telemetry, such as:
- Threat hunting: Proactively search your entire environment for malicious activity, anomalies, and indicators of compromise (IOCs). Formulate queries to look for specific patterns of behavior that might indicate an ongoing attack, even if no alert has been triggered.
- Investigation: When a case or issue is generated, XQL allows security analysts to drill down into the underlying data, understand the full scope of an attack, identify affected assets, and trace the attacker's actions.
- Forensics: Extract detailed information about past events for post-incident analysis and compliance audits.
- Reports and dashboards: Create custom reports and dashboards to visualize security posture, track key metrics, and communicate insights to stakeholders.
To view and use sample investigative queries, such as the Top Unresolved High Severity Cases query, go to Investigation & Response → Search → Query Builder → XQL → Query Library. For more information about using XQL, see Cortex XSIAM XQL.
You can query case and issue data in the cases and issues datasets. When using the issues dataset, keep in mind the following:
- Informational issues are not included in this dataset.
- Issue fields are limited to certain fields available in the API. For the full list, see Create a new issue.
The issues dataset is categorized by domain. To query only security issues, use the following XQL:
dataset = issues | filter issue_domain = "SECURITY"
To query only posture issues, use the following XQL:
dataset = issues | filter issue_domain = "POSTURE"
Exclude an issue
During the process of triaging and investigating issues, you might determine that an issue does not indicate threat. You can choose to exclude the issue, which hides the issue, excludes it from cases, and excludes it from search query results.
You can also set up issue exclusion rules that automatically exclude issues that match certain criteria. For more information, see Issue exclusions.
Cortex XSIAM supports exclusion of up to 100,000 issues.
How to exclude an issue
- From the Issues page, locate the issue you want to exclude.
-
Right-click the row, and select Manage Issue → Exclude Issue.
A notification displays indicating the exclusion is in progress.
Create a featured field
To help you to track issues involving specific hosts, users, and IP addresses, you can label specific issue attributes as featured fields. Issues that contain a matching featured field value are identified with a  flag in the Name field of the Issues table. After setting up featured fields, you can use them filter the Issues table and to create case scoring rules.
Featured Active Directory values are displayed in the User and Host fields accordingly.
How to create a featured field in Cortex XSIAM
- Go to Cases & Issues → Case Configuration → Featured Fields and select a type of featured field.
- Click Add featured <field-type> and select one of the following options:
-
Create New
To create a new featured field from scratch, enter one or more field-type values and click Add.
-
Upload from File
To upload field values from a CSV file, upload your file and click Import. Click Download example file to ensure you are using the correct format.
-
-
Find issues containing featured fields.
In the Issues table, use the Contains Featured filters.
- (Optional) Create a case scoring rule using the Contains Featured fields to further highlight and prioritize issues containing the Host, User, and IP address attributes.
Export issue details to a file
To archive, continue investigation offline, or parse issue details, you can export issues to a tab-separated values (TSV) file:
- From the Issues page, adjust the filters to identify the issues you want to export.
-
When you are satisfied with the results, click the download icon (
 ).
).The icon is grayed out when there are no results.
Cortex XSIAM exports the filtered result set to the TSV file.
To ensure fast, reliable downloads, you can export a maximum of 50k issues per export.
Investigate contributing events
When investigating an issue generated by a correlation rule, you can view all of the events created for the issue. You can have up to 1000 events per correlation rule.
In addition, if the correlation rule includes a drilldown query you can run the query in the Query Builder. The drilldown query provides additional information about an issue for further investigation.
How to investigate contributing events in Cortex XSIAM
- From the Issues table, locate an issue created by a correlation rule.
- Right-click the row, and select Manage Issue → Investigate Contributing Events.
-
(Optional) Open the drilldown query, if available.
Right-click the row and select Manage Issue → Open Drilldown Query.
The drilldown query can accept parameters from the issue output for the correlation rule. In addition, the issue time frame used to run the drilldown query provides more details about the issue generated by the correlation rule. The time frame is the minimum and maximum timestamps of the events for the issue. If there is only one event, the event timestamp is the time frame used for the query.
Retrieve additional issue details
To help you with issue analysis, Cortex XSIAM can provide related files and memory content analysis.
- From the Issues page, locate the issue for which you want to retrieve information.
- Right-click anywhere in the issue, and select one of the following options:
- Retrieve Additional Data: Cortex XSIAM can provide related files and additional analysis of the memory contents when an exploit protection module raises an issue.
- Select Retrieve issue data and analyze to retrieve issue data consisting of the memory contents at the time the issue was raised. You can also enable Cortex XSIAM to automatically retrieve issue data for every relevant issue. After Cortex XSIAM receives the data and performs the analysis, it issues a verdict for the issue. You can monitor the retrieval and analysis progress from the Action Center (pivot to view Additional data). When the analysis is complete, it displays the verdict in the Advanced Analysis field.
- Retrieve related files: To further examine files that are involved in an issue, you can request the agent send them to the Cortex XSIAM tenant. If multiple files are involved, the tenant supports up to 20 files and 200MB in total size. The agent collects all requested files into one archive and includes a log in JSON format containing additional status information. When the files are successfully uploaded, you can download them from the Action Center for up to one week.
-
Pivot to views → View in source system: For issues ingested from third-party vendors, this option pivots to the issue in the third-party system.
To enable this feature, ensure that Cortex XSIAM has a correlation rule that contains the External URL field. For more information, refer to Create a correlation rule.
- (For PAN NGFW source type issues) Download triggering packet: Download the session PCAP containing the first 100 bytes of the triggering packet directly from Cortex XSIAM. To access the PCAP, you can download the file from the Issues table, Cases, or Causality view.
- Retrieve Additional Data: Cortex XSIAM can provide related files and additional analysis of the memory contents when an exploit protection module raises an issue.
- Navigate to Investigation & Response+Response → Action Center to view the retrieval status.
-
Download the retrieved files locally.
In the Action Center, wait for the data retrieval action to complete successfully. Then, right-click the action row and select Additional Data. From the Detailed Results view, right-click the row and select Download Files. A ZIP folder with the retrieved data is downloaded locally.
Tip
If you require assistance from Palo Alto Networks support to investigate the issue, make sure to provide the downloaded ZIP file.
View generating BIOC or IOC rule
You can easily view and edit the BIOC and IOC rules that generated issues directly from the Issues table in Cortex XSIAM:
- From the Issues page, locate issues with Detection methods: XDR BIOC and XDR IOC.
-
Right-click the row, and select Manage Issue → View generating rule.
Cortex XSIAM opens the BIOC rule that generated the issue in the BIOC Rules page. If the rule has been deleted, an empty table is displayed.
- Review the rule, if necessary, right-click to perform available actions.
Create profile exceptions
For Cortex XDR agent related issues, you can create profile exceptions for Window processes, BTP, and JAVA deserialization issues directly from the Issues table in Cortex XSIAM.
- Identify an XDR Agent issue which has a category of Exploit, right-click and select Manage Issue → Create issue exception.
- Select an Exception Scope:
- Global: Apply the exception across your organization.
- Profile: Apply the exception to an existing profile or click and enter a Profile Name to create a new profile.
- Click Add to add the scope.
- (Optional) View your profile exceptions.
- Go to Inventory → Endpoints → Policy Management → Profiles.
- In the Profiles table, locate the OS in which you created your global or profile exception and right-click to view or edit the exception properties.
Add a file path to a malware profile allow list
Requires Cortex XSIAM Enterprise, Premium, or any other XSIAM license that includes endpoints or Cortex Cloud Runtime Security.
During investigation, if you deem a file path to be safe, you can add the file path to an existing malware profile allow list directly from the Issues table.
- In the Issues table, select the Initiator Path, CGO path, and/or File Path field values you want to add to your malware profile allow list.
- Right-click and select Add <path type> to malware profile allow list.
- In the Add <path type> to malware profile allow list dialog, select from your existing Profiles and Modules to which you want to add the file path to the allow list.
- (Optional) View your Malware profile allow list.
- Go to Inventory → Endpoints → Policy Management → Prevention → Profiles and locate the malware profile you selected.
- Right-click, select Edit Profile and locate in the Files / Folders in Allow List section the path file you added.
For more information about malware prevention profiles, see Set up malware prevention profiles.
Close an issue
Once you complete your investigation, perform one of the following actions to close a Cortex XSIAM issue:
- Manually close an issue: Right-click an issue and select Change Status → Resolved and select a resolution reason.
- Automatically close an issue: Run the
closeInvestigationcommand in the CLI, in a script, or a playbook task. You can configure this command to run as part of a flow when automating issue investigation.
The closeInvestigation command supports the closeReason and closeNotes arguments. The closeReason argument accepts a free text value; however, if the free text value doesn't match one of the defined resolution reasons the resolution_status field is set to Resolved - Other. To see a description of the resolution reasons, see Resolution reasons for cases and issues.
When an issue is resolved it remains linked to a case. Once all of the issues in a case are resolved, the case is automatically closed.
Example of using the closeInvestigation command in the CLI
In this example, the command specifies to close the issue and set values for closeReason and closeNotes.
!closeInvestigation closeReason="Resolved - Known Issue" closeNotes= "Mitigated"
Example of using the closeInvestigation command in a playbook
In this example, the closeInvestigation command is used in a playbook and values are set for closeReason and closeNotes.
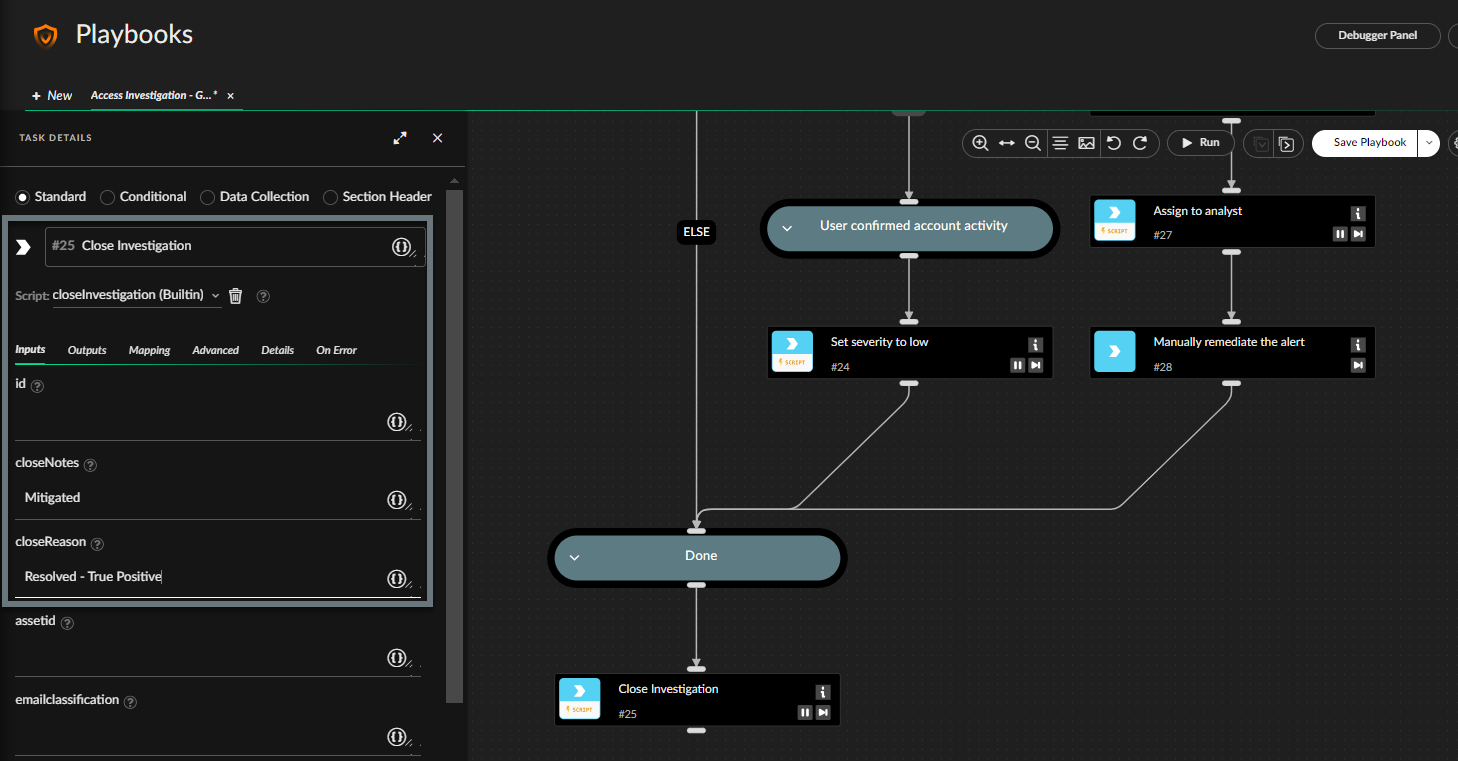
Example of using a variable in the closeReason field
In this example the close reason field specifies the ${tmpCloseReason} variable value. The tmpCloseReason key was added to the issue context data, and the value is drawn from this field.
-
Add the
tmpCloseReasonkey and set the value, run the following command in the issue War Room:!Set key=tmpCloseReason value="Resolved - True Positive"
-
Create a task in your playbook for the closeInvestigation command and set the closeReason field to
${tmpCloseReason}.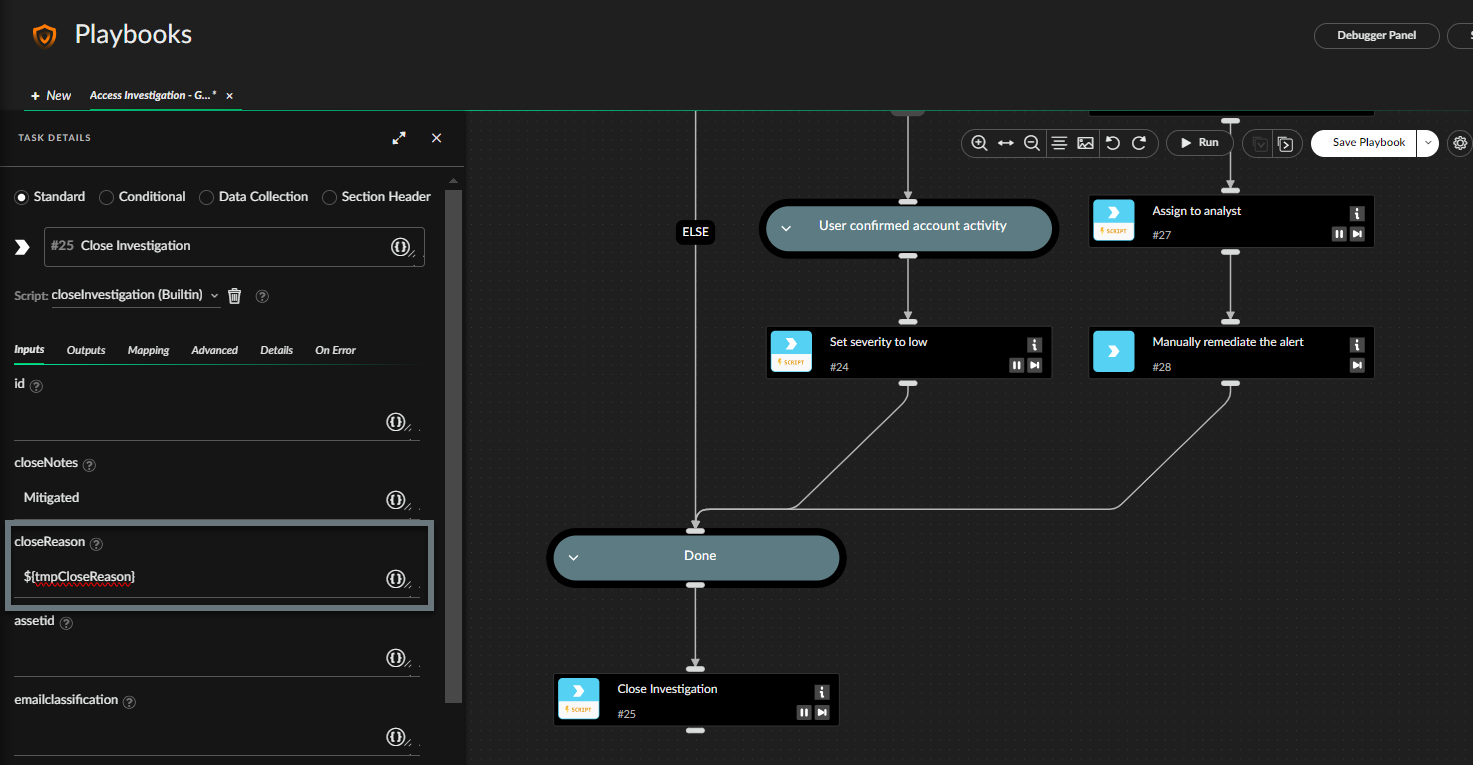
When the playbook runs, it draws the value from this field in the context data:
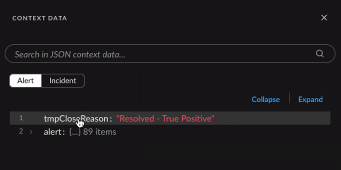
Review findings
In Cortex XSIAM findings provide knowledge about an asset by leveraging the data we collect from various sources. This process helps build a more accurate and comprehensive understanding of the asset’s current state, including its configuration, behavior, and context within the environment. Additionally, findings provide visibility into potential exposures and vulnerabilities, contributing to a clearer assessment of the asset’s risk level. By continuously analyzing and updating findings, we can maintain an up-to-date view of the asset’s security posture and support more informed decision-making for detection, prioritization, and remediation efforts. For more information, see Issues, findings, and events.
Click on a finding from any location in the UI to open the findings card. To view all findings, go to Issues → Findings table. You can also see findings for a specific asset by opening the asset card.
Show me more
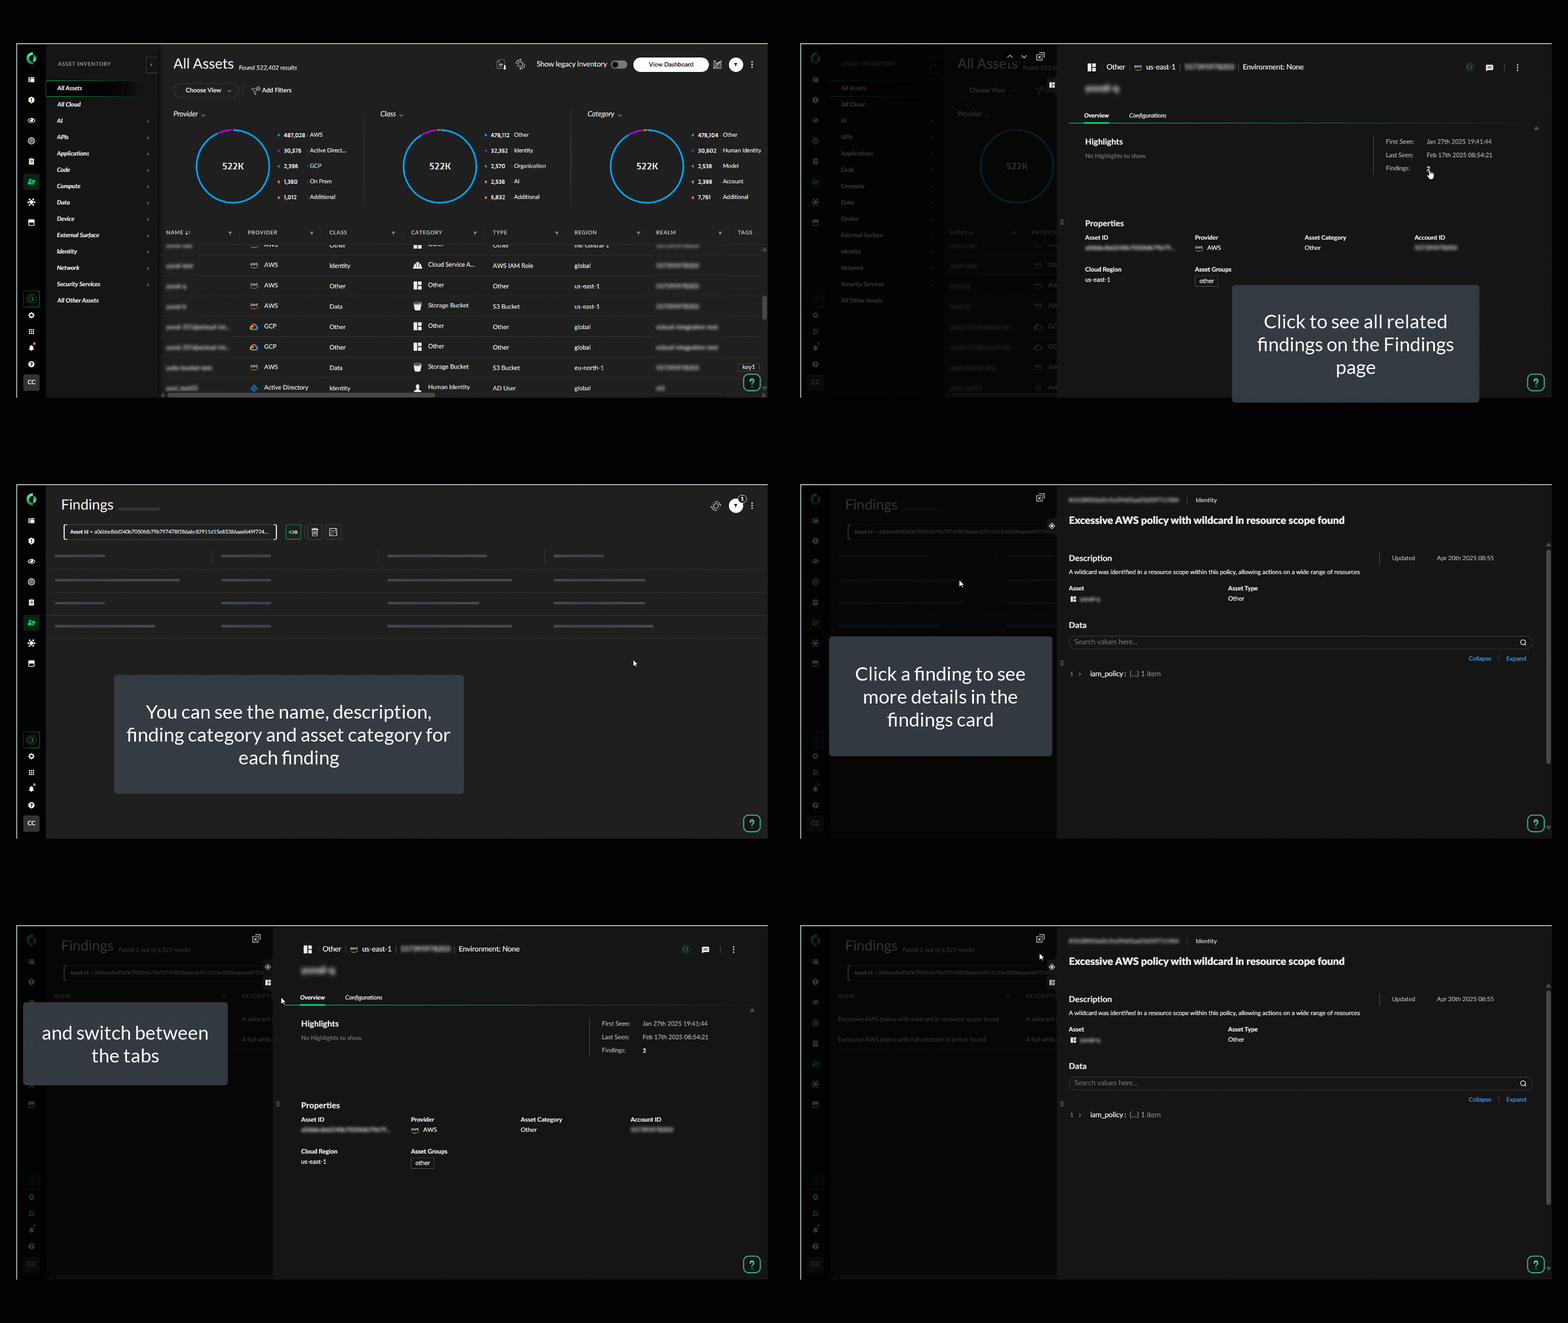
Types of findings
The following table describes the different types of findings:
Note
Some finding types require the Cortex XSIAM Premium license, or any other XSIAM license with the Cloud Posture Security or Cloud Runtime Security add-on.
| Type | Description |
|---|---|
| Code | Discovery of security issues within application source code, such as bugs, logic flaws, and insecure coding practices. |
| Compliance | Discovery of compliance violations that do not adhere to the security standards for your organization. |
| Configuration | Discovery of incorrect settings or configurations in systems, applications, or devices that reduce the environment's resilience and increase the potential for compromise. |
| Data | Discovery of sensitive data misuse, secrets, and shadow data. |
| Identity | Discovery of suspicious user identities, highlighting authentication and access control to prevent unauthorized access and minimize the risk of over-permissive access rights that could lead to security breaches. |
| Malware | Discovery of malicious files within cloud workloads. |
| Posture | Discovery of posture risks that might expose critical assets to potential cyberattacks and operational disruption. |
| Vulnerability | Discovery of weaknesses or flaws in software or hardware that attackers can exploit to gain unauthorized access, disrupt operations, or steal data. Includes the Contextual Asset ID (e.g., the specific Image Name, Container Instance ID) to help distinguish if the vulnerability is a host OS issue or originates from a nested workload. |
Set up rules to trigger issues from findings
Findings themselves are not issues, but findings that match a specific logic can generate issues. You can also set up your own policies and rules to trigger issues when the following types of findings are recorded:
- Compliance, Malware, or Secrets findings, for more information, see Cloud workload policies and rules.
- Vulnerability findings, for more information, see Vulnerability policies.
Query findings data
You can query finding data in the findings data set.
Example: The following query searches for all findings for AssetA:
dataset = findings | filter xdm.finding.asset_name = "AssetA"
Findings card
The Findings card displays information about the selected finding. On this card you can see the following information.
Note
The information in this card is context specific, therefore some sections are not available for all findings.
| Section | Description |
|---|---|
| Header | Finding ID, name, category (such as, Vulnerability or Compliance), time created, and time updated. |
| Description | Reason that the finding was created. |
| Impact | Information about the possible impact of the finding on your system. |
| Asset | Name and type of the affected asset. To investigate the asset, click on the asset name to open a new tab displaying the asset card. |
| Detection logic | Detection rule that identified the specific security risk, configuration gap, or malicious behavior generating the finding. |
| Compliance | Violated compliance standards and specific framework controls associated with the finding. Click the expand icon to see a list of all standards associated with the finding and a granular breakdown of specific controls breached under each standard. License Note Requires Cortex XSIAM Premium or the Cortex Cloud Posture Management or Cortex Cloud Runtime Security add-on. |
| Evidence | Visualization of the finding in your environment. |
| Data | Normalized finding data. |
Investigate artifacts and assets
From the Cases view, open the Key Assets & Artifact tab to see the assets and artifacts that are associated with the case, including hosts, IP addresses, and users. Icons represent properties of the artifacts and assets. Hover over an icon for more information. Click the more options icon to drill down in dedicated views, or take actions on the asset or artifact. The Key Assets & Artifact tab shows the following information:
-
Artifacts
To aid you with threat investigation, Cortex XSIAM displays the WildFire-issued verdict for each key artifact in a case. To provide additional verification sources, you can integrate external threat intelligence services with Cortex XSIAM.
-
Assets
Displays Hosts and Users details. For hosts with a Cortex XDR agent installed, click on the host name to see more information in the Details panel.
Investigate an IP address
Drill down on an IP address on the IP View. On this view, you can investigate and take actions on IP addresses, and see detailed information about an IP address over a defined 24-hour or 7-day time frame. In addition, to help you determine whether an IP address is malicious, the IP View displays an interactive visual representation of the collected activity for a specific IP address.
How to investigate an IP address
-
Open the IP View.
Right-click the IP address that you want to investigate and select Open IP View.
-
In the left panel, review the overview of the IP address.
The overview displays network operations, cases, actions, and threat intelligence information relating to the selected IP address, and provides a summary of the network operations and processes related to the IP address.
The displayed information and available actions are context-specific.
- Add an Alias or Comment to the IP address.
- Review the location of the IP address. By default, Cortex XSIAM displays information on whether the IP address is an internal or external IP address.
- External—Connection Type: Incoming displaying IP address is located outside of your organization. Displays the country flag if the location information is available.
- Internal—Connection Type: Outgoing displaying IP address is from within your organization. The XDR Agent icon is displayed if the endpoint identified by the IP address had an agent installed at that point in time.
-
Identify the IOC severity.
The color of the IP address value is color-coded to indicate the IOC severity.
-
Review threat intelligence for the IP address.
Depending on the threat intelligence sources that are integrated with Cortex XSIAM, the following threat intelligence might be available:
-
Virus Total score and report
Requires a license key. Select Settings → Configurations → Integrations → Threat Intelligence.
- Whois identification data for the specific IP address.
- IOC Rule, if applicable, includes the IOC Severity, Number of hits, and Source.
- EDL IP address if the IP address was added to an EDL.
-
-
Review the related cases.
Recent Open Cases lists the most recent cases that contain the IP address as part of the case’s key artifacts, according to the Last Updated timestamp. If the IP address belongs to an endpoint with a Cortex XDR agent installed, the cases are displayed according to the hostname rather than the IP address. To dive deeper into a specific case, select the case ID.
-
In the right-hand view, use the filter criteria to refine the scope of the IP address information that you want to visualize in the map.
In the Type field, select Host Insights to pivot to the Asset View of the host associated with the IP address, or select Network Connections to display the IP View of the network connections made with the IP address.
- Review the selected data.
- Select each node for additional information.
- Select Recent Outgoing Connections to view the most recent connections made by the IP address. Search all Outgoing Connections to run a Network Connections query on all the connections made by the IP address.
-
Perform actions on IOC or EDL.
Depending on the current IOC and EDL status, the Actions button is displayed.
Investigate an asset
Drilldown on an asset on the Asset View. On this view you can investigate host assets, view host insights, and see a list of cases related to a host.
The Asset view is available for hosts with a Cortex XDR agent installed.
How to investigate an asset in Cortex XSIAM
-
Open the Asset View.
Identify a host with a Cortex XDR agent installed and select Open Asset View.
-
In the left panel, review the overview of the host asset.
The overview displays the host name and any related cases.
- Add an Alias or Comment to the host name.
-
Review the related cases.
Recent Open Cases lists the most recent cases that contain the host as part of the case’s key artifacts, according to the Last Updated timestamp. To dive deeper into a specific case, select the Case ID.
-
In the right hand view, use the filter criteria to refine the scope of the host information that you want to display.
In the Type field, select one of the following:
- Host Insights: View a list of the host artifacts.
- Network Connections: Pivot to the IP view displaying the IP addresses associated with the host.
- Host Risk View: View insights and profiling information. Available with the the Identity Threat Module.
-
Review the data.
Select Run insights collection to initiate a new collection. The next time the Cortex XDR agent connects, the insights are collected and displayed.
-
Perform actions on the host.
Investigate a host
The Host Risk View requires the Identity Threat Module add-on. Depending on your permissions, some information may be limited by your scope.
The Host Risk view provides a centralized and interactive overview of activities on the host and risk scores, enabling you to investigate host events across core data sources. It enables you to identify and prioritize high-risk endpoint, gives you immediate context for risks, helps prevent missed indicators of compromise, and accelerates triage by offering proactive mitigation strategies.
Customize the Host Risk view for your use case by dragging and dropping each widget to position it where you want in the layout. You can also collapse the widgets to hide or show content as needed.
Drilldown on a host on the Host Risk View. In this view you can see insights and profiling information about a host. When investigating issues and cases, you can view anomalies in the context of the host that can help you to make better and faster decisions about risks. In the Host Risk View you can take the following actions:
- Assess the host's behavior and score.
- Analyze the host's behavior over time, and compare it to peer hosts with the same asset role.
- Review related cases and past issues for the host.
- Star the host to be included in the watchlist.
How to investigate a host
-
Right-click the host that you want to investigate and select Open Host Risk View.
Tip
You can also see a list of all hosts under Inventory → Assets → Asset Scores.
-
Select the timeframe to view the host details.
Cortex XSIAM normalizes and displays case and issue times in your time zone. If you're in a half-hour time zone, the activity in the graphs is displayed in the whole-hour time slot preceding it. For example, if you're in a UTC +4.5 time zone, the time displayed for the activity will be UTC +4.5, however, the visualization will be in the UTC +4 slot.
-
Investigate the host.
Host Risk view
The Host Risk view is available with the ITDR add-on. Depending on your permissions, some information may be limited by your scope.
Host identity and risk score
The host identity and risk score at the top provide an at-a-glance summary of the host details and risk posture. The host risk score displays the score assigned on the last day of the selected time frame and the change in the score for the selected time frame. The score is updated continuously as new issues are associated with cases.
Click the host to view more information about it in a panel that opens on the right. You can see the agent installation date, last communication with the host, details about the operating system, and the IP addresses associated with the host.
The highlight widgets under the host name provide an overview of the host's risk posture. They change according to the selected tab, Risk Assessment or Activities. The elements in the widgets are clickable and filter the information displayed in the tabs.
Risk Assessment
Investigate host risk changes in detail.
- Highlights
- Case Breakdown: Open cases involving this host within the selected timeframe, with a breakdown of how many cases were opened within each risk severity. Click the different severities to filter the rest of the page to display only the information relevant to that severity level.
- CVEs Breakdown by severity: Summary chart grouping Common Vulnerabilities and Exposures (CVEs) found on this host by severity, highlighting urgent patching needs.
- Mitre Att&ck Overview: Aggregate count of the host's detected behaviors correlated against the MITRE ATT&CK kill chain. The widget highlights the specific tactics and techniques observed in the host's behavior.
-
Main section
-
Risk Score Trend: Graph showing the fluctuation of the host's risk score over time, to help identify sudden spikes or long-term high-risk behavior. The graph is based on new cases created within the selected time frame, and updates on past cases that are still active. The straight line represents the host score, which is based on the scores of the cases associated with the host.
The bubbles in the graph represent the number of issues and insights generated on the selected day. Bigger bubbles indicate more issues and insights, and a possible risk.
Drill down on a score for a specific day by clicking a bubble. Alternatively, review the host information for the selected timeframe (Last 7D, 30D, or custom timeframe).
For hosts with associated asset roles, compare the data with other peers with the same asset role. In the Risk Score Trend graph click Compare To and select an asset role to which you want to compare the data.
The dashed line presents the average score for peers with the same asset role as the host, over the same time period. Hover over a bubble on the dashed line to see the Average score for the selected peer and a breakdown of the score per endpoint. Click Show x Hosts to see a full breakdown of the score on the Peer Score Breakdown, filtered by the selected asset role. From the Peer Score Breakdown, you can select any host name and pivot to additional views for further investigation.
- Cases: Cases triggered for the host for the selected timeframe or severity selected in the Case Breakdown widget. If you are drilling down on a score, you can see the cases that contributed to the total score on the selected day. Review the following data:
- The Status column provides visibility into the reason for the score change. For example, if a case is resolved, its score will decrease, bringing down the host score.
-
Issues & Insights: Comprehensive list of configuration issues, policy violations, or anomalies detected on the host machine. The issues are grouped into buckets according to MITRE ATT&CK tactics. Click a tactic to filter the issues in the table.
To further investigate an issue, click the issue to open the Issue Panel and click Investigate.
-
Related CVEs: Details of the specified CVEs related to the host, correlating device vulnerability with identity risk. This information can help you to access and prioritize security threats on each of the endpoints.
To further investigate related CVEs, click View In XQL to link to a prefilled query in the Query Builder. Using Cortex Query Language you can create queries to refine your search.
-
Mitre Att&ck Matrix Breakdown: Detailed visualization of the Mitre Att&ck tactics and techniques detected on the host. This widget breaks down the attack lifecycle, allowing you to pinpoint exactly which tactics and techniques were employed and identify the progression of the threat.
Click Open Mitre Triage to remediate the threat.
Activities
Investigate host activities in detail.
- Highlights
- Failed Logins: Numeric counter displaying the total number of failed login attempts on this host within the currently selected timeframe.
- Main section
-
Login Attempts: All login attempts onto this host. Use the widget to identify lateral movement or unauthorized access.
To further investigate login activity for the host, click View In XQL to link to a prefilled query in the Query Builder. Using Cortex Query Language you can create queries to refine your search. A table showing all user logins occurring onto this specific host, helping to identify lateral movement or unauthorized access
-
Authentication Attempts: Authentication protocols and requests processed by this host during the selected timeframe. You can see authentication. details of the related authentication attempts, and whether the attempts were successful.
To further investigate authentication attempts by the host, click View In XQL to link to a prefilled query in the Query Builder. Using Cortex Query Language, you can create queries to refine your search.
-
-
-
(Optional) Take actions on the host.
On the top right, click Actions to see a list of available actions. Actions are context specific.
Investigate a file and process hash
Drilldown on a file or process hash on the Hash View in Cortex XSIAM. On this view you can investigate and take actions on SHA256 hash processes and files, and see information about a specific SHA256 hash over a defined 24-hour or 7-day time frame. In addition, you can drill down on each of the process executions, file operations, cases, actions, and threat intelligence reports relating to the hash.
How to investigate a file or process hash
-
Open the Hash View.
Identify the file or process hash that you want to investigate and select Open Hash View.
-
In the left panel, review the overview of the hash.
- Review the signature of the hash, if available.
-
Identify the WildFire verdict.
The color of the hash value is color-coded to indicate the WildFire report verdict:
- Add an Alias or Comment to the hash value.
-
Review threat intelligence for the hash.
Depending on the threat intelligence sources that are integrated with Cortex XSIAM, the following threat intelligence might be available:
-
Virus Total score and report.
Requires a license key. Go to Settings → Configurations → Integrations → Threat Intelligence.
- IOC Rule, if applicable, including the IOC Severity, Number of hits, and Source according to the color-coded values:
- WildFire analysis report.
-
- Review if the hash has been added to:
- Allow List or Block List.
- Quarantined, select the number of endpoints to open the Quarantine Details view.
- Review the recent open cases that contain the hash as part of the case's Key Artifacts according to the Last Updated timestamp. To dive deeper into specific cases, select the Case ID.
WildFire color key
- Blue—Benign
- Yellow—Grayware
- Red—Malware
- Light gray—Unknown verdict
- Dark gray—The verdict is inconclusive
- In the right hand view, use the filter criteria to refine the scope of the IP address information that you want to visualize.
Filter criteria
| Event Type | Main set of values that you want to display. The values depend on the selected type of process or file. |
|---|---|
| Primary | Set of values that you want to apply as the primary set of aggregations. Values depend on the selected Event Type. |
| Secondary | Set of values that you want to apply as the secondary set of aggregations. |
| Showing | Number of Primary and Secondary aggregated values to display. |
| Timeframe | Time period over which to display your defined set of values. |
-
Review the selected data.
To view the most recent processes executed by the hash, select Recent Process Executions. To run a query on the hash, select Search all Process Executions.
-
(Optional) Perform actions on the hash.
Investigate a user
Drill down on a user in the User Risk View or the User View. In this view Cortex XSIAM aggregates all of the data collected for a user, displays the information in graphs and tables, and provides further drilldown options for easy investigation. Cortex XSIAM uses Identity Analytics to aggregate information on a user and displays insights about the user.
License type: If the Identity Threat module is enabled, you can open the User Risk View. This view displays insights and profiling information to help you investigate issues and cases. Viewing anomalies in the context of baseline behavior facilitates risk assessment and shortens the time you require for making verdicts.
If the Identity Threat module is not enabled you can open the User View. This view displays an overview of the user and information about the user's score and activity.
You can take the following actions to investigate a user:
- Assess the user's behavior and score.
- Star the user to be included in the watchlist.
- (User Risk View only) Review the user's working hours and related issues.
- (User Risk View only) Analyze the user's behavior over time and compare it to their peers with the same asset role.
How to investigate a user
-
Right-click a user name and select Open User Risk View or Open User Card.
Tip
You can also see a list of all users under Inventory → Assets → Asset Scores.
-
Select the timeframe to view the user's details.
Cortex XSIAM normalizes and displays case and issue times in your time zone. If you're in a half-hour time zone, the activity in the Issues & Insights Heatmap is displayed in the whole-hour time slot preceding it. For example, if you're in a UTC +4.5 time zone, the time displayed for the activity will be UTC +4.5, however, the visualization in the Issues & Insights Heatmap will be in the UTC +4 slot.
-
Investigate the user.
User Risk view
The User Risk view is available with the ITDR add-on. Depending on your permissions, some information may be limited by your scope.
The User Risk view provides a centralized and interactive overview of user identity activities and risk scores, enabling you to investigate user events across core identity data sources. It enables you to identify and prioritize high-risk users quickly, gives you immediate context for identity-related risks, helps prevent missed indicators of compromise, and accelerates triage by offering proactive mitigation strategies.
Customize the User Risk view for your use case by dragging and dropping each widget to position it where you want in the layout. You can also collapse the widgets to hide or show content as needed.
User identity and risk score
The user identity and risk score at the top provide an at-a-glance summary of the user's identity and risk posture. The user risk score displays the score assigned on the last day of the selected time frame and the change in the score for the selected time frame. The score is updated continuously as new issues are associated with cases.
Click the user to view more information about them in a panel that opens on the right. You can see the user's title, department, primary location and endpoint, when the user was created in the organization and when their last activity took place. You can also see their tags and the highlighted tags.
The highlight widgets under the username provide an overview of the user's risk posture. They change according to the selected tab, Risk Assessment or Activities. The elements in the widgets are clickable and filter the information displayed in the tabs.
Risk Assessment
Investigate user risk changes in detail.
- Highlights
- Case Breakdown: Open cases withing the selected timeframe, with a breakdown of how many cases were opened within each risk severity. Click the different severities to filter the rest of the page to display only the information relevant to that severity level.
- Mitre Att&ck Overview: Mitre Att&ck tactics and techniques detected for the user.
- Main section
-
User Risk Score Trend: The graph is based on new cases created within the selected time frame, and updates on past cases that are still active. The straight line represents the user score, which is based on the scores of the cases associated with the user.
The bubbles in the graph represent the number of issues and insights generated on the selected day. Bigger bubbles indicate more issues and insights, and a possible risk.
Drill down on a score for a specific day by clicking a bubble. Alternatively, review the user information for the selected timeframe (Last 7D, 30D, or custom timeframe).
For users with associated asset roles, compare the data with other peers with the same asset role. In the Risk Score Trend graph click Compare To and select an asset role to which you want to compare the data.
The dashed line presents the average score for peers with the same asset role as the user, over the same time period. Hover over a bubble on the dashed line to see the Average score for the selected peer and a breakdown of the score per endpoint. Click Show x Users to see a full breakdown of the score on the Peer Score Breakdown, filtered by the selected asset role. From the Peer Score Breakdown, you can select any user name and pivot to additional views for further investigation.
- User Cases: Related cases triggered for the user for the selected timeframe or severity selected in the Case Breakdown widget. If you are drilling down on a score, you can see the cases that contributed to the total score on the selected day. Review the following data:
- The Status column provides visibility into the reason for the score change. For example, if a case is resolved, its score will decrease, bringing down the user score.
- Issues & Insights: All detection activities associated with the user. The issues are grouped into buckets according to MITRE ATT&CK tactics. Click on a tactic to filter the issues in the table. To further investigate an issue, click the issue to open the Issue Panel and click Investigate.
- Mitre Att&ck Matrix Breakdown: Detailed information about the Mitre Att&ck tactics and techniques detected. Click Open Mitre Triage to remediate the threat.
-
Activities
Investigate user activities in detail.
- Highlights
- Common User Locations: A breakdown of the countries from which the user connected in the past few weeks.
- Common Operating Systems: A breakdown of the operating systems that the user used to connect in the past few weeks.
- Failed Logins: Details about failed login attempts by this user.
- Main section
-
Activity Timeline: Consolidated timeline view aggregating the activities of the user from different sources like Auth, Cloud, Endpoint into a single chronological stream. Displays the volume and type of activities over the selected time period.
The list provides a detailed, chronologically ordered timeline of individual events. Each event includes its timestamp, description, event type, and data source icon.
-
Issues & Insights Heatmap: Grid visualizing the volume and density of user activity across specific times of the day and days of the week. It aggregates events to show when a user is most active versus when they are inactive.
The widget compares the user's actual activity data with their regular activity hours and highlights any differences or anomalies in the user's expected activity.
The cells are marked according to the activity that took place, and a dashed frame indicates that Cortex XSIAM detected uncommon activity in the time slot.
- A dashed ribbon highlights discrepancies between regular activity hours and actual activity.
- A colored ribbon indicates the level of activity on a specific day/hour.
- A numbered ribbon indicates the number of issues and insights that occurred on a specific day/hour.
- Login Attempts: Details of the user's login attempts and whether the attempts were successful. To further investigate login activity for the user, click View In XQL to link to a prefilled query in the Query Builder. Using Cortex Query Language you can create queries to refine your search.
- Authentication Attempts: User's latest authentication attempts during the selected timeframe. You can see details of the related authentication attempts, and whether the attempts were successful. To further investigate authentication attempts by the user, click View In XQL to link to a prefilled query in the Query Builder. Using Cortex Query Language you can create queries to refine your search.
-
SaaS Logs: User's SAAS Log activity during the selected timeframe or on the day selected in the Score Trend graph. You can see details of the SaaS logs that were ingested into the platform in the context of the user.
To further investigate SaaS log activity for the user, click View In XQL to link to a prefilled query in the Query Builder. Using Cortex Query Language you can refine your search.
-
User View
Review the sections of the User View. Depending on your permissions, some information might be limited by your scope.
-
In the left panel, review the overview of the user. The displayed information is aggregated by Cortex XSIAM from cases, Workday, and Active Directory data.
The User Score displays the score that is currently assigned to the user and is updated continuously as new issues are associated with cases.
-
Review the Score Trend graph.
The graph is based on new cases created within the selected time frame, and updates on past cases that are still active. The straight line represents the user score, which is based on the scores of the cases associated with the user.
Select a score to display in the Cases table, the cases that contributed to the total user score on a specific day.
-
Click a score to drill down on the score for a specific day. Alternatively, review the user information for the selected timeframe (Last 7D, 30D, or custom timeframe).
The widgets in the right panel reflect the selected timeframe.
- Review the Related Cases for the selected timeframe or score selected in the Score Trend graph. If you are drilling down on a score, you can see the cases that contributed to the total score on the selected day. Review the following data:
- The Status column provides visibility into the reason for the score change. For example, if a case is resolved, its score will decrease, bringing down the host score.
- The Points column displays the risk score that the case contributed to the host score. The points are calculated according to SmartScore or Case Scoring Rules.
- Review the following additional widgets:
- User Associated Insights
- Top 5 Hosts Logged Into
- Top 5 Authentication Target Hosts
- Top 5 Authentication Source Hosts
- Recent Login
- Recent Authentications
Investigate endpoints
In Cortex XSIAM you can investigate and take actions on your endpoints in the Action Center.
Overview of the Action Center
The Action Center is a central location from which you can track the progress of all investigation, response, and maintenance actions performed on your Cortex XSIAM protected endpoints. To access the Action Center, go to Investigation & Response → Response → Action Center.
The main All Actions tab displays the most recent actions initiated in your deployment. To narrow down the results, use the table filters. You can also choose from the filtered Action Center views to see details of the following actions:
License note: For actions on endpoints, you need a Cortex XSIAM Premium, or Enterprise license, or any other XSIAM license with the Enterprise Runtime Security or Cloud Runtime Security add-on.
- File Quarantine: View details about quarantined files on your endpoints. You can also switch to an Aggregated by SHA256 view that collapses results per file and lists the affected endpoints in the Scope field.
-
Block List and Allow List: View files that are permitted and blocked from running on your endpoints regardless of file verdict.
Blocking files on endpoints is enforced by the endpoint malware profile. To block a hash value, ensure the hash value is configured in the Malware security profile.
Select Override Report mode to allow the agent to block hashes, even if the Malware Profile is set to Report.
- Endpoint Isolation: View the endpoints in your organization that have been isolated from the network. For more information, see Isolate an endpoint.
- External Dynamic List: View the list of IP addresses and domain names in your EDL. For more information, see Manage external dynamic lists.
- Endpoint Blocked IP Addresses: View remote IP addresses that the Cortex XDR agent has automatically blocked from communicating with endpoints in your network.
- Agent Scripts Library: View Palo Alto Networks and administrator-uploaded scripts that you can run on your endpoints.
For actions that can take a while to complete, the Action Center tracks the action progress and displays the action status and current progress description for each stage. For example, after initiating an agent upgrade action, Cortex XSIAM monitors all stages from the Pending request until the action status is Completed. Throughout the action lifetime, you can view the number of endpoints on which the action was successful and the number of endpoints on which the action failed. After a period of 90 days since the action creation, the action is removed from Cortex XSIAM and is no longer displayed in the Action Center. You cannot delete actions manually.
Initiate and monitor endpoint actions
In the Action Center you can initiate and monitor actions on your endpoints. In addition, you can initiate endpoint actions when viewing details about an endpoint on the All Endpoints page.
Initiate an endpoint action from the Action Center
Create new administrative actions using the Action Center wizard:
- Go to Investigation & Response → Response → Action Center → New Action.
-
Select the action you want to initiate and follow the required steps and parameters you need to define for each action.
Cortex XSIAM displays only the endpoints eligible for the action you want to perform.
-
Review the action summary and click Done.
Cortex XSIAM will inform you if any of the agents in your action scope will be skipped.
-
Track your action.
Track the new action in the Action Center. The action status is updated according to the action progress.
Monitor endpoint actions
- Go to Investigation & Response → Response → Action Center.
- Select the relevant view from the left-side menu on the Action Center page.
- Use the table filters to filter the results.
- Take further actions. Right-click the action to see the available options:
- Additional data: Display additional details for the action, such as file paths for quarantined files or operating systems for agent upgrades. For actions with Status, Failed or Completed with partial success, you can create an upgrade action to rerun the action on endpoints that have not been completed successfully.
- Archive: Archive the action for future reference. You can select multiple actions to archive at the same time.
- Cancel for Pending endpoints: Cancel the original action for agents that are still in
Pendingstatus. - Download output: Download a zip file with the files received from the endpoint for actions such as file and data retrieval.
- Rerun: Launch the Define an Action wizard populated with the same details as the original action.
- Run on additional agents: Launch the action wizard populated with the details as the original action except for the agents which you have to fill in.
- Restore: Restore quarantined files.
Action Center reference information
The following table describes both the default and additional optional fields that you can view from the All Actions tab of the Action Center and lists the fields in alphabetical order.
Action center field reference
| Field | Description |
|---|---|
| Action Type | Type of action initiated on the endpoint. |
| Agent Restart | Status of the restart action on the endpoint. Statuses:
|
| Created By | Name of the user who initiated the action. |
| Creation Timestamp | Date and time the action was created. |
| Description | Action scope of affected endpoints and additional data relevant to each of the specific actions, such as agent version, file path, and file hash. |
| Expiration Date | Time the action will expire. To set an expiration date, the action must apply to one or more endpoints. By default, Cortex XSIAM assigns a 30-day expiration limit to the following actions:
Additional actions such as malware scans, quarantine, and endpoint data retrieval are assigned a 4-day expiration limit. After the expiration limit, the status for any remaining Pending actions on endpoints change to Expired and these endpoints will not perform the action. |
| Status | Current status of the action. |
| Additional data: If additional details are available for an action or for specific endpoints, you can pivot to the Additional data view. You can also export the additional data to a TSV file. The page can include details in the following fields but varies depending on the type of action. | |
| Endpoint Name | Target host name of each endpoint for which an action was initiated. |
| IP Addresses | IP address associated with the endpoint. |
| Status | Status of the action for the specific endpoint. (Linux)—Completed with Partial Success for a single endpoint that did not complete the action successfully. |
| Action Last Update | Time at which the last status update occurred for the action. |
| Advanced Analysis | For Retrieve issue data requests related to Cortex XSIAM issues triggered by exploit protection modules, Cortex XSIAM can analyze the memory state for additional verdict verification. This field displays the analysis progress and resulting verdict. |
| Action Parameters | Summary of the action including the issue name and ID. |
| Additional Data | Malicious Files | Additional data, if any is available, for the action. For malware scans, this field is titled Malicious Files and indicates the number of malicious files identified during the scan. |
Manage endpoints
The All Endpoints page provides a central location from which you can view and manage the endpoints on which the agent is installed. To access the All Endpoints page, go to Inventory → Endpoints → All Endpoints.
To ensure the All Endpoints table is displaying the most accurate list of endpoints, you can perform a one-time or periodic cleanup of duplicated entities. After the cleanup, duplicated entities are removed leaving only one endpoint entry, which is the last endpoint to connect with the server. Deleted endpoint data is retained for 90 days from the last connection timestamp. If a deleted endpoint reconnects, Cortex XSIAM recovers and redisplays the endpoint’s existing data.
Go to Settings → Configurations → General → Agent Configurations → Endpoint Administration Cleanup. Enable the Periodic duplicate cleanup and select either One-time cleanup or define a periodic cleanup to run according to the Host Name, Host IP Address, and/or MAC Address fields at a specific time interval.
Endpoint actions
The right-click pivot menu displays the actions you can perform on your endpoints. For more information about these actions, see the topics in this section, and the topics under Manage endpoint protection.
For the Include endpoints from auto upgrade action, you cannot enable auto upgrade for Mobile, VDI, and TS installations.
All Endpoints reference information
The following table describes both the default and additional optional fields that you can view in the All Endpoints table and lists. Clicking on a row in the All Endpoints table opens a detailed view of the endpoint.
All Endpoints field reference
| Field | Description |
|---|---|
| Active Directory | Active Directory Groups and Organizational Units to which the user belongs. |
| Assigned Extensions Policy | Policy related to extensions and devices connected to the endpoint. |
| Assigned Prevention Policy | Policy assigned to the endpoint. |
| Agent Version | Agent version that is installed on the endpoint. |
| Auto Upgrade Status | When Cortex XDR agent auto upgrades are enabled, this field indicates the action status. If an endpoint is excluded, the auto upgrade profile configuration is not available. If you exclude the endpoint from auto upgrade while the auto upgrade action is In progress, the ongoing upgrade will still take place. |
| Cloud Account ID | Unique identifier for the cloud account that owns or manages the workload. |
| Cloud Info | IBM and Alibaba Cloud metadata reported by the workload. |
| Cloud Instance ID | (Agent 8.9 and later) Unique identifier for the cloud instance hosting the workload. |
| Cloud Provider | (Agent 8.9 and later) Cloud service provider hosting the workload. |
| Cloud Region | (Agent 8.9 and later) Geographical region of the cloud infrastructure where the workload is hosted. |
| Cluster Name | (Agent 8.9 and later) Cluster name to which the workload belongs. |
| Content Auto Update | Whether automatic content updates are Enabled or Disabled for the endpoint in the agent settings profile. |
| Content Release Timestamp | Time and date of when the current content version was released. |
| Content Rollout Delay (days) | If you configured delayed content rollout, the number of days for delay is displayed here. |
| Content Status | Status of the content version on the relevant endpoint. The Cortex XSIAM tenant attempts to contact an endpoint and check the content version over a 7-day period. After this period the tenant displays one of the following statuses:
Content Status is calculated every 30 minutes. Therefore, there might be a delay of up to 30 minutes in displaying the data. |
| Content Version | Content update version used with the agent. |
| Disabled Capabilities | List of capabilities that were disabled on the endpoint. Options are Live Terminal, Script Execution, and File Retrieval. You can disable these capabilities during agent installation on the endpoint or through Endpoint Administration. Disabling any of these actions is irreversible. If you later want to enable the action on the endpoint, you must uninstall the agent and install a new package on the endpoint. |
| Domain | Domain or workgroup to which the endpoint belongs. Only supported for Windows and macOS. |
| Endpoint Alias | If you assigned an alias to represent the endpoint in Cortex XSIAM, the alias is displayed here. To set an endpoint alias, right-click in the endpoint row, select Endpoint Control → Change Endpoint Alias. The alias can contain any of the following characters:
|
| Endpoint ID | Unique ID that identifies the endpoint. |
| Endpoint Isolated | Isolation status, either:
|
| Endpoint Name | Hostname of the endpoint. If the agent enables Pro features, this field also includes a PRO badge. For Android endpoints, the hostname comprises the <firstname>—<lastname> of the registered user, with a separating dash. |
| Endpoint Status | Registration status of the agent on the endpoint:
|
| Endpoint Type | Type of endpoint. |
| Endpoint Version | Versions of the agent that runs on the endpoint. |
| First Seen | Date and time the agent first checked in (registered) with Cortex XSIAM. |
| Golden Image ID | For endpoints with a System Type of Golden Image, the image ID is a unique identifier for the golden image. |
| Group Names | Endpoint Groups to which the endpoint is a member, if applicable. |
| Incompatibility Mode | Agent incompatibility status, either:
When agents are compatible with the operating system and environment, this field is blank. |
| Isolation Date | Date and time of when the endpoint was Isolated. Displayed only for endpoints in Isolated or Pending Isolation Cancellation status. |
| Install Date | Date and time at which the agent was first installed on the endpoint. |
| Installation Package | Installation package name used to install the agent. |
| Installation Type | Type of installation. |
| IP Address | Last known IPv4 address of the endpoint. |
| IPv6 Address | Last known IPv6 address of the endpoint. |
| Is EDR Enabled | Whether EDR data is enabled on the endpoint. |
| IT Metric Collection | Whether the endpoint is collecting IT performance data. |
| Last Certificate Enforcement Fallback | (For Windows and MacOS Endpoints) If Certificate Enforcement is Enabled, this column shows the date and time of use of a fallback certificate from the local store. If no fallback is used, this will remain empty. |
| Last Content Update Time | Time and date when the agent last deployed a content update. |
| Last Origin IP | Last IPv4 address from which the XDR agent connected. |
| Last Origin IPv6 | Last IPv6 address from which the XDR agent connected. |
| Last Scan | Date and time of the last malware scan on endpoint. |
| Last Seen | Date and time of the last change in an agent's status. This can occur when Cortex XSIAM receives a periodic status report from the agent (once an hour), a user performed a manual Check In, or a security event occurred. Changes to the agent status can take up to ten minutes to display on Cortex XSIAM . |
| Last Used Proxy | IP address and port number of proxy that was last used for communication between the agent and Cortex XSIAM. |
| Last Used Proxy Port | Last proxy port used on endpoint. |
| Linux Operation Mode | (Agent 7.7 and later for Linux) Type of operation mode your Linux endpoint is running by the agent. |
| Last Upgrade Failure Reason | Reason an upgrade failed. |
| Last Upgrade Source | Source of the upgrade installation file. |
| Last Upgrade Status | Status of the last upgrade. |
| Last Upgrade Status Time | Date and time of the last upgrade. |
| MAC Address | Endpoint MAC address that corresponds to the IP address. Currently, this information is available only for IPv4 addresses. |
| Mobile ID | Unique identifier of the agent located on an Android or iOS mobile. |
| Network Interface | Relationship between the MAC address and the IP address for agents that can report the network interfaces information. Information is displayed in JSON format, and searches can be performed on attributes in JSON. |
| Network Location | (Agent 7.1 and later for Windows and agent 7.2 and later for macOS and Linux) Endpoint location is reported by the agent when you enable this capability in the Agent Settings profile. |
| Operating System | Name of the operating system. |
| Operational Status | Cortex XDR agent operational status:
|
| OS Description | Operating system version name. |
| OS Type | Name of the operating system. |
| OS Version | Operating system version number. |
| Platform | Platform architecture. |
| Proxy | IP address and port number of the configured proxy server. |
| Scan Status | Malware scan status. |
| Managed Device | Whether an iOS device has a corporate profile installed on it and is to some extent controlled and managed by the corporation. |
| Tags | Tags associated with the endpoint. Tags created in the agent are displayed with a shield icon. |
| User | User that was last logged into the endpoint. On Android endpoints, the Cortex XSIAM tenant identifies the user from the email prefix specified during app activation. |
Retrieve files from an endpoint
During an investigation, you can retrieve files from one or more endpoints by initiating a files retrieval request. For each file retrieval request, Cortex XSIAM supports up to:
- 20 files
- 500MB in total size
- 10 different endpoints
The request instructs the agent to locate the files on the endpoint and upload them to Cortex XSIAM. The agent collects all requested files into one archive and includes a log in JSON format containing additional status information. When the files are successfully uploaded, you can download them from the Action Center.
How to retrieve files from an endpoint
- Go to Investigation & Response → Response → Action Center → New Action.
- Select Files Retrieval.
-
Select the operating system and enter the paths for the files you want to retrieve. Press ADD after each completed path.
You cannot define a path using environment variables on Mac and Linux endpoints.
- Click Next.
- Select the target endpoints (up to 10) from which you want to retrieve files and click Next.
-
Review the action summary and click Done.
To track the status of a file retrieval action, return to the Action Center. Cortex XSIAM retains retrieved files for up to 30 days.
If at any time you need to cancel the action, right-click, and select Cancel for pending endpoint. You can cancel the retrieval action only if the endpoint is still in Pending status and no files have been retrieved from it yet. The cancellation does not affect endpoints that are already in the process of retrieving files.
-
To view additional data and download the retrieved files, right-click the action and select Additional data.
This view displays all endpoints from which files are being retrieved, including their IP Address, Status, and Additional Data such as error messages of names of files that were not retrieved.
-
When the action status is Completed Successfully, right-click the action and download the retrieved files logs.
If the Password Protection (for downloaded files) setting under Settings → Configuration → General → Server Settings is enabled, enter the password 'suspicious' to download the file.
Disable file retrieval
If you want to prevent Cortex XSIAM from retrieving files from an endpoint running the agent, you can disable this capability during agent installation or later on from the All Endpoints page. Disabling script execution is irreversible. If you later want to re-enable this capability on the endpoint, you must re-install the agent. See the XDR agent administrator’s guide for more information.
Disabling File Retrieval does not take effect on file retrieval actions that are in progress.
Retrieve support logs from an endpoint
When you need to investigate or share additional forensic data, you can initiate a request to retrieve all the support logs and issue data dump files from an endpoint. After Cortex XSIAM receives the logs, you can download the log files or generate a secured link to access them on the Cortex XSIAM server.
How to retrieve support files
-
Retrieve support files.
- Go to Investigation & Response → Response → Action Center → Run Action.
- Select Retrieve Support File and click Next.
- Select the target endpoints (up to 10) from which you want to retrieve logs and click Next.
-
Review the action summary and click Done.
In the next heartbeat, the agent will retrieve the request to package and send all logs to Cortex XSIAM .
You can also retrieve support files from the All Endpoints table by right-clicking and selecting Endpoint Control → Retrieve Support File.
-
In the Action Center, locate your Support File Retrieval action type and wait for the Status field to display Completed Successfully.
If you need to cancel the action, you can right-click it and select Cancel for pending endpoint. You can cancel the retrieval action only if the endpoint is still in
Pendingstatus and no files have been retrieved from it yet. The cancellation does not affect endpoints that are already in the process of retrieving files. -
When the status is Completed Successfully, right-click and select Additional data.
In the Actions table, you can see the endpoints from which support files were retrieved.
-
Select an endpoint, right-click and select either Download files or Generate support file link.
Cortex XSIAM retains retrieved files for up to 30 days.
The secured link is valid for only 7 days. Following the 7 day period, in order to access the files, you will need to initiate a new support file link.
To open the file you will need the support file password. For more information, see Retrieve support file password.
Retrieve support file password
From Cortex XDR agent, the Tech Support File (TSF) is generated by the Cytool command log collect in a zip format that is protected by an encrypted password. The TSF file is archived inside another file which includes a metadata file that contains a token. This token is used to retrieve the password to unzip the TSF file.
There are two methods to retrieve the TSF file password in Cortex XSIAM:
Retrieve the password from the endpoint, using the server Tokens and Passwords option.
- Go to Inventory → Endpoints → All Endpoints.
- At the top of the page, click the key icon (Tokens and Passwords) and select Retrieve Support File Password.
- In the Retrieve Support File Password dialog box, in the Encrypted Password field, paste the token that you copied from the metadata file located in the saved file when running the Cytool log collect command.
- Click the copy button to copy the password displayed and then click Ok. Use the password to unzip the TSF file.
Retrieve the password for the TSF file from the server Action Center.
- Go to Action Center → All Actions.
- Right-click the action and select Retrieve Support File Password.
- In the Retrieve Support File Password dialog box, in the Encrypted Password field, paste the token that you copied from the metadata file located in the download file.
- Click the copy button to copy the password displayed and then click Ok. Use the password to unzip the TSF file.
Scan an endpoint for malware
In addition to blocking the execution of malware, the Cortex XDR agent can scan your Windows, Mac and Linux endpoints and attached removable drives for dormant malware that is not actively attempting to run. The agent examines the files on the endpoint according to the Malware Security Profile that is in effect on the endpoint (quarantine settings, unknown file upload, etc.) When a malicious file is detected during the scan, the agent reports the malware to Cortex XSIAM so you can manually take action to remove the malware before it is triggered and attempts to harm the endpoint.
You can scan the endpoint in the following ways:
- System scan: Initiate a full system scan on demand from Endpoints Administration for an endpoint, as explained in the following procedure.
- Periodic scan: Configure periodic full scans that run on the endpoint as part of the malware security profile. To configure periodic scans, see Set up malware prevention profiles.
- Custom scan: (Windows, requires agent v7.1 or later) The end user can initiate a scan on demand to examine a specific file or folder. For more information, see the Cortex XDR Agent Administrator's Guide for Windows.
Initiate a full system scan
You can initiate full scans of one or more endpoints from the All Endpoints table or the Action Center. After initiating a scan, you can monitor the scan progress in the Action Center. Scan time varies depending on the number of endpoints, connectivity to those endpoints, and the number of files for which Cortex XSIAM needs to obtain verdicts.
- Select Investigation & Response → Response → Action Center → New Action.
- Select Malware Scan.
- Click Next.
-
Select the target endpoints (up to 100) on which you want to scan for malware.
Scanning is available on Windows, Mac and Linux endpoints. Cortex XSIAM automatically filters out any endpoints for which scanning is not supported. Scanning is also not available for inactive endpoints.
- Click Next.
- Review the action summary and click Done. Cortex XSIAM initiates the action at the next heartbeat and sends the request to the agent to initiate a malware scan.
-
To track the status of a scan, return to the Action Center.
When the status is Completed Successfully, you can view the scan results.
-
View the scan results.
After an agent completes a scan, it reports the results to Cortex XSIAM. To view the scan results for an endpoint:
-
In the Action Center, right-click the scan action and select Additional data.
Cortex XSIAM displays additional details about the endpoint.
-
Right-click the endpoint for which you want to view the scan results and select View related security events.
Cortex XSIAM displays a filtered list of malware issues for files that were detected on the endpoint during the scan.
-
Investigate files
You can take actions to manage and investigate files, including:
- Manage file execution on your endpoints by adding file hashes to your allow and block lists.
- Quarantine files and manage the files automatically quarantined by Cortex XSIAM.
- Review the file verdict and the WildFire Analysis Report for a file.
- Import hashes from the Endpoint Security Manager or from external feeds.
Note
To take actions on endpoints, you need the Cortex XSIAM Premium, Enterprise, or any other XSIAM license with the Enterprise Runtime Security (XDR) add-on.
Manage file execution
In Cortex XSIAM you can manage file execution on your endpoints by adding file hashes to your allow and block lists. If you trust a certain file and know it to be benign, you can add the file hash to the allow list. This allows the file to be executed on all your endpoints regardless of the WildFire or local analysis verdict. Similarly, if you want to always block a file from running on your endpoints, you can add the associated hash to the block list.
Adding files to the allow and block lists takes precedence over any other policy rules that are applied to these files. In the Action Center, you can monitor the allow and block list actions performed in your network, and add or remove files from these lists.
Supported file types are:
| Operating system | Supported file types |
|---|---|
| Windows |
|
| Mac |
|
| Linux |
|
If On-write File Examination is enabled, the following file type hashes are also supported in the allow and block list: War, Asp, Aspx.
How to add a file to the allow or block list or allow list
- Go to Investigation & Response → Response → Action Center → New Action.
- Select Add to Block List or Add to Allow List.
-
Enter the SHA-256 hash of the file and click
 .
.You can add up to 100 file hashes at one time. If you add a comment, it is added to all the hashes you added in this action.
- Click Next.
-
Review the summary and click Done.
In the next heartbeat, the agent retrieves the updated lists from Cortex XDR.
- You are automatically redirected to the Block List or Allow List that corresponds to the action in the Action Center.
- To manage the file hashes on the Block List or the Allow List, right-click a file to see the available actions.
Manage quarantined files
When the agent detects malware on an endpoint, you can take additional precautions to quarantine the file. When the agent quarantines malware, it moves the file from the location on a local or removable drive to a local quarantine folder where it encrypts and isolates the file as a locked file. This prevents the file from attempting to run again from the same path or causing any harm to your endpoints. The file remains stored locally in this repository until explicitly restored or deleted, or until storage rotation occurs.
To evaluate whether an executable file is considered malicious, the agent calculates a verdict using information from the following sources in order of priority:
- Hash exception policy
- WildFire threat intelligence
- Local analysis
Local quarantine folder location by OS
- Windows:
%ProgramData%\PaloAltoNetworks\Traps\quarantine\(or...\Cortex XDR\quarantine\, depending on agent version) - macOS:
/Library/Application Support/PaloAltoNetworks/Traps/quarantine/(or.../Cortex XDR/quarantine/) [Comment: Added macOS path from Text 2] - Linux:
/opt/traps/quarantine/(or/var/log/traps/quarantine/)
How to quarantine a file in Cortex XSIAM
You can quarantine a file in the following ways:
- Enable the agent to automatically quarantine malicious executables by configuring quarantine settings in a Malware prevention profile. For more information, see Set up malware prevention profiles.
- Right-click a specific file from the causality view and select Quarantine.
Retention and Expiration Timeframes
- Quarantine List Retention: Quarantined file records remain in the Quarantine List for a default retention period of 180 days (6 months).
- Pending Action Expiration: When a Quarantine command is issued to an offline or unreachable endpoint, the command stays in Pending status for 4 days by default before expiring. This setting is configurable between 1 and 30 days.
To update the Pending Action Expiration setting, go to Settings → Configurations → Agent Configurations → Action Center Expiration and locate Quarantine under the Response category, modify the Expiration (Days) field, and click Save.
View and manage quarantined files
Requires the Cortex XSIAM Premium, Enterprise, or any other XSIAM license with the Enterprise Runtime Security or the Cloud Runtime Security add-on.
-
To view the quarantined files in your network, go to Investigation & Response → Response → Action Center → File Quarantine.
Toggle between the Detailed and Aggregated By SHA256 tabs to see information on your quarantined files.
-
Review details about quarantined files.
- In the Detailed view, filter and review the Endpoint Name, Domain, File Path, Quarantine Source, and Quarantine Date of all the quarantined files. You can take the following actions:
-
Reinstate a quarantined file: Right-click one or more rows and select Restore all files by SHA256.
Note
This will restore all files with the same hash on all of your endpoints.
- Review the quarantined file inspection results on VirusTotal: Right-click the Hash field and select Open in VirusTotal.
- Drill down on the hash value: Right-click the Hash field and select Open Hash View. You can see each of the process executions, file operations, cases, actions, and threat intelligence reports relating to the hash value.
- Search for where the hash value appears in Cortex XSIAM: Right-click the Hash field and select Open in Quick Launcher.
- Export to file: Click the icon on the top right corner to download a detailed list of the quarantined hashes in a TSV format.
-
- In the Aggregated by SHA256 view, filter and review the Hash, File Name, File Path, and Scope of all the quarantined files. You can take the following actions:
- Open the Quarantine Details page: Right-click a row and select Additional Data to open the page detailing the Endpoint Name, Domain, File Path, Quarantine Source, and Quarantine Date of a specific file hash.
- Reinstate a file hash: Right-click and select Restore.
- Permanently delete quarantined files on the endpoint: Right-click and select Delete all files by SHA256.
- In the Detailed view, filter and review the Endpoint Name, Domain, File Path, Quarantine Source, and Quarantine Date of all the quarantined files. You can take the following actions:
Review WildFire analysis details
For each file, Cortex XSIAM receives a file verdict and the WildFire Analysis Report. This report contains detailed sample information and behavior analysis in different sandbox environments, leading to the WildFire verdict. You can use the report to assess whether the file poses a real threat on an endpoint. The details in the WildFire analysis report for each event vary depending on the file type and the behavior of the file.
Drill down into WildFire analysis details
WildFire analysis details are available for files that receive a WildFire verdict. The Analysis Reports section includes the WildFire analysis for each testing environment based on the observed behavior for the file.
-
Open the WildFire report.
If you are investigating a case in the case detail view you can see artifact details on the Key Assets & Artifacts tab. Under Artifacts, identify a file with a WildFire verdict and click Wildfire Analysis Report (
 ). If you are analyzing an issue, hover over the issue and Investigate. You can open () the WildFire report of any file included in the issue's Causality Chain.
Note
Cortex XSIAM displays the preview of WildFire reports that were generated within the last couple of years. To view a report that was generated more than two years ago, you can download the report.
-
Analyze the WildFire report.
On the left side of the report, you can see all the environments in which the Wildfire service tested the sample. If a file is low risk and WildFire can easily determine that it is safe, only static analysis is performed on the file. Select the testing environment to review the summary and additional details. To learn more about the behavior summary, see WildFire Analysis Reports—Close Up.
-
(Optional) Download the WildFire report.
If you want to download the WildFire report as it was generated by the WildFire service, click (
 ). The report is downloaded in PDF format.
Report an incorrect verdict to Palo Alto Networks
If you know the WildFire verdict is incorrect, for example, WildFire assigned a Malware verdict to a file you wrote and know to be Benign, you can report an incorrect verdict to Cortex XSIAM to request the verdict change.
- Open the WildFire report and verify the verdict that you are reporting.
- Click Report Verdict as Incorrect (
 ).
). - Under Suggested Verdict, suggest a new verdict.
- Under Comment, enter any details that can help us to better understand why you disagree with the verdict.
- Under Email, verify your email address.
-
Click OK.
The threat team will perform further analysis of the sample to determine whether it should be reclassified. If a malware sample is determined to be safe, the signature for the file is disabled in an upcoming antivirus signature update. If a benign file is determined to be malicious, a new signature is generated. After the investigation is complete, you will receive an email describing the action that was taken.
Import file hash exceptions
The Action Center displays information on files that are quarantined, or included in the allow list and block list. To import hashes from the Endpoint Security Manager or from external feeds, take the following steps:
- Go to Investigation & Response → Response → Action Center → New Action.
- Select Import Hash Exceptions.
-
Drag your file to the drop area.
Files must be in csv format, for example
Verdict_Override_Exports.csv. If necessary, resolve any conflicts encountered during the upload and retry. - Click Next.
-
Review the action summary, and click Done.
Cortex XSIAM imports your hashes. Depending on the assigned verdict, Cortex XSIAM then distributes them to the allow list or block list.
Cortex Assistant
Cortex Assistant is an innovative tool specifically developed to streamline various processes, including case triaging, investigation, and remediation in Cortex XSIAM. By utilizing Cortex Assistant, you can uncover valuable insights on a wide range of entities such as hashes, hosts, and more. Its primary objective is to simplify these tasks, allowing for a more efficient workflow and enhanced productivity.
Note
If you are in an eligible region and have enabled the Cortex Agentic Assistant, the Cortex Agentic Assistant replaces the Cortex Assistant. The Cortex Assistant is available if you do not have access to the Cortex Agentic Assistant based on the tenant region or you have not enabled it. For more information, see Compare Agentic Assistant with Cortex Assistant.
One of the key features of Cortex Assistant is its ability to provide personalized suggestions based on your specific needs and context. This helps you find the most relevant information and solutions quickly and effortlessly.
Cortex Assistant allows users to execute commands using natural language from anywhere within the interface. This means that users can interact with the tool seamlessly, without losing their train of thought or context.
Access Cortex Assistant
Cortex Assistant is conveniently accessible from the main menu in the left pane, ensuring easy navigation and usage. Alternatively, you can right-click on specific entities, such as an asset name or IP address, and select Open in Cortex Assistant to immediately open the Cortex Assistant with a focus on that entity.
To increase usability, you can create a personalized keyboard shortcut: Settings → Configurations → Server Settings → Keyboard Shortcuts and choose the shortcut you want to use. You can use this shortcut anytime, from anywhere within Cortex XSIAM, to instantly open Cortex Assistant. If you highlight an entity and open Cortex Assistant with the keyboard shortcut, it will open with a focus on that entity.
What can Cortex Assistant do for you?
- Perform investigations of entities such as cases, hashes, hosts, domains, IP addresses, and users, using advanced XQL queries and activate tailored responses.
- Use Cortex Assistant as a navigation tool to search for information, perform common investigation tasks, or initiate response actions.
Responsible AI
Cortex Assistant is developed in accordance with responsible AI principles. Customer data is not used to train the AI models, and your data is private and secure. For added security, user prompts are processed within the tenant's region. Safety and security measures include user confirmation for write actions and adherence to RBAC permissions. At the same time, explainability is maintained by providing the logic behind answers and offering a feedback option for user opinions.
Cortex Assistant layout
Cortex Assistant consists of the following primary components:
Search bar
The search bar is located at the top of the Cortex Assistant screen. This is where you interact with Cortex Assistant, providing a centralized location to access assistance, obtain insights, and navigate the platform efficiently.
Insights and suggestions
You can find Cortex Assistant's responses to your queries in the insights and suggestions area. The insights section includes all the important information Cortex Assistant can provide in response to your query.
Below that, Cortex Assistant offers suggestions, which are divided into three columns, each with specific functionalities:
- Investigate: Choose from the recommended relevant questions you can ask to further your investigation. Responses leverage advanced XQL queries.
- Respond: Take action by running recommended playbooks or scripts, enabling you to initiate response actions based on Cortex Assistant's suggestions.
Cortex Assistant capabilities
Entity investigation
The Cortex Assistant conducts investigations on entities entered in the search bar. It can investigate a range of entities, including hosts, users, hashes, domains, IP addresses, and cases. To initiate an investigation, enter the entity name in the search bar or ask specific questions about the entity, such as "What are the events related to <entity>?". You can then select from the relevant options displayed in the Investigate column, which includes a comprehensive set of Cortex XQL library queries for conducting investigations. A summary of the entity's details is displayed. For more details, click Show me more.
Note
In some cases, if the prompt does not include at least one recognizable entity such as an IP, hash, user, asset, domain, case, or XQL query, no response is returned.
Respond
After entering an entity in the Cortex Assistant search bar, you have the option to take action by selecting one of the suggestions listed in the Respond column. These suggestions encompass a variety of actions, such as running playbooks and scripts, performing scans, and collecting support files.
Note
When you choose an option from the Respond column, Cortex Assistant will always prompt you to approve the action before executing.
RBAC
Cortex Assistant uses Cortex’s role-based access control (RBAC) to control the type of access and actions a user can perform in Cortex XSIAM. Suggestions and responses offered by Cortex Assistant will be customized according to that specific user’s RBAC access. A user with Admin rights can manage user roles that are assigned to Cortex XSIAM users or user groups in Cortex XSIAM by selecting Settings → Configurations → Access Management.
Navigation mode
Use Cortex Assistant to navigate in Cortex XSIAM. You can search in navigation mode by entering a forward slash “/” in the search bar, followed by your search string. For example, typing /issues searches for all pages that include the term "issues" and allows you to navigate to them directly.
Additionally, you can enter multiple search terms, and Cortex Assistant will search for pages that include either of the terms (as if there were a logical OR between the words).
Response actions
To assist you with your investigation, Cortex XSIAM provides response actions for investigating and remediating endpoints. For example, if you detect a compromised endpoint you can isolate it from your network. This action prevents the endpoint from communicating with other internal or external devices, and thereby reducing an attacker’s mobility on your network.
For response actions that rely on the Cortex XDR agent, the following table describes the supported platforms and minimum agent version. A dash (—) indicates that the setting is not supported.
| Module | Windows | Mac | Linux | iOS |
|---|---|---|---|---|
Initiate a Live Terminal Session Initiates a remote connection to an endpoint, enabling you to investigate and respond to security events. Using | ✓ Agent 6.1 and later | ✓ Agent 7.0 and later | ✓ Agent 7.0 and later | — |
Isolate an Endpoint Halts all network access on the endpoint except for traffic to Cortex XSIAM. This prevents a compromised endpoint from communicating with other internal or external devices. | ✓ Agent 6.0 and later | ✓ Agent 7.3 and later on macOS 10.15.4 and later | ✓ Agent 7.7 and later | Agent for iOS 9.1 and later. This feature is only available on supervised iOS devices where the Network Shield is enabled. |
Run Scripts on an Endpoint Allows executing Python 3.7 scripts on your endpoints directly from Cortex XSIAM, including out-of-the-box scripts or your own Python scripts and code snippets. | ✓ Agent 7.1 and later | ✓ Agent 7.1 and later | ✓ Agent 7.1 and later | — |
Remediate Changes from Malicious Activity Investigates suspicious causality process chains and cases on your endpoints, and provides suggested actions for remediating processes, files and registry keys on your endpoint that were changed as a result of malicious activity. | ✓ Agent 7.2 and later | — | — | — |
Search and Destroy Malicious Files Searches for the presence of known and suspected malicious files on endpoints, and destroys the file on endpoints where it exists. | ✓ Agent 7.2 and later | ✓ Agent 7.3 and later on macOS 10.15.4 and later | — | — |
Response actions are not supported for Android endpoints.
Initiate a Live Terminal session
To investigate and respond to security events on endpoints, you can use the Live Terminal to initiate a remote connection to an endpoint from Cortex XSIAM. The remote connection is facilitated by the Cortex XDR agent by using a remote procedure call. With the Live Terminal you can manage remote endpoints, and perform investigation and response actions on endpoints. Actions include:
- Navigating and managing files in the file system.
- Managing active processes.
- Running operating system commands and Python commands.
- Downloading files of up to 200 MB and uploading files of up to 40 MB.
Live Terminal is supported for endpoints that meet the following requirements:
| Operating System | Requirements |
|---|---|
| Windows |
|
| Mac |
|
| Linux |
|
You can run PowerShell 5.0 or a later release on Live Terminal of Windows.
Initiate a Live Terminal session
-
You can initiate a Live Terminal session from Inventory → Endpoints → All Endpoints page. Right-click an endpoint and select Security Operations → Initiate Live Terminal. It might take the Cortex XDR agent a few minutes to facilitate the connection.
You can also initiate a Live Terminal as a response action to a security event. If the endpoint is inactive or does not meet the requirements, the option is disabled.
-
Use the Live Terminal to investigate and take action on the endpoint.
You can fine-tune the Live Terminal session visibility on the endpoint by adjusting the User Interface options in your Agent Settings Profile.
-
When you are finished, Disconnect the Live Terminal session.
After you terminate the Live Terminal session, you can save a session report that logs all actions from the Live Terminal session. The report is available for download as a text file report when you close the live terminal session.
The following example displays a sample session report:
Live Terminal Session Summary Initiated by user username@paloaltonetworks.com on target TrapsClient1 at Jun 27th 2019 14:17:45 Jun 27th 2019 13:56:13 Live Terminal session has started [success] Jun 27th 2019 14:00:45 Kill process calc.exe (4920) [success] Jun 27th 2019 14:11:46 Live Terminal session end request [success] Jun 27th 2019 14:11:47 Live Terminal session has ended [success] No artifacts marked as interesting
Manage processes from a Live Terminal session
From the Live Terminal you can monitor processes running on the endpoint. The Task Manager displays the task attributes, owner, and resources used. If you discover an anomalous process while investigating the cause of a security event, you can take immediate action to terminate the process or the whole process tree, and block processes from running.
-
From the Live Terminal session, open the Task Manager to navigate the active processes on the endpoint.
You can toggle between a sorted list of processes and the default process tree view (
 ). You can also export the list of processes and process details to a comma-separated values file. If the process is known as malware, the row displays a red indicator and identifies the file using a malware attribute.
 - Right-click the process to take the following actions:
- Terminate process: Terminate the process or the entire process tree.
- Suspend process: To stop an attack while investigating the cause, you can suspend a process or process tree without killing it entirely.
- Resume process: Resume a suspended process.
- Open in VirusTotal: VirusTotal aggregates known malware from antivirus products and online scan engines. You can scan a file using the VirusTotal scan service to check for false positives or verify suspected malware.
- Get WildFire verdict: WildFire evaluates the file hash signature to compare it against known threats.
- Get file hash: Obtain the SHA256 hash value of the process.
- Download Binary: Download the file binary to your local host for further investigation and analysis. You can download files up to 200MB in size.
- Mark as Interesting: Add an Interesting tag to a process so that you can easily locate the process in the session report.
- Remove from Interesting: If no threats are found, you can remove the Interesting tag.
- Copy Value: Copy the cell value to your clipboard.
-
To end the Live Terminal session, select Disconnect.
Choose whether to save the session report including files and tasks marked as interesting. Administrator actions are not saved to the endpoint.
Manage files from a Live Terminal session
The File Explorer enables you to navigate the file system on the remote endpoint and take the following actions:
-
Create, move, delete, or download files, folders, and drives, including connected external drives and devices such as USB drives and CD-ROM.
Network drives are not supported.
- View file attributes, creation and last modified dates, and the file owner.
- Investigate files for malicious content.
How to manage files from a Live Terminal
- From the Live Terminal session, open the File Explorer.
- Double click to navigate through each file directory. To locate a specific file, you can search for any filename rows on the screen from the search bar.
- From the top right hand menu you can take the following actions:
- Create a new directory
- Export the table as a CSV file.
- Right click a file or folder to see the available actions, including:
- Rename files and folders.
- Move and delete files and folders.
- Download a file.
- Open in VirusTotal: VirusTotal aggregates known malware from antivirus products and online scan engines. You can scan a file using the VirusTotal scan service to check for false positives or verify suspected malware.
- Get WildFire verdict: WildFire evaluates the file hash signature to compare it against known threats.
- Get file hash: Obtain the SHA256 hash value of the file.
- Download Binary: Download the file binary to your local host for further investigation and analysis. You can download files up to 200MB in size.
- Mark as Interesting: Add an Interesting tag to a file or directory so that you can easily locate the file in the session report.
- Remove from Interesting: If no threats are found, you can remove the Interesting tag.
- Copy Value: Copy the cell value to your clipboard.
-
Select Disconnect to end the live terminal session.
Choose whether to save the live terminal session report including files and tasks marked as interesting. Administrator actions are not saved to the endpoint.
Run operating system commands from a Live Terminal session
The Live Terminal provides a command line interface for running operating system commands on a remote endpoint. Each command runs independently and is not persistent.
On Windows endpoints, you cannot run GUI-based cmd commands like winver or appwiz.cpl.
How to run operating system commands
- From the Live Terminal session, select Command Line.
-
Type your command on the command line and press Shift + Enter to execute the command.
For example, you can manage files or launch batch files. You can enter or paste the commands into the command line interface, or you can upload a script.
Example 169.
To chain multiple commands together use
&&, as shown in the following example:cd c:\windows\temp\ && <command1> && <command2>
-
To end the Live Terminal session, select Disconnect.
Choose whether to save the session report including files and tasks marked as interesting. Administrator actions are not saved to the endpoint.
Run Python commands and scripts from a Live Terminal session
The Live Terminal provides a Python command line interface for running Python commands and scripts. The Python command interpreter uses Unix command syntax and supports Python 3 with standard Python libraries.
- From the Live Terminal session, select Python to start the python command interpreter on the remote endpoint.
-
Run Python commands or scripts as required.
You can enter or paste the commands into the command line interface, or you can upload a script.
-
When you are finished, Disconnect the Live Terminal session.
Choose whether to save the live terminal session report including files and tasks marked as interesting. Administrator actions are not saved to the endpoint.
Disable Live Terminal sessions
If you want to prevent Cortex XSIAM from initiating Live Terminal remote sessions on an endpoint that is running the Cortex XDR agent, you can disable this capability during agent installation or through Cortex XSIAM Endpoint Administration. Disabling script execution is irreversible. If you later want to re-enable this capability on the endpoint, you must re-install the Cortex XDR agent.
Disabling Live Terminal does not take effect on sessions that are in progress.
Isolate an endpoint
When you isolate an endpoint, you halt all network access on the endpoint except for traffic to Cortex XSIAM. This can prevent a compromised endpoint from communicating with other endpoints, thereby reducing an attacker’s mobility on your network. After the agent receives the instruction to isolate the endpoint and carries out the action, Cortex XSIAM shows an Isolated status. To ensure an endpoint remains in isolation, agent upgrades are not available for isolated endpoints.
When isolated, the endpoint will still allow:
- DHCP and HTTPS outgoing traffic for root user
- DNS traffic
IP-based file storage protocol traffic will also be blocked. This might affect endpoint functionality if the endpoint uses such mounts.
Network isolation is supported for endpoints that meet the following requirements:
| Operating System | Prerequisites |
|---|---|
| Windows |
|
| Mac |
Network isolation on Mac endpoints does not terminate active connections that were initiated before the agent was installed on the endpoint. |
| Linux |
Network isolation on Linux endpoints is based on the defined IP addresses and ports. |
| iOS | Supported by Cortex XDR agent for iOS 9.1 or later. This feature is only available on supervised iOS devices where the Network Shield is enabled. |
How to isolate an endpoint in Cortex XSIAM
-
Go to Investigation & Response → Response → Action Center → New Action and select Isolate.
You can also initiate the action (for one or more endpoints) from the Isolation page of the Action Center or from Endpoints → Endpoint Management → Endpoint Administration.
-
Enter a Comment to provide additional background or other information that explains why you isolated the endpoint.
After you isolate an endpoint, Cortex XSIAM displays the Isolation Comment under Action Center → Isolation. If needed, you can edit the comment from the right-click pivot menu.
- Click Next.
-
Select the target endpoint that you want to isolate from your network.
If needed, Filter the list of endpoints.
- Click Next.
-
Review the action summary and click Done when finished.
In the next heartbeat, the agent will receive the isolation request from Cortex XSIAM.
-
To track the status of an isolation action, go to Action Center → Currently Applied Actions → Endpoint Isolation.
If after initiating an isolation action, you can cancel the action by right-clicking the action and selecting Cancel for pending endpoint. You can cancel the isolation action only if the endpoint is still in
Pendingstatus and has not been isolated yet. -
After you remediate the endpoint, cancel endpoint isolation to resume normal communication.
You can cancel isolation from Actions Center → Isolation or from Endpoints → Endpoint Management → Endpoint Administration. From either place right-click the endpoint and select Endpoint Control → Cancel Endpoint Isolation.
If file system operations become unresponsive during isolation, such as being unable to list folder content, unmount the mounted network shares.
Pause endpoint protection
As of agent 7.7 and above, you can pause the agent protection capabilities on one or more endpoints while maintaining connectivity with Cortex XSIAM. By only pausing the protection and retaining connectivity, the agent will run with all the profiles disabled, but continue to send data and take actions from the server. When you are ready, you can resume the endpoint protection.
Pausing your endpoint protection modules leaves your machines exposed to risks.
How to pause endpoint protection modules
- Go to Inventory→ Endpoints → All Endpoints.
- In the All Endpoints page, select the endpoints on which you want to pause protection, right-click and select Endpoint Control → Pause Endpoint Protection.
-
Verify the endpoints, add an optional comment that appears in the Management Audit log, and Pause the protection.
Paused endpoints display a pause icon in the Endpoint Name field, and one of the following the action statuses in Manual Protection Pause field:
- Protection Active
- Pending Pause
- Protection Paused
- Pending Activation
-
When you are ready to resume protection, select the paused endpoints, right-click and select Endpoint Control → Resume Endpoint Protection and Resume protection on the listed endpoints.
The All Endpoint table fields are updated accordingly.
-
Track your pause and resume endpoint protection actions.
Go to Investigation & Response → Response → Action Center and locate Action Type Pause Endpoint Protection or Resume Endpoint Protection.
Run agent scripts on an endpoint
For enhanced endpoint remediation and endpoint management, you can run Python 3.7 scripts on your endpoints directly from Cortex XSIAM. For commonly used actions, Cortex XSIAM provides out-of-the-box scripts. You can also write and upload your own Python scripts and code snippets into Cortex XSIAM for custom actions. Cortex XSIAM enables you to manage, run, and track the script execution on the endpoints, and store and display the execution results per endpoint.
To run scripts on an endpoint, you must have the following system requirements:
- Endpoints running the Agent v7.1 and later. Since the agent uses its built-in capabilities and many available Python modules to execute the scripts, no additional setup is required on the endpoint.
-
Role in the hub with the following permissions to run and configure scripts:
- Run Standard scripts
- Run High-risk scripts
- Script configuration (required to upload a new script, run a snippet, and edit an existing script)
- Scripts (required to view the Scripts Library and the script execution results)
Running snippets requires both Run High-risk scripts and Script configuration permissions. Additionally, all scripts are executed as System User on the endpoint.
Manage scripts in the Scripts Library
Your scripts are available in the Action Center → Scripts Library, including out-of-the-box scripts and custom scripts. From the Scripts Library, you can view the script code and metadata, and perform the following actions from the right-click pivot menu:
- Download script: Download the Python code file locally.
- View/Download definitions file: View or download the script metadata.
- Run: Run the selected script. Cortex XSIAM redirects you to the Action Center where the details of this script are populated in the new action fields.
- Edit: Edit the script code or metadata. This option is not available for the out-of-the-box scripts.
The following table describes the default and optional fields that you can view in the Scripts Library. The fields are in alphabetical order.
| Field | Description |
|---|---|
| Compatible OS | Operating systems with which the script is compatible. |
| Created By | User who created the script. For out-of-the-box scripts, the user name is Palo Alto Networks. |
| Description | Script description is an optional field that can be completed when creating, uploading, or editing a script. |
| Id | Unique ID assigned by Cortex XSIAM to identify the script. |
| Modification Date | Date and time in which the script or its attributes were last edited. |
| Name | Script name is a mandatory field that can be completed when creating, uploading, or editing a script. |
| Outcome |
|
| Script FileSHA256 | SHA256 of the code file. |
Out-of-the-box scripts
Palo Alto Networks provides out-of-the-box scripts. You can view the scripts, download the script code and metadata, and duplicate the scripts, however you cannot edit the code or definitions of out-of-the-box scripts.
The following table lists the out-of-the-box scripts provided by Palo Alto Networks, in alphabetical order. New scripts are continuously uploaded into Cortex XSIAM through content updates, and are labeled New for a period of three days.
| Script name | Description |
|---|---|
| delete_file | Delete a file on the endpoint according to the full path. |
| file_exists | Search for a specific file on the endpoint according to the full path. |
| get_process_list | List CPU and memory for all processes running on the endpoint. |
| list_directories | List all directories under a specific path on the endpoint. You can limit the number of levels you want to list. |
| process_kill_cpu | Set a minimum CPU value and kill all process on the endpoint that are using higher CPU. |
| process_kill_mem | Set a minimum RAM usage in bytes and kill all process on the endpoint that are using higher private memory. |
| process_kill_name | Kill all processes by a given name. |
*registry_delete (Windows) | Delete a Registry key or value on the endpoint. |
*registry_get (Windows) | Retrieve a Registry value from the endpoint. |
*registry_set (Windows) | Set a Registry value from the endpoint. |
*Since all scripts are running under System context, you cannot perform any registry operations on user-specific hives (HKEY_CURRENT_USER of a specific user).
Upload your scripts
You can write and upload scripts to the Scripts Library.
-
Go to Action Center → Agent Script Library and select New Script.
Drag your script file into the window, or browse and select it. During upload, Cortex XSIAM parses the script to ensure you are using only supported Python modules. Click supported modules to view the supported modules list. If your script is using unsupported Python modules, or if your script is not using proper indentation, you will be required to fix it. You can use the editor to update your script directly in Cortex XSIAM.
-
Add metadata to your script.
You can enter the field definitions manually, or upload a definitions file to automatically enter the definitions. The definitions file must use exact script manifest format. To view the manifest format and create your own, see Create a script manifest.
Complete the following fields:
- General: Specify the general script definitions including name and description, risk categorization, supported operating systems, and timeout in seconds.
-
Input: Set the starting execution point of your script code. To execute the script line by line, select Just run. Alternatively, to set a specific function in the code as the entry point, select Run by entry point. Select the function from the list, and specify for each function parameter its type.
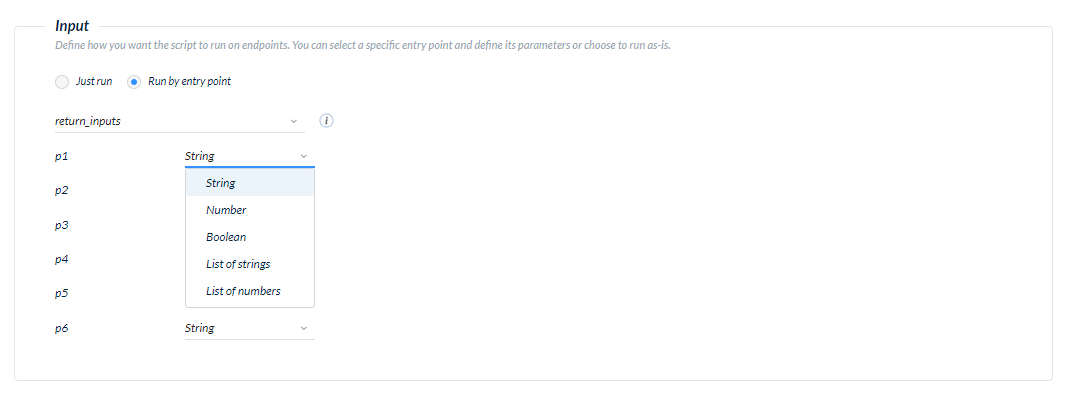
-
Output: If your script returns an output, specify the output type. Cortex XSIAM displays this information in the script results table.
- Single parameter: If the script returns a single parameter, select the output type from the list and the output will be displayed as is. To detect the type automatically, select Auto Detect.
-
Dictionary: If the script returns multiple values, select Dictionary. By default, Cortex XSIAM displays the dictionary value as is in the script results table.
To improve the display of the script results table and enable filtering, you can assign user-friendly names and types to your dictionary keys.
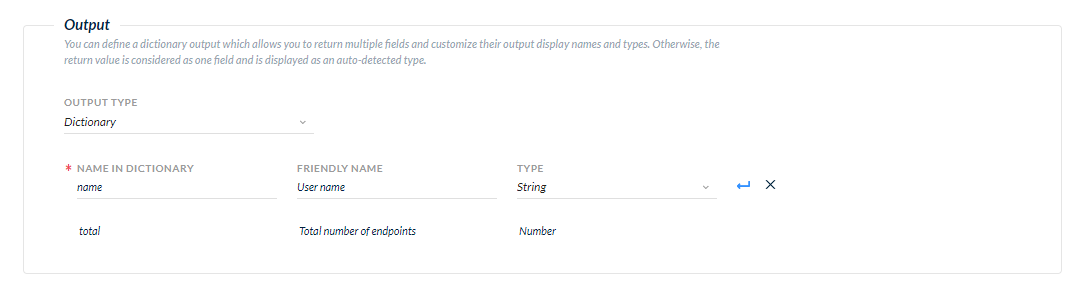
To retrieve files from the endpoint, add the
files_to_getkey to the dictionary. This key includes an array of paths from which files will be retrieved from the endpoint.
-
When you are finished, create the new script. The script is uploaded to the Scripts Library.
Create a script manifest
You can create a script manifest to automatically enter file definitions for a script. For more information, see Step 2 in Upload your scripts.
The script manifest file that you upload into Cortex XSIAM has to be a single-line textual file, in the exact format explained below. If your file is structured differently, the manifest validation will fail and you will be required to fix the file.
Example
This is an example of the manifest file structure and content.
In this example, we are showing each parameter in a new line. However, when you create your file, you must remove any \n or \t characters.
{ "name":"script name", "description":"script description", "outcome":"High Risk|Standard", "platform":"Windows,macOS,Linux", "timeout":600, "entry_point":"entry_point_name", "entry_point_definition":{ "input_params":[ {"name":"registry_hkey","type":"string"}, {"name":"registry_key_path","type":"number"}, {"name":"registry_value","type":"number"}], "output_params":{"type":"JSON","value":[ {"name":"output_auto_detect","friendly_name":"name1","type":"auto_detect"}, {"name":"output_boolean","friendly_name":"name2","type":"boolean"}, {"name":"output_number","friendly_name":"name3","type":"number}, {"name":"output_string","friendly_name":"name4","type":"string"}, {"name":"output_ip","friendly_name":"name5","type":"ip"}] } }
Always use lowercase for variable names.
How to create a script manifest
-
Type the script name and description.
You can use letters and digits. Avoid the use of special characters.
-
Categorize the script.
If a script is potentially harmful, set it as
High— Riskto limit the user roles that can run it. Otherwise, set it asStandard. -
Assign the platform.
Enter the name of the operating system this script supports. The options are Windows, macOS, and Linux. If you need to define more than one, use a comma as a separator.
-
Set the script timeout.
Enter the number of seconds after which Cortex XSIAM agent halts the script execution on the endpoint.
-
Configure the script input and output.
To Run by entry point, you must specify the entry point name, and all input and output definitions.
The available parameter types are:
auto_detectbooleannumberstringipnumber_liststring_listip_list
To set the script to Just run, leave both the
Entry_pointandEntry_point_definitionsempty:Example
{ "name":"script name", "description":"script description", "outcome":"High Risk|Standard", "platform":"Windows,macOS,Linux", "timeout":600, "entry_point":"", "entry_point_definition":{} }
Track script execution
When you run a script, you can see the script execution in the Action Center and track the script execution status. The Status indicates the action's progress, which includes the general action status and the breakdown by endpoints included in the action. The following table lists the possible status of a script execution action for each endpoint, in alphabetical order:
| Status | Description |
|---|---|
| Aborted | The script execution action was aborted after it was already in progress on the endpoint. |
| Canceled | The script execution action was canceled before the agent pulled the request from the server. |
| Completed Successfully | The script was executed successfully on the endpoint with no exceptions. |
| Expired | The script execution actions expire after four days. After an action expires, the status of any remaining pending actions on endpoints changes to Expired and these endpoints will not receive the action. |
| Failed | A script can fail due to these reasons:
|
| In Progress | The agent pulled the script execution request. |
| Pending | The agent has not yet pulled the script execution request from the server. |
| Pending Abort | The agent is in the process of executing the script, and has not pulled the abort request from the server yet. |
| Timeout | The script execution reached its configured time out and the agent stopped the execution on the endpoint. |
Open script in Interactive Mode
You can use Interactive Mode to dynamically track the script execution progress on all target endpoints and view the results as they are being received in real-time. Additionally, you can start executing more scripts on the same scope of target endpoints.
To initiate Interactive Mode for a script that is already running, in the Action Center, right-click the execution action of the relevant script and select Open in interactive mode.
Cancel or abort script execution
You can cancel or abort a script execution action for Pending and In Progress actions:
- When the script execution action is Pending, the agent has not yet pulled the request from the Cortex XSIAM server. When you cancel a pending action, the server pulls back the request and updates the action status to Canceled. To cancel the action for all pending endpoints, go to the Action Center, right-click the action and Cancel for pending endpoints. Alternatively, to cancel a pending action for specific endpoints, go to Action Center → Additional data → Detailed Results, right-click the endpoint(s) and Cancel pending action.
- When the script execution action is In Progress, the agent has begun running the script on the endpoint. When you abort an action that is in progress, the agent halts the script execution on the endpoint and updates the action status to Aborted. To abort the action for all In Progress endpoints and cancel the action for any Pending endpoints, go to the Action Center, right-click the action and Abort and cancel execution. Alternatively, to abort an in progress action for specific endpoints, go to Action Center → Additional data → Detailed Results, right-click the endpoints and Abort for endpoint in progress.
View script execution results
Cortex XSIAM logs all script execution actions, including the script results and the parameters specified when running the script. To view full details about the run, including returned values, right-click the script and select Additional data.
The script results are divided into the upper bar and the main view. The upper bar displays the script meta-data including the script name and entry point, the script execution action status, the parameter values used in this run and the target endpoints scope. You can also download the exact code used in this run as a py file.
The main view displays the script execution results as follows:
-
Main results view: Displays a table listing all target endpoints and their details.
In addition to the endpoint details (name, IP, domain, etc), the following table describes the default and additional optional fields that you can view per endpoint. The fields are in alphabetical order.
Field Description * Returned valuesIf your script returned values, the values are also listed in the additional data table according to your script output definitions. Execution timestamp Date and time the agent started the script execution on the endpoint. If the execution has not started yet, this field is empty. Failed files Number of files the agent failed to retrieve from the endpoint. Retention date Date after which the retrieved file will no longer be available for download. The value is 90 days from the execution date. Retrieved files Number of files that were successfully retrieved from the endpoint. Status See the list of statuses and their descriptions in Track script execution. Standard output The returned stdoutFor each endpoint, you can right-click to download the script
stdout, download retrieved files, and view returned exceptions. You can also Export to file to download the detailed results table inTSVformat. -
Aggregated results: A visualization of the script results. Cortex XSIAM automatically aggregates only results that have a small variety of values. To see how many of the script results were aggregated successfully, see the counts on the toggle (for example, aggregated results 4/5). You can filter the results to adjust the endpoints considered in the aggregation. You can also generate a PDF report of the aggregated results view.
Rerun a script
You can select a script execution action in the Action Center and rerun it. When you rerun a script, the same parameter values, target endpoints, and defined timeout are used, as defined in the previous run. However, you can make changes to the script before rerunning it. In addition, if the target endpoints in the original run were defined using a filter, the filter will be recalculated when you rerun the script.
Cortex XSIAM uses the current version of the script. If the script has been deleted or the supported operating system definition has been modified the since the previous run, you will not be able to rerun the script.
-
From the Action Center, right-click the script you want to rerun and select Rerun.
You are redirected to the final summary stage of the script execution action.
-
Run the script.
To run the script with the same parameters and on the same target endpoints as the previous run, click Done. To change any of the previous run definitions, navigate through the wizard and make the necessary changes. Then, click Done. The script execution action is added to the Action Center.
Troubleshoot script execution
To understand why a script returned Failed execution status, you can take the following actions:
- Check script exceptions: If the script generated exceptions, you can view them to learn why the script execution failed. From the Action Center, right-click the Failed script and select Additional data. In the Script Results table, right-click an endpoint for which the script execution failed and select View exceptions. The agent executes scripts on Windows endpoints as a SYSTEM user, and on Mac and Linux endpoints as a root user. These context differences could cause differences in behavior, for instance when using environment variables.
- Validate custom scripts: If a custom script that you uploaded failed, and the reason the script failed is still unclear from the exceptions or if the script did not generate any exceptions, try to identify whether it failed due to an error in Cortex XSIAM or an error in the script. To identify the error source, execute the script without the agent on the same endpoint with regular Python 3.7 installation. If the script execution is unsuccessful, you should fix your script. Otherwise, if the script was executed successfully with no errors, contact Customer Support.
Disable script execution
If you want to prevent Cortex XSIAM from running scripts on an agent, you can disable this capability during agent installation, or through Endpoint Administration. Disabling script execution is irreversible. If you want to re-enable this capability on the endpoint, you must reinstall the agent. For more information, see the Cortex XDR Agent Administrator’s Guide.
Disabling Script Execution does not take effect on scripts that are in progress.
Remediate changes from malicious activity
When investigating cases and causality chains you might need to restore and revert changes made to your endpoints as result of a malicious activity. To avoid manually searching for the affected files and registry keys on your endpoints, you can request remediation suggestions.
To initiate remediation suggestions, you must have the following system requirements:
- An App Administrator, Privileged Responder, or Privileged Security Admin role permissions which include the remediation permissions.
- EDR data collection enabled.
- Agent version 7.2 or above on Windows endpoints.
How to initiate remediation suggestions in Cortex XSIAM
-
You can initiate a remediation suggestions analysis from the following places:
-
In the Cases view, click the more options icon in the cases panel and select Remediation Suggestions.
Endpoints that are part of the Case view and do not meet the required criteria are excluded from the remediation analysis.
-
In the Causality View:
- Right-click any process node involved in the causality chain and select Remediation Suggestion.
- Select Actions → Remediation Suggestions.
Analysis can take a few minutes. You can minimize the analysis pop-up if desired while navigating to other pages.
-
- Review the remediation suggestion summary and details.
- Select one or more rows, right-click and select Remediate.
-
Track your remediation process.
Go to Investigation & Response → Response → Action Center → All Actions and locate your remediation process in the Action Type field. Right-click Additional data to open the Detailed Results window.
Field descriptions
| Field | Description |
|---|---|
| Original Event Description | Summary of the initial event that triggered the malicious causality chain. |
| Original Event Timestamp | Timestamp of the initial event that triggered the malicious causality chain. |
| Endpoint Name | Hostname of the endpoint. |
| IP Address | IP address associated with the endpoint. |
| Endpoint Status | Connectivity status of the endpoint. |
| Domain | Domain or workgroup to which the endpoint belongs, if applicable. |
| Endpoint ID | Unique ID assigned by Cortex XSIAM that identifies the endpoint. |
| Suggested Remediation | Action suggested by the remediation scan for you to apply to the causality chain process:
|
| Suggested Remediation Description | Summary of the remediation suggestion to apply to the file or registry. |
| Remediation Status | Status of the applied remediation. |
| Remediation Date | Displays the timestamp of when all of the endpoint artifacts were remediated. If missing a successful remediation, the field will not display the timestamp. |
Search and destroy malicious files
To take immediate action on known and suspected malicious files, you can search and destroy the files. After identifying the presence of a malicious file, you can immediately destroy the file from any or all endpoints on which the file exists.
The agent builds a local database on the endpoint with a list of all the files, including their path, hash, and additional metadata. Depending on the number of files and the disk size of each endpoint, it can take a few days for Cortex XSIAM to complete the initial endpoint scan and populate the files database. You cannot search an endpoint until the initial scan is complete and all file hashes are calculated.
After the initial scan is complete, the agent retains a snapshot of the endpoint files inventory. The agent maintains the files database by initiating periodic scans and closely monitoring all actions performed on the files.
You can search for specific files according to the file hash, the file full path, or a partial path using regex parameters from the Action Center or the Query Builder. When you find the file, you can select it in the search results and destroy the file by hash or by path. If you already know the path or hash, you can also destroy a file from the Action Center without performing a search. When you destroy a file by hash, all the file instances on the endpoint are removed.
You can validate a hash against VirusTotal and WildFire to provide additional context before initializing the File Destroy action.
The Cortex XSIAM agent does not include the following information in the local files inventory:
- Information about files that existed on the endpoint and were deleted before the Cortex XSIAM agent was installed.
- Information about files where the file size exceeds the maximum file size for hash calculations that are pre-configured in Cortex XSIAM .
- If the Agent Settings Profile on the endpoint is configured to monitor common file types only, then the local files inventory includes information about these file types only. You cannot search or destroy file types that are not included in the list of common file types.
The following are prerequisites to enable Cortex XSIAM to search and destroy files on your endpoints:
- Supported platforms:
- Windows: Cortex XDR agent version 7.2 or a later. If you plan to enable Search and Destroy on VDI sessions, you must perform the initial scan on the Golden Image.
- Mac: Cortex XDR agent version 7.3 or a later release running on macOS version 10.15.4 or later.
- Linux: Not supported.
- Setup and permissions:
- Ensure File Search and Destroy is enabled for your Cortex XDR agent.
- Ensure your Cortex XSIAM role has File search and Destroy files permissions.
Search a file
You can search for files on the endpoint by file hash or file path. The search returns all instances of this file on the endpoint. You can then immediately destroy all of the file instances on the endpoint, or upload the file to Cortex XSIAM for further investigation.
You can search for a file using the following workflow:
- From the Action Center select New Action → File Search.
- Configure the search method:
- To search by hash, enter the file SHA256 value. When you search by hash, you can also search for deleted instances of this file on the endpoint.
- To search by path, enter the specific path for the file on the endpoint or specify the path using wildcards. When you provide a partial path or partial file name using
*, the search will return all the results that match the partial expression. Note the following limitations:- The file path must begin with a drive name, for example:
c:\. - You must specify the exact path folder hierarchy. For example,
c:\users\user\file.exe. You must specify the exact path folder hierarchy also when you replace folder names with wildcards, by using a wildcard for each folder in the hierarchy. For example,c:\*\file.exe.
- The file path must begin with a drive name, for example:
- Select the target endpoints on which you want to search for the file. Cortex XSIAM displays only endpoints eligible for file search. Click Next.
-
Review the summary and initiate the search.
Cortex XSIAM displays the summary of the file search action. If you need to change your settings, go Back. If all the details are correct, click Run. The File search action is added to the Action Center.
-
Review the search results.
In the Action Center, you can monitor the action progress in real-time and view the search results for all target endpoints. For a detailed view of the results, right-click the action and select Additional data. Cortex XSIAM displays the search criteria, timestamp, and real-time status of the action for the target endpoints. You can:
- View results by file (default view): Cortex XSIAM displays the first 100 instances of the file from every endpoint. Each search result includes details about the endpoint, such as endpoint UUID, OS and endpoint status, name, IP address, and operating system, and details about the file instance, such as full file name and path, hash values, and creation and modification dates.
- View the results by endpoint: For each endpoint in the search results, Cortex XSIAM displays details about the endpoint, such as endpoint status, name, IP address, and operating system, the search action status, and details about the file, whether it exists on the endpoint or not, how many instances of the file exist on the endpoint, and the last time the action was updated.
If not all endpoints in the query scope are connected or the search has not completed, the search action remains in Pending status.
-
(Optional) Destroy a file.
After you locate the malicious file instances on all your endpoints, proceed to destroy all the file instances on the endpoint. From the search results Additional data, right-click the file to immediately Destroy by path, Destroy by hash, or Get file to upload it to Cortex XSIAM for further examination.
Destroy a file
When you know a file is malicious, you can destroy all of its instances on your endpoints, directly from Cortex XSIAM. You can destroy a file immediately from the File search action result, or initiate a new action from the Action Center. When you destroy a file, the Cortex XSIAM agent deletes all the file instances on the endpoint.
- From the Action Center select New Action → Destroy File.
- To destroy by hash, provide the SHA256 of the file. To destroy by path, specify the exact file path and file name. Click Next.
- Select the target endpoints from which you want to remove the file. Cortex XSIAM displays only endpoints eligible for file destroy. When you're done, click Next.
-
Review the summary and initiate the action.
Cortex XSIAM displays the summary of the file destruction. If you need to change your settings, go Back. If all the details are correct, click Run. The file destruction action is added to the Action Center.
Manage external dynamic lists
An External Dynamic List (EDL) is a hosted text file. In Cortex XSIAM, you can configure an EDL to share a list of Cortex XSIAM indicators with other products in your network, such as a firewall. For example, your Palo Alto Networks firewall can add IP addresses and domain data from the EDL to block or allow lists.
Cortex XSIAM hosts the following external dynamic lists that you can configure and manage:
- IP Addresses EDL
- Domain Names EDL
Prerequisites
Before you start, you must have a role that includes View/Edit EDL permissions, such as Instance Admin.
If creating a custom role, select View/Edit for EDL (Roles → New Roles → INVESTIGATION & RESPONSE → Response → EDL).
You can set up an EDL on the Cortex XSIAM tenant or an engine.
- Configuring custom certificates or private API Keys in the EDL integration instance is supported only on engines, not on the Cortex XSIAM tenant.
- For EDL integrations on the tenant, you must set a username and password. For long-running integrations running on an engine, we strongly recommend setting a username and password, but it is not required. You can set credentials for all EDL integrations or for a specific integration instance.
- The legacy external dynamic list PAN-OS integration is deprecated. Use the EDL integration on the Data Sources & Integrations page (by clicking the Automation & Feed Integration link.
Configure the EDL in Cortex XSIAM
- Navigate to Settings → Configurations → Integrations → External Dynamic List Integration.
- Under External Dynamic List Credentials, enter a username and password.
- In the External Dynamic List - Generic Integration section, click the link to configure the External Dynamic List integration.
- Select the Generic Export Indicators Service integration and click Add Instance.
- If you are using an engine, add the following:
- Listen Port: The service to access the EDL runs on this port from within Cortex XSIAM. You need a unique port for each long running integration instance. Do not use the same port for multiple instances.
- Run on single engine: Select the engine from a drop-down.
-
Enter the indicator query.
The query updates the EDL list. To view expected results, run
!findIndicators query=<your query>from the Cortex XSIAM CLI. Field names in your query must match the machine name for each field. -
Enter the maximum list size.
If an indicator query returns more indicators than the EDL list size, the list is populated with the most recent indicators sorted by their last seen timestamp, where
nis the maximum size of the EDL. -
The EDL URL must always be prefixed by
ext-.If using EDL data on the Cortex XSIAM tenant, run the following
curlcommand to access and test the External Dynamic List:https://ext-<cortex-xsiam-address>/xsoar/instance/execute/<instance-name>
Example
curl -v -u user:pass https://ext-mytenant.paloaltonetworks.com/xsoar/instance/execute/edl_instance_01?q=type:ip
If using EDL data on an engine, run the following
curlcommand to access and test the External Dynamic List with the engine URL:http://<engine-address>:<integration listen port>/
Example
curl -v -u user:pass http://<engine_address>:<listen_port>/?n=50
Configure the Firewall to authenticate the EDL
- Enable the firewall to authenticate the EDL.
- Download the following root certificate: https://cacerts.digicert.com/DigiCertGlobalRootG2.crt.pem.
- On the firewall, select Device → Certificate Management → Certificates and import the certificate. Make sure to give the device certificate a descriptive name, and select OK to save the certificate.
- Select Device → Certificate Management → Certificate Profile and Add a certificate profile.
- Give the profile a descriptive name and add the certificate to the profile.
- Select OK to save the profile.
-
Set the Cortex XSIAM EDL as the source for a firewall EDL.
For more detailed information about how Palo Alto Networks firewall EDLs work, how you can use EDLs, and how to configure them, review how to Use an External Dynamic List in Policy.
- On the firewall, select Objects → External Dynamic Lists and Add a new list.
- Define the list Type as either IP List or Domain List.
- Enter the IP Addresses Block List URL or the Domains Block List URL that you recorded in the last step as the list Source.
- Select the Certificate Profile that you created in the last step.
- Select Client Authentication and enter the username and password that the firewall must use to access the EDL.
- Use the Repeat field to define how frequently the firewall retrieves the latest list from the Cortex XSIAM EDL.
- Click OK to add the new EDL.
-
Select Policies → Security and Add or edit a security policy rule to add the Cortex XSIAM EDL as match criteria to a security policy rule.
Review the different ways you can Enforce Policy on an External Dynamic List; this topic describes the complete workflow to add an EDL as match criteria to a security policy rule.
- Select Policies → Security and Add or edit a security policy rule.
- In the Destination tab, select Destination Zone and select the external dynamic list as the Destination Address.
- Click OK to save the security policy rule and Commit your changes.
You do not need to perform an additional commit or make any subsequent configuration changes for the firewall to enforce the EDL as part of your security policy, even as you update the Cortex XSIAM EDL, the firewall will enforce the list most recently retrieved from Cortex XSIAM.
You can also use the IP list and URL lists as part of a URL Filtering policy, or the domain list as part of a custom Anti-Spyware profile.
Add an IP address or domain to your EDL
You can add IP addresses or Domains to your EDL to raise your triage issues from the Action Center or throughout Cortex XSIAM.
Ensure EDL sizes don't exceed your firewall model limit.
To add an IP address or Domain from the Action Center, select Add to EDL. You can choose to enter the IP address or Domain you want to add Manually or choose to Upload File.
During investigation, you can also Add to EDL from the Actions menu that is available from investigation pages such as the Issues View, Causality View, or IP View. At any time, you can view and make changes to the IP addresses and domain names in the EDL.
- Go to Investigation & Response → Action Center → Currently Applied Actions → External Dynamic List.
- Review your IP addresses and domain names lists.
- If desired, select New Action to add additional IP addresses and domain names.
- If desired, select one or more IP addresses or domain names, right-click and select Delete any entries that you no longer want included on the lists.
Collect a memory image
This functionality requires a Forensics add-on license.
Certain forensic artifacts exist only in the computer’s memory, such as volatile data created by running processes. The Memory Collection option enables Cortex XSIAM to capture the memory of a Windows endpoint. After the memory image has been captured from the Cortex XSIAM endpoint, the image is available to download. Use the image to perform a full analysis using industry-standard tools.
How to collect a memory image
- From the Action Center select Run Action → Memory Collection.
- Select the target Windows endpoint from which you want to collect the memory image (only one endpoint at a time). Click Next.
-
Review the summary and initiate the action.
A summary of the memory collection action is displayed. If you need to change your settings, click Back. If all the details are correct, click Done. The Memory Collection action is added to the Action Center.
-
Review the collection results.
In the Action Center, you can monitor the action progress in real-time and view the status for the target endpoint. For a detailed view of the results, right-click the action and select Additional data. Cortex XSIAM displays the action, timestamp, and real-time status of the action on the target endpoint.
-
Download the file of the image.
In the Detailed Results - Memory Collection screen, right-click the action and select Download files.
The file is downloaded to the local computer.
Forensics
Notice
Requires the Forensics add-on
Forensic investigations
Investigations are comprised of one or more data collections from endpoints within an environment. Grouping the collections within a single location enables you to focus on the endpoints relevant to your investigation. When searching for data, you can select two types of collections:
- Hunt collections enable you to search for a specific activity across a large number of hosts. A hunt collection provides more details about where something occurred. Examples of this type of collection are, finding which endpoints ran a piece of malware, which users accessed a particular file, or which endpoints were accessed by a specific user.
- Triage collections enable you to collect detailed information about specific activities that occurred on an endpoint. The triage functionality is configurable and supports the collection of all currently supported forensic artifacts, user-defined file paths, a full file listing for all of the connected drives, full event logs, and registry hives. The amount of data collected during a triage can be large, so triages are limited to ten or fewer endpoints per collection.
Manage an investigation
Forensic investigations streamlines your case response, data collection, threat hunting and analysis of your endpoint in Cortex XSIAM. By using the Forensic Investigation, you can find the source and scope of the attack and to determine what, if any, data was accessed. It provides a single location for grouping, tracking, and analyzing all forensic data collections.
Forensic Investigations enables you to do the following:
- View any alerts triggered during data ingested as part of the investigation.
- Tag relevant evidence for inclusion for the Investigation Timeline.
- Export collected data for long-term retention.
- Set user permissions that can be assigned to investigations allowing you to restrict access to the Investigation page including the Investigation Timeline and collection details.
The Forensic Investigation fields shows information relating to the investigation.
| Field | Description |
|---|---|
| Investigation | Name of the investigation. |
| Status | Present status of the investigation:
|
| Evidence collections | Number of completed collections from the total collections. |
| New alerts | Total count of alerts for the collection where the Resolution Status=New. |
| Total alerts | Total number of alerts for data collected in the investigation You can click the link to open the investigation on the Alerts tab. |
| Created | Timestamp of when the investigation was created. |
Create a new investigation
Create a forensics investigation that includes all the relevant forensics data. This includes adding collections (hunts and triages), exporting the data collections, managing alerts and evaluating key assets & artifacts.
- Select Investigation & Response → Forensics.
- Click New Investigation.
- In the Create New Investigation wizard, enter a name and description (optional) for the investigation.
-
In the Permissions table, select the users to whom you want to grant access to the investigation data.
To set up user permissions, you must have Scope-Based Access Control (SBAC) enabled.
Refer to User permissions for detailed information on permissions.
- Click Save to save the investigation in the Forensic Investigations table or click Save & Start A Collection to start the process of adding collections.
- In the New Collection widget, select Triage or Hunt.
- The investigation is saved to the Forensic Investigations table.
- Click UTC Timezone to configure the timezone and timestamp format. Refer to Configure server settings for information on setting up your timezone.
Edit an investigation
From the list of active investigations, you can edit the name, description or update the user permissions for the investigation.
- From the Forensic Investigations table, right-click one of the investigations and select Edit.
- In the Edit Investigation widget, you can update the Investigation Name, Description, and Permissions. For more information, refer to User permissions.
Close an investigation
From the list of ongoing investigations, you can close an investigation. You might want to close an investigation if resolved, or if you want to cancel the investigation.
When you close an investigation, Cortex XSIAM has a grace period of 24 hours before deleting any collections associated with the investigation. During this timeframe, you have the option to cancel the close investigation action.
- From the Forensic Investigations table, right-click an investigation and select Close.
- In the Close Investigation widget, you can view all evidence collections exported for the investigation.
- In the Forensic Investigation table, the status of the investigation changes to Close Pending, and the timestamp displays the time the investigation expires and the investigation data is deleted.
- Right-click an investigation pending closure to display the following options::
- Edit: Update the investigation name, description, or adjust user permissions.
- Open: Cancel the close request.
- Permanently delete: Delete the investigation and all associated data immediately. This action can't be canceled.
User permissions
By default, investigation permissions utilize the role-based access control (RBAC) settings configured in the system. Users must have a role with the Forensic permissions set to View in order to view forensic investigations. In order to create investigations or collections, a user must have a role where the Forensics permissions is set to View/Edit. Without either role, a user cannot interact with the forensics interface.
If Scope-Based Access Control (SBAC) is enabled on your system, from the Permissions table, you can select the users from which to assign permissions to the investigation.
Users with account administrator or instance administrator roles have access to investigations and can't be cleared from the Permissions table. They can view and edit all Investigations, including adding/removing users, creating/deleting collections, closing the Investigation. This prevents investigation lockout in the event of a user leaving before the Investigation is complete.
Even if a user does not have access to view an investigation via the Forensics Investigations page, they can still query the results of the collections using an XQL query.
The Permissions fields describe the following information:
| Field | Description |
|---|---|
| User Name | Name of the user as logged in the Settings → Configurations → Access Management → Users. |
| The user's email as logged in the Settings → Configurations → Access Management → Users. | |
| User Type | Indicates whether the user was defined in Cortex XSIAM using the CSP (Customer Support Portal), SSO (single sign-on) using your organization’s IdP, or both CSP/SSO. |
| Role | Name of the role assigned specifically to the user that is not inherited from somewhere else, such as a User Group. When the user does not have any Cortex XSIAM access permissions that are assigned specifically to them, the field displays No-Role. |
| Permissions | Options are None, View, View/Edit |
Data collection
The data collection section includes information related to each collection type.
Hunting
Hunting enables investigators to search for specific data across a large number of hosts in Cortex XSIAM. Hunt collections provide more details about where something occurred. Hunting examples include finding which endpoints executed a piece of malware, which users accessed a particular file, or which endpoints were accessed by a specific user.
Create a hunt
Select hunt collections when you want to search for a specific activity across a large number of hosts. Hunt Collections gather more details about where something occurred. For example, use a hunt to find which endpoints executed a piece of malware, which users accessed a particular file, or which endpoints a specific user authenticated to.
When adding a new hunt collection in Cortex XSIAM, you can select from various artifact types for Windows, macOS and Linux.
- In the New Hunt Collection wizard, in the Hunt Collection Name, enter a name that will be easy to find in the collections table.
- Select the Platform, Windows, macOS or Linux.
- Select one of the time range options:
- One Time Collection: Run the hunt collection only once.
- Repeat Collection Every: Run the hunt collection every x hours set.
- Schedule: Range of days during the week and time frame.
- In Description, enter information that is relevant to the collection you are creating.
- In Maximum Concurrent Endpoints, enter the maximum number of endpoints that will run the searches at the same time within the time range specified. The default is 200 endpoints.
- On the Configuration page, refer to Configure Collection for information about each artifact.
You can save hunts in an incomplete state and edit them later. After a hunt has run, you cannot edit it. Instead, you can duplicate the hunt with the same configuration.
Hunt results
The hunt results page consolidates information collected by the Cortex XDR agent enabling you to investigate and take action on your endpoints with Cortex XSIAM.
Review process execution search results
The Process Execution table displays a normalized table containing an overview of all of the different process execution artifacts collected from the endpoints. Investigate the following detailed fields:
The grouping button ( ) shows the number of affected endpoints grouped by executable name. This enables you to perform hunting via frequency analysis (referred to as stacking) and provides a birds eye view of potential malware files that require further analysis.
| Field | Description |
|---|---|
| Context | Contextual details relating to the executed process such as files opened, command line arguments, or process run count. |
| Executable Name | Name of the executable. |
| Executable Path | Path of the executable. |
| Hostname | Name of the host on which the process resided. |
| MDS | MDS value of the executable file, if available on the file system. |
| SHA1 | SHA1 value of the executable file, if available on the file system. |
| SHA256 | SHA256 value of the executable file, if available on the file system. |
| Timestamp | Timestamp associated with the executable file or process execution. |
| Type | Type of process artifact. |
| User | User name associated with the execution artifact. |
| Verdict | WildFire verdict for the following process execution artifacts.
If there is a WildFire verdict, the relevant Verdict is displayed.
Also, a link to the WildFire analysis report is available for review. |
Review file access
The File Access table displays a normalized table containing an overview of all of the different file access artifacts collected from the endpoints. Investigate the following detailed fields:
| Field | Description |
|---|---|
| Hostname | Name of the host on where the file access artifact resided. |
| Path | Path of the accessed file or folder. |
| Timestamp | Timestamp associated with the accessed file or folder. |
| Type | Type of file access artifact. |
| User | User name of who accessed the file or folder, if available. |
Review persistence search results
The Persistence table displays a normalized table containing an overview of all of the application persistence artifacts collected from the endpoints. Investigate the following detailed fields:
The grouping button () shows the number of affected endpoints grouped by file path. This enables you to perform hunting via frequency analysis (referred to as stacking) and provides a birds eye view of potential malware files that require further analysis.
| Field | Description |
|---|---|
| Command | Command to be executed. |
| Endpoint ID | Unique identifier of the endpoint on which the persistence mechanism resides. |
| File Path | Path of a secondary executable (often a dll) associated with this persistence mechanism. |
| File SHA256 | SHA256 value of the file. |
| Hostname | Name of the host on which the persistence mechanism resides. |
| Image Path | Path of the executable associated with this persistence mechanism. |
| Name | Name associated with persistence mechanism, if available. |
| Registry Path | Path of the registry value. |
| Timestamp | Timestamp associated with the persistence mechanism. |
| Type | Type of persistence mechanism. |
| User | User account associated with persistence mechanism. |
| User SID | User account associated with persistence mechanism. |
| Verdict | WildFire verdict for the following persistence artifacts.
If there is a WildFire verdict, the relevant Verdict is displayed.
Also, a link to the WildFire analysis report is available for review. |
Review network data search results
The Network table displays an overview of the different types of network artifacts collected on the endpoints. Investigate the following detailed fields:
| Field | Description |
|---|---|
| Hostname | Name of the host on which the network activity occurred. |
| Interface | Type of network interface. |
| IP Address | IP address associated with network activity. |
| Resolution | Network data type associated with the IP address. |
| Type | Type of network artifact. |
Review remote access search results
The Remote Access table displays a normalized table containing an overview of all of the remote access artifacts collected from the endpoints. Investigate the following detailed fields:
| Field | Description |
|---|---|
| Connection ID | Unique Identifier associated with the particular remote access connection found in this row. |
| Connection Type | Type of remote access connection. |
| Duration | Duration of remote access connection. |
| Endpoint ID | A unique ID assigned by Cortex XDR that identifies the endpoint. |
| Hostname | Name of the host on which the remote access occurred. |
| Message | Description of activity related to this remote access collection. |
| Source Host | Origination host of remote access connection. |
| Timestamp | Date and time of the remote access activity. |
| Type | Type of remote access artifact. |
| User | User account associated with remote access connection. |
Review archive history search results
The Archive History table displays an overview of the different types of archive processes that were executed on an endpoint. Investigate the following detailed fields:
| Field | Description |
|---|---|
| Hostname | Name of the host on which the archive history was found. |
| Timestamp | Timestamp associated with archive history file. |
| Type | Type of archive history artifact.
|
| Path | Path of archive history file. |
| User | User account associated with archive history file. |
Linux
The collection results for the Core Linux artifacts include information about each artifact.
| Artifact | Result Details |
|---|---|
| Auditd Rules | Auditd Rules artifact in Linux forensics refers to the log data collected by the Linux Audit Daemon, a core component of security auditing. It records a detailed, chronological trail of system events based on a set of pre-configured rules. |
| Authorized Keys | Shows the public keys that are permitted to log in as a specific user via SSH. Attackers can add their own keys to this file to gain persistent access to a system. |
| Environment Variables | Lists environment variables for a given context (for example: a user's shell or a specific process). These variables define the execution environment and can contain important paths, configurations, or sensitive data. |
| File Listing | Shows information about the timeline of file system activity. |
| Files & Processes | Lists files opened by processes. This is crucial for mapping processes to the files and network sockets they are interacting with, which can reveal hidden activities, loaded libraries, or active network connections. |
| Firewall Rules | Lists control network traffic. Analyzing these rules is crucial for understanding the network security posture and identifying potentially malicious or overly permissive configurations. |
| System-Wide Configuration | Shows key-value pairs parsed from various configuration files in the /etc directory, for example: /etc/resolv.conf for DNS settings. This artifact helps understand the system's network and operational configuration. |
| Kernel Modules | Lists kernel modules on the system, their state, and the associated file path. Malicious actors may use custom kernel modules (rootkits) to hide their presence or gain privileged access. |
| Known Hosts | Lists the files that store the public keys of SSH servers a user has connected to. This helps to verify the server's identity and prevent man-in-the-middle attacks by alerting the user if the server's key changes. |
| Mounted Filesystems | Lists all mounted file systems, their sources (devices), types, and unique identifiers. This is useful for discovering connected storage and network shares, and understanding the file system layout. |
| Network Connections | Shows the lists of active network connections and listening ports. Essential for identifying unauthorized network communications, malware command and control (C2) channels, or unexpected listening services. |
| Running Processes | Shows a detailed snapshot of running processes on the system. This includes process identifiers, user context, executable path, parent-child relationships, state, and performance metrics. It is a cornerstone artifact for live system analysis. |
| System Information | Provides fundamental hardware and system information, including manufacturer, model, UUID, and memory details. This helps to identify and profile the system. |
| Systemd Service | Lists the system daemons or services (for example, from systemd). Analyzing these is key to understanding what long-running processes are configured on the system and to spot malicious or unnecessary services. |
| User Login & Session History | Shows records of user login sessions from the last command, showing who logged in, from where, and for how long. This is essential for auditing user access and investigating unauthorized logins. |
Hunt status
Hunts consist of searches across multiple endpoints and those searches can take time to return results from all of the targeted endpoints. To view the status of all of the searches contained within a hunt, go to Investigation & Response → Forensics. From the investigations table, click the investigation link. From the Collections tab, select Hunt and from the Status column of the hunt, click Actions. This launches a new browser tab displaying the Actions table. Within the Actions table, you can scroll or use the filters to see the status of any search within a hunt across any of the targeted endpoints.
Using this information, you can identify the successful and failed searches and take the necessary action in Cortex XSIAM.
| Field | Description |
|---|---|
| Endpoint name | Agent hostname. |
| Endpoint ID | Agent unique ID. |
| Action ID | A unique identifier for the agent action. |
| Name | Name of search. |
| Status | Shows one of the following statuses of the search:
|
| Artifact category | Name of category for the search. Example: |
| Artifact | Artifact targeted by this search. Example: |
| Results | Number of results received for the search. |
| Last updated | Latest time results were received for this action. |
| Parameters | The string that describes the search parameters. Example: |
| Creation time | Timestamp when the search was created. |
Triage
Triage enables you to do a in-depth analysis of a specific endpoint to fully understand the activities that occurred on that endpoint. The triage functionality is configurable and supports the collection of all currently supported forensic artifacts, user-defined file paths, a full file listing for all of the connected drives, full event logs, and registry hives. The amount of data collected during a triage can be large, so triages are limited to ten or fewer endpoints per collection.
Create a triage
Use triage collections when a certain activity, group of activities, or the actions of a specific user on that endpoint have been identified, and additional information is required. The triage functionality collects detailed system information, including a full file listing for all of the connected drives, full event logs, and registry hives, to provide you with a complete, holistic picture of an endpoint.
Triage supports data collection from both online and offline hosts, on both Windows and macOS platforms.
How to create a triage collection in Cortex XSIAM
- In the Triage Collection Name field, enter a name that will be easy to find in the collections table.
- Select the Platform either Windows, macOS or Linux.
- In the Description field, enter information that is relevant to the collection you are creating .
- For Triage Type, you can select Offline or Online or both.
- Select Offline to upload archives containing forensic data collected by the Offline Collector. After the archive is uploaded, the data is extracted and ingested into the Forensics tables on the tenant. Import Offline Triage supports uploading packages created on Windows, macOS, and Linux platforms.
- Click Save Collection and Exit or click Next to continue.
- On the Configuration page, refer to Configure Collection for information about each artifact.
-
You can select a preset from Select Presets (Windows/macOS/Linux) to copy the options for artifacts, volatiles, and file collections from another collection.
You can also click Save new preset to save the current collection as a potential triage collection.
- Click Save Collection and Exit or click Next to continue.
Upload an offline triage package
The Forensics Triage feature enables you to create a custom, standalone executable package that collects all of the forensic artifacts in the configuration.
Use the Upload Offline Triage to upload archives containing forensic data collected by the offline collector. After the archive has been uploaded, the data is extracted and ingested into the forensics table on the tenant. Upload Offline Triage supports uploading packages created on both the Windows and macOS platforms.
How to upload an offline package in Cortex XSIAM
- In Cortex XSIAM, select Investigation & Response → Forensics.
- Click the link of the relevant investigation.
- When in the Collections page, search for or select the triage and click the menu options button (
 ) to select Upload Offline Package.
 -
Drag and drop or use the browse link to search for the file. More than one offline triage package can be uploaded at a time.
Do not upload memory images captured by the Offline Triage Collector. These images are collected for analysis using third-party tools and are not intended for upload.
- Click Done.
Offline triage collection
The Forensics add-on provides a triage collection option for endpoints with no network connection or no Cortex XDR agent currently installed.
Note that the procedure differs between Windows, macOS, and Linux.
Windows
- Select Investigation & Response → Forensics.
- Click the investigation link and from the Collections tab, find the triage and click the menu options button ()/ Depending on the system type of the endpoint, select Download 32-bit Collector or Download 64-bit Collector .
- Copy the downloaded file to a location accessible from the targeted endpoint.
-
From the endpoint, open the folder containing the offline triage collector and right-click on the executable file cortex-xdr-payload.exe and select
Run as administrator.The
cortex-xdr-payload.exeopens a command window that displays the status of each artifact collection.After the collection is completed, a zip file with the hostname and a timestamp in the file name is created in the same directory as the executable.
- From the Collections page, select the triage and click the menu options button () and select Upload Offline Package.
-
In the Import Offline Triage dialog, browse for or drag and drop the zip file, and click Done.
The triage file is ingested, and the results are available for review.
Security software running on the endpoint (including the Cortex agent) can interfere with or block the execution of the offline triage collector. Disable any security software on the endpoint while the collector is running, or whitelist the collector in your security software before running the offline triage collector.
macOS
- Select Investigation & Response → Forensics.
- Click the investigation link and from the Collections tab, find the triage and click the menu options button () and select Download Collector.
- Open the folder containing the zip file and run the command
xattr -c <triage_configuration_name>.zipto remove any extended attributes that macOS might have applied to the file. - Copy the downloaded zip file to a destination that is accessible from the targeted endpoint.
-
From the endpoint, open the folder containing the offline triage collector and run the cortex-xdr-payload.exe file, or from a command line, enter:
sudo cortex-xdr-payload.After the collection is completed, a zip file with the hostname and a timestamp in the file name is created in the same directory as the executable.
- From the Collections page, select the triage and click the menu options button () and select Upload Offline Package.
-
In the Import Offline Triage dialog, browse for or drag and drop the zip file, and click Done.
The triage file is ingested, and the results are available for review.
Security software running on the endpoint (including the Cortex agent) can interfere with or block the execution of the offline triage collector. Disable any security software on the endpoint while the collector is running, or whitelist the collector in your security software before running the offline triage collector.
Linux
- Select Investigation & Response → Forensics.
- Click the investigation link and from the Collections tab, find the triage and click the menu options button () and select Download x86 Collector or Download ARM64 Collector.
- Copy the downloaded zip file to a destination that is accessible from the targeted endpoint.
-
From the endpoint, open the folder containing the offline triage collector and run the cortex-xdr-payload file, or from a command line, enter:
sudo ./cortex-xdr-payload.After the collection is completed, a zip file with the hostname and a timestamp in the file name is created in the same directory as the executable.
- From the Collections page, select the triage and click the menu options button () and select Upload Offline Package.
-
In the Import Offline Triage dialog, browse for or drag and drop the zip file, and click Done.
The triage file is ingested, and the results are available for review.
Security software running on the endpoint (including the Cortex agent) can interfere with or block the execution of the offline triage collector. Disable any security software on the endpoint while the collector is running, or whitelist the collector in your security software before running the offline triage collector.
Triage results
The Triage collection results page provides an overview of the different types of triage collections initiated on an endpoint.
The triage results page is divided into the following tabs:
- Alerts: Refer to Overview of the Issues page for descriptions of the fields.
- Artifacts: Display all of the artifact categories collected. Refer to Hunt results for more information on the artifacts.
- Host Timeline: Displays a list of normalized, per-host timelines that include multiple forensic artifacts in a single table.
Triage status
You can drill down to the Actions table from the status link of the triage to view the search the status of all the artifacts for the triage.
| Field | Description |
|---|---|
| Endpoint name | Agent hostname. |
| Endpoint ID | Agent unique ID. |
| Action ID | Unique identifier for this agent action. |
| Type | Type of collection. Example: |
| Path | Path for files, registry path for registry artifacts. |
| Status | Displays one of the following statuses of the search:
|
| Details | Shows the detailed output from the ingestion script. Example: |
| Collected | Time the data was collected. |
| Download expiration | Time when bucket data (raw files) is to be deleted. |
| Preset | Name of the triage configuration. |
| Collection Type | Collection type. |
| Triage ID | Unique ID associated with this triage data. |
Configure collection
On the configuration page, select the relevant categories and artifacts for collection.
Configuration for collection
Note
When search fields are specified, the search is limited based on those filters. If more than one entry is in a search filter field, the search returns entries that match any of them. For example: A File Search with two specified paths ("C:\Test\" and "C:\Windows\") will return results from both the Test and Windows folders.
If you specify multiple search fields, the search returns entries that match all the selected criteria. For example: A File Search with one path ("C:\Test") and one size filter (">= 100MB") will return results from the Test folder that are greater than or equal to 100 megabytes.
Not all artifacts within an artifact category support the same search fields. If an artifact does not support one of the specified fields, then that filter is not applied to the search results. For example, in Windows, a Process Execution search with the search field User Name="jsmith" will filter the CidSizeMRU, LastVisitedPidlMRU, and UserAssist artifacts for that user name. That user name will not filter results from the Amcache, Prefetch, and Shimcache artifacts because those artifacts do not have a User Name field.
You can create a search query by adding any of the following artifacts available for both triage and hunt collections:
| Category from Hunt Collection | Default Timeout | Data collected during a Triage Collection is categorized into Artifacts, Volatiles, and File Collection | Supported Filters |
|---|---|---|---|
| Archive History (Windows only) | 60 minutes |
|
|
| Browser History | 60 minutes |
|
|
| Command History | 60 minutes |
|
|
| Deleted Files (Windows only) | 180 minutes |
|
|
| File Access | 60 minutes |
|
|
| File Search | 180 minutes |
|
|
| Log Search | 180 minutes |
|
|
| Network Data | 60 minutes |
|
|
| Persistence | 60 minutes |
|
|
| Process Execution | 60 minutes |
|
|
| Registry Search (Windows only) | 180 minutes |
|
|
| Remote Access (Windows only) | 60 minutes |
|
|
| System Statistics (Windows only) | 60 - 120 minutes |
|
|
| User Searches | 60 minutes |
|
|
Linux Artifacts Table
| Category | Schedule | Artifact & Description | Parameters / Options |
|---|---|---|---|
| Core Linux | 60 minutes | Authorized Keys: Contains public keys that are permitted to log in as a specific user via SSH. Attackers can add their own keys to this file to gain persistent access to a system. | <p>Comment: regular expression (case-sensitive) Example: tancref.*</p> |
Known Hosts: The known_hosts file stores the public keys of SSH servers that a user has connected to. This helps to verify the server's identity and prevent man-in-the-middle attacks by alerting the user if the server's key changes. |
<p>Host: IP or hostname (regular expression) Example: 41.21.21., .google.com</p> |
||
| System Information: Provides fundamental hardware and system information, including manufacturer, model, UUID, and memory details. This helps identify and profile the system. | <p>File Name: regular expression (case-sensitive) Example: [0-9A-F]{8}</p> |
||
| Systemd Journal: | None required | ||
| Running Processes: A detailed snapshot of running processes on the system. This includes process identifiers, user context, executable path, parent-child relationships, state, and performance metrics. It is a cornerstone artifact for live system analysis. | <p>• File Name: regular expression (case-sensitive) Example: [0-9A-F]{8}• Process Owner: Entries are either numeric UIDs or text usernames. Example: 1001• Path: file path Example: /usr/local/share//bin/</p> |
||
| Network Connections: Lists active network connections and listening ports. Essential for identifying unauthorized network communications, malware command and control (C2) channels, or unexpected listening services. | <p>• Local IP: IPv4 or IPv6 addresses Example: 10.0.0.5• Local Port • Local IP • Remote IP • Remote Port • Netstat Command Line • Netstat Process Name • Netstat Process Path</p> |
||
| <p>Firewall Rules: Firewall rules (for example, from iptables) that control network traffic. Analyzing these rules is important for understanding the network security posture and identifying potentially malicious or overly permissive configurations. NOTE: Supported only for the UFW tool (Firewall management tool for some Linux distributions such as Ubuntu)</p> |
<p>• Source: regular expression (case-insensitive) Example: [0-9A-F]{8}.exe• Destination: regular expression (case-insensitive) Example: [0-9A-F]{8}.exe</p> |
||
| Kernel Modules: Lists kernel modules on the system, their state, and the associated file path. Malicious actors may use custom kernel modules (rootkits) to hide their presence or gain privileged access. | <p>• Module Name: regular expression (case-insensitive) • Module Path: path</p> |
||
| Environment Variables: Lists environment variables for a given context (for example, a user's shell or a specific process). These variables define the execution environment and can contain important paths, configurations, or sensitive data. | <p>• Key: regular expression (case-sensitive) • Value: regular expression (case-sensitive)</p> |
||
| Mounted Filesystems: Lists all mounted file systems, their sources (devices), types, and unique identifiers. This is useful for discovering connected storage, network shares, and understanding the file system layout. | None required | ||
| User Login & Session History: Records of user login sessions from the last command, showing who logged in, from where, and for how long. This is essential for auditing user access and investigating unauthorized logins. | User Login | ||
Command History: Detailed records of commands from user shell history files (for example, .bash_history, .zsh_history). This artifact is essential for tracking user activity and command execution. |
<p>• Command: • Executed by: Entries are either numeric UIDs or text usernames. Example: 1001</p> |
||
| Auditd Rules: Refers to the log data collected by the Linux Audit Daemon, which is a core component of security auditing. It records a detailed, chronological trail of system events based on a set of pre-configured rules. | <p>• Command: • Executed by: Entries are either numeric UIDs or text usernames. Example: 1001• Auditd List:</p> |
||
System-Wide Configuration: Key-value pairs parsed from various configuration files within the /etc directory, such as /etc/resolv.conf for DNS settings. This artifact helps understand the system's network and operational configuration. |
<p>Source: regular expression (case-insensitive) Example: [0-9A-F]{8}.exe</p> |
||
| File Listing: A plain text file used in digital forensics to create a detailed timeline of a file system activity. | <p>• File Name: regular expression (case-sensitive) Example: [0-9A-F]{8}• User Id: Entries are either numeric UIDs or text usernames. Example: 100001• Group Id: Entries are either numeric GIDs or text group names. Example: 0, 1</p> |
||
| Files & Processes: The artifact lists the files opened by the processes. This listing is essential for mapping a process directly to the files, loaded libraries, and network sockets it's using, which can immediately reveal hidden activities or active connections. | <p>• File Name: regular expression (case-sensitive) Example: [0-9A-F]{8}• User Id: Entries are either numeric UIDs or text usernames. Example: 100001</p> |
||
System Configuration Files: Shell profile files (for example, .bashrc, .profile) that contain commands and configurations executed at session startup. They are analyzed for persistence mechanisms, aliases, and malicious environment modifications. |
None required | ||
| Service Status: Lists system daemons or services (for example, from systemd). Analyzing these is key to understanding which long-running processes are configured on the system and to spot malicious or unnecessary services. | <p>• File Name: regular expression (case-sensitive) Example: [0-9A-F]{8}• Path: file path Example: /usr/local/share//bin/• Command:</p> |
Analysis and documentation
Analysis and documentation
Forensic investigations include additional data for analysis and documentation purposes.
- Issues
- Forensics Timeline
- Key Assets & Artifacts
Review Issues
The issues table displays all the collections within the investigation that has identified suspicious or malicious activity within the forensics data sets.
Refer to Overview of the Issues page for descriptions of the table fields.
The following actions are available for a selected alert.
- Change status
- Change severity
- Investigate causality chain
- Run playbook
- Manage alerts
Investigation timeline
The Timeline page enables you to view the list of forensic artifacts that were tagged. The tags display details of the forensic data collected from the endpoints.
The Timeline table displays the following fields:
| Field | Description |
|---|---|
| Hostname | Name of the host machine. |
| Timestamp | Timestamp associated with the artifact. |
| Type | Forensic artifact of which a tag was added. |
| Description | Name of the timestamp field. |
| Tags | There are three default tags to choose from.
You can also create your own tags. |
| User | User account associated with the forensic artifact. |
| Data | Data summary for the tagged item. |
| Mitre Att&ck Tactic | Displays the type of MITRE ATT&CK tactic of the tagged item. |
| Mitre Att&ck Technique | Displays the type of MITRE ATT&CK technique of the tagged item. |
| Notes | Displays notes entered by the user. |
-
Edit a timeline entry
You can edit a tag of an artifact in the Timeline table.
- Locate the relevant item to update the tag.
- Right-click and select Edit timeline entry.
- In Edit timeline entry, update the information as required and then click Save to update the changes.
-
Clear a timeline entry
You can remove a tag from the artifact in the Timeline table.
- Locate the relevant item to remove the tag.
- Right-click and select Clear timeline entry. The tag is removed from the artifact and the row is removed from the Timeline table.
Key assets & artifacts
Key assets & artifacts are automatically created based on the tagged data from the investigation timeline of the investigation and are divided among the categories:
- Data Access: Displays all the items that have been tagged in the File Access tables.
The following table for Endpoints displays the endpoints that have at least one or more items tagged:
| Field | Description |
|---|---|
| Endpoint Name | Name of the endpoint. |
| Endpoint Type | Displays the endpoint type:
|
| Endpoint Status | Displays the status of the endpoint:
|
| Earliest Activity | Timestamp of the earliest tagged item in the incident timeline for the endpoint. |
| Latest Activity | Timestamp of the last tagged item in the incident timeline for the endpoint. |
| IP Address | List of associated IP addresses. |
| IPv6 Address | List of associated IPv6 addresses. |
| First Seen | Timestamp of first seen. |
| Last Seen | Timestamp of last seen. |
| Endpoint Isolated | Displays the status of endpoint isolation:
|
| Isolation Date | Isolation date of the endpoint. |
The following table for Malware shows all the items that have been tagged in the Process Execution or Persistence tables.
| Field | Description |
|---|---|
| File Name | Name of the artifact collected from the endpoint. |
| Path | Executable path. |
| Tags | Assigned tags to the artifact. |
| SHA256 | SHA256 value of the executable file. |
| Verdicts | WildFire verdicts. |
| User | User name of the person who ran the process. |
| Mitre ATT&CK Tactic | Tactic selected during tagging. |
| Mitre ATT&CK Technique | Technique selected during tagging. |
| Platform | Operating system of the endpoint:
|
| Created | Creation timestamp of the file accessed. |
| Accessed | Accessed timestamp of the file accessed. |
| Modified | Modified timestamp of the file accessed. |
The following table for Users displays any artifact data with a non-null user field that has been tagged.
| Field | Description |
|---|---|
| Username | Username of the person who ran the process. |
| Domain | Domain of the user's computer. |
| ID | Indicates the operating system:
|
| Earliest Activity | Timestamp of the earliest tagged item in the Incident Timeline for the user. |
| Latest Activity | Timestamp of the last tagged item in the Incident Timeline for the user. |
The following table for Network Indicators displays the event logs with the IP addresses that have been tagged.
| Field | Description |
|---|---|
| Indicator | Data field that was tagged. |
| Type |
|
| Country | Geolocation data for IP addresses. |
| Flag | Flag of the geolocated country. |
| Organization | Organization associated with the IP address. |
The following table for Data Access displays all the items that have been tagged in the File Access tables.
| Field | Description |
|---|---|
| Path | Path of the accessed file. |
| User | User name of the person who accessed the file. |
| Created | Creation timestamp of the file accessed. |
| Accessed | Accessed timestamp of the file accessed. |
| Modified | Modified timestamp of the file accessed. |
| Size | Size of the file. |
Export
You can export the data collection for long-term retention or offline analysis.
From the collections page, choose a search item from a hunt collection or the endpoint from a triage collection and click the export icon ( ). For export of all items, select the Export All option from the Exports button at the top of the Collections page.
You can export a collection more than once.
To view the status of the export, click the Exports button.
The Investigation Exports table displays the status of the requested exports for the selected collection. The compressed export data expires from the bucket after 30 days.
| Field | Description |
|---|---|
| Collection name | Displays the name of the triage or hunt. For triage, the endpoint name of the triaged host is displayed. |
| Exported | Displays the time when the exported package was created (compressed). |
| Exported by | Displays the name of the user who requested the export. |
| Export expiration | Displays the timestamp of when the bucket data (compressed data) will be deleted. The timestamp changes to red after the timestamp and the last column shows Expired. |
| Status | Indicates how many tables from the collections have been successfully exported to a bucket. |
| Download button | Enables you to download the the compressed (zip) export of the collection. |
| Bin icon | Enables you to delete the compressed export file. |
Notebooks
Jupyter Notebooks provide security analysts and threat hunters with a highly flexible, code-based environment for deep security data analysis. Integrated directly into Cortex XSIAM, these Notebooks, powered by the Jupyter framework, enable users to combine live code (primarily Python for data science and machine learning), XQL queries, and generate more advanced visualizations into a single, shareable document.
Using Jupyter tools, you can build machine learning models to visualize clusters, identify anomalies, and then feed your findings into the Cortex XSIAM environment to generate security insights. Notebooks serve as a crucial tool for transforming raw security telemetry, which Cortex XSIAM collects from endpoints, networks, and cloud environments, into actionable threat intelligence and custom detection models.
Although you can use the XQL Query, Notebook is designed for advanced statistical analysis. In particular, you can do the following:
- Create customized analytics and bring your own machine learning models into Cortex XSIAM.
- Utilize existing public resources.
- Visualize analytics using existing libraries and applications.
- Document, automate, and reuse hunting processes.
- Use the existing data manipulation and visualization tools to identify patterns, anomalies, and trends in the data.
- Automate the custom investigation process and make it available as part of a case with actions, such as creating issues and adding a comment to a case.
You need a daily minimum of 1000 compute units. After activation, 1,000 units are deducted daily at 00:00 UTC.
XQL and BQ queries performed in Cortex XSIAM Notebooks are calculated similarly to Compute Unit usage of XQL queries originating from public APIs. You can't create a Jupyter instance without sufficient Compute Units.
Based on your security analysis and data volume requirements, you may need to increase your allocated Compute Units to support extensive analysis, complex queries, or frequent usage of the Notebooks.
Example: Advanced Visualizations - PyGWalker
PyGWalker is a Python library that allows you to turn a Pandas DataFrame into an interactive, Tableau-like user interface for visual data exploration, all within the Jupyter environment. A threat hunter can quickly drag and drop variables (like user_name, source_ip, event_type) to visually identify anomalies, spikes, or patterns in large volumes of log data without writing dozens of complex visualization scripts.
Set up the Jupyter Notebook in Cortex XSIAM
This is an admin task.
Before you begin, ensure that you have the View/Edit permissions in Settings → Configurations → Access Management → Roles → Configurations → Apps. This enables an administrator to perform initial setup of the Notebooks instance, manage integration settings, and configure the Notebooks environment.
The Instance Administrator role has these permissions by default.
- In Cortex XSIAM, select Settings → Configurations → Integrations → Apps.
-
Click Install.
Cortex XSIAM displays a notification that the instance is being prepared, which may take time.
When completed, the instance is available in the navigation menu under Apps.
-
Review the App Service Account role.
When you create a Notebooks instance, the API key is assigned the App Service Account role.
This API key is used by the underlying service (the Notebooks container environment) to communicate with Cortex XSIAM's APIs to retrieve data using XQL queries. The App Service Account role is generally designed for API consumption by applications or integrations. Its default permissions allow it to view and triage cases/issues and support public APIs relevant for apps. The App Service Account role relies on default unrestricted access.
The Notebook functions via an API key assigned to this role. If the role tied to that key is missing the dataset permission, the code will fail with an authorization error, even if an analyst can run the same query in the Query Builder. If so, you should do the following:
- Duplicate the App Service Account role and add the new dataset permissions.
- Update the API key with the new role.
- Add the API Key with the new role to the Notebook by hovering over Notebooks and selecting the edit icon.
- You can only add one instance of Notebooks.
- Notebooks have access to approved sites on the internet when embedded in Cortex XSIAM.
- To delete the Notebook, hover over Notebooks and select the delete icon.
- Installing or uninstalling some plug-ins and packages requires the Notebooks server to refresh the web page. For these actions, go to File → Shut Down , and then refresh the page.
Access and build Notebooks
Once the instance is provisioned, any authorized user can access the environment.
Before you begin, ensure you have the following permissions:
- View/Edit permissions in Settings → Configurations → Access Management → Roles → Apps → Jupyter. This enables you to open the Notebooks application and create, view, edit, and execute code with notebooks.
- To query data, you must be granted at least read access to the specific XDL datasets the notebook will use for analysis.
-
Select Investigation and Response → Notebooks.
The JupyterLab or Jupyter Notebook interface launches within the tenant.
-
You can now create a new notebook and use Python (along with security-focused Python libraries and the XSIAM platform's data connectors) to query XSIAM data using XQL.
Every notebook you create is preconfigured with Cortex SDK access, enabling you to query the data using it.
Manage datasets in Notebooks
Create, edit, and delete datasets directly in Notebooks and use them in rules.
You can create datasets in BigQuery through Notebooks using custom Cortex XSIAM APIs. You can then bring the insights and enriched data through machine learning into Cortex XSIAM to use them inside rules. For example, you can run a query in Cortex XSIAM that searches a case and correlates it to a sensitive users list you've created in Notebooks to trigger an issue.
To use the Cortex XSIAM APIs inside Notebooks, in Investigation & Response → Notebooks, import them from the Cortex SDK.
from cortex.dataset import define_dataset, create_dataset_from_dataframe, delete_dataset, get_created_datasets. from cortex.xql import start_query, get_query_results.
The created datasets are available for querying in the Query Builder and can be used when defining rules. You can view them under Dataset Management, and they can be selected for access when creating a user role. Creating and deleting datasets are recorded in the Management Audit Logs.
To change the schema of a dataset created using the Notebooks API, delete the dataset and create a new dataset with the updated schema.
You can use all the Google BigQuery functions to update the data in a dataset created using the Notebooks API.
The functions that are available for creating and editing datasets in Notebooks are listed below.
Define dataset
Creates an XQL dataset based on an existing BQ table.
define_dataset(table_name: str, client: Optional[Client] = None)
| Arguments | <ul><li>table_name: Existing BQ table name created by the user.</li><li>client: Cortex HTTP client.</li></ul> |
Create a dataset from a dataframe
Creates an XQL dataset and the table at the same time, where you supply the data and the schema of the table in the API.
create_dataset_from_dataframe(
table_name: str,
dataframe: DataFrame,
schema: Optional[Sequence[Union[SchemaField, Mapping[str, Any]]]] = None,
client: Optional[Client] = None,
bq_client: Optional[BqClient] = None,
)
| Arguments |
|
If a schema is not provided, the function automatically detects the schema.
Get created datasets
Retrieves a list of all XQL datasets generated using the Cortex SDK.
get_created_datasets(client: Optional[Client] = None)
| Arguments | client: Cortex HTTP client. |
Delete dataset
Deletes the XQL dataset that was created by the Cortex SDK.
- Using this function, you can only delete datasets created using the Notebooks APIs.
- When you delete a dataset, the rules that use the dataset return an error.
delete_dataset(dataset_name: str, delete_underlying_bq_table: Optional[bool] = False, client: Optional[Client] = None)
| Arguments |
|
Notebooks scheduler
Ensure automatic data enrichment by scheduling Notebook jobs to run immediately or on a schedule.
-
In the Notebooks window, on the left sidebar tab, right-click the file you want to run and select Create Notebook Job.
- In the Create Job page, update the required parameters, such as the job name and output formats.
- Select whether to run the job now or on a schedule.
The results of the scheduled job are reflected in the related rules as soon as the job runs.
Build XQL queries
To support investigation and analysis in Cortex XSIAM, you can search your data by creating queries in the Query Builder. You can create queries with the Cortex Query Language (XQL) or by using the Query Builder templates.
If you have Cortex Agentic Assistant, you can use natural language prompts to create and run XQL queries within the chat interface. For more information, see Create and run XQL queries with Agentic Assistant chat.
About the Query Builder
The Query Builder aids in the detection of threats by allowing you to search for indicators of compromise and suspicious patterns within data sources. It assists in expanding case investigations by identifying related events and entities, such as activities associated with specific user accounts or network lateral movement. In addition, the Query Builder enables data analytics on suspected threats, helping organizations analyze large volumes of data to identify trends, anomalies, and correlations that may indicate potential security issues.
To support investigation and analysis, you can search all of the data ingested by Cortex XSIAM by creating queries in the Query Builder. You can create queries that investigate leads, expose the root cause of an issue, perform damage assessment, and hunt for threats from your data sources.
Cortex XSIAM provides different options in the Query Builder for creating queries:
-
XQL (Build your own queries)
You can use the Cortex Query Language (XQL) to build complex and flexible queries that search specific datasets or presets, or the entire Cortex Data Model (XDM). With XQL Search, you create queries based on stages, functions, and operators. To help you build your queries, Cortex XSIAM provides tools in the interface that provide suggestions as you type, or you can look up predefined queries, common stages and examples. For more information, see How to build XQL queries.
Note
Schema changes to datasets may not be reflected in the autocomplete suggestions and definitions as you type in real time the XQL query, and can appear with a slight delay.
Tip
When creating XQL queries, you can:
- Use the up and down arrow keys to navigate through the auto-suggestion commands and definitions.
- Select an auto-suggestion command by pressing either the Enter or Tab key.
- Press Shift+Enter to add a new line, and easily ignore the auto-suggestion output.
- Close the auto-suggestion output by pressing the Esc key.
-
Query Builder templates (No XQL knowledge required)
You can use the Query Builder templates to access your data without prior XQL knowledge. The templates include predefined filtering fields and key fieldsets, and can include any field from the XDM schema.
As the templates are also based on XQL, you can also translate your template queries into XQL. With this flexibility, you can enrich the basic queries created by templates for more detailed investigation, or use the templates as a starting point for creating complex queries with full XQL functionality. For more information, see Query Builder templates.
-
Graph Search to build queries to search assets, findings, and their contextual data. For more information, see How to build Graph Search queries?.
Tip
If you prefer to use the Query Builder in Legacy mode, switch the toggle in the header. In Legacy mode, the Query Builder searches predefined datasets only. To search the full XDM Data Model, switch to New mode or select XQL Search.
How to build XQL queries
The Cortex Query Language (XQL) enables you to query data ingested into Cortex XSIAM for rigorous endpoint and network event analysis. To help you create an effective XQL query with the proper syntax, the query field in the user interface provides suggestions and definitions as you type.
| XQL forms queries in stages. Each stage performs a specific query operation and is separated by a pipe character ( | ). Queries require a dataset, or data source, to run against. You can either query the Cortex Data Model (XDM) or you can query specific datasets. In a dataset query, unless otherwise specified, the query runs against the xdr_data dataset, which contains all log information that Cortex XSIAM collects from all Cortex product agents, including EDR data, and PAN NGFW data. In XDM queries, you must specify the dataset mapped to the XDM that you want to run your query against. |
Forensic datasets are not included by default in XQL query results, unless the dataset query is explicitly defined to use a forensic dataset.
Which datasets are mapped to XDM?
The Cortex Query Language (XQL) supports a single Cortex Data Model (XDM), which is a normalized data structure. Datasets are mapped to the XDM in 3 different ways:
- Automatic default mappings, including the following:
- The
xdr_datadataset is automatically mapped to the XDM with some data mapping exceptions. - Next-Generation Firewall (NGFW) network log data are mapped to the XDM from the following datasets:
panw_ngfw_traffic_rawpanw_ngfw_threat_rawpanw_ngfw_url_rawpanw_ngfw_filedata_rawpanw_ngfw_globalprotect_rawpanw_ngfw_hipmatch_raw
- The
- Out-of-the-box mappings of the datasets as part of the Data Model Rules via the Marketplace. For more information, see Marketplace.
- You can create your own mappings by creating your own Data Model Rules.
For more information on the XDM Schema, specifically the fields, fieldsets, fields designated as ENUMS (CONST), and aliases, see the XSIAM Data Model Schema.
XDM query syntax
The basic syntax structure for querying the Cortex Data Model (XDM) is either:
datamodel dataset in (<dataset_name>,...) …
| <STAGE> ...
| <STAGE> ...
| <STAGE> ...
or
datamodel dataset = <dataset_name> … | <STAGE> ... | <STAGE> ... | <STAGE> ...
In a query using the datamodel command, a query runs against the specified datasets, which contain log information ingested by Cortex XSIAM. You can also install Marketplace Content Packs, or map an ingested dataset into the XDM, to query additional datasets.
Adding a wildcard suffix (*) is supported in the <dataset_name>, which matches all datasets that are mapped to the data model and begin with the specified text. For example, datamodel dataset = xdr* or datamodel dataset in (xdr*).
When querying the XDM, fields that are not mapped to the XDM are accessible by <dataset>.<field>. They can be used at any stage of a datamodel query.
When creating XDM queries, auto-suggestions are available, according to the existing XDM fields.
Dataset query syntax
In a dataset query, unless otherwise specified, the query runs against the xdr_data dataset, which contains all log information that Cortex XSIAM collects from all Cortex product agents, including EDR data, and PAN NGFW data. In a dataset query, if you are running your query against a dataset that has been set as default, there is no need to specify a dataset. Otherwise, specify a dataset in your query. The Dataset Queries lists the available datasets, depending on system configuration.
- Users with different dataset permissions can receive different results for the same XQL query.
- An administrator or a user with a predefined user role can create and view queries built with an unknown dataset that currently does not exist in Cortex XSIAM. All other users can only create and view queries built with an existing dataset.
- When you have more than one dataset or lookup, you can change your default dataset by navigating to Settings → Configurations → Data Management → Dataset Management, right-click on the appropriate dataset, and select Set as default.
The basic syntax structure for querying datasets that are not mapped to the XDM is:
dataset = <dataset name> | <stage1> ... | <stage2> ... | <stage3> ...
or
dataset in (<dataset name>)
| <stage1> ...
| <stage2> ...
| <stage3> ...
You can specify a dataset using one of the following formats, which is based on the data retention offerings available in Cortex XSIAM.
-
Hot Storage queries use the format
dataset = <dataset name>. This is the default option.dataset = xdr_data
-
Cold Storage queries use the format
cold_dataset = <dataset name>.cold_dataset = xdr_data
You can build a query that investigates data in both a cold dataset and a hot dataset in the same query. In addition, as the hot storage dataset format is the default option and represents the fully searchable storage, this format is used throughout this guide for investigation and threat hunting.
When using the hot storage default format, this returns every xdr_data record contained in your Cortex XSIAM instance over the time range that you provide to the Query Builder user interface. This can be a large amount of data, which may take a long time to retrieve. You can use a limit stage to specify how many records you want to retrieve.
There is no practical limit to the number of stages that you can specify.
In the xdr_data dataset, every user field included in the raw data for network, authentication, and login events has an equivalent normalized user field associated with it that displays the user information in the following standardized format:
<company domain>\<username>
For example, the login_data field has the login_data_dst_normalized_user field to display the content in the standardized format. To ensure the most accurate results, we recommend that you use these normalized_user fields when building your queries.
Additional components
XQL queries can contain different components, such as functions and stages, depending on the type of query you want to build.
Get started with XQL queries
Before you begin running XQL queries, consider the following information:
-
Use the interface to help you build queries
Cortex XSIAM offers features in the XQL search interface to help you build queries. For more information, see Useful XQL user interface features.
-
Mitigate long-running queries
Querying the XDM enables searching of Cortex XSIAM's extensive data. We recommend that you use filters to streamline your queries. For more information, see XQL Query best practices.
-
Understand query defaults and limitations
Before you run a query, review this list to better understand query behavior and results. For more information, see Expected results when querying fields.
-
Translate Splunk queries to XQL
If you have existing Splunk queries, you can translate them to XQL. For more information, see Translate to XQL.
Tip
If you are new to creating queries, you can also try our simple search templates, which can help you get started in understanding how queries work. See Query Builder templates.
Useful XQL user interface features
The user interface contains several useful features for querying data and viewing results:
-
XQL query: Define your query parameters. The field provides suggestions and definitions as you type.
Dataset schema changes can take time to appear in autocomplete suggestions.
Tip
When creating XQL queries, you can:
- Use the arrow keys to navigate suggestions and definitions.
- Press Enter or Tab to select a suggestion.
- Press Shift+Enter for a new line, or Esc to close suggestions.
- Translate to XQL: Converts Splunk queries to XQL syntax. Enable this option to display SPL query and XQL query fields.
- Query Results: View, filter, and visualize results after you run a query.
- XQL Helper: Describes common stage commands and provides examples.
- Query Library: Contains predefined queries. You can save, manage, and share personal queries. For more information, see Manage your personal query library.
- Schema: Lists each result-set field, its data type, descriptive text, and dataset.
- For dataset queries, it lists fields from every involved dataset.
- For data model queries, it lists data model fields.
XQL Query best practices
Cortex XSIAM includes built-in mechanisms for mitigating long-running queries. These include default limits for allowed issues and returned rows. XDM queries search only specified mapped datasets. The following suggestions help streamline your queries:
-
Add a smaller limit by using a
limitstage.The default result limit is 1,000 for XDM and dataset queries. This applies when no limit is stated. It applies to basic queries with no stages except
fields. It does not apply to widgets, Correlation Rules, public APIs, saved queries, or scheduled queries. Those allow up to 1,000,000 results. Legacy templates allow 10,000 results.datamodel dataset = microsoft_windows_raw | fields *host* | limit 100
- Use a small Timeframe. Select Relative time and define Last 30 Minutes where possible.
- Use filters that exclude data, along with other applicable filters.
- Select only the fields required in the results.
Expected results when querying fields
The following are returned when querying fields:
- If specific fields are stated in the fields stage, those exact fields will be returned.
- If no fields are stated in the query, the
xdm_corefieldset will be returned. - Unmapped fields are treated as NULL. An unmapped field is an
xdmfield that hasn't been mapped from the relevant datasets using a Data Model Rule. - By default, the
_timesystem field will be added to all data model queries. Yet, the_timesystem field will not be added to queries that contain thecompstage. - For dataset queries, all current system fields will be returned, even if they are not stated in the query.
- For UNION between XDM and dataset, each part of the UNION will return its own fields.
- Each new column in the result set created by the alter stage will be added as the last column. You can specify a different column order by modifying the field order in the fields stage of the query.
- Each new column in the result set created by the comp stage will be added as the last column. Other fields that are not in the
group by / calculatedcolumn will be removed from the result set, including the core fields and_timesystem field. - When no limit is explicitly stated in a
datamodelquery, a maximum of 1000 results are returned (default). When this limit is applied to results using the limit stage, it will be indicated in the user interface.
Create XQL query
Review the following topics:
Build Cortex Query Language (XQL) queries to analyze raw log data stored in Cortex XSIAM. You can query the Cortex Data Model (XDM) or datasets using specific syntax.
How to create a XDM query
- From Cortex AgentiX, select Investigation & Response → Search → Query Builder.
- Click XQL.
-
(Optional) Change the default time period against which to run your query from the time picker at the top right of the window. You can select the required time period from any of the following options available:
- Preset time ranges easily available to select from, such as 24 hours and 30 days.
- Recently used selections from your previous queries.
- Relative time: Define the time frame as the last <number> minutes, days, or hours by setting the number.
- Calendar: Create a customized time period by selecting the date range from the calendar and the specific Start Time and End Time.
Note
- Whenever the time period is changed in the query window, the
config timeframeis automatically set to the time period defined for the entire query, including queries that are part of thejoinstage. Yet, this won't be visible as part of the query. Only if you manually type in theconfig timeframewill this be seen in the query. - These time picker options are available in XQL queries when using the Query Builder, XQL Widgets, and when defining XQL Widgets in Reports and Dashboards.
- (Optional) To translate Splunk queries to XQL queries, enable Translate to XQL. If you choose to use this feature, enter your Splunk query in the Splunk field, click the arrow icon to convert to XQL, and skip to Step 6.
-
Create your query by typing in the query field. Relevant commands, their definitions, and operators are suggested as you type.
Tip
When creating XQL queries, you can:
- Use the up and down arrow keys to navigate through the auto-suggestion command suggestions and definitions.
- Select an auto-suggestion command by pressing either the Enter or Tab key.
- Press Shift+Enter to add a new line, and easily ignore the auto-suggestion output.
- Close the auto-suggestion output by pressing the Esc key.
-
Specify the datasets to run your query against by typing either
datamodel dataset = <dataset name>...ordatamodel dataset in (<dataset name>,...).... For example:datamodel dataset in (amazon_aws_raw)
Note
While
datamodel dataset=*is supported in the query, we recommend that you specify specific datasets for quicker and more efficient results. - Press Enter, and then type the pipe character (
|). Select a stage, and complete the stage syntax using the suggested options. -
Continue adding stages until your query is complete. For example:
datamodel dataset in (amazon_aws_raw) | filter xdm.source.ipv4 = "10.9.165.1" | fields xdm.source.ipv4, xdm.source.port | limit 100
- Choose when to run your query:
- Run the query immediately.
- Run the query by the specified date and time, or on a specific date, by selecting the calendar icon (
 ).
).
- (Optional) The Save As options save your query for future use:
- Correlation Rule: When compatible, saves the query as a Correlation Rule. For more information, see What's a correlation rule?.
- Query to Library: Saves the query to your personal query library. For more information, see Manage your personal query library.
- Widget to Library: For more information, see Create XQL widgets.
Tip
While the query is running, you can navigate away from the page. A notification is sent when the query has finished. You can also Cancel the query or run a new query, where you have the option to Run only new query (cancel previous) or Run both queries.
How to create a dataset query
- From Cortex XSIAM, select Investigation & Response → Search → XQL Search.
-
(Optional) Change the default time period against which to run your query from the time picker at the top right of the window. You can select the required Timeframe from any of the following options available:
- Preset time ranges easily available to select from, such as 24 hours and 30 days.
- Recently used selections from your previous queries.
- Relative time: Define the time frame as the last <number> minutes, days, or hours by setting the number.
- Calendar: Create a customized time period by selecting the date range from the calendar and the specific Start Time and End Time.
Note
- Whenever the time period is changed in the query window, the
config timeframeis automatically set to the time period defined for the entire query, including queries that are part of thejoinstage. Yet, this won't be visible as part of the query. Only if you manually type in theconfig timeframewill this be seen in the query. - These time picker options are available in XQL queries when using the Query Builder, XQL Widgets, and when defining XQL Widgets in Reports and Dashboards.
- (Optional) To translate Splunk queries to XQL queries, enable Translate to XQL. If you choose to use this feature, enter your Splunk query in the Splunk field, click the arrow icon (
 ) to convert to XQL, and skip to Step 6.
 -
Create your query by typing in the query field. Relevant commands, their definitions, and operators are suggested as you type.
Tip
When creating XQL queries, you can:
- Use the up and down arrow keys to navigate through the auto-suggestion command suggestions and definitions.
- Select an auto-suggestion command by pressing either the Enter or Tab key.
- Press Shift+Enter to add a new line, and easily ignore the auto-suggestion output.
- Close the auto-suggestion output by pressing the Esc key.
-
(Optional) Specify a dataset.
You only need to specify a dataset if you are running your query against a dataset that you have not set as default. Otherwise, the query runs against the
xdr_datadataset. For more information, see How to build XQL queries.Example:
dataset = xdr_data
- Press Enter, and then type the pipe character (
|). Select a command, and complete the command using the suggested options. -
Continue adding stages until your query is complete.
dataset = xdr_data | filter agent_os_type = ENUM.AGENT_OS_MAC | limit 250
- Choose when to run your query:
- Run the query immediately.
- Run the query by the specified date and time, or on a specific date, by selecting the calendar icon ().
- (Optional) The Save As options save your query for future use:
- BIOC Rule: When compatible, saves the query as a BIOC rule. The XQL query must contain a filter for the event_type field.
- Correlation Rule: When compatible, saves the query as a Correlation Rule. For more information, see What's a correlation rule?.
- Query to Library: Saves the query to your personal query library. For more information, see Manage your personal query library.
- Widget to Library: For more information, see Create XQL widgets.
Tip
While the query is running, you can navigate away from the page. A notification is sent when the query has finished. You can also Cancel the query or run a new query, where you have the option to Run only new query (cancel previous) or Run both queries.
Review XQL query results
Review the following topics:
The results of a Cortex Query Language (XQL) query are displayed in the Query Results tab.
Note
It's also possible to graph the results displayed. For more information, see Graph query results.
Real-time query results
Cortex XSIAM displays partial results for queries run in the Query Builder as they are received, subject to the limitations below. In a long-running query, viewing the initial findings enables you to refine, validate, or stop the query.
The partial results are displayed only in the Table tab. The results are added to the table as they are received in real time. The incremental query results aren't ordered, so they may not be in sequence.
Limitations
- Real time query results are available only in the Query Builder and in free text query.
- Real time results are displayed only for queries run on hot datasets.
- The Sort option is available only after all the data is retrieved.
- When you formulate complex queries, the results will be displayed when the query has finished running completely, and not in real time. Some of the clauses that are included in this restriction are:
- JOIN - incremental results are supported only when the secondary dataset is smaller in size
- SORT
- COMP
- WINDOWCOMP
- TOP
Note
Results are received incrementally for the first 100K records, or up to 100MB worth of records, whichever comes first. After that, the next update is when the query has finished running completely.
Understanding the options available to investigate results
Use the following options in the Query Results tab to investigate your query results:
| Option | Use |
|---|---|
| Table tab | Displays results in rows and columns according to the entity fields. Columns can be filtered, using their filter icons. More options (
Show and hide rows according to a specific field in a specific event: select a cell, right-click it, and then select either Show rows with … or Hide rows with … |
| Graph tab | Use the Chart Editor to visualize the query results. |
| Advanced tab | Displays results in a table format which aggregates the entity fields into one column. You can change the layout, decide whether to Show line breaks for any text field in the results table, and change the log format from the Select Show more to pivot an Expanded View of the event results that include NULL values. You can toggle between the JSON and Tree views, search, and Copy to clipboard. |
| Export to File | Exports the results to a TSV (tab-separated values) file.
|
| Refresh | Refreshes the query results. |
| Free text search | Searches the query results for text that you specify in the free text search. Click the Free text search icon to reveal or hide the free text search field. |
| Filter | Enables you to filter a particular field in the interface that is displayed to specify your filter criteria. For integer, boolean, and timestamp (such as |
| Fields menu | Filters query results. To quickly set a filter, Cortex XSIAM displays the top ten results from which you can choose to build your filter. This option is only available in the Table and Advanced tabs, From within the Fields menu, click on any field (excluding JSON and array fields) to see a histogram of all the values found in the result set for that field. This histogram includes:
Note In order for Cortex XSIAM to provide a histogram for a field, the field must not contain an array or a JSON object. |
Available options for saving results
The Save As options save your query for future use:
- Correlation Rule: When compatible, saves the query as a Correlation Rule. For more information, see What's a correlation rule?.
- Query to Library: Saves the query to your personal query library. For more information, see personal query library.
- Widget to Library
Investigating results in the Causality View or Timeline View
You can continue investigating the query results in the Causality View or Timeline by right-clicking the event and selecting the desired view. This option is available for the following types of events:
- Process (except for those with an event sub-type of termination)
- Network
- File
- Registry
- Injection
- Load image
- System calls
- Event logs for Windows
- System authentication logs for Linux
For network stories, you can pivot to the Causality View only. For cloud Cortex XSIAM events and Cloud Audit Logs, you can only pivot to the Cloud Causality View, while for software-as-a-service (SaaS) related issues for audit stories, such as Office 365 audit logs and normalized logs, you can only pivot to the SaaS Causality View.
Add file path to Malware Profile allowed list
Add a file path to your existing Malware Profile allowed list by right-clicking a <path> field, such as target_process_path, and selecting Add <path type> to malware profile allow list.
Translate to XQL
To help you easily convert your existing Splunk queries to the Cortex Query Language (XQL) syntax, Cortex XSIAM includes a toggle called Translate to XQL in the query field in the user interface. When building your XQL query and this option is selected, both a SPL query field and XQL query field are displayed, so you can easily add a Splunk query, which is converted to XQL in the XQL query field. This option is disabled by default, so only the XQL query field is displayed.
Important
This feature is still in a Beta state and you will find that not all Splunk queries can be converted to XQL. This feature will be improved upon in the upcoming releases to support greater Splunk query translations to XQL.
Supported functions in Splunk
The following table details the supported functions in Splunk that can be converted to XQL in Cortex XSIAM with an example of a Splunk query and the resulting XQL query. In each of these examples, the xdr_data dataset is used.
| Splunk Function/Stage | Splunk Query Example | Resulting XQL Query Example |
| --------------------------- | ---------------------------------------------------------------------------------------------------------------------------------- | --------------------------------------------------------------------------------------------------------------- |
| avg | `index=xdr_data | stats avg(dst_association_strength)` |
| bin | `index = xdr_data | bin _time span=5m` |
| coalesce | `index= xdr_data | eval product_or_vendor_not_null=coalesce(_product, _vendor )` |
| count | `index=xdr_data | stats count(_product) BY _time` |
| ctime | `index=xdr_data | convert ctime(field) as field` |
| earliest | index = xdr_data earliest=24d | `dataset in (xdr_data) |
| eval | `index=xdr_data | eval field = "test"` |
| fillnull | `index=xdr_data | fillnull value = "missing ipv6" agent_ip_addresses_v6` |
| floor | `index=xdr_data | eval floor_test = floor(1.9)` |
| iplocation | `index=xdr_data | inputlookup append=true my_lookup.csv` |
| iplocation | `index = xdr_data | inputlookup agent_ip_addresses` |
| isnotnull | `index=xdr_data | eval x = isnotnull(agent_hostname)` |
| isnull | `index=xdr_data | eval x = isnull(agent_hostname)` |
| json_extract | `index= xdr_data | eval London=json_extract(dfe_labels,"dfe_labels{0}")` |
| join | join agent_hostname [index = xdr_data] | join type=left conflict_strategy=right (dataset in (xdr_data)) as inner agent_hostname = inner.agent_hostname |
| latest | index = xdr_data latest=-24d | `dataset in (xdr_data) |
| len | `index = xdr_data | where uri != null |
| ltrim(<str>,<trim_chars>) | `index=xdr_data | eval trimed_agent=ltrim("agent_hostname", "agent_")` |
| lower | `index = xdr_data | eval field = lower("TEST")` |
| max | `index =xdr_data | stats max(action_file_size) by _product` |
| md5 | `index=xdr_data | eval md5_test = md5("test")` |
| median | `index = xdr_data | stats median(actor_process_file_size) by _time` |
| min | `index =xdr_data | stats min(action_file_size) by _product` |
| mvcount | `index = xdr_data | where http_data != null |
| mvdedup | `index = xdr_data | eval s=mvdedup(action_app_id_transitions)` |
| mvexpand | `index = xdr_data | mvexpand dfe_labels limit = 100` |
| mvfilter | `index = xdr_data | eval x = mvfilter(isnull(dfe_labels))` |
| mvindex | `index=xdr_data | eval field = mvindex(action_app_id_transitions, 0)` |
| mvjoin | `index=xdr_data | eval n=mvjoin(action_app_id_transitions, ";")` |
| pow | `index=xdr_data | eval pow_test = pow(2, 3)` |
| relative_time(X,Y) | <ul><li>index ="xdr_data"</li></ul> | where \_time > relative\_time(now(),"-7d@d")</li><li>index ="xdr\_data" |
| replace | \index= xdr_data | eval description = replace(agent_hostname,"("."NEW")` |
| rex | `index=xdr_data action_local_ip!="0.0.0.0" | rex field=action_local_ip "(?<src_ip>\d+.\d+.\d+.48)" |
| round | `index=xdr_data | eval round_num = round(3.5)` |
| rtrim | `index=xdr_data | eval trimed_hostname=rtrim("agent_hostname", "hostname")` |
| search | `index = xdr_data | eval ip="192.0.2.56" |
| sha256 | `index = xdr_data | eval sha256_test = sha256("test")` |
| sort (ascending order) | `index = xdr_data | sort action_file_size` |
| sort (descending order) | `index = xdr_data | sort -action_file_size` |
| spath | `index = xdr_data | spath output=myfield input=action_network_http path=headers.User-Agent` |
| split | `index = xdr_data | where mac != null |
| stats | `index=xdr_data | stats count(event_type) by _time` |
| stats dc | `index = xdr_data | stats dc(_product) BY _time` |
| strcat | `index=xdr_data | strcat story_id "/" http_req_before_method comboIP` |
| sum | `index=xdr_data | where action_file_size != null |
| table | `index = xdr_data | table _time, agent_hostname, agent_ip_addresses, _product` |
| tonumber | `index=xdr_data | eval tonumber_test = tonumber("90210")` |
| top | <p>The following Splunk functions can be translated to XQL:</p><ul><li><p>limit</p><p>index = xdr_data</p></li></ul> | where action\_app\_id\_risk > 0 |
| upper | \index=xdr_data | eval field = upper("test")` |
| var | `index=xdr_data | stats var (event_type) by _time` |
How to translate a Splunk query to XQL syntax
- Select Investigation & Response → Search → Query Builder → XQL.
- Toggle to Translate to XQL, where both a SPL query field and XQL query field are displayed.
- Add your Splunk query to the SPL query field.
-
Click the arrow (
).The XQL query field displays the equivalent Splunk query using the XQL syntax.
You can now decide what to do with this query based on the instructions explained in Create XQL query.
Graph query results
To help you better understand your Cortex Query Language (XQL) query results and share your insights with others, Cortex XSIAM enables you to generate graphs and outputs of your query data directly from query results page.
Tip
Alternatively, you can use the Cortex Agentic Assistant to generate custom graphs and charts using natural language prompts. By simply prompting the agent, it will build and execute the query, returning the visual representation. For more information, see Use natural language to query and visualize your data.
- Select Investigation & Response → Search → XQL Search.
-
Run an XQL query.
Enter the following query:
dataset = xdr_data | fields action_total_upload, _time | limit 10
The query returns the
action_total_upload, a number field, and_time, a string field, for up to 10 results. - In the Query Results section, to graph the results either:
Use Chart Editor
Navigate to Query Results → Chart Editor () to manually build and view the graph using the selected graph parameters:
- Main
-
Graph Type: Type of graphs and output options available: Area, Bubble, Column, Funnel, Gauge, Line, Map, Pie, Scatter, Single Value, or Word Cloud.
Note
To display the result of as a time duration, choose the graph type Single Value and enable Show as Time. You can then select the Time Unit (millisecond, second, minute, or hour) and the Display format.
- Subtype and Layout: Depending on the selected type of graph, choose from the available display options.
- Header: Title your graph.
- Show Callouts: Display numeric values on the graph.
-
- Data
- X-axis: Select a field with a string value.
- Y-axis: Select a field with a numeric value.
- (Optional) Series: For an area, bubble, column, line, map, or scatter chart, you can specify a field (column) to group chart results based on y-axis values. This option is only displayed when one of the supported graph types are selected, and a single y-axis value is selected.
- Depending on the selected type of graph, customize the Color, Font, and Legend.
Use XQL query
Enter the visualization parameters in the XQL query section.
You can express any chart preferences in XQL. This is helpful when you want to save your chart preferences in a query and generate a chart every time that you run it. To define the parameters, either:
-
Define the following query:\
Exampledataset = xdr_data | view graph type = column header = "Test 1" xaxis = _time yaxis = action_total_upload series = _vendor
-
Select ADD TO QUERY to insert your chart preferences into the query itself.
-
(Optional) Create a custom widget.
To easily track your query results, you can create custom widgets based on the query results. The custom widgets you create can be used in your custom dashboards and reports. For more information, see Create custom XQL widgets.
Select Save to Widget Library to pivot to the Widget Library and generate a custom widget based on the query results.
Query Builder templates
You can use the Query Builder templates to create effective queries without using the Cortex Query Language (XQL).
From the Query Builder, you can select the following templates:
- Basic: Search by IP address, host name, user name, and domain.
- Free text: Search for a free text string.
The templates are set up with predefined filtering fields and fieldsets that are specific to the template type. You can specify values for the default fields and add any other required fields to refine and adapt your search. The Query Builder templates support any filtering fields from the Cortex Data Model (XDM) schema.
Tip
To get started with queries, you can run an empty template query with no values specified. The query results will include all of the fields in the template specific fieldset. Based on the query results, you can run subsequent queries to narrow down your search.
Get started with Query Builder templates
Before you start running queries with Query Builder templates in Cortex XSIAM, consider the following information:
- Learn about the templates: Although the templates don’t require XQL knowledge, they do require knowledge of operators and other factors. Understanding how the templates work will help you to build effective queries. For more information, see Considerations for using Query Builder templates.
- Look up field and alias descriptions: The templates are based on the fields and aliases in the Cortex Data Model (XDM). If you want more information about a field or alias, see the Cortex XSIAM Data Model Schema Guide.
- Try out our examples: To help you feel confident with Query Builder templates, start by following our step-by-step examples and tailor them for your environment. For more information, see Query Builder template examples.
Considerations for using Query Builder templates
The following sections provide information and considerations for using Query Builder templates in Cortex XSIAM.
General considerations
The following general considerations apply to Query Builder templates:
-
The templates run on the following datasets by default:
- Basic, Identity, Endpoint, and Network templates:
xdr_data - Cloud template:
cloud_audit_logs
It is also possible to run the templates on all datasets.
- Basic, Identity, Endpoint, and Network templates:
- The query uses an AND operator between the filtering fields.
- Separate multiple values with pipes and do not add spaces between the value and the pipe.
- Some of the filtering fields are aliases and therefore search all fields that are associated with the alias.
- Fields with dropdown options support ENUMs and free text values.
- In IP address fields, you can also specify subnets.
- The asterisk (
*) wildcard is supported, except in subnet values. - You cannot remove the predefined fields, but you can leave them blank.
- When filtering integer and float fields, you can only specify two operators from the four available options.
= (equal to) and != (not equal to) operators
Filtering fields support the = (equal to) and != (not equal to) operators, and you can specify both operators for the same field. The following conditions apply to these operators:
- If you specify multiple values for a field with the
=operator, the OR operator is applied. For example,User Name = aaa|bbbsearches for instances of user name equal to aaa OR bbb. - If you specify multiple values for a field with the
!=operator, the AND operator is applied. For example,User Name != aaa|bbbsearches for instances of user name not equal to aaa AND bbb. - If you specify both operators (
=and!=) for the same field, the AND operator is applied. For example,COUNTRY = Empty values AND COUNTRY != USA.
>= (greater than and equal) and <= (less than and equal) operators
Filtering fields support the >= (greater than and equal) and <= (less than and equal) operators, and you can specify both operators for the same field. The following conditions apply to these operators:
- Cortex XSIAM supports using these operators for integer and float fields.
- Empty values are not supported with these operators.
Include and exclude empty values
You can use the Empty values field to include or exclude fields with empty values and strings. In the search results, some fields might return empty values. This occurs if no data is mapped to a field. The following conditions apply to the Empty values field:
-
If you specify = and select Empty values, the query includes fields with empty values with an OR operator.
For example,
_vendor = aaa OR _vendor = Empty valuessearches the_vendorfield for any instances of aaa or empty values. -
If you specify != and select Empty values, the query excludes fields with empty values with an AND operator.
For example,
_vendor != aaa AND _vendor != Empty valuessearches the_vendorfield for values that are not equal to aaa AND do not contain empty values. -
If you specify != and select Empty values for an alias, you might not receive any results. The query searches all of the fields associated with the alias for non-empty values. If any of the associated fields contain empty values, no results are returned.
For example,
User Name != aaa AND User Name != Empty valuessearches the User Name alias fields for values that are not equal to aaa AND empty values. If the query finds either aaa or empty values in any of the alias fields, no results are returned.
Create a query from a template
You can use the Query Builder templates to create effective queries in Cortex XSIAM without using the Cortex Query Language (XQL).
Review the following topics:
- Query Builder templates
- Get started with Query Builder templates
- Considerations for using Query Builder templates
How to create a query from a Query Builder template
- Select Investigation & Response → Search → Query Builder.
-
In the Query Builder, select the template that you want to use.
If you want to use the Free Text Search template, see Run a free text query.
- (Optional) Change the Run on option (upper-right corner) that controls the datasets configured to run with the template. The templates are automatically configured to run on default datasets or you can choose to run them on all datasets. The templates run on the following datasets by default:
- Basic, Identity, Endpoint, and Network templates:
xdr_data - Cloud template:
cloud_audit_logs
- Basic, Identity, Endpoint, and Network templates:
- Enter values for any of the predefined fields and specify whether to include Empty values in the query.
Guidelines
- The query uses an AND operator between the filtering fields.
- Separate multiple values with pipes and do not add spaces between the value and the pipe.
- Some of the filtering fields are aliases and therefore search all fields that are associated with the alias.
- You can run an empty template with no values specified. The query results will show data from all of the fields in the template specific fieldset.
For more information about using the filtering fields, operators, and including Empty values, see Considerations for using Query Builder templates.
5. (Optional) Click Add Field and select the additional filtering fields or aliases to include in the query."
Note
- Field names and aliases are listed without their prefix, for example xdm.SOURCE.USER.USERNAME is listed as SOURCE.USER.USERNAME and XDM_ALIAS.ipv4 is listed as ipv4.
- Fields that are already included in the query template are shown as grayed out.
- In the Identity and Network templates,
xdm.event.outcomeshows as grayed out. In these templates, the ACTION STATUS and CONNECTION STATUS fields are linked to thexdm.event.outcomeenum. Therefore, you can't duplicate this field in a query.
6. Click TIME and select a time frame for the query.
-
Click Run to start the query, or click Schedule to run the query at a specific time.
You can also click Continue in XQL to open the XQL Query Builder showing the defined XQL fields. In XQL you have the flexibility to add additional stages and functions that are not available in the Query Builder templates.
-
Review the Results.
The search is limited to 1,000 results. In the Fields column, you can see all of the fields that were included in the query in the following order: (1) _time, (2) the filtering fields that you defined, and (3) the fields from the template-specific fieldset.
Note
This order might change if you include a filtering field that is listed in the fieldset. In that case, the field is taken out of the fieldset and ordered at the top of the list with the other filtering fields.
The query is also saved in the Query Center. In the Query Center, you can identify your query by filtering the Created By column and looking in the Query Description column. Queries created from a template are prefixed with the template name.
Example
-
The following query searches for instances of IP 3.3.3.3 with a source host name equal to host1 or host2. IP is an alias field; therefore, the query searches all fields associated with the alias.
IP ADDRESS = 3.3.3.3, SOURCE.HOST.OS = host1|host2
-
The following query searches for the event outcome success with an event duration value that is not equal to null:
EVENT.OUTCOME = XDM_CONST.OUTCOME_SUCCESS, EVENT.DURATION != Empty values
What to do next
- To edit or rerun the query, click Back to edit to review the template, or Continue in XQL to review the XQL.
- Practice running queries with Query Builder template examples.
Run a free text query
You can use the Free text template to query your datasets for free-text strings without building a Cortex Query Language (XQL) query in Cortex XSIAM. The template queries all of the raw datasets that are stored in your tenant and returns up to 1,000 results.
Note
The query in free-text search in the Query Templates page runs only on raw datasets. You can only scope your search using the search stage available in the XQL editor.\
Use the search stage in the XQL editor to use scoping to query free-text strings in specific datasets, normalized datasets, or all datasets in your tenant.
How to run a free text query
- Select Investigation & Response → Query Templates.
- Under General Search, select Free text.
- In the Text Contains field, type one or more strings. Separate multiple strings with pipes, which applies the OR operator.
-
Click TIME and select a time frame for the query.
Note
Free text search is limited to the last 90 days of data. Specifying a time frame outside of this limitation will cause the query to fail.
-
Click Run to start the query, or click Schedule to run the query at a specific time.
Free text search searches the relevant columns in each dataset. Relevant columns are subject to a change and can vary between datasets.
You can also click Continue in XQL to translate the query with the fields that you specified into XQL. In XQL you have the flexibility to add additional stages and functions that are not available in the Query Builder templates.
-
Review the results.
The searched string is highlighted in the results.
In the Fields column, you can see all of the fields in which the string was discovered. Fields are listed in the following order: (1)
_time, (2)_dataset, and (3) the fields in which the string was discovered, ordered by highest to lowest number of hits.In the
RAW_DATAcolumn, click Show more to see the specific row in the dataset in which the string was discovered.
What to do next
- To edit or rerun the query, click Back to edit to review the template in the Query Builder, or Continue in XQL to review the XQL.
- Practice running queries with Query Builder template examples.
Query Builder template examples
The following examples can help familiarize you with running queries.
Use the Identity template to search for information about a specific user
Goal: Search for information about users working on the system.
This example uses the Identity template, but you can apply it to any of the templates. In the example, we run multiple queries that narrow down our search results and find the required information we require.
Query 1: Search for information about all users
- Select Investigation & Response → Search → Query Builder.
- Select the Identity template.
-
Specify USER = * and do not select Empty values.
This searches for all users, and excludes empty values or strings from the results. The
USERfield is an alias so all associated fields are also searched. - Specify TIME → Last 7D.
- Click Run.
In the Results page, scroll through the table to find a value or string that you want to investigate further. If you are not receiving results, you can broaden the TIME to Last 30D.
In this example, the results returned information about USER66 in the XDM.SOURCE.USER.USERNAME column. To refine the search for information about this user, run another query.
Query 2: Search for information about a specific user
- Copy the term that you want to search, in this case USER66.
-
Click Back to edit.
The Identity template opens with the original search options.
- Click Add field and select SOURCE.USER.USERNAME.
- Specify SOURCE.USER.USERNAME = USER66 and do not select Empty values.
- Click Run.
The Results page provides more information about USER66.
Look through the results for anything you would like to investigate further. In this example, there is information about the operations performed by this user in the XDM.EVENT.OPERATION column. We can refine the search to see all FILE_REMOVE operations for USER66.
Query 3: Search for FILE_REMOVE operations for a specific user
- Click Back to edit.
- Click Add field and select EVENT.OPERATION.
- Specify EVENT.OPERATION = and select XDM_CONST.OPERATION_TYPE_FILE_REMOVE from the list.
- Click Run.
Review the Results page and continue to refine your search by using this method.
Use the Network template to search for hosts triggering threat events in the United States
Goal: Search for information about source hosts in the United States that caused threat events over the last 7 days.
Query 1: Search for network information in the United States
- Select Investigation & Response → Search → Query Builder.
- Select the Network template.
-
Specify COUNTRY = United States and do not select Empty values.
This searches for network activity in the United States, and excludes empty values or strings from the results.
- Specify TIME → Last 7D.
- Click Run.
In the Results page, scroll through the table to find a value or string for which you would like to find more information.
In this example, the results returned information about XDM.EVENT.TYPE = threat for host DC3ENX4FGC07 in the XDM.SOURCE.HOST.HOSTNAME column. To refine the search, run another query.
Query 2: Search for information about a specific host and event type
- Copy the term that you want to search, in this case DC3ENX4FGC07.
-
Click Back to edit.
The Network template opens with the original search options.
- Click Add field and select EVENT.TYPE.
- Specify EVENT.TYPE = threat and do not select Empty values.
- Click Add field and select SOURCE.HOST.HOSTNAME.
- Specify SOURCE.HOST.HOSTNAME = DC3ENX4FGC07 and do not select Empty values.
- Click Run.
The Results page provides more information about EVENT.TYPE = threat actions from host DC3ENX4FGC07.
To investigate further, we could run another query, or in this case, investigate the causality chain of the event. In the search results, right-click and select Investigate Causality Chain.
Use the Free text template to search for an IP address
Goal: Search for information about IP address 175.18.7.29 in the last 24 hours.
- Select Investigation & Response → Search → Query Builder.
- Select the Free text template.
- Specify Text Contains = 175.18.7.29.
- Specify TIME → Last 24H.
- Click Run.
In the Results page the searched string is highlighted. In the Fields column, you can see all of the fields in which the string was discovered. In the RAW_DATA column, click Show more to see the specific row in the dataset in which the string was discovered.
If you want to deepen your search you can Continue in XQL, which opens an XQL search with the fields you defined in the template. You can add stages and functions to the XQL that narrow down your search.
Overview of the Query Center
The Query Center displays information about all queries that were run on the tenant, and the queries that are currently In Progress. The Query Center displays the following tabs:
-
Query History
View and manage all completed Cortex Query Language (XQL) and Graph Search queries. On this tab you can view query results, re-run and adjust queries, and schedule when a query runs. You can also see details of cancelled queries, including the query type and source, and the name of the user who cancelled the query.
-
Active Queries
View and manage all queries that are currently In Progress on the tenant. You can view details about a running query, including the user who ran the query, the context from which it ran, the source of the query, and the amount of time that the query has been running. From this tab you can also cancel active queries.
Note
- Very short queries might not be listed.
- You cannot cancel correlation queries.
- The default retention period for historic queries is aligned with issue retention.
Edit and run queries in Query Center
From the Query Center in Cortex XSIAM you can take action on the Completed and In Progress queries that are running on your tenant.
Right-click a query to see the available options, where some of the options differ depending on the type of query you've selected. The pivot (right-click) options described below are some of the ones that may require further explanation.
Note
If query limits are applied to your tenant, the number of concurrent running queries is limited per user. If query usage is reaching the defined limit, a system message warns you that a high query load is impacting performance. If you exceed the limit, new queries are blocked until query usage drops. You can view all active queries under Query Center → Active Queries, and cancel queries to reduce the load.
View the results of a query
You can view the original results of an XQL query when it was originally run in the Query Builder and added to the Query Center.
- Select Investigation & Response → Search → Query Center → Query History.
-
Identify the XQL query by looking in the Query Name and Query Description columns.
The Query Description column displays the parameters that were defined for a query. If necessary, use the filter on the column to reduce the number of queries displayed.
Queries that were created from a Query Builder template are prefixed with the template name.
-
Right-click anywhere in the XQL query row and select Show results.
You have the option to Show results in new tab or Show results in same tab.
- (Optional) Export to file to export the results to a tab-separated values (TSV) file.
-
(Optional) Perform additional investigation on the issues.
Right-click a value in the results table to see the options for further investigation.
Run a query
You can run a query for a Graph Search query.
- Select Investigation & Response → Search → Query Center → Query History.
-
Identify the Graph Search query by looking in the Query Name and Query Description columns.
The Query Description column displays the parameters that were defined for a query. If necessary, use the filter on the column to reduce the number of queries displayed.
-
Right-click anywhere in the Graph Search query row and select Run query.
You have the option to Run in same tab or Show in new tab.
- (Optional) The Graph Search results are displayed in a graph format by default. You can toggle to Table to view the results in a table format. In addition, you can always export the graph results using the icon at the top of the page to a PNG, SVG, or TSV file. Table results can only be exported to a TSV file.
-
(Optional) Perform additional investigation on the graph or table results.
On the graph results, you can either hover or select different nodes for further investigation. While in the table results, you can select any cell in the table for further investigation.
Modify a query
After you view the query results of an XQL query or run a Graph Search query as explained in the tasks above, you can change your search parameters to refine the search results or correct a search parameter.
- For queries created in XQL, type your changes in the XQL query field where the original query is listed and the results are displayed in the Query Results tab. After modifying the query, you can run, schedule, or save the query.
- For queries created with a Query Builder template, the defined parameters are shown at the top of the Results page. Select Back to edit to modify the query with the template format or Continue in XQL to open the query in XQL.
- For Graph Search queries, the graph results are displayed. Click anywhere in the Graph Search query interface, where your existing query is defined, to display the complete query, update your query, and rerun the search.
Schedule a query to run
You can schedule an XQL query to run on or before a specific date. Cortex XSIAM creates a new query in the Query Center, and when the query completes, it displays a notification in the notification bar.
How to schedule a query
- Select Investigation & Response → Search → Query Center → Query History.
- Right-click anywhere in the query and then select Schedule.
- Choose a schedule option and the date and time that the query should run:
- Run one-time query on a specific date
- Run query by date and time: Schedule a recurring query.
-
Click OK to schedule the query.
Cortex XSIAM creates a new query and schedules it to run on or by the selected date and time.
-
View the status of the scheduled query on the Scheduled Queries page.
You can also make changes to the query, edit the frequency, view when the query will next run, or disable the query. For more information, see Manage scheduled queries.
Cancel a query
Note
You can cancel your own queries. To cancel queries run by other users, you must have View/Edit permissions for Configurations → Query Management. By default, Instance administrators have View/Edit permission.
On the Active Queries tab you can cancel one or more In Progress queries. You might want to cancel long-running queries, or cancel queries to reduce tenant consumption. If query limits are applied to your tenant and you exceed the defined limit of concurrent running queries, new queries are blocked until the number of active queries falls below the threshold. Canceling active queries allows you to unblock and run new queries.
How to cancel a query
- Select Investigation & Response → Search → Query Center → Active Queries.
- Select one or more queries and click Cancel Selected Queries.
Note
- Cancelled queries show a Canceled status. You can see details of all canceled queries in the Query History tab.
- You cannot cancel correlation rule queries.
- If you cancel a scheduled query, only the current query is cancelled. Future recurrences of the scheduled query are not affected.
Query Center reference information
The table below lists the common fields in the Cortex XSIAM Query Center, where the options differ for an XQL query versus a Graph Search query.
Note
Certain fields are exposed and hidden by default. An asterisk (*) is beside every field that is exposed by default.
Query Center table
| Field | Description |
|---|---|
| BQL | Indicates whether the Cortex Query Language (XQL) query was created by the native search. Native search has been deprecated; this field allows you to view data for XQL queries performed before deprecation. |
| COMPUTE UNIT USAGE | For XQL queries, indicates the number of query units that were used to execute the API query and Cold Storage query. |
| ISSUED BY * | For XQL queries, indicates the user who ran or scheduled the query. For Graph Search queries, indicates the user who ran the query. |
| DURATION (SEC) | Number of seconds it took to execute the XQL query. |
| EXECUTION ID | Unique identifier of XQL and Graph Search queries in the tenant. The identifier ID generated for queries executed in Cortex XSIAM and XQL query API. |
| NUM OF RESULTS* | Number of results returned by the query. |
| PUBLIC API | Whether the source executing the XQL query was an XQL query API. |
| QUERY DESCRIPTION* | Query parameters used to run the query. |
| QUERY ID | Unique identifier of the query. |
| QUERY NAME* |
|
| QUERY STATUS* | Status of the query, where the options differ based on the query type:
|
| QUERY SYNTAX | The exact syntax used to write the query. |
| RESULTS SAVED* | For XQL queries, you can choose whether to save the query results, so the output of the field is either Yes or No. Yet, for Graph Search queries, the results can't be saved and must be run each time again, so the field is always No. |
| SIMULATED COMPUTE UNITS | Number of XQL query units that were used to execute the Hot Storage query. |
| Source | Source from which the query was run, for example Playbook, Report, or Investigation. |
| Source ID | ID of the source from where the query was run. |
| Source Name | Name of the source from where the query was run. |
| TIMESTAMP* | Date and time the query was created. |
| XQL | Indicates whether the XQL query was created by an XQL search. |
Manage scheduled queries
The Scheduled Queries page displays information about your scheduled and recurring queries in Cortex XSIAM. From this page, you can edit scheduled query parameters, view previous executions, disable, and remove scheduled queries. Right-click a query to see the available options.
View executed queries
- Select Investigation & Response → Search → Scheduled Queries.
-
Locate the scheduled query for which you want to view previous executions.
If necessary, use the Filter to reduce the number of queries returned.
-
Right-click anywhere in the query row, and select Show executed queries.
Cortex XSIAM filters the queries on the Query Center.
Edit the query frequency
- Select Investigation & Response → Search → Scheduled Queries.
-
Locate the scheduled query that you want to edit.
If necessary, use the Filter to reduce the number of queries returned.
- Right-click anywhere in the query row and then select Edit.
- Adjust the schedule settings, and then click OK.
Scheduled Queries reference information
The table below lists the common fields in the Scheduled Queries page in Cortex XSIAM.
Note
Certain fields are exposed and hidden by default. An asterisk (*) is beside every field that is exposed by default.
Scheduled Queries table
| Field | Description |
|---|---|
| BQL | Whether the query was created by the native search. Native search has been deprecated, this field allows you to view data for queries performed before deprecation. |
| ISSUED BY | User who ran or scheduled the query. |
| MITRE ATT&CK TACTIC | MITRE ATT&CK tactics tagged in the scheduled query. |
| MITRE ATT&CK TECHNIQUE | MITRE ATT&CK techniques tagged in the scheduled query. |
| NEXT EXECUTION |
|
| PUBLIC API | Whether the source executing the query was an XQL query API. |
| QUERY DESCRIPTION | Query parameters used to run the query. |
| QUERY ID | Unique identifier of the query. |
| QUERY NAME |
|
| QUERY SYNTAX | The exact syntax used to write the query. |
| SCHEDULE TIME | Frequency or time at which the query was scheduled to run. |
| XQL | Whether the query was created by XQL search. |
Manage your personal query library
Cortex XSIAM provides a Query Library for saving and managing your custom Cortex Query Language (XQL) queries. When creating a query in XQL or managing your queries from the Query Center, you can save them in the Query Library.
The Query Library contains a powerful search mechanism that enables you to search in any field related to the query, such as the query name, description, creator, query text, and labels. In addition, adding a label to your query enables you to search for these queries using these labels in the Query Library.
How to add a query to your personal query library
-
Save a query to your personal query library.
You can do this in two ways:
- From the Query Builder
- Select Investigation & Response → Search → Query Builder → XQL.
- In the XQL query field, define the parameters of your query.
- Select Save as → Query to Library.
- From the Query Center
- Select Investigation & Response → Search → Query Center.
- Locate the query that you want to save to your personal query library.
- Right-click anywhere in the query row, and select Save query to library.
- From the Query Builder
- Set these parameters.
- Query Name: Specify a unique name for the query. Query names must be unique in both private and shared lists, which includes other people’s queries.
- Query Description (Optional): Specify a descriptive name for your query.
- Labels (Optional): Specify a label that is associated with your query. You can select a label from the list of predefined labels or add your label and then select Create Label. Adding a label to your query enables you to search for queries using this label in the Query Library.
- Share with others: You can either set the query to be private and only accessible by you (default) or move the toggle to Share with others the query, so that other users using the same tenant can access the query in their Query Library.
-
Click Save.
A notification appears confirming that the query was saved successfully to the library, and closes on its own after a few seconds.
The query that you added is now listed as the first entry in the Query Library. The query editor is opened to the right of the query.
-
Other available options.
As needed, you can return to your queries in the Query Library to manage your queries. Here are the actions available to you.
- Edit the name, description, labels, and parameters of your query by selecting the query from the Query Library, hovering over the line in the query editor that you want to edit, and selecting the edit icon to edit the text.
- Search query data and metadata: Use the Query Library’s powerful search mechanism that enables you to search in any field related to the query, such as the query name, description, creator, query text, and label. The Search query data and metadata field is available at the top of your list of queries in the Query Library.
- Show: Filter the list of queries from the Show menu. You can filter by the Palo Alto Networks queries provided with Cortex XSIAM , filter by the queries Created by Me, or filter by the queries Created by Others. To view the entire list, Select all (default).
- Save as new: Duplicate the query and save it as a new query. This action is available from the query menu by selecting the 3 vertical dots.
- Share with others: If your query is currently unshared, you can share with other users on the same tenant your query, which will be available in their Query Library. This action is only available from the query menu by selecting the 3 vertical dots when your query is unshared.
- Unshare: If your query is currently shared with other users, you can Unshare the query and remove it from their Query Library. This action is only available from the query menu by selecting the 3 vertical dots when your query is shared with others. You can only Unshare a query that you created. If another user created the query, this option is disabled in the query menu.
- Delete the query. You can only delete queries that you created. If another user created the query, this option is disabled in the query menu when selecting the 3 vertical dots.
Managing your queries
The ability to create, edit, or share queries is governed by access management. If certain options are unavailable, contact your administrator.
The visibility of saved queries in the Query Library is determined by access management. You can manage who can view (and run) or edit your queries by sharing them with specific users, user groups, or API keys. You can also view queries created and shared by others in your organization if they have granted you access or marked the query as Public.
The following icons in the Query Library table help you identify the sharing status of each query:
- : Identifies Restricted queries you created that have not been shared.
- : Identifies queries you created that are currently shared with others.
- : Identifies queries created by another user that have been shared with you.
- : Identifies out-of-the-box (OOTB) system queries provided by Palo Alto Networks.
Use the following tools and the vertical ellipsis (⋮) menu to manage your saved queries:
- Search and filter: Use the search field to find queries by metadata or content. Use the Show menu to filter by Owned by Me, Owned by Others, or Palo Alto Networks.
- Save as new: Duplicate a query using the vertical ellipsis (⋮) menu.
- Share/Manage Access: Once a query is saved to the library, the Owner (or an authorized Editor) can manage who else can interact with it using the vertical ellipsis (⋮) menu. The specific option available (Share or Manage Access) is determined by tenant-level settings.
- Change owner: Administrators can use the vertical ellipsis (⋮) menu to change the query owner to a different user.
- Delete: You can only delete queries that you own. Palo Alto Networks system queries cannot be deleted.
Manage access to saved queries
Once a query is saved to the library, the Owner (or an authorized Editor) can manage who else can interact with it. The options available depend on the tenant-level settings configured by your administrator.
- In the Query Library tab, locate the query you want to share in the table.
- Click the three-dot vertical ellipsis (⋮) and select the available action:
- Share: This option appears when Owners can Share objects they created is enabled in tenant-level settings. It allows you to manage both General access and specific principals (users, user groups, and API keys).
- Manage Access: This option appears when Owners can Share objects they created is disabled in tenant-level settings. It only allows you to change the General access state.
- (If sharing is enabled) To share with specific entities:
- Search for the User, User Group, or API Key.
- Assign the access level: Viewer (can run/view) or Editor (can modify and, if permitted by tenant-level settings, share).
-
Set the General access drop-down menu (if authorized by tenant-level settings):
- Restricted: The query is private. It is only visible to the Owner and the specific principals added to the list.
- Public: The query is visible to every user who has the Query Library enabled in their role.
When the tenant-level setting Owners and editors can change the general access is unselected, the drop-down is disabled, and only an administrator can configure this option.
- Click Save.
XQL macros
XQL macros are reusable XQL code snippets stored in the Macro Library that enable modular query design. Unlike full saved queries which are complete and executable queries, macros are code fragments designed to be inserted into other queries at specific points in the pipeline. The macro pre-processor resolves all macro calls by performing text substitution before the query is compiled and executed.
A query is a complete piece of code that you wrote for a specific dataset which is kept in the library for future use. A macro is a series of functions or queries that are dataset-agnostic, and can be used instead of writing out a long query. Macros are used to simplify complex queries by breaking them down into smaller, reusable components.
Syntax
call_macro "<macro_name>"
With parameters:
call_macro "<macro_name>" param1=value1, param2=value2
Parameters
| Name | Type | Required | Description |
|---|---|---|---|
macro_name | string | Yes | The name of the macro as saved in the Macro Library. Must be enclosed in double quotes. |
param | key=value | No | One or more parameters to pass to the macro. Parameters are substituted into the macro definition where ${param} placeholders appear. Multiple parameters are separated by commas. |
Returns
The call_macro statement is replaced by the macro's definition text after parameter substitution. The resulting expanded query is then compiled and executed as a single query.
How macros work
The macro resolution process follows these steps:
- The XQL pre-processor scans the query for
call_macrostatements. - For each
call_macro, it retrieves the macro definition from the Macro Library. - Parameter values are substituted into
${param}placeholders in the macro definition. - The macro call is replaced with the expanded text.
- If the expanded text contains additional
call_macrostatements (nested macros), steps 2–4 repeat. - The fully expanded query is compiled and executed.
Usage notes
- Macros support dynamic parameters using
${variable_name}syntax in the macro definition. - Macros can call other macros (nested macros). The pre-processor resolves all nested calls recursively. However, you can't create macros that reference each other in a circular chain. For example you can't have macro A that calls macro B, which in turn calls macro A.
- You can have 10
call_macrostages in a single query. Each query can have 3 nested macros. In total there can be 30 macros in a single query. - A macro cannot call a full saved query. Use the
callstage to execute full saved queries. - A macro definition cannot begin with a
datasetordatamodelstatement. Macros are code fragments, not complete queries. - There's no syntax validation for macros, so be careful when you build them.
- Macros are available in one-time queries, scheduled queries, widgets, dashboards, reports, and scheduled correlations.
- Macros are managed through the Macro Library with the same RBAC/SBAC access controls as saved queries.
- The Query History, Active Queries and Scheduled Queries views display the original query text with
call_macrostatements. The Query Builder displays the fully expanded (substituted) query. - You can use macros across stages.
- You can use APIs to run a query that includes a macro, which will be expanded in runtime.
Macros vs. saved queries
| Feature | Macros (call_macro) |
Saved Queries (call) |
|---|---|---|
| Purpose | Reusable code snippets for modular logic | Complete, executable queries |
| Position in pipeline | Anywhere in the pipeline | Must be the starting point of a query |
| Execution | Text substitution before compilation | Executes as a separate query call |
Can contain dataset/datamodel |
No | Yes |
| Can call macros | Yes | Yes |
| Can call saved queries | No | Yes (via call) |
| Location in UI | Macro Library | Query Library |
Macro display in different views
| View | Display behavior |
|---|---|
| Query Builder Editor | Hover over a call_macro statement to see the macro definition in an inline overlay. Click to expand and replace the macro call with the literal code (undo supported). |
| Query History | Shows the fully expanded query that was executed (all macros substituted). |
| Active Queries | Shows the original query text with call_macro statements (pre-substitution). |
| Scheduled Queries | Shows the original query text with call_macro statements (pre-substitution). |
Examples
Example 1: Basic macro usage
Goal: Use a macro to filter and select specific fields from network data.
Assume a macro named network_filter is saved in the Macro Library with the following definition:
filter action_country != "US" | fields agent_hostname, action_country, action_remote_ip
XQL code:
dataset = xdr_data | call_macro "network_filter"
Explanation: The pre-processor replaces call_macro "network_filter" with the macro definition. The expanded query becomes:
dataset = xdr_data | filter action_country != "US" | fields agent_hostname, action_country, action_remote_ip
Output:
| AGENT_HOSTNAME | ACTION_COUNTRY | ACTION_REMOTE_IP |
|---|---|---|
| server-01 | DE | 203.0.113.5 |
| workstation-12 | JP | 198.51.100.22 |
Example 2: Macro with parameters
Goal: Use a macro with dynamic parameters to create a reusable field transformation.
Assume a macro named classify_severity is saved with the following definition:
alter severity_label = if(${field} < 3, "Low", if(${field} < 7, "Medium", "High"))
XQL code:
dataset = xdr_data | call_macro "classify_severity" field=action_severity | fields event_id, action_severity, severity_label
Explanation: The parameter field is substituted with action_severity. The expanded query becomes:
dataset = xdr_data | alter severity_label = if(action_severity < 3, "Low", if(action_severity < 7, "Medium", "High")) | fields event_id, action_severity, severity_label
Output:
| EVENT_ID | ACTION_SEVERITY | SEVERITY_LABEL |
|---|---|---|
| evt-001 | 2 | Low |
| evt-002 | 5 | Medium |
| evt-003 | 9 | High |
Example 3: Nested macros
Goal: Demonstrate a macro that calls another macro.
Assume two macros are saved:
Macro extract_domain definition:
alter domain = arrayindex(split(${field}, "@"), 1)
Macro email_analysis definition:
call_macro "extract_domain" field=${email_field} | comp count() as email_count by domain | sort desc email_count
XQL code:
dataset = xdr_data | call_macro "email_analysis" email_field=sender_address | limit 10
Explanation: The pre-processor first expands email_analysis, substituting ${email_field} with sender_address. The intermediate result contains call_macro "extract_domain" field=sender_address, which is then expanded. The final query becomes:
dataset = xdr_data | alter domain = arrayindex(split(sender_address, "@"), 1) | comp count() as email_count by domain | sort desc email_count | limit 10
Output:
| DOMAIN | EMAIL_COUNT |
|---|---|
| example.com | 1,245 |
| corp.net | 892 |
| external.org | 456 |
Example 4: Macro called from a saved query
Goal: Show how a saved full query can include macro calls.
Assume a saved query named daily_threat_report contains:
dataset = xdr_data | filter event_type = ENUM.EVENT_TYPE.NETWORK | call_macro "classify_severity" field=action_severity | call_macro "network_filter" | comp count() as threat_count by severity_label, action_country | sort desc threat_count
XQL code:
call "daily_threat_report"
Explanation: The call stage executes the saved query. During execution, the pre-processor expands both call_macro statements within the saved query before compilation.
Output:
| SEVERITY_LABEL | ACTION_COUNTRY | THREAT_COUNT |
|---|---|---|
| High | CN | 342 |
| Medium | RU | 218 |
| Low | DE | 156 |
Related articles
- Stages: The
callstage, thefilterstage, thealterstage, thefieldsstage
Manage your macros
Save and manage your XQL macros in the Macro Library under Investigations & Response -> XQL Search. You can create, edit, share, and delete macros using the same workflows available for saved queries.
Macro visibility and access
The visibility of saved macros in the Macro Library is governed by RBAC (Role-Based Access Control) and SBAC (Scope-Based Access Control). You can manage who can view (and run) or edit your queries by sharing them with specific users, user groups, or API keys. You can also view queries created and shared by others in your organization if they have granted you access or marked the query as Public.
- Private macros are visible only to the creator.
- Public macros are available to all users with appropriate permissions.
- All access changes are recorded in the management audit log.
- You can have up to 200 macros in your macro library.
Add a macro to your macro library
- In the Query Builder, write the XQL code snippet you want to save as a macro. Highlight the XQL code you want to save as a macro, right-click it, and select Save as Macro to Library.
- In the dialog, provide the following details:
- Name (required): A unique name for the macro. Macro names must be unique in both private and shared lists.
- Description (optional): A description of what the macro does.
- Labels (optional): Assign labels for organizing and filtering macros. You can select a label from the list of predefined labels or add your label and then select Create Label. Adding a label to your query enables you to search for queries using this label in the Query Library.
- Sharing: Toggle to make the macro public (available to all users) or private.
- Click Save.
Use the following tools and the vertical ellipsis (⋮) menu to manage your saved queries:
Search and filter: Use the search field to find queries by metadata or content. Use the Show menu to filter by Owned by Me, Owned by Others, or Palo Alto Networks.
Save as new: Duplicate a query using the vertical ellipsis (⋮) menu.
Share/Manage Access: After a query is saved to the library, the Owner (or an authorized Editor) can manage who else can interact with it using the vertical ellipsis (⋮) menu. The specific option available (Share or Manage Access) is determined by tenant-level settings.
Change owner: Administrators can use the vertical ellipsis (⋮) menu to change the query owner to a different user.
Delete: You can only delete queries that you own.
Edit a macro
- In the Macro library, click the macro to open it in the detail pane.
- Modify the macro definition, name, description, or labels as needed.
- Click Save to update the existing macro, or Save as New to create a copy.
Note: You can't edit a saved macro if it is referenced in other objects, for example other queries, widgets, dashboards, or scheduled correlation rules.
Delete a macro
- In the Macro library, right-click the macro or use the actions menu and select Delete.
- Confirm the deletion.
Note: You can't delete a saved macro if it is referenced in other objects, for example other queries, widgets, dashboards, or scheduled correlation rules.
Usage notes
- Macro names must be unique within the Macro Library.
- All macro modifications (create, edit, delete, access changes) are logged in the management audit log.
Federated Search
Federated Search is a query mechanism designed to provide unified access to distributed data sources without requiring pre-ingestion or centralization. This capability enables you to query data in place, significantly reducing the complexity and operational costs associated with the ingestion process and long-term data retention.
NOTE:
Federated Search is not enabled by default. To enable it in your tenant, contact your Customer Support Team.
Modern enterprises store massive volumes of data across multiple cloud providers and hybrid environments. Centralized data ingestion and warehousing may be insufficient or expensive for cold or regulatory-mandated data. Federated Search allows you to:
- De-couple data management from data analytics for cost optimization.
- Maintain economic solutions for long-term data storage.
- Perform on-demand incident response or compliance audits against existing long-term storage solutions without the overhead of ingestion.
The main use cases for Federated Search include:
- Incident Investigation: Querying events that occurred a long time ago, where the data might not have been ingested into Cortex XSIAM.
- Compliance audits: Accessing historical data needed for audits without the need for extensive ingestion.
- Long-Term data storage: Providing an integrated solution for retaining data for many years.
- Data linking: Joining external datasets with ingested datasets for comprehensive and unified data analysis.
You can keep non-critical, high-volume data types in their native storage locations while preserving the ability to query this data using Cortex Query Language (XQL). This ensures that visibility is gained into a broader spectrum of data while maintaining the core value proposition of deep analytics on ingested data.
NOTE:
Federated search queries consume compute units, which are calculated according to timeframe, complexity, and any cross-cloud egress costs that may apply.
Supported configurations
Federated Search supports the following configurations.
| PROPERTY | CONFIGURATION |
|---|---|
| Storage solutions | Amazon Web Services (AWS) S3 Google Cloud Storage (GCS) Azure Blob Storage |
| Formats | CSV Parquet JSONL NOTE: For optimal results, we recommend the Parquet format. Federated Search supports certain use cases of gzip compressed files. For additional information, please contact your support agent. |
| Partitioning/File Structure | Your data must be partitioned and must follow the Hive partitioning format, which uses key-value pairs. Partitions must be named in the yyyy-mm-dd format (for example, ds=2023-07-07). |
| Supported Regions | AWS: us-east-1, us-west-2, ap-northeast-2, ap-southeast-2, eu-west-1, eu-central-1 GCS: africa-south1, asia-east1, asia-east2, asia-northeast1, asia-northeast2, asia-northeast3, asia-south1, asia-south2, asia-southeast1, asia-southeast2, australia-southeast1, australia-southeast2, europe-central2, europe-north1, europe-north2, europe-southwest1, europe-west1, europe-west10, europe-west12, europe-west2, europe-west3, europe-west4, europe-west5, europe-west8, europe-west9, me-central1, me-central2, me-west1, northamerica-northeast1, northamerica-northeast2, northamerica-south1, southamerica-east1, southamerica-west1, us-central1, us-east1, us-east4, us-east5, us-south1, us-west1, us-west2, us-west3, us-west4 Azure Blob Storage: eastus2 NOTE: The list of supported regions may change in the future. |
Limitations
The following limitations apply to Federated Search:
| LIMITATION | DESCRIPTION |
|---|---|
| Regions | If your tenant is on a specific region server (and not on a multi-region server), the bucket must be in the same region as your tenant. If your tenant is on a multi-region server, you can only configure regions that are in the multi-region of your tenant. The bucket must be in the same multi-region as your Cortex tenant. For example, if your Cortex XSIAM tenant is located in the US multi-region, you can configure an external dataset only from regions in the US multi-region. |
| Queries | The following functions are not available in Federated Search and remain exclusive to fully ingested data:
|
Federated Search configuration
Before you run federated searches, you must first create an external dataset to run the query.
To define a new external dataset, go to Settings → Configurations → Data Management → Dataset management → External Datasets and click Add External Dataset. You can also access the wizard through the Query builder page Investigation & Response → Search → Query Builder → Federated Search.
- Prerequisites: Perform preliminary steps on your remote storage, such as creating a policy and attaching it to a role.
-
Connection setup and dataset definition:
Configure the connection and trust relationship with the CSP.
Define the dataset name, description, path within the storage, region, and format.
- Schema Validation: Initiate the process to access the remote storage, pull sample data, and deduce the schema. You can view the auto-detected schema and if the fields aren't accurate, add or delete fields as needed.
- Configuration review and dataset creation: Go over the details and create the dataset.
Amazon S3
Prerequisite
- Access to Cortex XSIAM communication. For a list of the authorized IP addresses, see Enable access to required PANW resources.
- An AWS bucket that contains your data sources.
- Permissions to modify IAM policies in AWS.
How to add an external dataset for an Amazon S3 bucket
-
In Amazon S3, create an IAM policy to allow access to your bucket.
- Navigate to IAM (Access Management) → Policies → Create Policy and select S3.
- In Actions Allowed, select Effect → Allow.
- In List, select ListBucket.
- In Read, select GetObject.
- In Resources, click ARN and fill your bucket name for both Bucket and Object. For Object, use an asterisk (*) and select Any object name.
- Check the details and click Next.
- Click Create Policy.
Your policy appears in the Policies table.
- Create a role for the policy you created.
- Navigate to IAM → Roles → Create Role.
- In the Trusted entity type page, select Web identity.
-
In the Web identity page, under Identity provider, select Google, and under Audience, type 00000, and click Next.
This will later be replaced by the identity created by Cortex XSIAM.
- Select your policy and click Next.
- Type a name for your role and select Create Role.
- Configure the connection.
- In the Federated Search wizard, type the Role ARN from AWS.
- Specify the bucket region. Supported regions are us-east-1, us-west-2, ap-northeast-2, ap-southeast-2, eu-west-1, eu-central-1.
-
Click Generate to create a new Identity for this connection and copy the generated Identity.
This is the identity provided by Cortex XSIAM to create a trust relationship with AWS.
- In the AWS IAM console, add a trust relationship by adding the identity you generated above to the role and set a maximum session duration.
- In AWS IAM, select Roles.
- Select the role you created.
-
Click Edit and set Maximum session duration to 12 hours.
This configures the length of time the session lasts before requiring re-authentication.
- Click Save changes.
- Select Trust Relationships and click Edit policy.
- Replace the value of
accounts.google.com:audwith the identity you generated above. You can also replace the policy content with the provided code snippet. - Click Update policy.
- Configure the dataset.
- In the Federated Search wizard, type a meaningful dataset name and add an optional description. External dataset names must always begin with
external_. -
In S3 URI, enter the Amazon S3 path of the partition directory using the S3 format. To find the path, in the AWS bucket click the directory to display Object overview and copy the S3 URI. The path can only include letters, digits, and the symbols "-","_","=",".". For example,
s3://bucket-name/table-name/. Don't use wildcards.Your partitioned data must follow the Hive partitioning format, which uses key-value pairs. In your directory, name your partitions in the yyyy-mm-dd format, for example ds=2025-10-07. This creates external datasets based on your partitioned data source paths.
When you filter a query using the Query Builder Time frame selection, the query uses the dates in the partition.
- Specify the format. For correct deduction of the schema, you must provide the correct file format. Federated Search supports CSV, Parquet, and JSONL files. For optimal results, we recommend using Parquet format with explicit schema definition. Federated Search supports certain use cases of gzip compressed files. For additional information, please contact your support agent.
- In the Federated Search wizard, type a meaningful dataset name and add an optional description. External dataset names must always begin with
- Test the connection.
- If the connection was successful, click Next.
-
Validate the schema.\
Cortex XSIAM performs an automated schema discovery process by sampling approximately 500 events, typically from the most recent partitions available in the configured path.\
The auto-discovery relies on sampling and may not capture less common event types or fields that appear infrequently within the dataset. As a result, some fields visible in broader searches may not be included in the initially detected schema. This process also conducts validations to catch as many field type mismatches as possible, though due to the high volume of data involved, it cannot detect all mismatches.\
\
The auto-discovery process is meant to accelerate onboarding by generating a baseline schema, however you can still refine the schema as needed.We highly recommend that you don't change the auto-detected schema. However, if the auto-detected schema is incorrect, you can add, edit or delete fields.
- Missing fields: For json files and csv files, even if there are missing fields in the detected schema, your query will run successfully. For parquet files, the full schema is always deduced. If there's a partial schema and you add new fields to the actual data, the query will also run correctly.
- Field type mismatch: If a type mismatch is detected during onboarding, Cortex XSIAM displays an error message with the specific field name and allows you to change the field type by deleting the field and re-adding it with its proper type. If the type mismatch is found while running a query, the query fails and Cortex XSIAM displays an error message. In this case, you must delete the external dataset, re-onboard it and make the required changes to the field type accordingly.
- You can't delete the ds field, which is used for Hive partitioning.
- After you save the schema, you can't delete any fields you added during setup.
- Review all the details. You can go back to change any details you want, save the query and return to the external datasets table, or save and start a query in the XQL query page. Saving and starting a query can take some time.
Note: When you create, delete, or update an external dataset, the action is recorded in the Management Audit Logs under the type External Datasets.
Google GCS
Prerequisite
- Access to Cortex XSIAM communication. For a list of the authorized IP addresses, see Enable access to required PANW resources.
- A GCS bucket that contains your data sources.
- Permissions to modify IAM policies in GCS.
How to add an external dataset for a Google Cloud Storage bucket
- Configure the connection.
-
Specify the bucket region. Federated Search supports the following regions:\
africa-south1,asia-east1,asia-east2,asia-northeast1,asia-northeast2,asia-northeast3,asia-south1,asia-south2,asia-southeast1,asia-southeast2,australia-southeast1,australia-southeast2,europe-central2,europe-north1,europe-north2,europe-southwest1,europe-west1,europe-west10,europe-west12,europe-west2,europe-west3,europe-west4,europe-west6,europe-west8,europe-west9,me-central1,me-central2,me-west1,northamerica-northeast1,northamerica-northeast2,northamerica-south1,southamerica-east1,southamerica-west1,us-central1,us-east1,us-east4,us-east5,us-south1,us-west1,us-west2,us-west3,us-west4You can only configure regions that are in the multi-region of your tenant.
-
Click Generate to create a new Identity for this connection and copy the generated Identity.
This is the service account that will allow read access to the GCS bucket.
-
Grant access to the connection.
- In the GCS project, navigate to IAM.
- In Allow → View by principals, click Grant access.
- Under New principles, paste the Identity you generated in the Federated Search wizard.
- Under Assign roles, select the role Storage Object Viewer.
- Click Save.
-
- Configure the dataset.
- In the Federated Search wizard, type a meaningful dataset name and add an optional description. External dataset names must always begin with
external_. -
In GS URI, specify the partition directory. For example,
s3://bucket-name/table-name/. Don't use wildcards.Your partitioned data must follow the Hive partitioning format, which uses key-value pairs. In your directory, name your partitions in the yyyy-mm-dd format, for example ds=2025-10-07. This creates external datasets based on your partitioned data source paths.
When you filter a query using the Query Builder Time frame selection, the query uses the dates in the partition.
- Specify the format. For correct deduction of the schema, you must provide the correct file format. Federated Search supports CSV, Parquet, and JSONL files. For optimal results, we recommend using Parquet format with explicit schema definition. Federated Search supports certain use cases of gzip compressed files. For additional information, please contact your support agent.
- In the Federated Search wizard, type a meaningful dataset name and add an optional description. External dataset names must always begin with
- Test the connection.
- If the connection was successful, click Next.
-
Validate the schema.\
Cortex XSIAM performs an automated schema discovery process by sampling approximately 500 events, typically from the most recent partitions available in the configured path.\
The auto-discovery relies on sampling and may not capture less common event types or fields that appear infrequently within the dataset. As a result, some fields visible in broader searches may not be included in the initially detected schema. This process also conducts validations to catch as many field type mismatches as possible, though due to the high volume of data involved, it cannot detect all mismatches.\
\
The auto-discovery process is meant to accelerate onboarding by generating a baseline schema, however you can still refine the schema as needed.We highly recommend that you don't change the auto-detected schema. However, if the auto-detected schema is incorrect, you can add, edit or delete fields.
- Missing fields: For json files and csv files, even if there are missing fields in the detected schema, your query will run successfully. For parquet files, the full schema is always deduced. If there's a partial schema and you add new fields to the actual data, the query will also run correctly.
- Field type mismatch: If a type mismatch is detected during onboarding, Cortex XSIAM displays an error message with the specific field name and allows you to change the field type by deleting the field and re-adding it with its proper type. If the type mismatch is found while running a query, the query fails and Cortex XSIAM displays an error message. In this case, you must delete the external dataset, re-onboard it and make the required changes to the field type accordingly.
- You can't delete the ds field, which is used for Hive partitioning.
- After you save the schema, you can't delete any fields you added during setup.
- Review all the details. You can go back to change any details you want, save the query and return to the external datasets table, or save and start a query in the XQL query page. Saving and starting a query may take some time.
When you create, delete, or update an external dataset, the action is recorded in the Management Audit Logs under the type External Datasets
Azure Blob Storage
Prerequisite
- Access to Cortex XSIAM communication. For a list of the authorized IP addresses, see Enable access to required PANW resources.
- An Azure Blob Storage blob with your data sources.
- Permissions to modify IAM policies in Azure Blob Storage.
How to add an external dataset for an Azure blob
-
Create a new registration in Azure Blob Storage to be used by Federated Search.
- In your Azure tenant, navigate to All Services → App registrations, and click New registration.
- Fill the following fields as below:
- Name: Type a name
- Supported account types: Accounts in this organizational directory only
- Redirect URI: Leave blank for now.
- Click Register.
Note: Copy the Directory (tenant) ID, the Application (client) ID, and the Object ID. You will use these in the connection step.
- Configure the connection.
- In the Federated Search wizard, paste the following values from Azure: Directory ID, Application ID, Object ID.
-
Specify the blob region. Federated Search supports only eastus2.
You can only configure regions that are in the multi-region of your tenant.
-
Click Generate to create a new Identity for this connection and copy the generated Identity.
This is the identity used to establish the trust with Azure Storage.
- Create credentials for the application.
- In your Azure tenant, under All services → App registrations, select your application and click Add a certificate or secret.
- Select Federated credentials and click Add credential.
- In the Add a credential page, fill in the following values:
- Federated credential scenario: Other issuer
- Issuer: https://accounts.google.com
- Type: Explicit subject identifier
- Value: Identity you generated above in the Federated Search wizard.
- Type a name and description, and click Add.
- Assign a role to the application.
- In Azure → Storage accounts, select your blob.
- Select the container and, in the left menu, click Access Control (IAM).
- Under Check Access, click Add role assignment.
- In Role → Job function roles, select Storage Blob Data Reader and click Next.
- For the Assign access to field, select User, group, or service principal.
- Click Select members, search for the name of your app registration. Select the app registration and click Select.
- Click Review + assign to finalize.
- Configure the dataset.
- In the Federated Search wizard, type a meaningful dataset name and add an optional description. External dataset names must always begin with
external_. -
In Container URL, specify the partition directory. For example,
s3://bucket-name/table-name/. Don't use wildcards.Your partitioned data must follow the Hive partitioning format, which uses key-value pairs. Name your partitions in the yyyy-mm-dd format, for example ds=2025-10-07. This creates external datasets based on your partitioned data source paths.
When you filter a query using the Query Builder Time frame selection, the query uses the dates in the partition.
- Specify the format. For correct deduction of the schema, you must provide the correct file format. Federated Search supports CSV, Parquet, and JSONL files. For optimal results, we recommend using Parquet format with explicit schema definition. Federated Search supports certain use cases of gzip compressed files. For additional information, please contact your support agent.
- In the Federated Search wizard, type a meaningful dataset name and add an optional description. External dataset names must always begin with
- Test the connection.
- If the connection was successful, click Next.
-
Validate the schema.\
Cortex XSIAM performs an automated schema discovery process by sampling approximately 500 events, typically from the most recent partitions available in the configured path.\
The auto-discovery relies on sampling and may not capture less common event types or fields that appear infrequently within the dataset. As a result, some fields visible in broader searches may not be included in the initially detected schema. This process also conducts validations to catch as many field type mismatches as possible, though due to the high volume of data involved, it cannot detect all mismatches.\
\
The auto-discovery process is meant to accelerate onboarding by generating a baseline schema, however you can still refine the schema as needed.We highly recommend that you don't change the auto-detected schema. However, if the auto-detected schema is incorrect, you can add, edit or delete fields.
- Missing fields: For json files and csv files, even if there are missing fields in the detected schema, your query will run successfully. For parquet files, the full schema is always deduced. If there's a partial schema and you add new fields to the actual data, the query will also run correctly.
- Field type mismatch: If a type mismatch is detected during onboarding, Cortex XSIAM displays an error message with the specific field name and allows you to change the field type by deleting the field and re-adding it with its proper type. If the type mismatch is found while running a query, the query fails and Cortex XSIAM displays an error message. In this case, you must delete the external dataset, re-onboard it and make the required changes to the field type accordingly.
- You can't delete the ds field, which is used for Hive partitioning.
- After you save the schema, you can't delete any fields you added during setup.
- Review all the details. You can go back to change any details you want, save the query and return to the external datasets table, or save and start a query in the XQL query page. Saving and starting a query can take some time.
Note: When you create, delete, or update an external dataset, the action is recorded in the Management Audit Logs under the type External Datasets.
Query using Federated Search
To query using Federated search, navigate to Incident Response → Investigation → Query Builder and select XQL.
You can build queries across external datasets and ingested datasets, giving you a powerful tool.
In its current version, Federated Search enables only ad-hoc queries via the query builder. You can search, filter and use JOIN operations.
NOTE:
The following aren't available in Federated Search and remain exclusive to fully ingested data.
- Complex, cross-source analytical functions, for example correlations, widgets, dashboards, and APIs
search,targetandviewXQL stages
NOTE:\
\
If there is a type mismatch between the schema and the data in the field, the query fails and Cortex XSIAM displays an error message. In this case, you must delete the external dataset, re-onboard it and make the required changes to the field type accordingly
Manage external datasets
Manage external datasets created for federates searches in Settings → Configurations → Data Management → Dataset management → External Datasets.
On this page you can do the following:
- Add an external dataset: Click Add External Dataset.
- Check the connection status: The connection status is automatically checked once a week. To manually check the connection status, hover to the right on the dataset row and click Check connection.
- View: Hover to the right on the dataset row and click the eye icon.
-
Edit: This opens the setup wizard where you can change the description and the schema.
NOTE:
We highly recommend that you don't change the auto-detected schema. However, in the Edit window you can add new fields or delete the new fields you added in the Edit window. You can't delete the fields that were configured during setup.
-
Delete the dataset: Hover to the right on the dataset row and click Delete dataset.
This action deletes the dataset connection in Cortex XSIAM. The dataset in your external storage isn't affected.
- Run a query using the dataset: Hover to the right on the dataset row and click the triangle. This opens the Query Builder page, with the dataset already defined.
Legacy Query Builder
We recommend using the Query Builder in New mode to take advantage of the Query Builder templates and the ability to search the full Cortex Data Model (XDM).
In Legacy mode, the Query Builder searches predefined datasets only. To search the full XDM, switch to New mode or select XQL Search.
The Legacy Query Builder provides queries for the following types of entities:
- Process: Search on process execution and injection by process name, hash, path, command line arguments, and more. See Create process query.
- File: Search on file creation and modification activity by file name and path. See Create file query.
- Network: Search network activity by IP address, port, host name, protocol, and more. See Create network query.
- Image Load: Search on module load into process events by module IDs and more. See Create image load query.
- Registry: Search on registry creation and modification activity by key, key value, path, and data. See Create registry query.
- Event Log: Search Windows event logs and Linux system authentication logs by username, log event ID (Windows only), log level, and message. See Create event log query.
- Network Connections: Search security event logs by firewall logs, endpoint raw data over your network. See Create network connections query.
- Authentications: Search on authentication events by identity, target outcome, and more. See Create authentication query.
- All Actions: Search across all network, registry, file, and process activity by endpoint or process. See Query across all entities.
The Query Builder also provides flexibility for both on-demand query generation and scheduled queries.
Create authentication query
From the Query Builder, you can investigate authentication activity across all ingested authentication logs and data in Cortex XSIAM.
Some examples of authentication queries you can run include:
- Authentication logs by severity
- Authentication logs by the event message
- Authentication logs for a specific source IP address
How to build an authentication query
- From Cortex XSIAM, select Investigation & Response → Search → Query Builder.
- Select AUTHENTICATION.
-
Enter the search criteria for the authentication query.
By default, Cortex XSIAM will return the activity that matches all the criteria you specify. To exclude a value, toggle the
=option to=!. -
Choose when to run the query.
Select the calendar icon to schedule a query to run on or before a specific date or Run to run the query immediately and view the results in the Query Center.
While the query is running, you can always navigate away from the page and a notification is sent when the query completes. You can also Cancel the query or run a new query, where you have the option to Run only new query (cancel previous) or Run both queries.
- When you are ready, view the results of the query. For more information, see Review XQL query results.
Create event log query
From the Query Builder you can search Windows and Linux event log attributes and investigate event logs across endpoints with a Cortex XDR agent installed.
Some examples of event log queries you can run include:
- Critical level messages on specific endpoints.
- Message descriptions with specific keywords on specific endpoints.
How to build an event log query
- From Cortex XSIAM , select Investigation & Response → Search → Query Builder.
- Select EVENT LOG.
-
Enter the search criteria for your Windows or Linux event log query.
Define any event attributes for which you want to search. By default, Cortex XSIAM will return the events that match the attribute you specify. To exclude an attribute value, toggle the
=option to=!. Attributes are:- PROVIDER NAME: The provider of the event log.
- USERNAME: The username associated with the event.
- EVENT ID: The unique ID of the event.
- LEVEL: The event severity level.
- MESSAGE: The description of the event.
To specify an additional exception (match this value except), click the + to the right of the value and specify the exception value.
-
(Optional) Limit the scope to an endpoint or endpoint attributes:
Specify one or more of the following attributes: Use a pipe (** **) to separate multiple values. Use an asterisk (*) to match any string of characters.
- HOST: HOST NAME, HOST IP address, HOST OS, HOST MAC ADDRESS, or INSTALLATION TYPE.
- INSTALLATION TYPE can be either Cortex XDR agent or Data Collector.
- PROCESS: NAME, PATH, CMD, MD5, SHA256, USER NAME, SIGNATURE, or PID.
-
Specify the time period for which you want to search for events.
Options are Last 24H (hours), Last 7D (days), Last 1M (month), or select a Custom time period.
-
Choose when to run the query.
Select the calendar icon to schedule a query to run on or before a specific date or Run to run the query immediately and view the results in the Query Center.
While the query is running, you can always navigate away from the page, and a notification is sent when the query completes. You can also Cancel the query or run a new query, where you have the option to Run only new query (cancel previous) or Run both queries.
- When you are ready, view the results of the query. For more information, see Review XQL query results.
Create file query
From the Query Builder you can investigate connections between file activity and endpoints. The Query Builder searches your logs and endpoint data for the file activity that you specify. To search for files on endpoints instead of file-related activity, build an XQL query. For more information, see How to build XQL queries.
Some examples of file queries you can run include:
- Files modified on specific endpoints.
- Files related to process activity that exist on specific endpoints.
How to build a file query
- From Cortex XSIAM, select Investigation & Response → Search → Query Builder.
- Select FILE.
- Enter the search criteria for the file events query.
- File activity: Select the type or types of file activity you want to search: All, Create, Read, Rename, Delete, or Write.
-
File attributes: Define any additional process attributes for which you want to search. Use a pipe (
|) to separate multiple values (for examplenotepad.exe|chrome.exe). By default, Cortex XSIAM will return the events that match the attribute you specify. To exclude an attribute value, toggle the=option to=!. Attributes are:- NAME: File name.
- PATH: Path of the file.
- PREVIOUS NAME: Previous name of a file.
- PREVIOUS PATH: Previous path of the file.
- MD5: MD5 hash value of the file.
- SHA256: SHA256 hash value of the file.
- ACTION_DISK_DRIVER_NAME: The driver where the file was created.
- FILE_SYSTEM_TYPE: Operating system type where the file was run.
- ACTION_IS_VFS: Denotes if the file is on a virtual file system on the disk. This is relevant only for files that are written to disk.
- DEVICE TYPE: Type of device used to run the file: Unknown, Fixed, Removable Media, CD-ROM.
- DEVICE SERIAL NUMBER: Serial number of the device type used to run the file.
To specify an additional exception (match this value except), click the + to the right of the value and specify the exception value.
-
(Optional) Limit the scope to a specific acting process:
Select +PROCESS and specify one or more of the following attributes for the acting (parent) process.
Use a pipe (** ) to separate multiple values. Use an asterisk (***) to match any string of characters. - NAME: Name of the parent process.
- PATH: Path to the parent process.
- CMD: Command-line used to initiate the process, including any arguments, up to 128 characters.
- MD5: MD5 hash value of the process.
- SHA256: SHA256 hash value of the process.
- USER NAME: User who executed the process.
- SIGNATURE: Signing status of the parent process: Signature Unavailable, Signed, Invalid Signature, Unsigned, Revoked, Signature Fail.
- SIGNER: Entity that signed the certificate of the parent process.
- PID: Process ID of the parent process.
- Run search for process, Causality, and OS actors—The causality actor—also referred to as the causality group owner (CGO)—is the parent process in the execution chain that the Cortex XDR agent identified as being responsible for initiating the process tree. The OS actor is the parent process that creates an OS process on behalf of a different indicator. By default, this option is enabled to apply the same search criteria to initiating processes. To configure different attributes for the parent or initiate the process, clear this option.
-
(Optional) Limit the scope to an endpoint or endpoint attributes:
Select +Host and specify one or more of the following attributes:
-
HOST: HOST NAME, HOST IP address, HOST OS, HOST MAC ADDRESS, or INSTALLATION TYPE.
INSTALLATION TYPE can be either Cortex XDR agent or Data Collector.
-
PROCESS: NAME, PATH, CMD, MD5, SHA256, USER NAME, SIGNATURE, or PID.
Use a pipe (** ) to separate multiple values. Use an asterisk (***) to match any string of characters. -
-
Specify the time period for which you want to search for events.
Options are Last 24H (hours), Last 7D (days), Last 1M (month), or select a Custom time period.
-
Choose when to run the query.
Select the calendar icon to schedule a query to run on or before a specific date or Run to run the query immediately and view the results in the Query Center.
While the query is running, you can always navigate away from the page and a notification is sent when the query completes. You can also Cancel the query or run a new query, where you have the option to Run only new query (cancel previous) or Run both queries.
- When you are ready, view the results of the query. For more information, see Review XQL query results.
Create image load query
From the Query Builder, you can investigate connections between image load activity, acting processes, and endpoints.
Some examples of image load queries you can run include:
- Module load into process events by module path or hash.
How to build an image load query
- From Cortex XSIAM, select Investigation & Response → Search → Query Builder.
- Select IMAGE LOAD.
-
Enter the search criteria for the image load activity query.
- Type of image activity: All, Image Load, or Change Page Protection.
- Identifying information about the image module: Full Module Path, Module MD5, or Module SHA256.
By default, Cortex XSIAM will return the activity that matches all the criteria you specify. To exclude a value, toggle the
=option to=!. -
(Optional) To limit the scope to a specific source, click the + to the right of the value and specify the exception value.
Specify one or more attributes for the source.
Use a pipe (** ) to separate multiple values. Use an asterisk (***) to match any string of characters. - NAME: Name of the parent process.
- PATH: Path to the parent process.
- CMD: Command-line used to initiate the process, including any arguments, up to 128 characters.
- MD5: MD5 hash value of the process.
- SHA256: SHA256 hash value of the process.
- USER NAME: User who executed the process.
- SIGNATURE: Signing status of the parent process: Signature Unavailable, Signed, Invalid Signature, Unsigned, Revoked, Signature Fail.
- SIGNER: Entity that signed the certificate of the parent process.
- PID: Process ID of the parent process.
Run search for both the process and the Causality actor: The causality actor—also referred to as the causality group owner (CGO)—is the parent process in the execution chain that the app identified as being responsible for initiating the process tree. Select this option if you want to apply the same search criteria to the causality actor. If you clear this option, you can then configure different attributes for the causality actor.
-
(Optional) Limit the scope to an endpoint or endpoint attributes:
Specify one or more of the following attributes: Use a pipe (** **) to separate multiple values. Use an asterisk (*) to match any string of characters.
-
HOST: HOST NAME, HOST IP address, HOST OS, HOST MAC ADDRESS, or INSTALLATION TYPE.
INSTALLATION TYPE can be either Cortex XDR agent or Data Collector.
-
PROCESS: NAME, PATH, CMD, MD5, SHA256, USER NAME, SIGNATURE, or PID.
-
-
Specify the time period for which you want to search for events.
Options are Last 24H (hours), Last 7D (days), Last 1M (month), or select a Custom time period.
-
Choose when to run the query.
Select the calendar icon to schedule a query to run on or before a specific date or Run to run the query immediately and view the results in the Query Center.
While the query is running, you can always navigate away from the page and a notification is sent when the query completes. You can also Cancel the query or run a new query, where you have the option to Run only new query (cancel previous) or Run both queries.
- When you are ready, view the results of the query. For more information, see Review XQL query results.
Create network connections query
From the Query Builder, you can investigate network events stitched across endpoints and the Palo Alto Networks Next-Generation Firewall logs.
Some examples of a network query you can run include:
- Source and destination of a process.
- Network connections that included a specific App ID
- Processes that created network connections.
- Network connections between specific endpoints.
How to build a network connection query
- From Cortex XSIAM, select Investigation & Response → Search → Query Builder.
- Select NETWORK CONNECTIONS.
- Enter the search criteria for the network events query.
-
Network attributes: Define any additional process attributes for which you want to search. Use a pipe (
|) to separate multiple values (for example80|8080). By default, Cortex XSIAM will return the events that match the attribute you specify. To exclude an attribute value, toggle the=option to=!. Options are:- APP ID: App ID of the network.
- PROTOCOL: Network transport protocol over which the traffic was sent.
- SESSION STATUS
- FW DEVICE NAME: Firewall device name.
- FW RULE: Firewall rule.
- FW SERIAL ID: Firewall serial ID.
- PRODUCT
- VENDOR
To specify an additional exception (match this value except), click the + to the right of the value and specify the exception value.
-
-
(Optional) To limit the scope to a specific source, click the + to the right of the value and specify the exception value.
Specify one or more attributes for the source.
Use a pipe (** ) to separate multiple values. Use an asterisk (***) to match any string of characters. - HOST NAME: Name of the source.
- HOST IP: IP address of the source.
- HOST OS: Operating system of the source.
- PROCESS NAME: Name of the process.
- PROCESS PATH: Path to the process.
- CMD: Command-line used to initiate the process, including any arguments, up to 128 characters.
- MD5: MD5 hash value of the process.
- SHA256: SHA256 hash value of the process.
- PROCESS USER NAME: User who executed the process.
- SIGNATURE: Signing status of the parent process: Signature Unavailable, Signed, Invalid Signature, Unsigned, Revoked, Signature Fail.
- PID: Process ID of the parent process.
- IP: IP address of the process.
- PORT: Port number of the process.
- USER ID: ID of the user who executed the process.
- Run search for both the process and the Causality actor: The causality actor—also referred to as the causality group owner (CGO)—is the parent process in the execution chain that the app identified as being responsible for initiating the process tree. Select this option if you want to apply the same search criteria to the causality actor. If you clear this option, you can then configure different attributes for the causality actor.
-
(Optional) Limit the scope to a destination.
Use a pipe (** ) to separate multiple values. Use an asterisk (***) to match any string of characters. Specify one or more of the following attributes:
- REMOTE IP: IP address of the destination.
- COUNTRY: Country of the destination.
- Destination TARGET HOST,NAME, PORT, HOST NAME, PROCESS USER NAME, HOST IP, CMD, HOST OS, MD5, PROCESS PATH, USER ID, SHA256, SIGNATURE, or PID
-
Specify the time period for which you want to search for events.
Options are Last 24H (hours), Last 7D (days), Last 1M (month), or select a Custom time period.
-
Choose when to run the query.
Select the calendar icon to schedule a query to run on or before a specific date or Run to run the query immediately and view the results in the Query Center.
While the query is running, you can always navigate away from the page and a notification is sent when the query completes. You can also Cancel the query or run a new query, where you have the option to Run only new query (cancel previous) or Run both queries.
- When you are ready, view the results of the query. For more information, see Review XQL query results.
Create network query
From the Query Builder, you can investigate connections between network activity, acting processes, and endpoints.
Some examples of a network query you can run include:
- Network connections to or from a specific IP address and port number.
- Processes that created network connections.
- Network connections between specific endpoints.
How to build a network query
- From Cortex XSIAM, select Investigation & Response → Search → Query Builder.
- Select NETWORK.
- Enter the search criteria for the network events query.
- Network traffic type: Select the type or types of network traffic issues you want to search: Incoming, Outgoing, or Failed.
-
Network attributes: Define any additional process attributes for which you want to search. Use a pipe (
|) to separate multiple values (for example80|8080). By default, Cortex XSIAM will return the events that match the attribute you specify. To exclude an attribute value, toggle the=option to=!. Options are:- REMOTE COUNTRY: Country from which the remote IP address originated.
-
REMOTE IP: Remote IP address related to the communication.
When you run the query, depending on the outcome of the results, the value specified in this field might be displayed in the
dst_ipfield in the query results. This occurs if an RDP event is recorded whereby a user connected from the source IP to the destination IP. - REMOTE PORT: Remote port used to make the connection.
- LOCAL IP: Local IP address related to the communication. Matches can return additional data if a machine has more than one NIC.
- LOCAL PORT: Local port used to make the connection.
- PROTOCOL: Network transport protocol over which the traffic was sent.
To specify an additional exception (match this value except), click the + to the right of the value and specify the exception value.
-
(Optional) To limit the scope to a specific source, click the + to the right of the value and specify the exception value.
Specify one or more attributes for the source.
Use a pipe (** ) to separate multiple values. Use an asterisk (***) to match any string of characters. - NAME: Name of the parent process.
- PATH: Path to the parent process.
- CMD: Command-line used to initiate the process, including any arguments, up to 128 characters.
- MD5: MD5 hash value of the process.
- SHA256: SHA256 hash value of the process.
- USER NAME: User who executed the process.
- SIGNATURE: Signing status of the parent process: Signature Unavailable, Signed, Invalid Signature, Unsigned, Revoked, Signature Fail.
- SIGNER: Entity that signed the certificate of the parent process.
- PID: Process ID of the parent process.
- Run search for process, Causality, and OS actors: The causality actor—also referred to as the causality group owner (CGO)—is the parent process in the execution chain that the Cortex XDR agent identified as being responsible for initiating the process tree. The OS actor is the parent process that creates an OS process on behalf of a different indicator. By default, this option is enabled to apply the same search criteria to initiating processes. To configure different attributes for the parent or initiate the process, clear this option.
-
(Optional) Limit the scope to an endpoint or endpoint attributes:
Specify one or more of the following attributes: Use a pipe (** **) to separate multiple values. Use an asterisk (*) to match any string of characters.
- HOST: HOST NAME, HOST IP address, HOST OS, HOST MAC ADDRESS, or INSTALLATION TYPE.
- INSTALLATION TYPE can be either Cortex XDR agent or Data Collector.
- PROCESS: NAME, PATH, CMD, MD5, SHA256, USER NAME, SIGNATURE, or PID.
-
Specify the time period for which you want to search for events.
Options are Last 24H (hours), Last 7D (days), Last 1M (month), or select a Custom time period.
-
Choose when to run the query.
Select the calendar icon to schedule a query to run on or before a specific date or Run to run the query immediately and view the results in the Query Center.
While the query is running, you can always navigate away from the page and a notification is sent when the query completes. You can also Cancel the query or run a new query, where you have the option to Run only new query (cancel previous) or Run both queries.
- When you are ready, view the results of the query. For more information, see Review XQL query results.
Create process query
From the Query Builder you can investigate connections between processes, child processes, and endpoints.
For example, you can create a process query to search for processes executed on a specific endpoint.
How to build a process query
- From Cortex XSIAM, select Investigation & Response → Search → Query Builder.
- Select PROCESS.
- Enter the search criteria for the process query.
- Process action: Select the type of process action you want to search: On process Execution or Injection into another process.
-
Process attributes—Define any additional process attributes for which you want to search.
Use a pipe (
|) to separate multiple values. Use an asterisk (*) to match any string of characters.By default, Cortex XSIAM will return results that match the attribute you specify. To exclude an attribute value, toggle the operator from
=to!=. Attributes are:- NAME: Name of the process. For example,
notepad.exe. - PATH: Path to the process. For example,
C:\windows\system32\notepad.exe. - CMD: Command-line used to initiate the process including any arguments, up to 128 characters.
- MD5: MD5 hash value of the process.
- SHA256: SHA256 hash value of the process.
- USER NAME: User who executed the process.
- SIGNATURE: Signing status of the process: Signature Unavailable, Signed, Invalid Signature, Unsigned, Revoked, Signature Fail.
- SIGNER: Signer of the process.
- PID: Process ID.
- PROCESS_FILE_INFO: Metadata of the process file, including file property details, file entropy, company name, encryption status, and version number.
- PROCESS_SCHEDULED_TASK_NAME: Name of the task scheduled by the process to run in the Task Scheduler.
- PROCESS_TOKEN_INFORMATION: Bitwise token of the process privileges.
- DEVICE TYPE: Type of device used to run the process: Unknown, Fixed, Removable Media, CD-ROM.
- DEVICE SERIAL NUMBER: Serial number of the device type used to run the process.
To specify an additional exception (match this value except), click the + to the right of the value and specify the exception value.
- NAME: Name of the process. For example,
-
(Optional) Limit the scope to a specific acting process:
Select +PROCESS and specify one or more of the following attributes for the acting (parent) process.
- NAME: Name of the parent process.
- PATH: Path to the parent process.
- CMD: Command-line used to initiate the parent process including any arguments, up to 128 characters.
- MD5: MD5 hash value of the parent process.
- SHA256: SHA256 hash value of the process.
- USER NAME: User who executed the process.
- SIGNATURE: Signing status of the parent process: Signed, Unsigned, N/A, Invalid Signature, Weak Hash
- SIGNER: Entity that signed the certificate of the parent process.
- PID: Process ID of the parent process.
- Run search on process, Causality and OS actors: The causality actor—also referred to as the causality group owner (CGO)—is the parent process in the execution chain that the Cortex XDR agent identified as being responsible for initiating the process tree. The OS actor is the parent process that creates an OS process on behalf of a different initiator. By default, this option is enabled to apply the same search criteria to initiating processes. To configure different attributes for the parent or initiate a process,
-
(Optional) Limit the scope to an endpoint or endpoint attributes:
Select +HOST and specify one or more of the following attributes:
-
HOST: HOST NAME, HOST IP address, HOST OS, HOST MAC ADDRESS, or INSTALLATION TYPE.
INSTALLATION TYPE can be Cortex XDR agent.
-
PROCESS: NAME, PATH, CMD, MD5, SHA256, USER NAME, SIGNATURE, or PID.
-
-
Specify the time period for which you want to search for events.
Options are Last 24H (hours), Last 7D (days), Last 1M (month), or select a Custom time period.
-
Choose when to run the query.
Select the calendar icon to schedule a query to run on or before a specific date or Run to run the query immediately and view the results in the Query Center.
While the query is running, you can always navigate away from the page and a notification is sent when the query completes. You can also Cancel the query or run a new query, where you have the option to Run only new query (cancel previous) or Run both queries.
- When you are ready, view the results of the query. For more information, see Review XQL query results.
Create registry query
From the Query Builder you can investigate connections between registry activity, processes, and endpoints.
Some examples of a registry query you can run include:
- Modified registry keys on specific endpoints.
- Registry keys related to process activity that exist on specific endpoints.
How to build a registry query
- From Cortex XSIAM, select Investigation & Response → Search → Query Builder.
- Select REGISTRY.
- Enter the search criteria for the registry events query.
- Registry action: Select the type or types of registry actions you want to search: Key Create, Key Delete, Key Rename, Value Set, or Value Delete.
-
Registry attributes: Define any additional registry attributes for which you want to search. By default, Cortex XSIAM will return the events that match the attribute you specify. To exclude an attribute value, toggle the
=option to=!. Attributes are:-
KEY NAME: Registry key name.
Ensure the KEY NAME is entered as a real registry key name, and not as a symbolic link. Otherwise, the query will not retrieve results.
Example 96.
Instead of
HKEY_LOCAL_MACHINE\System\CurrentControlSet, which is a symbolic link, useKEY_LOCAL_MACHINE\System\ControlSet001.Example 97.
Instead of
HKEY_CURRENT_USER, useHKEY_USERS<SID>, where SID is either a SID of the current user or an asterisk (*) to represent any SID. - DATA: Registry key data value.
- KEY PREVIOUS NAME: Name of the registry key before modification.
- VALUE NAME: Registry value name.
To specify an additional exception (match this value except), click the + to the right of the value and specify the exception value.
-
-
(Optional) To limit the scope to a specific source, click the + to the right of the value and specify the exception value.
Specify one or more attributes for the source.
Use a pipe (** ) to separate multiple values. Use an asterisk (***) to match any string of characters. - NAME: Name of the parent process.
- PATH: Path to the parent process.
- CMD: Command-line used to initiate the process including any arguments, up to 128 characters.
- MD5: MD5 hash value of the process.
- SHA256: SHA256 hash value of the process.
- USER NAME: User who executed the process.
- SIGNATURE: Signing status of the parent process: Signature Unavailable, Signed, Invalid Signature, Unsigned, Revoked, Signature Fail.
- SIGNER: Entity that signed the certificate of the parent process.
- PID: Process ID of the parent process.
- Run search for process, Causality, and OS actors: The causality actor—also referred to as the causality group owner (CGO)—is the parent process in the execution chain that the Cortex XDR agent identified as being responsible for initiating the process tree. The OS actor is the parent process that creates an OS process on behalf of a different indicator. By default, this option is enabled to apply the same search criteria to initiating processes. To configure different attributes for the parent or initiate the process, clear this option.
-
(Optional) Limit the scope to an endpoint or endpoint attributes:
Specify one or more of the following attributes: Use a pipe (** **) to separate multiple values. Use an asterisk (*) to match any string of characters.
- HOST: HOST NAME, HOST IP address, HOST OS, HOST MAC ADDRESS, or INSTALLATION TYPE.
- INSTALLATION TYPE can be either Cortex XDR agent or Data Collector.
- PROCESS: NAME, PATH, CMD, MD5, SHA256, USER NAME, SIGNATURE, or PID.
-
Specify the time period for which you want to search for events.
Options are Last 24H (hours), Last 7D (days), Last 1M (month), or select a Custom time period.
-
Choose when to run the query.
Select the calendar icon to schedule a query to run on or before a specific date or Run to run the query immediately and view the results in the Query Center.
While the query is running, you can always navigate away from the page and a notification is sent when the query completes. You can also Cancel the query or run a new query, where you have the option to Run only new query (cancel previous) or Run both queries.
- When you are ready, view the results of the query. For more information, see Review XQL query results.
Query across all entities
From the Query Builder you can perform a simple search for hosts and processes across all file events, network events, registry events, process events, event logs for Windows, and system authentication logs for Linux.
Some examples of queries you can run across all entities include:
- All activities on a host
- All activities initiated by a process on a host
How to build a query
- From Cortex XSIAM, select Investigation & Response → Search → Query Builder.
- Select ALL ACTIONS.
-
(Optional) Limit the scope to a specific acting process:
Select Add Process to your search, and specify one or more of the following attributes for the acting (parent) process. Use a pipe ( ) to separate multiple values. Use an asterisk (*) to match any string of characters. Field Description NAME Name of the parent process. PATH Path to the parent process. CMD Command line used to initiate the parent process including any arguments, up to 128 characters. MD5 MD5 hash value of the parent process. SHA256 SHA256 hash value of the process. USER NAME User who executed the process. SIGNATURE Signing status of the parent process: Signed, Unsigned, N/A, Invalid Signature, Weak Hash. SIGNER Entity that signed the certificate of the parent process. PID Process ID of the parent process. Run search on process, Causality and OS actors The causality actor, also referred to as the causality group owner (CGO), is the parent process in the execution chain that the agent identified as being responsible for initiating the process tree. The OS actor is the parent process that creates an OS process on behalf of a different initiator. By default, this option is enabled to apply the same search criteria to initiating processes. To configure different attributes for the parent or initiating process, clear this option. -
(Optional) Limit the scope to an endpoint or endpoint attributes:
Select Add Host to your search and specify one or more of the following attributes:
- HOST: HOST NAME, HOST IP address, HOST OS, HOST ADDRESS, or INSTALLATION TYPE.
- INSTALLATION TYPE can be either an agent, or data collector.
-
PROCESS: NAME , PATH , CMD , MD5 , SHA256 , USER NAME , SIGNATURE, or PID.
Use a pipe ( ) to separate multiple values. Use an asterisk (*) to match any string of characters.
-
Specify the time period for which you want to search for events.
Options are Last 24H (hours), Last7D (days), Last1M (month), or select a Custom time period.
-
Choose when to run the query.
Select the calendar icon to schedule a query to run on or before a specific date or Run the query immediately and view the results in the Query Center.
While the query is running, you can always navigate away from the page and a notification is sent when the query completes. You can also Cancel the query or run a new query, where you have the option to Run only new query (cancel previous) or Run both queries.
- When ready, view the results in a query.
Research a known threat
This topic describes the steps you can take to investigate a lead. A lead can be:
- An issue from a non-Palo Alto Networks system with information relevant to endpoints or firewalls.
- Users or hosts that have been reported as acting abnormally.
- Information from online articles or other external threat intelligence that provides well-defined characteristics of the threat.
To research a known threat
-
Use threat intelligence to build a Cortex Query Language (XQL) query using the Query Builder.
For example, if external threat intelligence indicates a confirmed threat involving specific files or behaviors, search for those characteristics.
- Review and refine the query results by using filters and running follow-up queries to find the information you are looking for.
-
Select an event of interest, and open the Causality view.
Review the chain of execution and data, navigate through the processes on the tree, and analyze the information.
- Open the Timeline to view the sequence of events over time. If deemed malicious, take action using one or more of the response actions.
-
Inspect the information again, and identify any characteristics you can use to create a BIOC or correlation rule.
If you can create a BIOC or correlation rule, test and tune it as needed. For more information, see Create a correlation rule and Create a BIOC rule.
Agentic Assistant chat
The Agentic Assistant chat provides an interactive and intelligent way to simplify and streamline complex security operations. Enter a prompt using natural language, and your agent plans and executes the most relevant actions to fulfill your request.
Get started with Agentic Assistant chat
The chat leverages your personal context (such as your name, email, and roles), the agent’s description, available actions, and conversation context to enable highly informed and personalized interactions. You can manage multiple chats simultaneously and easily switch between the agents you have access to. Before acting, the agent generates a plan, verifying each step while executing the sequence of actions that fulfill your request.
Note
The Cortex Agentic Assistant is currently available in limited regions. For more information, see Agentic AI in Cortex XSIAM. If your tenant is not within one of those regions, you have access to the Cortex Assistant.
To enable the Cortex Agentic Assistant, go to Settings → Configurations → General → Server Settings → AI Configuration.
To access the chat, you must have the correct permissions. For more information, see Agentic Assistant role-based access control.
To open the chat window, click the Agentic Assistant icon in the upper right hand corner, or from the XSIAM Command Center dashboard click Cortex Agentic Assistant and click Start Investigation.
To close the chat window, click anywhere outside the chat window's boundaries or click the Agentic Assistant icon in the upper right hand corner.
Access the chat from Slack
Before you can interact with the Cortex Agentic Assistant in Slack, the Slack v3 integration must be set up correctly. For more information, see the Slack v3 integration documentation.
Once the setup is done, you can initiate a chat or interact with the Cortex Agentic Assistant from Slack by tagging your configured bot name in a thread (for example @Your bot name).
Choose an Agentic Assistant agent
To use the Agentic Assistant, you first select the agent best suited for the task. Each agent is designed with specific goals and toolsets to address different aspects of security operations.
You can choose from system agents, public agents other users have created, or agents you have personally built and configured.
Select an agent
- Within the chat prompt, click the agent icon on the left.
- You can hover over each agent in the list to view a brief description of its primary focus.
- Select the agent that best suits your current task or investigation.
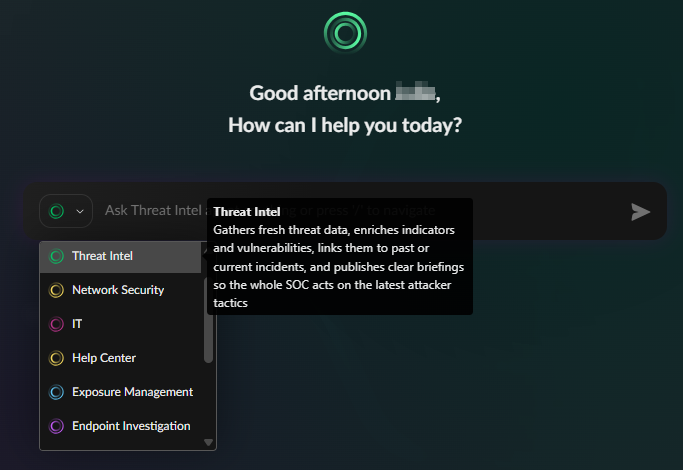
Select an agent from Slack
Select an agent from Slack by sending a request and tagging your configured bot name in a thread (for example @Your bot name). Cortex Agentic Assistant returns a dropdown menu of available agents to select.
Note
Only public agents are supported via Slack.
System agents
System agents are pre-built, mission-focused virtual personas provided out-of-the-box by Cortex XSIAM to handle specific security use cases without requiring manual configuration.
System agents come with defined roles and permissions, for example, the Threat Intel agent is pre-configured to enrich indicators, while the Help Center agent is designed specifically to retrieve documentation.
You can access additional system agents by enabling specific modules or licenses. Ensuring you have the relevant licenses active (for example, Cloud Posture or XSIAM Enterprise) will ensure the corresponding agents appear in your list. For instance, the Exposure Management agent helps prioritize risks but explicitly requires the Exposure Management add-on to function.
If a system agent is missing from your chat, it may be disabled or not included in your license. Go to the Agentic Assistant Hub, where you can view a list of all enabled and disabled agents (accessible via the side panel in the Agentic Assistant menu). An administrator may need to re-enable it to make it visible in your chat again.
Examples of specialized system agents:
| Agent Type | Description |
|---|---|
| IT | Automates identity lifecycle enforcement, real-time containment on endpoints and networks, vulnerability and patch governance, asset intelligence upkeep, and end-to-end incident workflow coordination—delivering policy-driven remediation across the enterprise. |
| Case Investigation | Accelerate and simplify the analyst's workflow by converting complex data points, case context, and event relationships into clear, actionable insights. It understands the whole structure of a case, automatically highlights what matters most, and offers concise summaries that reduce noise and cognitive load. Beyond interpretation, it provides quick-access actions and guided steps that help analysts progress investigations with confidence and consistency. Its strength comes from its ability to reason across diverse evidence, stitch narrative context, and translate technical signals into meaningful next moves - enabling a smoother, more intuitive investigation experience end to end. |
| Email Investigation | Automates the full lifecycle of email-borne threat response, spanning mailbox search, forensic collection, analysis, containment, and incident closure across all major mail platforms and security layers. |
| Threat Intel | Gathers fresh threat data, enriches indicators and vulnerabilities, links them to past or current incidents, and publishes clear briefings so the whole SOC acts on the latest attacker tactics. |
| Help Center | <p>An AI-powered assistant that helps you troubleshoot issues across the entire Cortex product suite through natural language conversation. Using official documentation, the agent diagnoses your tenant's security, health, and workflows to deliver data-backed guidance and automatically prefill support tickets. Access the Help Center Agent from Help → Get Support, or by clicking the Agentic Assistant icon in the top-right corner of the tenant and choosing the Help Center agent.</p> |
| Network Security | Audits next-gen firewalls for vulnerabilities, expired certificates, outdated software, risky or unused rules, capacity limits, and other misconfigurations. It searches logs for threats and then automates or guides clean-ups and upgrades to keep the network secure. |
| Exposure Management | <p>Helps understand, triage, and remediate vulnerabilities and misconfigurations across enterprise and cloud. Streamlines work for security analysts by helping to proactively prioritize risks, enrich identified exposures with ownership information, and take actions to reduce remediation times.</p><div data-gb-custom-block data-tag="hint" data-style="info" class="hint hint-info"><p>Note</p><p>Requires the Exposure Management add-on.</p></div> |
| Cloud Posture | Helps understand, triage, and remediate misconfigurations, attack paths, and posture issues across cloud environments. Streamlines work for security analysts by proactively prioritizing risks, enriching identified exposures with ownership information, and automatically taking mitigating or remediating actions, such as blocking network access or updating protection policies, to reduce the organization's exposure footprint. |
| Application Security | Operates as an intelligent, autonomous co-pilot within the security program. It provides full-cycle management by continuously monitoring AppSec maturity and driving a prevention-first strategy. The agent performs key actions such as opening pull requests (PRs) to resolve issues, identifying true risks and critical weaknesses in code, and using that context to suggest and apply prevention guardrails that eliminate risky environments. Its core function is to guide the organization’s AppSec journey by proactively improving coverage and measuring maturity, ensuring that security is automated, not merely audited. |
| Endpoint Investigation | Unifies host-level containment, forensic collection, and remediation across all major EDR/XDR platforms while feeding evidence and status into the SOC's ticketing and collaboration stack. |
Recommended agents
In some cases, the system may suggest you switch agents based on the page you are viewing. For example, if you are viewing a case and have a chat with the Threat Intel agent open, the system will suggest switching to the Case Investigation agent for more relevant results.
Chat with an Agentic Assistant agent
After choosing an agent, type a request using natural language. Be as clear and specific as possible. Submit your request by pressing Enter or clicking the submit arrow. Some agents provide relevant chat conversation starters under the chat prompt.
During a conversation, when an agent is formulating a plan or executing steps, clicking the agent will show which actions it is using. You can scroll between the actions or close the panel.
Prompt examples
Using chat prompt conversation starters in the Agentic Assistant simplifies and speeds up your interactions by providing pre-defined, common queries that guide you to relevant actions and information.
For example, a SOC analyst may see the following conversation starters under the chat prompt:
- What are the top issues I should prioritize today?
- Show me all issues with an overdue SLA
- Which automations are waiting for my input?
- Clean up all expired indicators.
- Create a visual representation of the top 10 targeted assets over the last 7 days.
Best practices for prompting
-
Be clear and specific
Clearly state your objective and provide the necessary context. Instead of "Fix the issue," try "Investigate issue 1234 and isolate any affected hosts on which malware has been identified." Specify exact values, IDs, and relevant details.
-
Break down complex tasks
For multi-step processes, break your request into smaller steps within a prompt. This allows the agent to focus, validate each step, and helps guide the flow.
-
Include key information
If not available from the current case context, always include relevant incident IDs, indicator values (such as IP addresses and file hashes), or entity names directly in your prompt. The more precise the initial information, the better the agent can leverage its actions and context.
-
Specify a desired output or action:
If you need a particular type of output (for example, "Summarize the findings," "List all affected assets") or a specific action (for example, "Isolate host X," "Block IP Y on firewall"), explicitly state it.
Considerations for Slack interactions with Agentic Assistant agents
When interacting with the Cortex Agentic Assistant directly within Slack, keep the following in mind to maintain session integrity and secure access:
-
Chat context
When an agent is tagged, the system automatically pulls in the last five messages in the thread (or up to the last bot interaction) so the agent understands the conversation's history.
-
Single player model
The first user to tag the bot becomes the initiator, and only this user can issue commands. If another user tries to send a prompt, they receive an Access Denied message.
-
The reset command
To hand off a session to another user or start fresh, any user in the Slack thread can type
@Cortex Assistant reset. This ends the session and allows a new initiator to take over. -
Approving sensitive actions (hard locks)
Sensitive actions require approval. In Slack, this triggers a hard lock where the agent refuses text input and displays Approve (green) and Deny (red) buttons, and only the initiator can click these buttons. If the initiator does not respond within two weeks, the request is automatically denied and the chat will close.
-
Providing feedback
After a final result or remediation is executed, you can provide feedback directly in Slack using thumbs up or thumbs down.
-
Additional considerations
- Small tables (less than 5 rows) are rendered as Markdown, while larger tables will be summarized with a link to view the full results. Code and logs will use standard Slack code blocks.
- Chat artifacts are not visible via Slack.
Case context and chat continuity
When you chat with an agent while you have a case open, the agent automatically receives the case context. This allows for immediate, context-aware analysis without requiring you to manually provide case details. The agent can visualize the entire scope of the investigation, interpreting complex relationships between entities and identifying patterns across the case data.
-
When you begin a chat while viewing a case, the agent automatically receives the relevant case context.
Note
Case data is only loaded when you send your first message. Opening the chat interface without sending a prompt does not provide the agent with the case context.
- If you have not yet sent a message while viewing a case, and you switch cases:
- If you return to a case with a previous chat history, the chat and the associated context automatically load.
- If no chat history exists for the case, the agent automatically opens a new chat.
- If you are in the middle of a chat and switch to a different case, the Agentic Assistant asks if you want to start a new chat for the case you are viewing. If you begin a new chat and send a prompt, the case context for the new case is provided to the agent.
| User action | Context status |
|---|---|
| Open chat, no message sent | No context loaded. |
| Send first message | Context for the current case is loaded. |
| Switch cases (no active chat) | No context is transferred. Agent remains 'blank.' |
| Switch cases (active chat) | Agentic Assistant suggests you start a new chat to switch the context to the new case or automatically resumes an existing chat. |
| Switch to a case with chat history | Previous chat and context are automatically resumed. |
Chat navigation and system behavior
- Navigate long responses: If an agent's response is long, you can jump directly to the last line of the response by clicking the anchor icon.
- Start over: Sometimes an investigation takes a new direction, or you want to pivot to a different task. You can always open a new conversation or start a new investigation path with a new agent whenever needed.
- Processing time: While an agent is processing a prompt, you can begin typing a new prompt. However, you can only submit this new prompt once the previous one has completed its processing. For complex actions, the system may indicate that it's taking some time. Actions exceeding five minutes result in an error.
Review the plan and execution
Cortex Agentic Assistant operates with transparency. The agent's proposed plan or steps for any action are always visible.
Click Plan and expand the chevron to review the detailed breakdown of what the agent intends to do.
JSON artifacts are created when agents create objects or retrieve information. JSON artifacts are available directly in the agent’s plan view to provide technical context for results.
Note
An agent's proposed plans and results may contain inaccuracies or errors. Always review the results carefully to ensure you fully understand the proposed action before proceeding.
Safeguards for chat security and control
Cortex Agentic Assistant implements the following safeguards to ensure agent plans and executions are secure, approved, and maintains your control over critical system changes.
- Agents are designed to intelligently validate their proposed plans, ensuring that all necessary permissions are in place before any action is taken.
- Cortex Agentic Assistant clarifies ambiguous prompt intentions and blocks requests that may be exploitative or harmful, for example, to perform a malicious operation.
- For any sensitive actions, agents will always require your explicit approval.
- Your conversations within the Agentic Assistant chat are private. However, for transparency and auditing purposes, Cortex XSIAM audit logs record all actions performed by the agents in response to your prompts. This ensures transparency by providing a detailed, traceable record of who initiated an action, what action was taken, and when, without logging the private content of your prompts themselves.
Tip
You can quickly jump to different product pages within Cortex XSIAM by typing / in the prompt area. This shortcut is a built-in navigation feature that is available even if the Cortex Agentic Assistant is disabled.
Chat with the Agentic Assistant from Slack
Slack chats with the Agentic Assistant bridge the gap between where your team collaborates and where security operations happen by enabling you to interact with agents directly within you daily communication workflow without needing to log in to Cortex XSIAM.
Access the chat from Slack
Prerequisite
- Before you can interact with the Cortex Agentic Assistant in Slack, the Slack v3 integration must be set up correctly. For more information, see the Slack v3 integration documentation.
- To perform actions in Slack, your Slack email must match your Cortex XSIAM user email. This ensures the system can strictly follow your assigned permissions (RBAC). If you do not have the required permissions to interact with agents, the system will block the action.
Once the setup is done, you can initiate a chat or interact with the Cortex Agentic Assistant from Slack by tagging your configured bot name in a thread (for example @Your bot name). Cortex Agentic Assistant returns a dropdown menu of available agents to select.
Note
Only public agents are supported via Slack.
Considerations for Slack interactions with Agentic Assistant agents
When interacting with the Cortex Agentic Assistant directly within Slack, keep the following in mind to maintain session integrity and secure access:
-
Chat context
When an agent is tagged, the system automatically pulls in the last five messages in the thread (or up to the last bot interaction) so the agent understands the conversation's history.
-
Single player model
The first user to tag the bot becomes the initiator, and only this user can issue commands. If another user tries to send a prompt, they receive an Access Denied message.
-
The reset command
To hand off a session to another user or start fresh, any user in the Slack thread can type
@Your bot name reset. This ends the session and allows a new initiator to take over. -
Approving sensitive actions (hard locks)
Sensitive actions require approval. In Slack, this triggers a hard lock where the agent refuses text input and displays Approve (green) and Deny (red) buttons, and only the initiator can click these buttons. If the initiator does not respond within two weeks, the request is automatically denied and the chat will close.
-
Providing feedback
After a final result or remediation is executed, you can provide feedback directly in Slack using thumbs up or thumbs down.
- Additional considerations
- Small tables (less than 5 rows) are rendered as Markdown, while larger tables will be summarized with a link to view the full results. Code and logs will use standard Slack code blocks.
- Chat artifacts are not visible via Slack.
-
Chat timeout
Slack sessions follow a timeout policy of two weeks of inactivity (matching the UI data retention policy), after which the session automatically closes.
Slack interaction with the Agentic Assistant example
The following is an example scenario describing how you can monitor shift priorities, track SLAs, and review pending automations in Cortex XSIAM directly from Slack.
-
Initiation
Check the daily queue by opening your team's Slack channel and tagging
@Your bot namewith the prompt, "What are the top issues I should prioritize today and show me all issues with an overdue SLA?". -
Agent selection
The bot responds with a dropdown menu of available public agents, and you select the appropriate agent to handle the request.
-
Status update
The agent processes the request and replies in the thread, providing a summarized list of the highest-priority issues and any automations currently waiting for user input.
Note
If a team member in the channel sees the summary and attempts to ask the agent, "Give me more details on the first SLA issue," the team member receives an access denied message because the active session is only available to you, the initiator.
-
Handoff
The session can remain open for up to two weeks, after which it automatically closes. To end a session, type
@Your bot name resetso the rest of the team can engage.Another team member can then tag
@Your bot nameto initiate a new session. Because the system pulls the last five messages in the thread, the agent understands the history of the conversation. The team member can simply prompt, "Assign the first overdue issue from that summary to me," and the agent will know which issue is being referenced.
Create and run XQL queries with Agentic Assistant chat
You can use natural language prompts to generate and run XQL queries through the Cortex Agentic Assistant chat. This allows you to access and analyze datasets without requiring prior knowledge of XQL syntax.
This capability is provided through two actions. The first is a built-in TextToXQL action available for all agents, that takes natural language prompts and translates them into XQL queries. The second is the Cortex - Run XQL Query action, which is included with all system agents and can be added to custom agents. If a custom agent does not have the Cortex - Run XQL Query action, it cannot execute XQL queries.
| Action | Description |
|---|---|
| TextToXQL | <p>Translates your natural language request into a valid XQL query. This action is built-in to all agents. It does not display in the list of actions for an agent and it cannot be removed.</p><div data-gb-custom-block data-tag="hint" data-style="info" class="hint hint-info"><p>Note</p><p>The TextToXQL action is a hidden system action and does not appear in the Agentic Assistant Hub.</p></div> |
| Cortex - Run XQL Query | Executes an XQL query and returns the data. |
Data access and permissions
The TextToXQL action is designed for system datasets. It cannot create XQL queries for custom datasets. You can manually write a query for custom datasets and ask the agent to run the query.
The TextToXQL action can generate XQL queries for datasets that you do not have permission to access, but the Cortex - Run XQL Query action can only execute if you have the necessary permissions for the dataset.
Best practices for prompting
We recommend using clear specific language to request that the agent create and execute XQL queries. Use terminology such as:
- Create an XQL query to...
- Build an XQL query for...
- Generate an XQL query that...
You can have the agent automatically run the query or you can manually run it yourself.
Results
When a query runs, the agent provides a preview of the results and you can also see the full dataset by pivoting directly to the XQL page.
Note
Running XQL queries manually through an agent does not consume compute units. This includes scenarios where you prompt the agent to create and execute a multi-step plan.
Use natural language to query and visualize your data
Use natural language prompts to request visual insights by instructing the Agentic Assistant to display its findings as charts or graphs. This makes it easy to visualize data for threat hunting, business intelligence, or investigations without writing XQL queries or manually creating data visualizations.
When you request a visualization, the agent generates an XQL query, executes it, and then presents the results in a graph. Agentic Assistant supports all graph types supported by the Cortex Platform.
This feature is provided as a built-in system hidden action and does not appear in the Agentic Assistant Hub. It is an enhancement of the built-in TextToXQL and Cortex - Run XQL Query actions. For more information, see Create and run XQL queries with Agentic Assistant chat.
Best practices for prompting
We recommend using clear, specific language to request that the agent create these visualizations. Use terminology such as:
- Create a pie chart showing the distribution of alert severities over the last 7 days.
- Visualize the top 10 targeted assets by malware in a bar chart.
- Generate a line chart tracking the number of failed login attempts per day for the past month.
Visualization capabilities
To help you get the most out of your generated graphs and charts, the Agentic Assistant supports the following capabilities:
- Visualization creation or editing: You can use natural language to instruct the agent to build a new query from scratch or to modify an existing one.
- Data filtering: You can ask the agent to alter the visual representation of your data. The system supports filtering without risking any changes to or breaking the existing underlying XQL query.
-
Dashboard integration: Once the graph or chart is created, you can click
to save it to the Widget Library and then apply it to your dashboard from the Widget Library.Note
Once the graph or chart is saved to the Widget Library, the link to the chat artifact is severed, and the agent does not track subsequent changes made to the widget or the dashboard.
Manage chat history
Cortex Agentic Assistant helps you keep track of your investigations by organizing your chat history for easy review and continuity.
Your chat history is listed to the left of the prompt. The chat history is organized by periods: Chats from today, yesterday, the last seven days, and older. To continue a previous investigation or review a past conversation, scroll through the list and click on the chat you wish to resume.
By default, the first prompt you enter in a new chat becomes its title in the history. To edit the chat title or delete a chat that is no longer relevant, click and select Edit or Delete.
NOTE
Chats and related artifacts are retained for six months (186 days). You can extend the retention period by purchasing a retention add-on.
Slack sessions
Slack sessions follow a timeout policy of two weeks of inactivity (matching the UI data retention policy), after which the session automatically closes.
Asset management
A comprehensive overview and management interface for all assets in your environment, ensuring complete visibility, control, and protection.
Asset inventory overview
The Asset Inventory acts as a centralized repository and a single source of truth for all asset-related information. Designed to provide end-to-end asset visibility across the entire enterprise, the inventory covers code, cloud, and runtime in cloud, hybrid, and on-premise environments. Cortex collects, normalizes, and aggregates data from multiple sensors to create a single, holistic profile for each asset.
Asset classification
Assets are organized into a strict system to facilitate filtering and management:
- Class: The highest-level grouping based on general purpose or domain, such as Compute, Network, or Data
- Category: A more detailed grouping within a class based on normalized function, such as Virtual Machine, Container, or Storage Bucket
- Type: The most specific level of classification, representing the provider-specific name for a particular asset, such as an AWS EC2 Instance or GCP Compute Engine Instance
Asset profiles
When Cortex XSIAM discovers an asset, it builds a comprehensive profile by stitching together data from multiple sources. This profile consists of:
- Core attributes: Essential identifiers like the unique ID, name, and provider
- Main attributes: Normalized characteristics and configuration details
- Other attributes: Extended fields that provide additional normalized properties
- Enrichments: Derived contexts, such as associated security findings or an exposed to the internet status
- Raw data: The original, unstructured JSON data collected directly from the source
Key inventory features
The inventory provides several advanced tools for exploring and managing your enterprise:
- Interactive filter widgets: The top of the page features interactive widget cards like Provider, Class, and Category that summarize your environment. You can change the attribute displayed for each widget card to customize your view, and you can shrink the widget lane to maximize screen space for the inventory table
- Saved views and quick filters: Use pre-defined saved views like Cloud and Enterprise to quickly subset the data, or utilize quick filters to easily isolate assets with Critical Cases or Issues
- Dashboard integration: Click the Dashboard button at the top of the page to navigate to a dedicated system dashboard for deeper analysis
- Query via XQL: The entire asset inventory is available to be queried via XQL using the
asset_inventorydataset. For advanced identity use cases, such as Cloud Infrastructure Entitlements Management permissions analysis, you should use theciem_permissions_with_last_access dataset. - Graph-based asset exploration: When enabled, the inventory supports graph queries via Cypher to explore complex relationships between assets, such as asset-to-asset network paths, identity-to-resource permissions, and network exposure paths.
- Direct case and issue correlation: Assets are directly linked to active security investigations, allowing analysts to immediately understand how an asset relates to active threats and view breakdowns of critical cases and issues directly on the asset profile.
- Asset groups and tagging: Group assets based on shared attributes to address them collectively, or manually add tags and annotations to build out asset profiles.
Asset lifecycle and cleanup
To maintain an accurate and clutter-free inventory, an automated cleanup process periodically removes outdated assets in the background. If an asset stops reporting, it follows a specific vanish cadence. It goes from Active from 0 to 3 days, Not Seen from 3 to 5 days, Lost from 5 to 7 days, and after 7 days, the asset is no longer shown in the inventory table.
All assets
The All Assets page provides a centralized repository containing information about all assets within your environment, including enterprise, multi-cloud, code, and external surfaces. Dedicated asset modules allow multi-method asset coverage, such as agent, agentless, logs, from various sources. Having full visibility of assets allows for timely incident response, effective threat hunting, and attack surface reduction.
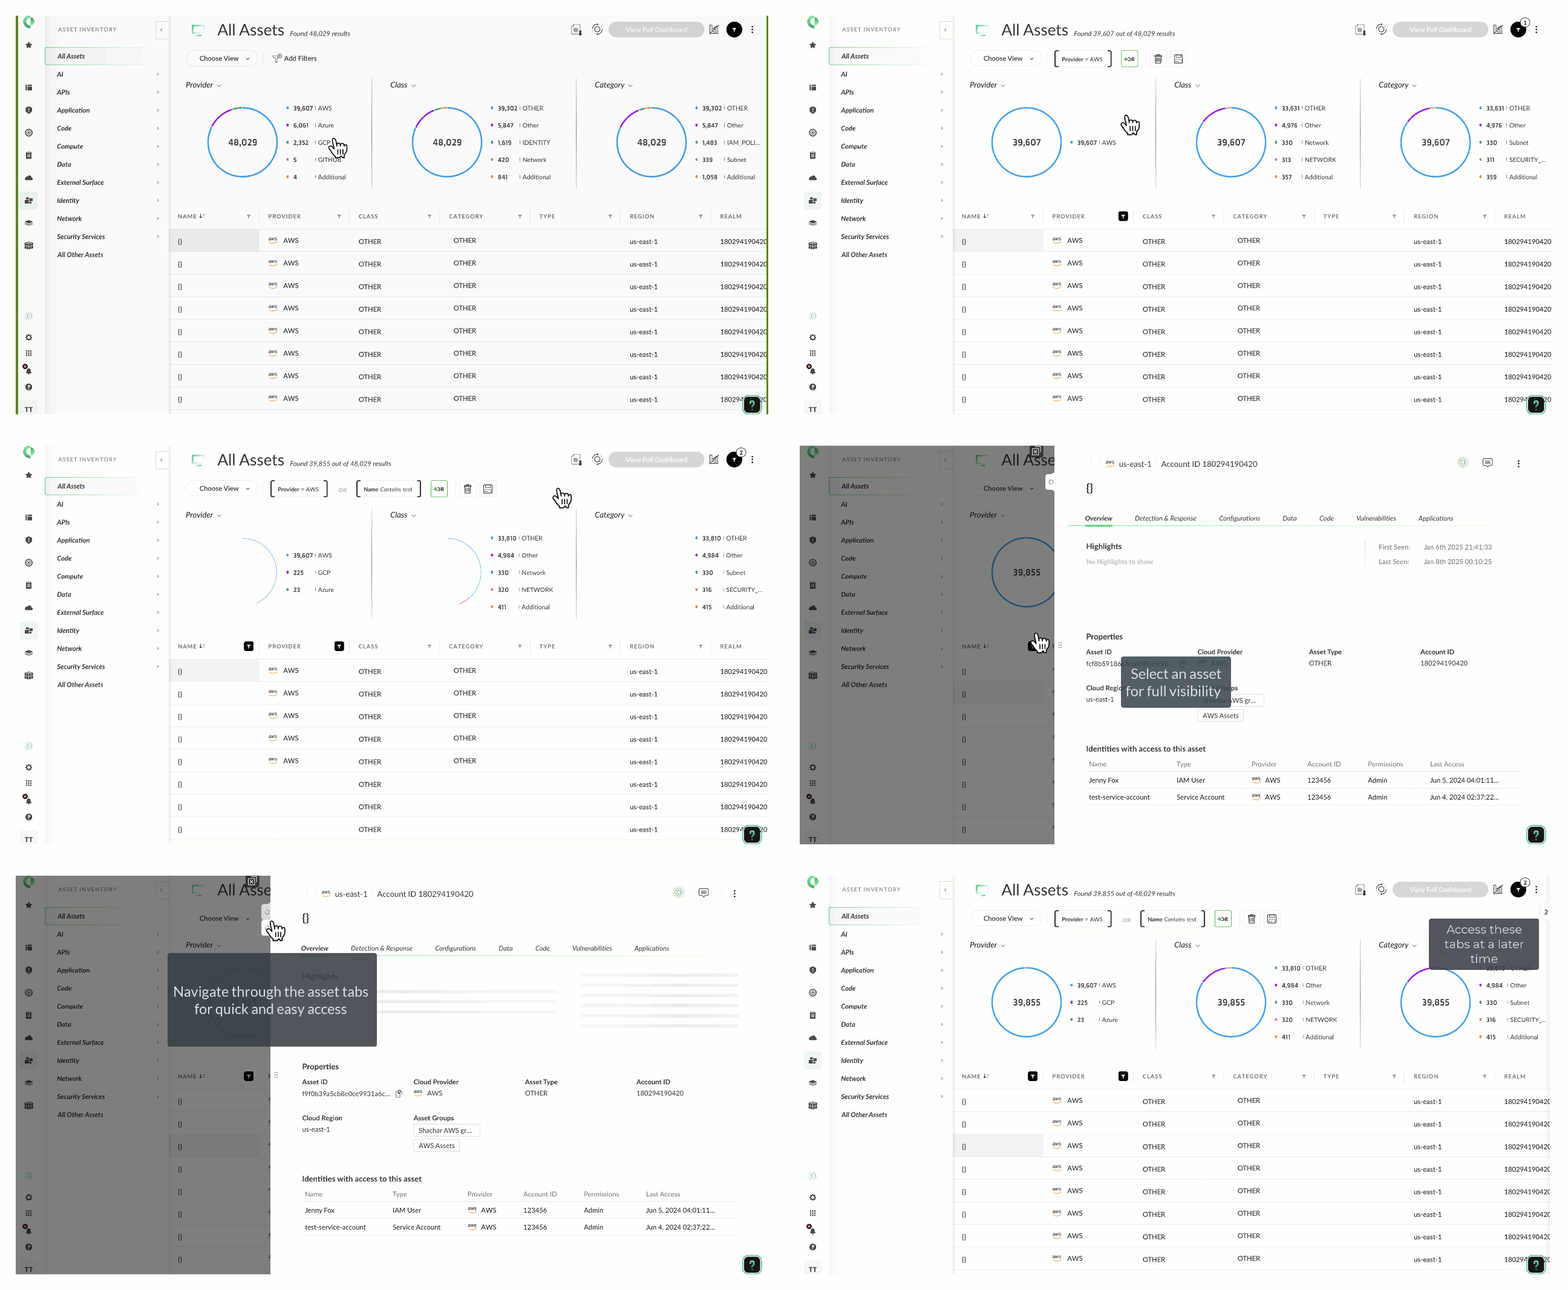
Inventory table
When navigating to the All Assets page, the primary inventory table provides a high-level view of your entire landscape. The table displays general identifying information for each asset.
The table provides immediate security context by displaying a breakdown of the cases and issues attached to each asset, highlighting the number of high or critical risks in brackets.
Asset card
Clicking an asset name in the table opens a unified asset card that consolidates its attributes and related risks. From this card, analysts can investigate all relevant normalized data and raw provider JSON connected to the asset, leave comments for other analysts, and use the Cortex Agentic Assistant to get AI-driven insights and recommendations.
Asset classes
To help you easily filter your inventory, assets are separated by their respective classes into dedicated sections under the All Assets menu. Note that the specific asset classes and types shown depend on your system licensing.
Note
To maintain an accurate and clutter-free asset inventory, an automated background cleanup process periodically removes outdated assets.
All cloud assets
The All Cloud Assets page provides a centralized, normalized view of your infrastructure across multi-cloud environments. It helps you assess your cloud footprint and serves as the foundation for Cloud Security Posture Management (CSPM).
Navigate to Inventory > Assets > All Cloud Assets to view an aggregated summary of your cloud footprint.
The dashboard features interactive widgets summarizing the total number of cloud assets, a breakdown by service such as Amazon EC2, AWS IAM, and AWS Backup, and a breakdown by provider such as AWS, Azure, and GCP.
The primary inventory table groups your cloud data by provider. For each provider, it displays high-level aggregates:
- Total assets and issues
- Number of cloud accounts and services
- Number of distinct asset categories, types, and classes
Cloud assets explorer
Clicking into a specific provider opens the Cloud Assets Explorer. This detailed table lists every individual cloud resource, including S3 Buckets, EC2 Instances, IAM Roles, API Gateways, and CloudFormation Stacks.
Cloud asset details
Clicking an individual cloud asset in the explorer opens a detailed side card with tabs for Overview, Configurations, and Compliance. The Configurations tab displays the raw Asset Configuration JSON as ingested from the cloud provider, along with any active Cloud Configuration Issues detected on the asset. The Compliance tab shows an Overall Compliance Score and a breakdown of Controls by Status.
Discovery Engine
The Discovery Engine is an essential component of Cortex XSIAM's security posture management. The Discovery Engine scans your onboarded cloud accounts and discovers your assets, services and resources. The discovered assets are added to the Unified Asset Inventory. Once these assets are identified, they can be scanned for misconfigurations and vulnerabilities, ensuring the security of your cloud environments. The cloud service provider (CSP) permissions that are required for the Discovery Engine are available here.
The Discovery Engine performs three main functionalities:
- Full discovery scans: The Discovery Engine calls all of the APIs in the discovery catalog (depending on the scope defined in the onboarding wizard) to scan every visible asset, service, and resource in the onboarded CSP. This full scan is performed every 12 hours.
- Event Assisted Ingestion (EAI): Using the collection of audit logs (whether enabled as part of the onboarding process or collected separately using a data collector), Cortex XSIAM analyzes the audit logs and identifies specific events or changes to certain asset types. If a change is identified, it triggers the Discovery Engine to scan that specific resource. This enables near-real-time discovery for specific assets, including VMs and data assets across AWS and GCP.
- On-demand scans: You can initiate a discovery scan for a specific CSP account or cloud instance using the Discover Now option. This option is available by right-clicking the account and selecting Discover Now . For a cloud instance, click the More options icon and select Discovery Now. Note that you can initiate an on-demand scan as long as there is no scan currently in progress. If a scan is already in progress, wait until it completes before initiating a new scan. A discovery scan can vary in duration based on the number of resources being scanned.
How does the Discovery Engine work?
The Discovery Engine is an API collection engine that gathers information about your cloud environment. The engine executes resource ingestion templates (RIT) that define which CSP APIs and actions to call in order to collect, stitch, and normalize data. This process ensures the information is consistent. Once normalized, relevant assets are added or updated in the unified asset inventory. The specific APIs it calls are detailed in the discovery catalog, organized according to RITs. The processed data collected by the RITs is used to maintain an up-to-date inventory of all your cloud assets in the unified asset inventory.
Technical details
- API limits: The Discovery Engine has no limit to the number of CSP APIs it calls; the goal is to provide a current and comprehensive view of your entire cloud environment. The number of API calls made by the Discovery Engine depends on the number of resources in your cloud environment, the frequency of changes to EAI-supported assets, and how often you run on-demand scans.
- Retry mechanism: The Discovery Engine implements an exponential backoff mechanism with up to three retries, with a maximum of 1.5 minutes for retry attempts.
- Infrastructure: The Discovery Engine always performs its functionality from the Cortex XSIAM tenant, regardless of whether you selected Cloud Scan or Scan with Outpost in the onboarding wizard.
Discovery catalog
The discovery catalog lists all of the resource ingestion templates (RIT). Each RIT has the following details:
- RIT NAME: The name of the template
- PROVIDER: The cloud service provider associated with this RIT
- SERVICE: The specific API service invoked by the Discovery Engine as part of this RIT
- ACTION: The action performed by the API service
- SCOPE: Whether the action is performed on a regional scope or a global scope
- ASSET TYPE: The asset type created from resources identified by this RIT. If there is no asset type listed, this RIT does not create an asset. It is an intermediary RIT used to support execution of other RITs.
Asset hierarchy
The asset inventory displays the full cloud hierarchy path for assets across Amazon Web Services, Google Cloud Platform, Microsoft Azure, and Oracle Cloud Infrastructure, allowing you to use Hierarchy Path to filter, sort, search, or build asset groups and enforce Scope-Based Access Control (SBAC).
NOTE
Asset hierarchy data is only available if you onboard your cloud environment using organization-wide or root-level onboarding; it does not apply to environments configured with single-account or individual onboarding.
If you choose to exclude specific organizational units during onboarding, asset hierarchy paths may be incomplete in the asset inventory.
The asset inventory integrates cloud provider hierarchies, ranging from root organizations to specific folders and projects, to provide structural context regarding where a resource resides.
Asset detail enhancements
When an asset is discovered, its profile includes three structural attributes to define its location in the cloud hierarchy:
- Realm (Account/Project)
- Organization
- Full Path: Captures all intermediate levels, such as folders and sub-folders, specific to the provider's logic.
These details update when a resource is moved within the cloud provider and display within the asset table.
Query and Filtering Capabilities
You can navigate the cloud structure using the Hierarchy Path filter in the asset inventory to search for resources under any path in the hierarchy.
- The filter operator logic supports autocomplete and multi-select functionality, displaying the hierarchy in ascending order.
- The filter value displays both the path and the unique ID. For example, GCP Org / Department X (13243141). The ID is for the last item in the path.
You can search by the name or ID of the objects within the autocomplete. For example, you can search by the cloud ID of the organization.
Asset Groups and Scope-Based Access Control (SBAC)
You can integrate the hierarchy filtering into Asset Groups to allow for automated grouping by business unit or environment.
This hierarchy data is exposed to Scope-Based Access Control (SBAC) to define permissions based on organizational branches. This allows administrators to configure access so that a user scoped only to Folder A cannot see assets residing in Folder B, despite being in the same cloud account. If you give access to a parent folder, the user also has access to all child folders.
\
API Support
Users can retrieve the full path in the GET Assets API, query assets by their hierarchy path using the Assets API, and create asset groups by their hierarchy path using the Asset Groups API.
\
Azure resource group visibility
You can filter, search, and audit your multi-cloud inventory by Azure resource group fields captured within the asset inventory. This resource metadata allows you to track cloud assets by their precise deployment boundaries, build custom asset groups, and enforce Scope-Based Access Control (SBAC).
Asset classes
The asset inventory organizes your organization's resources into a hierarchy:
- Class: The highest-level grouping based on general purpose or domain, such as compute, network, or data.
- Category: A detailed grouping within a class based on normalized function, such as virtual machine, container, or bucket).
- Type: The most specific, provider-level implementation, such as AWS EC2 instance or GCP Compute Engine instance.
The following asset classes are available in the inventory:
| Asset class | Description | License |
|---|---|---|
| AI | Provides a detailed view of AI-related assets, their attributes, and associated risks. | <div data-gb-custom-block data-tag="hint" data-style="info" class="hint hint-info"><p>Notice</p><p>This feature is included with a Cortex XSIAM Premium license or the Cloud Posture Security or Cloud Runtime Security add-on.</p></div> |
| API | Provides a comprehensive view of Application Programming Interfaces (APIs) across your cloud platforms. | <div data-gb-custom-block data-tag="hint" data-style="info" class="hint hint-info"><p>Notice</p><p>This feature is included with a Cortex XSIAM Premium license or the Cloud Runtime Security add-on.</p></div> |
| Application | Provides a high-level summary and detailed insights into the business applications within your environment. | <div data-gb-custom-block data-tag="hint" data-style="info" class="hint hint-info"><p>Notice</p><p>This feature is included with a Cortex XSIAM Premium license or the Cloud Posture Security or Cloud Runtime Security add-on.</p></div> |
| Code | Provides an overview of code assets, including all code repositories, Infrastructure as Code (IaC) resources, CI/CD pipelines, and software packages. | <div data-gb-custom-block data-tag="hint" data-style="info" class="hint hint-info"><p>Notice</p><p>This feature is included with the AppSec add-on.</p></div> |
| Compute | Provides a detailed overview of compute resources, including CaaS resources, virtual machines, containers, serverless functions, Kubernetes clusters, and general devices. | |
| Data | Provides an overview of data assets and their associated risks, highlighting sensitive assets and assets marked as open to the world. | <div data-gb-custom-block data-tag="hint" data-style="info" class="hint hint-info"><p>Notice</p><p>This feature is included with a Cortex XSIAM Premium license or the Cloud Posture Security or Cloud Runtime Security add-on.</p></div> |
| Device | Overview of physical or virtual devices with a Cortex XDR agent installed. | <div data-gb-custom-block data-tag="hint" data-style="info" class="hint hint-info"><p>Notice</p><p>This feature is included with a Cortex XSIAM Enterprise or Premium license or the Cortex XDR agent add-on.</p></div> |
| External Surface | Provides an overview of external-facing assets, including services versus websites, domains versus certificates, and their distribution across providers. | <div data-gb-custom-block data-tag="hint" data-style="info" class="hint hint-info"><p>Notice</p><p>This feature is included with the Attack Surface Management (ASM) add-on.</p></div> |
| Identity | Provides an overview of identity-related assets, giving visibility into both user and service-based identities and their associated permissions. | <div data-gb-custom-block data-tag="hint" data-style="info" class="hint hint-info"><p>Notice</p><p>This feature is included with a Cortex XSIAM Premium license or the Cloud Posture Security or Cloud Runtime Security add-on or the Identity Threat Module (ITDR) add-on.</p></div> |
| Network | Provides an overview of network-related assets, including Load Balancers, Network Interfaces, Security Groups, and Subnets. | |
| Security Services | A complete overview of the security services being actively managed within your environment. | |
| All Other Assets | All assets that are uncategorized. |
AI assets
Cortex XSIAM provides a comprehensive overview of the AI assets within an organization, designed to ensure AI security by offering tools to review and prioritize AI risks effectively.
AI assets inventory
You can view all AI assets in your environment, regardless of deployment mode or cloud provider. Navigate to Inventory → All Assets → AI to access the inventory. The top of the page features interactive widgets that summarize your AI security posture:
- Assets at risk: The number of AI assets with detected vulnerabilities or misconfigurations.
- Cloud provider breakdown: A summary of AI resources distributed across your cloud environments (AWS, Azure, GCP).
- Sensitive assets: The number of AI assets handling classified or sensitive data.
- Sensitive assets discovered last 7 days: A trend metric for newly exposed sensitive assets.
AI asset categories
The AI inventory is organized into the following categories to help you quickly filter your resources
- All AI Assets: An aggregated view of all AI resources.
- Agents AI agents (such as AWS Bedrock Agents) that use models and tools to perform tasks and assist primary models.
- Datasets: Collections of data used by AI models. This includes Training datasets used to teach the model how to process information, and Inference datasets used to provide real-world data during the model's inference phase such as for Retrieval-Augmented Generation, or RAG.
- Models: The trained machine learning models themselves , whether managed by a cloud provider or self-managed on your own cloud infrastructure.
- Model Endpoints: The interface through which applications interact with the AI model, acting as an access point for sending inputs and receiving generated outputs.
- Software packages The underlying AI-related software packages and SDKs used by developers to build these systems.
Expanded AI asset information
Clicking an AI asset in the inventory table opens a detailed asset card with specialized tabs for deep inspection:
- Overview: Summarizes highlights, properties, and asset identifiers.
- Identity: Provides an aggregated view of the permissions associated with the asset, mapping the relationships and displaying the identities that can access it.
- Data: Displays data profiles such as CCPA, Financial, and PCI, as well as data patterns found within datasets related to the asset.
- AI Ecosystem: Visualizes the "Asset Story," providing a topological map of how the AI components interact. For example, mapping the foundational Model connected to the Model Endpoint, tied to the Inference Dataset.
API assets
The API asset inventory provides an overview of API assets across cloud providers and data sources, enabling you to analyze, assess, and implement security measures to safeguard against risks.
API visibility and asset categories
Cortex XSIAM observes API traffic and extracts API specification files from gateways. The inventory includes:
- Endpoints: Live API endpoint paths used by applications to communicate with servers.
- Specifications: OpenAPI or Swagger specification files that are imported or extracted from gateways. You can use Cortex XSIAM to validate live traffic against these specifications to alert on surface deviations or undocumented endpoints.
Expanded API endpoint information
When you click on a specific API endpoint, a side card opens containing detailed information organized into the following tabs
- Overview: This tab shows the highlights and properties of the API endpoint. It includes identifying information such as the Asset ID, Provider, and Cloud Region, related Business Applications, and a Relations graph showing the connections between the API endpoint, API gateway, and VMs.
- Compliance: This tab displays the asset's overall compliance score and a breakdown of security controls to help you ensure the API aligns with assigned security standards.
- Endpoint Data: This tab shows the details of the API endpoint, and the components associated with authentication, such as token type, request/response body schema, and usage statistics. It provides deep visibility into the following areas:
- Endpoint metrics: Displays the Request Content Type, Response Content Type, the total number of Inspected Transactions, and timestamps for First Observed, Last Observed, and Last Changed.
- Authentication: Displays a detailed table of detected authentication methods, including the Type (e.g., OAuth, Basic, API Key, Learning, OIDC), Token Type (e.g., Opaque, Base64, JWT), the Location in the payload (e.g., Query Parameters, Authentication Header), and its Status (e.g., Found, Not Found).
- Request Body Schema and Response Body Schema: Displays the JSON structure, format, and expected data types for both the inbound requests and outbound responses.
- Usage Statistics: Provides graphical bar charts to assess usage patterns, displaying distributions for Requests size distribution, Response size distribution, and Status code distribution.
Application assets
The Business Application asset inventory provides visibility into all business applications and their interconnected assets generated throughout your software development lifecycle (SDLC), serving as a centralized repository for business application inventory management. Additionally, the interface details the risks detected in your business applications, allowing you to prioritize, manage, and mitigate potential threats based on business criticality.
Applications act as a single, holistic entity that encompasses their entire lifecycle, from custom code to open-source libraries and infrastructure configurations. By grouping these interconnected assets, you can prioritize, analyze, and mitigate threats based on actual business criticality.
Defining business applications
You can define and group assets into applications using two primary methods:
- Application Criteria: Automatically create and maintain applications in bulk by defining dynamic rules. You can base these criteria on Cloud tags (such as AWS tags grouping assets within a single provider), or VCS entities (automatically generating applications based on your code hierarchy, such as GitHub organizations or repositories).
- Application Builder: Manually build an application by selecting starting assets from either the code side (VCS repositories) or the run side (cloud providers, Kubernetes clusters, or VPCs). Cortex XSIAM automatically identifies and adds related assets based on their connections.
Application inventory
Navigate to Inventory > All Assets > Application > Business Applications to view your application inventory.
The application asset inventory includes a dashboard with a widget of all issues detected in the application by severity level and a table including a list of applications.
The following fields are exposed in the application inventory table. To add additional table properties, select Menu settings → [property].
| Field | Description |
|---|---|
| Name | The application name |
| Business Owner | The individual or team responsible for the application from a business perspective, as provided when creating the application |
| Criticality | The importance of the application to the business as defined when creating the application |
| Assets | The amount of assets associated with the application |
| Creation Method | Whether the application was created using criteria (Auto) or manually |
| Risk | Represents the overall assessed risk level for the application |
| Criteria Name | The configured criteria name |
| Last Updated | Timestamp showing the most recent application update |
Business application asset card
Click an application in the inventory table to open its side card, providing in-depth information organized into several tabs. The Overview tab (default display) offers highlights and a general summary. Additional contextual tabs provide specific details, including a Topology tab (providing context on the application path to production), and tabs focusing on specific issue types detected within the asset, such as Secrets and Vulnerabilities.
The Overview tab summarizes application highlights, metadata and properties.
- Highlights: Includes properties such as deployment status
- Visibility timeline: When the application was first and last detected
- Asset properties, including Asset Id, Asset Category, Asset Groups and associated with the application
- Application risks:
- Risk summary: The amount of risks associated with the application assets grouped by category (cases, issues and findings) and their severity level. For more information about issues, refer to Application Security code scanners.
- Risk Score: A value representing the overall security risk of an application, based on various underlying metrics. This helps in assessing and prioritizing the application's security posture and potential vulnerabilities
- Coverage: Evaluate the application security coverage via its scanned asset percentage
- Business Criticality: As defined when creating the application. See How to manually build an application for more information.
- Business Owners: The entity associated with the application
- Criteria: The criteria used to create the application
- Creation Method: Indicates if the application was created through a manual selection of assets or automatically (such as via automation or discovery)
The Topology tab visualizes your application's asset relationships across the entire software development lifecycle (SDLC). It maps interconnected assets including code repositories, pipelines, container images, and workloads, providing a comprehensive representation of the code-to-cloud journey. You can view the topology either as a visual representation or as an asset inventory by selecting the Graph or Inventory (default) tabs respectively.
Note
The topology graph is available only when all application components (code, pipeline, build and deploy), are configured.
Topology graph
The graph displays the application path to production, organized into four key SDLC sections:
- CODE: Displays source code repositories and VCS organizations, allowing you to understand code organization and repository structure:
- Providers: GitHub, GitLab, Azure Repos, Bitbucket
- Key relationships: Organizations contain repositories; repositories are forked from others
- BUILD: Displays CI/CD pipelines, visualizing build processes and pipeline dependencies:
- Providers: GitHub Actions, GitLab CI/CD, Jenkins, Azure Pipelines, CircleCI
- Key relationships: Repositories trigger pipelines; pipelines build container images
- Deploy: Displays container registries and image repositories, allowing you to track image lineage and registry organization:
- Providers: Docker Hub, Google Artifact Registry (GAR), Amazon ECR, Azure ACR
- Key relationships: Registries contain image repositories; pipelines build specific container images
- Run: Displays runtime architecture, including compute, storage, networking, and identity assets, allowing you to understand runtime architecture and resource dependencies
- Assets: Kubernetes clusters/workloads, virtual machines, serverless functions, storage buckets, load balancers, and IAM policies
- Providers: AWS, GCP, Azure
- Key relationships: Images run on instances, workloads use service accounts, functions access storage buckets
Navigating the graph
Use the following controls to manage the view and investigate assets:
- Node actions: Click any asset node to view basic details. Select View Details in the popup to open the asset side-car for comprehensive information without leaving the topology view
- Search and highlight: Search for specific assets by name to highlight matching nodes and navigate directly to them in the graph
- Group nodes: Toggle this to organize assets into logical clusters (such as Container Images), simplifying complex graphs. Click a group to expand it
- Layers: Apply filters to view assets based on specific criteria, such as public internet exposure, related cases, or associated runtime events
Filtering and layout options
Customize the display to focus on relevant information:
- Section filtering: Toggle visibility for specific SDLC sections (CODE, BUILD, DEPLOY, RUN) to isolate parts of the lifecycle
- Provider filtering: Filter assets by cloud or VCS provider (such as Show only AWS or GitHub assets)
- Layout options: Choose a visualization style:
- Hierarchical: Top-to-bottom flow (Code → Build → Deploy → Run).
- Force-Directed: Physics-based layout.
- Circular: Circular arrangement.
Understanding relationships
Edges connecting nodes represent specific interactions or dependencies, including:
- CONTAINS: Hierarchical containment (such as Org → Repo)
- TRIGGERS: Activation (such as Repo → Pipeline)
- BUILDS: Creation (such as Pipeline → Image)
- RUNS ON: Runtime execution (such as Image → Container Instance)
- USES/ACCESSES: Resource usage or data access
Common workflows
- Investigate critical vulnerabilities: Identify a critical CVE, locate the affected repository in the graph, and trace relationships forward to see if vulnerable versions are currently deployed as running instances
- Track Code to Cloud misconfigurations: Identify IaC issues (code) and trace them to deployed cloud resources to ensure fixes are applied at the source to prevent future misconfigured deployments
- Audit secret exposure: Locate repositories with privileged secrets and trace them to the DEPLOY or RUN sections to see if those secrets are active in production environments
- Understand application architecture: Filter for the RUN section to identify runtime components, then trace back to source repositories to document deployment paths for compliance.
Topology inventory
The Inventory table displays all assets associated with the business application. Selecting an asset opens its side card directly without having to navigate away to the dedicated asset inventory.
- Asset details: Displays properties such as Name, Provider, Type, Region, and timestamps for First/Last Observed
- Risk context: Includes breakdowns of associated cases, critical issues, and vulnerability severity
- Table controls: Filter the table by property or adjust the table settings to add/remove columns
- Export icon: Download the inventory as a
.tsvfile. See Export business application data for more information
The Vulnerabilities tab displays SCA vulnerability issues detected across the application assets. This tab includes a a continuous funnel graph and a section detailing the riskiest repositories.
The graph displays the following vulnerability metrics, filtered by default for Critical and High severity:
- All: The total amount of vulnerabilities detected in the application and its assets
- Exploitable: The subset of total vulnerabilities that are exploitable
- Fixable: The subset of total vulnerabilities that have an available fix
- Deployed: The subset of vulnerabilities detected in deployed application assets
You can filter the graph to display any combination of severities (Critical, High, Medium, and Low). Selecting any stage of the funnel (such as Fixable) redirects you to the main Issues inventory, filtered to display vulnerabilities that that match the criteria you selected (for example, issues that have available fixes).
A known limitation is that only up to 4,000 issues will be displayed in the Issues inventory when redirecting from the graph, even if the count in a particular stage (such as Deployed) is higher.
The Riskiest repositories section lists the repositories with the highest risk, based on the number and severity of known vulnerabilities detected in the application. It also displays risk metrics such as whether the repository is deployed.
This section displays the following details for each repository:
- VCS
- Repository location
- Branch
- Last commit date
Selecting a repository from the list redirects you to the main Issues inventory, filtered to display all vulnerability issues for that specific repository. It includes the total number and a breakdown of issues by severity level.
Selecting the branch link opens that repository's asset side-card directly, allowing you to view more details without navigating away.
The Configurations tab displays IaC misconfiguration issues detected across the application assets. This tab includes a graph and a section detailing top IaC misconfiguration rules.
The graph displays the following IaC misconfiguration metrics, filtered by default for Critical and High severity:
- All: The total number of misconfigurations detected in the application and its assets
- Fixable: The total number of misconfigurations that have an available fix
- Deployed: The total number of misconfigurations detected in deployed application assets
You can filter the graph to display any combination of severities (Critical, High, Medium, and Low). Selecting any of these categories (such as Fixable) redirects you to the tenant's main Issues inventory. This page will be filtered to display all IaC Misconfiguration issues for this specific application that match the criteria you selected (for example, issues that have available fixes).
A known limitation is that only up to 4,000 issues will be displayed in the Issues inventory when redirecting from the graph, even if the count in a particular category (such as Deployed) is higher.
The Top IaC misconfiguration rules section helps you identify and focus on the most urgent issues by highlighting misconfigurations detected from a matching rule in both the source code and the deployed cloud environment. It includes the total number and a breakdown of issues by severity level.
Selecting one of these matching rule sets redirects you to the main Issues inventory, filtered to display all IaC misconfiguration issues detected by that specific IaC rule set.
The Secrets tab displays exposed Secrets issues detected across the application assets. This tab includes a graph and a section detailing the Riskiest repositories.
The graph displays the following Secrets metrics, filtered by default for Critical and High severity:
- All: The total number of Secrets detected in the application and its assets
- Valid: The total number of detected Secrets that have been verified as active and functional
- Privileged: The total number of Secrets that are valid and provide high-level access
You can filter the graph to display any combination of severities (Critical, High, Medium, and Low). Selecting any of these categories (such as Valid) redirects you to the tenant's main Issues inventory. This page will be filtered to display all Secrets issues for this specific application that match the criteria you selected (for example, issues that are validated).
A known limitation is that only up to 4,000 issues will be displayed in the Issues inventory when redirecting from the graph, even if the count in a particular category (such as Valid) is higher.
The Riskiest repositories section identifies the repositories with the highest risk, based on the number and severity of known Secrets detected in its assets. It includes the total number and breakdown of issues by severity level.
- VCS
- Repository location
- Branch
- Last commit date
Selecting a repository from the list redirects you to the main Issues inventory, filtered to display all Secrets issues for that specific repository.
Selecting the branch link opens that repository's asset side-card directly, allowing you to view more details without navigating away.
The Code Weaknesses tab displays SAST code weakness issues detected across the application assets. This tab includes a graph and a section detailing the Riskiest repositories.
The graph displays the following code weakness metrics, filtered by default for Critical and High severity:
- All: The total number of code weaknesses detected in the application and its assets
- Labels: The total number of code weaknesses that are categorized by specific labels
- Deployed: The total number of code weaknesses detected in deployed application assets
You can filter the graph to display any combination of severities (Critical, High, Medium, and Low). Selecting any of these categories (such as Deployed) redirects you to the main Issues inventory. This page will be filtered to display all Code Weakness issues for this specific application that match the criteria you selected.
A known limitation is that only up to 4,000 issues will be displayed in the Issues inventory when redirecting from the graph, even if the count in a particular category is higher.
The Riskiest repositories section identifies the repositories with the highest risk, based on the number, severity, and type of code weaknesses detected—including those deployed to production.
This section displays the total count and type of issues for each repository, along with:
- VCS
- Repository location
- Branch
- Last commit date
Selecting a repository item redirects you to the tenant's main Issues inventory, which is filtered to display all code weakness issues for that specific repository.
Selecting the branch link opens that repository's asset side card directly, allowing you to view more details without navigating away.
Application SBAC (Scope-based access control)
You can scope user access directly to applications to enforce clear security boundaries. Using an implicit deny model, users only have visibility into the applications and related assets, such as repositories and vulnerabilities, explicitly assigned to them via application-scoped user groups.
Export business application data
You can export application security data for reporting, sharing metrics, or audit evidence. Cortex XSIAM offers two export workflows: a portfolio-level overview or an application-level deep dive. Data is downloaded to your local host in a .tsv file format.
Export global portfolios
You can export the high-level inventory for all defined business applications. This is used for reporting on the organization’s overall risk posture, business criticality, and security coverage.
- Navigate to Inventory → All Assets → Business Applications.
-
Select the Export icon on the main table header.
A file containing high-level summary data of all your business applications is downloaded.
Export individual application asset data
You can export the granular technical details for a single Business Application. This allows for tracing the Code to Cloud lineage and verifying the security status of every asset within a specific service.
- From the Business Application inventory, click on an application name to open the Application side card.
- Select the Topology tab.
- Ensure the view is set to Inventory.
-
Select the Export icon within the Topology section.
A file containing data of all the assets associated with the business application is downloaded.
Code and Supply Chain Security assets
The Code asset class provides visibility into your Software Development Lifecycle (SDLC), helping you identify and mitigate risks introduced during the build and deployment processes.
Code and Supply Chain Security categories
The inventory tracks several distinct asset categories to help secure your software supply chain. You can view an aggregated summary of All Code Assets, or filter by the following specific categories:
- IaC Resources: Tracks Infrastructure-as-Code resources to manage misconfigurations and ensure compliance with security standards.
- Repositories: Tracks version control repositories (e.g., GitHub, GitLab) where source code is hosted.
- VCS Organizations: The top-level structures within VCS platforms that contain your repositories, code, and configurations.
- CI/CD Pipelines: Tracks the automated workflows that build, test, and deploy your software.
- CI/CD Instances: Tracks the pipeline tool instances (like Jenkins or GitHub Actions) that execute your automated workflows.
- Software Packages: Tracks open-source software packages to manage vulnerabilities (CVEs), package operational risks, and license misconfigurations.
Code to cloud traceability
A key feature of code security assets is the code to cloud tab available on asset side cards. Code to cloud context is a correlation engine that maps the full lineage of assets across the SDLC. By deterministically connecting repositories, pipelines, images, and runtime resources (including VMs and IaC-defined infrastructure) back to their originating code, it provides end-to-end bidirectional traceability. This allows analysts to trace runtime issues back to the specific line of code, developer, or pipeline that introduced them/
Code security issue visibility
Code Security issues are organized into dedicated issue tables based on the scanner type (such as Secrets, SCA, CI/CD Risks, and IaC misconfigurations). However, these dedicated tables are filtered to only display issues generated from findings detected during periodic scans. If you need to view issues detected during pull request (PR) or continuous integration (CI) scans, you must navigate to the Issues page, which unifies all issues regardless of their detection source.
IaC resources assets
Cortex XSIAM discovers and inventories every Infrastructure-as-code (IaC) resource defined within your onboarded repositories. Each discovered resource appears in the unified asset inventory as a governed entity, allowing security teams to manage the security posture of cloud infrastructure before it is deployed to production.
The IaC asset enables security teams to answer three questions about every cloud template: What is the resource? Where is it defined? What is its security health?
Note
Scope: The IaC asset represents individual infrastructure resources defined in Terraform, CloudFormation, or Kubernetes manifests. The IaC asset does not represent the physical cloud resource in the runtime environment; those are managed under the Cloud asset class.
The IaC asset is a critical component of shift-left security, providing the visibility needed to identify and remediate misconfigurations at the source code level
Core achievements and use cases
- Resource discovery and identity: Every IaC resource defined in supported templates is automatically discovered and registered in the unified asset inventory with a unique asset identifier, resource type, and source file path
- Configuration enrichment: The IaC asset is enriched with metadata from the source code including resource attributes, provider types, and the specific line ranges where the resource is defined
- Code-to-cloud lineage: The IaC asset serves as the bridge in the Code-to-Cloud graph, establishing a traceable lineage from the source repository through the IaC definition to the deployed cloud resource
- Proactive health monitoring: The IaC asset provides a continuous health profile by detecting security misconfigurations against organizational policies before the infrastructure is provisioned
Functional responsibilities
The IaC asset model facilitates a structured delegation between governance and operations:
- AppSec managers (Governance): Define the IaC security policies and benchmarks that every resource must meet, and review the inventory to identify high-risk resource types across the organization
- AppSec practitioners (Operations): Review IaC misconfigurations detected in the asset inventory and apply the provided remediation guidance directly to the source templates to ensure secure deployments
Relationship model
Cortex XSIAM models the following relationships between the IaC asset and other asset categories to provide full supply chain visibility.
| Related asset category | Inherited metadata and description |
|---|---|
| Repository (Parent) | The VCS repository that contains the IaC definition, propagating business criticality and application context to the resource |
| Cloud resource (Downstream) | The physical cloud infrastructure provisioned from the IaC definition, traced via the Code-to-Cloud graph |
| CI/CD pipeline (Downstream) | The pipeline responsible for deploying the IaC template to the cloud environment |
Supported frameworks and languages
The following infrastructure-as-code (IaC) frameworks are supported:
| Ansible | Dockerfile | openAPI |
| ARM | Helm | OpenTofu |
| Bicep | Kubernetes | Terraform |
| CloudFormation | Kustomize | Terraform Plan |
IaC resources assets inventory
To view and manage IaC resource assets, you must have at least one Version Control System (GitHub, GitLab, Bitbucket, Azure DevOps) integrated and active and at least one repository with IaC scanning enabled and a completed scan resulting in discovered resources.
To access IaC assets, go to Inventory, select All Assets → Code → IaC Resources.
The IaC Resources assets page includes a dashboard and an inventory table.
IaC resources dashboard
The dashboard includes three widgets. To focus the IaC asset inventory on a specific set of resources, select a value in a widget and then choose Filter in, or Filter out to exclude a specific resource from the results.
- Cloud Providers: Displays the total amount of IaC resources categorized by connected cloud providers such as AWS and GCP and the number of IaC resources found in each provider
- Frameworks: Displays connected frameworks such as Terraform and Kubernetes and the number of IaC resources found in each framework
- Drifted Resources: Shows the total number of IaC resources with detected drift, broken down by cloud provider, where each provider displays its own drift count
IaC resources table
The following table describes the default exposed properties of the IaC Resource asset table. Select Menu Settings to view additional properties.
| Property | Description |
|---|---|
| Name | The logical name assigned to the resource within the IaC template code |
| Resource type | The specific infrastructure category defined by the provider such as aws_s3_bucket or google_compute_instance |
| Framework | The IaC technology used to define the resource such as Terraform, CloudFormation, or Kubernetes |
| Cloud provider | The cloud service provider where the resource is intended to be deployed such as Google Cloud, GCP, or Azure |
| Repository | The name of the version control repository containing the IaC source file |
| Provider | The Version Control System (VCS) platform hosting the repository such as GitHub or GitLab |
| File path | The specific directory path to the manifest or template file within the repository |
| Branch | The specific branch of the repository where the IaC resource was detected |
| Business application names | The business applications associated with the resource, which are automatically mapped based on the application assignment of the parent repository |
| First observed | The date and time the IaC resource was initially discovered in the inventory |
| Last observed | The date and time of the most recent scan that confirmed the presence of the resource |
Filter and prioritize IaC resources
To effectively reduce the infrastructure risk surface, apply the following high-priority filtering workflows:
- Target critical infrastructure: Filter by Business Application Names to prioritize misconfigurations in resources that support essential services
- Investigate drifted resources: Filter by Drifted Resources to identify infrastructure where the runtime configuration has diverged from the IaC template
- Isolate deployed infrastructure: Filter by C2C Traced Assets (in the More Actions menu next to Filters) to identify IaC templates that are actively running in your cloud environment rather than dormant code
- Scope by framework: Filter Frameworks to isolate specific technologies such as Kubernetes manifests for container security audits
IaC resources assets details
The IaC resources inventory provides multiple ways to investigate an infrastructure asset, from quick agentic queries in the main table to deep-dive configuration analysis in the side panel.
Select an IaC resource row in the table to open its side panel. This provides a consolidated workspace for investigating infrastructure definitions and remediating misconfigurations without navigating away from the asset inventory
Ask the AppSec agentic assistant agent
From the IaC assets side panel, click Ask AI and query resource-specific insights (for example, policy compliance, framework-specific risks, or deployment gaps).
Asset card tabs
Navigate through the following tabs in the side panel to review the infrastructure context and lineage. This helps prioritize remediation efforts based on application criticality and assess the potential production impact of misconfigurations:
- Overview tab: Displays highlights such as Internet Exposed, Public, Deployed to Runtime, Failed Security Assessment, as well as cases and issues associated with the resource. Additional information includes the severity breakdown of misconfigurations, resource properties (such as framework and provider), and current scan information including the last scan time and health status
- Applications tab: Displays the business applications associated with the resource including business criticality ratings and risk scores
- Code tab: Provides a direct view of the IaC template source code where the resource is defined to inspect raw configuration attributes
- Code to Cloud tab: Displays the relationship graph visualizing the full lineage from the source repository through the IaC resource to the deployed cloud workloads
Investigate and remediate issues by category
The IaC side panel organizes findings detected within the infrastructure template into dedicated tabs by issue category. Selecting a finding opens the issue side card directly within the resource context
Fixes are executed either directly from these dedicated tabs for in-context remediation, or from the main inventory tables for global management:
| Tab name | Scanner type | Description and remediation options |
|---|---|---|
| Configurations | IaC | <p>Security misconfigurations and policy violations detected in the infrastructure template</p><ul><li>Fix PR: Click to automatically generate a Pull Request to apply the recommended remediation code directly to the repository</li><li>Manual fix: Use the presented code snippets to manually update the template in your native VCS environment</li></ul> |
| Secrets | Secrets | <p>Hardcoded credentials and sensitive tokens detected within the IaC manifest</p><ul><li>Manual guidance: Secrets issues do not support automated Fix PRs and always require manual remediation using the provided guidance to revoke, rotate, and remove the exposed credentials</li></ul> |
Execute asset actions
After reviewing the resource health, you can perform the following operations depending on your location in the interface:
- Navigate to repository: Available from either the main table (right-click) or the side panel. Click to open the parent repository side panel, allowing you to investigate the broader codebase context without navigating away from your current view
- Navigate to provider: Available only from the side panel Actions menu. Click to open the native VCS platform (such as GitHub or GitLab) directly to the specific code where the IaC resource is defined
- Export: Available from the main table. Click the Export to file icon to generate and download a file containing the filtered inventory data
- View asset data: Available from either the side panel Actions menu or by right-clicking the resource in the main table. Click View asset data to view raw resource data in
JSON(default) ortree view
Repository assets
Cortex XSIAM discovers and inventories every repository connected through a Version Control System (VCS) integration; GitHub, GitLab, Bitbucket, or Azure DevOps. Each onboarded repository appears in the unified asset inventory as the source-of-truth for the software supply chain, carrying its identity metadata, ownership context, business criticality, security health, and downstream deployment lineage.
The repository asset enables security teams to answer three questions about every codebase: What is it? Where does it sit in the organization? What is its security health?
Note
Scope: The repository asset represents a VCS repository onboarded into Cortex XSIAM. The repository asset does not represent container image repositories, artifact registries, or cloud resource inventories; those asset categories are managed under the Compute and Cloud asset classes respectively.
The repository inventory provides the identity, context, and health telemetry needed to manage every codebase as a governed asset.
Core achievements and use cases
- Asset discovery and identity: Every repository connected through a VCS integration is automatically discovered and registered in the unified asset inventory with a unique asset identifier, VCS provider, organization, default branch, and onboarding timestamp to serve as the persistent identity record for the codebase
- Asset metadata enrichment: The repository asset is continuously enriched with metadata synchronized from the VCS provider. Retrieving repository asset details through the API enables synchronization with external asset management systems, CMDB platforms, and compliance reporting tools
- Code to cloud lineage: The repository asset is the origin node in the code to cloud graph, establishing a traceable lineage from source code through software packages, IaC resources, and CI/CD pipelines to deployed container images and cloud resources
- Asset health monitoring: The repository asset provides a continuous health profile by aggregating security signals from all scanner types
- Coverage measurement: The repository inventory quantifies the ratio of discovered repositories to actively scanned repositories, enabling AppSec managers to identify and close coverage gaps manually or programmatically
- Compliance evidence: SBOM export (CycloneDX) at the repository level provides auditable evidence of software composition
Functional responsibilities
The repository asset model facilitates a structured delegation between governance and operations:
- AppSec managers (Governance): Review the repository inventory to identify coverage gaps such as repositories without active scanners, repositories not assigned to applications, or repositories with stale scan data, and define scanner configurations to prioritize remediation
- AppSec practitioners (Operations): Onboard repositories through VCS integrations, configure scanner enablement per repository, trigger rescans, export SBOMs for compliance evidence, and remediate issues
Relationship model
| Related asset category | Inherited metadata and description |
|---|---|
| VCS organization (Parent) | The VCS organization that contains the repository, propagating organization-level policies and compliance scopes |
| Software package (Child) | Open-source and third-party packages declared in dependency manifest files within the repository |
| IaC resource (Child) | Infrastructure-as-Code resources defined within the repository |
| CI/CD pipeline (Child) | CI/CD pipeline definitions associated with the repository for deployment lineage tracking |
| Container image (Downstream) | Container images built from the repository through CI/CD pipelines |
| Cloud resource (Downstream) | Cloud infrastructure provisioned from IaC resources defined in the repository |
Repository assets inventory
To view and manage repository assets, you must have at least one Version Control System (GitHub, GitLab, Bitbucket, Azure DevOps) integrated and active and at least one repository onboarded through the VCS integration and visible in the asset inventory.
To access repository assets, go to Inventory, select All Assets → Code → Repositories.
The repositories assets page includes a dashboard and an inventory table.
Repository dashboard
The dashboard includes two widgets.
- Providers: Displays connected version control providers (such as GitHub and GitLab) and the number of repositories found in each provider.
- Privacy State: Shows the distribution between public and private repositories and the amount of repositories in each category.
Selecting an item in either widget filters the table accordingly.
Repository table
The following table describes the default exposed properties of the repository asset table. Select Menu Settings to view additional properties.
| Property | Description |
|---|---|
| Repository Name | The name of the repository in the version control system (VCS). |
| Provider | <ul><li>The VCS platform hosting the repository (for example, GitHub, GitLab)</li><li>CI/CD tools (for example, GitHub Actions, GitLab CI, Jenkins); these refer to associated pipeline assets, not the repository itself</li></ul> |
| Repository Organization | The organizational structure (such as project, team, platform) that contains and manages the repository |
| Repository labels | Labels associated with the repository |
| Business Application Names | The name of the business application to which the repository is associated, indicating it is part of the application assets |
| First observed | The date the repository was initially detected in a scan |
| Observation time | The date the repository was last updated |
| Scanned Branches | The branch of the repository that is scanned (default: main/master) |
| Is repository archived | Whether a repository is no longer actively maintained or developed (boolean) |
Filter and prioritize repositories
The Repositories page displays a table of all repositories. Use the search bar to find repositories by name, or apply filters to narrow results based on operational and security metadata.
To effectively reduce the organization risk surface, apply the following filter combinations to prioritize remediation efforts:
- Target critical assets: Filter by Business Application Names to isolate repositories tied to essential services and prioritize their vulnerabilities for remediation
- Identify public exposure risks: Filter by Repository visibility configuration: Public to identify proprietary repositories inadvertently set to public in the VCS provider
- Find active repositories missing scanner coverage: Filter by Is repository archived: No and sort the table by the Last Scan Date column to highlight actively maintained repositories that have never been scanned
- Filter out noise from stale code: Filter by Is repository archived: Yes or sort by the oldest Last Commit Date to isolate abandoned or read-only codebases
- Scope by business unit or environment: Use the repository tag metadata filter to isolate the inventory for specific engineering teams or deployment environments
Repository technologies
You can add the Repository technologies column to the table through Menu Settings. Each technology appears as a tag containing the technology icon and name (for example, a JavaScript icon followed by javascript), If a repository contains multiple technologies, the column displays a truncated list showing the first three. Hover over the indicator to view the full list. The technology data is derived from the repository file composition and is updated with each repository scan.
You can also filter the repositories table by Repository technologies to look for assets that use a specific technology. The filter supports wildcard filtering and is case-insensitive. You can also view technologies in repository asset cards.Hover over a tag to view a tooltip showing the percentage of the codebase attributed to that technology. Percentages sum to 100%.
Repository technologies frequently asked questions
Can users manually tag a repository with a custom or proprietary technology?
No. Technology detection is fully automated and cannot be manually overridden or supplemented. The detection engine identifies technologies based on file analysis during repository scans. If a custom or proprietary framework is not detected, it does not appear in the Technologies property.
However, repository Tags (a separate feature from Technologies) can be used to manually label repositories with custom metadata. Repository tags are displayed in the Tags property of the repository side card and can be used for organizational purposes.
What happens when a new language is added to a repository?
The new technology is detected and displayed after the next repository scan. You can trigger an immediate update by selecting Rescan from the repository side card.
Are technology percentages based on lines of code or file count?
Technology percentages represent the proportional share of each technology in the repository codebase. The detection engine uses file-level analysis to calculate the proportions. The percentages across all detected technologies in a repository sum to 100%.
Do technologies affect security scanning or policy evaluation?
Technologies are informational metadata displayed in the Asset Inventory. They do not directly control which scanners run or which policies apply. However, technology information can inform scanner configuration and policy scoping decisions.
Troubleshooting technology detection
If a known technology is not showing up for a repository, consider the following causes and resolutions:
| Cause | Resolution |
|---|---|
| The repository has not been scanned recently | Trigger a manual rescan from the repository side card. Select the repository row, then select Rescan from the side card actions |
| All scanners are disabled for the repository | Verify that at least one scanner is enabled. If all scanners are disabled, the Rescan action is unavailable |
| The technology files are on an unscanned branch | Technology detection covers only the branches configured for scanning. Verify the branch is included in the scanning scope |
| The technology is not in the supported detection set | The engine recognizes a broad set of standard technologies. Proprietary or highly custom frameworks may not be detected automatically |
Repository inventory table actions
Right-click on a row in the inventory table to take the following actions:
- Open in new tab: Opens the asset description card in a new tab
- View asset data: Display asset data. Formats: JSON, Tree View
- Copy text to clipboard: Duplicate selected text for easy pasting elsewhere
- Copy entire row: Duplicate the entire row of data for easy pasting elsewhere
- Show/hide rows with [Asset_Name]: Show/hide rows matching the [asset name] of the selected row
Repository assets details
Select a repository row in the table to open its side panel. This provides a consolidated workspace for investigating repository assets and remediating associated security issues without navigating away from the asset inventory.
Ask the AppSec agentic assistant agent
From the Repositories table, right-click a repository → Open in Agentic Assistant → select Application Security from the agents menu, and query repository-specific insights (for example, scan coverage, risk posture, or gaps).
Asset card tabs
Navigate through the following tabs in the side panel to review the repository context and lineage. This helps prioritize remediation efforts based on application criticality and assess the potential production impact of vulnerabilities:
-
Overview tab: Displays the severity breakdown of issues, repository properties (such as visibility, technologies, and owners), and current scan information including the scan type, branch name, last scan time, and health status
- Internet Exposed: The code in the repository ultimately powers a publicly reachable cloud endpoint, calculated via the Code-to-Cloud graph
- Deployed to Runtime: The repository code is deployed to production runtime environments through CI/CD pipelines
- Public: The repository has public visibility in the VCS provider
- Deprecated: The repository or its components are marked as deprecated
- Cases: X Critical and High Cases when the repository has associated cases with Critical or High severity
- Issues: Shows X Critical and High Issues when the repository has associated issues with Critical or High severity
For more information about scan management, refer to Application Security scans management.
-
Applications tab: Displays the business applications associated with the repository including business criticality ratings and risk scores
For more information about applications, refer to Defining Business Applications.
-
Code to Cloud tab: Displays the relationship graph visualizing the full lineage from the repository asset to deployed cloud workloads
Use the graph to perform the following supply chain investigations:
- Trace build paths: Identify the specific CI/CD pipelines that build artifacts from the repository and verify pipeline status indicators to see if they are actively deploying to production
- Map cloud infrastructure: Determine exactly which runtime cloud resources are provisioned from the IaC definitions stored in the repository
- Assess blast radius: Trace paths down to the terminal deployment nodes, such as container images and cloud instances, to understand which production workloads are affected by a vulnerability originating in the codebase
For more information on Code to Cloud, refer to Code to Cloud.
Investigate and remediate issues by category
The repository side panel organizes issues detected within the repository's underlying assets into dedicated tabs by issue category. Selecting a finding opens the issue side card directly within the repository context, allowing you to investigate and remediate the risk without navigating away.
| Tab name | Scanner type | Description |
|---|---|---|
| Vulnerabilities | SCA | Known CVE vulnerabilities in open-source packages declared in dependency manifest files within the repository. Refer to Software Composition Analysis (SCA) vulnerability issues for more information |
| Code Weaknesses | SAST | Security weaknesses in first-party source code detected through static analysis. Refer to Manage code weakness issues for more information |
| Secrets | Secrets | Hardcoded credentials, API keys, tokens, and other sensitive values detected in source code and configuration files. Refer to Navigate to secrets issues for more information |
| Package Integrity | SCA | Open-source packages with operational risk indicators (such as deprecated or unpopular packages) or license types that violate organizational compliance policies. Refer to Package integrity issues for more information |
| IaC Configuration | IaC | Security misconfigurations in Infrastructure-as-Code templates. Refer to refer to Navigate to IaC misconfiguration issues for more information |
| CI/CD Configuration | CI/CD | Security risks and misconfigurations in CI/CD pipeline definitions associated with the repository. Refer to CI/CD Risks for more information |
Execute asset actions
After reviewing the repository's health, you can perform the following operations from the Actions menu in the side panel.
- Rescan a repository: Click Rescan to trigger an on-demand scan using the currently configured scanners
- Export an SBOM: Click Export SBOM to generate and download a Software Bill of Materials.
- Level: Select Repository to download the SBOM for the selected repository, or Organization to download all SBOM reports for the parent organization as a ZIP archive
- Supported formats
CycloneDXv1.4: XML or JSONCycloneDXv1.5: XML or JSONCycloneDXv1.6: XML or JSONSDPXv2.3: JSON or TXT
- Open in GitHub: Click Open in GitHub to pivot directly to the native repository environment to investigate source code, review commit history, or initiate remediation through a pull request
- View asset data: Click View asset data to view raw repository data in
JSON(default) or tree view
Note
For detailed information on investigating and remediating issues, refer to Code Security scanners.
VCS organization assets
Cortex XSIAM discovers and inventories every Version Control System (VCS) organization connected through active VCS integrations. Each VCS organization appears in the unified asset inventory as the top-level governance boundary for the software supply chain, carrying its identity metadata, VCS provider, repository count, CI/CD instance associations, aggregated security health, and organizational context.
The VCS organization asset enables security teams to answer three questions about every development organization: what VCS organizations exist across the enterprise, what is the aggregated security posture of each organization, and which repositories and CI/CD instances does each organization contain.
Note
Scope: The VCS organization asset represents a VCS organization discovered through an active VCS integration. It captures the organizational identity, provider type, and aggregated security posture across all child entities. It does not represent individual repositories, CI/CD pipelines, or CI/CD instances, nor does it represent business applications.
The VCS organization asset is the foundational unit of organization-level governance in Cortex XSIAM. The VCS organization inventory provides the identity, provider context, aggregated security health, and repository visibility needed to manage every VCS organization as a governed asset, from discovery through remediation.
Core achievements
- Organization discovery and identity: Every VCS organization connected through a VCS integration is automatically discovered and registered with a unique identifier, name, provider, and URL
- Code to Cloud lineage root: All downstream assets inherit their governance scope (policies, compliance frameworks, business criticality context) from the VCS Organization through the parent-child relationship chain. The Code-to-Cloud graph in the side panel visualizes this lineage starting from the VCS Organization node
- Policy propagation and compliance scoping: Organization-level policies propagate to all repositories within the VCS organization, ensuring consistent security standards
Functional responsibilities
The VCS organization asset facilitates a structured delegation between governance and operations:
- AppSec managers (Governance): Review the VCS organization inventory to assess the security posture at the organizational level, identify organizations with the highest concentration of Critical and High severity findings, evaluate coverage gaps, and define organization-scoped policies that propagate to all child repositories.
- AppSec practitioners (Operations): Navigate from the VCS organization to individual repositories and CI/CD instances to investigate and remediate security findings. Onboard new repositories, configure scanner enablement, and track remediation progress at the organization level.
Relationship model
The VCS organization asset is the root node of the Code-to-Cloud asset hierarchy. The platform models the following relationships between the VCS organization asset and other asset categories:
| Relationship direction | Related asset category | Relationship description | Inherited metadata |
|---|---|---|---|
| Child | Repository | Repositories contained within the VCS organization. Aggregates security posture across all child repositories | Child repositories inherit organization-level policies and compliance scope. Findings aggregate up to the organization health profile |
| Child | CI/CD Instance | CI/CD platform instances associated with the VCS organization (such as GitHub Actions instance for a GitHub organization) | Child CI/CD instances inherit the VCS organization provider type and organizational context |
| Sibling | VCS Organization | Other VCS organizations within the same Cortex XSIAM tenant operating as independent governance boundaries | Sibling organizations share the tenant but maintain independent policy scopes and health profiles |
VCS organization assets inventory
To view and manage VCS organization assets, you must have at least one Version Control System (GitHub, GitLab, Bitbucket, Azure DevOps) integrated and active. VCS organizations are discovered through active VCS integrations.
To access repository assets, go to Inventory, select All Assets → Code → VCS Organizations.
The VCS organization assets page includes a dashboard and an inventory table.
VCS organization dashboard
The dashboard includes the Providers widget, which displays connected version control providers (such as GitHub, GitLab, Bitbucket, and Azure DevOps) and the number of organizations found in each provider. Selecting an item in the widget filters the table accordingly.
VCS organization asset table
The following table describes the default exposed properties of the VCS Organization asset table. Select Menu Settings to view additional properties.
| Property | Description |
|---|---|
| VCS Organization Name | The name of the VCS organization as discovered from the VCS integration. The Organization Name serves as the primary identifier for the VCS organization asset |
| VCS Organization Provider | The VCS platform hosting the organization (GitHub, GitLab, Bitbucket, Azure DevOps), displayed with a provider icon |
| First Observed | The date and time the asset was initially detected and registered into the unified asset inventory during its first scan |
| Observation Time | The date and time the asset was last updated, scanned, or seen by the platform's discovery and scanning mechanisms |
| VCS Organization URL | The direct web address to the organization within the Version Control System provider's platform (for example, https://github.com/my-org). This enables direct navigation from the inventory to the provider's console |
| Business Application Names | The name(s) of the business application(s) to which the asset is associated. For a VCS organization, these applications are inherited from the child repositories and CI/CD instances within the organization. This helps map the asset to its business context and criticality |
Filter and prioritize VCS organizations
The VCS Organizations page displays a table of all VCS organizations. Use the search bar to find specific organizations by name, or apply filters to narrow the inventory based on operational and security metadata.
To effectively manage the organization-level security posture, apply the following filter combinations to prioritize remediation efforts:
- Scope by VCS provider: Use the Provider filter (or dashboard widget) to isolate the inventory by provider (for example, GitHub or GitLab) to evaluate provider-specific organizational risks and enforce platform-level security standards
- Identify access control risks: Filter by Is MFA needed = No to quickly identify VCS organizations that do not have Multi-Factor Authentication enforced, allowing you to prioritize securing access to these foundational organization boundaries.
VCS organizations inventory table actions
Right-click on a row in the inventory table to take the following actions:
- Open in new tab: Opens the description tab of the asset for detailed analysis of the issue
- View asset data: Opens a new pop-up window displaying the data retrieved for the asset during the most recent scan in either JSON (default) or tree view. This raw data provides a comprehensive and unformatted view of the asset's properties and attributes as they were initially ingested
- Copy text to clipboard: Copies the selected text to the clipboard
- Copy entire row: Copies the entire selected row data
- Show/hide rows: Stand on data in a row and filter the entire inventory to show or hide assets based on the selected attribute
- Open in Cortex Assistant/Open in Cortex Agentic Assistant: Opens the repository in Cortex Assistant or Cortex Agentic Assistant.
Click the download icon (showing Export to file when hovering over the icon) in the top right of any asset page to export the asset data.
VCS organization details
Select a VCS organization row in the table to open its side panel. This provides a consolidated workspace for investigating organization-level security posture and remediating associated security issues without navigating away from the asset inventory.
Ask the AppSec agentic assistant agent
From the VCS Organizations table, click the Agentic Assistant icon and select Application Security from the agents menu to query organization-specific insights.
Additionally, you can click Ask AI in the side panel to access the Agentic agent.
Asset card tabs
Navigate through the following tabs in the side panel to review the organization context and security posture. This helps prioritize remediation efforts based on the aggregated risk profile, repository count, and business criticality:
- Overview tab: Displays the severity breakdown of security issues associated with the VCS organization, aggregated from all child repositories and CI/CD instances. It includes the following highlights:
- Repository Count: The total number of repositories within the organization, providing scale context for the governance boundary
- Coverage Percentage: The ratio of scanned repositories to total repositories, indicating how much of the organization is under active security monitoring
- Internet Exposed: Whether the organization contains repositories that ultimately power publicly reachable cloud endpoints, flagging organizations that should be prioritized for security review
- Identity tab: Provides a view of users within the VCS Organization, outlining their access levels and the repositories they are collaborators on, along with the timestamp of the latest commit for each repository
Investigate and remediate issues
You can investigate specific security findings directly from the asset side panel. From the Configurations tab, select specific configuration issues or cases associated with the VCS organization.
Selecting an issue opens a dedicated issue side card directly over the inventory view. The issue side card displays detailed information including the severity level and remediation guidance, enabling you to review and apply remediation guidance without losing your place in the asset inventory.
You can also access the full Issues page (Application Security → Issues) with filters pre-applied for the VCS organization. The full Issues page provides additional capabilities not available in the side panel.
Execute asset actions
After reviewing the organization's health, you can perform the following operations from the Actions menu in the side panel.
- Open in Provider: Click Open in Provider to navigate directly to the VCS platform console (for example, the GitHub organization page or the GitLab group page) at the organization URL
- View asset data: Click View asset data to view raw VCS organization asset data in
JSON(default) ortree viewformats to assist with custom integrations, XQL queries, or API operations
CI/CD pipeline assets
Cortex XSIAM discovers and inventories every CI/CD pipeline associated with onboarded repositories and connected CI/CD integrations. Each pipeline detected through CI/CD scanning — whether a GitHub Actions workflow, GitLab CI pipeline, Jenkins pipeline, Azure Pipeline, Bitbucket Pipeline, or CircleCI pipeline, appears in the unified asset inventory as the governed bridge between source code and production deploymentsthe governed bridge between source code and production deployments, carrying its identity metadata, CI/CD provider, parent repository, CI/CD instance association, build activity, security health, and downstream deployment lineage.
The CI/CD pipeline asset enables security teams to answer three questions about every build and deploy workflow: what pipelines exist in the organization, what is the security posture of each pipeline configuration, and which production workloads does each pipeline deploy.
Note
Scope: The CI/CD pipeline asset represents a CI/CD pipeline definition associated with an onboarded repository or CI/CD integration. The CI/CD pipeline asset captures the pipeline configuration and build activitypipeline configuration and build activity as discovered through CI/CD scanning. The CI/CD pipeline asset does not represent individual pipeline runs, build logs, or CI/CD scan results; pipeline runs are tracked as scan events, and CI/CD risk findings are managed as issue types under Application Security Issues. The CI/CD pipeline asset does not represent CI/CD instances (e.g., Jenkins servers, GitHub organizations); CI/CD instances are managed as a separate asset category.The repository asset represents a VCS repository onboarded into Cortex XSIAM. The repository asset does not represent container image repositories, artifact registries, or cloud resource inventories; those asset categories are managed under the Compute and Cloud asset classes respectively.
The CI/CD pipeline asset is the foundational unit of build and deploy governance in Cortex XSIAM Application Security. The CI/CD pipeline inventory provides the identity, provider context, build activity, security health, and deployment traceability needed to manage every pipeline as a governed asset, from discovery through remediation.
Core achievements and use cases
- Pipeline discovery and identity: Every CI/CD pipeline associated with an onboarded repository or CI/CD integration is automatically discovered and registered in the unified asset inventory with a unique asset identifier, pipeline name, CI/CD provider, CI/CD instance, parent repository, and pipeline definition file path. The CI/CD pipeline asset serves as the persistent identity record for the build and deploy workflow
- Build activity tracking: Each CI/CD pipeline asset carries build activity metadata including the last build execution timestamp and job activity status. The build activity profile enables operational monitoring, identifying active pipelines deploying to production versus dormant pipelines with no recent build activity
- Code to cloud deployment lineage: The CI/CD pipeline asset is the critical bridge node in the Code to cloud graph, linking the repository (code origin) to deployed runtime assets (container images, VM images, cloud resources). The lineage transforms the pipeline from an isolated workflow definition into a governed deployment component with production impact visibility
- Coverage measurement: The Command Center tracks the scanning coverage status of your CI/CD pipelines (e.g., Fully covered, Partially covered, or Uncovered). This coverage visibility enables AppSec Managers to identify blind spots in their CI/CD integrations and ensure that pipelines deploying critical workloads are actively monitored for configuration risks
- CI/CD risk detection: The CI/CD pipeline asset carries a security health profile aggregating CI/CD configuration risk findings from the CI/CD scanner into a severity breakdown — the count of Critical, High, Medium, and Low issues. CI/CD risk findings map to the OWASP CI/CD Top 10 framework, covering categories such as insufficient flow control, inadequate identity and access management, dependency chain abuse, poisoned pipeline execution, and insufficient credential hygiene
Functional responsibilities
The CI/CD pipeline asset model facilitates a structured delegation between governance and operations:
- AppSec managers (Governance): Review the CI/CD pipeline inventory to identify pipelines with systemic configuration risks mapped to the OWASP CI/CD Top 10, assess provider-level coverage gaps, and evaluate the ratio of pipelines deploying to production. Define unified policies using the CI/CD Configuration Scan policy type to enforce pipeline security standards across all onboarded CI/CD integrations. Prioritize remediation based on deployment status, internet exposure, business criticality, and the concentration of Critical and High severity CI/CD risk findings per pipeline
- AppSec practitioners (Operations): Investigate CI/CD pipeline configuration risks and apply remediation guidance directly in the pipeline definition file. Trace pipelines to deployed container images and cloud resources through the Code-to-Cloud graph to assess blast radius. Monitor build log scanning results for leaked secrets. Track remediation progress through resolution statuses and SLA compliance
Relationship model
Cortex XSIAM models the following relationships between the CI/CD pipeline asset and other asset categories to provide full supply chain visibility in the Code-to-Cloud relationship graph. The CI/CD pipeline connects the repository (where code is stored) to deployed runtime assets (where code runs in production).
| Related asset category | Inherited metadata and description |
|---|---|
| Repository (Parent) | The repository containing the CI/CD pipeline definition file. The repository asset is the code origin of the pipeline in the Code to cloud graph. The CI/CD pipeline inherits the repository Applications association, Business Criticality, and tags |
| CI/CD instance (Parent) | The CI/CD platform instance that hosts and executes the pipeline (such as Jenkins server, GitHub Actions organization). The CI/CD Instance asset aggregates security posture across all pipelines within the instance. The CI/CD pipeline inherits the CI/CD Instance provider type and organizational context |
| CI/CD pipeline (Sibling) | Other CI/CD pipelines defined in the same parent repository or hosted on the same CI/CD instance. Sibling pipelines share the same repository Applications association and tags |
| Container image (Downstream) | Container images built by the CI/CD pipeline. The Code-to-Cloud graph traces the build lineage from the pipeline to the container image in the registry. The container image inherits the pipeline build context for deployment lineage tracking |
| VM image (Downstream) | VM images built by the CI/CD pipeline through tools such as Packer, Azure Image Builder and GCP VM Image Builds. The VM image inherits the pipeline build context for deployment lineage tracking |
| Cloud resource (Downstream) | Cloud resources deployed by the CI/CD pipeline. The Code-to-Cloud graph traces the deployment lineage from the pipeline to the runtime cloud resource. The cloud resource inherits the pipeline deployment context |
Repository assets inventory
To view and manage CI/CD pipeline assets, you must have:
- At least one Version Control System (GitHub, GitLab, Bitbucket, Azure DevOps) integrated and active and at least one repository onboarded through the VCS integration and visible in the asset inventory.
- At least one CI/CD integration active (GitHub Actions, GitLab CI, Jenkins, Azure Pipelines, Bitbucket Pipelines, CircleCI, Argo CD, AWS CodeBuild). CI/CD pipelines are discovered through active CI/CD integrations.
- At least one completed periodic scan that includes CI/CD configuration scanning results
To access repository assets, go to Inventory, select All Assets → Code → CI/CD Pipelines.
The CI/CD pipelines assets page includes a dashboard and an inventory table.
CI/CD pipeline dashboard
The dashboard includes a widget displaying the connected CI pipeline providers (such as GitHub Actions, GitLab CI, and Jenkins) and the number of pipelines found in each provider. Selecting an item in the widget filters the table accordingly.
CI/CD pipeline asset table
The following table describes the default exposed properties of the CI/CD pipeline asset table. Select Menu Settings to view additional hidden properties (such as Last Job Execution Time and File Contributors).
| Property | Description |
|---|---|
| Name | The name of the CI/CD pipeline as discovered from the CI/CD integration. The Pipeline Name serves as the primary identifier for the CI/CD pipeline asset |
| Provider | The CI/CD platform hosting the pipeline (for example, GitHub Actions, GitLab CI, Jenkins, Azure Pipelines, Bitbucket Pipelines, CircleCI, Argo CD, AWS CodeBuild) |
| CI Instance | The CI/CD platform instance that executes the pipeline (for example, the Jenkins server name, the GitHub organization, the GitLab group) |
| Repository | The parent repository containing the CI/CD pipeline definition file |
| Provider | The VCS provider hosting the parent repository (GitHub, GitLab, Bitbucket, Azure DevOps) |
| CI File Path | The path to the pipeline definition file within the repository (for example, .github/workflows/build.yml, .gitlab-ci.yml, Jenkinsfile) |
| Business Application Names | The business applications associated with the CI/CD pipeline, inherited from the parent repository, including business criticality ratings |
Filter and prioritize repositories
The CI/CD Pipelines page displays a table of all CI/CD pipeline assets discovered through active CI/CD integrations. Apply filters to narrow results based on operational and security metadata.
To effectively reduce the organization CI/CD risk surface, apply the following filter combinations to prioritize remediation efforts:
- Prioritize active deployment workflows: Filter by Last Job Execution column (most recent first) to surface pipelines that are actively running. This ensures you are prioritizing remediation efforts on live, active workflows rather than dormant codebases
- Scope by CI/CD provider: Use the CI/CD Provider filter (or dashboard widget) to isolate the inventory by provider (for example, GitHub Actions or Jenkins) to evaluate provider-specific misconfigurations and enforce platform-level security standards
Repository inventory table actions
Right-click on a row in the inventory table to take the following actions:
- Open in new tab: Opens the description tab of the asset for detailed analysis of the issue
- View asset data: Opens a new pop-up window displaying the data retrieved for the asset during the most recent scan in either JSON (default) or tree view. This raw data provides a comprehensive and unformatted view of the asset's properties and attributes as they were initially ingested
- Copy text to clipboard: Copies the selected text to the clipboard
- Copy entire row: Copies the entire selected row data
- Show/hide rows: Stand on data in a row and filter the entire inventory to show or hide assets based on the selected attribute
- Open in Cortex Assistant/Open in Cortex Agentic Assistant: Opens the repository in Cortex Assistant or Cortex Agentic Assistant.
CI/CD pipeline assets details
Select a CI/CD pipeline row in the table to open its side panel. This provides a consolidated workspace for investigating pipeline definitions and security posture without navigating away from the asset inventory. The health profile represents the current security state of the pipeline configuration.
Ask the AppSec agentic assistant agent
From the CI/CD Pipelines table, right-click a pipeline row → Open in Agentic Assistant → Application Security from the agents menu. You can then query pipeline-specific insights.
You can also access the agent in the side panel by clicking the Ask AI icon.
Asset card tabs
Navigate through the following tabs in the side panel to review the pipeline context and lineage. This helps prioritize remediation efforts based on application criticality and assess the potential production impact of misconfigurations:
- Overview tab: Displays key pipeline properties, including highlights allowing you to prioritize pipelines including Deployed to runtime, indicating it actively deploys workloads to production, Internet Exposed, indicating the deployed workloads produced by the pipeline are publicly reachable from the internet, Public, indicating the pipeline or its parent repository has public visibility, and Deprecated, indicating the pipeline or associated components are deprecated. In addition, highlights the severity breakdown of CI/CD configuration risk issues associated with the pipeline
- Deployed to runtime, indicating it actively deploys workloads to production
- Internet Exposed, indicating the deployed workloads produced by the pipeline are publicly reachable from the internet
- Public, indicating the pipeline or its parent repository has public visibility
- Deprecated, indicating the pipeline or associated components are deprecated
- Issue severity, the severity breakdown of CI/CD configuration risk issues associated with the pipeline
- Applications tab: Lists the business applications associated with the CI/CD pipeline (inherited from the parent repository), including business criticality ratings and risk scores
- Instances tab: Displays the CI/CD instances associated with the pipeline. Select an instance to view its details without navigating away
-
Code to Cloud tab: Displays the Code to cloud relationship graph, visualizing the lineage from the CI/CD pipeline through the parent repository to deployed container images, VM images, and cloud resources
Note
This requires active CI/CD integrations and successful build log analysis. Pipelines without successful build log analysis display only the repository and pipeline nodes
Investigate and remediate issues
You can investigate specific security findings directly from the asset side panel. From the Overview tab, you can select specific issues or cases associated with the pipeline.
Selecting an issue opens a dedicated issue side card directly over the inventory view. This allows you to review detailed information, including the detection rule, severity level, OWASP CI/CD Top 10 category mapping, and evidence, and apply remediation guidance without losing your place in the asset inventory.
Note
Navigate to the dedicated Application Security → Issues → CI/CD Risks page to manage the remediation lifecycle at scale through bulk status updates, team assignments, and SLA tracking for compliance monitoring.
Execute asset actions
After reviewing the pipeline health, you can click View asset data to view raw pipeline data in JSON (default) or tree view formats to assist with custom integrations, XQL queries, or API operations. View asset data is available from either the side panel Actions menu or by right-clicking the resource in the main table.
Limitations
| Limitation | Description |
|---|---|
| CI/CD integration required | CI/CD pipeline assets are only created through active CI/CD integrations. Repositories without connected CI/CD integrations do not generate CI/CD pipeline assets |
| Provider support scope | CI/CD pipeline discovery is limited to supported providers: GitHub Actions, GitLab CI, Jenkins, Azure Pipelines, Bitbucket Pipelines, CircleCI, Argo CD, AWS CodeBuild, TeamCity, and Travis CI |
| Code to cloud mapping dependency | The code to cloud graph requires successful build log analysis to trace the full lineage from the pipeline to deployed runtime assets |
| Build activity data freshness | Build activity metadata (Last job execution, Job Activity) is updated during periodic scans and CI/CD integration synchronization |
| Build log secret scanning scope | Build log scanning detects secrets printed during pipeline execution. Not all CI/CD providers support build log ingestion |
| CI/CD configuration scan policy restrictions | The CI/CD configuration scan policy type supports only the periodic scan trigger |
CI/CD instances assets
Cortex XSIAM discovers and inventories every CI/CD platform instance connected through active CI/CD integrations. Each CI/CD instance, whether a Jenkins server, GitHub Actions organization, GitLab CI group, Azure DevOps organization, or CircleCI organization, appears in the unified asset inventory as the platform-level entity that hosts and executes CI/CD pipelinesthe platform-level entity that hosts and executes CI/CD pipelines, carrying its identity metadata, CI/CD provider, platform version, instance URL, associated pipelines, and aggregated security health.
The CI/CD instance asset enables security teams to answer three questions about every CI/CD platform: what CI/CD platforms exist in the organization, what is the security posture of each platform, and which pipelines does each platform host.
Note
Scope: The CI/CD instance asset represents a CI/CD platform instance discovered through an active CI/CD integration. The CI/CD instance asset captures the platform identity, version, and aggregated security postureplatform identity, version, and aggregated security posture across all pipelines hosted on the instance. The CI/CD instance asset does not represent individual CI/CD pipelines, pipeline runs, or build logs; individual pipelines are managed as a separate asset category (CI/CD Pipeline), and pipeline runs are tracked as scan events. The CI/CD instance asset does not represent VCS organizations; VCS organizations are managed under the VCS Organization asset category. The CI/CD pipeline asset represents a CI/CD pipeline definition associated with an onboarded repository or CI/CD integration. The CI/CD pipeline asset captures the pipeline configuration and build activitypipeline configuration and build activity as discovered through CI/CD scanning. The CI/CD pipeline asset does not represent individual pipeline runs, build logs, or CI/CD scan results; pipeline runs are tracked as scan events, and CI/CD risk findings are managed as issue types under Application Security Issues. The CI/CD pipeline asset does not represent CI/CD instances (e.g., Jenkins servers, GitHub organizations); CI/CD instances are managed as a separate asset category. The repository asset represents a VCS repository onboarded into Cortex XSIAM. The repository asset does not represent container image repositories, artifact registries, or cloud resource inventories; those asset categories are managed under the Compute and Cloud asset classes respectively.
The CI/CD instance asset is the foundational unit of platform-level CI/CD governance in Application Security. The CI/CD instance inventory provides the identity, provider context, platform version, aggregated security health, and pipeline visibility needed to manage every CI/CD platform as a governed asset; from discovery through remediation..
Core achievements
- Instance discovery and identity: Every CI/CD platform instance connected through a CI/CD integration is automatically discovered and registered in the unified asset inventory with a unique asset identifier, instance name, CI/CD provider, and instance URL. The CI/CD instance asset serves as the persistent identity record for the CI/CD platform
- Instance-level security posture aggregation: The CI/CD instance asset carries a security health profile aggregating CI/CD configuration risk findings from the CI/CD Risks scanner into a severity breakdown , the count of Critical, High, Medium, and Low issues. Instance-level aggregation provides a platform-wide security view that surfaces systemic configuration risks affecting all pipelines hosted on the instance
- Pipeline aggregation and visibility: The CI/CD instance asset provides direct visibility into all CI/CD pipelines hosted on the instance through the Pipelines tab, enabling platform-level pipeline management and cross-pipeline risk assessment
- Coverage measurement: The Coverage page tracks the scanning coverage status of CI/CD instances, enabling AppSec Managers to identify CI/CD platforms that are not actively monitored for configuration risks
Functional responsibilities
The CI/CD instance asset model facilitates a structured delegation between governance and operations:
- AppSec managers (Governance): Review the CI/CD instance inventory to identify platform-level configuration risks mapped to the OWASP CI/CD Top 10, assess provider-level coverage gaps, and evaluate the security posture of each CI/CD platform across the organization. Define unified policies using the CI/CD Configuration Scan policy type to enforce platform security standards across all onboarded CI/CD integrations. Prioritize remediation based on the concentration of Critical and High severity CI/CD risk findings per instance
- AppSec practitioners (Operations): Investigate CI/CD instance configuration risks and apply remediation guidance at the platform level. Navigate from the CI/CD instance to individual pipelines hosted on the instance to assess pipeline-level risks. Track remediation progress through resolution statuses and SLA compliance
Relationship model
Cortex XSIAM models the following relationships between the CI/CD instance asset and other asset categories to provide organizational context and aggregate security posture.
| Related asset category | Inherited metadata and description |
|---|---|
| VCS organization (Parent) | The VCS organization that the CI/CD instance is associated with (for example, the GitHub organization that hosts GitHub Actions workflows). The CI/CD instance is attached to the VCS organization for organizational context. The CI/CD instance inherits the VCS organization provider type and organizational context |
| CI/CD pipeline (Child) | CI/CD pipelines hosted and executed by the CI/CD instance. The instance aggregates security posture across all child pipelines. Child pipelines inherit the CI/CD instance provider type. The CI/CD instance aggregates pipeline-level CI/CD risk findings into the instance-level security health profile |
CI/CD instance assets inventory
To view and manage CI/CD instance assets, you must have:
- At least one CI/CD integration active (GitHub Actions, GitLab CI, Jenkins, Azure Pipelines, Bitbucket Pipelines, CircleCI, Argo CD, AWS CodeBuild). CI/CD instances are discovered through active CI/CD integrations.
- At least one completed periodic scan that includes CI/CD configuration scanning results
To access repository assets, go to Inventory, select All Assets → Code → CI/CD Instances.
The CI/CD instances assets page includes a dashboard and an inventory table.
CI/CD pipeline dashboard
The dashboard includes a widget displaying the connected CI/CD providers (such as Jenkins, GitHub Actions, and GitLab CI) and the number of instances found in each provider. Selecting an item in the widget filters the table accordingly.
CI/CD pipeline asset table
The following table describes the default exposed properties of the CI/CD instance asset table. Select Menu Settings to view additional hidden properties.
| Property | Description |
|---|---|
| Name | The name of the CI/CD instance as discovered from the CI/CD integration. The Instance Name serves as the primary identifier for the CI/CD instance asset |
| Provider | The CI/CD platform type hosting the instance (Jenkins, GitHub Actions, GitLab CI, Azure Pipelines, CircleCI), displayed with a provider icon |
| URL | The direct URL to the CI/CD platform instance (for example, https://jenkins.company.com, https://github.com/my-org). The Instance URL enables direct navigation to the CI/CD platform console |
| Last Observed | The date and time when the CI/CD instance was most recently detected or synchronized by the active CI/CD integration. This timestamp helps verify that the integration is actively monitoring the platform |
| Pipeline Count | The total number of CI/CD pipelines hosted and executed by the CI/CD instance. This metric helps assess the scale, usage, and potential blast radius of the platform |
Filter and prioritize repositories
The CI/CD Instances page displays a table of all CI/CD instance assets discovered through active CI/CD integrations. Apply filters to narrow results based on operational and security metadata.
To effectively reduce the organization CI/CD risk surface, apply the following filter combinations to prioritize remediation efforts:
- Scope by CI/CD provider: Use the Provider filter (or dashboard widget) to isolate the inventory by provider (for example, Jenkins or GitHub Actions) to evaluate provider-specific misconfigurations and enforce platform-level security standards
- Assess blast radius by pipeline count: Review the Pipeline Count attribute to identify the CI/CD instances hosting the largest number of pipelines. Securing these high-volume platforms effectively reduces risk across a broader segment of your development lifecycle
Repository inventory table actions
Right-click on a row in the inventory table to take the following actions:
- Open in new tab: Opens the description tab of the asset for detailed analysis of the issue
- View asset data: Opens a new pop-up window displaying the data retrieved for the asset during the most recent scan in either JSON (default) or tree view. This raw data provides a comprehensive and unformatted view of the asset's properties and attributes as they were initially ingested
- Copy text to clipboard: Copies the selected text to the clipboard
- Copy entire row: Copies the entire selected row data
- Show/hide rows: Stand on data in a row and filter the entire inventory to show or hide assets based on the selected attribute
- Open in Cortex Assistant/Open in Cortex Agentic Assistant: Opens the repository in Cortex Assistant or Cortex Agentic Assistant.
Click the download icon (showing Export to file when hovering over the icon) in the top right of any asset page to export the asset data.
CI/CD instance assets details
Select a CI/CD instance row in the table to open its side panel. This provides a consolidated workspace for investigating platform-level security posture without navigating away from the asset inventory. The health profile represents the current security state of the CI/CD platform configuration.
Ask the AppSec agentic assistant agent
From the CI/CD Instances table, select the Agentic Agentic icon and then select Application Security from the agents menu. You can then query instance-specific insights.
You can also access the agent in the side panel by clicking the Ask AI icon.
Asset card tabs
Navigate through the following tabs in the side panel to review the instance context. This helps prioritize remediation efforts based on platform criticality and assess the potential impact of misconfigurations:
- Overview tab: Displays key instance properties, including the provider type, instance URL, and platform version. Also shows the severity breakdown of CI/CD configuration risk issues associated with the instance
- Pipelines tab: Displays all CI/CD pipelines hosted on the CI/CD instance. Select a pipeline row to open the CI/CD pipeline asset side panel for cross-asset investigation without navigating away from the CI/CD instance context
- Compliance tab: Displays the compliance posture of the CI/CD instance against relevant industry frameworks and security benchmarks
Investigate and remediate issues
You can investigate specific security findings directly from the asset side panel. From the Overview tab, you can select specific issues or cases associated with the CI/CD instance, or you can investigate risks by category using the dedicated issues tab.
| Tab name | Description |
|---|---|
| CI/CD Configuration | Displays CI/CD configuration risk findings detected at the instance level by the CI/CD scanner. Each risk finding includes the detection rule identifier, risk name and description, severity level, OWASP CI/CD Top 10 category mapping, and evidence sentence with linked metadata |
Selecting an issue opens a dedicated issue side card directly over the inventory view. This allows you to review detailed information, including the detection rule, severity level, OWASP CI/CD Top 10 category mapping, and evidence, and apply remediation guidance without losing your place in the asset inventory.
Note
Navigate to the dedicated Application Security → Issues → CI/CD Risks page to manage the CI/CD risks remediation lifecycle at scale through bulk status updates, team assignments, and SLA tracking for compliance monitoring.
Execute asset actions
After reviewing the instance health, you can perform the following operations:
- Open in Provider: Available from the side panel Actions menu. Click Open in Provider to navigate directly to the CI/CD platform console at the instance URL (for example, the Jenkins dashboard or the GitHub organization page)
- View asset data: Available from either the side panel Actions menu or by right-clicking the resource in the main table. Click View asset data to view raw instance data in JSON (default) or tree view formats to assist with custom integrations, XQL queries, or API operations
Limitations
| imitation | Description |
|---|---|
| CI/CD integration required | CI/CD instance assets are only created through active CI/CD integrations. Disconnected or removed CI/CD integrations result in the CI/CD instance asset no longer receiving updated scan data |
| Provider support scope | CI/CD instance discovery is limited to supported providers: Jenkins, GitHub Actions, GitLab CI, Azure Pipelines, and CircleCI. CI/CD platforms on unsupported providers are not discovered as instance assets |
| No Code-to-Cloud lineage | The CI/CD instance asset does not directly participate in the Code-to-Cloud relationship graph. Code-to-Cloud lineage is tracked at the CI/CD pipeline level, not the instance level |
| Instance URL availability | The Instance URL property is populated only when the CI/CD integration provides the platform URL. Instances without a discoverable URL display an empty Instance URL field |
| Version data availability | The Version property is populated only for CI/CD providers that expose platform version metadata through the integration (for example, Jenkins). Not all CI/CD providers expose version information |
| CI/CD Configuration Scan policy restrictions | The CI/CD Configuration Scan policy type supports only the Periodic Scan trigger. PR Scan, CI Code Scan, CI Image Scan, and Image Registry Scan triggers are not available for CI/CD Configuration Scan policies |
| Security posture aggregation scope | The instance-level security health profile aggregates CI/CD configuration risk findings only. Vulnerability, code weakness, and secrets findings are tracked at the repository and pipeline levels, not the instance level |
| Limitation | Description |
|---|---|
| CI/CD integration required | CI/CD instance assets are only created through active CI/CD integrations. Disconnected or removed CI/CD integrations result in the CI/CD instance asset no longer receiving updated scan data |
| Provider support scope | CI/CD instance discovery is limited to supported providers: Jenkins, GitHub Actions, GitLab CI, Azure Pipelines, and CircleCI. CI/CD platforms on unsupported providers are not discovered as instance assets |
| No Code-to-Cloud lineage | The CI/CD instance asset does not directly participate in the Code-to-Cloud relationship graph. Code-to-Cloud lineage is tracked at the CI/CD pipeline level, not the instance level |
| Instance URL availability | The Instance URL property is populated only when the CI/CD integration provides the platform URL. Instances without a discoverable URL display an empty Instance URL field |
| Version data availability | The Version property is populated only for CI/CD providers that expose platform version metadata through the integration (for example, Jenkins). Not all CI/CD providers expose version information |
| CI/CD Configuration Scan policy restrictions | The CI/CD Configuration Scan policy type supports only the Periodic Scan trigger. PR Scan, CI Code Scan, CI Image Scan, and Image Registry Scan triggers are not available for CI/CD Configuration Scan policies |
| Security posture aggregation scope | The instance-level security health profile aggregates CI/CD configuration risk findings only. Vulnerability, code weakness, and secrets findings are tracked at the repository and pipeline levels, not the instance level |
Software package assets
Cortex XSIAM discovers and inventories every open-source and third-party software package declared in dependency manifest files across onboarded repositories. Each package detected through Software Composition Analysis (SCA) scanning appears in the unified asset inventory as a governed component of the software supply chain, carrying its identity metadata, version, license type, dependency classification, operational risk rating, and associated CVE vulnerabilities.
The software package asset enables security teams to answer three questions about every dependency: What third-party code does the codebase consume? What is the operational and license risk of each dependency? What known vulnerabilities does each dependency introduce?
Note
- Scope: The software package asset represents an open-source or third-party dependency discovered through SCA scanning of onboarded repositories. The software package asset does not represent first-party application code, container image layers, or cloud runtime packages; those asset categories are managed under their respective asset classes.
- Programmatic SBOM export: To support supply chain auditing and compliance workflows, the dependency data inventoried here can be programmatically exported as a machine-readable Software Bill of Materials (SBOM). For automation details, refer to APIs for SBOM management..
The software package asset is the foundational unit of supply chain governance in Cortex XSIAM. The software package inventory provides the identity, dependency context, operational risk, and vulnerability telemetry needed to manage every third-party dependency as a governed asset, from discovery through remediation.
Core achievements and use cases
- Dependency discovery and identity: Every open-source package declared in a dependency manifest file is automatically discovered and registered in the unified asset inventory with a unique asset identifier, package name, version, package manager, and programming language to serve as the persistent identity record
- Supply chain visibility: The asset provides a complete view of the third-party code consumed by each repository, including direct and transitive dependencies, enabling teams to identify which direct dependency introduced a vulnerable leaf package
- Operational risk assessment: Each asset carries a risk rating derived from maintenance activity, community popularity, and deprecation status to identify libraries that pose a risk independent of known CVEs
- License compliance: The inventory surfaces license types to enable enforcement of organizational policies against strong copyleft or non-permissive licenses
- Code to cloud lineage: The package asset participates in the relationship graph as a child of the repository, establishing traceability from the code declaration through to deployed cloud resources
Functional responsibilities
The software package asset model facilitates a structured delegation between Governance and Operations:
- AppSec managers (Governance): Review the inventory to identify systemic supply chain risks such as deprecated packages or license violations and define unified policies to enforce compliance standards
- AppSec practitioners (Operations): Investigate package-level vulnerabilities, trace dependency chains to identify root causes, and upgrade or replace vulnerable packages to meet SLA requirements
Relationship model
Cortex XSIAM models the following relationships between the software package asset and other asset categories::
| Related asset category | Inherited metadata and description |
|---|---|
| Repository (Parent) | The repository that declares the software package in a dependency manifest file, providing the inherited business criticality and application association |
| Software package (Sibling) | Other software packages declared in the same repository that share the same repository context and tags |
| CVE vulnerability issue (Downstream) | CVE vulnerabilities detected in the software package by the SCA scanner |
| License issue (Downstream) | License compliance violations detected in the software package by the SCA scanner |
| Operational risk issue (Downstream) | Operational risk findings such as deprecation or low maintenance detected in the software package |
Limitations
Review the following limitations before investigating and managing software package assets:
| Limitation | Description |
|---|---|
| SCA scanner required | Software package assets are only created through SCA scanning. Repositories with the SCA scanner disabled do not generate software package assets in the asset inventory |
| Dependency manifest scope | Software packages are discovered from dependency manifest files, so packages installed through non-standard mechanisms, vendored dependencies, or dynamically resolved dependencies may not be detected |
| Transitive dependency depth | The depth of transitive dependency resolution depends on the package manager and the dependency manifest format |
| Operational risk data freshness | Operational risk ratings are updated during periodic scans and may not reflect real-time changes in the package registry between scan cycles |
| License detection accuracy | License types are extracted from package metadata in the registry, meaning packages with missing or ambiguous declarations may display incomplete information, and manual verification is recommended for compliance |
| Third-party SCA data integration scope | Third-party SCA integrations contribute CVE vulnerability findings to software package assets but do not create the assets in the inventory, nor do they provide operational risk or license data |
Software packages assets inventory
To view and manage software package assets, you must have: at least one Version Control System (GitHub, GitLab, Bitbucket, Azure DevOps) integrated and active.
- At least one Version Control System (GitHub, GitLab, Bitbucket, Azure DevOps) integrated and active.
- The SCA scanner enabled for the target repositories.
- At least one completed periodic scan or PR scan that includes SCA scanning results.
To access repository assets, go to Inventory, select All Assets → Code → Software Packages.
Software packages dashboard
The dashboard includes two widgets:
- Package Managers: A breakdown showing the package managers (such as npm and pip) in your environment, and the number of software packages found in each package manager
- Dependency Types: A breakdown showing the amount of direct and transitive (indirect) software packages
Selecting an item in either widget filters the software package asset inventory accordingly.
Software packages asset table
The following table describes the default exposed properties of the software packages asset table. Select the column picker to view additional properties.
| Property | Description |
|---|---|
| Name | The name of the software package serving as the primary identifier |
| Version | The version of the software package |
| Licenses | The license types associated with the package displayed as a comma-separated list |
| Dependency Type | Whether the package is a Direct or Transitive dependency |
| Provider | The VCS provider hosting the parent repository |
| File Path | The path to the dependency manifest file containing the package declaration, including the affected line range |
| First Seen | The timestamp when the software package was first discovered in the asset inventory |
Filter and prioritize VCS organizations
The Software Packages page displays a table of all dependencies. Use the search bar to find packages by name, or apply filters to narrow results based on operational and security metadata.
To effectively reduce the organization supply chain risk surface, apply the following filter combinations to prioritize remediation efforts:
- Target critical business applications with high severity vulnerabilities: Filter packages associated with your most sensitive workloads by using the Business Application Names filter to select the specific business applications you know are critical, and then reviewing the affected packages for high-severity issues
- Identify deprecated packages: Filter by Operational Risk indicators to surface deprecated packages that represent a structural supply chain risk regardless of current CVE status and should be replaced
- Find restrictive licenses: Use the Licenses column filter to identify packages with strong copyleft licenses or non-permissive licenses that may violate organizational compliance policies
- Isolate transitive risk: Filter by Dependency Type = Transitive to identify indirect dependencies that introduce risk without direct developer control
Software packages inventory table actions
Right-click on a row in the inventory table to take the following actions:
- Open in new tab: Opens the description tab of the asset for detailed analysis of the issue
- View asset data: Opens a new pop-up window displaying the data retrieved for the asset during the most recent scan in either JSON (default) or tree view. This raw data provides a comprehensive and unformatted view of the asset's properties and attributes as they were initially ingested
- Copy text to clipboard: Copies the selected text to the clipboard
- Copy entire row: Copies the entire selected row data
- Show/hide rows: Stand on data in a row and filter the entire inventory to show or hide assets based on the selected attribute
- Open in Cortex Assistant/Open in Cortex Agentic Assistant: Opens the repository in Cortex Assistant or Cortex Agentic Assistant.
Click the download icon (showing Export to file when hovering over the icon) in the top right of any asset page to export the asset data.
Software packages asset details
Select a software package row in the table to open its side panel.
Ask the AppSec agentic assistant agent
From the Software Packages table, right-click a software package > Open in Agentic Assistant > select Application Security from the agents menu, and query package-specific insights (for example, vulnerability summaries, risk posture, or remediation guidance). This action is also available from the software package side panel.
Additionally, you can click Ask AI in the side panel to access the Agentic agent.
Asset card tabs
Navigate through the following tabs in the side panel to review the package context and trace its impact across the supply chain:
- Overview tab: Displays a high-level summary of the package details alongside the severity breakdown of CVE vulnerabilities associated with the software dependency
- Applications tab: Displays the business applications associated with the software package, inherited from the parent repository, including business criticality ratings and risk scores
- Code tab: Displays the dependency tree visualization showing the dependency chain from root direct dependencies to the selected package, and highlights the package declaration in the manifest file
- Code to Cloud tab: Displays the relationship graph visualizing the full lineage from the software package through the parent repository to deployed cloud workloads. For more information on Code to Cloud, refer to Code to Cloud.
Use the Code to Cloud graph to assess the blast radius of a package vulnerability by tracing which CI/CD pipelines build artifacts from the parent repository and which production container images consume the affected dependency
Investigate and remediate issues
To investigate security findings for a software package, you can click on issues or cases directly from the Overview tab. This navigates you away from the asset inventory to the main Cases or Issues pages filtered specifically by this package.
Alternatively, the side panel organizes issues into dedicated tabs so you can investigate and remediate without navigating away. Selecting a finding in these dedicated tabs opens an issue side panel to view detailed information, including the attack vector, impact description, and fix version recommendation.
| Tab Name | Description |
|---|---|
| Vulnerabilities | Displays CVE vulnerabilities detected in the software package by the SCA scanner, including the CVSS score, severity, and fix version recommendation. Refer to Software Composition Analysis (SCA) vulnerability issues for more information |
| Package Integrity | Displays operational risk indicators like deprecation status and low maintenance activity, alongside license compliance violations. Refer to Package integrity issues for more information |
Execute asset actions
After reviewing the package health, you can perform the following operations from the Actions menu in the side panel or directly from the inventory tableL
- Open in Provider: From the Overview tab in the side panel, click the value under Repository to open the repository in the Repositories table which includes the software package for further investigation, such as assessing the business impact of the affected codebase
- Open in GitHub: From the menu in the side panel, click the value under Repository to open the parent repository directly in GitHub to view the source code and manifest file where the dependency is declared
- View asset data: Right-click on a row in the table and select View asset data to display package data in JSON or Tree View formats to assist with custom integrations or XQL queries
Compute assets
The Compute Inventory provides a detailed overview of your compute resources, including virtual machines, containers, serverless functions, Kubernetes clusters, general devices, and other compute assets across your environment.
Compute categories
Navigate to Inventory → All Assets → Compute to view an aggregated summary or to filter your inventory by the following specific categories:
| Asset category | Description |
|---|---|
| All Compute Assets | An aggregated summary view of all your compute resources. |
| CaaS Resources | Provides full inventory visibility for managed container services across AWS, GCP, and Azure. For AWS container services, related issues are displayed. The dedicated dashboard features interactive widgets summarizing the distribution by cloud provider and resource type. |
| Container Registries | Services used for publishing, maintaining, and securely distributing container images. Supported registries include managed cloud registries (AWS ECR, Azure ACR, Google GAR, and OCI) and third-party integrations (Docker Hub, Docker V2 compliant registries, GitLab, Harbor, JFrog, Sonatype Nexus). |
| Container Images | Fundamental, immutable assets that package applications and are uniquely identified by a SHA256 digest. |
| Container Instances | Assets dynamically added to the inventory when a drift is detected between a running container and its original image. |
| General Devices | Tracks physical and virtual endpoints (such as PCs, laptops, servers, and mobile devices) that are protected by an installed Cortex XDR agent. |
| Container Image Repositories | Distinct assets representing the organizational structures within a container registry where images reside to improve management and security isolation. |
| Kubernetes Clusters | Provides a comprehensive overview of your Kubernetes (K8s) environment. |
| Kubernetes Resources | Individual Kubernetes components tracked in their own dedicated inventory view |
| Serverless Functions | Provides comprehensive visibility into the security posture of your serverless functions without the need to install agents |
| VM Instances | Tracks traditional, provider-managed virtual machines (like Amazon EC2 instances) |
| VM Images | Tracks the machine images associated with your virtualized infrastructure |
Expanded asset information
Clicking on specific compute assets in the inventory table opens a detailed Asset Card with specialized tabs for deep inspection:
CaaS Resources
CaaS Resources: Clicking a CaaS asset opens a detailed side card with specialized tabs that vary based on the specific resource type. Common tabs across CaaS assets include an Overview of highlights and properties, a Configurations tab displaying the asset configuration JSON, and a Compliance tab. Depending on the resource type, additional tabs may include:
- Identity: Provides an aggregated view of the permissions and access graphs associated with the asset
- Code: Displays the original source definition file retrieved from your cloud environment (such as a Google Cloud Run Job execution template or an Azure Container Group definition)
Note that for the actual runtime units spawned from these blueprints, the system generates CaaS Container Instance assets only when a runtime drift is detected, limiting creation to a maximum of 50 instances per workload.
Container Images
Container Images are fundamental, immutable assets that package applications and their dependencies for consistent deployment across cloud environments. Each image is uniquely identified by a SHA256 digest, ensuring content verifiability throughout its lifecycle across build, deploy, and run stages. You can assign multiple names and tags to a single container image, allowing you to reference the same image in various contexts and versions within container registries. For more information, see Container images assets.
Container Instances
Drift typically occurs in two scenarios: when an attacker gains access and fetches malicious code not present in the original image, or when a legitimate application dynamically fetches additional software as it loads at runtime. Since legitimate applications can create continuous drift across many instances, the asset inventory limits the amount of data collected by only capturing a sample of these drifted container instances for a given image. This sample provides sufficient evidence to investigate the behavior without creating unnecessary noise in the Asset Inventory. To resolve recurring non-malicious drift, you can either preload the dynamically fetched software into the original image so it can be scanned, or create an issue exception. If an exception is created, the container instances will continue to appear in the asset inventory, but they will no longer generate issues.
The asset side card includes:
- Detailed asset properties, such as container ID, image, host, cluster, and namespace.
- Relationships to the container image, pod, workload, and host machine.
- A breakdown of findings and an option to view all associated security issues.
- The ability to export the container's image and host data as a Software Bill of Materials (SBOM) in JSON or XML format.
- A Security Drift Detected highlight and a dedicated Security Drift tab, providing visibility into containers that have deviated from their base image. These drifts expose vulnerabilities, misconfigurations, compliance violations, and other security risks introduced at runtime that were not part of the base image.
General Devices
For physical and virtual endpoints, the asset card tracks vital connectivity data including Endpoint Status (Connected, Disconnected, or Lost) and Operational Status (Protected, Partially Protected, or Unprotected). Furthermore, General Devices support Host Insights, which collects extensive business and IT operational data (like installed applications, autoruns, mounted disks, local user groups, and running services) to help analysts quickly identify anomalies on the machine.
Serverless Functions
The asset inventory provides comprehensive visibility into the security posture of your serverless functions without the need to install agents or disrupt your workloads. The inventory supports AWS Lambda functions, Google Cloud Functions, and Microsoft Azure functions. The system automatically scans these functions during periodic scans or configuration modifications to detect vulnerabilities, malware, and exposed secrets early in the development process. You can proactively detect and address threats across your cloud environment using three categories of serverless function rules:
- Attack Path: Identifies combined risks, such as overly permissive roles combined with network exposure, that could be exploited to breach applications
- Config: Detects security resource misconfigurations in the function and related pipeline infrastructure
- Network Exposure: Detects internet-exposed serverless functions by leveraging monitored network configurations
Kubernetes Clusters
Select any cluster, to view all resources within it and any connected clusters. The Cluster details panel provides a detailed breakdown of assets, and the nodes within each cluster. Choose any of the following tabs for additional information:
- Click Resource Explorer to view the clusters components and identify any security breaches. Disconnected clusters do not show any data. Ensure all clusters are connected for maximum protection.
- Select the Vulnerabilities tab to to see a list of all cluster nodes. Click on any cluster to further analyze the vulnerability. You can also find specific container images in the vulnerability list and view the container images, namespaces, and associated K8s deployment. Options include:
- Container Image Vulnerability Findings: Displays all the vulnerabilities found in the container images running within the cluster. Select any cluster to view vulnerability details such as Max CVSS Severity, Associated K8s Resource Type, etc.
-
Kubernetes Nodes Vulnerability Findings: Provides a detailed view of vulnerabilities effecting the Kubernetes worker and master nodes. Select any node from the table view to see more information, such as Node type, associated Vulnerabilities, and Max CVSS Severity.
Note
The Vulnerabilities tab is only available if the cluster you wish to analyze has a K8s connector.
Select Kubernetes Connectivity Management to manage the connector-connectivity of cluster assets, including connector versions, upgrades, statuses, and more. Here, you can check if a cluster is connected, view the status, and see the connector version. You can also update to a new connector version when one is released.
Container image assets
Container Images are fundamental, immutable assets that package applications and their dependencies for consistent deployment across cloud environments. Each image is uniquely identified by a SHA256 digest, ensuring content verifiability throughout its lifecycle across build, deploy, and run stages. You can assign multiple names and tags to a single container image, allowing you to reference the same image in various contexts and versions within container registries.
Container images are represented as different asset types based on where they exist in the lifecycle. Understanding these types helps you investigate findings, track lineage, and apply policies effectively. You can also use this information to:
- query assets by image Type using graph searches or XQL
- group assets based on image classification
- apply cloud workload policies to monitor and protect your environment
The container images asset inventory provides a centralized view of all scanned container images and their details across your environments. The platform enables efficient tracking and management of your container images, ensuring compliance with security and governance standards.
The following table summarizes each container image type, its purpose, and key characteristics to help you effectively manage container images.
| Image Type | Description | Key Characteristics |
|---|---|---|
| Core Image | Represents the immutable content of the container image. | <p>Purpose:</p><ul><li>Serves as the foundational definition for all other image types: Build, Registry, and Runtime Images.</li></ul><p>Properties:</p><ul><li>Identified by a unique SHA256 digest.</li><li>Contains file-related findings such as vulnerabilities, secrets, and malware.</li><li>Has no scope and cannot directly be part of an asset group or policy, as it purely represents the image's content.</li><li>Does not include issues.</li></ul><p>Relationships with other image types:</p><ul><li>Can reference another Core Image as its base, establishing a hierarchical relationship between images.</li><li>Can be the "base of" another Core Image.</li></ul><p>User Interaction:</p><ul><li>You can query Core Image assets through XQL.</li><li>Find Core Images listed under Inventory → All Assets → Compute → Container Images</li></ul> |
| Build Image | Represents a container image created from a CI/CD pipeline or build processes. | <p>Purpose:</p><ul><li>Exists when discovered through CLI scanning in the platform.</li><li>Helps with build traceability and integrity verification.</li></ul><p>Properties:</p><ul><li>Includes build metadata such as build time, source code repository, and build environment.</li><li>Contains findings and issues related to the build image.</li></ul><p>Relationships with other image types:</p><ul><li>A Build Image represents a Core Image, and a Core Image can be represented by a Build Image.</li></ul><p>User Interaction:</p><ul><li>You can query Build Image assets through XQL.</li><li>Find Build Images listed under Inventory → All Assets → Compute → Container Images</li></ul> |
| Registry Image | Represents a container image stored within a container registry (for example, AWS ECR, Azure ACR, Google GAR, JFrog Artifactory, Docker). | <p>Purpose:</p><ul><li>Exists only when discovered through cloud discovery or registry scanning for onboarded registries.</li><li>Helps manage images within registries and ensures compliance with registry policies.</li></ul><p>Properties:</p><ul><li>Includes registry-specific findings (for example, retention policy, FQDN, repository name, image tags, manifest digests).</li></ul><p>Relationship with other image types:</p><ul><li>The container image registry contains an image repository, and a Registry Image resides within the image repository.</li><li>A Registry Image represents a Core Image, and a Core Image can be represented by a Registry Image.</li><li>A Registry Image can have a base image relationship to one or more other Registry Images, where those images act as its logical base images, as defined by a Base Images Rule.</li></ul><p>User Interaction:</p><ul><li>You can query Registry Image assets through XQL.</li><li>Find Registry Images listed under Inventory → All Assets → Compute → Container Images</li></ul> |
| Runtime Image | Represents container images stored, running, or defined in a workload asset (such as VMs, Kubernetes workloads). | <p>Purpose:</p><ul><li>Exists when discovered through Agentless Disk scan, XDR agent scan, and Kubernetes Connector.</li><li>Ensures that runtime images adhere to security policies and provides visibility into their deployment and operational state.</li></ul><p>Properties:</p><ul><li>Contains findings related to its deployment and operational state, such as configuration deviations and security policy violations. File-related findings are derived from the connected Core Image.</li></ul><p>Relationships with other images:</p><ul><li>A Runtime Image "represents" a Core Image, linking the runtime state to the immutable content of the image.</li><li>A Core Image is "represented by" a Runtime Image, ensuring that any findings related to the image files are considered during runtime evaluations.</li><li>A Runtime Image can have a base image relationship to one or more Registry Images, where those registry images act as the logical base images of the runtime image, as defined by a Base Images rule.</li></ul><p>User Interactions:</p><ul><li>You can query Runtime Image assets through XQL.</li><li>Find Runtime images listed under Inventory → All Assets → Compute → Container Images</li></ul> |
Container images asset inventory
To access container images assets, go to Inventory, select All Assets → Compute → Container Images.
The container image assets inventory provides a centralized view of all scanned container images and their details across your environments. The platform enables efficient tracking and management of your container images, ensuring compliance with security and governance standards. The container images assets page includes a dashboard with OS Distro, OS Version, and Base Image widgets displayed by default, and an inventory table. Selecting a widget automatically filters the inventory table based on the widget's criteria.
The inventory table includes the following fields. You can filter results by any heading and value:
| Fields | Description |
|---|---|
| Asset ID | A unique identifier assigned to the image. |
| Provider | The provider that hosts cloud assets, such as AWS, Azure, Docker, GCP, JFrog Artifactory, OCI, and Not Applicable (for core images). |
| Asset Type | <p>Types of container images:</p><ul><li>Core Image: Represents the immutable content of the container image itself. It is identified by a unique SHA256 digest, ensuring that any alteration to its content results in the creation of a new Core Image.</li><li>Build Image: Represents the image created from a pipeline or build process, capturing the context of the build environment and time.</li><li>Registry Image: Represents the container image stored in an artifact repository within a container registry. It exists only when discovered as part of cloud discovery or registry scan for onboarded registries.</li><li>Runtime Image: Represents container images stored, running, or defined in a workload asset (VMs, Kubernetes workloads), identified by its name and digest in the runtime environment.</li></ul> |
| Name | The container image name. |
| Image Type | Image file format. For example, Docker and OCI formats. |
| Image Identifier | A unique identifier assigned to a specific version of a container image, used to distinguish it from other images and ensure consistency across deployments. |
| Names | Aggregation of all the observed image names over time. |
| Realms | Indicates which connector the registry belongs to. For managed registries (such as ECR, GAR, and ACR), this field shows the CSP account. |
| SDLC Stages | Shows the SDLC stage when the image was created. For example, Runtime. |
| Base Image | <p>Displays the number of images derived from the base image.</p><p>For example, Base image</p> |
| Registry | The container image registry. Applies only to Registry Image assets. |
| Repository | The container image repository. Applies only to Registry Image assets. |
| Tag | The container image tag. Applies only to Registry Image assets. |
| Tags | Docker labels assigned to container images to identify and reference specific versions or variants. |
| Digest | A unique, content-based SHA256 hash that immutably identifies a specific container image version. |
| Architecture | The CPU architecture for which the container image is built. For example, amd64, arm64, x86 |
| Image OS | The base operating system environment version the container image uses. For example, 12.10 |
| OS Distribution | The operating system (OS) distribution name. For example, Debian. |
| Operating System | Operating system details of the image. For example, Linux. |
| OS Version | The version or release number of that OS distribution. For example, 20.04 for Ubuntu) |
| OS Concat | Shows combined values of OS distribution and OS version. For example, Debian 11 or Debian bookworm. |
| Size | Size of the container image in bytes. |
| First Observed | Timestamp of when the image was first observed by the source that reported it. |
| Last Observed | Timestamp of when the image was last observed by the source that reported it. |
| Scanners | List of scanners that have scanned the container image. As the container image can be scanned by multiple scanners, the values are stored as a concatenated string of all scanner types. If no scanner data exists for an asset in the database, the default value is an empty array. This column is hidden from the default view. |
| Last Scan | Timestamp of the most recent scan time for the container image, considering all scanners that have scanned it. If no scan data exists in the database for the container image, the default value is 0. This column is hidden from the default view. |
On the Container Image page, select an asset in the inventory table to open a detailed Asset card, which provides additional, in-depth information about the asset. The information is organized into tabs, including an Overview tab (displayed by default) that provides highlights and a general summary, while contextual tabs focus on particular properties of the asset. The card also includes details about detected risks, allowing you to explore them directly from the asset inventory. You can also perform actions on the asset using the Actions menu.
The Overview tab summarizes container image Highlights, Properties, Scan information details, and Relationships between the current image and its Core Image.
Highlights include:
- Critical/High issues: An aggregation of critical and high issues associated with the container image. Clicking on this property redirects you to the Issues page, filtered by specific asset and severity level.
- Visibility timeline: When the container image was first and last detected.
Properties include:
- Includes identifying information and cloud location of the container image: Name, ID (such as ARN in AWS), cloud Provider, cloud Region, and Account ID.
- Additional details: Includes Asset category, Asset Groups, Image Digest, Base image name along with its URL (if present), and Image name.
OS/ARCH includes:
OS information: Includes OS related information for that container image, such as OS distro, OS release, size in bytes, operating system, Docker Labels, and the type of architecture the image is compatible with.
Scan information includes:
Information about the last scan, including scanner name, version, and scan status for vulnerabilities, compliance, secrets, and malware.
Relationships include:
Information about how each logical image (Build, Registry, Runtime) is linked to the Core Image it represents, ensuring that any findings related to the Core Image are contextualized within the scope of the logical images.
This feature enables you to precisely identify the registry and repository source of any running image, directly linking runtime security findings to their origin. As a result, you can rapidly answer complex audit and security questions, such as determining which registry images are currently deployed in runtime. You can also associate images with specific base images used within your organization by defining Base Images rules. This provides clearer visibility into image lineage and simplifies investigation workflows.
The SBOM tab displays details about the Software Bill of Materials (SBOM) generated by the scanning process. Exposed properties include Type, Name, Binary Packages, Version, Path, and License.
Export SBOM: You can export the entire SBOM, or selected attributes from any of the tabs in the expanded card:
Select menu → file format. Supported formats: XML, json
The Vulnerabilities tab provides inventories for Vulnerability Findings, Packages, and Layers, enabling you to assess potential risks and prioritize remediation efforts.
- Vulnerability Findings: Displays a list of findings, along with their associated CVE ID and description, EPSS score, Scope (Base OS or Application) CVSS score and severity, CVE risk factors, affected software, and fix versions, when available.
-
For Registry Image assets, if there are newer, more secure versions of a base image already approved within your corporate registry, a Recommended upgrade plan appears above the Vulnerability Findings table. Click View to see details of recommendations for upgrading the base image and any relevant packages. The Recommended upgrade plan includes the number and severity of CVEs that can be fixed by upgrading, as well as the number of dependent images that will inherit the upgraded version after the dependent images are rebuilt. You can view the dependent images in the Overview tab of the asset, under Relationships.
\
For each recommended upgrade task, you can see the current and recommended base image or package, and the number of relevant CVES and their severity.\
For base image recommendations, you can also see the operational risk of the upgrade. Operational risk is calculated based on the level of change required. For example, if upgrading the base image requires a major version upgrade but remains the same operating system, the operational risk is calculated as Medium. A base image recommendation that requires you to switch operating systems would have an operational risk of High.\
Upgrade recommendations are provided after balancing the number and severity of vulnerabilities resolved by the upgrade against potential operational (compatibility) risks from an upgrade.\
You can Export selected upgrade tasks to a CSV file that can be used internally in your organization to request an upgrade. For example, you could send the base image upgrade recommendation details to your infrastructure team and package upgrade recommendations to your development team.
-
- Packages: Displays a list of packages, their name and version, the total number of vulnerabilities found within each package, a breakdown of vulnerabilities by severity level and count, their EPSS (Exploit Prediction Scoring System), which estimates the likelihood of exploitation; CVSS (Common Vulnerability Scoring System), which rates the technical severity of the vulnerability; location; base image vulnerability; and whether a fix is available.
- Layers: Displays the various layers and their contents within a container image.
The Compliance tab provides visibility into how an asset aligns with assigned security standards and individual controls. Use this tab to evaluate compliance posture and investigate specific control results.
Overall Compliance Score: Displays the asset’s compliance score, along with the number of standards and controls used in the assessment. Use this metric for a high-level view of how the asset aligns with evaluated standards.
Controls by Status: Shows the distribution of controls across Passed, Failed, and Not Assessed. Click a specific status to filter the Standards and Controls data.
Standards, Score, Controls Passed: Lists the standards by which the asset is assessed, including the score and passed control count for each.Controls Table: An exhaustive list of controls for which an asset may be assessed including columns for Standard, Category, Control, Severity, and Status.
Serverless functions assets
The Serverless Functions asset inventory provides a centralized view of all serverless functions and their details across your environments. The platform enables efficient tracking and management of your serverless function resource, ensuring compliance with security and governance standards. You can directly access serverless function issues and findings within the inventory, allowing you to prioritize and remediate them without having to navigate to a separate remediation section.
To access serverless function assets, under Inventory, select All Assets → Compute → Serverless Functions.
The Serverless Functions assets inventory includes a dashboard with provider, class, and category widgets displayed by default, and an inventory table. Selecting a widget automatically filters the inventory table based on the widget's criteria.
The inventory table includes general asset properties, as well as these unique attributes:
| Property/attribute | Description |
|---|---|
| Category | Serverless Functions |
| Type | <ul><li>Lamda Function - for AWS</li><li>Google Cloud Function - for GCP</li><li>Azure App Service Web App Function - for Azure</li></ul> |
| Class | Serverless functions belong to the Compute asset class |
Serverless functions asset card
The serverless function summary, displayed at the top of the card, provides concise details about the serverless function including cloud provider, category, region and account ID.
The Overview tab summarizes serverless function highlights, properties, scan management details and provides a list of entities with access to the serverless function.
Highlights include:
- Critical/High issues: An aggregation of critical and high issues associated with the serverless function. Clicking on this property redirects to the Issues page, filtered by specific asset and severity level
- Visibility timeline: When the serverless function was first and last detected
- Risk summary: The risks associated with the serverless function, grouped by category (cases, issues and findings). Each category includes the total number of associated risks, as well as a specific count for each severity level
Properties include:
- Identification and Location: Includes identifying information and cloud location of the serverless function: Name, ID (such as ArN in AWS), cloud provider, cloud region and account ID
- Configuration and Environment: Includes the fundamental setup and execution context of the serverless function. It includes the function category, type (the specific serverless compute service being used such as AWS Lambda, Azure Functions, Google Cloud Functions) and runtime (such as Python and Node.js)
Scan management: Includes information about the last scan, including date, scanner name, version and scan status.
Identities with access to this asset: Lists the top most privileged identities on the asset, ranked by their recent activity and highlighting those who have recently used their high-level permissions.
The SBOM tab displays details about the Software Bill of Materials (SBOM) that was generated by the scanning process. Exposed properties include Type, Name, Binary Packages, Version, Path and License.
Export SBOM: You can export the entire SBOM, or selected attributes from any of the tabs in the expanded card: Select menu → file format. Supported formats: XML, json.
The Access tab includes two inventories:
- Access permissions (Who can access this asset): Exposed properties include Source, Grantor, Access Levels, Access to Data Labels, Last Used, Permission Scope and Excessive Policies
- Identity access scope (Where can this identity access): Exposed properties include Grantor, Destination, Access Level, Last Used, Access to Data Labels, Configured By and Destination ID
The Vulnerabilities tab provides inventories for Findings and Packages, enabling you to assess potential risks and prioritize remediation efforts.
- Findings: Displays a list of findings, along with their associated CVE ID and description, EPSS score, CVSS score and severity, CVE risk factors, affected software and fix versions, when available
- Packages: Displays a list of packages, their name and version, the total number of vulnerabilities found within each package, a breakdown of vulnerabilities by severity level and count, their EPSS (Exploit Prediction Scoring System), which estimates the likelihood of exploitation, CVSS (Common Vulnerability Scoring System), which rates the technical severity of the vulnerability, location, base image vulnerability, and whether a fix is available
Note
For details of all serverless function issues generated by Cortex Cloud from vulnerability findings, refer to Serverless function usage.
VM images assets
Cortex VM image scanning is an agentless scanning feature that enables you to inspect the risks and vulnerabilities of a cloud workload without installing an agent or affecting the execution of your workload.
Agentless scanning of VM images is automatically enabled upon onboarding a cloud account to Cortex XSIAM. Disabling this feature prevents VM images on your account from being scanned for vulnerabilities and risks, reducing your account's overall security coverage.
Cortex Agentless scanning includes private virtual machine images across the following major cloud platforms:
- Amazon Web Services (AWS): Cortex exclusively scans private Amazon Machine Images (AMIs).
- Microsoft Azure: Scanning is limited to private gallery versioned Images.
- Google Cloud Platform (GCP): Cortex XSIAM supports scanning of private VM images.
After you onboard your cloud account, it is continuously scanned regardless of how many workloads are under that account. Whether you add or remove hosts and containers, agentless scanning keeps your workload’s security issues visible.
VM images assets inventory
To access VM images assets, go to Inventory, select All Assets → Compute → VM Images.
The VM images assets page includes a dashboard and an inventory table.
VM images asset table
The following table describes the default exposed properties of the VM images asset table. Select the column picker to view additional properties.
| Column | Description |
|---|---|
| Provider | Cloud Account Provider |
| Name | Name of the VM image |
| Region | Geographical location within a cloud provider's infrastructure where that VM image is located |
| Architecture | Architecture of the VM image. For example: x86_64 |
| Image OS | The OS distribution version. For example: 2020 or 20 |
| OS Distribution | Operating System distribution details |
| Operating System | Operating System on the VM image |
| OS version | Version of the operating system |
| Tags | User-defined label to correlate VM images and Instances |
| Size | Size of the VM image |
| Created At | The time when the VM Image was created in the Cloud provider |
| First Observed | The first scan time of the VM image |
| Last Observed | The last scan time of the VM image |
| Scanners | <p>List of scanners that have successfully scanned the Core Image asset. As the core image can be scanned by multiple scanners, the values are stored as a concatenated string of all scanner types. If no scanner data exists for an asset in the database, the default value is an empty array. This column is hidden from the default view.</p><div data-gb-custom-block data-tag="hint" data-style="info" class="hint hint-info"><p>Note</p><p>The data in the Scanners column is accurate only for Core Image assets. Ignore the Scanners value for assets categorized as Registry, Build, or Runtime images, as it may not reflect an accurate scan status.</p></div> |
| Last Scan | <p>The Last Scan time reflects the most recent scan across all scanners for a Core Image. If no scan data is available in the database for the core image, the default value is 0. This column is hidden from the default view.</p><div data-gb-custom-block data-tag="hint" data-style="info" class="hint hint-info"><p>Note</p><p>The Last Scan value is only accurate for Core Image assets; ignore the Last Scan values for Registry, Build, and Runtime images, as they may be incorrect.</p></div> |
VM images asset details
The VM image asset card provides a unified view of a VM image, consolidating VM details and related configuration issues and vulnerabilities found during VM image scanning.
Ask the AppSec agentic assistant agent
From the VM Images table, right-click a VM image > Open in Agentic Assistant > select Application Security from the agents menu, and query VM image specific insights. This action is also available from the VM image side panel.
Asset card tabs
-
Overview tab: Displays a high-level summary of the VM image including OS details, findings, cases, VM scan information, and the relationship graph between the VM instance and the VM image.
Note
If the VM image is not used to create any VM instance, the graph section will show no results. This feature enables you to precisely identify the registry and repository source of any running image, directly linking runtime security findings to their origin. As a result, you can answer audit and security questions, such as determining which registry images are currently deployed in runtime.
- Configurations tab: Lists all the cloud configuration issues seen during the VM image scanning. The Asset Configuration JSON section provides details of the VM image in JSON format.
- Vulnerabilities tab: Lists the vulnerability findings during VM image scans as well as the packages with related vulnerabilities found during VM image scans.
Data assets
The data assets inventory provides a centralized repository for all data assets within your environment. Powered by theData Security (DSPM) module, it provides continuous visibility into where sensitive data resides, how it is used, and its exposure risk.
Note
The data assets inventory requires a Cortex XSIAM Premium license, or a base Cortex XSIAM license that includes the Cloud Posture Security or Cloud Runtime Security add-on.
Navigate to Inventory → All Assets → Data → All Data Assets to view your data landscape. The top of the page features interactive widgets that summarize your risk:
- Assets at risk: Displays a bar with various risk levels. You can hover your mouse to see the number of risks for each level.
- Data stored in AWS, Azure, and GCP: Displays the number of data assets located within each specific cloud platform. You can click any of these cloud platform icons to dynamically filter the inventory results below, and click them again to remove the filter.
- Sensitive Assets: Displays the number of assets containing sensitive data profiles.
- Sensitive Assets Open to World: Highlights sensitive assets that are publicly accessible.
You can filter the inventory to focus on specific data categories: Databases (structured data), Storage Buckets (folders and files), or Disks (VM disks like AWS EBS or Azure Managed Disks).
Data asset details
Clicking an asset in the inventory opens a detailed asset card with the following tabs:
- Overview: Provides highlights, properties, and identities with access to the resource, if any are found.
- Identity: Displays an aggregated view of the identities and permissions associated with the asset, including an interactive graph of the access paths.
- Configurations: Displays any Cloud Configuration Issues detected on the asset and provides the raw Asset Configuration JSON.
- Data: Provides an overview of the displayed asset and its associated risks, including the presence of Data Profiles like Financial or PCI and Data Patterns like credit card numbers.
- Compliance: Shows the Overall Compliance Score, a breakdown of Controls by Status, and a detailed list of compliance results based on industry standards.
- Objects: Provides a granular list of the objects stored within the asset and information pertaining to their contents.
- AI Ecosystem: Visualizes the Asset Story, providing a topological map of how the data asset interacts with connected AI components. This tab does not appear on every data asset. It only appears dynamically if Cortex XSIAM detects that the data asset is actively functioning as part of an AI supply chain, such as acting as an inference dataset or training dataset connected to an AI model
Backups
Alongside databases, storage buckets, and disks, the data asset class also provides an inventory of your environment's backups, such as AWS Backup resources. Navigate to Inventory → All Assets → Data → Backups.
Device assets
Navigate to Inventory → All Assets → Device → General Devices to view your inventory of physical and virtual endpoints, such as PCs, laptops, servers, and mobile devices, that are protected by an installed Cortex XDR agent.
Note
The device assets inventory requires deployed Cortex XDR agents, which are included with Cortex XSIAM Enterprise and Premium licenses, or available as an add-on for Cortex XSIAM NG-SIEM.
Asset details and status
The device inventory tracks vital operational and connectivity data for each asset. Analysts can view the endpoint status to see if the agent is Connected, Disconnected, or Lost, the operational status to verify if the endpoint is Protected, Partially Protected, or Unprotected, as well as the Agent Version, Operating System, and the last logged-in User.
Host insights
For deeper visibility, device assets support Host Insights. This feature collects extensive business and IT operational data from the endpoint, including installed applications, autoruns, mounted disks, local user groups, and running services. This allows analysts to quickly identify anomalies, such as a suspicious service or an unauthorized autorun added to a device.
Direct remediation actions
Because these device assets are actively managed by the XDR agent, analysts can execute direct response actions on the asset during an investigation. Supported actions include:
- Isolating the Endpoint: Halting all network access on the device (except for traffic to Cortex XSIAM) to prevent a compromised device from communicating with other internal or external networks.
- Live Terminal: Initiating a remote connection to manage files, active processes, and run system commands.
- Script Execution & File Retrieval: Running Python scripts directly on the device or retrieving specific files (up to 20 files or 500MB) for further forensic analysis.
Asset cleanup
To ensure the device inventory remains accurate and clutter-free, administrators can perform one-time or periodic cleanups of duplicated entities. If a device is removed, its data is retained for 90 days from the last connection timestamp, and the data will be seamlessly recovered if the device reconnects in the future.
External Surface assets
The External Surface inventory provides a searchable, filterable view of the internet-facing assets that Cortex XSIAM has discovered and attributed to your organization, including certificates, domains, services, and websites. Navigate to Inventory → All Assets → External Surface to access the All External Surface Assets view, or specific categories including Services, Websites, Domains, and Certificates.
Notice
Requires the Attack Surface Management (ASM) add-on.
The following sections provide information about each External Surface asset type. For information about external IP address ranges, see Network configuration.
External asset categories
There are four categories of external assets:
- Services: Any internet-facing device or software communicating on an application-level protocol over the public internet. The services table includes detailed fields such as Active classifications, Business units, Discovery type, Externally inferred CVEs, and an Externally inferred vulnerability score.
- Websites: Represents the content and the software stack that was used to generate a website.
- Domains: All root domains and subdomains that Cortex XSIAM has attributed to your organization. Subdomains are automatically grouped under a wildcard domain asset if they resolve to the same IP address, and are collapsed under a parent domain if more than 1,000 subdomains are observed.
- Certificates: Cortex XSIAM tracks "cryptographic health" checks, flagging issues such as self-signed or expired certificates, and weak signature algorithms.
Website assets
Cortex XSIAM websites data extends Attack Surface Management (ASM) protection by identifying insecure websites, web components, and technologies running on your managed and unmanaged web assets. Cortex XSIAM scans your public-facing websites, creating a continuously updated inventory of your web assets, including the server software and other technologies powering your web applications.
Websites data in Cortex XSIAM enables you to accomplish the following:
- Develop a single source of truth for all of your organization's web inventory
- Track and monitor your risk due to third-party libraries
- Continuously discover and monitor external web application inventory and third-party technologies
- Identify insecure and misconfigured websites, vulnerable technologies, and dependencies
- Improve security ratings by identifying sites failing security best practices
The difference between websites and external services
In Cortex XSIAM, external services are public-facing network services; for example, an RDP server or an HTTP server. Websites represent the content and the software stack that was used to generate the website.
An HTTP service represents a single HTTP server (on-prem) or a cohesive group of HTTP servers (cloud). A website can be served by a single HTTP server or by multiple HTTP servers. Some of these HTTP servers could be hosted by a cloud provider, others on-prem. Generally, the relationship between HTTP services and websites can be described as follows:
- A website is supported by one or more HTTP services.
- A cloud HTTP service serves a single website.
- An on-prem HTTP service serves multiple websites, potentially hundreds.
The difference between websites and domains
A domain is simply the registration of a domain (for example, your organization might own www.example.com). You can have a domain without a website behind it. You can also have a domain that does not resolve to an IP address (which means it does not have a website behind it). Cortex XSIAM includes websites with a domain name or an IP address.
Websites field descriptions
The Websites page lists your websites in a table format that can be sorted, filtered, and downloaded. Some of the key fields are described in the table below.
| Field | Description |
|---|---|
| Authentication | Detected authentication method. Results could be none, form based authentication (e.g. user ID and password), or a single-sign on method. |
| Attributed Organizations | Business unit this website is associated with. |
| Externally Detected Providers | Hosting provider. |
| Website Failed Security Assessments | Which of the security best practices the website failed. |
| First Crawled Timestamp | When the website was first observed. |
| Host | <p>Domain or IP of the website host.</p><ul><li>A closed lock indicates HTTPS.</li><li>An open lock indicates HTTP.</li></ul> |
| HTTP Type | HTTPS, HTTP redirecting to HTTPS, or HTTP. |
| IP Addresses | IP addresses associated with this website. |
| Is Active | <p>Yes — Indicates the website is active, which means it has been observed recently.</p><p>No — Indicates the website is inactive, which means Cortex Xpanse no longer sees it on the internet or it is no longer attributed to your organization.</p> |
| Last Crawled Timestamp | When the website was most recently observed in a Cortex Xpanse scan. |
| Port | Port for the website. |
| Site Category | <p>The inferred business purpose of the website based on the technologies used on that website. Full list of site categories is Ecommerce, Advertising, Affiliate Programs, Appointment scheduling, Blogs, CMS, CRM, Development, Documentation, Issue Tracker, LMS, Reservations & Delivery, Recruitment & Staffing.</p><p>If a technology doesn't fit into one of the listed categories, this field will be blank.</p> |
| Website Technologies | Any technologies detected on the website. |
| Website Third Party Script Domains | Third-party domains that serve the scripts (not the scripts themselves). |
| Website ID | Unique ID associated with the website. |
Website details
Click a row in the Websites table to open the details page for that website. The following sections describe the information on the website details page.
Site Details, Site Categories, Site Deployment Details
Summarizes key information about the security of the website.
Most Recent Screenshot
A screenshot and link to the website to make it easier to investigate issues. If you don't see a screen shot, the website may have been down when we scanned the page or that access was blocked for our scanner (in which case you probably won't see any technologies listed under Technologies Used either). If the screenshot is incomplete (a blank or invalid layout), the page may have loaded too slowly—we take the screenshot six seconds after we request the page.
Security Best Practices Analysis
Provides an at-a-glance look at whether the website is following broadly accepted security best practices.
We perform only the relevant security best practice assessments on each website. For example, if a website redirects somewhere else, many of the security assessments are performed on the website the user is redirected to; only the Has HTTPS Enabled and Protocol Downgrade assessments are performed on the original website. And some security assessments don’t make sense on non-HTTPS websites (e.g. mixed content and HSTS header), so those assessments are not performed.
Some security best practice assessments are performed only on webpages without "transient errors". We consider a page to have a transient error if the HTTP status code is 405, 407, 408, 409 or greater than 411. In this case, we assume this is not a normal condition of the website and visiting the page later or in different conditions would yield a different result.
If we have no matching observation for an assessment, the assessment will not be displayed. For example, if https://acme.com has a single page with a 404 status code, the Mixed Content assessment would be performed (404 is not a transient error) but the X-Frame-Options assessment would not be.
The table below lists each of the security best practices, which websites and webpages the analysis is performed on, and the criteria we use to determine whether the website Passes or Fails the assessment.
| Website Security Best Practice | Performed on these websites | Performed on these pages | Pass/Fail Criteria |
|---|---|---|---|
| Has HTTPS Enabled | All websites | All | Passes if the website is accessed over TLS or redirects to an HTTPS website. |
| Secure Forms | HTTPS websites that do not always redirect | Pages without transient errors | Fails if we find an HTML form with an action to an insecure website. This applies only to static forms and will not detect dynamically rendered forms. |
| No Mixed Content | HTTPS websites that do not always redirect | Pages without transient errors | Fails if we find a page that is using a resource (image, stylesheet, script but not just a <a> link) loaded over HTTP. |
| Protocol Downgrade | All websites | All | Fails if we find a transition from HTTPS to HTTP in the redirect chain. |
| Sets Valid X-Frame-Options Header | Websites that do not always redirect | Pages with 2xx status code | <p>Fails if:</p><ul><li>X-Frame-Options header is not empty and is neither DENY or SAMEORIGIN</li><li>Content-Security-Policy header is not set or syntactically invalid</li></ul> |
| Sets Valid X-Content-Type-Options Header | Websites that do not always redirect | Pages with 2xx status code | Fails if X-Content-Type-Options is not set or not “nosniff” |
| Sets valid Content-Type Header | Websites that do not always redirect | Pages with 2xx status code | Fails if Content-Type is not set or set to an invalid value. |
| Sets HTTP Strict Transport-Security-Header | HTTPS websites that do not always redirect | Pages without transient errors | Fails if there is no “Strict-Transport-Security” header. |
| Sets valid Referrer-Policy Header | Websites that do not always redirect | Pages without transient errors | Fails if Referrer-Policy header not set or set to an invalid value. |
Technologies Used
List of the technologies used on your website.
HTML Form Analysis
List of login forms. Login forms are only detected in a static environment, so if the form is created by JavaScript, it will not be detected. Only login forms are displayed in analysis.
Domain Details
Information about the website domain, including a link to the domain in the Inventory.
Third Party Resources
List of the scripts and CSS loaded from domains that are not owned by your organization.
Other Websites Hosted with This Website
List of other websites owned by your organization and hosted on the same IP addresses.
Services Hosting This Website
List of services hosting the website in the last 30 days.
GeoMap
Map indicating the IP region of the website.
Externally Inferred CVEs
Externally inferred CVEs associated with the technologies used on your website.
Service assets
A service can be any internet-facing device or software that communicates on a domain:port or IP:port pair that responds to scanners on an application-level protocol over the public internet.
Services include classifications which are fingerprint-based identifiers of software, technologies, and behaviors observed on the service. Classifications can be either active or inactive based on the most recent observations of a service. In addition to classifications, services will also include banner, response, and header information from Cortex XSIAM data collection.
Services field descriptions
The Services table includes the fields.
| Field | Description |
|---|---|
| Active classifications | <p>Facts that have been inferred about each of your services by examining a response for fingerprints. Classifications cover a variety of details including:</p><ul><li>Identifying specific software and versions.</li><li>Configuration details of note.</li><li>Identifying when the services do not implement best practices like web security headers or certificate security standards.</li></ul><p>Some Classifications merely note that a fact is true or false, like Missing Cache Control Header. Other Classifications provide additional information, such as a version number for “nginx Server”. These details are viewable in the services table and on the details page for the service by clicking the name of the service in the All External Services table.</p> |
| Business units | A Business Unit is a designation to classify assets. Cortex XSIAM tracks business units as a means to identify owning organizations of these assets. Business units become extremely important when an organization has subsidiaries and groups established through M&A activities. |
| Discovery type | <p>Services are identified with one of the following two discovery types, depending on the level of confidence Cortex XSIAM has in attributing it to your organization.</p><ul><li><p>Directly Discovered: services that are definitively associated with an asset that belongs to your organization.</p><p>Examples include:</p><ul><li>It is hosted on one of your on-prem IP ranges.</li><li>The service advertises one of your organization's certificates.</li><li>It is on a managed cloud resource that is known to be yours.</li></ul></li><li><p>Colocated with your Services: the service is running on the same IP as a different directly-discovered service.</p><p>In a multi-tenant hosting environment, these co-located services may belong to other organizations but can sometimes pose adjacency risks to your services hosted on that IP. If your organization has “single-tenant environment only” policies with 3rd party hosting providers, you can use this functionality to identify possible violations of that policy.</p></li></ul> |
| Domain | The most recent domain on which the service is running. |
| Externally detected providers | The provider of the asset is determined by an external assessment. |
| Externally inferred CVEs | <p>Externally Inferred CVEs are identified by comparing the product name and version of active service, if identifiable, with CVES for those products in the National Vulnerability Database. Additional investigation may be required to confirm if the CVE is present.</p><p>Click on the service to view the service details, which include the complete list of all the externally inferred CVEs.</p> |
| Externally inferred vulnerability score | <p>This score is based on the highest CVSSv3 score for Externally Inferred CVEs on this service. If there is no CVSSv3 score for the CVE, then the CVSSv2 score is used.</p><p>This field applies only to services with Externally Inferred CVEs.</p> |
| First observed | When the asset was first observed via any of the sources. |
| Inactive Classifications | Previously observed classifications that are no longer observed. |
| IP addresses | Array column specifying a list of IPs associated with this asset. |
| Is active | <ul><li>Yes— indicates the service is active, which means that the service has been observed recently.</li><li>No— indicates the service is inactive, which means Cortex XSIAM no longer sees it on the internet.</li></ul> |
| Last observed | When the asset was last observed via any of the sources. |
| Port | The most recent port for the service. |
| Protocol | The application-level protocol on the public internet over which Cortex XSIAM validated the service. |
| Service name | The service type along with the specific domain:port or IP:port pair for the service. |
| Service type | The type of server or software for the service. |
Click a row in the Services table to open the details page for that service. The information on this page is organized into the following tabs:
- Overview: Summarizes key information about the service, including Highlights like cases, issues, and internet exposure. It also lists Properties like Asset ID and Provider, along with Service Details including Status, Service Types, Discovery Type, Port, Protocol, IPs, Geo Region, and Attributed Organizations
- Vulnerabilities: Displays the Vulnerability Findings associated with the service, including CVE IDs, CVSS scores, and EPSS scores
- Compliance: Displays the Overall Compliance Score and Controls by Status for the service
- Recently Observed: Lists recently observed IPs, Certificates, Domains, and TLS Versions associated with the service
- Service Classifications: Provides fingerprint-based identifiers of software, technologies, and behaviors observed on the service, detailing specific software revisions, firmware, model names, and vendor information
Domain assets
The External Surface inventory includes all domains that Cortex XSIAM has attributed to your organization and whether each domain has a recent resolution. Root domains and subdomains are displayed as separate entries in the inventory. However, if an organization owns a wildcard DNS entry, all subdomains of that wildcard that resolve to the same IP address are grouped under that one wildcard domain asset entry. If there are more than 1,000 subdomains, subdomains are collapsed under the parent domain.
Cortex XSIAM collects domains and DNS data from a combination of active and passive global collection techniques. For DNS scanning, Cortex XSIAM sends a BIND version query as the payload. This approach still identifies DNS servers that are not BIND compliant as their response informs us of a DNS server’s existence.
Click a row in the Domains table to open the details page for that domain. The information on this page is organized into the following tabs:
- Overview: Summarizes key information about the domain, including Highlights like internet exposure, Properties like Asset ID, Provider, Asset Category, Account ID, and Tags, along with Attribution Evidence explaining why the asset belongs to your organization
- Vulnerabilities: Displays Vulnerability Findings and Packages associated with the domain, including CVE IDs, CVSS scores, and EPSS scores
- Compliance: Displays the Overall Compliance Score and Controls by Status for the domain
- Recently Observed: Lists recently observed IPs associated with the domain, including the IP Address, Last Seen date, and Cloud Type
- Services & Websites: Lists the services and websites running on the domain, including their Type, Status, Discovery Type, and Host
Certificate assets
Certificates (also known as digital or public key certificates) are used when establishing encrypted communication channels to identify and authenticate a trusted party. Certificates are typically used for SSL/TLS, HTTPS, FTPS, SSH, and VPN connections. The most common use of certificates is for HTTPS-based websites, which enable a web browser to validate that an HTTPS web server is an authentic website.
Cortex XSIAM tracks information for each certificate, such as Issuer, Public key, Public Key Algorithm, Subject, Subject Alternative Names, Subject Organization, Subject Country, and Subject State. Cortex XSIAM also tracks the following “cryptographic health” checks for each certificate:
- Overview: Summarizes key information about the certificate, including Highlights like an expired certificate status. It lists Properties like Asset ID, Provider, Asset Category, Account ID, Tags, and Asset Groups, along with Attribution Evidence explaining why the asset belongs to your organization. This tab also displays detailed certificate information such as Issuer, Public key, and Subject Alternative Names, along with Certificate Classifications that track cryptographic health checks
- Compliance: Displays the Overall Compliance Score and Controls by Status for the certificate
- Recently Observed: Lists recently observed IPs, domains, and TLS versions associated with the certificate
- Services & Websites: Lists the services and websites running with the certificate, including their Type, Status, Discovery Type, and Host
External Surface attribution evidence
Cortex XSIAM provides attribution information about each asset in your External Surface inventory, so you know at-a-glance why we believe an asset belongs to your organization.
Inventory Origin field
Explains whether an asset was Discovered by Cortex XSIAM or Provided by your organization. This field is included on the Certificates, Domains, and External IP Address Ranges pages in your inventory.
Attribution Reason field
Indicates whether an asset was attributed to your organization because it is Registered to You or Has Your Content. This field is included on the External IP Address Ranges page in your inventory.
Asset Attribution Evidence
To review more detailed attribution evidence for an asset, click on an asset in the External Surface inventory to display the asset details and find the Asset Attribution Evidence section.
For each asset, Cortex XSIAM provides the seed term that was used to attribute the asset to your organization and the specific piece of scan data that we matched to the seed term. A seed term is a text string that our research team generated and associated with your organization. For example, seed terms for Cortex Xpanse might include: Xpanse, Cortex, Cortex Xpanse, Palo Alto Networks, PANW, PAN, etc. We use machine learning models as well as manual research to match the seed terms with our scan data to attribute assets to your organization.
Depending on the asset type and scan data, most assets will have one or more pieces of attribution evidence. Assets that don't have attribution evidence do not have a seed term match. The following are reasons we may not have a seed term match:
- The domain or IP range is provided by the customer and cannot be externally validated using public data.
- The domain registration information is redacted, blank, or private. We attribute these through manual routing.
- The domain is attributed by an associated website (e.g. example.com is attributed to Example Corp because the website at www.example.com shows clear evidence of belonging to Example Corp).
- The domain is attributed based on a DNS record.
If you have questions about a specific asset, reach out to Customer Success.
Identity assets
Powered by the Identity Security module, the Identity Asset Inventory helps you discover your entire cloud identity estate. It analyzes your environment to determine exactly what actions identities can take and which resources they can access, providing the context needed to trigger security detection rules.
Identity categories
The identity inventory is organized into the following categories:
- All Identity Assets: Identities originating from all platforms and sources.
- Human: All cloud, identity provider (IdP), and platform users.
- Non-human: Machine identities that can assume permissions and perform cloud Identity and Access Management (IAM) actions such as VMs and functions.
- Groups: Identity and Access Management groups.
- Policies: Permission documents, such as AWS policies, Azure roles, and GCP roles.
For each identity category, you can refine the results using the tabs:
- All Identities: Identities originating from all platforms and sources.
- Cloud Identities: Identities originating from cloud platforms.
- SaaS Identities: Identities originating from SaaS data sources.
-
On-premises Identities: Identities managed within your on-premises or enterprise directories.\
For Human identities, the On-premises Identities tab includes the Weak Password widget to filter the users in your organization who are likely to be targeted because they have a weak password.Note
Access to the Weak Password widget and column requires the ITDR add-on.
Note
Once a user updates their password to a strong password, they will no longer appear in the filtered weak password results.
Expanded identity details
Clicking an identity asset in the inventory opens a detailed asset card that provides deep contextual analysis. Because managing identity security requires understanding how assets interact with one another, the information available on these cards helps map the complex web of relationships and permissions within your environment.
While the specific layout changes depending on whether you are viewing a human identity, a machine identity, or a secret, the asset details generally provide an aggregated view of the permissions associated with the asset. By exploring the identity details, you can understand exactly how an identity is granted its permissions by viewing the groups it belongs to, the cloud service accounts it can impersonate, and any policy attachments or inline policies. You can also review an identity's specific access levels to destination assets, which highlights unused permissions, excessive permissions, and the account access type.
Network assets
Navigate to Inventory > All Assets > Network to access dedicated views for your network infrastructure. You can view All Network Assets, or filter by specific categories including Load Balancers, Network Interfaces, Security Groups, and Subnets. This section provides comprehensive visibility into the network infrastructure and security boundaries configured within your cloud and on-premise environments.
Asset details and configurations
Clicking on a network asset opens a detailed asset card with the following tabs:
When investigating virtual machine assets, analysts can use the dedicated Network tab to gain in-depth visibility over internal network reachability and security boundaries. This tab provides:
- Overview: Summarizes the highlights and properties of the network asset
- Identity: Displays the identities associated with the network asset
- Configurations: Displays the raw Asset Configuration JSON to deeply inspect specific IP rules, port protocols, and inbound or outbound permissions as defined by the provider
- Compliance: Displays the compliance status of the network asset
Network exposure detection
To secure your network assets, the Cloud Network Analyzer continuously evaluates your infrastructure to detect inbound, outbound, and east-west exposures. The Cloud Network Analyzer maps the internal network topology to determine if assets have unrestricted access or can move laterally across VPCs and cloud accounts. This analysis takes into account the effectiveness of all cloud-native network security policies in the routing path, including network firewalls, internet gateways, load balancers, and security groups. If the Cloud Network Analyzer detects a risky exposure, it publishes actionable findings and issues mapping the network path
Security services assets
Navigate to Inventory > All Assets > Security Services > All Security Services Assets to access a complete, centralized overview of the security services being actively managed within your organization.
A Security Service Asset is a specific class of asset within the inventory that represents the actual security configurations, policies, and managed services deployed to protect your cloud environment. Rather than representing the infrastructure that needs protection, such as a compute instance or storage bucket, these assets represent the mechanisms doing the protecting. Examples of these assets include cloud-native security controls like AWS KMS Key Rotation Status and Google Binary Authorization Policy. The system tracks these assets to provide a complete, centralized overview of the security services being actively managed within your environment, ensuring your defensive infrastructure remains active, properly configured, and uncompromised.
You can review these assets to ensure your core security mechanisms are functioning correctly and have not been tampered with. Because these assets are continuously enriched with posture and threat data, you can quickly identify, prioritize, and resolve active threats or misconfigurations directly impacting your managed security services. For example, if an encryption key rotation policy is disabled or a binary authorization policy is misconfigured, you can view a direct breakdown of any related cases, issues, and findings tied to that specific security service to immediately remediate the gap in your defenses.
Asset groups
By grouping assets based on shared attributes, you can address them collectively to enable more efficient bulk actions and simplify scoping across the platform. You can create an asset group by navigating to Inventory → Assets → Groups and clicking Add Group.
When creating or editing a dynamic asset group, you can enable the Show only fields supported for access management option. Enabling this toggle limits the available fields in the Assets table to display only the subset of attributes supported for Scope-Based Access Control (SBAC). Using this option ensures that the asset group can be used to define granular user scopes in Access Management. To view the complete and current list of supported scoping attributes, see Manage user scope.
Note
If an asset group uses fields outside of this supported list, it cannot be used for scoping in Access Management.
Dynamic and static asset groups
You can choose between two types of asset groups. Dynamic groups use filters, such as provider or realm, to group current and future assets that meet the defined criteria, while static groups require you to manually select individual assets to include in the group.
Use asset groups
After you define asset groups, you can use them for the following:
-
Scope-Based Access Control (SBAC): Asset groups serve as the foundational building blocks for Asset-led Scope-Based Access Control (SBAC). This allows administrators to explicitly restrict which users can view which assets by defining access to specific Asset Groups, which simultaneously restricts their ability to view related cases and issues for those assets.
Note
Note: You cannot create SBAC based on static groups. When using dynamic asset groups for SBAC, you can limit access based only on the following attributes: Asset Class, Category, Provider, Region, Organization, Realm, Business Application Names, Kubernetes Cluster, Kubernetes Namespace, Code Repository, Hierarchy Path, Resource Group, and Asset Tags.
- Automation Exclusion Policies: You can use asset groups for specific automation exclusion policies, such as the IAM User Hard Remediation and User Soft Remediation policies. By using asset groups for these policies, the system enables automatic updates of critical assets without requiring manual edits to a list. These specific exclusion policies can be configured to contain only lists, only asset groups, or a combination of both.
- Enrich asset data: Add information to a set of assets that isn't directly stored on the asset itself.
- Reuse asset groups: Reference the same group across different areas of Cortex XSIAM, for example, in policies and rules.
- Query Asset Groups in XQL: You can query asset group information directly in Cortex Query Language (XQL) using the
asset_groupssystem dataset.
Note
When you create or edit an Asset Group, the changes are applied immediately to new assets and to existing assets that have been updated. Yet, it may take a few hours for the changes to appear on existing assets that have not been updated.
Best practices for asset group management
The speed and overall performance of using asset groups depend on the amount of data processed during data creation and access operations. This impacts how fast the system can:
- Enrich new assets with the asset groups they belong to.
- Revisit and update existing assets when an asset group's configuration is changed.
- Enforce granular Scope-Based Access Control (SBAC) that checks whether assets can be accessed based on the asset groups they belong to.
The data processing and filtering required for grouping and scoping can increase system latency if the rule count or filtering complexity is high. To ensure optimal performance, we recommend the following:
- Use short filters and simple comparison operators in your asset group definitions to keep complexity low.
- Minimize the number of asset groups each asset belongs to. While a higher number of groups shouldn't significantly impact performance, incorrectly leveraging them for scoping at a very large scale can have a negative impact.
- Moderate the total number of asset groups, as an excessively high asset group count can increase latency.
.
Manage Risk Scores
An risk score is a dynamic risk metric, typically ranging from 10 to 100 though it can go higher with custom modifiers, assigned to users and hosts. It acts as an aggregate indicator of how much security risk a specific identity or machine currently represents.
Note
Customers with the Identity Threat Module add-on have access to risk scores.
Cortex XSIAM aggregates Workday and Active Directory data to create a list of user and host assets within your network. A user or host risk card is generated only after an alert associated with that specific entity is triggered. Cortex XSIAM calculates the score by summing the scores of the cases and alerts that the specific asset is implicated in.
For users, the underlying data driving these scores heavily relies on authentication logs, such as VPNs and Single Sign-On events. Cortex XSIAM aggregates this risk by the exact hostname or username. If multiple alerts map to the exact same name, the score aggregates under a single Risk View.
Risk scores act as an important input for the broader alert ecosystem. The Cortex SmartScore algorithm factors in the Risk Score, meaning a critical alert on an asset with a low risk score might be given a lower overall SmartScore, while minor alerts on highly critical assets might be elevated.
You can view the latest scores by navigating to Inventory → Assets → Risk Scores. This page provides a birds-eye view of your riskiest entities. Use the toggle in the page header to switch between the Users and Hosts tabs. Access to the Hosts tab and the associated Risk Management dashboard requires the Identity Threat Module add-on and Analytics to be enabled.
To include system users in the table, such as administrators or NT authority, select the Include System Users checkbox. From the table, you can filter and review your assets. To investigate further, right-click on a selected host or user and click Open User Risk View or Open Host Risk View to track the score trend over time.
Users tab fields
| Field | Description |
|---|---|
| Starred | Whether the user is included in the watchlist. |
| Score | Represents the Cortex XSIAM high-risk user score. The score is updated continuously as new alerts are associated with incidents. |
| User name | Name of the user as provided by Cortex XSIAM. |
| Full name | Name of the user as provided by Workday or Active Directory. |
| Department | Department of the user as provided by Workday or Active Directory. |
| Email of the user as provided by Workday or Active Directory. | |
| Member of | (Derived from AD) The security groups that the user is associated with. |
| Featured | Whether the user is flagged as a featured user in the platform. |
| Location | Location of the user as provided by Workday or Active Directory. |
| Last login | Last date and time the user accessed Cortex XSIAM. |
| Asset role | Asset roles that the user is associated with. |
Hosts tab fields
| Field | Description |
|---|---|
| Starred | Whether the host is included in the watchlist. |
| Hostname | Unique ID of the host. |
| Score | Host score. |
| IP | IP on which the endpoint is running. |
| Has XDR agent | Whether the endpoint has an XDR agent installed. |
| Users | Users assigned to the endpoint. |
| Agent installation date | Date and time that the XDR agent was installed. |
| Last communication | Date and time of last communication. |
| Operating system | Operating system with which the endpoint is running. |
| Endpoint isolated | Whether the endpoint is isolated. |
| Featured | Whether the host is flagged as a featured host in the platform. |
| Tags | Endpoint tags applied to the host. |
| Group names | User groups that the host is associated with. |
| Asset role | Asset roles that the host is associated with. |
Note
Some User Associated Insights may not appear as part of the User Associated Incidents due to the insight generation mechanism. For example, when an insight related to one of the assets in an incident is generated a few days after the associated incident, the insight may not be associated with the incident.
Asset configurations
Asset configurations help Cortex XSIAM apply organizational context to monitored assets. Define network configurations, organize assets into applications, and manage user and endpoint roles to support asset analysis and investigation.
The Configurations page includes:
- Network configurations
- Application Criteria
- Asset Roles
Network configurations
Network asset visibility is an investigative tool for discovering rogue devices and preventing malicious activity within your environment. By defining your network boundaries, you reduce the amount of manual research required to distinguish between managed and unmanaged assets, identify internal assets, and monitor data communications moving in and out of your network.
Configure network parameters
Navigate to Inventory → Assets → Configurations → Network to define the boundaries of your organization's network. The configuration page allows you to set:
Internal IP Address Ranges
By default, Cortex XSIAM automatically populates private network ranges based on industry-approved reserved ranges. To define custom internal ranges, click Add New Range. You can manually enter a name and IP address, range, or CIDR notation, or you can upload a CSV file.
Note
You can add a new range that is fully contained within an existing range, but you cannot add a new range that partially intersects with another.
External IP Address Ranges
Notice
This feature is included with the Attack Surface Management (ASM) add-on.
All external IPv4 and IPv6 address ranges that Cortex XSIAM has discovered through ASM scans and attributed to your organization are listed here, including details such as the first/last IP address, active responsive IPs count, and ASN handles.
Internal Domain Suffixes
Internal domain suffixes are DNS domain suffixes that are used within your internal network. Adding your domains here allows Cortex XSIAM to use them for analytics engine profiling. Click +Add to enter a new domain suffix to your domains list.
Trusted Networks
You can define networks that are considered safe or authorized within your environment. To add a trusted network, click Add trusted network. You can manually provide a name, optional description, and the CIDR block or you can upload a CSV file to bulk import multiple networks.
Configure your network parameters
Internal IP address ranges and domain names must be defined in order to track and identify assets in the network. This enables Cortex XSIAM to analyze, locate, and display your network assets.
Define internal IP address ranges
- In Cortex XSIAM, select Assets Network Configuration.
-
Define an IP address range.
By default, Cortex XSIAM creates Private Network ranges that specify reserved industry-approved ranges. These ranges can only be renamed.
To Add New Range, select either:
- Create New.
-
In the Create IP Address Range dialog box, enter the IP address Name and IP Address, Range or CIDR values.
Note
You can add a range that is fully contained in an existing range, however, you cannot add a new range that partially intersects with another range.
-
Click Save.
-
- Upload from File
- In the Upload IP Address Range dialogue box, drag and drop or search for a CSV file listing the IP address ranges. Download example file to view the correct format.
- Click Add.
- Create New.
View external IP address ranges
Notice
Viewing external IP address ranges requires the Attack Surface Management add-on.
An external IP address range is an IPv4 or IPv6 address range that Cortex XSIAM has discovered through ASM scans and attributed to your organization. The complete list of external IP Address Ranges can be viewed on the External IP Address Ranges page, as explained in the following steps. External IP address range information is also available on asset details pages when an external IP address is used to attribute an asset to your organization.
- In Cortex XSIAM, select Assets → Network Configuration → IP Address Ranges → External IP Address Ranges.
-
Review your external IP address ranges, as needed.
The IP Address Ranges table displays the following fields:
- First IP Address: First IP address value of the defined range
- Last IP Address: Last IP address value of the defined range.
- IPs Count: Number of IP addresses in the range.
- Active Responsive IPS count: Number of IP addresses in the range that are currently active and responsive.
- Business Units: Business units associated with this external IP range.
- Date Added: The first time that Cortex XSIAM identified this IP Range.
- Organization Handles: Unique identifiers for the organizations managing the IP range.
- Display details about an external IP range by selecting a row in the table.
The detailed view is displayed to the right of the table. External IP address range details include registration data, which Cortex XSIAM pulls from public RIR (Regional Internet Registries) databases. Registration data includes network records and organization records.
Define domain names
- Select Assets → Network Configuration → Internal Domain Suffixes.
- In the Internal Domain Suffixes section, +Add the domain suffix you want to include as part of your internal network. For example,
acme.com. - Select to add to the Domains List.
IP address ranges fields
| FIELD | DESCRIPTION |
|---|---|
| Range Name | Name of the IP address range defined. |
| First IP Address | First IP address value of the defined range. |
| Last IP Address | Last IP address value of the defined range. |
| Active Assets | Number of assets within the defined range that have reported Cortex Agent logs or appeared in your Network Firewall Logs. |
| Active Managed Assets | Number of assets within the defined range reported Cortex XSIAM Agent logs. |
| Modified By | Username of the user who last changed the range. |
| Modification Time | The timestamp shows when this range was last changed. |
Define trusted networks
- Select Assets → Network Configuration → Trusted Networks.
- Click Add trusted network:
- To manually add a trusted network, select Create new and enter the name, description, and CIDR. Click Update to add the network.
- To upload .CSV file, select Upload from file. Every row in the file must contain a value for name and CIDR range. You can download a sample file to view the correct format. Click Upload to add the networks.
Application criteria
You can define and group assets into applications using two primary methods:
- New Application: Manually build an application by selecting starting assets from either the code side (VCS repositories) or the run side (cloud providers, Kubernetes clusters, or VPCs). Cortex XSIAM automatically identifies and adds related assets based on their connections.
- New Criteria: Automatically create and maintain applications in bulk by defining dynamic rules. You can base these criteria on Cloud tags (such as AWS tags grouping assets within a single provider), or VCS entities (automatically generating applications based on your code hierarchy, such as GitHub organizations or repositories).
Go to Inventory → Assets → Configurations → Application Criteria to add a new application or new criteria.
For more information, see: Defining Business Applications.
For information on defining applications, see Defining Business Applications.
Asset Roles
Note
Asset Roles are available only if the Identity Threat Module add-on is enabled.
The system continuously analyzes your users and endpoints, and automatically classifies them based on their activities under asset roles, for example, Domain Controller, Administrator, and Executive User. You can edit, add, and fine-tune the assets associated with each asset role at any time.
Fine-tuned asset roles aid Cortex XSIAM Analytics in the following areas.
- Enhancement of the accuracy of the analytics that runs on assets, enabling better detection of uncommon activities by the asset based on the baseline for the asset role.
- Asset role visualization in the Incident view, the User view, and the Host view as background information for risk assessment.
- Analysis of User and Host peer groups for score trend comparison over selected timelines.
You can add users and endpoints to any asset role manually or by importing a CSV file.
You can remove users from asset roles manually and override the automatically detected asset roles.
The tag family for asset roles provides the ability to slice and dice alerts and incidents. Automated and customizable asset role classification is based on constant analysis of the users and hosts in your network. You can edit and manage the User Asset Roles and Host Asset Roles to meet the needs of your organization.
The asset roles configuration page displays the asset roles, their type, the number of assets that are associated with each asset role, and the last modification date. On this page, you can refresh the data, filter it, and change the layout.
To edit an asset role, right-click and select Edit Asset Role. Depending on the type of asset, you can manage the user asset role list or the endpoint asset role list for the asset role.
Manage Asset Roles for Endpoints
Note
The Identity Security Module add-on is required in order have the ability to explicitly edit the host lists assigned to asset roles.
You may want to exclude some endpoints from certain roles even if Cortex XSIAM automatically detected the endpoint as having this asset role. For example, if an endpoint is reassigned to another user and you want their Analytics behavioral baselines to be adjusted accordingly.
To access the management page, navigate to Inventory → Assets → Configurations → Asset Roles, right-click an endpoint asset role, and select Edit Asset Role. The Endpoints list on the page displays the endpoints classified under the asset role, whether the asset role was assigned automatically or edited manually for the endpoint, the last modification date, and the modifier.
When editing an asset role, there are two primary lists:
- Included Endpoints: Displays all the endpoints Cortex XSIAM automatically detects as having this asset role, as well as any endpoints you have manually added.
- Excluded Endpoints: Displays the endpoints that were manually removed from the asset role.
Endpoint role actions
- Exclude an Endpoint: If you want to remove an endpoint from an asset role, right-click the endpoint in the included list and select Exclude Endpoint. When you exclude an endpoint, it moves to the Excluded Endpoints list. This ensures that even if the endpoint exhibits behavior matching this role in the future, the automatic detection is overridden and the endpoint remains excluded. By default, excluding an endpoint also removes it from any parent asset roles.
- Advanced Exclusion Settings: To remove an endpoint from a child asset role but leave it in its parent asset roles, click Advanced Exclusion Settings and select Don't Exclude next to the name of the parent role.
- Manually Add an Endpoint: Click Add Endpoint to manually assign a role to a host. You can select the endpoint from a displayed list of hosts managed by your tenant. Note that you can only manually add endpoints that have the Cortex XSIAM agent installed on them. Manually added endpoints are analyzed by the Analytics engine on its next run and appear in the Host Risk View and User Risk View.
- Delete vs. Exclude: If you right-click and select Delete Endpoint on a manually added endpoint, it is removed from the included list. If the system automatically detects it acting in that role in the future, it is added back. If you want to prevent it from ever being added back, you must Exclude it instead.
- Rename an Endpoint: To change the name of an endpoint, right-click the endpoint name and select Edit Endpoint.
Manage Asset Roles for Users
Note
User Role Management is available only if the Identity Threat Module add-on is enabled.
You may want to manually exclude users from certain asset roles if a user's position in the organization changes and you want their Analytics baselines adjusted accordingly
To access the management page, navigate to Inventory → Assets → Configurations → Asset Roles, right-click a user asset role, and select Edit Asset Role. Note that some asset roles are nested under parent roles higher in the hierarchy. For example, an Admin User asset role may be a child asset role of the parent asset role Sensitive User. You can hover over the information icon next to a role's name to see its parent rule.
When editing an asset role, there are two primary lists:
- Included Users: Displays all the users Cortex XSIAM automatically detects as having this asset role, as well as any users you have manually added.
- Excluded Users: Displays the users that were manually removed from the asset role.
User role actions
- Exclude a User: Right-click a user in the included list and select Exclude User. The user moves to the Excluded list, which overrides future automatic detections and ensures they are not added back to the role. By default, Cortex XSIAM also removes the user from the parent asset roles.
- Advanced Exclusion Settings: To remove a user from a child asset role but leave them in any parent asset roles, click Advanced Exclusion Settings and select Don't Exclude next to the name of the parent role.
- Manually Add Users: Click Add User to manually assign a role. To add users one by one, click Add New and type the usernames using the exact
Netbios\samAccountformat. To add users in bulk, click Import from File and upload a structured CSV. - Delete vs. Exclude: If you right-click and select Delete User on a manually added user, the user is removed from the included list. If the system automatically detects the user acting in that role in the future, they appear in the included list again. To permanently prevent them from being associated with the role, you must use the Exclude action.
To change the name of a user, right-click the user name and Edit User.
Honey user
Prerequisite
The honey user role is available only if the Identity Threat Module add-on is enabled.
A honey user is a decoy account designed to mimic a legitimate user within your environment. This kind of user looks attractive to potential attackers, with access to many assets, and is used for triggering alerts if accessed.
One of the techniques used by an attacker trying to gain access to your network is attempting to use the credentials of accounts in your organization. By setting up honey users, you can detect these access attempts as soon as they occur. Unlike genuine user accounts, honey users have no legitimate purpose within the organization, making any activity involving them inherently suspicious. Cortex XSIAM uses its out-of-the-box Identity Threat Module to automatically detect activity on the honey user role for identifying suspicious activities.
To use a honey user account for detection, you must configure it manually.
Configure a honey user
- In Inventory → Assets → Configurations → Asset Roles, right click to select Honey User.
- Click Edit Asset Role.
- Select Add User → Add New and enter the honey user account details in the NetBIOS\SAM Account format.
Vulnerability Assessment
Cortex XSIAM vulnerability assessment enables you to identify and quantify the security vulnerabilities on an endpoint. After evaluating the risks to which each endpoint is exposed and the vulnerability status of an installed application in your network, you can mitigate and patch these vulnerabilities on all the endpoints in your organization.
License Type
The Vulnerability Assessment feature is included with Cortex XSIAM Enterprise and with Cortex XSIAM NG SIEM with a Host Insights license. If you have a Cloud Posture Security, Cloud Runtime Security, or Cortex XSIAM Premium license, use the Vulnerability Management feature. For more information, see Vulnerability management in Cortex XSIAM.
You can access the vulnerability assessment feature by navigating to Inventory → Endpoints → Host Insights → Vulnerability Assessment. Cortex XSIAM uses an advanced algorithm to collect extensive details on common vulnerabilities and exposures from comprehensive databases and to produce an in-depth analysis of endpoint vulnerabilities. Cortex XSIAM retrieves the latest information from the NIST public database to calculate the severity score.
Vulnerability Assessment
Vulnerability Assessment uses an advanced algorithm to collect extensive details on CVEs from comprehensive databases and to produce an in-depth analysis of the endpoint vulnerabilities.
The following are prerequisites for Cortex XSIAM to perform an Enhanced Vulnerability Assessment of your endpoints.
| Requirement | Description |
|---|---|
| Supported Platforms | <ul><li><p>Windows</p><ul><li>Cortex XDR agent 8.3 or a later release.</li><li>Cortex XSIAM collects all the information about the operating system and the installed applications, and calculates CVE.</li><li>CVEs that apply to applications that are installed by one user aren't detected when another user without the application installed is logged in during the scan.</li></ul></li><li><p>MacOS</p><ul><li>Cortex XDR agent 8.3 or a later release.</li><li>Cortex XSIAM collects all the information about the operating system and the installed applications, and calculates CVE.</li></ul></li></ul> |
| Setup and Permissions | Ensure Host Inventory Data Collection is enabled for your Cortex XDR agent. |
| Certificates for Windows and macOS | <p>When Advanced Vulnerability and Assessment is enabled, these certificates are a prerequisite for Windows and macOS. </p><p>Download the certificates provided below.</p><ul><li>Import the Digicert Trusted Root G4 certificate into the Trusted Root Certification Authorities store in the local machine.</li><li><p>In some environments, if the scan does not initialize, the DigiCert Trusted G4 Code Signing RSA4096 SHA384 2021 CA1 certificate, may also be required.</p><p>Import the signed certificate into the Intermediate Certification Authorities store in the local machine.</p></li></ul> |
| Limitations | <ul><li>Some CVEs may be outdated if the Cortex XDR agent wasn't updated recently.</li><li>Application versions which have reached end-of-life (EOL) may have their version listed as 0. This doesn't affect the detection of the CVEs.</li><li>Some applications are listed twice. One of the instances may display invalid version, however, this doesn't affect the functionality.</li><li>The scanning process may impact performance on the Cortex XDR agent during scanning. The scan may take up to two minutes.</li></ul> |
After enabling the feature for the first time, it may take up to a week to get the updated data into the platform. Re-collecting the data from all endpoints in your network could take up to 6 hours. After that, Cortex XSIAM initiates periodical recalculations to rescan the endpoints and retrieve the updated data. If at any point you want to force data recalculation, click Recalculate. The recalculation performed by any user on a tenant updates the list displayed to every user on the same tenant.
CVE Analysis
To evaluate the extent and severity of each CVE across your endpoints, you can drill down into each CVE in Cortex XSIAM and view all the endpoints and applications in your environment that are impacted by the CVE. Cortex XSIAM retrieves the latest information from the NIST public database. From Inventory → Endpoints → Host Inventory → Vulnerability Assessment, select CVEs on the upper-right bar. This information is also available in the va_cves dataset, which you can use to build queries in XQL Search.
If you have the Identity Threat Module enabled, you can also view the CVE analysis in the Host Risk View. To do so, from Inventory → Assets → Asset Scores, select the Hosts tab, right click on any endpoint, and select Open Host Risk View.
For each vulnerability, Cortex XSIAM displays the following default and optional values.
| Value | Description |
|---|---|
| Affected endpoints | The number of endpoints that are currently affected by this CVE. For excluded CVEs, the affected endpoints are N/A. |
| Applications | The names of the applications affected by this CVE. |
| CVE | <p>The name of the CVE.</p><div data-gb-custom-block data-tag="hint" data-style="info" class="hint hint-info"><h3>Tip</h3><p>You can click each individual CVE to view in-depth details about it on a panel that appears on the right.</p></div> |
| Description | The general NIST description of the CVE. |
| Excluded | Indicates whether this CVE is excluded from all endpoint and application views and filters, and from all Host Insights widgets. |
| Platforms | The name and version of the operating system affected by this CVE. |
| Severity | The severity level (Critical, High, Medium, or Low) of the CVE as ranked in the NIST database. |
| Severity score | The CVE severity score is based on the NIST Common Vulnerability Scoring System (CVSS). Click the score to see the full CVSS description. |
You can perform the following actions from Cortex XSIAM as you analyze the existing vulnerabilities:
- View CVE details: Left-click the CVE to view in-depth details about it on a panel that appears on the right. Use the in-panel links as needed.
- View a complete list of all endpoints in your network that are impacted by a CVE: Right-click the CVE and then select View affected endpoints.
- Learn more about the applications in your network that are impacted by a CVE: Right-click the CVE and then select View applications.
-
Exclude irrelevant CVEs from your endpoints and applications analysis: Right-click the CVE and then select Exclude. You can add a comment if needed, as well as Report CVE as incorrect for further analysis and investigation by Palo Alto Networks. The CVE is grayed out and labeled Excluded and no longer appears on the Endpoints and Applications views in Vulnerability Assessment, or in the Host Insights widgets. To restore the CVE, you can right-click the CVE and Undo exclusion at any time.
NOTE:
The CVE will be removed/reinstated to all views, filters, and widgets after the next vulnerability recalculation.
Endpoint Analysis
To help you assess the vulnerability status of an endpoint, Cortex XSIAM provides a full list of all installed applications and existing CVEs per endpoint and also assigns each endpoint a vulnerability severity score that reflects the highest NIST vulnerability score detected on the endpoint. This information helps you to determine the best course of action for remediating each endpoint. From Inventory → Endpoints → Host Inventory → Vulnerability Assessment, select Endpoints on the upper-right bar. This information is also available in the va_endpoints dataset. In addition, the host_inventory_endpoints preset lists all endpoints, CVE data, and additional metadata regarding the endpoint information. You can use this dataset and preset to build queries in XQL Search.
For each vulnerability, Cortex XSIAM displays the following default and optional values.
| Value | Description |
|---|---|
| CVEs | A list of all CVEs that exist on applications that are installed on the endpoint. |
| Endpoint ID | Unique ID assigned by Cortex XSIAM that identifies the endpoint. |
| Endpoint name | <p>Hostname of the endpoint.</p><div data-gb-custom-block data-tag="hint" data-style="info" class="hint hint-info"><h3>Tip</h3><p>You can click each individual endpoint to view in-depth details about it on a panel that appears on the right.</p></div> |
| Last Reported Timestamp | The date and time of the last time the Cortex XDR agent started the process of reporting its application inventory to Cortex XSIAM. |
| MAC address | The MAC address associated with the endpoint. |
| IP address | The IP address associated with the endpoint. |
| Platform | The name of the platform running on the endpoint. |
| Severity | The severity level (Critical, High, Medium, or Low) of the CVE as ranked in the NIST database. |
| Severity score | The CVE severity score based on the NIST Common Vulnerability Scoring System (CVSS). Click the score to see the full CVSS description. |
You can perform the following actions from Cortex XSIAM as you investigate and remediate your endpoints:
- View endpoint details: Left-click the endpoint to view in-depth details about it on a panel that appears on the right. Use the in-panel links as needed.
- View a complete list of all applications installed on an endpoint: Right-click the endpoint and then select View installed applications. This list includes the application name, and version, of applications on the endpoint. If an installed application has known vulnerabilities, Cortex XSIAM also displays the list of CVEs and the highest Severity.
- (Windows only) Isolate an endpoint from your network: Right-click the endpoint and then select Isolate the endpoint before or during your remediation to allow the Cortex XSIAM agent to communicate only with Cortex XSIAM .
- (Windows only) View a complete list of all KBs installed on an endpoint: Right-click the endpoint and then select View installed KBs. This list includes all the Microsoft Windows patches that were installed on the endpoint and a link to the Microsoft official Knowledge Base (KB) support article. This information is also available in the
host_inventory_kbspreset, which you can use to build queries in XQL Search. - Retrieve an updated list of applications installed on an endpoint: Right-click the endpoint and then select Rescan endpoint.
Application Analysis
You can assess the vulnerability status of applications in your network using the Host inventory. Cortex XSIAM compiles an application inventory of all the applications installed in your network by collecting from each Cortex XDR agent the list of installed applications. For each application on the list, you can see the existing CVEs and the vulnerability severity score that reflects the highest NIST vulnerability score detected for the application. Any new application installed on the endpoint will appear in Cortex XSIAM within 24 hours. Alternatively, you can re-scan the endpoint to retrieve the most updated list.
Note
Starting with macOS 10.15, Mac built-in system applications are not reported by the Cortex XDR agent and are not part of the Cortex XSIAM Application Inventory.
From Inventory → Endpoints → Host Inventory, select Applications.
- To view the details of all the endpoints in your network on which an application is installed, right-click the application and select View endpoints.
- To view in-depth details about the application, left-click the application name.
Query the asset inventory via XQL
While the asset inventory provides extensive filtering capabilities, you may need to perform complex, programmatic searches across your environment. The entire asset inventory is available to be queried via XQL using the asset_inventory dataset.
For advanced identity use cases, such as Cloud Infrastructure Entitlements Management (CIEM) permissions analysis, you should use the ciem_permissions_with_last_access dataset. This dataset contains the permissions of each identity discovered in your environments, including the time of their last access, providing deep visibility into identities and permissions.
Key asset fields
When querying the asset_inventory dataset, Cortex XSIAM uses the normalized Cortex Data Model (XDM) schema. Here is a reference list of the most important xdm.asset.* fields you should know for your queries.
Identity and classification:
- xdm.asset.id: The unique asset identifier.
- xdm.asset.name: The human-readable asset name.
- xdm.asset.type.class: The broad asset class, such as Compute, Identity, AI, or Network.
- xdm.asset.type.category: The category within the class, such as Database, Storage Bucket, or Model Endpoint.
- xdm.asset.provider: The cloud provider (e.g., AWS, GCP, AZURE) or data source.
- xdm.asset.realm: The account, subscription, or project the asset belongs to.
Location and configuration:
- xdm.cloud.region: The cloud region (e.g., US-EAST-1).
- xdm.cloud.zone: The availability zone.
- xdm.asset.normalized_fields: A JSON blob containing normalized, cross-provider fields.
- xdm.asset.raw_fields: A JSON blob containing all of the raw, provider-specific data collected from the source.
Security context and timing:
- xdm.asset.group_ids: Identifies the asset's group memberships (used for SBAC scoping).
- xdm.asset.issues_critical / xdm.asset.cases_critical: The count of critical issues or cases linked to this asset.
- xdm.asset.first_observed / xdm.asset.last_observed: Timestamps indicating when the asset was first and last seen by Cortex XSIAM.
Asset query examples
The following are examples of how to combine the asset_inventory dataset with the key XDM fields to find specific resources.
Find all AWS Compute Instances:
dataset = asset_inventory| filter xdm.asset.provider = "AWS" AND xdm.asset.type.class = "Compute"
Find assets in a specific cloud region:
dataset = asset_inventory| filter xdm.cloud.region = "US-EAST-1"
Search for specific database assets by name:
dataset = asset_inventory| filter xdm.asset.name contains "prod-db"| limit 10
Threat management
Detection rules
Cortex XSIAM detection rules identify suspicious activity and generate issues for investigation.
Use IOC rules for known artifacts. Use BIOC rules for suspicious behavior. Use correlation rules to connect events across sources.
Explore detection rules
- what-are-detection-rules
- whats-an-ioc
- whats-a-bioc
- whats-a-correlation-rule
- manage-ioc-and-bioc-rules
What are detection rules?
Cortex XSIAM uses rules to detect threats in your network and to generate issues. You can add specific detection rules for which you want Cortex XSIAM to generate issues. The following are the different types of rules available:
- Indicators of compromise (IOCs): IOCs are used to alert for known artifacts that are considered malicious or suspicious. IOCs are static, simple, and based on the detection of criteria such as SHA256 hashes, IP addresses and domains, file names, and paths. You create IOC rules based on information you gather from various threat-intelligence feeds or as a result of an investigation within Cortex XSIAM. For example, if you find out that a certain ransomware uses a certain file hash, you can add the file hash as an IOC and generate an issue if it is detected.
- Behavioral indicators of compromise (BIOCs): BIOCs detect suspicious behavior. As you identify specific activities (network, process, file, registry, etc) that indicate a threat, you create BIOCs that can alert you when the behavior is detected. If you enable Cortex XSIAM Analytics, Cortex XSIAM can use Analytics BIOCs (ABIOCs) to establish baseline behavior and detect any deviation from this behavior.
- Correlation Rules: Correlation rules help you analyze the relationship between multiple events from multiple sources by using the Cortex Query Language (XQL) based engine.
What's an IOC?
Indicators of compromise (IOCs) enable Cortex XSIAM to generate issues about known malicious objects on endpoints across the organization. You can load collections of IOCs from threat-intelligence sources into Cortex XSIAM or define them individually.
Note
Cortex XSIAM supports a maximum of 4,000,000 IOCs.
You can define the following types of IOCs:
- Full path
- File name
- Domain
- Destination IP address
- MD5 hash
- SHA256 hash
After you load or define IOCs, the tenant checks for matches in the xdr_data dataset that contains all the information collected about the endpoints and the network. Cortex XSIAM looks for IOC matches in all data collected in the past and continues to evaluate any new data it receives in the future.
Issues for IOCs are identified by the source type of the IOC.
IOC rule details
In the Threat Management → Detection Rules → IOC page, you can view all configured or uploaded indicators of compromise (IOCs). To view the number of IOC rules, filter by one or more fields in the IOC rules table. You can also manage or clone existing rules.
The following table describes the fields that are available for each IOC rule in alphabetical order.
| Field | Description |
|---|---|
| # OF ISSUES | The number of issues generated by this indicator. |
| BACKWARDS SCAN STATUS | <p>Status of the Cortex XSIAM search for the first 10,000 matches when the IOC rule was created or edited. Status can be:</p><ul><li>Done</li><li>Failed</li><li>Pending</li><li>Queued</li></ul> |
| BACKWARDS SCAN TIMESTAMP | Timestamp of the Cortex XSIAM search for the first 10,000 matches in your Cortex XSIAM when the IOC rule was created or edited. |
| BACKWARDS SCAN RETRIES | Number of times Cortex XSIAM searched for the first 10,000 matches in your Cortex XSIAM when the IOC rule was created or edited. |
| CLASS | <p>The IOC's class. For example, 'Malware'.</p><div data-gb-custom-block data-tag="hint" data-style="info" class="hint hint-info"><p>Note</p><p>Field cannot exceed 36 characters.</p></div> |
| COMMENT | Free-form comments specified when the IOC was created or modified. |
| EXPIRATION DATE | The date and time at which the IOC will be removed automatically. |
| INDICATOR | The indicator value itself. For example, if the indicator type is a destination IP address, this could be an IP address such as 1.1.1.1. |
| INSERTION DATE | Date and time when the IOC was created. |
| MODIFICATION DATE | Date and time when the IOC was last modified. |
| RELIABILITY | <p>Indicator's reliability level:</p><ul><li>A - Completely Reliable</li><li>B - Usually Reliable</li><li>C - Fairly Reliable</li><li>D - Not Usually Reliable</li><li>E - Unreliable</li></ul> |
| REPUTATION | Indicator's reputation level. One of Unknown, Good, Bad, or Suspicious. |
| RULE ID | Unique identification number for the rule. |
| SEVERITY | IOC severity that was defined when the IOC was created. |
| SOURCE | <p>User who created this IOC, or the file name from which it was created, or one of the following keywords:</p><ul><li>Public API—the indicator was uploaded using the Insert Simple Indicators, CSV or Insert Simple Indicators, JSON REST APIs.</li><li>XSOAR TIM—the indicator was retrieved from XSOAR.</li></ul> |
| STATUS | Enabled or Disabled. |
| TYPE | Type of indicator: Full path, File name, Host name, Destination IP, MD5 hash. |
| VENDORS | A list of threat intelligence vendors from which this IOC was obtained. |
Create an IOC rule
Create new indicator of compromise (IOC) rules and optionally define rule expiration for all IOC rules. You can create an IOC rule either by configuring a single one or by uploading a file that contains multiple IOCs.
Note
To ensure your IOC rules generate issues efficiently and do not overcrowd your Issues table, Cortex XSIAM automatically does the following:
- Disables any IOC rules that reach 5000 or more hits over 24 hours.
- Creates a rule exception based on the PROCESS SHA256 field for IOC rules that hit more than 100 endpoints over 72 hours.
If you have the Threat Intel Management add-on included in your license, create an indicator detection rule for File, Domain, and IP Address indicators rather than creating an IOC. For more information, see Generate issues from indicators using indicator rules for prevention and detection.
- In Threat Management → Detection Rules → IOC, select + Add IOC.
- Configure the IOC criteria.
Configure a single IOC
Configure a single IOC
After investigating a threat, if you identify a malicious artifact, you can generate an issue for the Single IOC right away.
- Configure the INDICATOR value on which you want to match.
- Configure the IOC TYPE. Options are Full Path, File Name, Domain, Destination IP, and MD5 or SHA256 Hash.
- Configure the SEVERITY you want to associate with the issue for the IOC.
- (Optional) Enter a comment that describes the IOC.
- (Optional) Configure the IOC's REPUTATION and its RELIABILITY.
- (Optional) Configure the EXPIRATION settings for this IOC. Default, Specific Expiration Date, No Expiration.
- Click Save.
Upload multiple IOCs
Upload multiple IOCs
If you want to match multiple indicators, you can upload the criteria in a CSV file. You can upload IOCs using REST APIs in either CSV or JSON format.
Upload a file, one IOC per line, that contains up to 20,000 IOCs. For example, you can upload multiple file paths and MD5 hashes for an IOC rule. To help you format the upload file in the syntax that Cortex XSIAM accepts, you can download the example file.
- Select Upload File.
-
Drag and drop the CSV file containing the IOC criteria in the drop area of the Upload File dialog or Browse for the file.
Cortex XSIAM supports files with multiple IOCs in a pre-configured format. For help in determining the format syntax, download the example text file.
- Configure the SEVERITY you want to associate with the issue for the IOCs.
- Define the DATA FORMAT of the IOCs in the CSV file. Options are Mixed, Full Path, File Name, Domain, Destination IP, and MD5 or SHA256 Hash.
- (Optional) Configure the IOC's REPUTATION and its RELIABILITY.
- (Optional) Enter an EXPIRATION for the IOC. Default, Specific Expiration Date, No Expiration.
-
Click Upload.
-
(Optional) Define any expiration criteria for your IOC rules.
You can also configure additional expiration criteria per IOC type to apply to all IOC rules of that type. In most cases, IOC types like Destination IP or Host Name are considered malicious only for a short period of time since they are soon cleaned and then used by legitimate services, from which time they only cause false positives. For these types of IOCs, you can set a defined expiration period. The expiration criteria you define for an IOC type will apply to all existing rules and additional rules that you create in the future. By default, Cortex XSIAM does not apply an expiration date set on IOCs.
- Select Default Rule Expiration.
- Set the expiration for any relevant IOC type. Options are Never, 7 Days, 30 days, 90 days, or 180 days.
- Click Save.
What's a BIOC?
Behavioral indicators of compromise (BIOCs) enable you to alert and respond to behaviors—tactics, techniques, and procedures. Instead of hashes and other traditional indicators of compromise, BIOC rules detect behavior related to processes, registry, files, and network activity.
To benefit from the latest threat research, the Cortex XSIAM tenant automatically receives pre-configured rules from Palo Alto Networks. These global rules are delivered to all tenants with content updates. When you need to override a global BIOC rule, you can disable it or set a rule exception. As you investigate threats on your network and endpoints, you can also configure additional BIOC rules. BIOC rules are highly customizable; you can create a BIOC rule that is simple or quite complex.
As soon as you create or enable a BIOC rule, the tenant begins to monitor input feeds for matches. It also analyzes historical data collected in the tenant. When there is a match on a BIOC rule, Cortex XSIAM generates an issue.
To further enhance the BIOC rule capabilities, you can also configure BIOC rules as custom prevention rules and incorporate them with your Restrictions profiles. The tenant can then generate behavioral threat prevention issues based on your custom prevention rules in addition to the BIOC detection issues.
BIOC rule details
Manage your behavioral indicator of compromise (BIOC) rules in Threat Management → Detection Rules → BIOC.
If you are assigned a role that enables Investigation → Rules privileges, you can view all user-defined and preconfigured rules for behavioral indicators of compromise (BIOCs).
If you have Cortex XSIAM Analytics enabled, you can also view Analytics BIOCs (ABIOCs) on a separate page. To access this page, click Analytics BIOC Rules next to the refresh icon at the top of the page.
Each page displays fields that are relevant to the specific rule type.
BIOC rule fields
By default, the BIOC Rules page displays all enabled rules. To search for a specific rule, use the filters above the results table to narrow the results. You can also manage existing rules using the right-click pivot menu.
The following table describes the fields that are available for each BIOC rule in alphabetical order.
| Field | Description |
|---|---|
| # OF ISSUES | The number of incidents generated by this rule. |
| BACKWARDS SCAN STATUS | Status of the Cortex XSIAM search for the first 10,000 matches when the BIOC rule was created or edited. Status can be: - Done - Failed - Pending - Queued |
| BACKWARDS SCAN TIMESTAMP | Timestamp of the Cortex XSIAM search for the first 10,000 matches in your Cortex XSIAM when the BIOC rule was created or edited. |
| BACKWARDS SCAN RETRIES | Number of times Cortex XSIAM searched for the first 10,000 matches in your Cortex XSIAM when the BIOC rule was created or edited. |
| BEHAVIOR | A schematic of the behavior of the rule. |
| COMMENT | Free-form comments specified when the BIOC was created or modified. |
| EXCEPTIONS | Exceptions to the BIOC rule. When there's a match on the exception, the event will not generate an incident. |
| GLOBAL RULE ID | Unique identification number assigned to rules created by Palo Alto Networks. |
| INSERTION DATE | Date and time when the BIOC rule was created. |
| MITRE ATT&CK TACTIC | Displays the type of MITRE ATT&CK tactic the BIOC rule is attempting to trigger on. |
| MITRE ATT&CK TECHNIQUE | Displays the type of MITRE ATT&CK technique and sub-technique the BIOC rule is attempting to trigger on. |
| MODIFICATION DATE | Date and time when the BIOC was last modified. |
| NAME | Unique name that describes the rule. Global BIOC rules defined by Palo Alto Networks are indicated with a blue dot and cannot be modified or deleted. |
| RULE ID | Unique identification number for the rule. |
| TYPE | Type of BIOC rule: - Collection - Credential Access - Dropper - Evasion - Execution - Evasive - Exfiltration - File Privilege Manipulation - File Type Obfuscation - Infiltration - Lateral Movement - Other - Persistence - Privilege Escalation - Reconnaissance - Tampering |
| SEVERITY | BIOC severity that was defined when the BIOC was created. |
| SOURCE | User who created this BIOC, the file name from which it was created, or Palo Alto Networks if delivered through content updates. |
| STATUS | - Enabled - Partially Enabled (Agent Disabled) - Partially Enabled (Server Disabled) - Disabled When you hover over a rule that's disabled, a pop-up message appears to provide more information about the Disable action. |
| USED IN PROFILES | Displays if the BIOC rule is associated with a Restriction profile. |
Analytics BIOC rule fields
By default, the Analytics BIOC Rules page displays all enabled rules. To search for a specific rule, use the filters above the results table to narrow the results. You can also disable and enable rules using the right-click pivot menu.
The following table describes the fields that are available for each Analytics BIOC rule in alphabetical order.
| Field | Description |
|---|---|
| Activation Prerequisites | Displays a description of the prerequisites Cortex XSIAM requires in order to activate the rule. |
| Description | Description of the behavior that will generate the issue. |
| # OF HITS | The number of hits (matches) on this rule. |
| NAME | Unique name that describes the rule. New rules are identified with a blue badge icon. |
| SEVERITY | BIOC severity that was defined when the BIOC rule was created. Severity levels can be Low, Medium, High, Critical, and Multiple. Multiple severity BIOC rules can generat incidents with different severity levels. Hover over the flag to see the severities defined for the rule. |
| STATUS | Displays whether the rule is Enabled, Disabled, or Pending Activation. Rules that are Pending Activation are in the process of collecting the data required to enable the rule. Hover over the field to view how much data has already been collected within a certain period of time. |
| TAGS | Filter the results according to Detector Tags. This tag enables you to filter for specific detectors such as Identity Threat, Identity Analytics, and others. |
Create a BIOC rule
When you identify a threat and its characteristics, you can configure rules for behavioral indicators of compromise (BIOCs) for this threat.
You can create a BIOC rule either by configuring a single one or by uploading a file that contains multiple BIOCs.
After you create a BIOC rule, Cortex XSIAM searches for the first 10,000 matches in your tenant and generates an issue if a match is detected. After the initial scan, Cortex XSIAM generates issues every time a new match is detected.
You can also use BIOC rules to create prevention rules that terminate the causality chain of a malicious process and generate Cortex XSIAM Agent behavioral prevention type issues.
Note
To ensure your BIOC rules generate issues efficiently and do not overcrowd your Issues table, Cortex XSIAM automatically does the following:
- Disables BIOC rules that reach 5000 or more hits over a 24-hour period.
- Creates a rule exception based on the PROCESS SHA256 field for BIOC rules that hit more than 100 endpoints over a 72 hour period
Create a BIOC rule from scratch
You can create a new BIOC rule in a similar way as you create a search with Query Builder or by building the rule query with XQL Search. In both methods, use Cortex Query Language (XQL) to define the rule using XQL syntax. The XQL query must at a minimum filter on the event_type field in order for it to be a valid BIOC rule. In addition, you can create BIOC rules using the xdr_data and cloud_audit_log datasets and presets for these datasets.
Note
- A
cloud_audit_logdataset requires a Cortex XSIAM Pro per GB license. - Currently, you cannot create a BIOC rule on customized datasets and only the
filterstage,alterstage, and functions without any aggregations are supported for XQL queries that define a BIOC. - For BIOC rules, the field values in XQL are evaluated as case insensitive (
config case_sensitive = false).
The following is an example of creating a BIOC rule in XQL.
dataset = xdr_data | filter event_type = PROCESS and event_sub_type = PROCESS_START and action_process_image_name ~= ".*?\.(?:pdf|docx)\.exe"
The following describes the event_type values for which you can create a BIOC rule.
FILE—Events relating to file create, write, read, and rename according to the file name and path.INJECTION—Events related to process injections.LOAD_IMAGE—Events relating to module IDs of processes.NETWORK—Events relating to incoming and outgoing network, filed IP addresses, port, host name, and protocol.PROCESS—Events relating to execution and injection of a process name, hash, path, and CMD.REGISTRY—Events relating to registry write, rename and delete according to registry path.STORY—Events relating to a combination of firewall and endpoint logs over the network.EVENT_LOG—Events relating to Windows event logs and Linux system authentication logs.
To create a BIOC rule:
- Select Threat Management → Detection Rules → BIOC.
- Select + Add BIOC.
-
Configure your BIOC criteria using one of the following methods.
Build the BIOC rule query with XQL Search.
- Click XQL Search.
- The XQL query field is where you define the parameters of your query for the BIOC rule. To help you create an effective XQL query, the search field provides suggestions as you type. The XQL query must at a minimum filter on the
event_typefield in order for it to be a valid BIOC rule. In addition, you can create BIOC rules using thexdr_dataandcloud_audit_logdatasets and presets for these datasets. Currently, you cannot create a BIOC rule on customized datasets and only thefilterstage,alterstage, and functions without any aggregations are supported for XQL queries that define a BIOC. For BIOC rules, the field values in XQL are evaluated as case insensitive (config case_sensitive = false). After configuring the XQL query for your BIOC rule and the syntax is valid, a indication is displayed, and it is possible to add the BIOC rule. -
Click Test BIOC. Rules that you do not refine enough can generate thousands of issues. It is highly recommended that you test the behavior of a new or edited BIOC rule before you save it.
When you test the rule, Cortex XSIAM immediately searches for rule matches across all your Cortex XSIAM tenant data. The results are displayed in the Query Results tab underneath the XQL query field. Adjust any rule definition as needed.
Note
To demonstrate the expected behavior of the rule before you save it, Cortex XSIAM tests the BIOC on historical logs. After you save a BIOC rule, it will operate both on historical logs (up to 10,000 hits) and on new data received from your log sensors.
- (Optional) Use the Schema tab to view schema information for every field found in the result set. This information includes the field name, data type, descriptive text (if available), and the dataset that contains the field. In order for a field to appear in the Schema tab, it must contain a non-NULL value at least once in the result set.
- Add as BIOC the new query rule configured.
Build the BIOC rule query through a specific entity.
- Select an entity icon. Define any relevant activity or characteristics for the entity type. Create a new BIOC rule in the same way that you create a search with the Query Builder. You use XQL to define the rule. The XQL query must filter on an
event_typein order for it to be a valid BIOC rule. -
Test your BIOC rule. Rules that you do not refine enough can generate thousands of issues. It is highly recommended that you test the behavior of a new or edited BIOC rule before you save it.
When you test the rule, Cortex XSIAM immediately searches for rule matches across all your Cortex XSIAM Cortex XSIAM tenant data. Adjust any rule definition as needed.
Note
To demonstrate the expected behavior of the rule before you save it, Cortex XSIAM tests the BIOC on historical logs. After you save a BIOC rule, it will operate on both historical logs (up to 10,000 hits) and new data received from your log sensors.
- Save the BIOC rule.
- Define the following parameters.
- Name—Specify a description or leave the default name which is automatically populated using the format XQL-BIOC-<rule number>.
- Type—Select a rule TYPE that describes the activity.
- Severity—Specify the Severity you want to associate with an issue generated based on this rule.
- (Optional) Select the MITRE Technique and MITRE Tactic you want to associate with the issue. You can select up to 3 MITRE Techniques/Sub-Techniques and MITRE Tactics.
- (Optional) Select the + more global exceptions to view the EXCEPTIONS associated with this BIOC rule.
- (Optional) Comment—Specify any additional comments, such as why you created the BIOC.
- Click OK.
Import multiple BIOC rules
To match multiple indicators, you can upload the criteria in a CSV file. You can upload BIOCs using REST APIs in either CSV or JSON format. Your file can be a list of BIOCs from external feeds or a file that you previously exported from Cortex XSIAM. The export/import capability is useful for rapid copying of BIOCs across different Cortex XSIAM instances.
Upload a file, one BIOC per line, that contains up to 20,000 BIOCs. For example, you can upload multiple file paths and MD5 hashes for a BIOC rule. To help you format the upload file in the syntax that Cortex XSIAM accepts, you can download the example file.
Note
You can only import files that were exported from Cortex XSIAM. You can not edit an exported file.
- Select Threat Management → Detection Rules → BIOC.
- Select Import Rules.
- Drag and drop the file on the import rules dialog or browse to a file.
-
Click Import.
Cortex XSIAM loads any BIOC rules. This process may take a few minutes depending on the size of the file.
- Refresh the BIOC Rules page to view matches (# of Hits) in your historical data.
- To investigate any matches, view the Issues page and filter the Issue Name by the name of the BIOC rule.
Configure a custom prevention rule
Note
Custom prevention rules are supported on Cortex XSIAM agent 7.2 and later versions and enable you to configure and apply user-defined BIOC rules to Restriction profiles deployed on your Windows, Mac, and Linux endpoints.
By using the BIOC rules, you can configure custom prevention rules to terminate the causality chain of a malicious process according to the Action Mode defined in the associated Restrictions Security Profile and generate Cortex XSIAM Agent behavioral prevention type issues in addition to the BIOC rule detection issues.
For example, if you configure a custom prevention rule for a BIOC Process event, apply it to the Restrictions profile with an action mode set to Block, the Cortex XSIAM agent:
- Blocks a process at the endpoint level according to the defined rule properties.
- Generates a behavioral prevention issue that you can monitor and investigate in the Issues table.
Before you configure a BIOC rule as a custom prevention rule, create a Restriction Profile for each type of operating system (OS) that you want to deploy your prevention rules.
Note the following requirements and restrictions for converting a BIOC rule into a custom prevention rule:
Supported investigation types
To be eligible for conversion into a custom prevention rule, a BIOC rule must be based on one of the following investigation types:
- file_event
- process_execution
- remote_code_execution
- network_event
- registry_event
- windows_event_log
- module_event
Available subtypes:
- file_event
- network_event
- registry_event
- windows_event_log
Query structure requirements
The structure of your XQL query is critical for custom prevention rule compatibility. Adhere to the following guidelines:
- Avoid using the
alterstage. - Select PANW as the vendor.
- If you use action_module_signature_vendor, the investigation type must be module_event.
- The
NOT INoperator is not supported for custom prevention rule conversion. If you need to exclude certain values, structure your query to use positive matching, for example includeINwithANDconditions, or use a regular expression that excludes the desired values.
Supported fields
The following table lists all fields supported for custom prevention rule conversion and specifies their OS compatibility.
| XQL Field | Supported Operating System |
| os_actor_process_image_path | Windows, macOS, Linux |
| os_actor_process_command_line | Windows, macOS, Linux |
| os_actor_process_image_md5 | Windows, macOS, Linux |
| os_actor_process_image_sha256 | Windows, macOS, Linux |
| os_actor_process_os_pid | Windows, macOS, Linux |
| action_evtlog_description | Windows |
| action_evtlog_message | Windows |
| action_evtlog_provider_name | Windows |
| action_evtlog_username | Windows |
| action_registry_key_name | Windows |
| action_registry_value_name | Windows |
| action_registry_data | Windows |
| action_module_path | Windows |
| action_module_md5 | Windows |
| action_module_sha256 | Windows |
| action_module_signature_vendor | Windows |
| actor_process_signature_vendor | Windows |
| causality_actor_process_signature_vendor | Windows |
| os_actor_process_signature_vendor | Windows |
| actor_process_signature_status | Windows |
| causality_actor_process_signature_status | Windows |
| os_actor_process_signature_status | Windows |
| action_remote_process_image_name | Windows |
| action_remote_process_image_path | Windows |
| action_remote_process_image_command_line | Windows |
| action_remote_process_os_pid | Windows |
To configure a BIOC rule as a prevention rule:
- In Threat Management → Detection Rules → BIOC, from the BIOC Rule table, filter the Source field to locate a user-defined rule you want to apply as a custom prevention rule. You can only apply a BIOC rule that you created either from scratch or a Cortex XSIAM global rule template that meets the following criteria.
- The user-defined BIOC rule does not include the following field configurations.
- All Events—Host Name
- File Event—Device Type, Device Serial Number
- Process Event—Device Type, Device Serial Number
- Network Event—Country, Raw Packet
- BIOC rules with OS scope definitions must align with the Restrictions profile OS.
- When defining the Process criteria for a user-defined BIOC rule event type, you can select to run only on actor, causality, and OS actor on Windows, and causality and OS actor on Linux and Mac.
- The user-defined BIOC rule does not include the following field configurations.
-
Test your BIOC rule.
Rules that you do not refine enough can generate thousands of issues. As a result, it is highly recommended that you test the behavior of a new or edited BIOC rule before you save it. Cortex XSIAM automatically disables BIOC rules that reach 5000 or more hits over a 24-hour period.
-
Right-click and select Add to restrictions profile.
If the rule is already referenced by one or more profiles, select See profiles to view the profile names.
- In the Add to Restrictions Profile pop-up:
- Ensure the rule you selected is compatible with the type of endpoint operating system.
-
Select the Restriction Profile name you want to apply the BIOC rule to for each of the operating systems. BIOC event rules of type Event Log and Registry are only supported by Windows OS.
Note
- You can only add to existing profiles you created, Cortex XSIAM Default profiles will not appear as an option.
- When you want to add to restrictions profile, you can only use fields or options that exist in pre-built process-type BIOCs
-
Add the BIOC rule to the selected profiles.
The BIOC rule is now configured as a custom prevention rule and applied to your Restriction profiles. After the Restriction profile is pushed to your endpoints, the custom prevention rule can start generating behavioral prevention-type issues.
- Review and edit your custom prevention rules.
- Navigate to Endpoints → Policy Management → Profiles.
- Locate the Restrictions Profile to which you applied the BIOC rule. In the Summary field, Custom Prevention Rules appears as Enabled.
- Right-click and select Edit.
- In the Custom Prevention Rules section, you can review and modify the following:
- Action Mode—Select to Enable or Disable the BIOC prevention rules.
-
Auto-disable—Select if to auto-disable a BIOC prevention rule if it triggers after a defined number of times during a defined duration.
Note
Auto-disable will turn off both the BIOC rule detection and the BIOC prevention rule.
- Prevention BIOC Rules table—Filter and maintain the BIOC rules applied to this specific Restriction Profile. Right-click to Delete a rule or Go to BIOC Rules table.
- Save your changes if necessary.
- Investigate the BIOC prevention rules issues.
- Select Cases & Issues → Issues.
- Filter the fields as follows:
- Issue Source:
XDR Agent - Action:
Prevention (<profile action mode>) - Issue Name:
Behavioral Threat
- Issue Source:
- In the Description field, you can see the rule name that generated the prevention issue.
Manage Global BIOC Rules
Manage Global BIOC Rules
Global BIOC rules are detection rules created by Cortex and distributed to the tenants. Cortex XSIAM checks automatically for the latest update of global BIOC rules and applies them. If there are no new global BIOC rules, Cortex XSIAM displays a content status of Content up to date next to the BIOC rules table heading. A dot to the left of the rule name indicates a global BIOC rule.
To see which rules are pushed by Palo Alto Networks, display the optional Source field.
Retrieve the latest global BIOC rules
- Navigate to Threat Management → Detection Rules → BIOC.
-
To view the content details, hover over the status Content up to date, to show the global rules version number and the date the global rules were checked.
The content status displays the date when the content was last updated, either automatically or manually by an administrator.
-
If the status displays Could not check update, click the status to check for updates manually.
The last updated date changes when the download is successful.
Copy global BIOC rules
You cannot directly modify a global rule, but you can copy global rules to use as a template to create new rules.
- Locate a Palo Alto Networks Source type rule, right-click and select Save as New.
- Review and modify the BIOC properties.
-
Select OK to save the rule.
The rule appears in the BIOC Rules table as a user-defined Source type rule that you can edit.
Add an exception to global BIOC rules
You cannot edit global rules, but you can add exceptions to the rule. For more information about rule exceptions, see Add a rule exception.Add an IOC or BIOC rule exception
What's a correlation rule?
Correlation rules help you analyze correlations of multiple events from multiple sources by using the Cortex Query Language (XQL) based engine for creating scheduled rules. Issues are then generated based on these correlation rules with a defined time frame and set schedule, including every X minutes, once a day, once a week, or a custom time.
Some examples of events for which you might want to create correlation rules are:
- A user has a number of failed logins, and then a successful login within a small window.
- A device on a watch list has an activity.
- A device connects to an IP that's on a watch list.
- Two specific events occur in a 10 minute window.
After you configure your correlation rules, you can manage them in Threat Management → Detection Rules → Correlations, and view and analyze the generated issues in Cases and the Issues Table. In addition, issues generated by correlation rules are factored into the number of cases displayed in the dashboards.
Correlation rule details
If you are assigned a role that enables Investigation → Rules privileges, you can manage all user-defined Correlation Rules from Threat Management → Detection Rules → Correlations.
By default, the Correlation Rules page displays all enabled rules. To search for a specific rule, use the filters above the results table to narrow the results. From the Correlation Rules page, you can manage existing rules using the right-click pivot menu. You can also import and export rules in JSON format, which can help you to transfer your configurations between environments for onboarding, migration, backup, and sharing. You can bulk export and import multiple rules at a time.
In addition, the Correlation Rules page enables you to easily identify and resolve correlation rules errors. The number of errors is indicated at the top of the page in red using the format <number> errors found. You can change the view to only display the correlation rules with errors by selecting Show Errors Only. The LAST EXECUTION column in the table indicates a correlation rule with an error by displaying the last execution time in a red font and providing a description of the correlation rule error when hovering over the field. The following error messages are displayed in the applicable scenarios.
- Invalid query
- Query timeout
- Dependency correlation did not complete
- Unknown error
- Delayed rule—This rule is running past its scheduled time, which can cause delayed results.
-
Dataset does not exist:
Note
Only an administrator can create and view queries built with an unknown dataset that currently does not exist in Cortex XSIAM .
A notification is also displayed in Cortex XSIAM to indicate these correlation rules errors.
Note
For more information on troubleshooting server errors in scheduled correlation rules, Troubleshoot server errors in scheduled correlation rules.
Correlation rule fields in alphabetical order
Note
Certain fields are exposed and hidden by default. An asterisk (*) is beside every field that is exposed by default.
| Field | Description |
|---|---|
| # OF ISSUES* | The number of issues generated by this rule. |
| ALERT CATEGORY* | Type of issue as configured when creating the rule. - Collection - Credential Access - Dropper - Evasion - Execution - Evasive - Exfiltration - File Privilege Manipulation - File Type Obfuscation - Infiltration - Lateral Movement - Persistence - Privilege Escalation - Reconnaissance - Tampering - Other |
| DATASET* | The text displayed here depends on the resulting action configured for the correlation rule when the rule was created. - alerts—When your resulting action for the rule was configured to Generate issue. - Dataset name—When your resulting action for the rule was configured to Save to dataset. |
| DESCRIPTION* | The description for the Correlation Rule that was configured when the rule was created. |
| DRILL-DOWN QUERY | Displays the Drill-Down Query that you configured for additional information about the issue for further investigation using Cortex Query Language (XQL) when you created the rule. If you did not configure one, the field is left empty. After configuration, any issue generated for the Correlation Rule has a right-click pivot menu Open Drilldown Query option, an Open drilldown query link after you investigate any contributing events, and a quick action Open Drilldown Query icon (drilldown-icon.png) that is accessible in the Issues page, which opens a new browser tab in XQL Search to run this query. If you do not define a Drill-Down Query, no right-click menu option, link, or icon is displayed. The Drill-Down Query Time Frame can be configured as either. - Generated Issue—Uses the time frame of the issue that is generated, which is the first event and last event timestamps for the issue (default option). - XQL Search—Uses the time frame from when the Correlation Rule was run in XQL Search. |
| FAILURE REASON | For a Correlation Rule with an error, displays the error message, which can be one of the following. - Invalid query - Query timeout - Dependency correlation did not complete - Unknown error - Delayed rule—This rule is running past its scheduled time, which can cause delayed results. - Dataset does not exist: Note: Only an administrator can create and view queries built with an unknown dataset that currently does not exist in Cortex XSIAM. |
| INSERTION DATE | Date and time when the Correlation Rule was created. |
| LAST EXECUTION* | Date and time when the correlation rule was last executed. Indicates a correlation rule with an error by displaying the last execution time in a red font and providing a description of the correlation rule Error when hovering over the field. |
| MITRE ATT&CK TACTIC* | Displays the type of MITRE ATT&CK tactic the correlation rule is attempting to trigger. |
| MITRE ATT&CK TECHNIQUE* | Displays the type of MITRE ATT&CK technique and sub-technique the correlation rule is attempting to trigger. |
| MODIFICATION DATE* | Date and time when the correlation rule was last modified. |
| NAME* | Unique name that describes the rule. |
| RULE ID | Unique identification number for the rule. |
| SCHEDULE* | Displays the Time Schedule for the frequency of running the XQL Search definition set for the correlation rule when the rule was created. The options displayed are one of the following. - Every 10 Minutes - Every 20 Minutes - Every 30 Minutes - Hourly - Daily - Displays the Time Schedule as Cron Expression fields. |
| SEVERITY* | Correlation rule severity that was defined when the correlation rule was created. Severity levels can be Informational, Low, Medium, High, Critical, and Customized. If a generated issue has severity Medium or above, a case is automatically opened. Low severity issues generated by correlation rules are not grouped into cases. |
| SOURCE* | User who created this correlation rule. |
| STATUS | Rule status: Enabled or Disabled. |
| SUPPRESSION DURATION* | The duration time for how long to ignore other events that match the issue suppression criteria that was configured when the rule was created. This is required to configure. |
| SUPPRESSION FIELDS* | The fields that the issue suppression is based on, which was configured when the rule was created. The fields listed are based on the XQL query result set for the rule. This is optional to configure. |
| SUPPRESSION STATUS* | Displays the Suppression Status as either Enabled or Disabled as configured when the rule was created. |
| TIME FRAME* | Displays the time frame for running a query, which can be up to 7 days as configured when the rule was created. |
| TIMEZONE | Displays the Timezone when the Time Schedule for the frequency of running the XQL Search definition set for the correlation rule is set to run daily or using a cron expression. Otherwise, this field is left empty. |
| XQL SEARCH | Displays the XQL definition for the correlation rule that was configured in XQL Search when the rule was created. |
Create a correlation rule
Prerequisite
To enable pivots from issues to a third-party source system, ensure that you know the dataset field name that contains the URL of the source system. Some vendors already provide this URL as part of their API, and you can find it in the third-party product dataset. If there is no URL, you cannot enable this feature.
You can create a new correlation rule from either the Threat Management → Detection Rules → Correlation Rules page or when building a query in XQL Search. You can also import a number of correlation rules.
When setting up correlation rules, you have the following capabilities:
- Specify whether the correlation rule is Scheduled, or scans the data in Real Time, as it’s ingested.
- Define when the correlation rule runs.
- Define whether issues generated by the correlation rule are suppressed by a duration time and a field.
- Set the resulting action for the correlation rule, which includes any of the following:
- Generate an issue: You can also define the issue settings, which include the Issues Field Mapping for incident enrichment, Issue Severity, MITRE Attack Tactics and Techniques, and other issue settings.
- Save data to a dataset: Use this option to test and fine-tune new rules before initiating issues and applying correlation of correlation use cases.
- Add data to a lookup dataset
- Remove data from a lookup dataset
Note
- To ensure your correlation rules raise issues efficiently and do not overcrowd your Issues table, Cortex XSIAM automatically disables correlation rules that reach 5000 or more hits over a 24-hour period.
- The maximum number of active scheduled correlations is 1200. This limit applies only to enabled, user-created scheduled correlations. If your organizational needs exceed this limit, please contact your support agent.
Create a correlation rule from scratch
-
Open the New Correlation Rule editor.
You can do this in two ways:
- From the Correlation Rules page.
- Select Threat Management → Detection Rules → Correlations.
- Select +Add Correlation.
- From XQL Search.
- Select Investigation & Response → Search → Query Builder → XQL Search.
- In the XQL query field, define the parameters for your Correlation Rule.
-
Select Save as → Correlation Rule.
The New Correlation Rule editor is displayed where the XQL Search section is populated with the query you already set in the XQL query field.
- From the Correlation Rules page.
- Configure the General settings.
- Specify a descriptive Name to identify the correlation rule.
- (Optional) Specify a Description for the correlation rule.
-
Use XQL to define the correlation rule in XQL Search field.
Define the correlation rule in the XQL Search field. After writing at least one line in XQL, you can Open full query mode to display the query in XQL Search. You can Test the XQL definition for the rule whenever you want.
Tip
When creating your correlation rule, you can use predefined values for different fields in the editor, such as Alert Name, Alert Description, and Drill-Down Query. For more information, see Field replacement syntax in correlation rules.
Note
- When you open the New Correlation Rule editor from XQL Search, this XQL Search field is already populated with the XQL query that you defined.
- An administrator can create and view queries built with an unknown dataset that currently does not exist in Cortex XSIAM . All other users can only create and view queries built with an existing dataset.
When you finish writing the XQL for the Correlation Rule definition, select Continue editing rule to bring you back to the New Correlation Rule editor, and the complete query you set is added to the XQL Search field.
Note
- The XQL features for
call,top, and wildcards in datasets (dataset in (<dataset prefix>_*)) are currently not supported in Correlation Rules. If you add them to the XQL definition, you will not be able to Create or Save the Correlation Rule. - The XQL features for
transactionin datasets (dataset in (<dataset prefix>_*)) are currently not supported in Real Time correlation rules. - The XQL
tagstage is currently not supported in correlation rules. - Using the
current_time()function in your XQL query for a correlation rule can yield unexpected results when there are lags or during downtime. This happens if the correlation rule doesn’t run exactly at the time of the data inside the timeframe, for example, when a rule is dependent on another rule, or when a rule is stuck due to an error, and then runs in recovery mode. Instead, we recommend using thetime_frame_end()function, which returns the timestamp at the end of the time frame in which the rule is executed.
- Select to run the Correlation Rule in Real Time or Scheduled.
- Real Time Correlation Rules scan the data as it’s ingested.
- You can run Real Time Correlation Rules on Cortex XSIAM issues, Cloud audit logs, third party datasets, and Data Models.
- When you start typing a Correlation Rule, Cortex XSIAM can detect that the query can be run in Real Time and recommend that you select Real Time.
- Real Time Correlation Rules only support the following XQL stages:
dataset,datamodel,filter,alter,fields, andconfig case_sensitive. A Real Time Correlation Rule must include an XQLfilterstage. For more information on these XQL stages, see the Cortex XSIAM XQL Language Reference Guide. - The following XQL functions are not supported in a Real Time Correlation Rule:
json_extract_scalar_array,parse_epoch, andtime_frame_end. - Dataset views are not supported in Real Time Correlation Rules.
- If the Correlation Rule is Scheduled, configure the Timing settings.
-
Time Schedule: Select the Time Schedule for the frequency of running the XQL Search definition set for the Correlation Rule as one of the following.
- Every 10 Minutes: Runs every rounded 10 minutes at preset 10-minute intervals from the beginning of the hour, such as 10:10 AM, 10:20 AM, and 10:30 AM.
- Every 20 Minutes: Runs every rounded 20 minutes at preset 20-minute intervals from the beginning of the hour, such as 10:20 AM, 10:40 AM, and 11:00 AM.
- Every 30 Minutes: Runs every rounded 30 minutes at preset 30-minute intervals from the beginning of the hour, such as 10:30 AM, 11:00 AM, and 11:30 AM.
- Hourly: Runs at the beginning of the hour, such as 1:00 AM or 2:00 AM.
- Daily: Runs at midnight, where you can set a particular Timezone.
- Custom: Displays the Time Schedule as Cron Expression fields, where you can set the cron expression in each time field to define the schedule frequency for running the XQL Search. The minimum query frequency is every 10 minutes and is already configured. You can also set a particular Timezone.
By default, the query is set to run once an hour (1 Hour/s).
- Timezone (Optional): You can only set the Timezone when the Time Schedule is set to Daily or Custom. Otherwise, the option is disabled.
- Query time frame: Set the time frame for running a query, which can be up to 7 days. Specify a number in the field and in the other field select either Minute/s, Hour/s, or Day/s.
-
-
(Optional) Configure Issue Suppression settings.
Define whether the issues generated by the Correlation Rule are suppressed by a duration time, field, or both.
- Enable issues suppression: Select this checkbox to Enable issue suppression. By default, this checkbox is clear and the issues of the Correlation Rule are configured to not be suppressed.
- Duration time: Set the Duration time for how long to ignore other events that match the issue suppression criteria, which are based on the Fields listed. Specify a number in the field and in the other field select either Minute/s, Hour/s, or Day/s. By default, the generated issues are configured to be suppressed by 1 hour (1 Hour/s). The Duration time can be configured for a maximum of 1 day.
- Fields (Optional): Select the fields that the issue suppression is based on. The fields listed are based on the XQL query result set. You can perform the following.
- Select multiple fields from the list.
- Select all to configure all the fields for suppression. This means that all the fields must match for the issuesto be suppressed. This option will generate multiple issues during the suppression period.
- Search for a particular field, which narrows the available options as you begin typing.
- Do not set any Fields by leaving the field empty only 1 issue is generated during the suppression period.
-
Configure the resulting Action for the Correlation Rule.
You can select one of the following resulting actions to occur, where the configuration settings change depending on your selection:
Generate issue
Generates a Correlation type of issue according to the configured settings in the New Correlation Rule editor (default). When this option is selected, a number of new sections are opened to configure the issue.
Issue Settings
- Issue Name: Specify a name. You can incorporate a variable based on a query output field in the format
$fieldName.-
Severity: Select the severity type whenever an issue is generated for this Correlation Rule as one of the following:
- Informational
- Low
- Medium
- High
- Critical
- User Defined: Select fields from inside the query.
Note
- If a generated issue has severity Medium or above, a case is automatically opened.
- Low severity issues generated by correlation rules are not grouped into cases.
- Category: Select the type of issue that is generated.
-
Issue Description (Optional): Specify a description of the behavior that will raise the issue. You can include dollar signs (
$), which represent the fields names (i.e. output columns) in XQL Search.For example.
The user $user_name has made $count failed login requests to $dest in a 24 hours period
Output.
The user lab_admin has made 234 failed login requests to 10.10.32.44 in a 24 hours period
Note
There is no validation or auto complete for these parameters and the values can be null or empty. In these scenarios, Cortex XSIAM does not display the null or empty values, but adds the text
NULLorEMPTYin the descriptions. -
Drill-Down Query (Optional): You can configure a Drill-Down Query for additional information about the issue for further investigation using XQL. This XQL query can accept parameters from the issue output for the Correlation Rule. Yet, keep in mind that when you create the Correlation Rule, Cortex XSIAM does not know in advance if the parameters exist or contain the correct values. As a result, Cortex XSIAM enables you to save the query, but the query can fail when you try and run it. You can also refer to field names using dollar signs (
$) as explained in the Issue Description.Once configured any issue generated for the Correlation Rule has a right-click pivot menu Open Drilldown Query option, an Open drilldown query link after you investigate a contributing event, and a quick action Open Drilldown Query icon () that is accessible in the Issues page, which opens a new browser tab in XQL Search to run this query. If you do not define a Drill-Down Query, no right-click pivot menu option, link, or icon is displayed.
- Drill-Down Query Time Frame: Select the time frame used to run the Drill-Down Query from one of the following options, which provides more informative details about the issue generated by the Correlation Rule.
- Generated Issue: Uses the time frame of the issue that is generated, which is the first event and last event timestamps for the issue (default option). If there is only one event, the event timestamp is the time frame used for the query.
- XQL Search: Uses the time frame from when the Correlation Rule was run in XQL Search.
- MITRE ATT&CK (Optional): Select the MITRE Tactics and MITRE Techniques you want to associate with the issue using the MITRE ATT&CK matrix.
- You can access the matrix by selecting the MITRE ATT&CK bar or Open complete MITRE matrix link underneath the bar on the right.
- Select the MITRE Tactics listed in the first row of the matrix and the applicable MITRE techniques and Sub-Techniques, which are listed in the other rows in the table. You can select either MITRE Tactics only, MITRE techniques and Sub-Techniques only, or a combination of both.
- Click Select and the matrix window closes and the MITRE ATT&CK section in the New Correlation Rule editor lists the number of Tactics and Techniques configured, which is also listed in the bar. For example, in the following image, there are 3 Tactics and 4 Techniques configured. The three MITRE Tactics are Resource Development with 2 Techniques configured, Credential Access with 1 Technique configured, and Discovery with 1 Technique configured.
-
Issues Fields Mappings
You can map the issue fields to display the mapped fields in the Issues page to provide important information in analyzing your issues. In addition, mapping the fields helps to improve incident grouping logic and enables Cortex XSIAM to list the artifacts and assets based on the map fields in the incident. The options available can change depending on your Correlation Rule definitions in XQL Search. Each preconfigured field that is automatically mapped is clearly displayed.
Note
Cortex XSIAM groups into cases based on a grouping logic that evaluates relationships, context, and shared artifacts across issues. However, not all fields influence case grouping. For information about the specific fields that influence grouping, see Optimize case grouping in correlations.
There are two ways to map the issue fields.
-
Use the preconfigured Cortex XSIAMIssue field mapping
Select this option if you want Cortex XSIAM to automatically map the fields for you. This checkbox only displays when your Correlation Rule can be configured to use Cortex XSIAM incident enrichment, and then it is set as the default option. We recommend using this option whenever it is available to you.
You can edit the source mapped to preconfigured fields to customize the mapping to your needs. Click the Edit icon next to a field value to select one of the other values.
Manually map the issue fields by selecting the fields that you want to map. When you create the Correlation Rule, Cortex XSIAM does not detect whether the issue fields that you mapped manually are valid. If the fields are invalid according to your mapping, null values are assigned to those fields.
Note
When more than one XDM field is listed, Cortex XSIAM looks for the field value according to the order of the fields listed.
-
Manually map the issue fields by selecting the fields that you want to map. When you create the Correlation Rule, Cortex XSIAM does not detect whether the issue fields that you mapped manually are valid. If the fields are invalid according to your mapping, null values are assigned to those fields.
Note
When Use the Cortex XSIAM default incident enrichment is not selected and you have not mapped any issue fields, the issue is dispatched into a new incident.
(Optional) Set fields as default for new Security Domain correlations - saves the custom issue fields that are configured for this rule for all users. When a user next creates an incident for the same domain, these fields are automatically configured instead of the default field set.
To restore the system defaults, click Restore default system fields.
Save to dataset
Use to save the data generated from the Correlation Rule to a separate Target Dataset. This option is helpful when you are fine-tuning and testing a rule before promoting the rule to production. You can also save a rule to a dataset as a building block for the next Correlation Rule, which will be based on the results of the first Correlation Rule instead of building too complex XQL queries.
You can either create a new Target Dataset by specifying the name for the dataset in the field or select a preexisting Target Dataset that was created for a different Correlation Rule. The list only displays the datasets configured when creating a Correlation Rule. Different Correlation Rules can be saved to the same dataset and Cortex XSIAM will expand the dataset schema as needed. The dataset you configure for the Correlation Rule contains the following additional fields:
_rule_id_rule_name_insert_time
Add to lookup
Use to add data to a specified lookup dataset. After selecting this option, perform the following:
-
In the Target Dataset field, select an existing lookup dataset to add the data.
In the displayed mapping, Cortex XSIAM lists fields from the lookup schema in the KEY column to enable you to map fields from the query to an entry in the lookup.
- In the VALUE column, map at least one field from the query to an entry in the lookup dataset (KEY column).
- (optional) You can set a single field or multiple fields as unique by selecting the checkbox in the UNIQUE column. A unique field means these fields are designated as a key to update existing entries as opposed to creating a new entry. If multiple fields are selected, these fields together are used to identify existing entries. If several existing entries meet the condition, all these entries are updated. If no existing entries meet the condition, the entry is added as a new one. If no field is marked as unique, records are added as new.
Important:
The maximum size of a lookup dataset is 50 MB. If the data exceeds this limit, the add to lookup action fails.
Remove from lookup
Removes data from a specified lookup dataset. After selecting this option, perform the following:
-
In the Target Dataset field, select an existing lookup dataset to remove data.
In the displayed mapping, Cortex XSIAM lists fields from the lookup schema in the KEY column to enable you to map fields from the query to an entry in the lookup.
-
In the VALUE column, map at least one field from the query to an entry in the lookup dataset (KEY column). All rows (lookup entries) matching these field mapping values (filtering condition) will be deleted. If several existing entries meet the condition, all these entries are deleted. If no existing entries meet the condition, no entries are deleted.
- Issue Name: Specify a name. You can incorporate a variable based on a query output field in the format
-
(Optional) Disable the Correlation Rule.
Select Disable → Create if you want to finish configuring your Correlation Rule at a different time, but do not want to lose your settings. The Create button is only enabled when you have configured all the mandatory fields in the New Correlation Rule editor. Once configured, your Correlation Rule is listed in the Correlation Rules page, but is disabled. You can edit or enable the rule at any time by right-clicking the rule and selecting Edit Rule or Enable.
-
Create the correlation rule.
The rule is added to the table in the Correlation Rules page as an active rule and a notification is displayed.
Import correlation rules from a file
You can import a number of correlation rules from a JSON file. This facilitates the sharing of correlation rules between tenants.
To import a file containing correlation rules, select Threat Management → Detection Rules → Correlations and click Import at the top right corner of the page.
Field replacement syntax in correlation rules
When creating correlation rules, it's possible to use predefined values for different fields in the editor, such as Alert Name, Alert Description, and Drill-Down Query. These predefined values follow a certain syntax and are dependent on the Cortex Query Language (XQL) query for the correlation rule that you build in the XQL Search and Drill-Down Query areas in the editor. For example, if you define the Alert Name to be something, such as Alerts based on $agent_name, the XQL query defining the correlation rule must have the agent_name field defined in the logic of the query; otherwise, this field won't be replaced.
Standard field replacement
Syntax
$<field>
Example:
The following text is added to the Alert Description field in the correlation rule editor, which uses a regular field:
The user's registered email is: $Email
Example Results:
If the Email field is a saved value containing john.doe@example.com, the output of the Alert Description is:
The user's registered email is: john.doe@example.com
Example:
The following text is added to the Alert Description field in the correlation rule editor, using an XDM field:
The user's registered email is: $xdm.email.recipient
Example Results:
If the xdm.email.recipient field is a saved value containing john.doe@example.com, the output is:
The user's registered email is: john.doe@example.com
Keep in mind the following:
<field>identifiers must consist exclusively of alphanumeric characters (a-z, A-Z, 0-9) and underscores (_).- Cortex Data Model (XDM) fields can include dot (
.) characters. - While
<field>identifiers can begin with a numeric character, the fields cannot be composed solely of numeric characters. For example,$123_datais permissible, whereas$456is not. - Text enclosed with double quotes (
"<text>") is treated as a literal string and will not undergo field replacement.
Example:
The following text is added to the Alert Description field in the correlation rule editor:
The user's registered email is: "$Email"
Example Results:
Since the syntax is invalid, it's ignored and the same text is displayed:
The user's registered email is: "$Email"
Fields with special characters
When field names contain characters that are not permitted in the standard $<field> syntax, such as spaces, hyphens, or special symbols, the field name must be enclosed within backticks ( )
Syntax
$`<field>`
The following text is added to the Alert Description field in the correlation rule editor, using a field containing characters that are not permitted:
Report Title: $`Annual Sales Report - Q1 2025`
Example Results:
If the Annual Sales Report - Q1 2025 field is a saved value containing Executive Summary, the output is:
Report Title: Executive Summary
Manage correlation rules
View and manage your correlation rules in Threat Management → Detection Rules → Correlations. To manage a Correlation Rule, right-click the Correlation Rule and select an action.
Note\
The maximum number of active scheduled correlations is 1200. This limit applies only to enabled, user-created scheduled correlations. If your organizational needs exceed this limit, please contact your support agent.
You can also monitor your correlation rule executions with the correlations_auditing data set. For more information, see Monitor correlation rules.
Right-click actions for managing correlation rules
- View related issues: View the issues generated by this correlation rule in the Issues page. You can Show issues in new tab or Show issues in same tab.
- Open in XQL: View the XQL results for the correlation rule in XQL Search. You can Show results in new tab or Show results in same tab.
-
Execute Rule: Run the rule now without waiting for the scheduled time.
Note
Execute Rule is not available for real time correlation rules.
- Preview Rule: View the rule before it's executed.
- Save as new: Duplicate the correlation rule and save it as a new correlation rule.
- Export: Select one or more rules to export to a JSON file.
- Disable the selected correlation rule. This option is only available on an active rule.
- Enable the selected correlation rule. This option is only available on an inactive rule.
- Edit Rule: Edit the rule parameters configured in the Edit Correlation Rule editor.
- Delete the correlation rule.
- Copy entire row to copy the text from all the fields in a row of a correlation rule.
- Show rows with ‘<field value>’ to filter the correlation rules list to only display the correlation rules with a specific field value that you select in the table. On certain fields that are null, this option does not display.
- Hide rows with ‘<Rule Description>’: Filter the correlation rules list to hide the correlation rules with a specific field value that you select in the table. On certain fields that are null, this option does not display.
Monitor correlation rules
Cortex XSIAM audits all correlation rule executions in the correlations_auditing dataset. The dataset records the query initiation times, end times, retry attempts, failure reasons, and other useful metrics. You can use this dataset to monitor your correlation executions. Cortex XSIAM also provides OOTB health issues that are generated when a correlation rule completes with errors. For more information, see About health issues.
In the correlations_auditing dataset, audit entries are added as follows:
- The rule starts executing. This is audited with the status of Initiated or Initiated Manually.
- The rule completes successfully. This is audited as Completed.
- The rule completes with errors. This is audited as Error.
Note
In the dataset, the Query start time and Query end time indicate the time frame of the data that was queried. The actual start and end times of the correlation rule execution are recorded in the _time field for the Initiated and Completed entries.
Field descriptions for the correlations_auditing dataset
The following table describes the fields in the correlations_auditing dataset:
| Field | Description |
|---|---|
| _time | Timestamp of the audit. For entries with an Initiated or Initiated Manually status, this is the start time of the correlation rule execution. For entries with a Completed or Error status, this is the end time of the rule execution. |
| _id | Unique identifier of the audit entry. |
| Rule ID | Unique identification number for the correlation rule. |
| Name | Correlation rule name. |
| Status | The status of the correlation rule query. Possible values are Initiated, Initiated Manually, Completed, and Error. |
| Query start time | The start time of the query time frame. |
| Query end time | The end time of the query time frame. |
| Time frame | Time frame for the query. |
| Failure reason | For correlation rules with errors, this field displays the error message. |
| Retry attempts | Number of retry attempts before the query initiated or failed to run. |
| Schedule | Scheduled frequency to execute the correlation rule. |
| Rule creation time | Date and time that the correlation rule was created. |
| Rule modification time | Date and time that the correlation rule was last modified. |
| Description | Description of the correlation rule. |
| Severity | Defined severity of the correlation rule. |
| Dataset | Target data set, as defined in the correlation rule |
| Suppression status | Whether issue suppression is Enabled or Disabled. |
| Suppression duration | Duration for which to ignore additional events that match the issue suppression criteria. |
| Suppression fields | Fields on which the issue suppression is based. |
| Timezone | Timezone on which the scheduled frequency is based. |
| MITRE ATT&CK Tactic | MITRE ATT&CK tactic that the correlation rule attempted to generate. |
| MITRE ATT&CK Technique | MITRE ATT&CK technique that the correlation rule attempted to generate. |
| Alert category | Category of issue as configured when creating the rule. |
| Source | Source of the correlation rule. |
| XQL search | XQL query for the correlation rule. |
| Drill-down query | XQL query configured for further investigation. |
| Alert name | Name of the issue that the correlation rule will generate. |
Troubleshoot server errors in scheduled correlation rules
When you encounter any server errors in scheduled correlation rules, there are some steps you can perform to address the issues depending on the type of error. Follow the steps below to help troubleshoot the issue.
Errors related to the query
Error messages
A server error occurred while running the query.
This rule did not run because resources were exceeded during query execution.
Steps to perform
These errors indicate that the Cortex Query Language (XQL) query for the scheduled correlations rule is complex, broad, or exceeding resource limits. To fix the query, perform the following:
- Run the query for the scheduled correlation rule in the Query Builder to identify syntax issues or logic errors introduced by any recent changes.
- Review your query and decide which actions you can perform to fix the query:
- Simplify the query by removing any fields that are not essential for the required results.
- If the query covers an extended period, reduce the time frame.
- If real-time correlation rules are supported and being used, consider converting your query to this mode.
- When queries involve complex operations, such as
comp, precede these with afieldsstage to set only the necessary fields required to include in the query results. - Divide overly complex or data-heavy queries into multiple, simpler correlation rules.
Error related to the alert
Error message
A server error occurred while generating the alert.
Steps to perform
This error typically points to issues with the output alert configuration's complexity or content. Consider taking the following actions:
- Simplify the query output by excluding non-essential fields and any fields that may contain excessively large data.
- In some cases, the size of the query output can include fields that are too large to allow alerts to be generated successfully. To avoid this, we recommend setting boundaries that improve the chances of the correlation rule running successfully over time by performing the following:
-
Limit the length of the calculated array fields by using the
arrayrange()function. For more information, see arrayrange.Example:Limits the length of the calculated
array_fieldfield to return only the first 1000 elements:arrayrange(array_field, 0, 1000)
-
Limit the length of string fields set to an unlimited length using the
trimfunction. For more information, see ltrim, rtrim, and trim.Example: Limits the length of the
string_fieldfield, which is set to an unlimited length, to return the first 1000 characters:rtrim(string_field, len(string_field) - 1000)
-
- Reduce the length and complexity of the Alert Name, Description, and any associated Drill-Down Query.
- Temporarily remove any mapped fields from the alert configuration.
- If present, verify the existence of the fields within the table. Temporarily remove suppression fields from the alert configuration.
- Use Static Severity: If dynamic severity is in use, switch to static.
When to contact support team
If the steps explained above don't resolve the issue, contact our support team and provide the following details:
- The exact error message received.
- The actions which led to the error.
- A list of the troubleshooting steps you've already attempted from the list provided above.
Manage IOC and BIOC rules
After you create an indicator rule, you can take the following actions:
For Analytics BIOC rules, you can only disable and enable rules.
View issues generated by a rule
As your IOC and BIOC rules generate issues, Cortex XSIAM displays the total # OF ALERTS generated by the rule in the the BIOC or IOC rules page. For rules with a high, medium, or low severity that have generated one or more issues, you can quickly pivot to a filtered view of those issues generated by the indicator:
- Select Threat Management → Detection Rules and the type of rule (BIOC or IOC).
-
Right-click anywhere in a rule, and then select View associated issues.
You can view a filtered query of issues associated with the Rule ID.
Use a BIOC rule as the basis of a query
- Select Detection & Threat Intel → Detection Rules and the type of rule (BIOC or IOC).
-
Right-click anywhere in the rule, and then select Open in query builder.
Cortex XSIAM populates a query using the criteria of the BIOC rule.
- Add or change the query criteria as required.
- (Optional) Test your query to see the sample results.
- If you are satisfied with the query, save it.
Edit a rule
After you create a rule, it may be necessary to tweak or change the rule settings. You can open the rule configuration from the Rules page or from the pivot menu of an issue generated by the rule. To edit the rule from the Rules page:
- Select Threat Management → Detection Rules and the type of rule (BIOC or IOC).
- Locate the rule you want to edit.
- Right-click anywhere in the rule and select Edit.
-
Edit the rule settings as needed, and then click OK.
If you make any changes, Test and then Save the rule.
Export a rule (BIOC only)
- Select Threat Management → Detection Rules → BIOC.
- Select the rules that you want to export.
-
Right-click any of the rows, and select Export selected.
The exported file is not editable, however, you can use it as a source to import rules at a later date.
Copy a BIOC rule
You can use an existing rule as a template to create a new one. Global BIOC rules cannot be deleted or altered, but you can copy a global rule and edit the copy.
- Select Threat Management → Detection Rules and then BIOC.
- Locate the rule you want to copy.
- Right-click anywhere in the rule row and then select Save as New to create a duplicate rule.
Disable or remove a rule
If you no longer need a rule you can temporarily disable or permanently remove it.
You cannot delete global BIOCs delivered with content updates.
- Select Threat Management → Detection Rules and the type of rule (BIOC or IOC).
- Locate the rule that you want to change.
- Right-click anywhere in the rule row and then select Remove to permanently delete the rule, or Disable to temporarily stop the rule. If you disable a rule you can later return to the rule page to Enable it.
Partially disable or re-enable a BIOC rule
You can disable one or more BIOC rules on the agent, on the server, or on both. This provides you more granularity for managing the prevention actions generated by the BIOC Rules.
- Navigate to Threat Management → Detection Rules → BIOC.
- Select the rules you want to disable.
-
Right-click any of the rules and select to disable the rules on the agent, on the server, or on both.
Note
For BIOC rules that are applied to prevention profiles:
If you disable a rule only on the agent, detection on the server works as usual.
If you disable a rule only on the server, prevention on the agent works as usual.
- We recommend you supply a reason for disabling the rule.
Note
When a BIOC rule is disabled automatically by Cortex XSIAM, for example due to the server anti flooding mechanism, prevention on the agent works as before.
You can re-enable a rule granularly for detection, prevention, or both in the same way.
Analytics
Cortex XSIAM Analytics analyzes sensor data, establishes behavioral baselines, and creates issues for suspicious activity.
Use Analytics rules and BIOCs to investigate anomalies across endpoints, networks, and identities.
Explore analytics
- analytics-overview
- analytics-engine
- analytics-sensors
- coverage-of-mitre-attack-tactics
- review-mitre-att-and-ck-framework-coverage
- analytics-detection-time-intervals
- analytics-issues-and-analytics-biocs
- view-and-manage-analytics-rules
- identity-analytics
- ai-detection-and-response-in-cortex-xsiam-beta
Analytics overview
Analytics uses the Analytics engine, sensors, and rules to keep your network safe.
Safeguarding your network requires a defense-in-depth strategy which utilizes current and patched software and hardware to keep unwanted users out of the network. Most available strategies are designed to stop intrusion attempts at the network perimeter, defending only against known threats. For example, systems scanning for malicious software rely on previously identified MD5 signature databases. However, attackers constantly modify virus signatures to circumvent virus scanners. Your network defense-in-depth strategy must include software and processes designed to detect and respond to intruders that may have already penetrated your systems.
Cortex XSIAM efficiently and automatically identifies abnormal activity on your network, while providing you with the exact information you need to rapidly evaluate, isolate and remove potential threats.
Analytics engine
Cortex XSIAM uses its Analytics Engine to examine logs and data retrieved from your sensors on the Cortex XSIAM tenants to build an activity baseline, and recognize abnormal activity when it occurs. The Analytics engine accesses your logs as they are streamed to the Cortex XSIAM tenant, including any firewall data, and analyzes the information as soon as it arrives. Cortex XSIAM triggers an Analytics issue when the Analytics Engine determines an anomaly.
The Analytics Engine examines traffic and data from a variety of sources such as network activity from firewall logs, VPN logs (from Prisma Access from the Panorama plugin), endpoint activity data, Active Directory or a combination of these sources, to identify the endpoints and users on your network. After identifying the endpoints and the users, the Analytics Engine collects relevant details about each asset based on the information it obtains from the logs to create profiles. The Analytics Engine can detect threats from only network data or only endpoint data, but for more context when investigating an issue, we recommend using a combination of data sources.
Cortex XSIAM also enables analytics to run on all mapped network and authentication data. For more information, see MODEL.
The Analytics Engine creates and maintains profiles to view the activity of the endpoint or user in context by comparing it to similar endpoints or users. The large number of profile types can generally be placed into one of three categories.
- Peer Group profiles: A statistical analysis of an entity or an entity relation that compares activities from multiple entities in a peer group. For example, a domain can have a cross-organization popularity profile or per peer group popularity profile.
- Temporal profiles: A statistical analysis of an entity or an entity relation that compares the same entity to itself over time. For example, a host can have a profile depending on the number of ports it accessed in the past.
- Entity classification: A model detecting the role of an entity. For example, users can be classified as service accounts, and hosts as domain controllers.
Analytics sensors
To detect anomalous behavior, Cortex XSIAM can analyze logs and data from a variety of sensors.
| Sensor | Description |
|---|---|
| Palo Alto Networks sensors | |
| Firewall traffic logs | Palo Alto Networks firewalls perform traditional and next-generation firewall activities. The Cortex XSIAM Analytics engine can analyze Palo Alto Networks firewall logs to obtain intelligence about the traffic on your network. A Palo Alto Networks firewall can also enforce Security policies based on IP addresses and domains associated with Analytics issues with external dynamic lists. |
| Enhanced application logs (EAL) | <p>To provide greater coverage and accuracy, you can enable enhanced application logging on your Palo Alto Networks firewalls. Enhanced Application Logs (EAL) are collected by the firewall to increase visibility into network activity for Palo Alto Networks apps and services, like Cortex XSIAM.</p><p>Types of data collected by EAL include, amongst others, records of DNS queries, the HTTP header User Agent field that specifies the web browser or tool used to access a URL, and information about DHCP automatic IP address assignment. For example, with DHCP information, Cortex XSIAM can generate an issue when it detects unusual activity based on hostname instead of IP address. This enables the security analyst to meaningfully assess whether the user’s activity is within the scope of their role, and if not, to stop the activity.</p><p>Enhanced application logs (EAL) are now non-billable and are excluded from the dashboard to remove them from your Data Collection (GB) license. Data is still ingested and available in the relevant datasets.</p> |
| GlobalProtect and Prisma Access logs | If you use GlobalProtect or Prisma Access to extend your firewall security coverage to your mobile users, Cortex XSIAM can analyze VPN traffic to detect anomalous behavior on mobile endpoints. |
| Firewall URL logs (part of firewall threat logs) | Palo Alto Networks firewalls can log threat log entries when traffic matches one of the Security Profiles attached to a security rule on the firewall. Cortex XSIAM can analyze entries for Tthreat logs relating to URLs and generate issues that indicate malicious behavior such as command and control, and exfiltration. |
| Cortex XSIAM agent endpoint data | <p>With a Cortex XSIAM Pro per Endpoint license, you can deploy Cortex XDR agents on your endpoints to protect them from malware and software exploits. The Analytics engine can also analyze the EDR data collected by the agent to generate issues. To collect EDR data, you must install Cortex XDR agent 6.0 or a later release on your Windows endpoints (Windows 7 SP1 or later).</p><p>The Cortex XSIAM Analytics engine can analyze activity and traffic based solely on endpoint activity data sent from Cortex XDR agents. For increased coverage and greater insight during investigations, use a combination of Cortex XDR agent data and firewalls to supply activity logs for analysis.</p> |
| Directory Sync logs | If you use the Cloud Identity Engine to provide Cortex XSIAM with Active Directory data, the Analytics engine can also generate issues on your Active Directory logs. |
| External sensors | |
| Third-party firewall logs | If you use non-Palo Alto Networks firewalls - Check Point, Fortinet, Cisco ASA - in addition to or instead of Palo Alto Networks firewalls, you can set up a syslog collector to facilitate log and issue ingestion. By sending your firewall logs to Cortex XSIAM, you can increase detection coverage and take advantage of Cortex XSIAM analysis capabilities. When Cortex XSIAM analyzes your firewall logs and detects anomalous behavior, it generates an issue. |
| Third-party authentication service logs | If you use an authentication service—Microsoft Entra ID, Okta, or PingOne—you can set up log collection to ingest authentication logs and data into authentication stories. |
| Windows Event Collector logs | The Windows Event Collector (WEC) runs on the Broker VM collecting event logs from Domain Controllers (DCs). The Analytics engine can analyze these event logs to generate issues such as for credential access and defense evasion. |
Coverage of MITRE Attack tactics
Network attacks follow predictable patterns. If you interfere with any portion of this pattern, you can neutralize the attack. The adversarial behaviors making up these patterns are collected in a universally accessible, continuously updated knowledge base called the MITRE ATT&CK™ knowledge base of tactics.
The Analytics Engine can generate an issue for any of the following attack tactics as defined in the MITRE Attack database.
| Tactic | Description |
|---|---|
| Execution | <p>After attackers gain a foothold in your network, they can use various techniques to execute malicious code on a local or remote endpoint.</p><p>Cortex XSIAM detects malware and grayware on your network using a combination of network activity, endpoint data from your Cortex XDR agents, and evaluation of suspicious files using the WildFire cloud service.</p> |
| Persistence | To carry out a malicious action, an attacker can try techniques that maintain access in a network or on an endpoint. An attacker can initiate configuration changes—such as a system restart or failure—that require the endpoint to restart a remote access tool or open a back door that allows the attacker to regain access on the endpoint. |
| Discovery | <p>When an attacker has access to a part of your network, they use discovery techniques to explore and identify subnets, servers and services that are hosted on those endpoints. They aim to identify vulnerabilities within your network.</p><p>Cortex XSIAM detects these tactics by looking for indicators in your internal network traffic such as changes in connectivity patterns, including increased rates of connections, failed connections, and port scans.</p> |
| Lateral Movement | <p>To expand the footprint inside your network, an attacker uses lateral movement techniques to obtain credentials for additional access to more data in the network.</p><p>The Analytics Engine detects attacks during this phase by examining administrative operations (such as SSH, RDP, and HTTP), file share access, and user credential usage that is beyond the norm for your network. Cortex XSIAM looks for indicators like increased administrative activity, SMB usage, and remote code execution.</p> |
| Command and Control | The command and control tactic allows an attacker to remotely issue commands to an endpoint and receive information from it. The Analytics Engine identifies intruders using this tactic by looking for anomalies in outbound connections, DNS lookups, and endpoint processes with bound ports. Cortex XSIAM detects unexplained changes in the periodicity of connections and failed DNS lookups, changes in random DNS lookups, and other indicators that suggest an attacker has gained initial control of a system. |
| Exfiltration | Exfiltration tactics are techniques used to retrieve data from a network, such as valuable enterprise data. Cortex XSIAM identifies this type of attack by examining outbound connections with a focus on the volume of data being transferred. Increases in this volume are an important symptom of data exfiltration. |
Review MITRE ATT&CK framework coverage
You can see a comprehensive overview of the Cortex XSIAM content and capabilities in context with the MITRE ATT&CK framework on the MITRE ATT&CK Framework Coverage dashboard. Access the dashboard from the drop-down menu in the dashboard header.
On this dashboard you can see a breakdown of the protection modules and detection rules in place for each MITRE tactic and technique. You can use the dashboard to review the elements that affect your coverage, and identify coverage gaps in your framework.
You can see the following information:
- Number of detection rules per tactic: Review the detection rules that are available for each MITRE tactic.
- MITRE ATT&CK framework coverage: Review the MITRE matrix detailing the available coverage for each tactic and technique. By default, covered methods are displayed. Click on a tactic or technique for details about the available prevention and detection methods. Note that the Protection numbers represent modules, which are a grouping of several protections.
-
Contributing data source types: Review the connectivity status of the data sources that are contributing to a specific data source type on your system.
Note
When a contributing data source type is active, it does not imply that all the rules and detectors associated with the data source type are active. Rule applicability is dependent on the data source's context and configuration. To enable an active status, data source types require the following setup:
- Endpoint: Installed Cortex XDR agent.
- Network: A contributing network device that is configured to ingest logs as Cortex XSIAM network connection stories.
- Cloud: A data source that is contributing the required cloud related information.
- Identity: An identity application that is supported in IA (Identity Analytics) and the ITM (Identity Threat Module).
In addition, if you are working with reports, you can use the MITRE Coverage Report widget, which summarizes coverage for each tactic.
Analytics detection time intervals
The Cortex XSIAM Analytics Engine retrieves logs from the Cortex XSIAM tenant to create a baseline so that it can generate issues when abnormal activity occurs. This analysis is highly sophisticated and performed on more than a thousand dimensions of data. Internally, Cortex XSIAM organizes its analytics activity into algorithms called detectors. Each detector is responsible for generating an issue when suspicious behavior is detected.
To generate issues, each detector compares the recent past behavior to the expected baseline by examining the data found in your logs. A certain amount of log file time is required to establish a baseline and then a certain amount of recent log file time is required to identify what is currently happening in your environment.
There are several meaningful time intervals for Cortex XSIAM Analytics detectors:
| Time interval | Description |
|---|---|
| Activation period | <p>The shortest amount of log file time before the app can generate an issue. This is typically the period between the time a detector first starts running and the time you see an issue. However, in some cases, detectors pause after an upgrade as they enter a new activation period.</p><p>Most but not all detectors start running after the activation period ends. The activation period provides the detector enough data to establish a baseline, which in turn helps to avoid false positives.</p><p>The activation period is also called the profiling or waiting period and is informally referred to as soak time.</p> |
| Test period | The amount of logging time that a detector uses to determine if unusual activity is occurring on your network. The detector compares test period data to the baseline created during the training period, and uses that comparison to identify abnormal behavior. |
| Training period | <p>The amount of logging time that the detector requires to establish a baseline, and to identify the behavioral limits beyond which an issue is generated. Because your network is not static in terms of its topology or usage, detectors are constantly updating the baselines that they require for their analytics. For this update process, the training period is how far back in time the detector goes to update and tune the baseline.</p><p>This period is also referred to as the baseline period.</p><div data-gb-custom-block data-tag="hint" data-style="info" class="hint hint-info"><h3>Note</h3><p>When establishing a baseline, detectors compute limits beyond which network activity will require an issue. In some cases, detectors do not compute baseline limits; instead they are predetermined by Cortex XSIAM engineers. The engineers determine the values used for predetermined limits using statistical analysis of malicious activity recorded worldwide. The engineers routinely perform this statistical analysis and update the predetermined limits as needed with each release of Cortex XSIAM.</p></div> |
| Deduplication period | The amount of time in which additional issues for the same activity or behavior are suppressed before Cortex XSIAM generates another Analytics issue. |
These time periods are different for every Cortex XSIAM Analytics detector. The actual amount of logging data (measured in time) required to generate any given Cortex XSIAM Analytics issue is specified in the Cortex XDR Analytics Alert Reference Guide.
Analytics issues and Analytics BIOCs
The Cortex XSIAM Analytics engine generates an issue when it detects suspicious activity, composed of multiple events, that deviates from the behavior baseline it establishes over time. To ensure the Analytics detectors generates issues efficiently and do not overcrowd your Issues table, Cortex XSIAM automatically disables issues from detectors that reach 5000 or more matches over a 24 hour period.
In addition to standard Analytics issues, there is another category of issues generated by Analytics behavioral indicators of compromise (ABIOCs). In contrast to standard Analytics issues, Analytics BIOCs (ABIOCs)—indicate a single event of suspicious behavior with an identified chain of causality. To identify the context and chain of causality, ABIOCs leverage user, endpoint, and network profiles. The profile is generated by the Analytics Engine and can be based on a simple statistical profile or a more complex machine-learning profile. Cortex XSIAM tailors each ABIOC to your specific environment after analyzing your logs and data sources and continually tunes and delivers new ABIOCs with content updates.
Identity Analytics
Cortex XSIAM enables you to investigate suspicious user activity information using Identity Analytics. When enabled, Identity Analytics aggregates and displays user profile information, activity, and issues associated with a user-based Analytics type issue and Analytics BIOC rule.
To easily track the issues and Analytics BIOC rules, Cortex XSIAM displays an Identity Analytics tag in the Issues table > Issue Name field and Analytics BIOC Rules table > Name field. In the Analytics Issue View, when selecting the User node, Cortex XSIAM details the Active Directory group, organizational unit, role, logins, hosts, alerts, and process executions associated with the user.
To enable Identity Analytics, you must first:
- Set Up Cloud Identity Engine (formerly Directory Sync Services (DSS))
- Activate Cortex XSIAM Analytics
After configuring your Cloud Identity Engine instance and Cortex XSIAM Analytics, select Settings ( ) → Configurations → Cortex XSIAM - Analytics, and in the Featured in Analytics section, Enable Identity Analytics.
View and manage Analytics rules
The Analytics Rules page offers a consolidated view of all Analytics BIOC and XDR Analytics rules, which are crucial to your organization's security posture. Designed to provide complete transparency, this centralized hub enables EDR experts and SOC analysts to gain a comprehensive understanding of every Analytics rule that could generate an issue and take action accordingly. For more information, see Analytics issues and Analytics BIOCs.
Within the unified Analytics rules table, you can leverage powerful capabilities to manage and investigate Analytics rules effectively.
- Get an understanding of all the rules that generated an issue in one place.
- Filter rules by name or description for seamless integration with issue investigations.
- Filter rules by any column, including "Variant Severities" to quickly locate rule variants associated with specific severity criteria.
- Order by any column, enabling you to prioritize and evaluate issues based on severity, name, modification time, and other critical factors.
- Fine-tune your XDR Analytics rules by disabling or enabling specific ones, and changing the severity of the rules or the rule variants.
- View more information for a selected analytics rule, including all its variants, and pivot to the Cortex Analytics Reference for the specific rule.
The Analytics Rules page is under Threat Management → Detection Rules.
Some of the displayed properties are listed below:
| Column name | Description |
|---|---|
| Modification Time | When the rule was last changed |
| Name | Name of the rule |
| Severity | Severity of the basic variant |
| Severity Variations | Number of different variants for the rule, including their respective severities |
| Severity Modification time | Last time the severity for any of the rule’s variants was changed |
| Severity Modification user | Latest user who changed the severity of any rule variant |
| Severity Modified | Yes/No indicating if the severity for any of the rule variants was changed |
| Status | Enabled or Disable |
| Type | XDR Analytics or XDR Analytics BIOC |
| Tags | Detector tag |
| Description | Cortex XSIAM defined description of the rule |
| Mitre Att&ck Tactic | Goals an adversary is trying to achieve during a cyberattack |
| Mitre Att&ck Technique | Adversary tactics and techniques used in cyberattacks |
| # of Issues | Number of issues generated by the rule in all its variants |
- Use the right click menu for the following actions:
- Disable or enable a rule to customize issue generation based on the Analytics rule.
-
View Rule or Edit Rule depending on your permissions.
View Rule
View the rule with all its variants, including their respective descriptions, tags, and severities in the View Analytics Rule screen.
- For more information about the Mitre Att&ck techniques and tactics, click the tag to display its explanation in the MITRE ATT&CK database.
- For more information about the rule, click View Rule, and click More information to display the Analytics Alert Reference.
Edit Rule
Edit Rule is available only if you have the necessary Edit permissions.
View the rule details as described in the View Rule section.
Customize the severity of the issues triggered by the analytics rule, or any of its variants, to align with your organizational needs in the Edit Analytics Rule screen.
Some of the reasons you may want to change a severity level are below, although the list is not exhaustive.
- Lowering a severity for specific rules, suspected as false positives, to reduce the number of issues raised by Cortex XSIAM.
- Raising a severity for specific rules, to trigger generating issues for a specific behavior in Cortex XSIAM.
- Customizing the severity of a specific logic to be immune to content updates, thus keeping the same custom severity, agnostic to Cortex XSIAM suggestion.
Edit the severity of a rule or one or more of its variants:
- Right click the rule and select Edit Rule.
-
In the variant you want to change, select the severity you want.
Warning
Changing the default severity may result in issues not being triggered or too many issues being triggered. Please consider this carefully before you change the severity recommended by Cortex XSIAM. Any responsibility for not getting issues triggered as a result of changing the severity will be yours.
If the severity determined by Cortex XSIAM was changed, to revert to the default, click Reset to default next to the severity.
Note
The default severity is updated by content updates. If a content update determines a new default severity for the rule that's the same as the value you had previously determined, you won't have the option to reset to default. For example, if the default was Informational, and you changed the severity to Medium, and after a content update Cortex XSIAM now determines the default to be Medium, the Reset to default option won't be displayed.
- Click Save.
- Show rows or hide rows with a specific rule.
- Copy entire row.
Note
When you select multiple rows, you can only enable or disable the selected rules.
AI Detection & Response in Cortex XSIAM
As organizations increasingly integrate AI into their operations, they become vulnerable to new threats such as model tampering or prompt injection. Traditional security tools lack the context and precision needed to detect and respond to AI-specific threats. In line with comprehensive security strategies, enterprises should incorporate a combination of preventive and responsive actions to safely enable adoption of AI technologies.
Cortex AI Detection & Response (AIDR) allows companies to:
- Gain visibility into AI usage in the cloud
- Identify AI-specific threats
- Respond and remediate these threats
Data sources and supported services
AIDR uses multiple data sources to gain visibility into AI usage in the cloud and identify AI-specific threats. Cloud audit logs are used for infra-level detections, such as model theft, denial of ML service, and training data poisoning. Cloud audit logs can be collected using existing data collectors. At this time, prompt logs are used to detect which models are being used.
See Collect prompt logs for instructions on configuring prompt log collection.
The following AI/ML managed services are supported:
- AWS: Amazon Bedrock, SageMaker
- Azure: Open AI
- GCP: VertexAI
Collect prompt logs
Cortex XSIAM collects prompt logs from your cloud accounts using existing data collectors. Currently, AWS and Azure are supported by Cortex XSIAM for prompt log collection. At this time, GCP does not have a storage solution for AI prompts that allows Cortex XSIAM to ingest them.
For details on dataset retention, see Cortex XSIAM product licenses.
Follow these procedures to enable prompt log collection in AWS and Azure:
Prompt log collection in AWS
Amazon Bedrock allows you to save prompt logs to Amazon S3 or Amazon CloudWatch. For details on how to configure invocation logging using CloudWatch Logs or Amazon S3, see the AWS documentation: Model invocation logging.
Ingest prompt logs from Amazon S3
For instructions on ingesting prompt logs from Amazon S3, see Ingest generic logs from Amazon S3. In step 7, select Prompt logs as the log type.
Ingest prompt logs from Amazon CloudWatch
For instructions on ingesting prompt logs from Amazon CloudWatch, see Ingest logs from Amazon CloudWatch. In step 1.d, select Prompt logs as the log type.
Enable prompt log collection in Azure
The following steps are necessary to enable prompt log collection in Microsoft Azure:
Configure the Azure Event Hub collection in Cortex XSIAM
For instructions on ingesting prompt logs from Microsoft Azure Event Hub, see Ingest logs from Microsoft Azure Event Hub.
Set up prompt logging
Log HTTP data
Configure logging request and response payloads in Azure API Management.
- In your Azure API Management instance, navigate to APIs → Select an API.
- In the Settings tab, under Diagnostics Settings, select Azure Monitor and select Enable.
- In Advanced Options select the following: Backend Request and Backend Response.
- For Backend Request, enter the following headers:
- Authorization
- Api-key
- User-Agent
- Referer
- Host
- In Number of payload bytes to log, enter:
8192. Click Save. - For Backend Response, enter the following headers:
- apim-request-id
- x-ms-rai-invoked
- In Number of payload bytes to log, enter:
8192. Click Save.
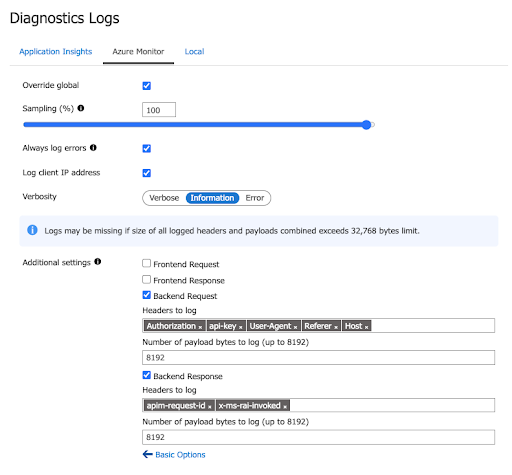
Configure diagnostic settings
- In your Azure API Management instance, navigate to APIs → Select an API.
- Navigate to Monitoring → Diagnostic settings.
- Click Add diagnostic settings.
- Under Logs, select audit. Under Destination details, select Stream to an event hub.
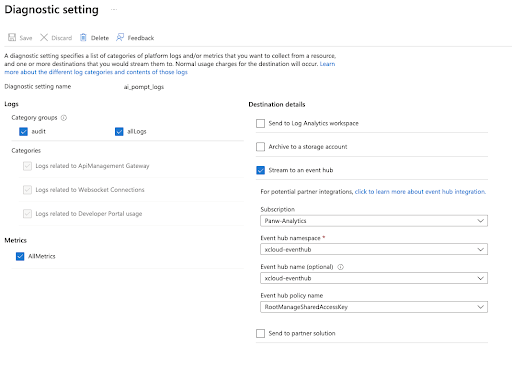
Extended Threat Intelligence
Extended Threat Intelligence (XTI) offers operationalized Threat Intelligence (TI) seamlessly integrated across the Cortex platform.
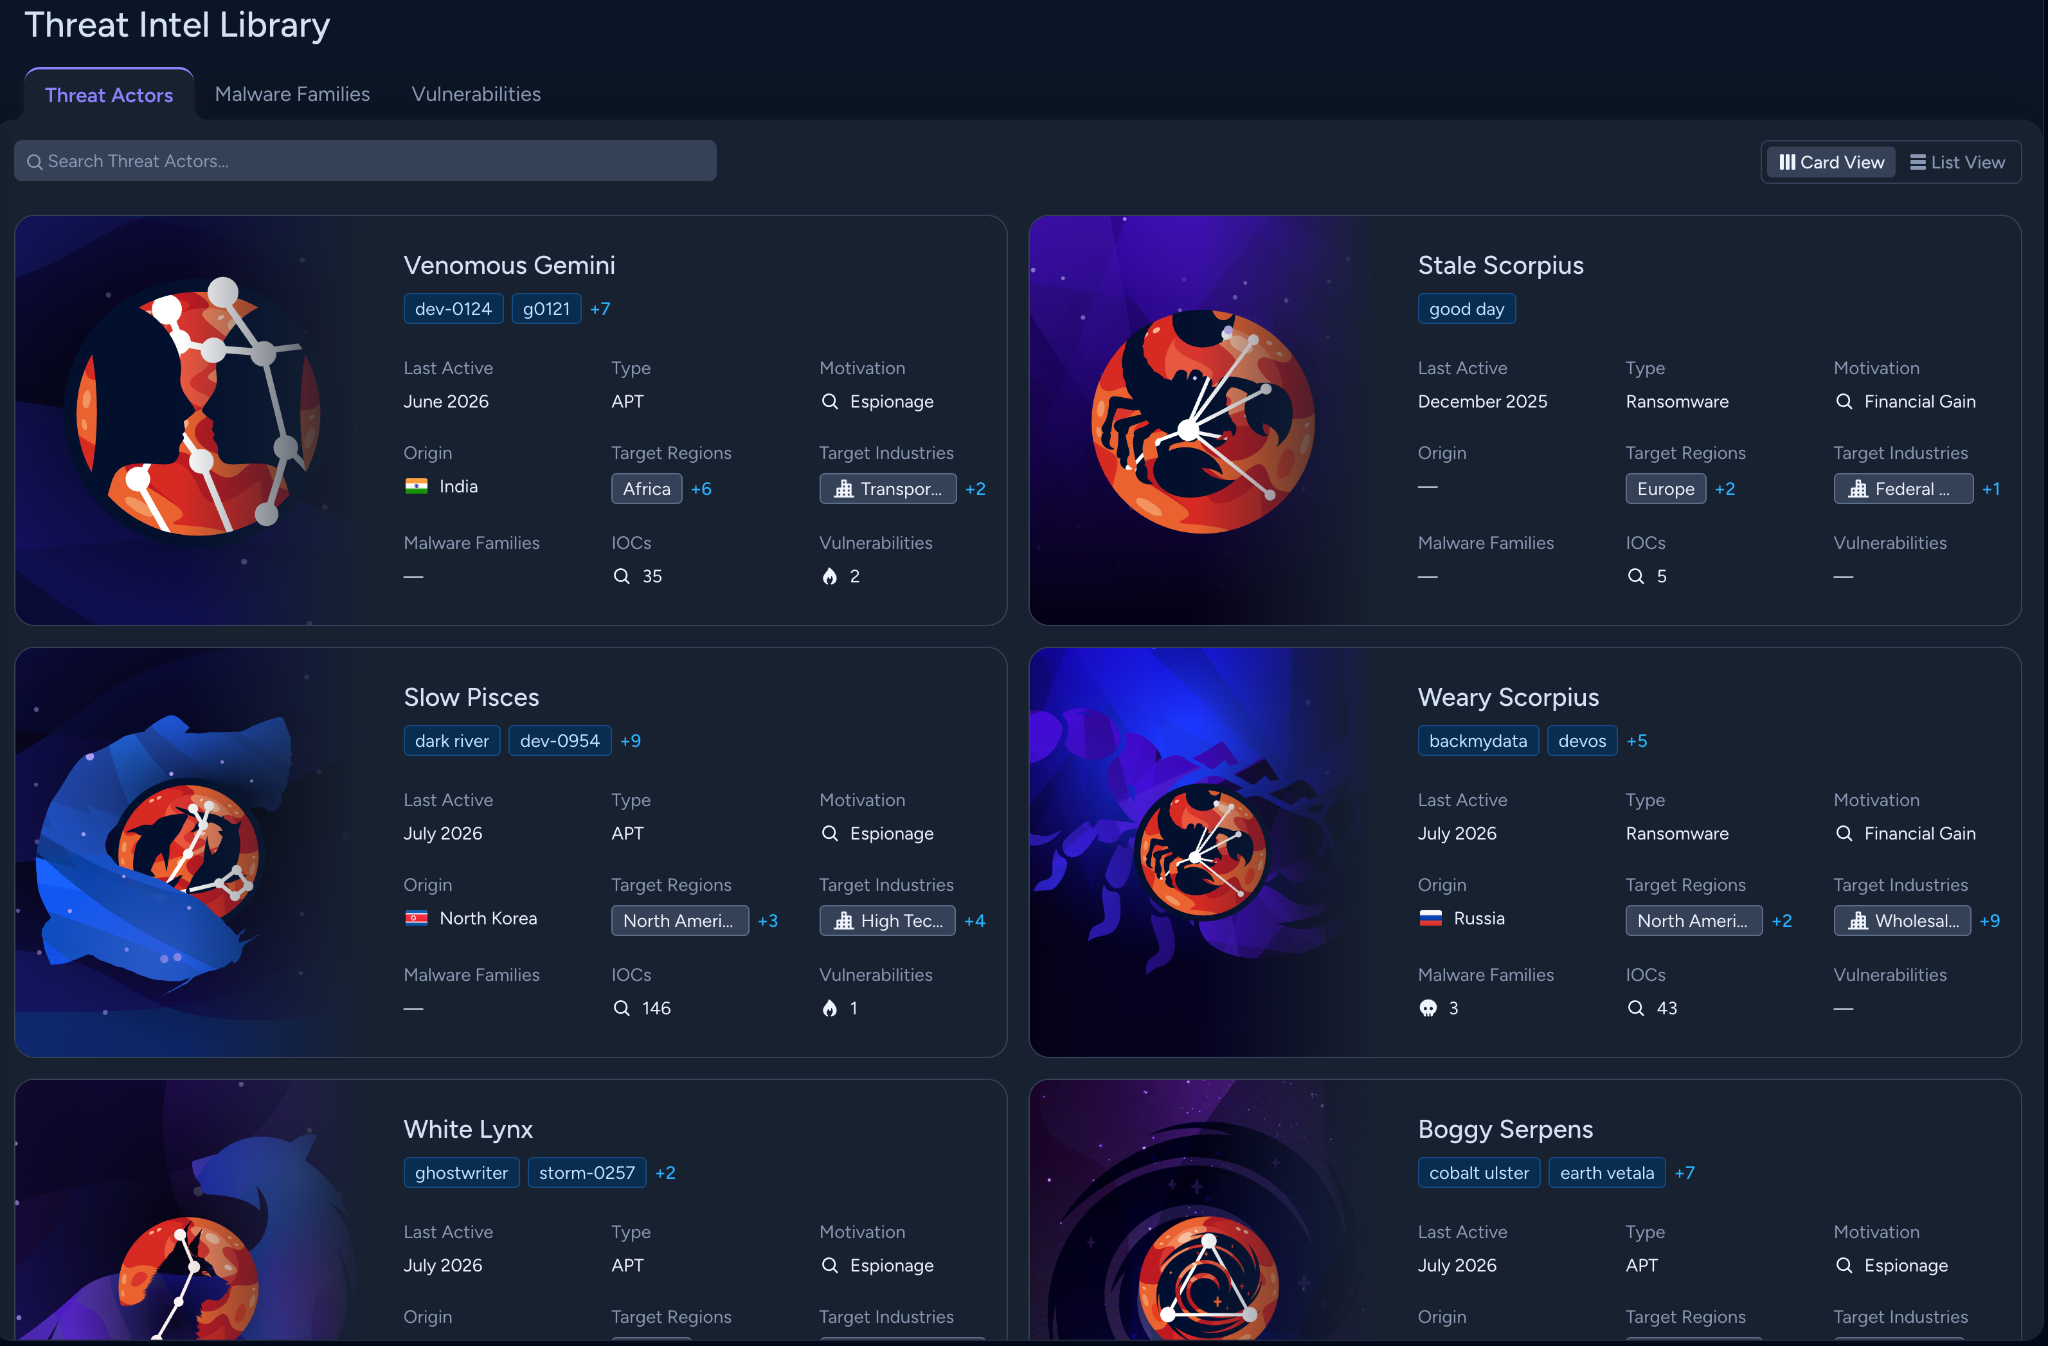
XTI offers the following core capabilities:
- Threat Intel Library: Powered by Unit 42 threat intel data, the Threat Intel Library provides a unified catalog of curated threat objects (threat actors, malware families, vulnerabilities, and reports), helping you understand the broader threat landscape.
- XTI Indicators: XTI indicators include first-party indicators, as well as observables extracted from detections and customer-managed indicators.
- TI context in case and issue investigations: Cases and issues are enriched with the XTI threat intelligence, providing SOC analysts with threat intel context during case and issue investigations.
- AI-driven Behavioral Threat Analysis (BTA): XTI correlates observed behaviors and evidence from security cases and issues with known threat actor Tactics, Techniques, and Procedures (TTPs).
- TI investigations through XQL: Build investigations and hunt queries, and correlate threat intel data with issues data through Cortex Query Language (XQL) using the full depth of XTI intelligence library.
- Interactive TI dashboard: Leverage the built-in XQL dashboard summarizing threat intel relevant to your organization, and clone and modify it as needed.
- Indicator/IOC detections: Continuously monitor your environment for known threat indicators with automated issue generation and dynamic targeting.
- Threat-aware automation and response: Utilize built-in commands in playbooks to automate TI triage, enrichment, and response.
- Accessible TI with AgentiX: Natural language assistance for TI search and explanations powered by AgentiX.
What Cortex XSIAM license do I need to use XTI?
To use XTI, you must have one of the following:
- The Cortex XSIAM Premium license, or
- Another Cortex XSIAM license with the Extended Threat Intelligence (XTI) add-on or the Advanced SOC add-on.
If you have the correct license, you can access Cortex XTI by navigating to Threat Management → Threat Intelligence.
Permissions required for XTI in Cortex XSIAM
XTI requires View or View/Edit RBAC permissions for Threat Intelligence in the Threat Management component tab.
Using indicator rules requires View or View/Edit RBAC permissions for both Threat Intelligence and Rules in the Threat Management component tab.
Using XTI with platform features such as cases and issues or dashboards requires additional feature-specific permissions.
Accessing XTI when using TIM and XTI
If you are currently using Threat Intel Management (TIM), you can access Extended Threat Intelligence (XTI) and TIM side by side:
- Four options are available from the Threat Management → Threat Intelligence menu: Threat Intel Library, Indicators, Indicators (TIM), and Dashboard.
- Threat Intel Library, Indicators, and Dashboard are part of the XTI module.
- Indicators (TIM) is part of the TIM module.
- From the Threat Management → Detection Rules you can access Indicator Rules and Indicator Rules (TIM):
- Indicator Rules are compatible with the XTI module.
- Indicator Rules (TIM) are compatible with the TIM module.
XTI and TIM run in parallel, and switching between the XTI and TIM interfaces does not disrupt your existing workflows and pipelines.
Disable access to XTI from the UI
If you are using Threat Intel Management (TIM), an instance or account administrator can disable access to Extended Threat Intelligence (XTI) from the UI.
- Go to Configurations → Threat Intelligence → Experience.
- Under Choose your Threat Intelligence experience, you see two options:
- XTI + TIM: Show TIM and XTI side-by-side in the navigation pane.
- TIM only: Only show TIM in the left navigation pane.
- Select TIM only.
After you have made the choice, the UI options available from the navigation pane are updated for all users of the tenant:
- One option is now available from the Threat Management → Threat Intelligence menu: Indicators.
- From the Threat Management → Detection Rules, you can access Indicator Rules that work with TIM.
XTI Threat Intel Library
The XTI Threat Intel Library provides a unified catalog of threat objects, which are durable, conceptual entities used to describe and understand the broader threat landscape. It serves as a repository of curated intelligence, providing detailed information about the primary entities and security flaws observed in the threat landscape: threat actors, malware families, and vulnerabilities. By offering in-depth profiles, associations, and technical indicators, the library is a dedicated research tool that allows you to investigate adversary motivations, track malware evolution, and analyze vulnerability intelligence.
The XTI Threat Intel Library is powered by high-fidelity Unit 42 data.
The following types of threat objects are part of the library:
- Threat Actors
- Malware Families
- Vulnerabilities
- Reports
To access the Threat Intel Library, go to Threat Management → Threat Intelligence → Threat Intel Library.
Threat Actors
Use the Threat Actor tab to research threat actors. It can display listings in card view with a graphical representation for each threat object or in grid view as a list. You can search for specific threat actors in the search box.
By default threat actors are displayed in card view. To access advanced filtering options and customize the information displayed for each threat actor, switch to the list view.
When you select a threat actor, a side pane opens and the following tabs provide detailed information:
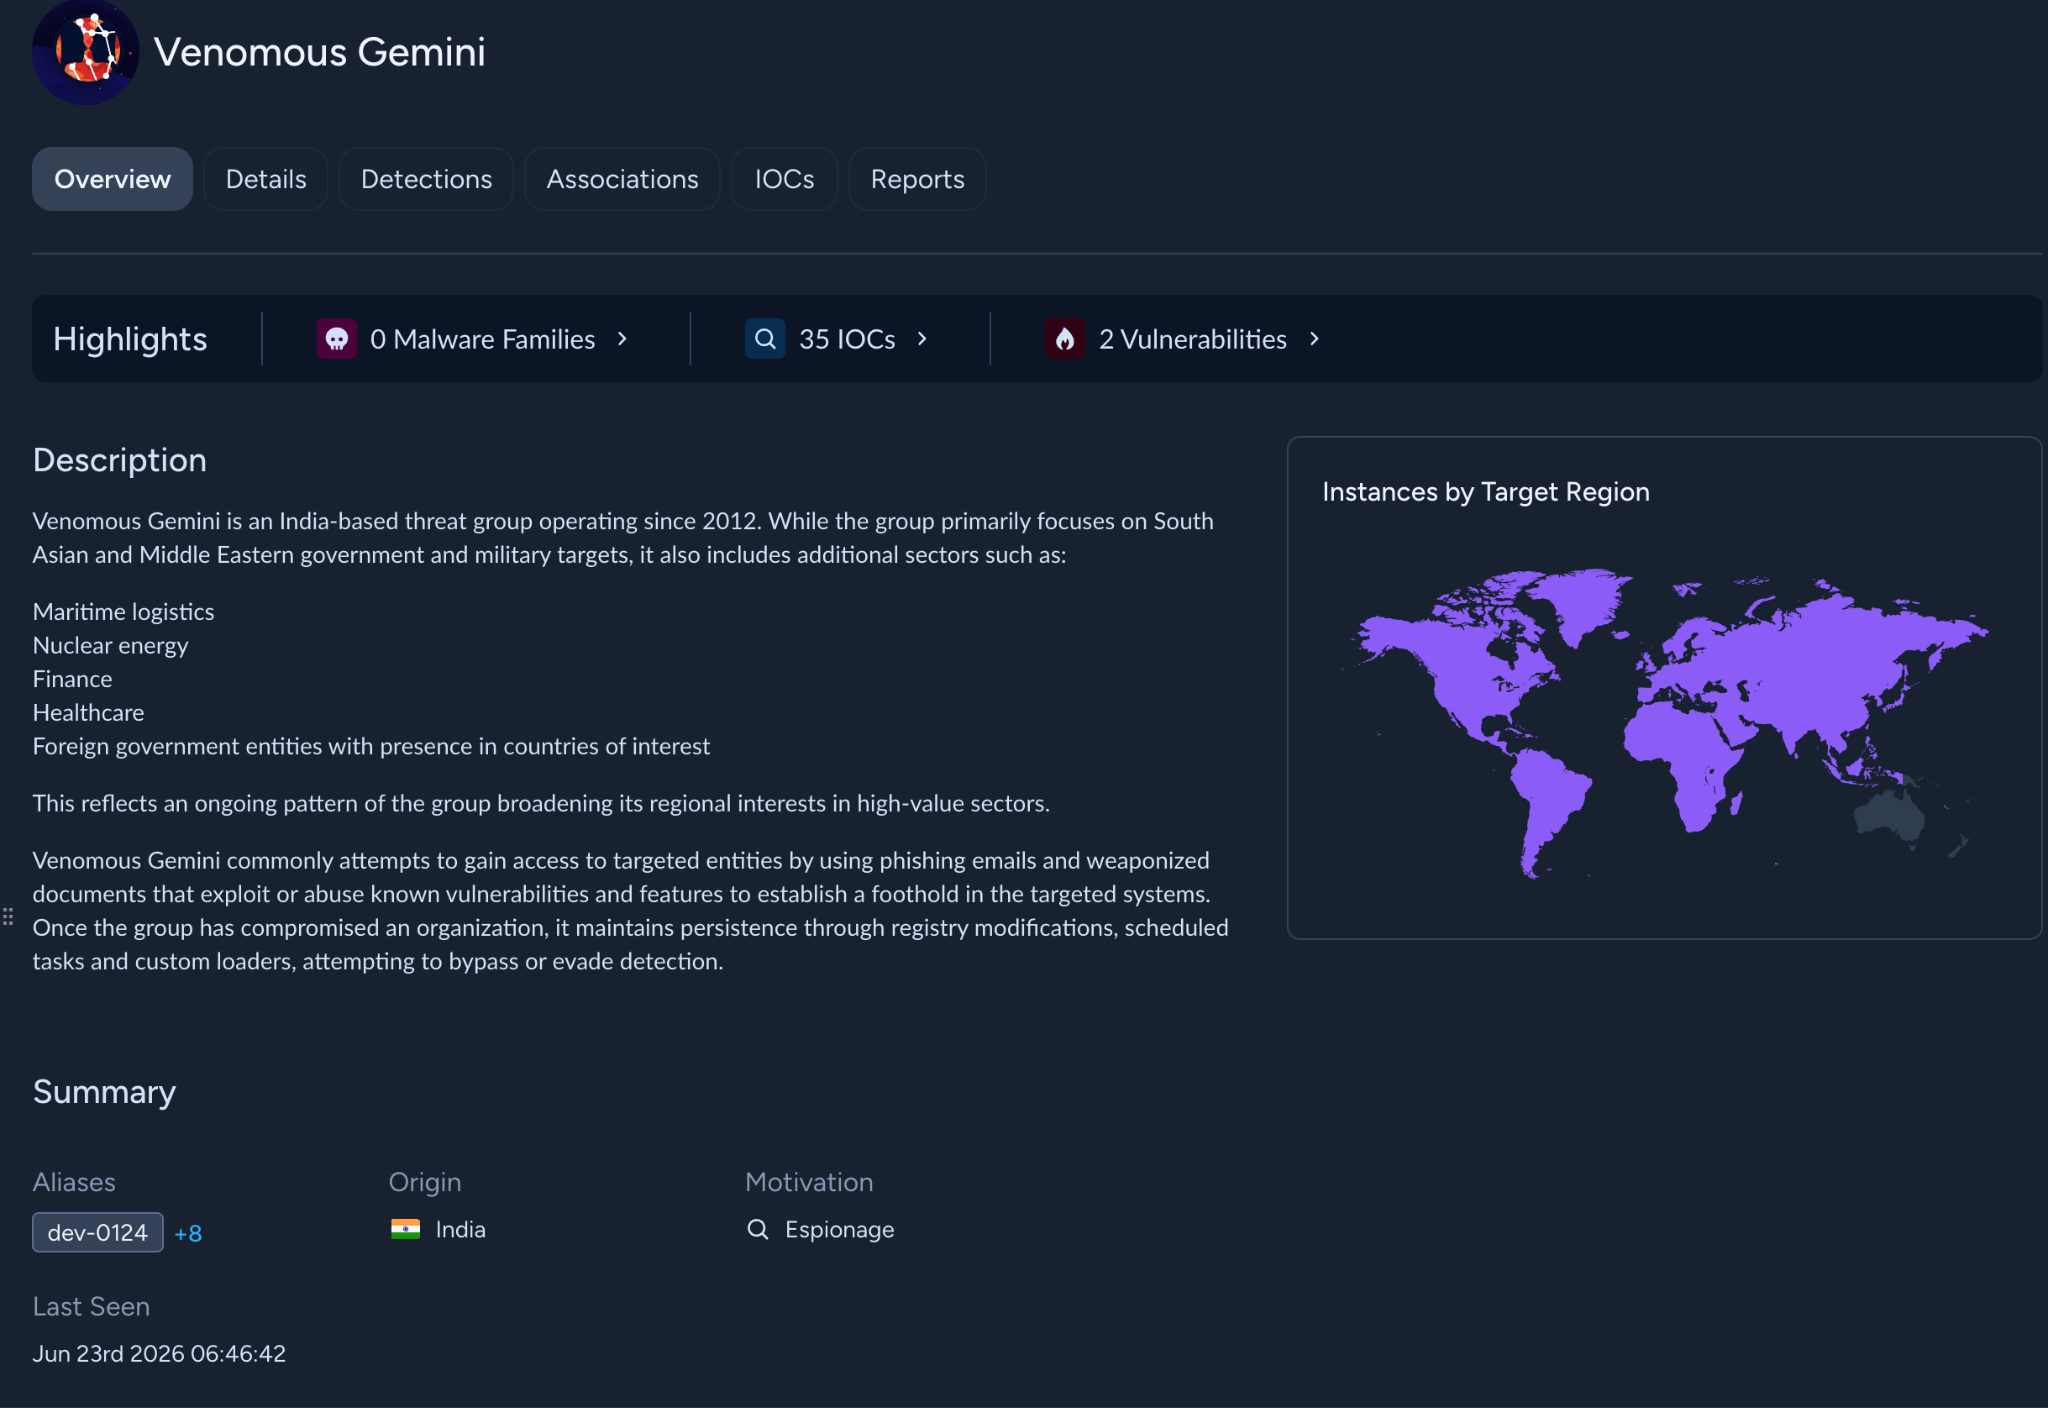
- Overview: High-level profile of the adversary, including description, summary, target region, MITRE ATT&CK mapping of key tactics, techniques, and procedures, and links to related threat objects and IOCs.
- Details: Includes metadata about initial access, motivations/targets/victimology, aliases, targeted regions, targeted industries, and more.
- Detections: Lists cases and issues associated with the specific threat object, including cases based on direct IOC observation and cases based on Behavioral Threat Analysis (BTA). Select a Cases or Issues grouping to view cases or issues in a tabular view.
- Associations: Lists malware families and vulnerabilities related to the threat actor. Select Malware Families to view a list of related malware families and select Vulnerabilities to view related vulnerabilities.
- IOCs: Lists indicators of compromise linked to the threat actor.
- Reports: Lists reports related to the threat actor. Select a specific report category to view all related reports that fall in that category.
Malware Families
Use the Malware Families tab to research malware families. You can set filters, such as malware family name, aliases, and associated threat actors, to search for malware families.
When you select a malware family, a side pane opens and the following tabs provide detailed information:
- Overview: High-level profile of the malware family, including description, summary, MITRE ATT&CK mapping of key tactics, techniques, and procedures, aliases, and links to related threat actors and IOCs.
- Detections: Lists cases and issues associated with the specific threat object. Select a Cases or Issues grouping to view cases or issues in a tabular view.
- Associations: Lists threat actors related to the malware family.
- IOCs: Lists indicators of compromise linked to the malware family.
- Reports: Lists reports related to the malware family. Select a specific report category to view all related reports that fall in that category.
Vulnerabilities
Use the Vulnerabilities tab to research vulnerabilities that threat actors may exploit. You can set filters, such as vulnerability ID, EPSS score, and CVSS score, to search for vulnerabilities and also save, load, and export the filters.
When you select a vulnerability, a side pane opens and the following tabs provide detailed information:
- Overview: High-level profile of the vulnerability, including description, EPSS details, CVSS details, vulnerability intelligence, and exploit intelligence.
- Affected Software: Information about the software/packages affected by the vulnerability, such as software/package name, distribution, release, and affected versions.
Reports
XTI allows you to access Unit 42 reports and Open Source Intelligence (OSINT) reports:
- Intel Bulletins: Proprietary Unit 42 point-in-time analysis reports covering threat actor infrastructure, malware, and techniques
- Publications: Unit 42’s public threat reports published to the Unit 42 threat research center.
- Timely Threat Intel: Quick-hit sharing of IOCs and TTPs identified in the wild and shared out through Unit 42 social media (X & LinkedIn)
- OSINT: Third-party synthesized documents that detail publicly accessible information about a target—such as a specific individual, organization, or threat.
- Others: Other reports from Unit 42.
Accessing reports
You can access the reports as follows:
- From Threat Actors and Malware Families tabs in Threat Intel Library
- From Behavioral Threat Analysis (BTA) citations and publication lists available for BTA-eligible cases
Accessing reports from Threat Actors and Malware Families tabs in Threat Intel Library
You can access reports associated with a specific threat actor or malware family through the Reports tab available for that threat object in the Threat Intel Library.
For each threat object, you can see its linked reports, organized in five categories (Intel Bulletins, Publications, Timely Threat Intel, OSIN, and Others).
Use the search bar to look for key words in one or more linked reports and report categories. Depending on the page that you are searching from, you can search multiple reports or multiple report categories.
When you select a specific citation, the Reports side pane is displayed.
Accessing reports from BTA citations and publication lists
You can access reports used for Behavioral Threat Analysis (BTA) through the links in BTA citations in the Threat Intel tab available in cases. When you select a specific citation, the Reports side pane is displayed.
Reports side pane
There is detailed information available for each report available from XTI.
The following information is available about each report:
- Overview: Includes the link to the report (if the report is publicly available), the name of its publisher, the date of publishing, and the summary of the report content.
- Associations: Lists Threat Actors and Malware Families associated with the content of the report.
- IOCs: Lists indicators of compromise associated with the content of the report.
\
XTI Indicators
XTI Indicators help you identify and investigate suspicious or malicious activity.
Indicator concepts
XTI indicators are observables, structured representations of stateful properties or measurable events within a cyber environment, such as IP addresses and file hashes. Unlike the threat objects in the Threat Intel Library, indicators are high-volume, and, in some cases, frequently changing items that are used to identify malicious or suspicious activity, or other activity associated with security issues. XTI indicators include Indicators of Compromise (IOCs) and other non-malicious indicators.
Indicator types
XTI currently supports the following indicator types:
- Domains
- File hashes (SHA-256)
- IP addresses
- URLs
Only IPv4 addresses are currently supported. IPv6 addresses are not supported.
Common indicator data model
XTI Indicators share a set of common fields, such as Verdict, Creation Method, Tags, First Seen, and Last Seen.
Additionally, each indicator type includes unique fields; for example, File Type and File Size are specific to file hashes.
Indicator verdict
XTI assigns an indicator verdict according to the verdict returned by the source with the highest reliability.
Indicators are assigned the following verdicts:
- Unknown
- Benign
- Suspicious
- Malicious
The verdict can be modified by a user.
Indicator input sources
There are three primary sources for adding indicators to the XTI Indicators dataset:
| Source | Description |
|---|---|
| Unit 42 first-party data ingestion | <p>First-party indicators are powered by high-fidelity Unit 42 data and are sourced from the entire Palo Alto Networks product suite.</p><p>Unit 42 indicators are added through periodic feed ingestion every 24 hours.</p> |
| Automated extraction | <p>Potential indicators are automatically extracted from Issue objects, enriched with Unit 42 intelligence, and added to the XTI Indicators dataset.</p><p>Indicators extracted from issues are added in near real-time as issues are processed.</p> |
| User creation | Users can manually create or import indicators, adding them to the XTI Indicators dataset. |
When reviewing the list of indicators, the Creation Method field indicates the original source of a specific indicator. The Last Modification Method field indicated the source that last updated the indicator.
Indicator lifecycle
Indicator lifecycle management defines how indicators evolve, how conflicting data is handled, and how metadata remains accurate over time.
It consists of several core automated and manual processes:
| Step | Details |
|---|---|
| Automatic ingestion and enrichment | Indicators are continuously managed through periodic feed ingestion from Unit 42. To keep metadata fresh, the system performs periodic background enrichments. |
| Normalization and deduplication | Because indicators can come from multiple sources (such as an extraction from an issue or ingestion from a Unit 42 feed), the system normalizes the data and deduplicates it into a single "golden record" based on the indicator's value and type. |
| User overrides (verdict and expiration) | <p>A user can manually update the following indicator fields:</p><ul><li>Verdict</li><li>Expiration</li><li>Tags</li></ul><p>If a user manually updates a field, that field is "detached" from future automatic updates to preserve the user's input. The system visually flags this field as "Out of Sync," and users can select "Revert to Automatic Update" if they want to unlock it and resync with the latest upstream threat intelligence.</p><p>If a user manually changed the verdict for an indicator, when a new verdict update is available for that indicator from the upstream threat intel source, a user can review and apply the update.</p> |
| Creation of indicators by user | Users can manually add indicators, entering the specific domain, file hash, IP address or URL associated with the indicator and optionally specifying the verdict. |
| Indicator expiration | <p>Indicators are automatically marked as “Expired" based on fixed time windows since the last sighting, the last update, or the last extraction. By default, IPs expire in 7 days, domains in 14 days, URLs in 30 days, and file hashes never expire. A user can also manually expire indicators (individually or in bulk). Expired indicators are removed from active threat matching but are kept in the dataset up to a certain period of time to provide historical context for investigations.</p><p>An expired indicator is automatically reactivated—or "unexpired"— in the following scenarios:</p><ul><li>If it is observed again within a threat feed or via enrichment.</li><li>If its verdict is manually updated.</li><li>If its associated tags are edited.</li></ul><p>When any of these conditions are met, the platform immediately resets the indicator's expiration status to Active.</p> |
Edit an indicator verdict
You can edit the verdict of an indicator.
- Go to Threat Management → Threat Intelligence → Indicators.
- Select a specific indicator to go to its Overview.
- Position the cursor over the Verdict field until an edit tooltip appears next to it.
- Select the edit tooltip next to the Verdict.
- Provide the following information:
- Verdict: Select a new verdict.
- Verdict Change Reason: Select the reason for the verdict change (False Positive or Other).
- Additional Comments (Optional): You can provide additional information.
- Select Apply.
After the verdict update is complete, position the cursor over the Verdict field and you should see “Verdict set by {user name}”.
Apply a verdict update
If a user manually changed the verdict for an indicator, when a new verdict update is available for that indicator from the upstream threat intel source, a user can review and apply the update.
Expire indicators
You can expire a single indicator or “bulk-expire” multiple selected indicators.
- Go to Threat Management → Threat Intelligence → Indicators.
- Select one or more indicators.
- Select the Expire button, or right-click an indicator and select Expire.
After an indicator has expired, its Expiration Status changes from “Active” to “Expired”.
Tag indicators
You can apply tags to indicators to provide context for filters, XQL queries, and playbooks.
- Go to Threat Management → Threat Intelligence → Indicators.
- Select a specific indicator to go to its Overview.
- In the Tags section, select the edit tooltip to modify tags.
- Add the tags and select Apply.
Add an indicator
- Go to Threat Management → Threat Intelligence → Indicators.
- Select +Add New Indicator.
- Single indicator tab is pre-selected. Provide the following information:
- Type: Select one of the supported indicator types (Domain, File hash, IP address, URL).
- Value: Enter the specific domain, file hash, IP address or URL associated with the indicator. If an indicator with that value already exists, the UI returns an error message.
- Verdict (Optional): Select one of the following: Unknown, Benign, Suspicious, Malicious
- Select Add.
Investigate Indicators
The Indicators page lists domains, IP addresses, URLs, and file hashes.
You can access it from Threat Management → Threat Intelligence → Indicators.
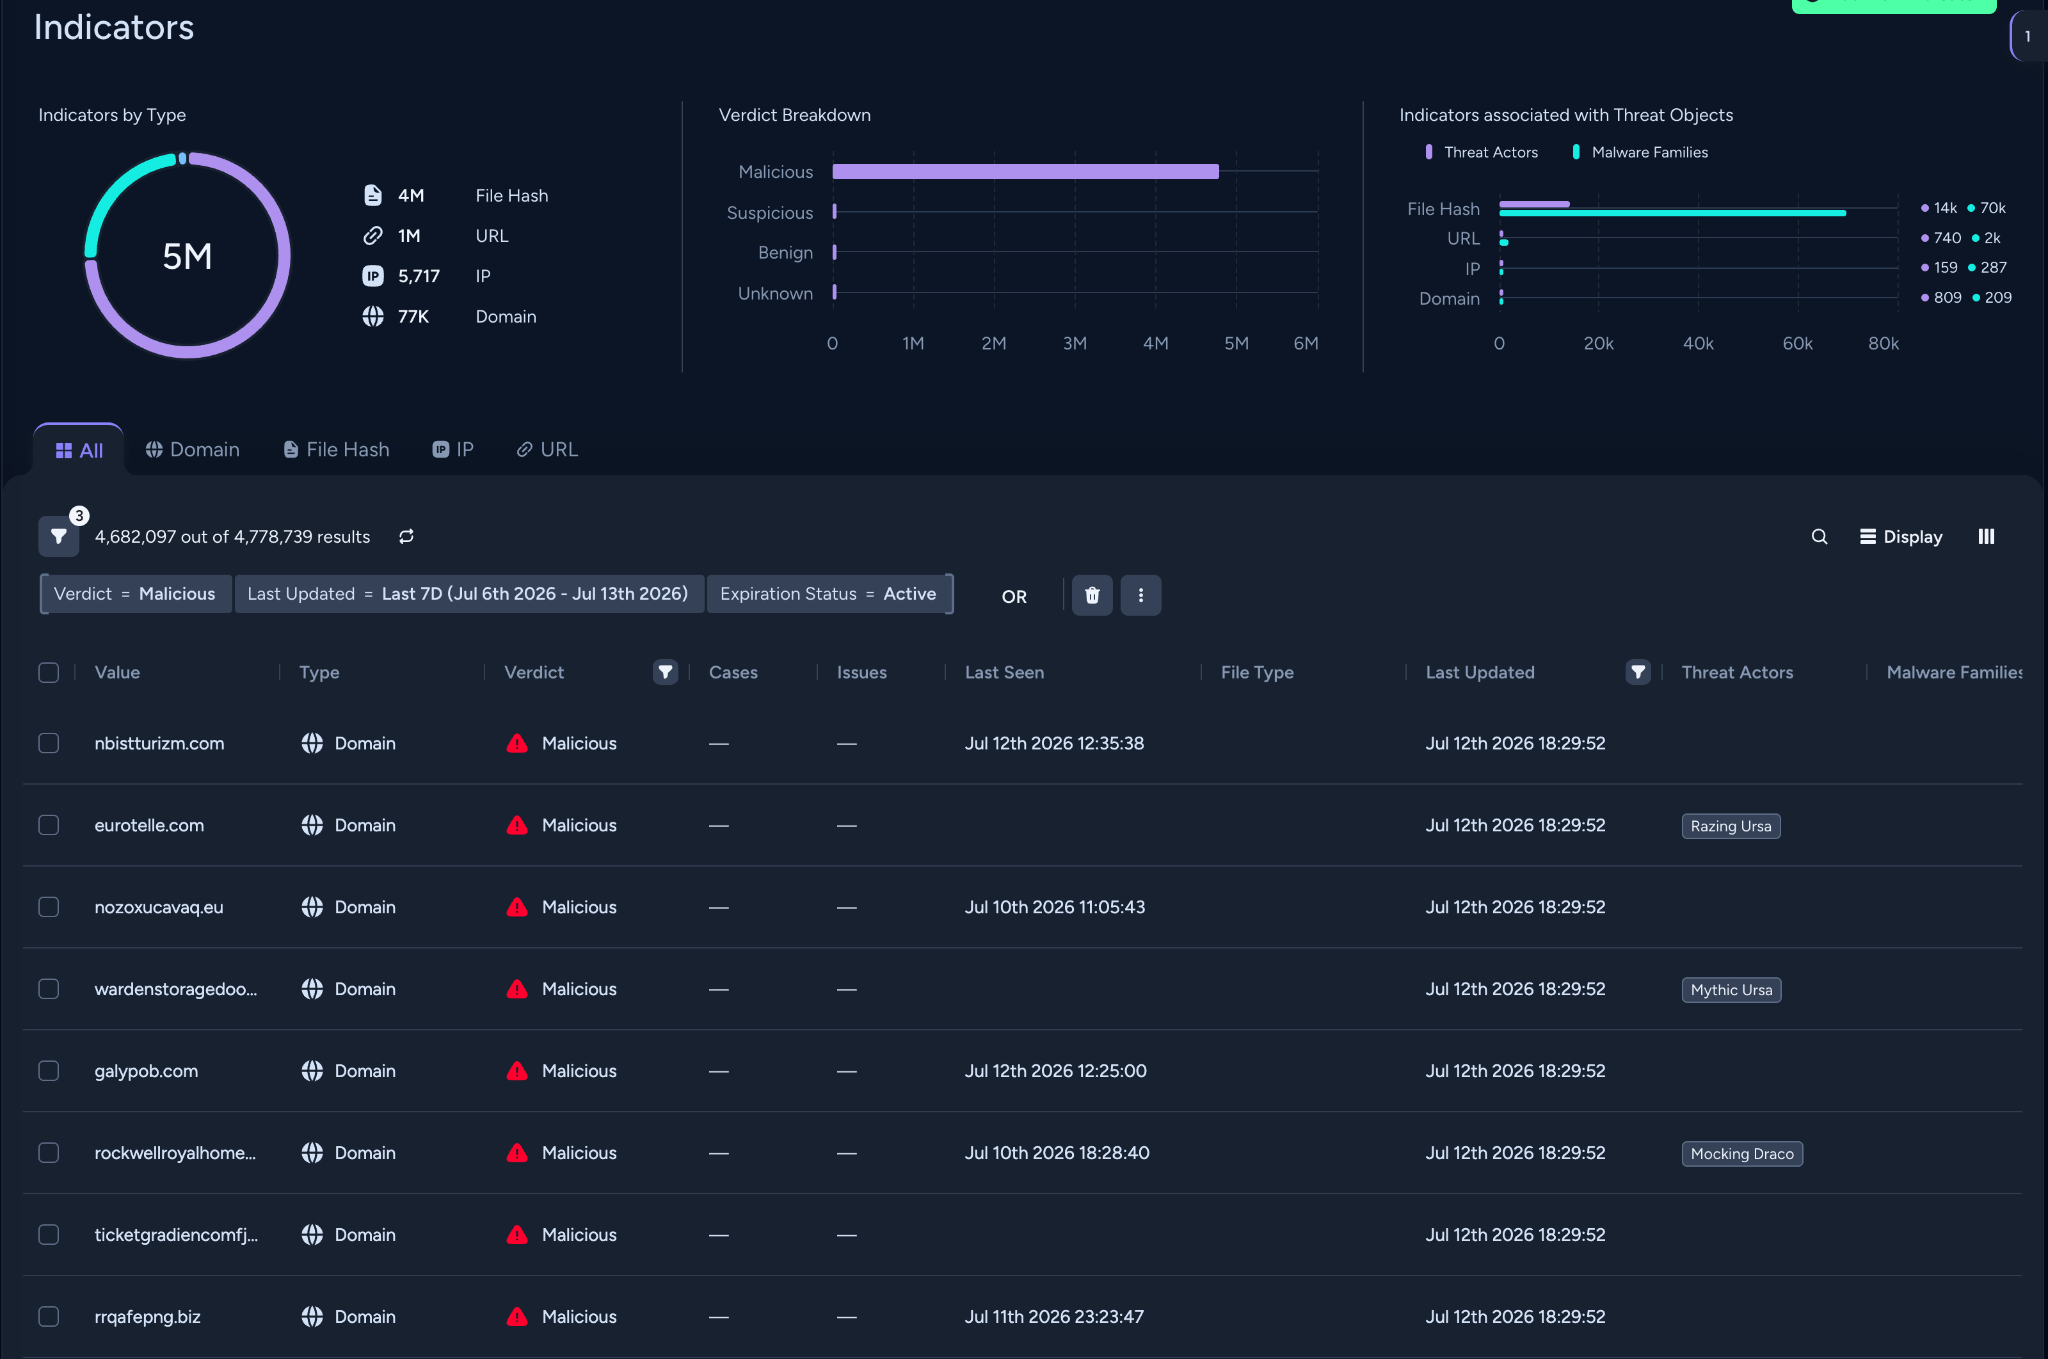
You can use this page to view data and discover relationships between specific indicators and the broader threat landscape. The main tab contains all indicators and you can also view dedicated tabs for Domain, File Hash, IP, and URL indicator types.
The widgets at the top of the page provide visualizations that help you understand the breakdown of the indicators by type, verdict, and association with threat objects.
You can search and filter by fields such as value, type, threat actors, malware families, verdict, and tags.
When you select an indicator, a side pane opens, providing highlights designed for rapid tactical assessment and information about related threat actors and malware families.
- Overview: Shows highlights such as description, summary, and tags.
- Detections: Lists cases and issues associated with the specific indicator, including cases based on direct IOC observation and cases based on Behavioral Threat Analysis (BTA). Select a Cases or Issues grouping to view cases or issues in a tabular view.
- Associations: Lists related Threat Actors and Malware Families.
- Reports: Shows reports related to the indicator.
\
Threat intel context in cases and issues
Cortex identifies indicators from your existing detections generated by other modules. The system extracts these indicators at the issue level and aggregates them at the case level.
When an indicator is associated with an issue, you can view the threat intelligence context in the case and in the issues grouped under it, as follows.
Analyzing threat intel in a case
You can access threat intel context for a case as follows:
Case overview
In the Overview, under Artifacts, you can see indicators extracted from the case.
Expand each indicator that is listed here and hover over it to access more information about it, including XTI Verdict:
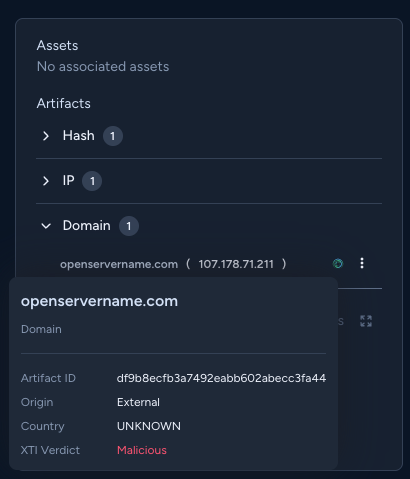
Threat Intel tab
In the Detailed view of a case, access threat intel context through the Threat Intel tab. When indicators are identified in one or more issues grouped under the case, the tab includes overview widgets and a list of the aggregated indicators.
The following screenshot shows the Threat Intel tab and its content:
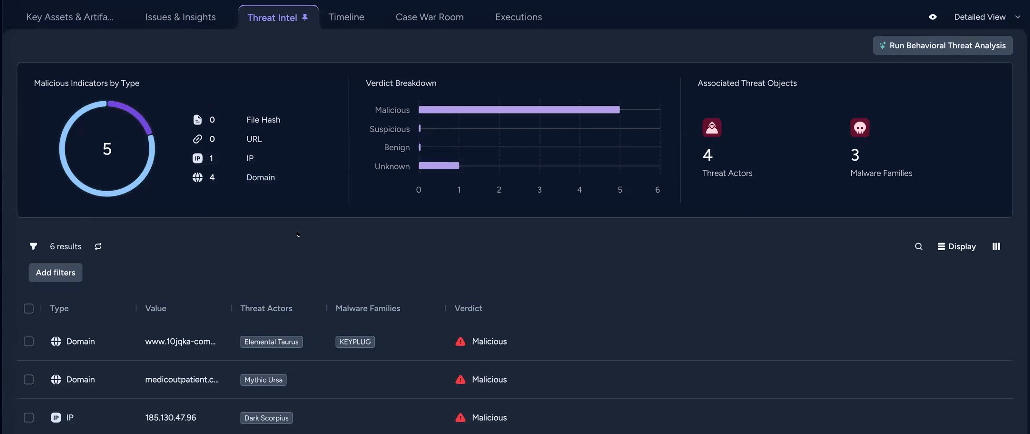
The following widgets help you understand the indicators associated with the case:
- Malicious indicators by type: Shows the breakdown of malicious indicators by type. Select the indicators in the widget to filter the indicators shown in the table.
- Verdict breakdown: Shows the breakdown of all indicators by verdict. Select the verdicts in the widget to filter the indicators shown in the table.
- Associated Threat Objects: Links threat actors and malware families associated with the indicators. Select to filter the results below.
The Associated Indicators list provides the following information:
- Type: Indicator type (Domain, File Hash, IP or URL)
- Value: A specific domain name, file hash, IP address or URL
- Threat actors: Threat actors associated with the indicator.
- Malware families: Malware families associated with the indicator.
- Verdict: Indicator verdict.
Select a specific row to open the indicator’s XTI entry in a side panel, where you can review the associated threat actors, malware families, as well as XTI Verdict.
Analyzing threat intel in an issue
When investigating an issue using the Investigate option, there is a section called Indicators in the issue Overview that lists indicators extracted from the issue:
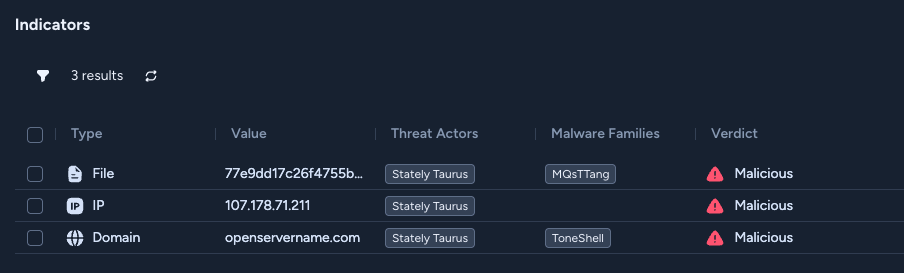
For each indicator, you can see the associated threat actors, malware families associated with that indicator, as well as XTI Verdict.
You can select each indicator to view the XTI Indicator side pane.
Related links
For general information about cases and issues, see Investigation and response.
Behavioral Threat Analysis (BTA)
XTI performs Behavioral Threat Analysis (BTA) on eligible cases and displays any significant findings. BTA correlates observed behaviors and evidence from security cases and issues with known threat actor Tactics, Techniques, and Procedures (TTPs).
BTA uses an agentic inference pipeline to integrate threat intelligence with the rich telemetry of your environments, categorizing each case and providing potential attribution to help analysts quickly understand the nature and origin of a threat.
BTA performs the following actions:
- Categorizes threats: Automatically analyzes a case and predicts if the activity is an APT Attack, Cyber Crime, Attack Simulation Tool, or Non-attributable.
- Provides actor attribution: For APT Attacks or Cyber Crime, supplies up to three likely actor hypotheses (for example, identifying a specific threat group) using relative likelihood labels like "Most Likely," "Possible," and "Less Likely."
- Delivers country attribution: For APT attacks, provides a predicted country of origin to help trace the attack's source.
- Supplies evidence and rationale: Provides the model's reasoning, evidence details, and direct links to supporting Unit 42 or OSINT publications.
- Reconciles context: Evaluates the "totality of case evidence"—including all extracted indicators, their relationships, and behavioral patterns—to provide a highly contextualized attribution story.
Supported regions
BTA is only available on Cortex tenants located in the following regions:
Americas
- United States (US)
- Canada (CA)
EMEA
- Italy (IT)
- Netherlands
- Spain (ES)
- United Kingdom (UK)
JPAC
- India (IN)
- Singapore (SG)
BTA eligibility
BTA is automatically generated for cases with high or critical severity. You can also run BTA manually on cases with lower severity.
BTA categories
Here is the breakdown of how the BTA logic processes a case to issue a threat intelligence summary and categorize an attack, attributing it into one of four primary categories depending on the nature of the activity.
| BTA category | Description |
|---|---|
| APT Activity | <p>If the activity is classified as an Advanced Persistent Threat (APT) Activity, the system evaluates whether specific Threat Actor (TA) attribution is possible:</p><ul><li>No Threat Actor Attribution: If the specific threat actor cannot be identified, the system defaults to showing general country-level attribution.</li><li>With Threat Actor Attribution: If a specific threat actor is identified, the system provides deeper context alongside the nation-state origin. Up to three suspected actors are displayed with one identified as the most likely to be responsible for the activity.</li></ul> |
| Cybercrime | <p>If the activity is classified as financially motivated Cybercrime, the system evaluates attribution at the criminal level:</p><ul><li>No Threat Actor Attribution: If the specific threat group or individual cannot be pinned down, the logic stops at identifying the general category.</li><li>With Cybercriminal Attribution: If the specific cybercriminal group or campaign can be identified, it provides targeted threat actor attribution. Up to three suspected actors are displayed with one identified as the most likely to be responsible for the activity.</li></ul> |
| Attack Simulation | If the system detects that the activity is an authorized security test or training exercise, it bypasses all actor or country attribution entirely and simply generates an overview of the event. |
| Non Attributable | If the activity does not fit into the threat or simulation categories, or lacks any defining behavioral footprints, it categorizes it as Non Attributable and provides a standard high-level overview. |
BTA summary in Threat intel
XTI performs Behavioral Threat Analysis (BTA) on eligible cases and displays any significant findings. If BTA findings have been generated and displayed for a case, you can find them listed under AI Behavioral Threat Analysis in the Threat Intel tab.
When BTA attribution is displayed, a confidence level in the results is included (“Very High Confidence” or “High Confidence”). If confidence level is lower, BTA results are not displayed.
The following screenshots illustrate examples of the Threat Intel tab with BTA output displayed in it.
APT Activity
In this example, the system determined the activity to be an APT activity:
You can see the title and the summary of the findings, as well as suspected actor(s) (if attributed) and suspected origin (if attributed). To the right, you can find the widget visualizing threat associations.
Select Suspected Actor to review the list of threat actors. Select a specific actor to view it in XTI Threat Intel Library.
Select the  (down arrow) to expand the BTA summary.
If a threat actor has been attributed, you can access Report Details for each of the attributed threat actors:
Select a threat actor name to view Actor Attribution Evidence and Source Publications used for the attribution. Within the Actor Attribution Evidence, you can access clickable citations pointing you to specific reports that were used to attribute the actor. Under Source Publications, you can select a publication to access more information about it in XTI Threat Intel Library.
Cybercrime
In this example, the system determined the activity to be a cybercrime:
You can see the title and the summary of the findings, as well as suspected actor(s) (if attributed). To the right, you can find the widget visualizing threat associations.
Select Suspected Actor to review the list of threat actors. Select a specific actor to view it in XTI Threat Intel Library.
Select the (down arrow) to expand the BTA summary.
If a threat actor has been attributed, you can access Report Details for each of the attributed threat actors:
Select a threat actor name to view Actor Attribution Evidence and Source Publications used for the attribution. Within the Actor Attribution Evidence, you can access clickable citations pointing you to specific reports that were used to attribute the actor. Under Source Publications, you can select a publication to access more information about it in XTI Threat Intel Library.
Attack simulation
In this example, the system determined the activity to be an attack simulation:
You can see the title and the summary of the findings. To the right, you can find the widget visualizing associated indicators.
Select the (down arrow) to expand the BTA summary.
In Report Details, you can see Evidence Summary about the observed activity.
Non-attributable
In this example, the system determined the activity to be non-attributable:
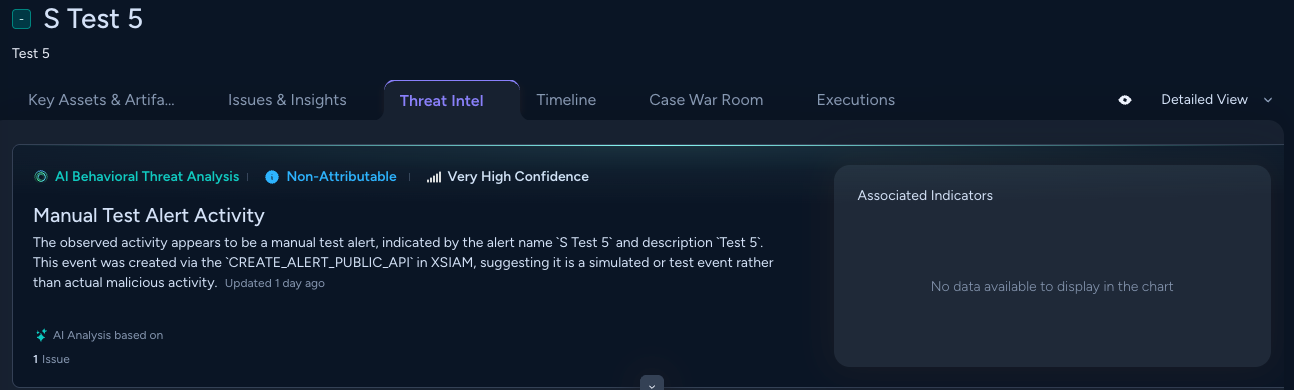
You can see the title and the summary of the findings. To the right, you can find the widget visualizing associated indicators.
Select the (down arrow) to expand the BTA summary.
In Report Details, you can see Evidence Summary about the observed activity..
Under AI Analysis based on, you can see the sources behind the AI analysis. You can hover and/or select the text to get more information and access related reports.
Run Behavioral Threat Analysis (BTA)
If BTA wasn’t displayed on a case automatically, you can trigger it manually.
BTA is automatically generated only for cases where severity is high or critical. If the BTA did not run automatically on a case (because case severity is lower, or the automatic pipeline is out of quota, or where it did not run for any other reason), you can run BTA manually.
- Go to the case where you would like to run BTA.
- Select the Threat Intel tab.
- Select Run Behavioral Threat Analysis.
Results typically appear within a few minutes. Results only display when confidence is high. Otherwise, the message "Behavioral Threat Analysis last ran on {date} and produced no notable findings" appears.
XTI indicator rules
Use XTI indicator rules to monitor your environment for known threat indicators—such as malicious IPs, domains, and file hashes. Configure an indicator rule to scan collected log data and generate an issue for investigation upon a match.
XTI indicator rules offer smart, dynamic targeting. In addition to manually selecting static lists of indicators, you can build dynamic, attribute-based filters using rich threat intelligence context. For example, you can create a rule that automatically targets "all indicators linked to a specific threat actor with a malicious verdict". As new intel is ingested that matches your filters, the rule dynamically updates its scope without manual intervention.
Indicator rule limits
- Each tenant is limited to a maximum of 4 million indicators flagged by indicator rules.
- The maximum number of indicators allowed per rule depends on the scoping mechanism used (static list or dynamic filter). Rules using static lists support up to 1,000 indicators, while rules using dynamic filters can support up to 1 million indicators. If you require a higher limit, reach out to Palo Alto Networks.
Supported indicator rule types
Currently, only detection rules are supported.
You can create a detection rule using a static list of manually selected indicators or a dynamic filter that automatically adds new indicators to the rule based on the filter conditions.
Permissions required for using indicator rules
Viewing indicator rules requires View RBAC permissions for both Threat Intelligence and Rules in the Threat Management component tab.
Creating, modifying, enabling/disabling, and deleting indicator rules requires View or View/Edit RBAC permissions for both Threat Intelligence and Rules in the Threat Management component tab.
View indicator rules
To view and manage indicator rules, go to Threat Management → Detection Rules → Indicator Rules. For each rule, you can see: Modification Date, Name, Type, Target, Severity, # of Issues, Created by, Description, Status, Rule ID, and Creation Date.
Create an indicator rule for detection
To create a detection rule:
- Go to Threat Management → Detection Rules → Indicator Rules.
- Select +Add Rule.
- In the Overview, provide:
- Rule Name: The rule name is used when creating issues triggered by the rule (The title and description of an issue will include the rule name and the indicator value). The rule name can include up to 75 characters; no special characters are allowed.
- Severity (Critical, High, Medium, or Low): The severity of an indicator rule determines the severity of issues created as a result of rule matching. Severity also dictates rule priority. If two rules flag the same indicator, the rule with the highest severity is associated with the indicator and the corresponding issue. If two rules have the same severity, the last modified rule has priority.
- Description (Optional).
- Select Next.
- In the Select Target Indicators, select one of the following.
- Static List: Manually select indicators one by one. You can select up to 1000 indicators.
- Dynamic Filters: Specify a filter. The filter automatically adds new indicators to the rule based on the filter conditions, up to 1 million indicators per rule.
- Select Next.
- Confirm the details and select Create New Rule to save the rule.
Modify an indicator rule
You can modify a previously created indicator rule to update future detections. All parameters can be modified.
Note: Changes take effect going forward and do not apply retroactively. Existing issues are not closed or updated after a rule modification.
To modify a previously created rule:
- Go to Threat Management → Detection Rules → Indicator Rules.
- Right-click a rule and then select Edit Rule.
Enable or disable an indicator rule
You can enable or disable indicator rules.
Disabling a rule stops new rule matching but does not close previously generated issues.
To enable or disable a rule:
- Go to Threat Management → Detection Rules → Indicator Rules.
- Right-click a rule and then select Disable Rule or Enable Rule.
- Confirm by selecting Yes.
Delete an indicator rule
You can delete a previously created indicator rule to prevent future detections. Deleting an indicator rule cannot be reverted.
Note: Existing issues generated by the rule are not closed after you delete the rule.
To delete a rule:
- Go to Threat Management → Detection Rules → Indicator Rules.
- Right-click a rule and then select Delete Rule.
- Confirm by selecting Delete.
\
Threat intel investigation through XQL
XTI is integrated into the Cortex Query Language (XQL) system, empowering you to create investigations and hunt queries using the full depth of the XTI intelligence library.
You can query threat intel indicators and threat objects through the XQL Search Portal by navigating to Investigation & Response → Search → Query Builder.
The following threat intel XQL datasets are available:
| Dataset name | Description |
|---|---|
| threat_intel_indicators | Contains all active threat intel indicators with their attributes. |
| threat_intel_threat_actors | Contains all threat intel actors with their attributes. |
| threat_intel_malware | Contains all threat intel malware families with their attributes. |
| threat_intel_relationships | Describes associations between threat objects (threat actors, malware families) and indicators. |
| issue_to_indicator | Correlates threat intel data with issues data. |
Select the Schema tab to see all fields available for each dataset.
Because XTI datasets are holistic, stateful representations rather than time-bound logs, the Time frame filter is disabled for these datasets.
Related links
For general information about XQL, see Cortex XSIAM XQL.
Using XTI datasets in correlation rules
Using XTI datasets in correlation rules is not supported. Contact Palo Alto Networks if you have any questions.
Threat Intel Dashboard
The Threat Intel Dashboard visualizes threat intelligence data, such as threat objects and indicators, within your environment to help you understand data distribution and identify trends.
You can use the dashboard as provided or clone and modify it to suit your needs.
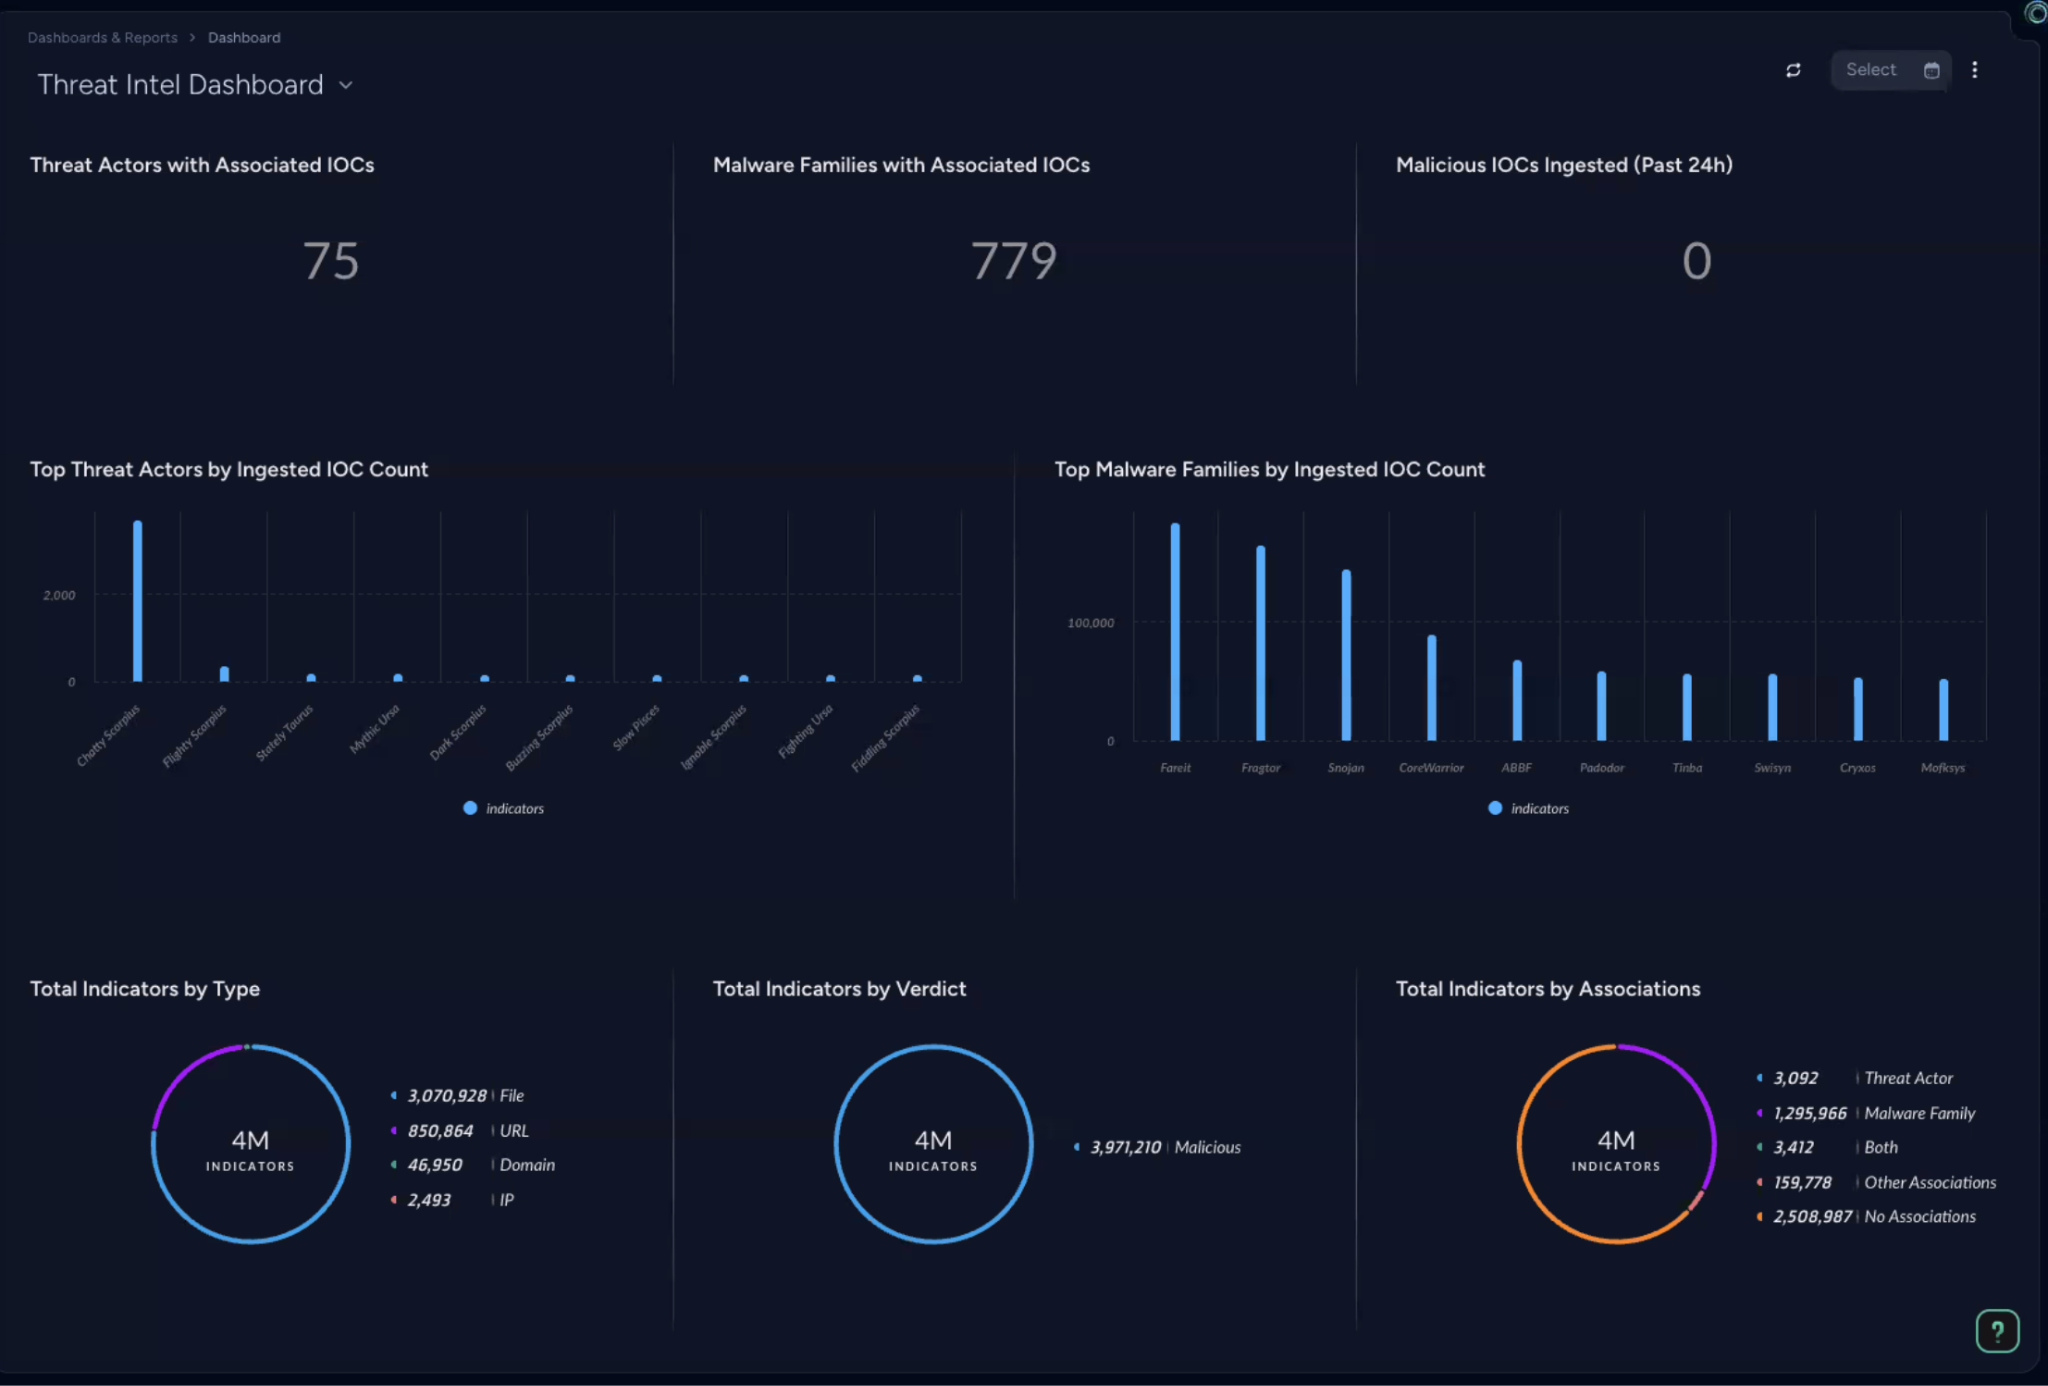
Accessing the dashboard
To access the dashboard, go to Threat Management → Threat Intelligence → Dashboard.
Alternatively, you can access it from Dashboards & Reports → Dashboard. From the dashboard header, a menu lists all available predefined and custom dashboards. Find the Threat Intel Dashboard dashboard on that list and select it.
If you position the cursor over a specific dashboard widget, you can access the related XQL query by selecting the XQL link in the top-right corner of the widget:
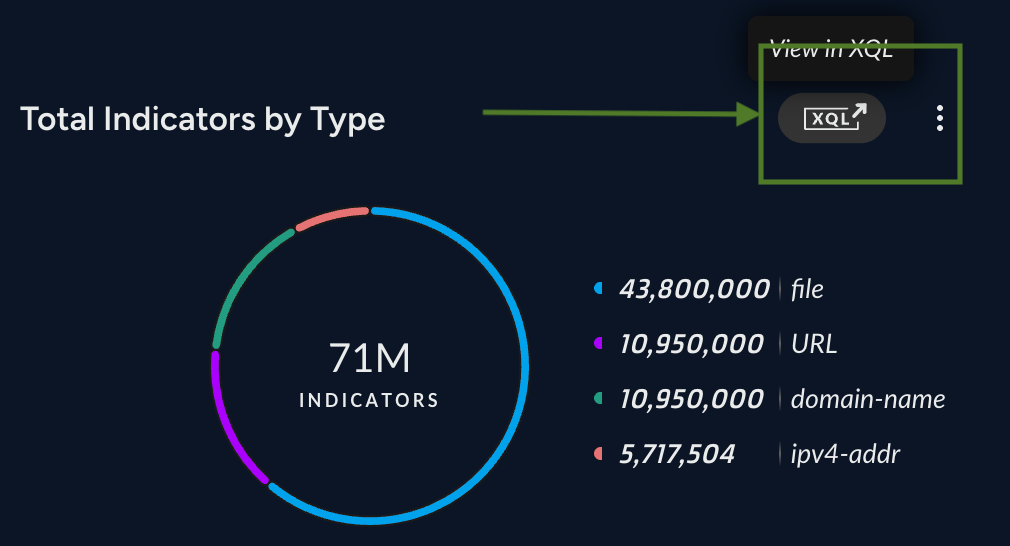
Dashboard content
The Threat Intelligence Dashboard serves as a comprehensive overview of Unit 42 threat intelligence data, helping you understand data distribution and identify trends.
The dashboard starts with a high-level overview of ingestion health and data distribution to ensure all streams from Unit 42 remain active.
As you move down, the data becomes increasingly granular. The second row breaks down top threat actors and malware families by specific IOC counts, while the third row expands the scope to provide a holistic view of indicators across the entire environment.
These categories are separated because file-based data typically arrives in much larger volumes than network traffic data, and each represents a distinct technical domain—one focused on file processes and the other on network communication.
Related links
For general information about dashboards, see Monitor dashboards and reports.
Using XTI with Threat Intel Agent
Agentic Assistant Threat Intel (TI) Agent works with Extended Threat Intelligence (XTI) and Threat Intel Management (TIM).
- If you have XTI only enabled, the TI Agent reads from and writes to the XTI dataset. Only the actions listed below are supported.
- If you have both XTI and TIM enabled side-by-side:
- The TI Agent reads from the XTI dataset. Only the actions listed below are supported.
- The TI Agent writes to both XTI and TIM datasets. Only the actions listed below are supported for XTI.
- If you disable XTI, the TI Agent reads from and writes to the TIM dataset.
TI Agent actions supported by XTI
The TI Agent can perform various read and write actions. The TI Agent can perform the following actions for XTI:
| Action | Example prompt |
|---|---|
| List indicators | Show me the most recent malicious IP indicators |
| List indicator relationships | Show me relationships with 183.132.45.96 |
| Update Indicator | Update 1.1.1.10 to verdict Benign |
| <p>Enrich Domain</p><p>Enrich File</p><p>Enrich IP</p><p>Enrich URL</p> | Show me information about 192.43.254.85 |
Enrich CVE is currently not supported.
Related links
For general information and best practices related to enabling and using Agentic Assistant chat, see Agentic Assistant chat.
Using XTI in playbooks
Extended Threat Intelligence (XTI) utilizes existing Threat Intel Management (TIM) to automate triage, enrichment, and response for threat intel use cases.
Playbook commands supported by XTI
The following built-in commands (also referred to as system commands) can be used with XTI.
The supported commands are:
- createNewIndicator
- setIndicator
Related links
For more information on specific built-in commands, see the in-product Script Helper available from Incident Response → Automation → Scripts → Script Helper.
For general information about playbooks, see Playbooks.
Threat Intel Management
Enhance your investigation with Threat Intel Management (TIM), which utilizes Unit 42 Intel.
Explore Threat Intel Management
Get started with Threat Intel Management
Enhance your investigation with Threat Intel Management (TIM), which utilizes Unit 42 Intel.
Before diving in, you should understand the Cortex XSIAM Threat Intelligence Management's functionality and how it integrates with your needs. Review the use cases and key details to optimize your Cortex XSIAM experience from the start. Threat Intel management includes the following features:
- Manage Indicator Relationships
- Deep dive into an indicator on the XSIAM Indicators page.
Note
You must have the Cortex XSIAM Premium license or any other XSIAM license with the Threat Intel Management (TIM) add-on to use this feature.
What is Threat Intel Management?
The Cortex XSIAM native threat intel management capabilities allow you to unify the core components of threat intel, including threat intel aggregation, scoring, and sharing. Cortex XSIAM automates threat intel management by ingesting and processing indicator sources, such as feeds and lists, and exporting the enriched intelligence data to SIEMs, firewalls, and any other system that can benefit from the data. These capabilities enable you to sort through millions of indicators daily and take automated steps to make those indicators actionable.
Note
You must have the Cortex XSIAM Premium license or any other XSIAM license with the Threat Intel Management (TIM) add-on to use this feature.
You can do the following:
- Import from integrations (such as third-party feeds and WildFire)
- Create indicators during investigations
- Create issue rules (such as IP, Domain, and File indicators)
- Push indicators to the XDR agent for prevention (SHA256 and MD5 indicators)
- Export indicators through a feed
Why Threat Intel Management?
-
Powerful native centralized threat intel
Supercharge investigations with instant access to a large repository of built-in, high-fidelity Palo Alto Networks threat intelligence crowdsourced from the largest footprint of network, endpoint, and cloud intel sources.
-
Indicator relationships
Indicator connections enable structured relationships between threat intelligence sources and issues. These relationships surface important context for security analysts on new threat actors and attack techniques.
-
Hands-free automated playbooks with extensible integrations
Take automated action to shut down threats across over 600 third-party products with purpose-built playbooks based on proven SOAR capabilities.
-
Granular indicator scoring and management
Take charge of your threat intel with playbook-based indicator lifecycle management and transparent scoring that can be easily extended and customized.
-
Automated, multi-source feed aggregation
Eliminate manual tasks with automated playbooks to aggregate, parse, prioritize, and distribute relevant indicators in real-time to security controls for continuous protection.
-
Most comprehensive marketplace
The largest community of integrations with content packs that are prebuilt bundles of integrations, playbooks, dashboards, field subscription services, and all the dependencies needed to support specific security orchestration use cases.
Threat Intel with Security orchestration
Security orchestration, automation, and response (SOAR) solutions have been developed to weave threat intelligence management into workflows by combining TIM capabilities with case management, orchestration, and automation capabilities. SOAR solutions weave threat intelligence into a more unified and automated workflow. It matches issues both to their sources and to compiled threat intelligence data and can automatically execute an appropriate response.
As part of the extensible Cortex XSIAM platform, TIM unifies threat intelligence aggregation, scoring, and sharing with playbook-driven automation. It empowers security leaders with instant clarity into high-priority threats to drive the right response across the entire enterprise.
Cortex XSIAM provides a common platform for cases and threat information, where there is no disconnect between external threat data and your environment. Automated data enrichment of indicators provides analysts with relevant threat data to make smarter decisions.
Integrated case management allows for real-time collaboration, boosts operational efficiencies across teams, and automates playbooks to speed response across security use cases.
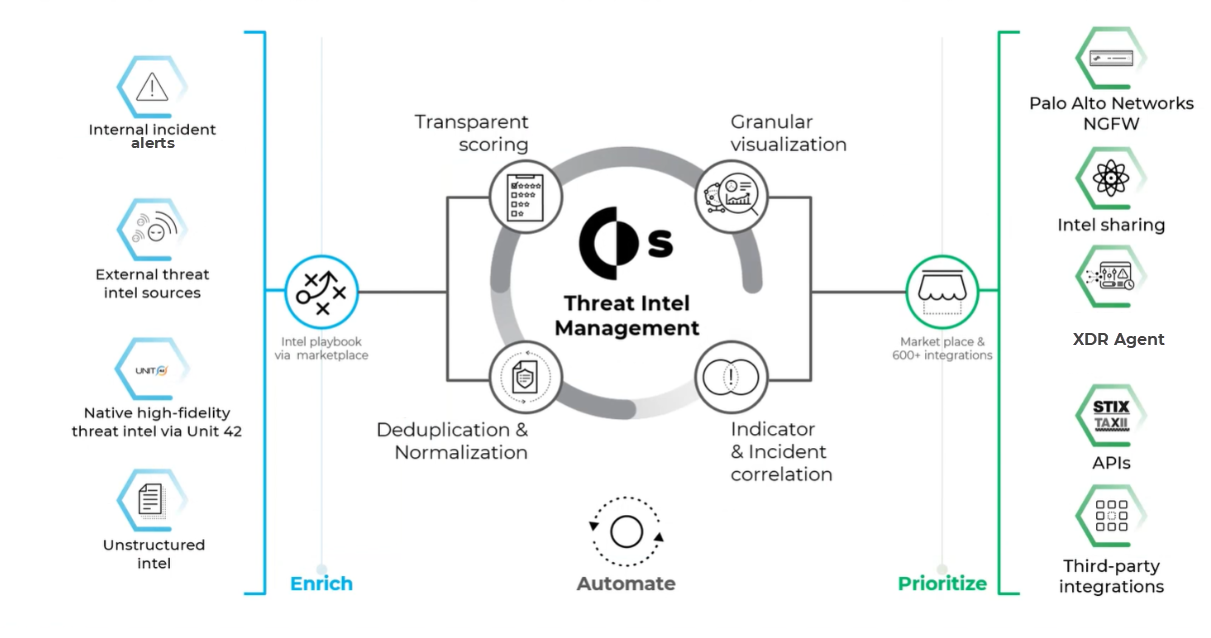
Cortex XSIAM collects data from sources such as issues, Unit 42, and external threat intel feeds. After the data is ingested, Threat Intel playbooks examine the data proactively. The data gets deduped, normalized, and stored in the Threat Intel database so that a Threat Intel analyst can start a threat analysis. The analyst can then send that information to firewalls, share it with other stakeholders, and take remedial action as necessary.
Threat Intel Management use cases
Threat Intel Management use cases
The following examples illustrate typical use cases for Threat Intel Management analysts.
Dynamic allow lists for business-critical SaaS apps
In this example, Firewall Admins are responsible for ensuring employees can always access SaaS applications such as Zoom and Office 365. They need to manage a stream of inbound change requests from the security team and other business units. Regardless of these daily changes, critical apps must always be allowed. The network infrastructure of SaaS applications is constantly changing/rotating IP addresses and Domains.
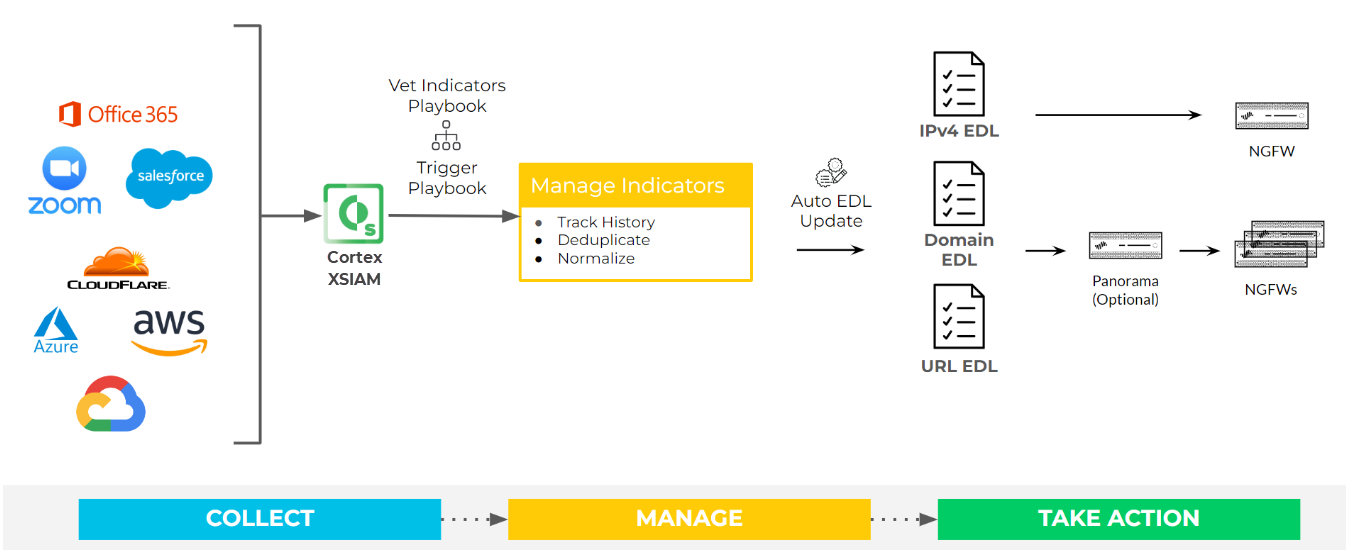
- Configure a feed integration such as Office 365, Amazon AWS, or Unit 42.
- Navigate to Settings → Data Sources & Integrations.
-
Search for and select the relevant integration and click Add Instance.
In this example, add the AWS feed.
- Set up the instance. In the Indicator Reputation field, select Benign.
- Test and save the instance.
- (Optional) Configure a playbook to filter indicators according to your requirements.
-
Go to the Indicators page and run the following search to return IP, IPv6 or IPv6CIDR results:
sourceBrands:"AWS Feed" and expirationStatus:active and type:IP or type:IPv6 or type:IPv6CIDR - Configure the Generic Export Indicator Service integration.
- On the Data Sources & Integrations page, search for and select Generic Export Indicators Service, and click Add Instance.
- In the Indicator Query field, add the query in step 3.
- Add the remaining fields, test, and save.
- Test the EDL by running the cURL command:
curl -v-u- user:pass https://ext-<tenant>crtx<region>.paloaltonetworks.com/xsoar/instance/execute/<instance-name>
Proactive blocking of known threats
The security team needs to leverage threat intelligence to block or alert on known bad domains, IPs, hashes, etc. (indicators). The indicators are collected from many sources, which need to be normalized, scored, and analyzed before pushing to security devices such as firewalls for alerting. Detection tools can only handle limited amounts of threat intelligence data and need to constantly re-prioritize indicators.
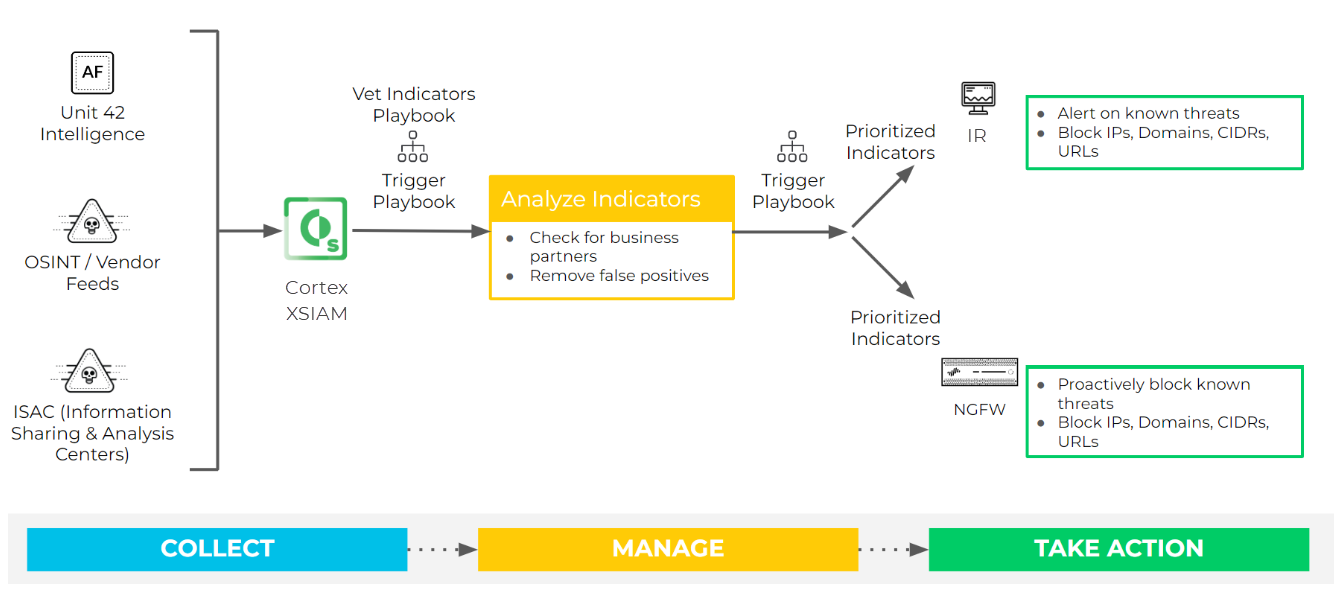
Solution
Indicator prioritization. Cortex XSIAM can ingest phishing issues from email inboxes through integrations. Once an issue is ingested, a playbook is triggered and can have any combination of automated or manual actions that users desire. The playbooks can have filters and conditions that execute different branches depending on certain values.
- Configure feed integrations such as Unit 42 Feed, TAXII feed, etc.
- Navigate to Settings → Data Sources & Integrations.
- Search for and select the relevant threat intel feed integration and select Add Instance.
-
Set up the instance.
Leave the Indicator Reputation field blank.
- Test and save the instance,
- (Optional) Configure a playbook to filter indicators according to your requirements.
-
Go to the XSIAM Indicators page and run the following search to return IP addresses with the verdict malicious with high reliability:
expirationStatus:active and type:IP and verdict:malicious and aggregatedReliablitiy:A - Completely reliable - Configure the Generic Export Indicator Service integration.
- Navigate to Settings → Data Sources & Integrations.
- Search for and select Generic Export Indicators Service and click Add Instance.
- In the Indicator Query field, add the query in step 3.
- Add the remaining fields, test, and save.
-
Test the EDL by running the cURL command:
curl -v-u- user:pass https://ext-<tenant>crtx<region>.paloaltonetworks.com/xsoar/instance/execute/<instance-name>You can use this URL in your Next-Generation Firewall.
Issue enrichment
Case Responders receive an endless stream of issues, usually with little to no context of the external threat. Enriching issues with curated threat intelligence from Unit 42 enables analysts to see the bigger picture and make more informed decisions when responding to issues, ensuring comprehensive containment of the threat.
Most tools that Security Operations Centers and Case Response teams use to respond to issues are very generic. There is little correlation between network data and understanding of threats and attacker movements. There is often a dump of information, including bad IP addresses or domains, and someone has to be assigned to manually resolve to figure out false positives. There is also a lack of understanding of malicious families, hacking tools, and their patterns of attacks.
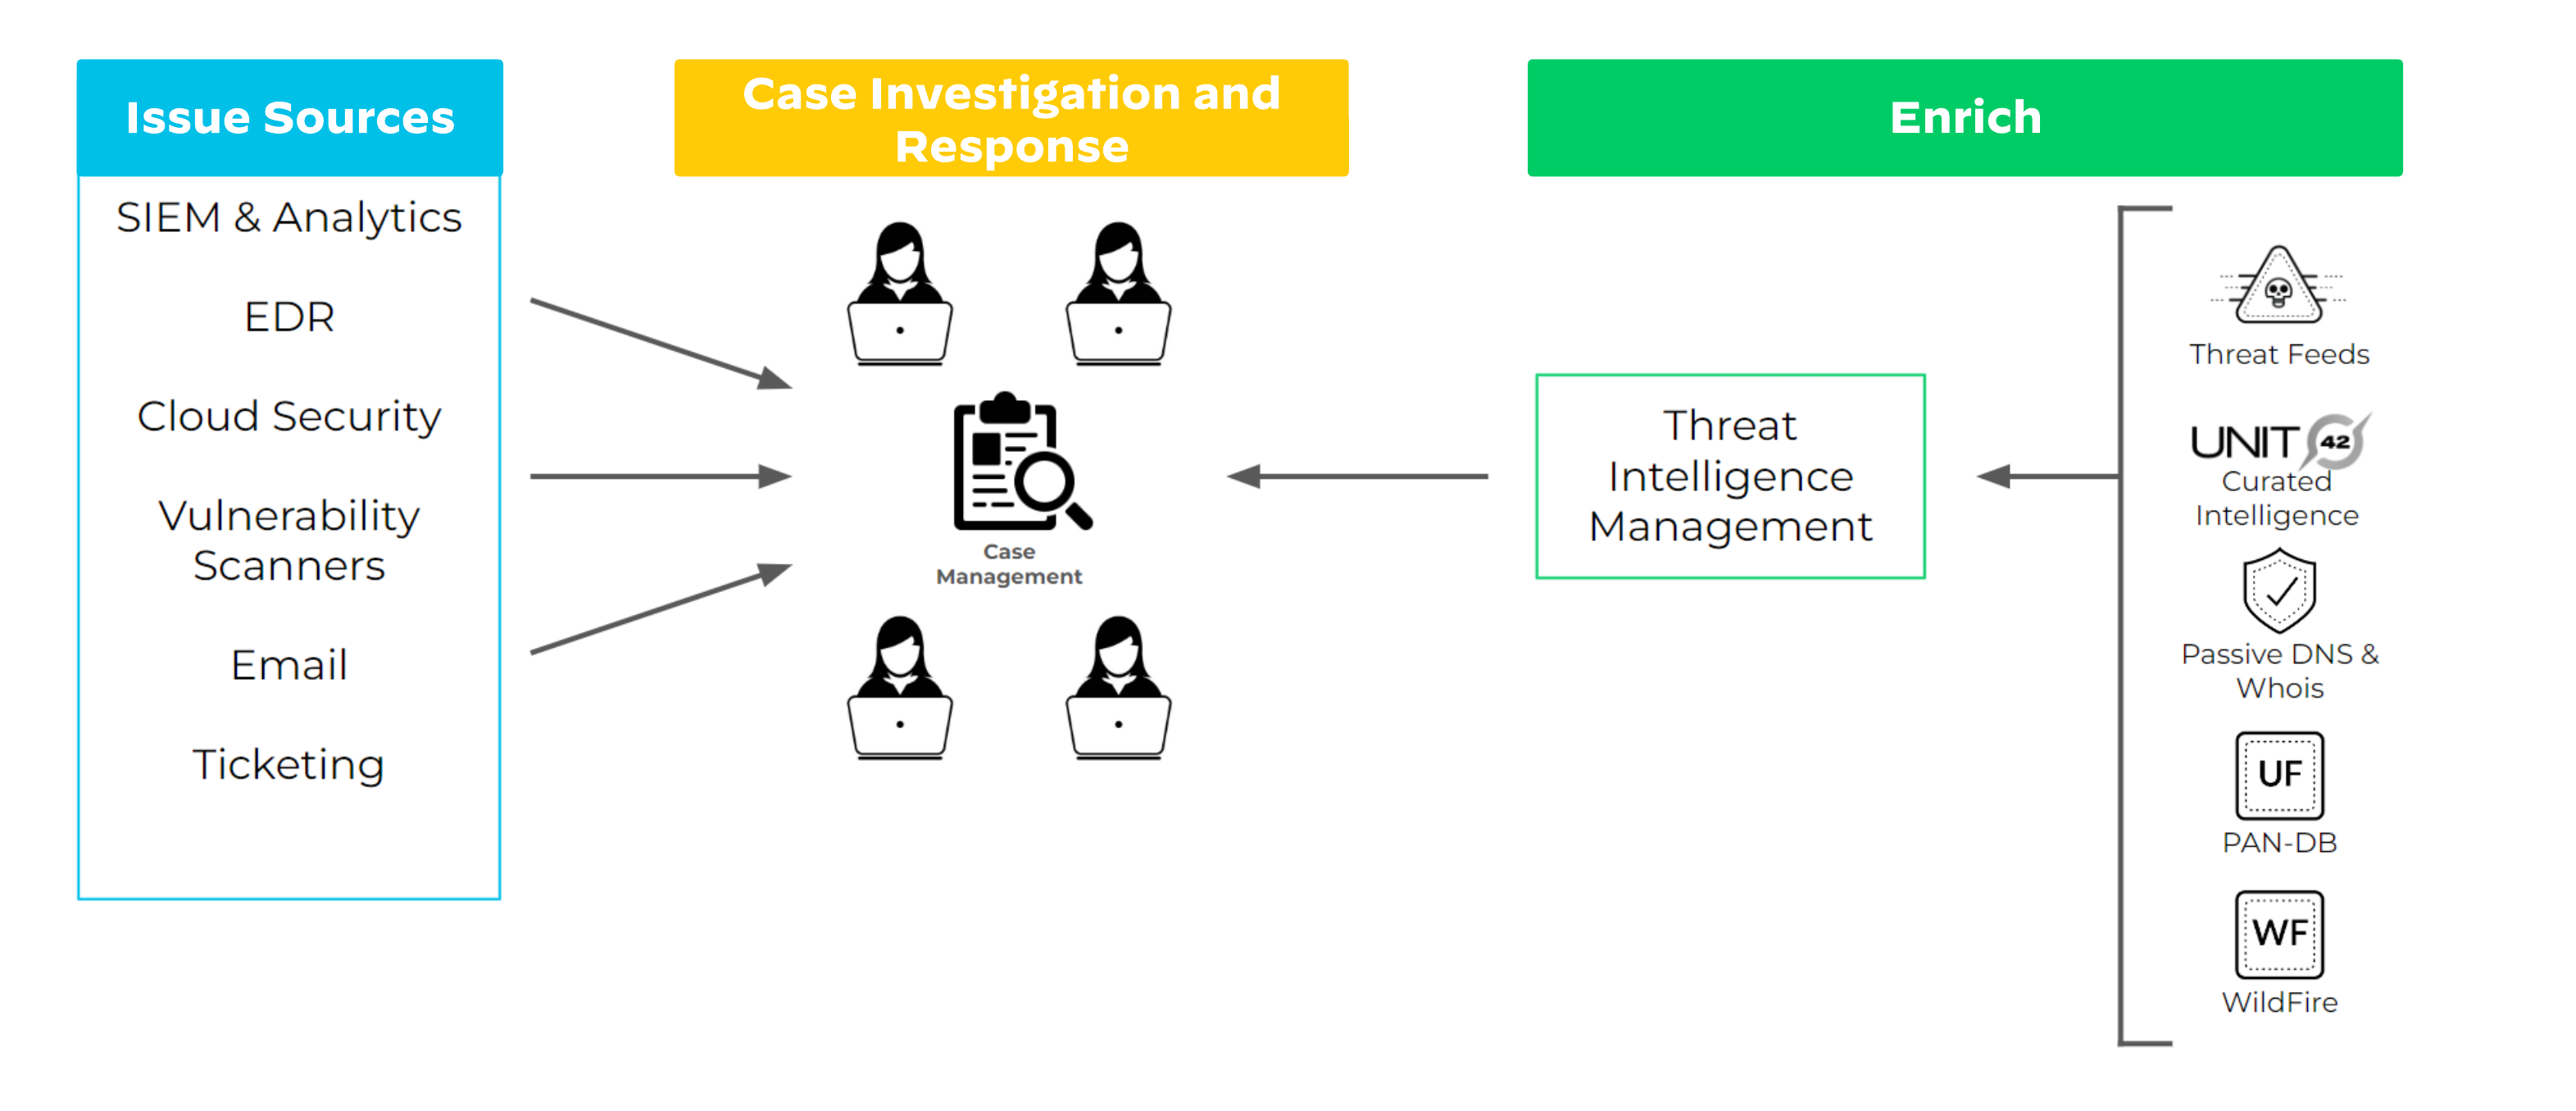
Accelerate issue response with TIM and issue enrichment using threat intelligence data. The case enrichment workflow in Cortex XSIAM leverages threat intelligence from our centralized threat intelligence library, including information on:
- Data from Unit 42 Intel to learn about known malware campaigns or families
- IPs and domains with WHOIS data
- Passive DNS data
- Web categorization data
When investigating an issue, you can see information, such as affected hosts, affected users, and detailed information about the source and destination. You can deep dive into the indicator by clicking the indicator to see the verdict, sources, related issues, file details, and relationships. If the indicator originated from Unit 42, in the Unit 42 Intel tab you can see additional information, such as static and dynamic analysis for a file.
Roles and responsibilities in Threat Intel Management
A Threat Intel Management (TIM) analyst may have a different persona in the SOC. In some organizations, the TIM analyst is part of the SOC analyst’s definition of work, but they have different workflows and use cases. The daily work of SOC analysts and TIM analysts are different.
| Roles | Responsibility |
|---|---|
| Security Analyst (SOC Tier-1) | <ul><li>Triage Specialist</li><li>Monitor, manage, and configure security tools</li><li>Review cases to assess their urgency</li><li>Escalate cases when necessary</li></ul> |
| Threat Intel Analyst (SOC Tier 2-3) | <ul><li>Case responders and threat hunters</li><li>Remediation of escalated cases from Tier 1 - investigation, response, and assessments</li><li>Proactive work to remove infrastructure weaknesses</li></ul> |
Indicator concepts
Before you start customizing and investigating you should be familiar with the following terms
Indicators of Compromise
Indicators of compromise (Indicators) are artifacts that can signal a security breach has occurred and are associated with security issues. They help correlate issues, create hunting operations, and enable you to easily analyze issues and reduce Mean Time to Response (MTTR). They are an essential part of the case management and remediation process. Indicators can include:
- IP addresses: Unusual or foreign IP address accessing your network
- Hashes: Unique identifiers for files or malware
- Domain names: Suspicious or malicious domains
- Registry entries: Changes to the system registry
Fetch indicators
Cortex XSIAM includes integrations that fetch indicators from a vendor-specific source, such as TAXII, or a generic source, such as a CSV or JSON file. For more information about how to set up a Threat Intel feed integration to fetch indicators, see Configure Threat Intelligence feed integrations.
Indicator ingestion
Cortex XSIAM automates threat intel management by ingesting and processing indicator sources, such as feeds and lists, and exporting the enriched intelligence data to SIEMs, firewalls, and any other system that can benefit from the data. These capabilities enable you to sort through millions of indicators daily and take automated steps to make those indicators actionable in your security posture.
Note
You can store up to 100,000,000 indicators.
Indicators are added to Cortex XSIAM via the following methods:
| Method | Description | Classification and Mapping |
|---|---|---|
| Integration | Feed integrations: Fetch indicators from a feed, for example, TAXII, Office 365, and Unit 42 Feed. | Indicator classification and mapping is done in the Feed Integration and not in the Cortex XSIAM Settings → Configurations → Object Setup → Indicators → Classification & Mapping tab. |
| Indicator extraction | If you have enabled system-wide indicator extraction, indicators are extracted from all issues in Cortex XSIAM. | Only the value of an indicator is extracted, so no classification or mapping is needed. |
| Manual | <ul><li>Command line</li><li>Mark: The user marks a piece of data as an indicator.</li><li>STIX file: Manually upload a STIX file on the XSIAM Indicators page.</li></ul> | <p>Data is inserted manually via the UI so no classification or mapping is needed.</p><p>If importing a STIX file, mapping is done via the STIX parser code.</p> |
Common indicator data model
When indicators are ingested, regardless of their source, they have a unified, common set of indicator fields, including traffic light protocol (TLP), expiration, verdict, and tags.
Indicator smart merge
The same indicator can originate from multiple sources and be enriched with multiple methods (such as integrations, scripts, and playbooks). Cortex XSIAM implements a smart merge logic to make sure indicators are accurately scored (verdict) and aggregated. Indicator fields are merged according to the source reliability hierarchy. When there are two different values for a single indicator field, the field is populated with the value provided by the source with the highest reliability score. For multi-select and tag fields, new values are appended, rather than replacing the original values.
Indicators enrichment cache (Insightcache)
To avoid exceeding API quotas for third-party services, indicators are only updated after the cache expiration period. By default, the cache expires 4,320 minutes (3 days) after an indicator is updated, and cannot be cleared manually. The cache expiration can be set in the indicator type parameters. Indicator enrichment cache expiration only applies to automatic enrichment, triggered by the enrichIndicators command, and does not apply when you run reputation commands, such as !ip, directly.
Indicator timeline
The indicator timeline displays an indicator’s complete history, such as the first-seen and last-seen timestamp and changes made to indicator fields.
Indicator expiration
When ingesting and processing many indicators daily, it’s important to control whether or not they are active or expired and to define how and when indicators are expired. Cortex XSIAM offers multiple options to set indicator expiration. To configure how to expire an indicator, see Configure indicator expiration.
Exclusion list
Indicators added to the exclusion list are disregarded by the system and are not created or involved in automated flows such as indicator extraction. For more information, see Delete and exclude indicators.
Jobs
Administrators can define a job to trigger a playbook when the specified feed or feeds finish a fetch operation that includes a modification to the list. The modification can be a new indicator, a modified indicator, or a removed indicator. To create a job to process indicators, see Create jobs to process indicators example.
Indicator lifecycle
Indicators are text-based artifacts associated with issues, such as IP addresses, URLs, and email addresses, and are an essential part of the case management and remediation process. They help correlate issues, create hunting operations, and enable you to easily analyze cases and reduce Mean Time to Response (MTTR).
The following diagram explains the indicator lifecycle in Cortex XSIAM.
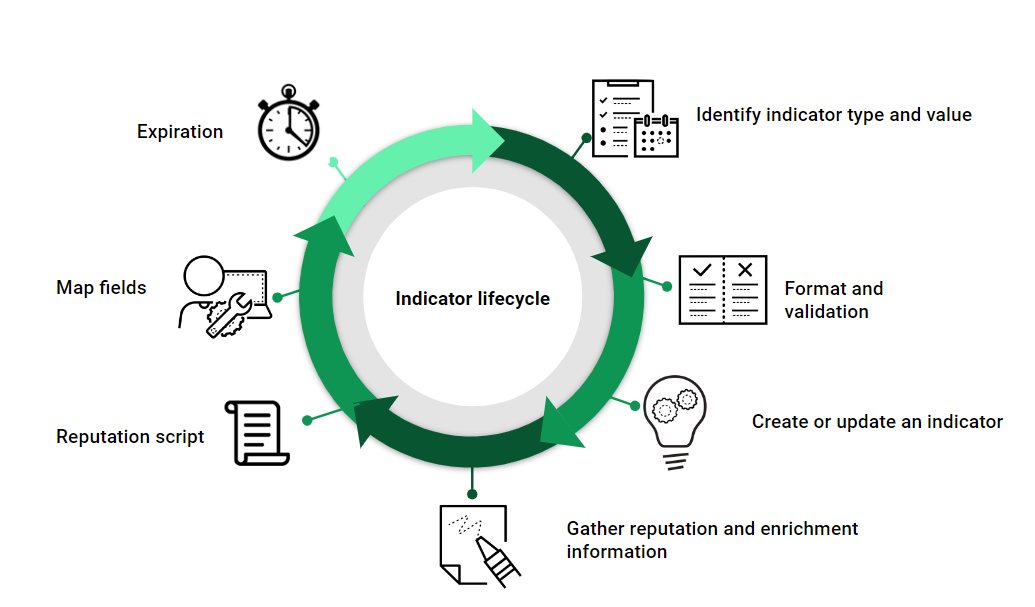
| Step | Details |
|---|---|
| 1. Identify the indicator type and value | <p>Cortex XSIAM analyzes the text-based artifact and if it matches the indicator type profile. The indicator value is extracted, based on the indicator profile definition. Indicator extraction identifies indicators from various sources within Cortex XSIAM, such as email headers, IP addresses, email addresses, and file hashes in file attachments. For more information about indicator extraction, see Indicator extraction.</p><p>You can create or customize existing indicator types and fields for your use case. For more information, see Customize indicator fields and types.</p> |
| 2. Formatting and validation | Formatting and validation of the indicator are done using a formatting script that validates the data that represents the indicator's value and determines how we want the data to appear in Cortex XSIAM. For example, the URL indicator type uses the FormatURL script, which defangs URLs. For more information, see Formatting scripts. |
| 3. Create or update an indicator | If the indicator is not known to Cortex XSIAM, an indicator is created or you can create your own. If already known, it is updated with any new data including last seen dates. If the indicator is in an expired state but new data is received, it changes to active status. |
| 4. Gather reputation and enrichment information | <p>You can run reputation commands and enhancement script commands on indicator values. You need to set them to run in the indicator type. The enhancement script also runs on the indicator type. Both determine the indicator's verdict. For more information, see Enhancement scripts.</p><p>When a reputation command/enhancement script is run, the verdict gets added to the issue context, when attached to an issue. Generally, the information is found under the Dbot Score key, the specific Indicator type, and specific vendor information.</p><div data-gb-custom-block data-tag="hint" data-style="info" class="hint hint-info"><p>Note</p><p>To run enhancement scripts and reputation commands, you must configure a relevant enrichment integration, such as VirusTotal, IPinfo v2, etc.</p></div> |
| 5. Reputation scripts | Reputation scripts can be used if you want to override existing reputation commands with custom logic. For those indicator types without reputation commands, a custom reputation script can be applied. Use it to customize verdicts and DBotScore context entry. For more information, see Reputation scripts. |
| 6. Map indicator fields | After your indicator is enriched, you can map fields. Some indicator fields are automatically mapped by Cortex XSIAM to contain the relevant values. The default settings can be changed for each indicator type. You can create and associate any custom fields with indicators. For more information, see Indicator classification and mapping. |
| 7. Expiration | <p>Many indicators have expiration dates as threats are dynamic. IP addresses may change, systems may be fixed, etc. When configuring an indicator type, you can set it never to expire or after a time interval. For more information, see Expire an indicator.</p><div data-gb-custom-block data-tag="hint" data-style="info" class="hint hint-info"><p>Tip</p><p>We recommend defining your policy for handling expired indicators.</p></div> |
Indicator configuration
Customize your indicators to your specific needs. Edit existing indicator types and fields, add scripts, and configure tailored extraction and expiration settings for optimal insights.
Configure Threat Intelligence feed integrations
You can download and install content packs, including threat intelligence integrations such as:
- MITRE ATT&CK
- Unit 42 Feed
- Unit 42 Intelligence
- AlienVault
- AWS
Note
Some third-party services (such as Whois and MITRE ATT&CK) enforce strict rate limits based on the source IP address. If you encounter quota management issues, we recommend running them on an engine. This routes traffic through your private network, ensuring the external service sees a unique, dedicated IP address assigned to your organization.
How to configure threat intelligence feed integrations
- Navigate to Settings → Data Sources & Integrations and click + Add New or navigate to Settings → Configurations → Marketplace and browse for and install the relevant threat intelligence content pack.
-
Configure the threat intelligence integration by navigating to Settings → Data Sources & Integrations, search for your integration, and click Add Instance.
The following table is a non-exhaustive list of the most common feed integration parameters. Each feed integration may have parameters unique to that integration. Read the documentation for specific feed integrations for more details.
Parameter Description Fetches indicators <p>Select this option for the integration instance to fetch indicators.</p><p>Some integrations can fetch indicators or issues. Select the relevant option for what you need to fetch in the instance.</p> URL The URL of the feed. Feed Fetch Interval When the integration instance should fetch indicators from the feed. Indicator verdict The indicator verdict that will apply to all indicators fetched from this integration instance. Source reliability The reliability of the source that provides the threat intelligence data. Indicator Expiration Method <p>The method by which to expire indicators from this integration instance. The default expiration method is the interval configured for the indicator type to which this indicator belongs.</p><ul><li>Indicator Type: The expiration method defined for the indicator type to which this indicator belongs (interval or never).</li><li>Time Interval: Expires indicators from this instance after the specified time interval, in days or hours.</li><li>Never Expire: Indicators from this instance never expire.</li><li><p>When removed from the feed: When the indicators are removed from the feed, they are expired in the system.</p><div data-gb-custom-block data-tag="hint" data-style="info" class="hint hint-info"><p>Note</p><p>Some feeds only provide information about new indicators and do not specify when indicators are removed. Indicators from these feeds cannot be automatically expired on removal.</p><p>If a feed's expiration method is set to When removed from the feed, indicators that are removed from the feed immediately expire. Note that if the feed is disabled, its expiration method reverts to that of the indicator type (time-based).</p><p>Time-based expiration is set according to feed reliability. If the same indicator appears on multiple feeds, the feed with the highest reliability determines the indicator's expiration time. If multiple feeds have the same reliability, the last feed to add or modify the indicator determines its expiration time.</p><p>Example:</p><ul><li>An indicator was initially fetched by Feed A, then by Feed B.</li><li>Both feeds have the same reliability.</li><li>Feed B's indicators are set to expire When removed from the feed.</li><li>Feed B is now disabled.</li></ul><p>After Feed B is disabled, the indicator's expiration method reverts to that of the indicator type (for example, expire after 7 days). However, if Feed A then modifies the indicator (or removes and re-adds it), the expiration method changes back to Feed A's settings.</p></div></li></ul> Bypass exclusion list When selected, the exclusion list is ignored for indicators from this feed. This means that if an indicator from this feed is on the exclusion list, the indicator might still be added to the system. Trust any certificate (not secure) When selected, certificates are not checked. Use system proxy settings Runs the integration instance using the proxy server (HTTP or HTTPS) when an engine is selected. Do not use in CLI by default Excludes this integration instance when running a generic command that uses all available integrations.
Customize indicator fields and types
Cortex XSIAM provides out-of-the-box indicator types and fields. However, your use case may require indicator customization, either by editing existing indicator types and fields or by creating new ones to help investigate and respond to potential security threats specific to your organization.
Custom indicators can provide more accurate and efficient identification of potential cyber security threats. For example, you can customize indicators to monitor and detect unusual activity within your organization's internal network. This can include creating indicators to flag unauthorized access attempts or unusual data transfers, or identifying insider threats or compromised accounts.
Before customizing an indicator, review the ingested indicator and then customize it as needed. After ingesting issues and indicators, check the indicator information associated with your issue. From an issue, review the context data. If there is information in the context data that you don't see in the indicator, map it into indicator fields and display it in the layout.
You can customize the following:
| Option | Description |
|---|---|
| Indicator type | Customize an indicator type by setting the relevant fields, scripts to run, and reputation command for the indicator type. You can create a new indicator type or you can edit an out-of-the-box indicator type. For more information, see Create an indicator type. |
| Indicator fields | Custom indicator fields add specific details or attributes to indicators, helping to better classify and understand the nature of potential security threats. You can edit an existing indicator field or create a new one. After creating a new indicator field, map the field to the relevant context data. You can add the field to an indicator type and view it in an indicator layout. For more information, see Create an indicator field and Map custom indicator fields. |
Create an indicator type
Indicators are categorized by indicator type, which determines the indicator layout and fields that are displayed and which scripts are run on indicators of that type. Cortex XSIAM includes several out-of-the-box indicator types, such as:
- IP Address
- Domain
- URL
-
File
For information about file indicators and file hash configuration, review the indicator type settings.
When you create a new indicator type, you define its properties, including whether and how to format the indicator data and how the verdict is calculated.
- Go to Settings → Configurations → Object Setup → Indicators → Types.
- Click New.
-
In the Settings tab, add the required indicator profile, such as name and Regex.
For more information, see Indicator type profile.
-
In the Custom Fields tab, map the fields, as required.
For more information, see Map custom indicator fields.
Example 191. Create a company email indicator type
The following example describes how to create a new indicator type to manage employee emails, for example for resource management or inside threat investigation.
Create a new indicator type for the employee email addresses which contain the “our_company.com” company domain.
- Under Settings → Configurations → Object Setup → Indicators → Types → New, in the Settings tab, define the following.
- Name: Company email
- Regex:
.*?@our_company.com(simplified to capture all the email addresses using the our_company.com domain). - Reputation command: Not relevant for this example, since we don't want any external enrichment.
- Formatting script: If more formatting is needed, you can use a formatting script to edit the saved value.
- Reputation script: If needed, you can create a reputation script to affect the DBot score given to the new custom indicator.
-
In the Custom Fields tab, map custom fields for the new indicator type.
You can map fields returned using an integration such as Active Directory to obtain more data about the actual user to whom the email belongs. You can also collect data using integrations such as Okta (MFA, SSO), SIEM, and email security. Fields such as Username, Full name, and various groups the user is part of as well as other identifiers are returned to context and mapped into the indicator using the custom fields.
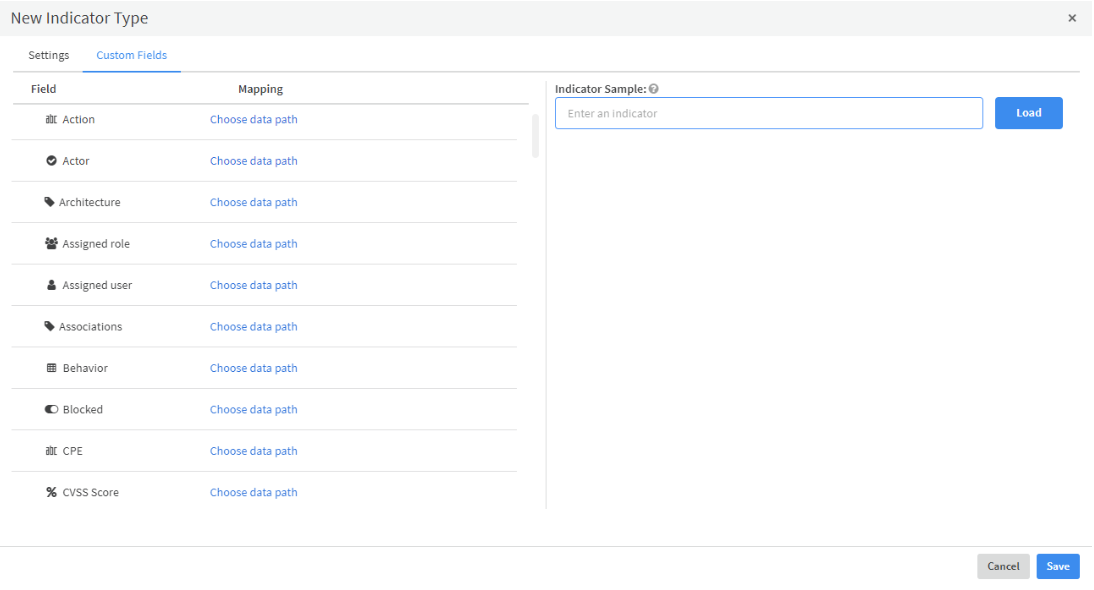
Note
If you miss mapping any field, you can create additional new indicator fields and either relate them to all indicator types, or relate them only to the new indicator type (recommended).
Indicator type profile
Each indicator type has its own profile that enables Cortex XSIAM to recognize it across the platform. During the indicator extraction flow, the order of execution is regex, formatting script, reputation command, and reputation script. You can update the following fields when updating an indicator type.
| Field | Description |
|---|---|
| Name | A meaningful name for the indicator type. |
| Reputation script | <p>The output of the reputation script is a verdict score, which is used as the basis for the indicator verdict. Reputation scripts must be tagged reputation to appear in the list for the indicator type. For more information, see Reputation scripts</p><p>The results of reputation scripts do not print to the War Room in the extraction flow.</p> |
| Formatting script | <p>Modifies how the indicator displays in Cortex XSIAM.</p><p>Formatting scripts must be tagged indicator-format to appear in the list for the indicator type. For more information, see Formatting scripts.</p> |
| Enhancement script | <p>The enhancement script is not part of the indicator extraction flow and is run manually on the indicator type. Examples of enhancement scripts include an enrichment script and a script that runs a search in an SIEM for the indicator.</p><p>After indicators are identified, you can go to the Indicator Quick View page, click the Actions button, and run an enhancement script directly on an indicator. For these scripts to be available in the menu, they need the enhancement tag. For more information, see Enhancement scripts.</p><p>When you run an enhancement script, it is the equivalent of running the script in the CLI. The script can write to context, return an entry, etc.</p> |
| Reputation command | <p>Calculates the reputation of indicators of this type. The verdict (reputation) is only associated with the specific indicator value on which it’s run (not the indicator type). The command returns the reputation of the indicator value as an entry with entry context and in some cases also returns context values that can be mapped to the indicator type custom fields.</p><p>The results of the reputation command do not print to the War Room in the indicator extraction flow. For more information, see Reputation commands.</p> |
| Regex | The regular expression (regex) to identify indicators for this indicator type. |
| Layout | Select the indicator layout to use. |
| Exclude these integrations for the reputation command | <p>Integrations to exclude when calculating the verdict, evaluating, and enriching indicators of this indicator type. Excluding an integration here prevents it from triggering during automated enrichment processes such as indicator extraction, the enrichIndicators command, or the Enrich button. This setting does not prevent the integration from running if you explicitly execute its command (for example, !url or !ip).</p><div data-gb-custom-block data-tag="hint" data-style="info" class="hint hint-info"><p>Tip</p><p>To control which integrations run when explicitly executing a command (and not during enrichment), add the using-brand argument to specify only the integrations you want to use.</p><p>For example:</p><p>!url url="https://www.google.com" using-brand="AutoFocus V2,VirusTotal"</p></div> |
| Indicator Expiration Method | <p>The method by which to expire indicators of this type. The expiration method that you select is the default expiration method for indicators of this indicator type.</p><p>The expiration can also be assigned when configuring a feed integration instance, which overrides the default method.</p><ul><li>Never Expire: indicators of this type never expire.</li><li>Time Interval: indicators of this type expire after the specified number of days or hours.</li></ul> |
| Context path for verdict value (Advanced) | When an indicator is extracted, the entry data from the command is mapped to the issue context. This path defines where in context the data is mapped. |
| Context value of verdict (Advanced) | The value of this field defines the actual data that is mapped to the context path. |
| Cache expiration in minutes (Advanced) | <p>The amount of time (in minutes) after which the cache for indicators of this type expire. The default is 4,320 minutes (three days). The cache enables you to limit API requests by only updating indicators after a specific time period has passed. The cache cannot be cleared manually.</p><div data-gb-custom-block data-tag="hint" data-style="info" class="hint hint-info"><p>Note</p><p>Indicator cache expiration rules only apply to standard enrichment (for example, running the enrichIndicators command). If you run a reputation command, such as !ip, the commands executes even if the cache has not expired.</p></div> |
Formatting scripts
A formatting script has the following main functions:
- Validate inputs, for example, to check that the top-level domain (TLD) is valid.
- Modify how the indicator appears in Cortex XSIAM such as the War Room.
After indicator values are extracted according to the defined regex, the formatting script can be used to modify how the indicator value appears in the War Room and reports. For example, the IP indicator type uses the UnEscapeIPs formatting script, which removes any defanged characters from an IP address, so 127[.]0[.]0[.]1 is formatted to 127.0.0.1. When you click the IP address in the War Room, you see the formatted IP address. This extracted indicator value is then added to the Threat Intel database.
Out-of-the-box Formatting Scripts
You can create a new script, or you can use an out-of-the-box formatting script on the Scripts page, for example:
UnEscapeIPs:Removes escaping characters from IP addresses. For example, 127[.]0[.]0[.]1 transforms to 127.0.0.1.ExtractDomainAndFQDNFromUrlAndEmail:Extracts domains and FQDNs from URLs and emails, used by the Domain indicator. It removes prefixes such as proofpoint or safelinks, removes escaped URLs, and extracts the FQDN.ExtractEmailV2:Verifies that an email address is valid and only returns the address if it is valid.
Formatting Script example
In the following example, the RemoveEmpty script removes empty items, entries, or nodes from an array.
// pack version: 1.2.30
const EMPTY_TOKENS = argToList(args.empty_values);
function toBoolean(value) {
if (typeof(value) === 'string') {
if (['yes', 'true'].indexOf(value.toLowerCase()) != -1) {
return true;
} else if (['no', 'false'].indexOf(value.toLowerCase()) != -1) {
return false;
}
throw 'Argument does not contain a valid boolean-like value';
}
return value ? true : false;
}
function isObject(o) {
return o instanceof Object && !(o instanceof Array);
}
function isEmpty(v) {
return (v === undefined) ||
(v === null) ||
(typeof(v) == 'string' && (!v || EMPTY_TOKENS.indexOf(v) !== -1)) ||
(Array.isArray(v) && v.filter(x => !isEmpty(x)).length === 0) ||
(isObject(v) && Object.keys(v).length === 0);
}
function removeEmptyProperties(obj) {
Object.keys(obj).forEach(k => {
var ov = obj[k];
if (isObject(ov)) {
removeEmptyProperties(ov);
} else if (Array.isArray(ov)) {
ov.forEach(av => isObject(av) && removeEmptyProperties(av));
obj[k] = ov.filter(x => !isEmpty(x));
}
if (isEmpty(ov)) {
delete obj[k];
}
});
}
var vals = Array.isArray(args.value) ? args.value : [args.value];
if (toBoolean(args.remove_keys)) {
vals.forEach(v => isObject(v) && removeEmptyProperties(v));
}
return vals.filter(x => !isEmpty(x));
Formatting Script input
The formatting script requires a single input argument named input that accepts a single indicator value or an array of indicator values. The input argument should be an array to accept multiple inputs and return an entry-result per input.
| Argument | Description |
|---|---|
input |
<p>Accepts a string or array of strings representing the indicator value(s) to be formatted. Will be accessed within the script using demisto.args().get(‘input’, []).</p><p>In the script settings, the Is Array checkbox must be selected (see screenshot below).The script code must be able to handle a single indicator value (as string), multiple indicator values in CSV format (as string) and an array of single indicator values (array).</p> |
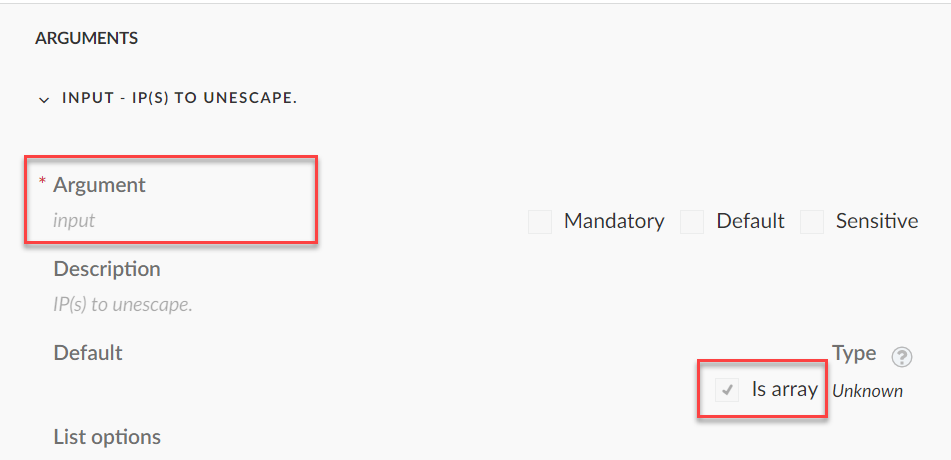
Formatting Script outputs
The indicators appear in a human-readable format in Cortex XSIAM. The output should be an array of formatted indicators or an array of entry results (an entry result per indicator to be created). The entry result per input can be a JSON array to create multiple indicators. If the entry result is an empty string, it is ignored and no indicator is created.
Use the return_results function to generate the script output. For more information, see https://xsoar.pan.dev/docs/integrations/code-conventions#return_results.
Single-value result:
results = CommandResults(
outputs_prefix='VirusTotal.IP',
outputs_key_field='Address',
outputs={
'Address': '8.8.8.8',
'ASN': 12345
}
)
return_results(results)
Multiple-value results:
results = [
CommandResults(
outputs_prefix='VirusTotal.IP',
outputs_key_field='Address',
outputs={
'Address': '8.8.8.8',
'ASN': 12345
}
),
CommandResults(
outputs_prefix='VirusTotal.IP',
outputs_key_field='Address',
outputs={
'Address': '1.1.1.1',
'ASN': 67890
}
)]
return_results(results)
Add a Formatting Script to an indicator type
- Go toSettings → Configurations → Object Setup → Indicators → Types.
- Select the indicator type and click Edit.
-
Select the desired formatting script.
Note
Formatting scripts must have the
indicator-formattag to appear in the list.
Note
Formatting scripts for out-of-the-box indicator types are system-level, which means that the formatting scripts for these indicator types are not configurable. To create a formatting script for an out-of-the-box indicator type, you need to disable the existing indicator type and create a new (custom) indicator type. If you configured a formatting script before this change and updated your content, this configuration reverts to content settings (empty).
Run a Formatting script in the CLI
You can run out-of-the-box or custom formatting scripts in the CLI to check the extracted indicator data is properly formatted.
The following are examples of the syntax for running the out-of-the-box UnEscapeIPs formatting script in the CLI.
!UnEscapeIPs !UnEscapeIPs input=127.0.0[.]1!UnEscapeIPs input=127.0.0[.]1,8.8.8[.]8!UnEscapeIPs input=${contextdata.indicators}(where the keycontextdata.indicatorsin the context object is an array)
Enhancement scripts
Enhancement scripts enable you to gather additional data about the highlighted entry in the War Room. They can enrich indicators, search a SIEM for a specific indicator, write indicator details to context, and return entries to the War Room.
Enhancement scripts are run manually from the Indicator Quick View window or the CLI after indicators are extracted to allow you to collect additional information about an indicator. If you have an issue that contains an IP indicator and you want to run one or more enhancement scripts, go to Indicator Quick View → Actions and under Run Scripts, select the desired script.
Note
Enhancement scripts are different from reputation commands. A reputation command runs every integration that has that command within it, to enrich the indicator. The reputation command ip , for example, runs every IP integration command in your enabled integrations, to collect data from multiple sources. An enhancement script is manually run after the initial extraction and enrichment for the indicator type is complete.
Enhancement script input
The enhancement script requires the indicator value as the input argument.
| Argument | Description |
|---|---|
| The value of the indicator | For example ip, email, url.The argument name should match the indicator type in lower case. For example, the IPReputation script requires the ip input. For an EmailReputation script the input is email. |
In the following example, the DomainReputation script uses domain as the input.
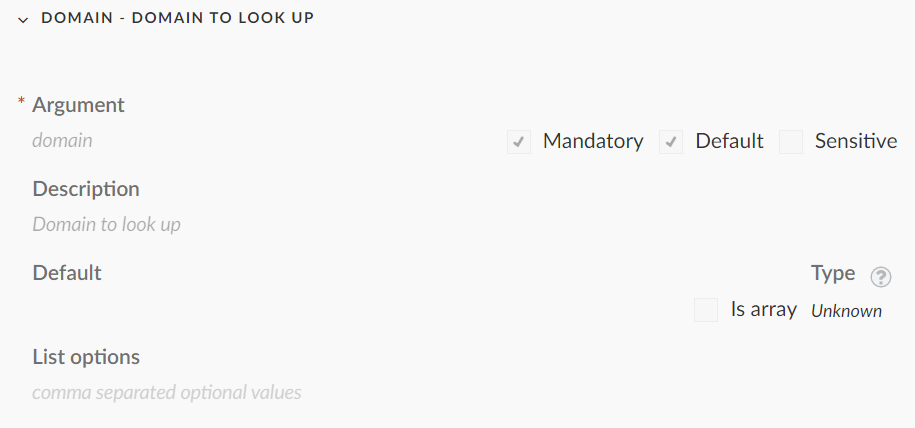
Enhancement script outputs
The enhancement script output depends on its input because the script is run manually. If you want the output to be added to indicator enrichment or the Threat Intelligence screen, it should follow the DBotScore convention in the content output as described in https://xsoar.pan.dev/docs/integrations/dbot.
output =
{
'Type': entryTypes['note'],
'ContentsFormat': formats['json'],
'Contents': ‘this is the enrichment data’,
'EntryContext': {
'Email': ‘xsoar@test.com’,
‘DBotScore’: {}},
}
return_results(output)
Add an enhancement script to an indicator type
- Go to Settings → Configurations → Object Setup → Indicators → Types
- Select the indicator type and click Edit.
-
Select one or more desired enhancement scripts.
Note
Enhancement scripts must have the
enhancementtag applied to appear in the list.
Run an enhancement script in the CLI
You can run out-of-the-box or custom enhancement scripts in the CLI to enrich specific indicator values.
The following are examples of the syntax for running the out-of-the-box IPReputation and URLReputation enhancement scripts in the CLI.
!IPReputation ip=8.8.8.8!URLReputation url=cardcom.com
Reputation scripts
Reputation scripts are used to assess and assign reputation scores to indicators. These scripts integrate external threat intelligence or internal data sources to evaluate the reputation of indicators (such as IP addresses, URLs, or file hashes). Reputation scripts enable you to implement custom logic and algorithms for determining the reputation of indicators.
Reputation scripts return the verdict of an indicator as a number. The number overrides the verdict returned from the reputation command and any default settings for the indicator that relates to the verdict, but does not override a manually set verdict.
The system automatically executes the reputation script in the following cases:
- During enrichment: When enrichment is triggered (via indicator extraction, the
enrichIndicatorscommand, or the Enrich button), the system runs the reputation command and then the reputation script for the specific indicator type. - If a verdict changes not via the enrichment process: When explicitly running a reputation command such as
!file, if the result changes the indicator's verdict the reputation script runs to finalize the decision. This happens even if you use theusingargument to target a specific integration.
The reliability of the score from a reputation script is by default A++ - Reputation script.
Out-of-the-box reputation scripts
You can create a new reputation script, or you can use an out-of-the-box reputation script in the Scripts page, for example:
CertificateReputationcveReputationMaliciousRatioReputationSSDeepReputation
Reputation Script input
The reputation requires a single input argument named input that accepts an indicator value.
| Argument | Description |
|---|---|
input |
The indicator value. |
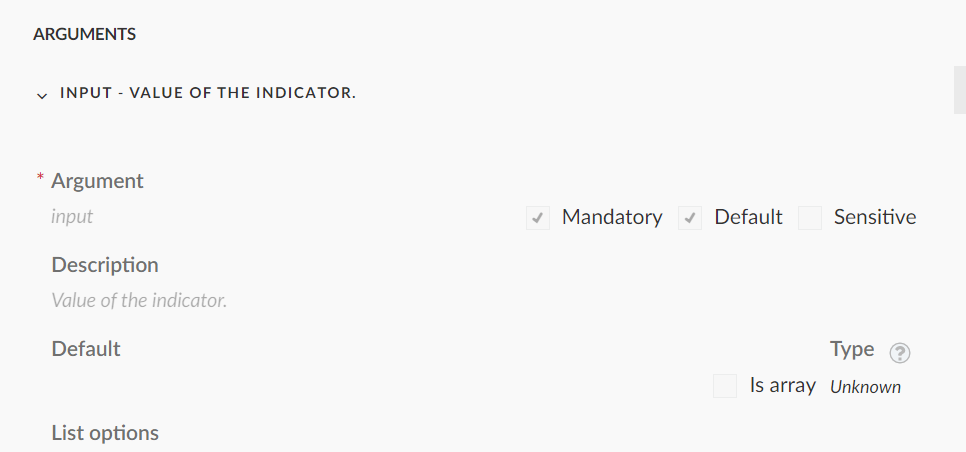
Reputation Script outputs
Either a number or a dbotScore. It can either be a raw number which is the score, or a full entry with DBotScore.
from CommonServerPython import * def main(): url_list = argToList(demisto.args().get('input')) entry_list = [] for url in url_list: entry_list.append({ 'Type': entryTypes['note'], 'ContentsFormat': formats['json'], 'Contents': 2, 'EntryContext': { 'DBotScore': { 'Indicator': url, 'Type': 'Onion URL', 'Score': 2, # suspicious 'Vendor': 'DBot' } } }) demisto.results(entry_list) if __name__ in ('__main__', 'builtin', 'builtins'): main()
Values for Common.DbotScore
| Constant | Value |
|---|---|
| Common.DbotScore.NONE | NONE = 0 |
| Common.DbotScore.GOOD | GOOD = 1 |
| Common.DbotScore.SUSPICIOUS | SUSPICIOUS = 2 |
| Common.DbotScore.BAD | BAD = 3 |
Add a Reputation Script to an indicator type
- Go to Settings → Configurations → Object Setup → Indicators → Types.
- Select the indicator type and click Edit.
-
Select the relevant reputation script.
Note
Reputation scripts must have the reputation tag applied to appear in the list.
Run a Reputation Script in the CLI
You can run out-of-the-box or custom reputation scripts in the CLI to set the verdict for a specific indicator.
The following are examples for running the out-of-the-box CertificateReputation and MalicioiusRationReputation reputation scripts in the CLI.
!CertificateReputation input=<value of the indicator>!MalicioiusRationReputation input=<value of the indicator>
Reputation commands
Reputation commands are built-in or custom commands that use integrations to provide predefined functionalities for obtaining an indicator verdict for specific indicator types. These commands simplify the process of fetching reputation data from external services or threat intelligence feeds without requiring extensive scripting. Reputation commands come with preconfigured parameters and settings for commonly used threat intelligence sources.
You can set an indicator type to run reputation commands. The command returns the verdict of the indicator as an entry with entry context and may also return context values that can be mapped to the custom fields of the indicator.
Note
Running a reputation command directly (such as !ip) might not apply the result to an indicator, nor does it use the enrichment cache. To ensure an indicator is enriched, and to take advantage of caching, use the enrichIndicators command or the Enrich button in the UI. This runs the appropriate reputation command/script based on the indicator type settings. Note that extracted indicators are enriched in the same way.
Out-of-the-box reputation commands
You can create a new reputation command, or you can use an out-of-the-box reputation command, for example:
ipfileurlemaildomain
For more details on using out-of-the-box reputation commands or developing new reputation commands, see Generic Reputation Commands.
Reputation command input
The reputation command uses the indicator value as the input argument.
| Arguments | Description |
|---|---|
| The value of the indicator | <p>For example ip, email, url. Inputs are based on different integrations. Basic inputs are common to all reputation commands. For example, the !ip command has the following basic inputs:</p><p>- name: ip arguments: - name: ip default: true description: List of IPs. isArray: true</p> |
In this example, the ip script uses ip as the input, with is array unchecked.
Reputation command output
Outputs return a dbotScore.
Run a Reputation command in the CLI
The following are examples of the syntax for running the ip , domain, and file reputation commands in the CLI.
!ip ip=<indicator IP>!domain domain=<indicator domain>!file file=<indicator file hash>!file file=<indicator file hash> using=<a specific integration instance>
Map custom indicator fields
Indicator mapping enables you to automatically update the value of an indicator field without having to manually change it. For example, the IP indicator automatically maps the Country field. If it was not mapped, each time the IP address changes country the analyst would have to update the country every time that indicator type is ingested.
The value of an indicator field is determined by the value of the key in context data the field is mapped to in Cortex XSIAM.
When you start ingesting indicators, the incoming fields are automatically mapped to the relevant indicator fields. Sometimes you may want to change the default settings or map custom indicator fields to specific context data. Before you map custom indicator fields, you need to create the indicator field and add it to the relevant indicator type layout.
Note
Some integrations have indicator mappers and classifiers, such as AWS. If you want to use an integration mapper or classifier, see Indicator classification and mapping.
To map custom fields to the indicator type, you need to enrich the indicator either by using the !enrichindicators command in the CLI, in a playbook, or by opening an indicator and click Enrich indicator. Enrichment returns an entry, with the EntryContext property as the source of the mapping process. When editing an indicator type, in the Custom Fields tab, type the name of the indicator exactly how it appears (in the XSIAM Indicators page) and click Load.
For the enrichment data to be considered valid, EntryContext must include a DBotScore with the fields: Indicator, Score, Vendor , and Type. If DBotScore has those fields, all the data of EntryContext is used as the source for the mapping, and not only the data under EntryContext.DBotScore.
How to map indicator fields
- Go to Settings → Configurations → Object Setup → Indicators → Types.
- Select the indicator type and click Edit.
-
Click the Custom Fields tab.
The custom fields associated with this indicator type are listed in the table. If you do not see a custom field in the list, verify that you associated the custom field with this indicator type.
- (Optional) In the Indicator Sample panel, enter an indicator relevant to the indicator type to load sample data.
- Click Choose data path to map the custom field to a data path.
- (Optional) Click the curly brackets to map the field to a context path.
- (Optional) From the Indicator Sample panel, select a context key to map to the field.
- Save the indicator type.
Create an indicator field
Create an indicator field
Indicator fields are used to add specific indicator information to issues. When you create an indicator field, you can associate the field to a specific indicator type or all indicator types.
Note
Cortex XSIAM IOC fields are based on the STIX 2.1 specifications. For more information, see Indicator field structure.
Field types
| Field type | Description |
|---|---|
| Boolean | Checkbox |
| Date picker | Adds the date to the field. |
| Grid (table) | <p>Include an interactive, editable grid as a field type for selected indicator types or all indicator types.</p><p>When you select Grid (table) you can format the table and determine if the user can add rows.</p> |
| HTML | <p>Create and view HTML content, which can be used in any type of indicator.</p><div data-gb-custom-block data-tag="hint" data-style="info" class="hint hint-info"><p>Note</p><p>The following HTML tags are not permitted: blockquote, del, dd, div, dl, dt, fieldset, form, h1, h2, h3, h4, h5, h6, hr, iframe, ins, li, math, noscript, ol, pre, p, script, style, table, ul, address, article, aside, canvas, details, dialog, figcaption, figure, footer, header, hgroup, main, nav, output, progress, section, video.</p><p>The following CSS tags are not permitted: background-color, text-align, font-size, font-family, font-weight, color, line-height, border-style, border, page-break-inside, tablelayout, padding, background-size, display, padding-top, padding-right, padding-bottom, padding-left, text-size-adjust, break-inside, word-break, width, height, -ms-text-size-adjust, -webkit-text-size-adjust.</p></div> |
| Long text | <ul><li>Long text is analyzed and tokenized, and entries are indexed as individual words, enabling you to perform advanced searches and use wildcards.</li><li>Long text fields can't be sorted and used in graphical dashboard widgets.</li><li>While editing a long text field, pressing Enter will create a new line (case is insensitive).</li></ul><p>Add a placeholder, if required.</p> |
| Markdown | Add markdown-formatted text as a template, which will be displayed to users in the field after the indicator is created. Markdown lets you add basic formatting to text to provide a better end-user experience. |
| Multi select/Array | <p>Select the following options:</p><ul><li>Multi-select from a prefilled (static) list</li><li>An empty array field for the user to add one or more values as a comma-separated list</li></ul><p>Add a placeholder, if required.</p> |
| Number | Can contain any number. Default is 0. |
| Role | The role assigned to the indicator. Determines which users (by role) can view the indicator. |
| Short text | <ul><li>Short text is treated as a single unit of text and is not indexed by word. Advanced search, including wildcards, is not supported.</li><li>Short text fields are case-sensitive by default, but can be changed to case-insensitive when creating the field.</li><li>While editing a short text field, pressing Enter will save the change.</li><li>Maximum length 60,000 characters</li></ul><p>Recommended use is one-word entries, such as username and email address.</p><p>Select a placeholder, if required.</p> |
| Single select | Select a value from a list of options. Add comma-separated values. |
| Tags | <p>Accepts a single tag or a comma-separated list, not case-sensitive.</p><p>Add a placeholder, if required.</p> |
| URL | Add a URL when completing the field. |
| User | A user in Cortex XSIAM. |
How to create a field
- Select Settings → Configurations → Object Setup → Indicators → Fields → New Field.
- Select the relevant field type.
-
Complete the following fields (if relevant):
Parameter Description Mandatory If selected, this field is mandatory when used in a form. Field Name A meaningful display name for the field. After you type a name, you will see below the field that the Machine name is automatically populated. The field’s machine name is applicable for searching and the CLI. Tooltip An optional tooltip for the field. - In the Basic Settings tab, define the values (according to the selected field type).
-
In the Attributes tab define the following:
Field Description Script to run when field value changes The script dynamically changes the field value when script conditions are met. For a script to be available, it must have the field-change-triggered-indicatortag when defining the script. For more information, see Indicator field trigger scripts.Add to all indicator types <p>This option is selected by default, which means this field is available to use in all indicator types.</p><p>Clear the checkbox to associate this field with a subset of indicator types.</p> - Save the field.
- (Optional) In the indicator type, map custom indicator fields, so an indicator field is automatically updated, without the analyst having to manually change it.
Indicator field structure
Cortex XSIAM IOC fields are based on the STIX 2.1 specifications. These fields provide a guideline for the fields we recommend you maintain within an IOC. None of the fields are mandatory, except the value field. Maintaining this field structure enables you to share and export IOCs to additional threat intel based systems as well as to other cybersecurity devices.
Like STIX, Cortex XSIAM indicators are divided into two categories, STIX Domain Objects (SDOs) and STIX Cyber-observable Objects (SCOs). The category determines which fields are presented in the layout of that specific IOC. In Cortex XSIAM, all SCOs can be used in a relationship with either SDOs or SCOs.
Each IOC table of fields is separated into three parts:
- System fields - Fields created and managed by Cortex XSIAM.
- Custom core fields - Custom fields shared by all IOCs of the same time (SDO or SCO). Fields may be empty.
- Custom unique fields - Fields unique to a specific type of IOC. If a user associates more fields with the IOC, the additional fields are also treated as unique.
STIX Cyber-observable Objects (SCO)
Account
Similar to STIX User Account Object, this indicator type represents a user account in various platforms such as operating system, social media accounts, and Active Directory. The value for the object is usually the username for logging in.
| System Fields | Description |
|---|---|
| Value | Defines the indicator on Cortex XSIAM. The value is the main key for the object in the system. |
| Verdict | Malicious, Suspicious, Benign, or Unknown. |
| Expiration | The expiration date of the object. |
| Source Time Stamp | When the object was created in the system. |
| Modified | When the object was last modified. |
| Custom Fields - Core | Description |
|---|---|
| Blocked | A Boolean switch to mark the object as blocked in the user environment. |
| Community Notes | Comments and free-form notes regarding the indicator. |
| Description | The description of the object. |
| STIX ID | The STIX ID for the object in the format of account--<UUID>. |
| Tags | Tags attached to the object. |
| Traffic Light Protocol | Red, Amber, Green, or White. |
| Custom Fields - Unique | Description |
|---|---|
| Account Type | Specifies the type of the account, comes from account-type-ov by STIX. |
| Creation Date | The date the account was created (not the date the indicator was created). |
| Display Name | The display name of the account as it is shown in the UI. |
| Groups | The groups the account is a member of. |
| User ID | The account's unique ID according to the system it was taken from. |
Domain / DomainGlob
Network domain name, similar to the STIX Domain Name object. The value is the domain address.
| System Fields | Description |
|---|---|
| Value | Defines the indicator on Cortex XSIAM. The value is the main key for the object in the system. |
| Verdict | Malicious, Suspicious, Benign, or Unknown. |
| Expiration | The expiration date of the object. |
| Source Time Stamp | When the object was created in the system. |
| Modified | When the object was last modified. |
| Custom Fields - Core | Description |
|---|---|
| Blocked | A Boolean switch to mark the object as blocked in the user environment. |
| Community Notes | Comments and free form notes regarding the indicator. |
| Description | The description of the object. |
| STIX ID | The STIX ID for the object in the format of domain--<UUID>. |
| Tags | Tags attached to the object. |
| Traffic Light Protocol | Red, Amber, Green, or White. |
| Custom Fields - Unique | Description |
|---|---|
| Creation Date | The date the domain was created. |
| DNS Records | All types of DNS records with a timestamp and their values (GRID). |
| Expiration Date | The domain expiration date. |
| Certificates | Any certificates issued for the domain. |
| WHOIS Records | Any records from WHOIS about the domain (GRID). |
A single user email address.
| System Fields | Description |
|---|---|
| Value | Defines the indicator on Cortex XSIAM. The value is the main key for the object in the system. |
| Verdict | Malicious, Suspicious, Benign, or Unknown. |
| Expiration | The expiration date of the object. |
| Source Time Stamp | When the object was created in the system. |
| Modified | When the object was last modified. |
| Custom Fields - Core | Description |
|---|---|
| Blocked | A Boolean switch to mark the object as blocked in the user environment. |
| Community Notes | Comments and free form notes regarding the indicator. |
| Description | The description of the object. |
| STIX ID | The STIX ID for the object in the format of email--<UUID>. |
| Tags | Tags attached to the object. |
| Traffic Light Protocol | Red, Amber, Green, or White. |
| Custom Fields - Unique |
|---|
| None |
File
Represents a single file. For backward compatibility, the indicator has multiple fields for different types of hashes. New hashes, however, should be stored under the Hashes grid field. The file value should be its hash (either MD5, SHA-1, SHA-256, or SHA-512, in that order).
| System Fields | Description |
|---|---|
| Value | Defines the indicator on Cortex XSIAM. The value is the main key for the object in the system. |
| Verdict | Malicious, Suspicious, Benign, or Unknown. |
| Expiration | The expiration date of the object. |
| Source Time Stamp | When the object was created in the system. |
| Modified | When the object was last modified. |
| Custom Fields - Core | Description |
|---|---|
| Blocked | A Boolean switch to mark the object as blocked in the user environment. |
| Community Notes | Comments and free form notes regarding the indicator. |
| Description | The description of the object. |
| STIX ID | The STIX ID for the object in the format of file--<UUID>. |
| Tags | Tags attached to the object. |
| Traffic Light Protocol | Red, Amber, Green, or White. |
| Custom Fields - Unique | Description |
|---|---|
| Creation Date | The file creation date. |
| File Extension | The file extension. |
| Associated File Names | Names the file is associated with. |
| File Type | The type of the file. |
| Hashes | Any hashes not specified in a separate field. |
| imphash | The imphash. |
| MD5 | The MD5 hash. |
| Modified Date | When the file was modified on the origin. |
| Path | The path to the file. |
| Quarantined | Was the file quarantined? |
| SHA1 | The SHA1 hash. |
| SHA256 | The SHA256 hash. |
| SHA512 | The SHA512 hash. |
| Size | The file size. |
| SSDeep | The SSDeep hash. |
IPv4 / IPv6 / CIDR / IPv6CIDR
Represents an IP address and its subnet (CIDR). If no subnet is provided, the address is treated as a single IP (same as a /32 subnet).
| System Fields | Description |
|---|---|
| Value | Defines the indicator on Cortex XSIAM. The value is the main key for the object in the system. |
| Verdict | Malicious, Suspicious, Benign, or Unknown. |
| Expiration | The expiration date of the object. |
| Source Time Stamp | When the object was created in the system. |
| Modified | When the object was last modified. |
| Custom Fields - Core | Description |
|---|---|
| Blocked | A Boolean switch to mark the object as blocked in the user environment. |
| Community Notes | Comments and free form notes regarding the indicator. |
| Description | The description of the object. |
| STIX ID | The STIX ID for the object in the format of type--<UUID>. |
| Tags | Tags attached to the object. |
| Traffic Light Protocol | Red, Amber, Green, or White. |
| Custom Fields - Unique | Description |
|---|---|
| Geo Country | The country where the object is located. |
| Geo Location | A set of geographic coordinates for the object. |
| WHOIS records | Any records from WHOIS about the domain (GRID). |
URL
Represents the properties of a uniform resource locator.
| System Fields | Description |
|---|---|
| Value | Defines the indicator on Cortex XSIAM. The value is the main key for the object in the system. |
| Verdict | Malicious, Suspicious, Benign, or Unknown. |
| Expiration | The expiration date of the object. |
| Source Time Stamp | When the object was created in the system. |
| Modified | When the object was last modified. |
| Custom Fields - Core | Description |
|---|---|
| Blocked | A Boolean switch to mark the object as blocked in the user environment. |
| Community Notes | Comments and free form notes regarding the indicator. |
| Description | The description of the object. |
| STIX ID | The STIX ID for the object in the format of url--<UUID>. |
| Tags | Tags attached to the object. |
| Traffic Light Protocol | Red, Amber, Green, or White. |
| Custom Fields - Unique | Description |
|---|---|
| Certificates | Any certificates issued for the domain. |
STIX Domain Objects (SDO)
Attack Pattern
Attack patterns are a type of TTP (Tactics, Techniques and Procedures) that describe ways adversaries attempt to compromise targets. Attack patterns help categorize attacks, generalize specific attacks to the patterns that they follow, and provide detailed information about how attacks are performed. An example of an attack pattern is spear phishing, where an attacker sends a carefully crafted email message with the intent of getting the target to click a link or open an attachment that delivers malware. Attack patterns can also be more specific, such as spear phishing by a particular threat actor (for example, an email saying the target won a contest).
| System Fields | Description |
|---|---|
| Value | Defines the indicator on Cortex XSIAM. The value is the main key for the object in the system. |
| Verdict | Malicious, Suspicious, Benign, or Unknown. |
| Expiration | The expiration date of the object. |
| Source Time Stamp | When the object was created in the system. |
| Modified | When the object was last modified. |
| Custom Fields - Core | Description |
|---|---|
| Community Notes | Comments and free form notes regarding the indicator. |
| Description | The description of the object. |
| STIX ID | The STIX ID for the object in the format of attack-pattern--<UUID>. |
| Tags | Tags attached to the object. |
| Traffic Light Protocol | Red, Amber, Green, or White. |
| Custom Fields - Unique | Description |
|---|---|
| Kill Chain Phases | The list of kill chain phases this Attack Pattern is used for. |
| External References | List of external references consisting of a source and ID. For example, {source: mitere, id: T1189} |
Campaign
A campaign is a grouping of adversarial behaviors that describes a set of malicious activities or attacks (sometimes called waves) that occur over a period of time against a specific set of targets. Campaigns usually have well defined objectives and may be part of an intrusion set.
Campaigns are often attributed to an intrusion set and threat actors. The threat actors may reuse known infrastructure from the intrusion set or may set up new infrastructure specifically for conducting that campaign.
Campaigns can be characterized by their objectives and the issues they cause, people or resources they target, and the resources (such as infrastructure, intelligence, and malware, tools) they use.
For example, a campaign can describe a crime syndicate's attack using a specific variant of malware and new C2 servers against the executives of ACME Bank during the summer of 2020 to gain secret information about an upcoming merger with another bank.
| System Fields | Description |
|---|---|
| Value | Defines the indicator on Cortex XSIAM. The value is the main key for the object in the system. |
| Verdict | Malicious, Suspicious, Benign, or Unknown. |
| Expiration | The expiration date of the object. |
| Source Time Stamp | When the object was created in the system. |
| Modified | When the object was last modified. |
| Custom Fields - Core | Description |
|---|---|
| Community Notes | Comments and free form notes regarding the indicator. |
| Description | The description of the object. |
| STIX ID | The STIX ID for the object in the format of campaign--<UUID>. |
| Tags | Tags attached to the object. |
| Traffic Light Protocol | Red, Amber, Green, or White. |
| Custom Fields - Unique | Description |
|---|---|
| Aliases | Alternative names used to identify this campaign. |
| Objective | The campaign’s primary goal, objective, desired outcome, or intended effect. |
Course of action
A course of action is an action taken either to prevent an attack or to respond to an attack that is in progress. It may describe technical, automatable responses (applying patches, reconfiguring firewalls), but can also describe higher level actions such as employee training or policy changes. For example, a course of action to mitigate a vulnerability could describe applying the patch that fixes it.
| System Fields | Description |
|---|---|
| Value | Defines the indicator on Cortex XSIAM. The value is the main key for the object in the system. |
| Verdict | Malicious, Suspicious, Benign, or Unknown. |
| Expiration | The expiration date of the object. |
| Source Time Stamp | When the object was created in the system. |
| Modified | When the object was last modified. |
| Custom Fields - Core | Description |
|---|---|
| Community Notes | Comments and free form notes regarding the indicator. |
| Description | The description of the object. |
| STIX ID | The STIX ID for the object in the format of course-of-action--<UUID>. |
| Tags | Tags attached to the object. |
| Traffic Light Protocol | Red, Amber, Green, or White. |
| Custom Fields - Unique | Description |
|---|---|
| Action | Reserved to capture structured/automated courses of action. |
CVE
To preserve backward compatibility, our vulnerability indicator is referred to as CVE, but it is equivalent to the Vulnerability object defined by STIX. Unlike STIX, in TIM the object is identified by its CVE number. A vulnerability is a weakness or defect in the requirements, designs, or implementations of the computational logic (code) found in software and some hardware components (firmware) that can be directly exploited to negatively impact the confidentiality, integrity, or availability of that system.
| System Fields | Description |
|---|---|
| Value | Defines the indicator on Cortex XSIAM. The value is the main key for the object in the system. |
| Verdict | Malicious, Suspicious, Benign, or Unknown. |
| Expiration | The expiration date of the object. |
| Source Time Stamp | When the object was created in the system. |
| Modified | When the object was last modified. |
| Custom Fields - Core | Description |
|---|---|
| Community Notes | Comments and free form notes regarding the indicator. |
| Description | The description of the object. |
| STIX ID | The STIX ID for the object in the format of vulnerability--<UUID>. |
| Tags | Tags attached to the object. |
| Traffic Light Protocol | Red, Amber, Green, or White. |
| Custom Fields - Unique | Description |
|---|---|
| CVSS Version | The version of the CVSS scoring system. |
| CVSS Score | The score given to the CVE. |
| CVSS Vector | The full CVSS vector. |
| CVSS Table | All CVSS data by Metric - Value pairs. |
Infrastructure
The Infrastructure SDO represents a type of TTP and describes any systems, software services and any associated physical or virtual resources that support some purpose (for example, C2 servers used as part of an attack, a device or server that is part of a defense, and database servers targeted by an attack). While elements of an attack can be represented by other SDOs or SCOs, the Infrastructure SDO represents a named group of related data that constitutes the infrastructure.
| System Fields | Description |
|---|---|
| Value | Defines the indicator on Cortex XSIAM. The value is the main key for the object in the system. |
| Verdict | Malicious, Suspicious, Benign, or Unknown. |
| Expiration | The expiration date of the object. |
| Source Time Stamp | When the object was created in the system. |
| Modified | When the object was last modified. |
| Custom Fields - Core | Description |
|---|---|
| Community Notes | Comments and free form notes regarding the indicator. |
| Description | The description of the object. |
| STIX ID | The STIX ID for the object in the format of infrastructure--<UUID>. |
| Tags | Tags attached to the object. |
| Traffic Light Protocol | Red, Amber, Green, or White. |
| Custom Fields - Unique | Description |
|---|---|
| Aliases | Alternative names used to identify this infrastructure. |
| Infrastructure types | The type of infrastructure being described. Values should come from STIX infrastructure-type-ov open vocabulary. |
Intrusion set
An intrusion set is a grouped set of adversarial behaviors and resources with common properties that is believed to be orchestrated by a single organization. An intrusion set may capture multiple campaigns or other activities that are all tied together by shared attributes indicating a commonly known or unknown threat actor. New activity can be attributed to an intrusion set even if the threat actors behind the attack are not known. Threat actors can move from supporting one intrusion set to supporting another, or they may support multiple intrusion sets.
Whereas a campaign is a set of attacks over a period of time against a specific set of targets to achieve an objective, an intrusion set is the entire attack package and may be used over a very long period of time in multiple campaigns to achieve potentially multiple purposes.
| System Fields | Description |
|---|---|
| Value | Defines the indicator on Cortex XSIAM. The value is the main key for the object in the system. |
| Verdict | Malicious, Suspicious, Benign, or Unknown. |
| Expiration | The expiration date of the object. |
| Source Time Stamp | When the object was created in the system. |
| Modified | When the object was last modified. |
| Custom Fields - Core | Description |
|---|---|
| Community Notes | Comments and free form notes regarding the indicator. |
| Description | The description of the object. |
| STIX ID | The STIX ID for the object in the format of intrusion-set--<UUID>. |
| Tags | Tags attached to the object. |
| Traffic Light Protocol | Red, Amber, Green, or White. |
| Custom Fields - Unique | Description |
|---|---|
| Aliases | Alternative names used to identify this intrusion set. |
| Goals | The high-level goals of this intrusion set, what it is trying to do. |
| Primary Motivation | The primary reason, motivation, or purpose behind this intrusion set. Values should come from STIX attack-motivation-ov open vocabulary. |
| Secondary Motivation | The secondary reason, motivation, or purpose behind this intrusion set. Values should come from STIX attack-motivation-ov open vocabulary. |
| Resource level | Specifies the organizational level at which this intrusion set typically works. Values should come from STIX attack-resource-level-ov open vocabulary. |
Malware
Malware is a type of TTP that represents malicious code. It generally refers to a program that is inserted into a system, usually covertly. The intent is to compromise the confidentiality, integrity, or availability of the victim's data, applications, or operating system (OS) or otherwise annoy or disrupt the victim.
| System Fields | Description |
|---|---|
| Value | Defines the indicator on Cortex XSIAM. The value is the main key for the object in the system. |
| Verdict | Malicious, Suspicious, Benign, or Unknown. |
| Expiration | The expiration date of the object. |
| Source Time Stamp | When the object was created in the system. |
| Modified | When the object was last modified. |
| Custom Fields - Core | Description |
|---|---|
| Community Notes | Comments and free form notes regarding the indicator. |
| Description | The description of the object. |
| STIX ID | The STIX ID for the object in the format of malware--<UUID>. |
| Tags | Tags attached to the object. |
| Traffic Light Protocol | Red, Amber, Green, or White. |
| Custom Fields - Unique | Description |
|---|---|
| Aliases | A list of other names the malware is known as. |
| Architecture | The processor architectures (for exmple, x86, ARM) that the malware instance or family is executable on. The values should come from the STIX processor-architecture-ov open vocabulary. |
| Capabilities | Any of the capabilities identified for the malware instance or family. The values should come from STIX malware-capabilities-ov open vocabulary. |
| Implementation Languages | The programming language(s) used to implement the malware instance or family. The values should come from the STIX implementation-language-ov open vocabulary. |
| Is Malware Family | Whether the object represents a malware family (if true) or a malware instance (if false). |
| Malware Types | Which type of malware. Values should come from STIX malware-type-ov open vocabulary. |
| Operating System Refs | Identifier of a software object. |
Report
Reports are collections of threat intelligence focused on one or more topics, such as a description of a threat actor, malware, or attack technique, including context and related details. They are used to group related threat intelligence together so that it can be published as a comprehensive cyber threat story.
| System Fields | Description |
|---|---|
| Value | Defines the indicator on Cortex XSIAM. The value is the main key for the object in the system. |
| Verdict | Malicious, Suspicious, Benign, or Unknown. |
| Expiration | The expiration date of the object. |
| Source Time Stamp | When the object was created in the system. |
| Modified | When the object was last modified. |
| Custom Fields - Core | Description |
|---|---|
| Community Notes | Comments and free form notes regarding the indicator. |
| Description | The description of the object. |
| STIX ID | The STIX ID for the object in the format of report--<UUID>. |
| Tags | Tags attached to the object. |
| Traffic Light Protocol | Red, Amber, Green, or White. |
| Custom Fields - Unique | Description |
|---|---|
| Publications | Links to publications of the report. |
Threat actor
Threat actors are individuals, groups, or organizations believed to be operating with malicious intent. A threat actor is not an intrusion set but may support or be affiliated with various intrusion sets, groups, or organizations over time.
| System Fields | Description |
|---|---|
| Value | Defines the indicator on Cortex XSIAM. The value is the main key for the object in the system. |
| Verdict | Malicious, Suspicious, Benign, or Unknown. |
| Expiration | The expiration date of the object. |
| Source Time Stamp | When the object was created in the system. |
| Modified | When the object was last modified. |
| Custom Fields - Core | Description |
|---|---|
| Community Notes | Comments and free form notes regarding the indicator. |
| Description | The description of the object. |
| STIX ID | The STIX ID for the object in the format of threat-actor--<UUID>. |
| Tags | Tags attached to the object. |
| Traffic Light Protocol | Red, Amber, Green, or White. |
| Custom Fields - Unique | Description |
|---|---|
| Alias | A list of other names the threat actor is known as. |
| Geo country | The country the threat actor is associated with. |
| Goals | The high-level goals of this threat actor, what it is trying to do. |
| Resource Level | The organizational level at which this threat actor typically works. Values for this property should come from STIX attack-resource-level-ov open vocabulary. |
| Primary Motivation | The primary reason, motivation, or purpose behind this threat actor. Values for this property should come from STIX attack-motivation-ov open vocabulary. |
| Secondary Motivation | The secondary reasons, motivations, or purposes behind this threat actor. Values for this property should come from STIX attack-motivation-ov open vocabulary. |
| Sophistication | The skill, specific knowledge, special training, or expertise a threat actor must have to perform the attack. Values for this property should come from STIX threat-actor-sophistication-ov open vocabulary. |
| Threat actor type | The type(s) of this threat actor. Values should come from STIX threat-actor-type-ov open vocabulary. |
Tool
Tools are legitimate software used by threat actors to perform attacks. Knowing how and when threat actors use such tools can help understand how campaigns are executed. Unlike malware, these tools or software packages are often found on a system and have legitimate purposes for power users, system administrators, network administrators, or even regular users. Remote access tools such as RDP and network scanning tools such as Nmap are examples of tools that may be used by a threat actor during an attack.
| System Fields | Description |
|---|---|
| Value | Defines the indicator on Cortex XSIAM. The value is the main key for the object in the system. |
| Verdict | Malicious, Suspicious, Benign, or Unknown. |
| Expiration | The expiration date of the object. |
| Source Time Stamp | When the object was created in the system. |
| Modified | When the object was last modified. |
| Custom Fields - Core | Description |
|---|---|
| Community Notes | Comments and free form notes regarding the indicator. |
| Description | The description of the object. |
| STIX ID | The STIX ID for the object in the format of tool--<UUID>. |
| Tags | Tags attached to the object. |
| Traffic Light Protocol | Red, Amber, Green, or White. |
| Custom Fields - Unique | Description |
|---|---|
| Alias | Alternative names used to identify this tool. |
| Tool Types | The kind(s) of tool(s) being described. Values for this property should come from STIX tool-type-ov open vocabulary. |
| Tool Version | The version identifier associated with the tool. |
| Kill Chain Phases | The list of kill chain phases this attack pattern is used for. |
Indicator field trigger scripts
Indicator field trigger scripts are automated responses that are triggered by a change in an indicator field value. In the script, you define the change in the indicator field value to check for and the actions to take when the change occurs. For example, you can:
- Create a script that runs when the Verdict field of an indicator changes. For example, the script will fetch all issues related to the indicator and take any action that is configured, such as reopening or changing severity.
-
Create a script that runs when the Expiration Status field changes. For example, you can define a script that will immediately update the relevant allow/block list and not wait for the next iteration, as seen in the following sample script:
indicators = demisto.args().get('indicators') new_value = demisto.args().get('new') indicator_values = [] for indicator in indicators: current_value = indicator.get('value') indicator_values.append(current_value) if new_value == "Expired": # update allow/block list regarding expired indicators else: # update allow/block list regarding active indicators
Indicator field trigger script arguments
Scripts can be created in Python, PowerShell, or JavaScript on the Scripts page. To use a field trigger script, you need to add the field-change-triggered-indicator tag when creating the script. You can then add the script in the Attributes tab when you edit or create a custom indicator field. If you did not add the tag when creating the script, the script will not be available for use.
Indicator field trigger scripts have the following triggered field information available as arguments (args):
| Argument | Description |
|---|---|
associatedToAll |
Whether the field is associated with all or some indicators. Value: true or false. |
associatedTypes |
An array of the indicator types the field is associated with. |
cliName |
The name of the field when called from the CLI. |
description |
The description of the field. |
indicators |
A list of indicators that have the current change. |
isReadOnly |
Specifies whether the field is non-editable. Value: true or false. |
name |
The name of the field. |
new |
The new value of the field. |
old |
The old value of the field. |
ownerOnly |
Specifies that only the creator of the field can edit. Value: true or false. |
placeholder |
The placeholder text. |
required |
Specifies whether this is a mandatory field. Value: true or false. |
selectValues |
If this is a multi-select type field, these are the values the field can take. |
system |
Whether it is a Cortex XSIAM defined field. |
type |
The field type. |
user |
The username of the user who triggered the script. |
Indicator field trigger script best practices
- Indicator field trigger scripts react to changes that have already occurred to the field and cannot validate or block changes to the field.
- Indicator field trigger scripts can be configured on the Verdict, Related Incidents, Expiration Status, and Indicator Type fields, as well as any custom indicator fields.
- Indicator field trigger scripts work in all TIM (Threat Intelligence Management) scenarios and workflows, except for feed ingestion.
- Fields that can hold a list (related incidents, multi-select/tag/role type custom fields) will provide an array of the delta. For example, if a multi-select field value has changed from ["a"] to ["a", "b"], the new argument of the script will get a value of ["b"].
-
Indicator field trigger scripts run as a batch. This means that if multiple indicators are changed in the same way and are set to trigger the same action, it will happen in one batch.
For example, in the following scenario for a configured indicator field trigger script named
myTriggerScripton the Verdict indicator field:- The Threat Intel Library has two existing Malicious indicators: 1.1.1.1 and 2.2.2.2.
- The user runs the following command
!setIndicators indicatorsValues="1.1.1.1,2.2.2.2" verdict=Benign. - The
myTriggerScriptscript will run just once, with the following parameters:- new - "Benign"
- old - "Malicious"
- indicators - "[{<indicator_1.1.1.1>},{<indicator_2.2.2.2}]"
- When writing indicator field trigger scripts, avoid scenarios that call the scripts endlessly (for example, a change in field A triggers script X, which changes field B's value, which in turn calls script Y, which changes field A's value).
Add an indicator field trigger script to an indicator field
After creating an indicator field trigger script in the Scripts page in Python, PowerShell, or JavaScript, you can then associate it with an indicator field.
- Go to Settings → Configurations → Object Setup → Indicators → Fields.
- Select the indicator field and click Edit.
-
In the Attributes tab, under Script to run when field value changes, select the desired indicator field trigger script.
Note
Indicator field trigger scripts must have the
field-change-triggered-indicatortag to appear in the list.
Indicator classification and mapping
The following table shows methods by which indicators are detected and ingested in Cortex XSIAM and how they are classified and mapped.
| Method | Description | Classification and Mapping |
|---|---|---|
| Integration | Feed integrations: Fetch indicators from a feed, for example, TAXII, Office 365, and Unit 42. | <p>Indicator classification and mapping is done in the integration code by duplicating the integration and not in the Indicators → Classification & Mapping tab. For more information, see Feed Integrations.</p><p>Some integrations come with a classifier and mapper, which you can customize.</p> |
| Indicator extraction | If you have enabled system-wide indicator extraction, indicators are extracted from all issues in Cortex XSIAM. | Only the value of an indicator is extracted, so no classification or mapping is needed. |
| Manual | <ul><li>Command line</li><li>Mark: The user marks a piece of data as an indicator.</li><li>STIX file: Manually upload a STIX file on the Threat Intel (Indicators) page.</li></ul> | <p>Data is inserted manually via the UI so no classification or mapping is needed.</p><p>If importing an STIX file, mapping is done via the STIX parser code.</p> |
Classify and map an indicator type for an integration
The indicator classification and mapping feature enables you to take the data that Cortex XSIAM ingests from integrations, and classify and map the data to indicator types and indicator fields. By classifying the data as different indicator types, you can process them with different playbooks suited to their respective requirements.
Note
When creating a new indicator type, you classify and map the indicator fields in the indicator type settings. For more details, see Map custom indicator fields.
Classification determines the type of indicator that is created for data ingested from a specific integration. You create a classifier and define that classifier in an integration.
You can map the fields from your third-party integration to the fields in your indicator layouts as follows:
- Map your fields to indicator types irrespective of the integration or classifier. This means that you can create a mapping before defining an instance and ingesting indicators. By doing so, when you do define an instance and apply a mapper, the data that comes in is already mapped.
- Create default mapping for all of the fields that are common to all indicator types. You can still overwrite the contents of a field in the specific indicator type.
Classify an indicator type
When an integration fetches indicators, it populates the raw JSON object for the indicator. The raw JSON object contains all of the attributes (fields) for an indicator. For example, source, when the event was created, the priority that was designated by the integration, and more. When classifying ingested indicator data, you want to select an attribute (field) that can determine the indicator type.
Use this procedure to create a classifier or duplicate an existing classifier for ingested indicator data.
- Select Settings → Configurations → Object Setup → Indicators → Classification & Mapping.
- Do one of the following:
- To create a new classifier, select + New → Indicator Classifier.
-
To edit an existing classifier, select it and click Edit.
If the classifier is installed from a content pack, you need to duplicate and then edit.
-
Under Get data, select from where you want to import the indicator data. You will classify the indicator type based on this information.
Note
You can optionally skip importing data. Click the pencil on the right of each indicator type on the right pane to enter the value manually.
- Pull from instance: Select an existing integration instance to import indicator data from.
- Upload JSON: Upload a formatted JSON file that includes the fields you want to classify by.
-
Under Fetched data, select from the attributes (fields) in the imported indicator object a field that will serve as the classifier (key) to route to a specific indicator type.
Cortex XSIAM searches through the imported indicator objects for the values for the field you select.
- Drag the found values from the Unmapped Values column to the relevant indicator type on the right pane.
- Save the classifier.
- Apply the indicator classifier to the relevant feed integration.
- Navigate to Settings → Data Sources & Integrations.
- Select an existing integration instance you want to apply the indicator classifier to or create a new integration instance.
- In the integration instance settings under Classifier, select the classifier you created and click Save.
Map indicator fields
Mappers enable you to map the information from ingested indicator data to the indicator fields that you have in your system.
Mapping data takes place in two stages:
- Map all of the fields that are common to all indicators in the default mapping.
- Map the additional fields that are specific for each indicator type, or overwrite the mapping that you used in the default mapping.
Note
In the Classification & Mapping page, the mapping does not indicate for which indicator types they are configured. When creating a mapper, it is best practice to add to the mapper name and the indicator type the mapper is for. For example, Mail Listener - Phishing.
When mapping a list, we recommend you map to a multi-select field. Short text fields do not support lists. If you need to map a list to a short text field, add a transformer in the relevant playbook task to split the data back into a list.
Use this procedure to create a mapper or duplicate an existing mapper to map all of the ingested indicator fields to an indicator layout.
- Select Settings → Configurations → Indicators → Classification & Mapping.
- Do one of the following:
- To create a new mapper, select + New → Indicator Mapper (incoming).
-
To edit an existing mapper, select it and click Edit.
If the mapper is installed from a content pack, you need to duplicate and then edit.
- Under Get data, select from where you want to import the indicator data. You will map the indicator data based on this information.
- Pull from instance: Select an existing integration instance to import indicator data from.
- Upload JSON: Upload a formatted JSON file that includes the fields you want to map.
- Under Indicator Type, start by mapping out the Common Mapping. This mapping includes the fields that are common to all of the indicator types and saves you time having to define these fields individually in each indicator type.
- Click the attribute (field) to which you want to map. You can further manipulate the field using filters and transformers.
- Repeat this process for the other indicator types for which this mapping is relevant.
- Save the mapper.
- Apply the indicator mapper to the relevant feed integration.
- Navigate to Settings → Data Sources & Integrations.
- Select an existing integration instance you want to apply the classifier to or create a new integration instance.
- In the integration instance settings under Mapper, select the mapper you created and click Save.
Indicator extraction
Indicator extraction identifies indicators from different text sources in the system (such as War Room entries and email content), extracts them (usually based on regex), and creates indicators in Cortex XSIAM . After extraction, the indicator can be enriched.
Indicator enrichment takes the extracted indicator and provides detailed information about the indicator, based on enrichment feeds such as VirusTotal and IPinfo.
Note
By default, system-wide automatic indicator extraction and enrichment is disabled. However, if you migrated from Cortex XSIAM 2.x to Cortex XSIAM 3.x, system-wide automatic indicator extraction and enrichment is enabled.
If you have a Threat Intel Management (TIM) Add-on, you can enable or disable automatic indicator extraction system-wide. Go to Settings → Configuration → General → Server Settings. In the Indicators section, enable Enable automatic indicator extraction and enrichment from issues.
To extract indicators from incoming feeds without enrichment or to prevent enrichment for existing indicators, see Exclude indicators from enrichment.
In Cortex XSIAM, the indicator extraction feature extracts indicators from War Room entries and enriches them using commands and scripts defined for the indicator type.
You can extract indicators in the following scenarios:
- When fetching issues
- In a playbook task
- Using the command line
Note
Reputation commands, such as !ip and !domain, can only be used after you configure and enable a reputation integration instance, such as VirusTotal and Whois.
Indicator extraction modes
You set the indicator extraction mode:
- In a playbook task.
- Running a command during an investigation.
Indicator extraction supports the following modes:
- None: Indicators are not extracted automatically. Use this option when you do not want to further evaluate the indicators.
- Inline: Indicators are extracted within the context that indicator extraction runs (synchronously). The findings are added to the context data. For example, if indicator extraction mode for a task in a playbook is inline, the extraction and enrichment must complete before the next task begins. This option provides the most robust information available per indicator.
-
Note
The inline configuration may delay playbook execution.
Note
While indicator creation is asynchronous, indicator extraction and enrichment are run synchronously. Data is placed into the issue context and is available via the context for subsequent tasks.
All indicators are automatically extracted and enriched before a playbook is run. For an on-field change, extraction occurs before the next playbook tasks run.
-
-
Out of band: Indicators are extracted in parallel (asynchronously) to other actions. The extracted data will be available within the issue, however, it is not available for immediate use in task inputs or outputs since the information is not available in real-time.
Note
When using out of band, the extracted indicators do not appear in the context. If you want the extracted indicators to appear select inline.
- If system-wide indicator extraction and enrichment is enabled, indicators are extracted according to the following system defaults:
- Issue creation - inline
- Tasks - none, can be overridden on a per task basis
- CLI - out of band, but can be overridden on a per-command basis
Troubleshoot indicator extraction
If indicators are not extracted, check whether the indicator mode is set to none, and verify the indicator is not in the Exclusion List, as is or as part of a regular expression (regex).
Set the indicator extraction mode for a playbook task
By default, system-wide indicator extraction is disabled. You can set the indicator extraction mode for specific playbook tasks.
- Select the playbook where you want to add indicator extraction to a task, and click Edit.
- In the playbook, click a task to open the Edit Task window.
- Click the Advanced tab.
- In the indicator extraction drop-down menu, select the mode you want to use.
- Click OK.
Disable indicator extraction for scripts or integrations
By default, system-wide indicator extraction and enrichment is disabled.
If you have the TIM add-on and you have enabled system-wide indicator extraction and enrichment, the procedure below enables you to disable indicator extraction for a specific script or integration.
Note
The TIM add-on is included in the Cortex XSIAM Premium license.
-
To disable indicator extraction for a script, add the
IgnoreAutoExtractentry with the value oftrue, when returning an entry.For example:
entry = { 'Type': entryTypes['note'], 'Contents': { 'Echo' : demisto.args()['echo'] }, 'ContentsFormat': formats['json'], 'ReadableContentsFormat': formats['markdown'], 'HumanReadable': hr, 'IgnoreAutoExtract' : True } -
To disable indicator extraction for an integration, add the
'IgnoreAutoExtract'entry with the value oftrue, when returning an entry.For example in the ServiceNow integration:
entry = { 'Type': entryTypes['note'], 'Contents': result, 'ContentsFormat': formats['json'], 'ReadableContentsFormat': formats['markdown'], 'HumanReadable': tableToMarkdown('ServiceNow ticket', hr, headers=headers, removeNull=True), 'EntryContext': { 'Ticket(val.ID===obj.ID)': context, 'ServiceNow.Ticket(val.ID===obj.ID)': context }, 'IgnoreAutoExtract': True } entries.append(entry) return entries
For more information about command results in Python, see Python code conventions for CommandResults.
Configure Threat Intelligence feed integrations
You can download and install content packs, including threat intelligence integrations such as:
- MITRE ATT&CK
- Unit 42 Feed
- Unit 42 Intelligence
- AlienVault
- AWS
Note
Some third-party services (such as Whois and MITRE ATT&CK) enforce strict rate limits based on the source IP address. If you encounter quota management issues, we recommend running them on an engine. This routes traffic through your private network, ensuring the external service sees a unique, dedicated IP address assigned to your organization.
How to configure threat intelligence feed integrations
- Go to Marketplace and install the relevant threat intelligence content pack.
-
Configure the threat intelligence integration by going to Settings → Configurations → Data Collection → Automation & Feed Integrations, search for your integration, and click Add Instance.
The following table is a non-exhaustive list of the most common feed integration parameters. Each feed integration may have parameters unique to that integration. Read the documentation for specific feed integrations for more details.
Parameter Description Fetches indicators <p>Select this option for the integration instance to fetch indicators.</p><p>Some integrations can fetch indicators or issues. Select the relevant option for what you need to fetch in the instance.</p> URL The URL of the feed. Feed Fetch Interval When the integration instance should fetch indicators from the feed. Indicator verdict The indicator verdict that will apply to all indicators fetched from this integration instance. Source reliability The reliability of the source that provides the threat intelligence data. Indicator Expiration Method <p>The method by which to expire indicators from this integration instance. The default expiration method is the interval configured for the indicator type to which this indicator belongs.</p><ul><li>Indicator Type: The expiration method defined for the indicator type to which this indicator belongs (interval or never).</li><li>Time Interval: Expires indicators from this instance after the specified time interval, in days or hours.</li><li>Never Expire: Indicators from this instance never expire.</li><li><p>When removed from the feed: When the indicators are removed from the feed they are expired in the system.</p><div data-gb-custom-block data-tag="hint" data-style="info" class="hint hint-info"><p>Note</p><p>Some feeds only provide information about new indicators and do not specify when indicators are removed. Indicators from these feeds cannot be automatically expired on removal.</p><p>If a feed's expiration method is set to When removed from the feed, indicators that are removed from the feed immediately expire. Note that if the feed is disabled, its expiration method reverts to that of the indicator type (time-based).</p><p>Time-based expiration is set according to feed reliability. If the same indicator appears on multiple feeds, the feed with the highest reliability determines the indicator's expiration time. If multiple feeds have the same reliability, the last feed to add or modify the indicator determines its expiration time.</p><p>Example:</p><ul><li>An indicator was initially fetched by Feed A, then by Feed B.</li><li>Both feeds have the same reliability.</li><li>Feed B's indicators are set to expire When removed from the feed.</li><li>Feed B is now disabled.</li></ul><p>After Feed B is disabled, the indicator's expiration method reverts to that of the indicator type (for example, expire after 7 days). However, if Feed A then modifies the indicator (or removes and re-adds it), the expiration method changes back to Feed A's settings.</p></div></li></ul> Bypass exclusion list When selected, the exclusion list is ignored for indicators from this feed. This means that if an indicator from this feed is on the exclusion list, the indicator might still be added to the system. Trust any certificate (not secure) When selected, certificates are not checked. Use system proxy settings Runs the integration instance using the proxy server (HTTP or HTTPS) when an engine is selected. Do not use in CLI by default Excludes this integration instance when running a generic command that uses all available integrations.
Exclude indicators from enrichment
You can disable enrichment for individual indicators or disable enrichment for all indicators fetched by any of the following feeds:
- Azure Feed
- Office 365 Feed
- Cisco WebEx Feed
- Cloudflare Feed
- Fastly Feed
- AWS Feed
- Zoom Feed
- Public DNS Feed
- Google IP Ranges Feed
If you disable enrichment for an incoming feed, the indicators are extracted and saved but not enriched by Cortex XSIAM, enabling you to conserve system resources when dealing with known indicators.
When an indicator has enrichment excluded, the Enrich Indicator button is disabled. If you try to enrich an indicator that is enrichment excluded, an error will occur.
Indicators of the following indicator types can have enrichment excluded:
- IP
- Domain
- URL
- File
Exclude enrichment for a feed integration
To exclude enrichment for indicators fetched from a feed integration, when configuring an instance of the feed integration, select the Enrichment Excluded checkbox.
Exclude enrichment for individual indicators
When creating or editing an indicator of one of the following types: IP, Domain, Email, URL, or File, you have the option to set Enrichment Excluded to Yes or No. The default is No.
View list of enrichment excluded indicators
To view the enrichment excluded indicators in the Indicators table, add the Enrichment Excluded column to the table.
Generate issues from indicators using indicator rules for prevention and detection
Indicator rules allow you to utilize indicators in the system for detection and prevention. These rules allow you to select indicators or indicator traits to be detected by the tenant and prevented by the endpoint. Indicator rules marked for detection and prevention generate issues that you can then track and investigate.
Note
Indicators should be present in the Threat Intelligence database (Threat Management → Threat Intelligence → Indicators) before creating detection and prevention rules.
Indicator rules can be used for the following:
- Real-time prevention on the agent
Create an indicator rule for a Restrictions profile on the Agent using filters applied on file (SHA256 and MD5) indicators. A Restrictions profile limits the locations from which executables can run on an endpoint. When the Cortex XDR agent detects behavior that matches a rule defined in your profile, the Cortex XDR agent applies the security profile that is attached to the rule for further inspection. An issue is then generated in Cortex XSIAM (source is XDR Agent). For more information about the Restrictions profile, see Set up restrictions prevention profiles.
-
Cortex XSIAM tenant (server-side) detection
Create rules based on filters that are applied to a file (SHA256, MD5) an IP address, and a domain. If an indicator rule applies, an issue is generated in Cortex XSIAM (source is Threat Intelligence).
Note
Although you can create IOC rules for detection, indicator rules are designed to leverage threat intelligence indicators like MD5 and SHA256 hashes that are present in your TIM library. These rules directly integrate with and rely on the indicators ingested and managed by TIM. Indicators must be in the TIM database before creating these rules.
For more information about IOC rules, see What's an IOC?
Create a Prevention Rule
Prevention Rules are created based on the file (SHA256 and MD5) indicator type.
- Create a Restrictions Profile.
- Select Inventory → Endpoints → Policy Management → Prevention → Profiles → Add Profile → Create New.
- Select one of the following Platforms.
- Windows
- MacOS
- Linx
- Select Restrictions.
-
From the Custom Indicator Prevention Rules section, in the Action Mode field, select Enabled.
You will see that there are no custom prevention rules defined. After you create an indicator rule, you will need to edit this profile and select the indicator rule.
- Add the parameters as required. For more information, see Set up restrictions prevention profiles.
- Create the Profile.
- Create the Indicator Rule.
- Select Threat Management → Detection Rules → Indicator Rules → Add Rule → Prevention Rule.
-
From the Create New Prevention Rule wizard, in the General section, add the following parameters:
Parameter Description Rule Name Add a meaningful name. Select Profiles for Prevention (To block files) <p>Select the Retentions profile you created in step 1.</p><p>For the profile to appear, when defining the Retentions profile, the Custom Indicator Prevention Rules section must be set to Enabled.</p> Severity Defines the severity of the issue. Description Add a meaningful description. - Click Next.
-
In the Target section, use the filters and/or select the file indicators to which to apply the rule.
Note
You can't change the Preventable = True, Status = Active and Type = File filters, which comply with the requirements of the supported indicator type for Prevention on the Agent.
Filter Description Value The hash value of the field (SHA256 or MD5). Verdict The reputation of the indicator: Malicious, Suspicious, Benign, Unknown Has Related Issues Whether the indicator has related issues. Campaign Whether the indicator is part of an existing campaign. Mitre ID Mitre ID associated with the related issues. Mitre Tactic Mitra Tactic associated with the related issues. Tags The tags applied to indicators. Confidence The level of confidence. Aggregated Reliability The reliability score such as A - Completely reliable. Feed The source (script, manual, etc.) that last set the indicator's expiration status. - Click Next and then save the rule.
- Add the indicator rule to the Restrictions Profile.
- Go to Inventory → Endpoints → Policy Management → Prevention → Profiles.
- Edit the Restrictions Profile you created in step 1.
- In the Custom Indicator Prevention Rules tab, select the indicator rule you created in step 2.
- Save the Profile.
Example 192. Create a prevention rule blocking indicators from a feed
In this example, create an Indicator Prevention rule, which blocks file indicators using the Unit 42 Feed and then generates an issue.
Before you begin create a Restrictions Profile called JC-Win-R-O1, with the Custom Indicator Prevention Rules section set to Enabled.
-
Create a Prevention Indicator Rule and in the General section, add the following parameters.
Field Value Rule Name JC-IR-Prevent-02 Select Profiles For Prevention (To Block Their Files) JC-WIN-R-01 Severity Medium Description To raise prevention on IOCs from Unit 42 Feed -
In the Target Section, select the
Feed=Unit 42filter.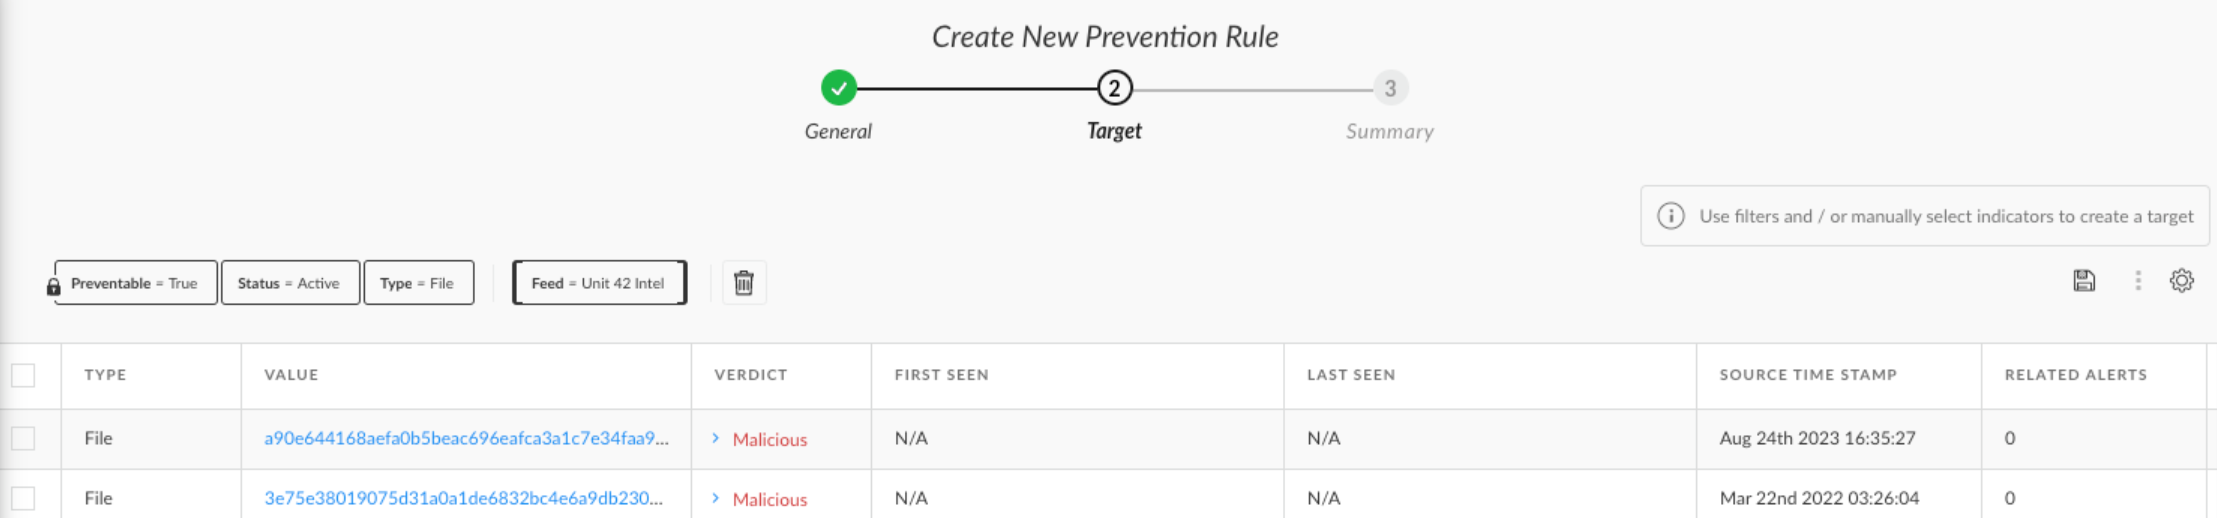
-
In the Restrictions Profile, add the indicator rule.
When a file indicator from Unit 42 feed is found, the XDR Agent blocks the indicator.
An issue is generated in Cortex XSIAM. The Issue Source is XDR Agent, severity is medium and the Action is Prevented (Blocked).

Note
The Indicator Rule shows the number of issues generated by the rule. You can view the issues that were generated using the Indicator rule by right-clicking the rule and select View related issues.
Create a Detection rule
After you create a detection rule, Cortex XSIAM searches indicators in your tenant and raises an issue if a match is detected. Detection rules apply for File, Domain, and IP Address indicator types.
- Select Threat Management → Detection Rules → Indicator Rules → Add Rule → Detection Rule.
-
From the Create New Detection Rule wizard, in the General section, add the following parameters:
Parameter Description Rule Name Add a meaningful name. Severity Defines the severity of the issue. Description Add a meaningful description. - Click Next.
-
In the Target section, use the filters and/or select the file indicators to which to apply the rule.
Note
You can't change the Detectable = True and Status = Active filters, which comply with the requirements of the supported indicator type for detection.
Filter Description Value The hash value of the field (SHA256 or MD5), IP address, or domain. Verdict The reputation of the indicator: Malicious, Suspicious, Benign, Unknown Has Related Issues Whether the indicator has related issues. Campaign Whether the indicator is part of an existing campaign. Mitre ID Mitre ID associated with the related issues. Mitre Tactic Mitra Tactic associated with the related issues. Tags The tags applied to indicators. Confidence The level of confidence. Aggregated Reliability The reliability score such as A - Completely reliable. Feed The source (script, manual, etc.) that last set the indicator's expiration status. Type The indicator type (Domain, File, IP) - Click Next and then save the rule.
- If the indicator rule has generated issues, right-click the rule and select View related issues.
Example 193. Create a detection rule from feeds
In this example, create a detection rule from many feeds, such as Unit 42, AzureRiskyUsers, and Mail-Sender that returns a malicious verdict.
-
In the General section, add the following parameters.
Field Value Rule Name JC-IR-Prevent-01 Severity Medium Description To raise detection on all indicators uploaded from feeds with a malicious verdict. -
In the Target Section, select Feed (Select All) and Verdict = Malicious.
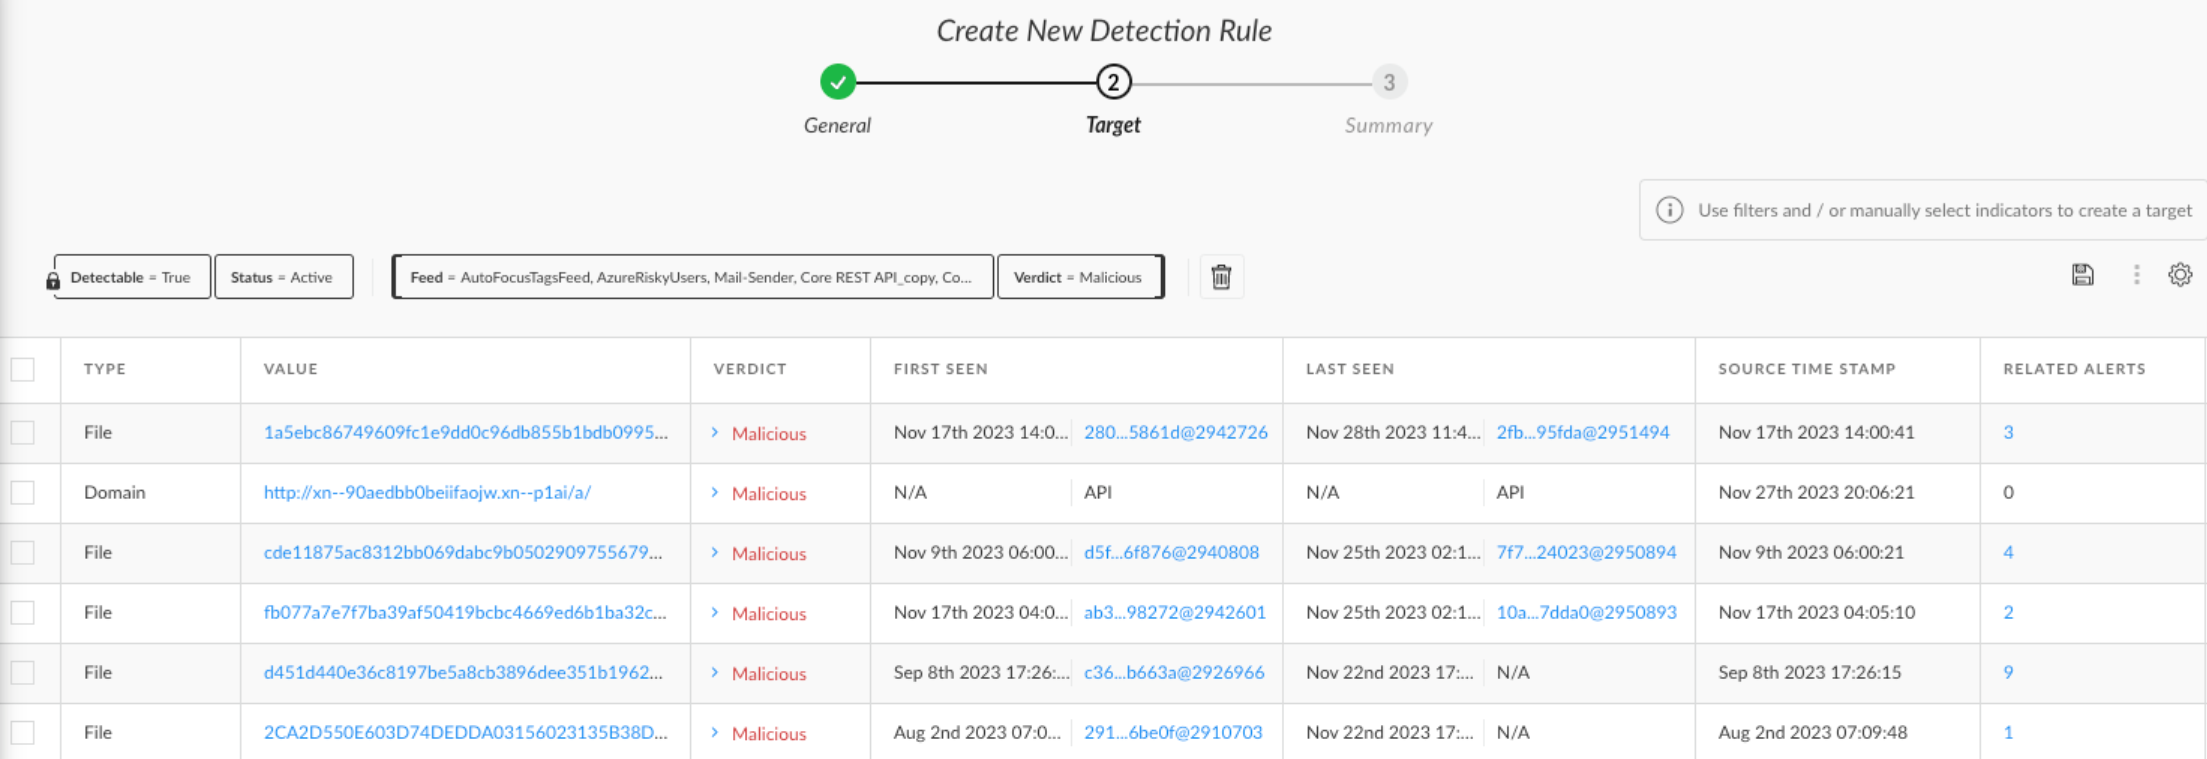
When a malicious verdict is found from the feed, an issue is generated. The Issue Source is Threat Intelligence, severity is medium and the Action is Detected.

Note
The Issue source is Threat Intelligence.
Manage Indicator Rules
The Indicator Rules page displays the following fields for each rule:
| Field | Description |
|---|---|
| Rule ID | Unique identifier for the rule. |
| Creation Date | Timestamp of when the rule was created. |
| Modification Date | Timestamp when the rule was edited. |
| Name | Name of the rule. |
| Type | Whether the rule is a Prevention or Detection type rule. |
| Target | Hash, IP address, File, or domain value associated with the rule. |
| Severity | Level of severity associated with the rule. |
| # of issues | Number of issues generated by the rule. |
| Created by | The email address of the user who created the rule. |
| Description | An optional description associated with the rule. |
| Status | Whether the rule is Enabled or Disabled. |
| Used in profiles | Cortex XDR agent Restriction Profile associated with the rule. |
Note
If an indicator matches multiple indicator rules, the highest severity rule is used. If all have the same severity, the rules are used by the first created.
In the Indicator Rules table, right-click a rule to perform actions, including the following:
| Action | Description |
|---|---|
| View related issues | View issues generated by the rule. |
| Disable/Enable | Depending on the current status, Disable or Enable the rule. |
| Edit Rule | Modify the rule. |
| Save as new | Create a new rule using the current rule configurations. |
| Delete | Delete the rule. |
Export indicators
In the Indicators table, you can export indicators in a CSV or STIX file. You can also export indicators using an integration or a playbook.
Export indicators using the Generic Export Indicators Integration
You can export indicators in a hosted text file (External Dynamic list) from Cortex XSIAM or an engine using the Generic Export Indicators Service integration. Exported indicators can be used for example in firewall block lists, allow lists, and monitoring and analysis in Splunk. See Generic Export Indicators Service.
The Generic Export Indicators Service integration can be configured to export specific fields in different output formats. Multiple instances of the integration can be configured for different indicator queries, and the output can be customized to work with a variety of third-party services.
You can set up the Generic Export Indicators Service integration by setting up a long-running integration. See Forward Requests to Long-Running Integrations.
If you configure the Generic Export Indicator to run on-demand, use the !export-indicators-list-update command for the first time to initialize the export process.
Export indicators using playbooks
Cortex XSIAM provides out-of-the-box playbooks for TIM, including playbooks that enable you to export indicators. All TIM-related playbooks have the 'TIM' prefix. Some are generic and some are dedicated to a specific vendor, like QRadar (for example, TIM - QRadar Add Domain Indicators) and ArcSight (for example, TIM- Arcsight Add IP Indicators).
If you define a playbook task input that pulls from indicators, the entire playbook runs in Quiet Mode. This means the task or playbook information is not written to the War Room, and inputs and outputs are not displayed in the playbook. However, errors and warnings are still written to the War Room.
Caution
You should not run a query on a field that you might change in the playbook flow. For example, you shouldn’t have a playbook with query Verdict:Malicious and then change the indicator verdict as a part of the playbook.
Indicator management
Indicator management
Indicators are artifacts associated with security issues and are an essential part of the case management and remediation process. They help correlate issues, create hunting operations, and enable you to easily analyze cases and reduce Mean Time to Response (MTTR).
Indicators
Displays a list of indicators added to Cortex XSIAM, where you can perform several indicator actions.
You can perform the following actions on the XSIAM Indicators page.
| Action | Description |
|---|---|
| Investigate an indicator | Click on an indicator to view and take action on the indicator. |
| Create an indicator | <p>Indicators are added to the indicators table from feed integrations or you can manually create a new indicator in the system.</p><p>When creating an indicator, in the Verdict field, you can either select a Verdict or leave it blank to calculate it later by clicking Save & Enrich, which updates the indicator from enrichment sources. After you select an indicator type, you can add any custom field data.</p> |
| Edit | Edit a single indicator or select multiple indicators to perform a bulk edit. |
| Delete and Exclude | <p>Delete and exclude one or more indicators from all indicator types or a subset of indicator types.</p><p>If you select the Do not add to exclusion list checkbox, the selected indicators are only deleted.</p> |
| Export CSV | Export the selected indicators to a CSV file. |
| Export STIX | Export the selected indicators to a STIX file. |
| Upload a STIX file | To upload a STIX file, click the upload button (top right of the page) and add the indicators from the file to the system. |
Indicator Rules
The Indicator Rules page is located under the Threat Management → Detection Rules menu and displays the following fields for each rule. For more information, see Generate issues from indicators using indicator rules for prevention and detection.
| Field | Description |
|---|---|
| Rule ID | Unique identifier for the rule. |
| Creation Date | Timestamp of when the rule was created. |
| Modification Date | Timestamp when the rule was edited. |
| Name | Name of the rule. |
| Type | Whether the rule is a Prevention or Detection type rule. |
| Target | Hash, IP address, File, or domain value associated with the rule. |
| Severity | Level of severity associated with the rule. |
| # of issues | Number of issues generated by the rule. |
| Created by | The email address of the user who created the rule. |
| Description | An optional description associated with the rule. |
| Status | Whether the rule is Enabled or Disabled. |
| Used in profiles | Cortex XDR agent Restriction Profile associated with the rule. |
Note
If an indicator matches multiple indicator rules, the highest severity rule is used. If all have the same severity, the rules are used by the first created.
In the Indicator Rules table, right-click a rule to perform actions, including the following:
| Action | Description |
|---|---|
| View related issues | View issues generated by the rule. |
| Disable/Enable | Depending on the current status, Disable or Enable the rule. |
| Edit Rule | Modify the rule. |
| Save as new | Create a new rule using the current rule configurations. |
| Delete | Delete the rule. |
Indicator investigation
Cortex XSIAM enables you to centralize and manage every aspect of your TIM investigation. Create, extract, and enrich indicators and explore their relationships to gain deeper insights.
After you start ingesting indicators into Cortex XSIAM, you can start your investigation, including creating indicators, adding indicators to an issue, extracting indicators, exporting indicators, etc.
When investigating an indicator, you can see the following tabs:
-
Summary
View verdict, enrich, expire, delete and exclude the indicator, add relationships, view related issues, and add comments. Add or remove tags, which can help classify known threats. For example, you may want to group specific malware indicators that are part of ransomware, such as trojan or loader.
-
Additional Details
Add or view any community notes for sharing and any custom details.
When investigating an indicator, you can perform actions on the indicator, such as:
| Action | Description |
|---|---|
| Enrich an indicator | You can view detailed information about the indicator (WHOIS information for example), using third-party integrations such as VirusTotal and IPinfo. For more information, see Extract and enrich an indicator. |
| Expire an indicator | You may want to expire an indicator to filter out less relevant issues, allowing analysts to focus on active threats. For more information, see Expire an indicator. |
| Manage indicator relationships | Indicator relationships are connections between different indicators. These relationships can be IP addresses related to one another, domains impersonating legitimate domains, etc. Relationships are created from threat intel feeds and enrichment integrations that support the automatic creation of relationships. For more information, see Manage indicator relationships. |
| Delete and exclude indicators | Indicators added to an exclusion list are disregarded by the system and are not created or involved in automated flows. For more information, see Delete and exclude indicators. |
Indicator verdict
An indicator’s verdict is assigned according to the verdict returned by the source with the highest reliability, where reliability is scaled based on the Admiralty Source and Information Reliability Matrix. In cases where multiple sources with the same reliability score return a different verdict for the indicator, the worst verdict is taken. Indicators are assigned the following verdicts:
- 0: Unknown
- 1: Benign
- 2: Suspicious
- 3: Malicious
In the UI, you can manually set the verdict when creating or editing an indicator. If you manually changed the indicator’s verdict in the UI and want to recalculate it according to enrichment integrations, set the verdict to Unknown and then enrich the indicator. If you run indicator enrichment without setting the verdict to Unknown, the indicator is enriched but the manually set verdict is not changed.
You can also manually set the verdict by running !setIndicator or !setIndicators in the CLI (for example in the Playground), but if you set the verdict to Unknown the system will not overwrite it.
Source reliability
The reliability of an intelligence data source influences the verdict of an indicator and the values for indicator fields when merging indicators. Indicator fields are merged according to the source reliability hierarchy, which means that when there are two different values for a single indicator field, the field will be populated with the value provided by the source with the highest reliability score.
In rare cases, two sources with the same reliability score might return different values for the same indicator field. In these cases, the field is populated with the most recently provided source, unless the field is verdict. If two sources have the same reliability score and return different values for the verdict field, the worse verdict is used.
For the field types Tags and Multi-select, all values are appended, and nothing is overridden.
| Source | Reliability Score | Notes |
|---|---|---|
| Manual | A+++ | A user manually updates the verdict of an indicator. |
| Reputation script | A++ | A script with the reputation tag calculates the verdict of an indicator. For example, the DataDomainReputation script evaluates the verdict of a URL or domain. |
| Third-party enrichment | A+ | An integration or service that evaluates the verdict of an indicator. For example, the urlscan.io integration evaluates the verdict of a URL. |
| Feed | A: Completely reliable | <p>The feed reliability is applied at the integration instance level.</p><p>For configuration steps, see Configure Threat Intelligence feed integrations.</p> |
| B: Usually reliable | ||
| C: Fairly reliable | ||
| D: Not usually reliable | ||
| E: Unreliable | ||
| F: Reliability cannot be judged |
Different verdicts from integrations
In this example, two third-party integrations, VirusTotal and AlienVault, return a different verdict for the same indicator. The indicator’s verdict will be Malicious because VirusTotal’s reliability score is higher than AlienVault.
| Integration | Reliability | Verdict | Final Verdict |
|---|---|---|---|
| VirusTotal | C - Fairly reliable | Malicious | Malicious |
| AlienVault | D- Not usually reliable | Benign |
In this example, two sources with the same verdict score return a different verdict for the same indicator. The indicator’s verdict will be Malicious because when two sources have the same reliability, the worse verdict applies.
| Integration | Reliability | Verdict | Final Verdict |
|---|---|---|---|
| TAXII Feed | B - Usually reliable | Malicious | Malicious |
| CSV Feed | B - Usually reliable | Benign |
Extract and enrich an indicator
Indicator extraction identifies indicators from different text sources in the system (such as War Room entries), extracts them, and creates indicators in Cortex XSIAM. After extraction, the indicators are enriched.
Note
By default, system-wide automatic indicator extraction and enrichment is disabled. However, if you migrated from Cortex XSIAM 2.x to Cortex XSIAM 3.x, system-wide automatic indicator extraction and enrichment is enabled.
If you have a Threat Intel Management (TIM) Add-on, you can enable or disable automatic indicator extraction system-wide. Go to Settings → Configuration → General → Server Settings. In the Indicators section, enable Enable automatic indicator extraction and enrichment from issues.
Indicator enrichment takes the extracted indicator and provides detailed information about the indicator (WHOIS information for example), using third-party integrations such as VirusTotal and IPinfo.
If you want to extract an indicator manually, you can do the following:
-
Run indicator extraction in the CLI by running one of the following commands:
Command Description extractIndicators <p>If you want to extract indicators from non-War-Room-entry sources (such as extracting from files), use the !extractIndicatorscommand from the CLI. Use the command to do the following:</p><ul><li>Validate regex: Test a specific string to see if the relevant indicators are extracted correctly, such as a URL.</li><li>In a playbook or script. The command extracts indicators in a playbook or a script (non War Room source), and also creates and enriches them.</li></ul><p>You can extract the following:</p><ul><li>A specified entry (an entry ID)</li><li>Investigation (Investigation ID)</li><li>Text</li><li>File path</li></ul><p>For example, type!extractIndicators text="some text 1.1.1.1 something" auto-extract=inline. The entry text contains the text of the indicators, which is extracted and enriched.</p><p>You can also extract indicators by adding the auto-extract parameter with the script and the mode for which you are setting it up. For example:!ReadFile entryId=826@101 auto-extract=inline.</p><p>Usually, when using the CLI, you want to disable indicator extraction. For example, if you return internal/private data to the War Room, and you do not want it to be extracted and enriched in third-party services, addauto-extract=noneto your CLI command.</p>enrichIndicators <p>The enrichIndicatorscommand is usually used when you want to batch enrich indicators. This command works on existing indicators only (it does not create them on its own). When running the command, the relevant enrichment command is triggered (such as!ip), which is based on the indicator type that is found. The data is saved to context and the indicator.</p><div data-gb-custom-block data-tag="hint" data-style="info" class="hint hint-info"><p>Note</p><p>Triggering enrichment on a substantial number of indicators can take time (because it's activating all enrichment integrations per indicator) and can result in performance degradation.</p></div>Reputation commands <p>Reputation commands such as !ip, can be run for new indicators and indicators already in the system. If extraction is on, the data is saved both to the indicator and the issue's context. If not, then the data is saved only to the context because the mapping flow is always triggered in enrichment commands. The default configuration is set to none in playbook tasks for extraction.</p><div data-gb-custom-block data-tag="hint" data-style="info" class="hint hint-info"><p>Note</p><p>Reputation commands, such as !ip, !domaincan only be used when you configure and enable a reputation integration instance, such as VirusTotal and WHOIS.</p></div> - Use the Enrich indicator button in the indicator layout. This is the same effect as running a reputation command.
-
Run indicator enrichment in the Quick View window
If there is an enhancement script attached to the indicator type, in the indicator Quick View window, you can run a script to enrich an indicator. For example, the Domain indicator type uses the
DomainReputationenhancement script. In an issue that contains a domain indicator type, click Quick View. In the Indicators tab, click Domain → Actions → DomainReputation.You can also run the enhancement script in the CLI.
Expire an indicator
Indicators can have the Expiration Status field set to Active or Expired. When indicators expire, they still exist in Cortex XSIAM, meaning they are still displayed and you can still search for them. You may want to expire an indicator to filter out less relevant issues, allowing analysts to focus on active threats. Expiring IoCs that are no longer relevant helps ensure that security systems remain focused on current threats.
You can set up expiration in the indicator type, integration feed, or in a script. When you manually expire an indicator, this overrides indicator extraction rules set in scripts, indicator types, and feeds.
You can expire indicators using the following methods:
- In the indicator layout by clicking Expire indicator.
- Use the
expireIndicatorscommand to change the expiration status to Expired for one or more indicators. This command accepts a comma-separated list of indicator values and supports multiple indicator types. For example, you can set the expiration status for an IP address, domain, and file hash:!expireIndicators value=1.1.1.1,safeurl.com,45356A9DB614ED7161A3B9192E2F318D0AB5AD10. - Use the
!setIndicatoror for multiple indicators use the!setIndicatorscommand to reset the indicators' expiration value. The value can also be set toNever, so that the indicators never expire. For example,!setIndicators indicatorsValues=watson.com expiration=Never.
Note
You need to run these commands in the Case or Issue War Room.
Manage indicator relationships
Manage indicator relationships
Indicator relationships are connections between different indicators. These relationships can be IP addresses related to one another, domains impersonating legitimate domains, etc. These relationships enable you to enhance investigations with information about indicators and how they might be connected to other issues or indicators. For example, if you have a phishing issue with several indicators, one of those indicators might lead to another indicator, which is a malicious threat actor. Once you know the threat actor, you can investigate to see the issues it was involved in, its known TTPs (tactics, techniques, and procedures), and other indicators that might be related to the threat actor. The initial issue which started as a phishing investigation immediately becomes a true positive and relates to a specific malicious entity.
Relationships are created from threat intel feeds and enrichment integrations that support the automatic creation of relationships, such as AlienVault OTX v2 and URLhaus, by selecting Create relationships in the integration settings. Based on the information that exists in the integrations, the relationships are formed.
You can view indicator relationships by clicking on the indicator from an issue, and then from the Quick View window click the Relationships tab.
Create indicator relationships
You can also manually create and modify relationships, which is useful when a specific threat report comes out. For example, Unit 42’s SolarStorm report contains indicators and relationships that might not exist in your system, or you might not be aware of their connection.
If a relationship is no longer relevant, you can revoke it. This might be relevant, for example, if a known malicious domain is no longer associated with a specific IP address.
When you create a relationship, you can set the relationship type such as whether the indicator is related, attached, applied, etc. For example, a file is attached-to an email. The email communicated-with the file.
You can create relationships by adding them in a playbook, in the CLI using the CreateIndicatorRelationship command, or when investigating an indicator in the Threat Intel tab.
How to add an indicator relationship from an Indicator
- Open an indicator and in the RELATIONSHIPS section add a relationship.
-
In the New Relationships window, in Step 1, add a query by which to search for the relevant indicators.
You can optionally limit the time range for the search.
- Select the indicators you want to create a relationship to.
-
In Step 2 set the relationship type.
By default, the relationship is related-to. For example, IP address x.x.x.x is
related-toIP address y.y.y.y. - Save the relationship.
Note
You can also add an indicator relationship from the Quick View when selecting an indicator from an issue.
Investigate an indicator using indicator relationships
In this example, you can see how to use the relationships feature to further your investigation.
- When opening an issue, the severity is low, but the issue contains the following indicators:
- File
- IP
-
When you click the file hash indicator, neither the Info nor Relationships tabs have any additional details. This seems to indicate that the file is harmless.
-
Click on the IP address indicator.
Under the Info tab, you can see that the indicator was ingested from a threat intel feed. This already bears further investigation.
-
Go to the Relationships tab.
You can see that this indicator is related to a campaign.
What started as a low severity issue, has become a lot more threatening.
Delete and exclude indicators
Indicators added to an exclusion list are disregarded by the system and are not created or involved in automated flows such as indicator extraction. You can still manually enrich IP addresses and URLs that are on the exclusion list, but the results are not posted to the War Room.
Add indicators to the exclusion list either in the Indicators table or in the Exclusion List page.
Delete and exclude indicators in the Indicators table
Select one or more indicators from the Indicators table and click the Delete and Exclude button. The indicators are deleted from the Indicators table and added to the exclusion list. You can associate these indicators with one or more indicator types.
If you delete the indicator it is removed from Cortex XSIAM. This option should be used mainly for correcting errors in ingestion, and not as part of your regular workflow.
Add indicators in the Exclusion List page
From the Exclusion List page, you can view the list of excluded indicators, add an indicator to the exclusion list, or define indicator values to be excluded using a regular expression (regex) or CIDR.
- Select Settings → Configurations → Object Setup → Indicators → Exclusion List → New excluded indicator.
-
Add the indicator value. For example, example.com (for a domain).
Caution
Ensure you are using the correct syntax when defining the values for your exclusion lists.
-
Select whether to use Regex.
A regular expression enables you to identify a sequence of characters in an unknown string. The following example would identify www.demisto.com:
[A-Za-z0-9!@#$%\.&]*demisto[A-Za-z0-9!@#$%\.&]*.Classless inter-domain routing (CIDR) enables you to define a range of IP addresses. For example, the IPv4 block 192.168.100.0/22 represents the 1024 IPv4 addresses from 192.168.100.0 to 192.168.103.255.
- Add a reason as to why you are excluding the indicator.
- Add the indicator types that apply.
- Save the excluded indicator.
Exclusion list examples
| Exclusion | Description | Settings |
|---|---|---|
| Domain, URLs, and subdomains | Excludes a specific domain, and all subdomains and URLs associated with the domain. | <p>Define two entries to cover all URLs and subdomains associated with a specific domain.</p><p>Entry one:</p><ul><li>Value: Subdomains and URLs. Example: .example.com</li><li>Select Use Regex.</li><li>Do not select any indicator types.</li></ul><p>Entry two:</p><ul><li>Value: The specific domain. Example: example.com</li><li>Do NOT select Use Regex.</li><li>Do not select any indicator types.</li></ul> |
| Subdomain (and URLs) specifically | Excludes any subdomains and URLs of a domain, but the domain is still extracted. | <ul><li>Value: Subdomains and URLs. Example: .example.com</li><li>Select Use Regex.</li><li>Do not select any indicator types.</li></ul> |
| Specific domain only | Excludes a specific domain. Subdomains and URLs are still extracted. | <ul><li>Value: The specific domain. Example: example.com</li><li>Do NOT select Use Regex.</li><li>Select indicator type: Domain.</li></ul> |
| URL with wildcards | Excludes any indicators of type URL matching the regex. Indicators example.com and examplesub.example.com of type Domain would still be extracted. Start the regex with https?:// to exclude both HTTP and HTTPS URLs. |
<ul><li>Value: The URL with wildcard added at the end. Example: http://examplesub.example.com</li><li>Select Use Regex.</li><li>Select indicator type: URL.</li></ul> |
| Specific URL | Excludes a specific URL, but the domain and subdomains are still extracted. | <ul><li>Value: The specific URL. Example: http://examplesub.example.com/myexample</li><li>Do NOT select Use Regex.</li><li>Select indicator type: URL.</li></ul> |
| URLs, domain, and subdomains, case-insensitive, anchored to start | Excludes domain example.com, its subdomains, and its URLs. Case-insensitive. Anchors regex match to the start of the indicator value, so indicators that contain but do not start with a match (e.g., example.net?param=example.com) are not excluded. | <ul><li>Value: Domain, subdomains and URLs, case insensitive and anchored to the start of the indicator. Example: (?i)^(https?://)?(([a-zA-Z0-9-]+.)+)?example.com</li><li>Select Use Regex.</li><li>Select indicator types: URL, Domain.</li></ul> |
| All URLs | Excludes all URLs for a specific domain that have a path (even an empty path), but the domain and subdomains are still extracted. | <ul><li>Value: URLs with or without a path. Example: example.com/</li><li>Select Use Regex.</li><li>Do not select any indicator types.</li></ul> |
Attack surface management
Notice
Included in Cortex XSIAM Premium. For any other XSIAM license, the ASM add-on is required.
get-started-with-attack-surface-management
attack-surface-management-detections
deploy-asm-and-exposure-management-enrichment-and-remediation-automation
Learn about Attack Surface Management
Before you get started with Cortex XSIAM Attack Surface Management, review the topics in this section to better understand what attack surface management is, what the key use cases are, and how it works.
What is attack surface management?
The ASM add-on module for Cortex XSIAM brings industry-leading Attack Surface Management (ASM) capabilities to the XSIAM platform. ASM helps you discover and manage your public attack surface, providing visibility into all of your digital assets, including on-prem and cloud. With Attack Surface Management, you can identify and remediate vulnerabilities, enforce compliance policies, and reduce the risk of cyberattacks.
ASM data and insights are viewable and actionable in several different places in the Cortex XSIAMinterface.
- External Surface Assets—In the Inventory, Cortex XSIAM provides a searchable, filterable view of all the external internet-facing assets that have been attributed to your organization, including certificates, domains, services, and websites.
- Dashboards & Reports—Cortex XSIAM provides out-of-the-box and customizable dashboards and reports on the current and historical state of your organization's inventory, services, and issues. This reporting delivers insight into trends and helps leaders identify key topics and business units to focus on to improve the security posture of the organization.
- Cases & Issues—Cortex XSIAM generates issues based on a flexible attack surface rules engine that identifies security and configuration risks within your organization's assets and services, and provides a workflow in which analysts can investigate, prioritize, track efforts to remediate outstanding problems, and independently confirm that issues have been corrected.
- Attack Surface Management module—Cortex XSIAM provides 800+ attack surface rules and hundreds of attack surface tests to identify actionable, risky and vulnerable assets and confirm exploitability. In this location you'll also find a list of your External IP Address Ranges with key contextual information about each range.
Attack surface management use cases
Cortex XSIAM Attack Surface Management gives security and IT operations teams the visibility they need to reduce risk to the business by focusing remediation efforts on critical exposures and assets out of compliance with policy. Cortex XSIAM automatically updates your asset lists and processes, providing a single source of truth about assets that tie to your organization, including on-prem, through partners, and in cloud providers.
Use cases include the following:
- Asset discovery and inventory management: Discover all of your internet-facing assets, including cloud instances, web applications, and IoT devices, and maintain an up-to-date inventory of those assets.
- Vulnerability management: Identify and remediate vulnerabilities in your internet-facing assets, reducing the risk of cyberattacks.
- Compliance: Enforce compliance policies by identifying and tracking changes in your attack surface, ensuring that all assets are properly secured and in compliance with industry standards.
- Incident response: Gain real-time insights into security incidents, so you can quickly respond to and mitigate potential threats.
- Certificate hygiene: Manage your SSL/TLS certificates by identifying expiring or vulnerable certificates and providing automated workflows to renew or replace them.
- DNS hygiene: Monitor your DNS records and ensure that they are properly configured, reducing the risk of DNS-related attacks.
- Mergers and acquisitions: Assess the security risks and identify potential vulnerabilities associated with mergers and acquisitions through visibility into the target company's internet-facing assets.
Network mapping
Attack Surface Management (ASM) in Cortex XSIAM discovers and intelligently attributes assets to organizations, helping you discover and protect previously unknown internet-connected systems. Through this network mapping process, you will understand your organization's true public-facing network perimeter.
Asset discovery and attribution
Cortex XSIAM uses a variety of methods to discover and attribute internet-facing assets to your organization. These methods include:
- IP Registration—An IP range’s registry information mentions information about your organization. Cortex XSIAM pulls from all regional internet registry databases, including ARIN, RIPE, APNIC, LACNIC, and AFRINIC. Registry information in your Cortex XSIAM instance is updated approximately biweekly.
- ASN Advertisement—An autonomous system number (ASN) assigned to you advertises your IP range as a BGP prefix.
- Domain Registration—Domain registry information mentions information about your organization. Cortex XSIAM pulls Whois registration information and updates it in your Cortex XSIAM instance approximately biweekly.
- Certificate—An IP range advertised one of your certificates.
- DNS—A DNS record points to an IP in your IP range. Cortex XSIAM gets its domains and DNS data from a combination of active and passive global collection techniques.
- Self-Provided—The asset was on an IP address list provided by your organization or was attributed by Cortex XSIAM for a reason other than those listed above.
Human-in-the-loop
An expert analyst oversees a human-in-the-loop system which leverages our proprietary AI models to produce network maps of the highest confidence and completeness.
Your Internet-facing assets are always under attack from targeted and opportunistic attackers. Without a continuously updated, accurate inventory of those assets, you leave unknown or unmonitored assets exposed to threats. Cortex XSIAM discovers and helps remediate any exposures on those assets.
A primary advantage of Cortex XSIAM is combining leading-edge automated network mapping analysis with expert insights and validation. Cortex XSIAM experts understand the intricacies and idiosyncrasies of asset scanning and attribution. The end-result for Cortex XSIAM customers is fewer false positives and development of naming schemas and patterns that lead to broader asset discovery than what you see with fully automated scanning engines alone.
Does Cortex XSIAM include assets for vendors, partners, and subsidiaries?
Standard contracts for the ASM Module for Cortex XSIAM include mapping and reporting on your core company's attack surface as well as named subsidiaries. Depending on the contract, or an additional statement of work, we can map and report on additional vendors, partners, or acquisitions. Contact your customer success manager for more information.
Scanning
Attack Surface Management (ASM) in Cortex XSIAM uses data collected from global internet scans as well open-source intelligence about the internet to maintain a complete inventory of all the internet-facing assets that belong to an organization. The following topics describe the scans that Cortex XSIAM uses to map and monitor your attack surface.
Scanning cadences
Cortex XSIAM scans the internet to discover new services at varying cadences depending on several factors such as port, protocol, cloud provider ranges, and customer-attributed assets. All responsive services are monitored regularly.
Below is a list of our targeted scanning cadences:
- Discovery Scans
- Global Base— twice per week discovery of approximately 250 of the most common ports on all IPv4 space.
- Global Extended—low background rate discovery of the remaining 65k ports, excluding those covered in KAM base and KAM extended.
- KAM (Known Assets Monitoring) Base—daily discovery of approximately 300 of the most common ports on customer-attributed assets.
- KAM Extended—weekly discovery of approximately 2800 of the most common ports on customer-attributed assets. These do not overlap with KAM Base.
- Monitoring Scans
- Daily on all responsive services.
- Attack Surface Testing Scans
- Daily on configured services.
Known Assets Monitoring
Cortex XSIAM performs global scans twice a week on a limited set of ports by default. For customers who opt in, Cortex XSIAMperforms targeted scanning of known assets daily. Known Assets Monitoring (KAM) brings three significant benefits to the data delivered by Cortex XSIAM:
- Additional ports and protocols
- Port/protocol pairs not included in global scans, including port 25/SMTP, 500/UDP
- SMB version enumeration
- TLS/SSL scanning
- Determination of supported cipher suites and protocol versions for TLS/SSL services
- Frequent scanning and data delivery
- Faster data delivery for reduced time to notification of new exposures
Opting in to Known Assets Monitoring
Note the following prerequisites for Known Assets Monitoring (KAM):
- KAM uses more exhaustive payloads than global scans, so we recommend validating your network before opting in. KAM will be turned on once we have consent from the network owner that all identified ranges have been validated.
- We recommend verifying that KAM source IP addresses are not blocked on your automated intrusion prevention system (IPS), intrusion detection system (IDS), or firewalls and that anti-scanning and DDoS rules do not apply to these specific IP ranges.
- Cortex XSIAM scans your external attack surface only, so we do not need any access inside your network.
- The amount of traffic you receive from our scanners depends on the KAM configuration (basic or extended) and the total amount of IP space owned by your organization.
- Contact your Customer Success Team to learn more and opt in to KAM.
Scanning ports and protocols
Cortex XSIAM detects protocol-validated services on the IPv4 and IPv6 space of the internet through a series of specialized payloads that target specific port-protocol pairs. Following are examples of some of the protocols and ports on which Cortex XSIAM checks for active services throughout a standard global scan.
Note
The following lists are not exhaustive. For current and complete lists, contact your customer success team.
- Sample protocols: SSL, FTS, SSH, Telnet, HTTP, POP3, RDP, FTP, XMPP, Postgres, VNC, UDP, etc
- Sample Ports: 0, 20, 21, 22, 23, 25, 53, 67, 68, 80, 81, 82, 83, 88, 110, 111, 118, 123, 135, 137, 138, 139, 143, 161, 179, 389, 401, 443, 444, 445, 465, 500, 502, 554, 587, 593, 808, 873, 888, 943, 987, 990, 993, 995, 1000, 1024, 1025, 1026, 1028, 1112, 1234, 1250, 1433, 1434, 1443, 1521, 1717, 1723, 1900, 1911, 2001, 2002, 2078, 2080, 2082, 2083, 2084, 2085, 2086, 2087, 2096, 2121, 2160, 2161, 2222, 2323, 2443, 2483, 2484, 2525, 3000, 3052, 3306, 3333, 3388, 3389, 3390, 3443, 3493, 3905, 3909, 3917, 3929, 3975, 3978, 4002, 4100, 4117, 4172, 4343, 4430, 4433, 4443, 4444, 4500, 4506, 4567, 4786, 4911, 5000, 5001, 5060, 5061, 5222, 5269, 5351, 5353, 5432, 5443, 5555, 5632, 5800, 5900, 5901, 5902, 5903, 5904, 5905, 5906, 5907, 5908, 5909, 5910, 5916, 5984, 5985, 5986, 6001, 6002, 6363, 6379, 6443, 7001, 7080, 7170, 7443, 7547, 7777, 8000, 8005, 8008, 8009, 8010, 8015, 8020, 8080, 8081, 8082, 8083, 8085, 8088, 8090, 8094, 8139, 8140, 8159, 8194, 8195, 8196, 8197, 8198, 8209, 8210, 8211, 8212, 8213, 8214, 8215, 8216, 8217, 8218, 8219, 8220, 8282, 8290, 8291, 8292, 8293, 8294, 8333, 8443, 8444, 8530, 8531, 8800, 8880, 8887, 8888, 8899, 8991, 8999, 9000, 9002, 9042, 9080, 9091, 9092, 9100, 9200, 9418, 9443, 9444, 9595, 9983, 9997, 10000, 10010, 10443, 11211, 11495, 11553, 12345, 16010, 17185, 17516, 17778, 18080, 18574, 20249, 21242, 22460, 25789, 25827, 27017, 28080, 30005, 30006, 30010, 30083, 30303, 32400, 37443, 37777, 38080, 38520, 40000, 40005, 42713, 44344, 44818, 47001, 47693, 47808, 49501, 49502, 50001, 50067, 50070, 50580, 50805, 50995, 50996, 50997, 51005, 51007, 51200, 51401, 52200, 52311, 52590, 52869, 53300, 53524, 53631, 54041, 54498, 54528, 55918, 56222, 58000, 58603, 60000, 60243, 60443, 61337, 62078
Scanning activity
Cortex Xpanse at Palo Alto Networks takes an outside-in approach to network security and asset management. We continuously scan the global internet to monitor our customers' internet-facing attack surface and discover emerging threats.
Our scanning activity on the ranges below is CFAA-compliant. You can mark our ranges as non-malicious in your system so that you stop getting alerts, or configure your firewall to drop traffic from our ranges.
35.203.210.0/23 144.86.173.0/24 147.185.132.0/23 162.216.149.0/24 162.216.150.0/24 172.105.147.0/24 198.235.24.0/24 205.210.31.0/24 216.25.88.0/21 2604:a940:300:5b6:0:0:0:0/64 2604:a940:301:225:0:0:0:0/64 2604:a940:302:118:0:0:0:0/64
If you believe you have discovered abuse associated with Cortex Xpanse scans, please contact us at scaninfo@paloaltonetworks.com.
GeoIP data collection
Attack Surface Management (ASM) in Cortex XSIAM geoIP data collection enables you to confirm that your actual network distribution is consistent with what you believe your global footprint to be. GeoIP data is especially important for security organizations to identify compliance violations, such as data residing in restricted locations, and to drive efficient remediations where customers leverage geoIP data to determine infrastructure location, who owns the asset, and where to route notifications.
Attack Surface Management detections
The Attack Surface Management module creates findings and issues based on the types of detections described in the following sections:
Attack surface rules
An attack surface rule is a definition managed by Cortex XSIAM that identifies risks on a customer's attack surface. Attack Surface Rules match on ASM global scan results to detect exposed or misconfigured customer-owned assets. When an attack surface rule is enabled, Cortex XSIAM will generate findings as well as issues for observations that match that rule.
To view attack surface rules, navigate to Modules → Attack Surface → Policies → Attack Surface Rules.
The following table describes each field in the Attack Surface Rules table.
| Field | Description |
|---|---|
| ASM Alert Categories | A categorization done by the Cortex XSIAM security research team often with input from customers or in reference to published materials such the the BOD-22-01 or BOD-23-02 from CISA. |
| Description | Description of what the attack surface rule is looking for. |
| Estimated Alert Count | Estimated number of alerts that Xpanse will create if this attack surface rule is enabled. |
| Has Remediation Rule | Indicates whether a remediation path rule has been created for this attack surface rule. Applies only to systems with the Active Response addon module. |
| Modified | Date of the most recent update to the attack surface rule. |
| Remediation Guidance | Guidance on how to remediate or mitigate the alerts created by this attack surface rule. |
| Rule ID | ID for this attack surface rule. |
| Rule Name | Name of the attack surface rule. |
| Severity | Severity of the risk identified by the attack surface rule. Issues are created with the same severity as the attack surface rule that triggered them. See Default attack surface rule severity for default severity settings. |
| Status | Enabled or Disabled. An enabled attack surface rule creates an issue when it detects an instance of that rule. See Default attack surface rule enablement status for details about the default enablement status. |
Manage attack surface rules
On the Attack Surface Rules page you can enable or disable rules and change the severity to align with your organization’s specific needs and priorities.
- Navigate to Modules → Attack Surface → Policies → Attack Surface Rules.
- Select one or more rules and right-click to perform one of the following actions:
- Enable or Disable the rule—Some rules are enabled by default, but many are designed to be opt-in.
- Change the default Severity of the rule—All attack surface rules have a predefined default Severity setting of Low, Medium, or High. Critical is never a predefined default, but you can set it as the default.
When you first enable an attack surface rule, you can expect to see new findings within 24 hours if any instances of that rule are detected on your attack surface. When you disable an attack surface rule, Cortex XSIAM will stop creating new issues for that rule, but any existing open issues will remain open until you change the status.
Default attack surface rule severity
The Cortex security research team determines the default severity setting for an attack surface rule based on a number of details. We may adjust the default severity when new threat information becomes available. Changes to the default severity will never override any changes you make to a rule’s severity.
| Default Severity | Description |
|---|---|
| Critical | None of the attack surface rules are rated as Critical by default. This severity is reserved for customers to elevate the attack surface rules or individual issues they deem critical for their organization. |
| High | High severity rules identify risks that most organizations would consider important to remediate in a timely manner. This primarily includes known insecure versions of software with published high or critical severity CVEs and external services that are inherently risky to expose directly on the internet. For example:
|
| Medium | Medium severity rules identify risks that we believe some organizations would consider important to remediate, but may not be important to everyone. For example:
|
| Low | Low severity rules are unlikely to be consequential to most organizations. These include the following types of risks:
|
Default attack surface rule enablement status
Attack surface rules are enabled or disabled by default. You can change the enablement status for a rule or set of rules at any time.
If a rule is made available to only a select set of customers (typically due to customer request), we will set the rule to enabled by default, regardless of the severity.
In general, most attack surface rules are disabled by default. This approach ensures that customers stay in control of their overall risk assessment. We encourage you to routinely review the attack surface rules and Enable them so they begin generating issues.
The internal Cortex decision to enable a rule by default weighs the likelihood of generating numerous issues that may not be relevant to all customers versus the risk of a customer missing something important to them.
Attack surface rule deprecation
Cortex XSIAM is committed to providing the most accurate attack surface rules. Our security research team continuously reviews and refines the attack surface rules to ensure that our rules effectively reflect the evolving threat landscape and new technologies. When a rule is marked as "deprecated" in Cortex XSIAM, it signifies that the rule is no longer recommended for active use by customers and is slated for eventual removal from the platform. A deprecated rule will continue to function for a transitional period, but deprecation indicates an important update in our recommended best practices and upcoming rule enhancements.
Attack Surface Testing
Note
Requires the ASM add-on.
Attack Surface Testing confirms vulnerabilities and misconfigurations on your external attack surface, enabling you to quickly and confidently prioritize risks. With your approval, Cortex XSIAM runs daily, controlled exploits against externally facing assets to confirm the presence or absence of vulnerabilities, eliminating the need to manually verify every inferred CVE. Issues are created for positive attack surface test results, so you can address these vulnerabilities as part of your existing remediation workflows.
Attack surface tests
Cortex XSIAM has an extensive set of attack surface tests for CVEs and other risks that affect externally-facing services and can be confirmed with controlled testing. Our attack surface testing is layered on top of our existing attack surface management (ASM) global scanning infrastructure, which distributes requests across a broad time range to minimize the impact to scanned and tested services.
We perform external scans only, which means we only test directly-discovered services accessible from the public internet and that you selected for testing. To further decrease test load and the possibility of impacting a service, we map attack surface tests to service classifications, enabling us to run tests only on the relevant services in your approved set of targets. For example, we only run Apache attack surface tests against your Apache services.
Note
Attack surface testing scans are typically not CFAA compliant, meaning that they may attempt more extensive fuzzing to confirm or deny the presence of a CVE. Additionally, some attack surface tests are more intrusive than others. Tests are labeled with the level of intrusiveness, so you can decide whether to run more intrusive tests.
New attack surface tests are added at the discretion of the Cortex XSIAM Security Research Team when new vulnerabilities are announced.
Attack surface tests for default credentials
Attack Surface Testing does not perform authenticated tests; however, we do have attack surface tests focused on the detection of applications that are using manufacturer default credentials. These attack surface tests attempt to log in to specific business operations systems, IT, and networking devices with default credentials, but don't perform any operations if login is successful and will never change the state or configuration of a tested service.
You can identify attack surface tests for default credentials by looking at the test Name field, which typically includes Default Credentials , and the Vulnerability ID field, which uses the prefix DEFAULT-CRED-.
Attack Surface Testing intrusivity
Attack surface tests are classified by their level of intrusivity. While most tests are benign, some vulnerabilities require more intrusive methods for confirmation. You can choose whether to enable these more intrusive tests, with the various levels of intrusiveness described in the table below.
| Intrusivity level | Description | Examples |
|---|---|---|
| Level 0: Non-intrusive | No interaction with the target system beyond passive information gathering. The system remains completely unaffected by any tests. | <ul><li>Default credential login tests</li><li>Basic HTTP GET / POST requests</li></ul> |
| Level 1: Minimal interaction | Basic interactions that involve standard requests without altering the system state or data. Any changes are confined to volatile memory and do not persist. | <ul><li>Dropping a small, benign file in a temporary directory, such as /tmp, that the system deletes on reboot.</li></ul> |
| Level 2: Temporary modification | Makes temporary and fully reversible changes to the system. Modifications do not impact normal operations and can be undone without lasting effects. Cleanup is not necessary, but can be done. | <ul><li>Dropping files with benign content in non-temporary directories and that can be removed afterward</li><li>Modifying service configurations that revert after a restart</li><li>Creating a temporary database user that is deleted upon restart</li></ul> |
| Level 3: Reversible changes | Introduces changes that persist but can be reversed with your actions. These changes may slightly impact normal operations, but are recoverable. | <ul><li>Dropping a file containing controlled code that is removed afterward</li><li>Modifying application data (such as UI elements or database entries) that can be corrected</li><li>Executing commands that alter system state but can be undone</li></ul> |
| Level 4: Significant impact | Makes significant changes that are not easily reversible. These actions may disrupt services or alter system data. | <ul><li>Injecting data into a database that cannot be fully removed</li><li>Causing temporary service unavailability (for example, a brief Denial of Service lasting a few seconds)</li><li>Creating users or projects within the application that cannot be deleted</li></ul> |
| Level 5: Full compromise | Actions that fully compromise the system, leading to irreversible damage, persistent backdoors, or extensive disruption. | <ul><li>Executing commands that install persistent backdoors or webshells that cannot be removed</li><li>Modifying critical system files or settings leading to system instability</li><li>Performing Denial of Service attacks that render services completely unavailable</li></ul> |
Set up Attack Surface Testing
To set up Attack Surface Testing for the first time, complete the following tasks:
- Task 1: Verify that you have edit permission for Vulnerability Testing
- Task 2: Accept the End-User Licensing Agreement (EULA)
- Task 3: Select targets for attack surface testing
- Task 4: Configure the default enablement of new attack surface tests
Task 1: Verify that you have edit permission for Vulnerability Testing
To set up Attack Surface Testing, you must have a role that includes edit permission for Vulnerability Testing. To check your role-based permissions go to Settings → Configurations → Access Management → Roles, and select the role. Select the Components tab, and find Vulnerability Testing under Attack Surface.
Task 2: Accept the End-User Licensing Agreement (EULA)
The EULA gives Cortex XSIAM permission to conduct attack surface testing scans. You only need to accept the EULA once. After accepting the EULA the Vulnerability Testing Configuration page opens automatically so you can select the targets for testing.
You only need to accept the EULA once, before you enable attack surface testing for the first time.
- Navigate to Modules → Attack Surface → Policies → Attack Surface Tests.
- On the Welcome to Vulnerability Testing page, click Next.
- Read the End-User Licensing Agreement and click Accept Terms.
After accepting the terms of the EULA, the Vulnerability Testing Configuration page opens and you can select the set of services to be tested.
Task 3: Select targets for attack surface testing
Attack surface testing targets are directly-discovered services, which are definitively associated with an asset that belongs to your organization. You can choose to run attack surface tests on all your relevant directly-discovered services or you can specify a subset of services.
Specify the directly-discovered services upon which Cortex XSIAM will run attack surface tests. After the initial set-up, you can update this set of targets anytime.
- Navigate to Settings → Configurations → Attack Surface → Attack Surface Testing.
-
To select specific targets, in the Target Testing section, make sure the toggle is set to Selected Targets, and click Edit Targets (or Add Targets if this is the first time you are selecting targets.)
To select all the targets, set the toggle to All Targets. This overrides your target selection.
- Use the filter to define a set of targets from your list of services.
- Click Save Targets.
Task 4: Configure the default enablement of new attack surface tests
When you first enable Attack Surface Testing, all existing attack surface tests with intrusiveness level 0 or level 1 are enabled by default. Moving forward, all new tests that are introduced, for all intrusiveness levels, are disabled by default. To configure Cortex XSIAM to automatically enable new attack surface tests and to specify the intrusiveness level of those default tests, perform the steps below. After the initial set-up, you can update this set of defaults anytime.
- Navigate to Settings → Configurations → Attack Surface → Attack Surface Testing.
-
In the Default Attack Surface Test Enablement section, select the intrusiveness level for the new tests you want to be enabled by default moving forward.
The intrusiveness level you select will include the tests for the levels below it. For example, if you select Level 2, then new level 0, level 1, and level 2 tests will be enabled moving forward.
After you complete the initial set-up tasks, Cortex XSIAM begins daily attack surface testing scans using the default set of attack surface tests. The default set of tests consists of existing tests with level 0 and level 1 intrusiveness levels.
You can now view details about attack surface tests and enable or disable them and view issues that were triggered by positive attack surface testing scans.
Manage attack surface tests
View information about the available attack surface tests, and enable or disable tests on the Vulnerability Testing page. By default all tests are enabled.
- Navigate to Modules → Attack Surface → Policies → Attack Surface Tests.
- Filter and sort the list of tests as needed to identify the tests you want to enable or disable.
- Select one or more tests using the check boxes, and right click to Enable or Disable them.
Attack surface test field descriptions
| Field | Description |
|---|---|
| Affected Software | Software names and versions impacted by this vulnerability. |
| CWE IDs | Common Weakness Enumeration ID as defined by MITRE. |
| Created | When Cortex XSIAM released this test. |
| EPSS Score Description | The Exploit Prediction Scoring System (EPSS) score indicates the likelihood that a vulnerability will be exploited in the wild. Possible values are 0 -100%.the higher the score, the greater the probability that a vulnerability will be exploited. |
| References | Research references and supporting documentation. |
| Remediation Guidance | Recommended steps for remediating or mitigating the vulnerability. |
| Severity Score | The CVE severity score is based on the NIST Common Vulnerability Scoring System (CVSS). |
| Services Found Vulnerable | The number of directly-discovered services owned by your organization that Cortex XSIAM has confirmed vulnerable with this test. |
| Status | Indicates whether the test is Enabled or Disabled. |
| Vendor Names | Name of the vendor whose product is impacted by the vulnerability. |
| Vulnerability IDs | CVE number or other public identifier for the vulnerability. |
View issues created from Attack Surface Testing results
Cortex XSIAM creates issues for confirmed positive attack surface test results, for both vulnerabilities and misconfigurations. To view those issues and attack surface testing details, perform the following steps.
- Navigate to Modules → Attack Surface → Attack Surface Issues.
- Filter the issues list with Finding Sources = Cortex Attack Surface Testing.
- To view AST scan details, click on an issue, and then select the Overview tab of the issue details panel. The AST scan details appear in the Attack Surface Testing section.
Source IP addresses for Attack Surface Testing scans
To view the IP address range Cortex XSIAM uses for vulnerability tests, navigate to Settings → Configurations → Attack Surface → Attack Surface Testing and refer to the Source IP Addresses section. We recommend adding this range to your organization's security tooling allow lists to avoid unnecessary alerting; however, we do not recommend modifying the configuration of your perimeter security controls to allow this traffic to pass. The aim of Attack Surface Testing is to confirm the exploitability of vulnerabilities from an attacker perspective.
Externally inferred CVEs
Cortex XSIAM identifies externally inferred CVEs by comparing the product name and version of an active service, if identifiable, with CVEs for those products in the National Vulnerability Database (NVD). We categorize externally inferred CVE matches as high or medium confidence based on the version information that is available on the service and from NVD.
- High Confidence Match—Precise version information is available both from the service and from NVD. Cortex XSIAM generates issues for high-confidence externally inferred CVEs.
- Medium Confidence Match—Part of the version information from the service matches the NVD entry for the CVE, but the version information from the service or from NVD has additional characters. Cortex XSIAM creates findings for medium-confidence externally inferred CVEs but will not generate issues.
Note
An externally inferred CVE might impact your service or asset, but additional investigation is required to confirm that the CVE is actually present.
The following table provides examples of externally inferred CVE matches.
| Service information available from ASM scan | CVE information available from NVD | Match result | Details |
|---|---|---|---|
| Apache v 2.4.49 | CVE-2021-41773Affects cpe:2.3:a:apache:http_server:2.4.49:*:*:*:*:*:*:* | High Confidence Match | Because the CPE information from NVD matches the version of Apache indicated from the scan, this is a high confidence match. |
| Apache v 2.4.49c | CVE-2021-41773Affects cpe:2.3:a:apache:http_server:2.4.49:*:*:*:*:*:*:* | Medium Confidence Match | Because the version numbers from the service and the NVD information match, except for the additional character in the version from the service, this is a medium confidence match. |
| Apache v 2.4.50 | CVE-2021-41773Affects cpe:2.3:a:apache:http_server:2.4.49:*:*:*:*:*:*:* | No Match | Because the CPE information from NVD indicates a version of Apache that is different than the one we saw in the scan, this does not match. |
| Apache v 2.4.50 (Running on Red Hat Enterprise Linux 6 (RHEL6), which is not affected by this CVE) | CVE-2022-22719Affects cpe:2.3:a:apache:http_server:*:*:*:*:*:*:*:* (up to and including 2.4.52) | High Confidence Match | Because the CPE information from NVD matches the version of apache indicated from the scan, this is a high confidence match. Cortex XSIAM cannot determine if mitigating controls are in place or the underlying OS, so this pairing will still generate a high confidence match. |
| Apache (any version number) | CVE-2012-3526Affects cpe:2.3:a:apache:http_server:*:*:*:*:*:*:*:* | No match | Because this CVE does not indicate any specific version number, we do not consider it a match for any version of Apache http_server, regardless of version information. |
Digital Risk Protection
Organizations face significant challenges in safeguarding their brand and digital assets from threats such as credential theft and brand impersonation. Using our comprehensive asset inventory, along with embedded intelligence and automation, Cortex XSIAM Digital Risk Protection discovers and helps you mitigate the following risks:
-
Brand risk domains
Brand risk domains pose a threat to organizations because they can be used by threat actors to deceive customers, partners, or employees by impersonating a legitimate brand or application. These domains can be used for phishing attacks, spreading malware, launching social engineering campaigns, or other fraudulent activities. Additionally, malicious brand risk domains can also be used to steal sensitive information such as login credentials, financial data, or intellectual property.
-
Leaked credentials
Leaked Credentials pose a risk to organizations by providing unauthorized access to sensitive systems and data, leading to data breaches, financial losses, and reputation damage.
Cortex XSIAM focuses on externally reported credential leaks, specifically surfacing those that have occurred within the last six months.
How to enable Digital Risk Protection
Digital Risk Protection is disabled by default. You can enable it by enabling the Brand Risk Domains and Brand Risk Leaked Credentials attack surface rules. When enabled, these rules generate issues that include brand risk domain and leaked credential information on the issue details panel.
- Navigate to Modules → Attack Surface → Policies → Attack Surface Rules.
-
Filter the list of attack surface rules by ASM Issue Categories = Brand Protection.
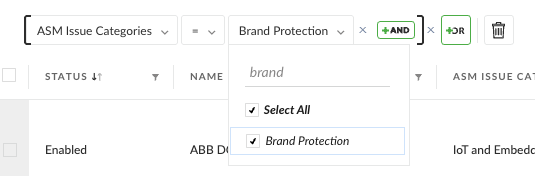
- Select either or both rules, right-click and select Enable.
Note
Both of these attack surface rules are based on the attributed domain assets that appear in the asset inventory. If there are no attributed domains in your inventory, Cortex XSIAM will not generate Digital Risk Protection findings and issues.
Attack surface assets
The internet-facing assets that were discovered in an attack surface management (ASM) scan and attributed to your organization are available in the inventory on the Inventory → Assets → All Assets → External Surface pages. For information about External Surface assets, including domains, certificates, services, and websites, see External Surface assets.
To view your external IP address ranges in the inventory, navigate to Inventory → Assets → Network Configuration → IP Address Ranges → External IP Address Ranges. For information about external IP address ranges, see Configure your network parameters.
Upload or remove ASM assets
In Cortex XSIAM, you can upload assets or remove assets from your inventory through the UI. This feature simplifies inventory management by enabling you to make ad hoc inventory updates yourself as needed. To make large-scale scope changes to your inventory (for example, a merger with a new organization), contact your Customer Success Architect for assistance.
Note
You must have the Instance Administrator role to upload or remove assets.
Upload assets
You can add assets to your inventory by submitting an asset upload request, in the form of a CSV file, through the Cortex XSIAM UI. After submitting an asset upload request, the requested assets will appear in the Asset Uploads/Removal table with the status Pending Review. Cortex XSIAM will respond to your upload request within five days of submission. The status of each asset will be updated in the Asset Uploads/Removal table to either Accepted, which indicates that the asset has been added to your inventory, or Rejected. Rejected assets will have an explanation for the rejection.
Guidelines and restrictions for asset uploads
Before you submit an asset upload request, familiarize yourself with the following guidelines and restrictions:
- You can upload domains (paid-level domains and subdomains) and IPv4 ranges. You can upload a single IPv4 address, but it must be submitted as an IPv4 range asset type. Upload of certificates and IPv6 ranges is not yet supported.
- An asset upload request can include up to 500 assets.
- The asset upload request must follow the CSV formatting requirements described in the CSV format for upload requests section.
- You cannot upload an asset that was added or rejected in a previous upload request. This will cause an error that must be fixed before you can submit the upload request.
- You cannot upload an asset that was previously removed in an asset removal request. Instead, you can undo an asset removal request, which will result in the asset being added back to your inventory. See Remove assets for details.
Note
If an asset upload request has an invalid CSV or includes one or more invalid assets, the entire request will fail, and none of the assets will be uploaded. If this happens, Cortex XSIAM will display an error message indicating what caused the error, so you can fix the problem and resubmit if you choose.
How to submit an asset upload request
- Create and save a CSV file that lists the assets you want to add to your inventory. It is important to format the CSV file correctly, or the upload might fail. Refer to CSV format for upload requests for an example and details about upload request CSV file formatting.
- Navigate to Settings → Configurations → Asset Management → Asset Uploads/Removals.
- Click the Asset Upload/Removal button and select Add Asset(s).
-
Drag and drop or browse to your CSV file to upload it to Cortex XSIAM.
The assets will be added to the Asset Uploads/Removals table with the status Pending,
-
Check the status of your asset upload request as needed on the Asset Uploads/Removals page.
Within five days of submitting your request, each asset will be Accepted and added to the inventory or Rejected. Assets that were rejected will include an explanation in the Decision Reason field.
CSV format for upload requests
An asset upload request is a CSV file that lists the assets you want to add along with the asset types and business units they will be assigned to. It is important to format the CSV file to match the following requirements. Incorrect formatting or typos may cause the upload to fail.
Upload request example
This example shows the correct CSV format for an asset upload request, including the supported values for asset types and supported IP range notation. The headers in your CSV must match the headers shown here.
| BusinessUnits | AssetType | Asset |
|---|---|---|
| BU1, BU2 | Domain | example.com |
| BU3 | Domain | example1.com |
| BU1 | IP_Range | 192.0.2.0/32 |
| BU2 | IP_Range | 192.0.2.0-192.0.2.0 |
| BU1, BU3 | IP_Range | 192.0.2.0-192.0.2.24 |
| BU2, BU3 | IP_Range | 192.0.2.0/27 |
Upload request CSV details
The following table provides details about each field that is required in an asset upload request CSV file.
| Field | Details |
|---|---|
| Business Units | <p>This is the business unit you want to assign to the asset upon upload.</p><p>The header for this field must be written as BusinessUnits.</p><p>The business units in your CSV must already exist in Cortex XSIAM and must use the exact same spelling and capitalization.</p><p>If you aren't sure which business units are available in your tenant, follow these steps to download the complete list of business units:</p><p>1. Go to Settings → Configurations → Asset Management → Asset Uploads/Removals.</p><p>2. In the upper righthand corner, click the Asset Upload/Removal button and select Asset Upload.</p><p>3. In the Add List of Assets dialog box, click on Business Unit Directory to download the list of business units.</p> |
| Asset Type | <p>The header for this field must be written as AssetType.</p><p>Supported values are Domain and IP_Range.</p> |
| Asset | <p>This is the specific domain or IPv4 range you want to add to your inventory.</p><p>The header for this field must be written as Asset.</p><p>IP ranges can be specified using the following types of notation:</p><ul><li>CIDR notation</li><li><First IP address>-<Last IP address></li></ul><p>Individual IP addresses can be specified using the following notation:</p><ul><li>192.0.2.0/32</li><li>192.0.2.0-192.0.2.0</li></ul> |
Rejection reasons for upload requests
After submitting an upload request, Cortex XSIAM will accept or reject each individual asset. Rejected assets will indicate the reason for the rejection in the Decision Reason column of the Asset Uploads/Removal table. Rejection reasons include the following:
- The asset you uploaded shows registration information that is attributable to an unrelated organization.
- The asset you uploaded is currently for sale.
- The asset you uploaded is a cloud IP address or the asset you uploaded is a cloud or reserved internal IANA IP address. We do not add these asset types to customer maps.
- The asset you uploaded contains your customer’s content. Cortex XSIAM focuses on corporate infrastructure for our telecommunications, ISPs, and other customer leasing organizations.
Remove assets
You can remove assets from your inventory by submitting an asset removal request, in the form of a CSV file, through the Cortex XSIAM UI. After you've submitted an asset removal request, the requested assets appear in the Asset Uploads/Removal table with the status Removed. Within 24 hours of submitting the request, Cortex XSIAM will remove the assets from the inventory and remove associated alerts, incidents, and services,
Guidelines and restrictions for asset removals
Before you submit an asset removal request, familiarize yourself with the following guidelines and restrictions:
- You can remove domains (paid-level domains and subdomains), certificates, and IPv4 ranges. Removal of IPv6 ranges is not supported.
- The asset removal request CSV file must be less than 2 MB.
- You cannot remove an asset that was uploaded in a previous upload request. This will cause an error that must be fixed before you can submit the upload request.
- When you remove a paid-level domain, related subdomains are also removed.
- When you remove an IPv4 range, the individual IPv4 addresses in that range are also removed.
- You can undo a removal request, which will result in the asset being added back to your inventory. See Undo an asset removal for more information.
- Removing assets will not result in a reduction to your contract price. Contract pricing will be reevaluated at the time of contract renewal.
Note
If an asset removal request has an incorrectly formatted CSV or includes one or more invalid assets, the entire request will fail, and none of the assets will be removed. If this happens, Cortex XSIAM will display an error message indicating what caused the error, so you can fix the problem and resubmit if you choose.
How to submit an asset removal request
An asset removal request is a CSV file that lists all the assets you want to remove from your inventory. It is important that the data and formatting of the CSV file are correct, or the entire request might be rejected.
- Create and save a CSV file that lists the assets you want to remove from your inventory. Be sure to provide the correct asset information and follow the formatting requirements described in CSV format for removal requests.
- Navigate to Settings → Configurations → Asset Management → Asset Uploads/Removals.
- Click on the Asset Upload/Removal button and select Remove Asset(s).
-
Drag and drop or browse to your CSV file to upload it to Cortex XSIAM.
As soon as the file has been successfully uploaded, the assets will appear in the Asset Uploads/Removals table with the status Removed. Within 24 hours, the assets will be removed from the inventory and related incidents, alerts, and services will also be removed.
CSV format for asset removal requests
An asset removal request is a CSV file that lists the assets you want to remove from the inventory. It is important to format the CSV file to match the following requirements. Incorrect formatting or typos may cause the upload to fail.
Remove request example
This example shows the correct CSV format for an asset removal request, including the supported asset types and IP range notation. The headers in your CSV must match the headers shown here.
| AssetType | Asset |
|---|---|
| Domain | example.com |
| Domain | example1.com |
| IP_Range | 192.0.2.0/32 |
| IP_Range | 192.0.2.0-192.0.2.0 |
| IP_Range | 192.0.2.0-192.0.24 |
| IP_Range | 192.0.2.0/27 |
Remove request CSV details
The following table provides details about each field that is required in an asset removal request CSV file.
| Field | Details |
|---|---|
| Asset Type | <p>The header for this field must be written as AssetType.</p><p>Supported values are Domain, IP_Range, and Certificate. Use the IP_Range asset type to remove individual IP addresses.</p> |
| Asset | <p>This is the specific domain, certificate, or IP range you want to add to your inventory.</p><p>IP ranges can be specified using the following types of notation:</p><ul><li>CIDR notation</li><li><First IP address>-<Last IP address></li></ul><p>Individual IP addresses can be specified using the following notation:</p><ul><li>192.0.2.0/32</li><li>192.0.2.0-192.0.2.0</li></ul> |
Undo an asset removal
There may be situations where you want to add an asset back to your inventory that was previously removed. Cortex XSIAM will not allow you to upload an asset that was previously removed, but you can undo the removal to add that asset back to the inventory.
A common use case for undoing a removal is when an IP range has been removed, but you want to add back an IP address that falls within that range. In that case you can undo the removal of the range, and then submit a new removal request for the ranges before and after the IP address that you want to add back. For example, if you removed IP range 192.0.2.0 -192.0.2.24, but then realized you need to include 192.0.2.10 in your inventory, you would:
- Undo the removal for IP range 192.0.2.0 -192.0.2.24.
- Submit a new asset removal request that includes IP ranges 192.0.2.0 - 192.0.2.9 and 192.0.2.11 - 192.0.2.24
How to undo an asset removal
- Navigate to Settings → Configurations → Asset Management → Asset Uploads/Removals.
- In the Asset Uploads/Removals table, find the asset you want to add back to the inventory. An asset must be in the Removed state to undo the removal (and add it back to the inventory).
-
Right-click the row and select Undo Asset Removal. Click Yes to confirm the removal.
After confirming the Undo Asset Removal action, the asset will no longer appear in the table.
Deploy ASM and Exposure Management enrichment and remediation automation
The Cortex Exposure Management pack enables you to automate attack surface management (ASM) and vulnerability issue enrichment and remediation. This content pack includes playbooks that streamline the remediation process by enriching issues with contextual information gathered from out-of-the-box integrations with sources like CMDBs, Cloud Service Providers, and VM solutions, and by automatically remediating some types of ASM and runtime vulnerability issues.
Note
For details and requirements regarding the enrichment information that can be collected and the specific issues that can be remediated automatically, review the Exposure Management Content Pack information in Marketplace.
Complete the tasks below to enable automated enrichment and remediation of ASM and vulnerability issues.
Task 1. Install the Cortex Exposure Management content pack
Install the Cortex Exposure Management content pack and, optionally, the related content packs.
- Navigate to Settings → Configurations → Marketplace → Browse and locate the Cortex Exposure Management content pack.
- Select the content pack and review the contents and other details.
-
Click Install to add the content pack to the Cart.
The **Cart **displays the number of items you are installing, including any additional required content packs. It also displays relevant optional content packs.
- (Optional) Select the related content packs you want to install, for example ServiceNow and AWS Enrichment and Remediation.
- Click Install.
Task 2. Add automation rules for ASM and vulnerability issue enrichment and remediation
Add the automation rules for exposure management issue remediation and enrichment. Automation rules trigger the Cortex Exposure Management playbooks to run on ASM and vulnerability issues. To learn which issues will trigger the playbooks, review the automation rules.
- Navigate to Investigation & Response → Automation → Automation Rules.
- Click View Recommendations.
- Select one or more of the Cortex Exposure Management automation rules.
- Click Add Selected Rules.
Task 3. Set up integrations
Install and configure relevant 3rd-party integrations, such as ServiceNow and AWS, to enable the Cortex Exposure Management playbooks to collect enrichment information and to automatically remediate some issues.
- Navigate to Settings → Data Sources & Integrations.
- Select the row of the integration you want to add and click Add Instance.
- Add the parameters, as required.
- Save & Exit.
See the Exposure Management Content Pack for a list of supported integrations. See Administration and troubleshooting for more detailed information about setting up integrations.
Task 4. Configure vulnerability policies
The Cortex Exposure Management playbooks run on specific types of issues. Review your vulnerability policies to make sure issues are being created for relevant vulnerability findings. For information about vulnerability policies and how to configure them, see Vulnerability policies.
Note
Cortex Exposure Management playbooks only run on issues that were created after the automation rules have been configured.
ASM enrichment of cloud assets
Attack Surface Management (ASM) enrichment of cloud assets brings ASM capabilities to cloud security posture management, providing visibility into all the assets in your cloud infrastructure that are exposed to the internet.
ASM enrichment of cloud assets includes the following capabilities:
- Discovery of unmanaged cloud services: Identify internet-exposed cloud services that are unmanaged, so you can onboard them into Cortex XSIAM for comprehensive cloud security and policy enforcement.
- Confirmation of internet exposure: ASM internet scan data is used to reinforce CNA detections to provide high-confidence detections of inadvertent internet exposure. This joint approach combines inside-out and outside-in assessments to reduce false-positives.
- Monitoring of managed and unmanaged cloud services: Gain ongoing visibility into the risks on cloud services through regular ASM scans and issues and findings for cloud-related attack surface detections.
What is unmanaged cloud?
Managed cloud—Cloud services that were discovered in an ASM scan and can be correlated with preexisting cloud assets that have been onboarded into your asset inventory. For example, if an ASM scan finds a service on AWS that is also in your cloud inventory, the asset is considered a managed cloud asset.
Unmanaged cloud—Cloud services that were discovered by an ASM scan, were attributed to you based on domain, subdomain, or TLS certificate, but cannot be correlated to the IPs or FQDNs of any onboarded cloud assets. For example, if a scan detects a service on an Azure asset that has not been onboarded into your cloud inventory, it is considered an unmanaged cloud asset.
If an ASM scan finds a service on HiNet or some other unsupported cloud provider, it is considered "not applicable" because it cannot be onboarded and converted to a managed asset.
Review your unmanaged cloud services
Review your unmanaged cloud services in your External Surface inventory. Unmanaged cloud services are cloud services that were discovered in an ASM scan and cannot be correlated with cloud assets that were previously onboarded into your inventory.
- Navigate to Inventory → Assets → All Assets → External Surface → Services.
- On the Service Inventory page, filter the list of services using the filter Partially Onboarded = Yes.
Review unmanaged cloud issues
The attack surface rule Unmanaged Cloud Service creates findings when ASM scans detect unmanaged cloud services. This rule is enabled by default, which means it will also create issues. Perform these steps to view your unmanaged cloud issues:
- Navigate to Cases & Issues → Issues.
- Filter the Issues table using the filter Attack Surface Rule ID = UnmanagedCloudService.
- Click on an issue to display the issue details, including the unmanaged cloud service information.
Emerging Vulnerabilities
Notice
Requires the ASM add-on
The Emerging Vulnerabilities page streamlines your response to global attack surface threat events and zero-day exploits by aggregating important information about threats and its impact on your organization in one place. From Emerging Vulnerabilities, you can accomplish the following:
- Review a complete list of emergent and global threat events, and quickly identify the events that impact your organization. The list displays key information about each threat, such as CVSS and EPSS scores, and is sorted by the Last Policy Update date.
- Research a threat event. Our security research team provides a threat summary, potential exploit consequences, previous exploit activity, and links to other reputable sources for additional information.
- Assess the impact of a threat event on your organization. Quickly identify services on your external attack surface impacted by emerging vulnerabilities. Review a detailed list of the affected software, turn on relevant attack surface rules, and access relevant issues, assets, and attack surface test results.
- Build a Remediation Plan. The Emerging Vulnerabilities page provides remediation guidance for each event and click-throughs to issues to begin remediation.
Note
You must have a role with Attack Surface Rules permission to access the Emerging Vulnerabilities page. When setting up Roles Based Access Control (RBAC), you can find Attack Surface Rules in the Detection & Threat Intel component.
How to view emerging vulnerabilities
- Navigate to Posture Management → Vulnerability Management → Emerging Vulnerabilities.
- Click anywhere in the row of a threat event to open the details page.
- Review the information on this page to learn about the threat event and build a remediation plan for your organization.
Which vulnerabilities are included in Emerging Vulnerabilities?
Typically, an emerging vulnerability is a critical or high-risk vulnerability that allows threat actors direct access to assets, leading to widespread impact across corporate networks. Devices and applications impacted by such vulnerabilities are at risk of exploitation remotely over the public-facing internet. These threats often allow threat actors to gain remote control of systems.
Cortex XSIAM considers the following questions when evaluating the level of risk of a threat event and whether to include it on the Emerging Vulnerabilities page:
- Is it a vulnerability without a patch?
- Is it a “Known Exploitable Vulnerability” that has been weaponized by threat actors?
- Can it be exploited remotely over the internet in an unauthenticated manner?
- Is a proof of concept readily available? Has active exploitation in the wild been reported?
- How widespread is the impact of the vulnerability? Does it impact many organizations or is limited to a certain section of the industry?
- Is the vulnerability in an application or device that is routinely targeted by attackers?
- Does it have a vendor severity rating of “Critical” or “High”? Does it have a CVSS score of 9 or higher?
- Are there geo-political factors in play? (For example, is an APT targeting groups or individuals from specific countries or regions?)
How often is the Emerging Vulnerabilities page updated?
Our security research team creates and updates threat events in the Emerging Vulnerabilities page in the following situations:
- When a new threat event occurs and the security research team determines the event is critical enough to add to Emerging Vulnerabilities.
- When new information is discovered for existing threat events. The information on an Emerging Vulnerabilities page is updated frequently as a threat evolves and exploit details are made public.
Global Lookup
Global Lookup allows you to query global internet scan data for certificate hashes, IP addresses, and domains. This internet data is enriched with registration information, geolocation, related certificates, observed services, ASNs, and passive DNS records. Global Lookup is not limited to your own attack surface, offering clear insights into indicator ownership and accelerating the analysis of potentially malicious indicators.
Global Lookup enables you to:
- View and analyze up to 30 days of data, and select up to a 30-day range to search within the last 6 months.
- View the services that have been open on a given IP address over the last 6 months.
- Pivot to Global Lookup directly from IP addresses, domains, and certificates found in attack surface or vulnerability issues.
How to use Global Lookup
- Navigate to Modules → Attack Surface → Global Lookup.
- Enter an IP address, domain, or certificate hash (MD5, SHA1, and SHA256) in the Search box.
Vulnerability management
Vulnerability management in Cortex XSIAM
Note
Requires the Cortex Cloud Posture Security, Cortex Cloud Runtime Security, Exposure Management, Cortex XSIAM Premium or ASM add-on.
Managing vulnerabilities effectively is crucial to proactively maintaining the security, integrity, and availability of IT infrastructure. Cortex XSIAM provides a comprehensive vulnerability management platform, helping you identify, assess, prioritize, and remediate security vulnerabilities across your entire IT infrastructure, including endpoints, code, and cloud.
Cortex XSIAM leverages advanced detection techniques, real-time threat intelligence, and automated workflows to streamline the vulnerability management process. This allows your security team to focus on the most critical issues, reduce risk exposure, and ensure compliance with industry standards and regulations.
Cortex XSIAM helps identify and prevent vulnerabilities across the entire application lifecycle, while prioritizing risk for your cloud-native environments. Integrate vulnerability management into any CI process, while continuously monitoring, identifying, and preventing risks to all the hosts and images in your environment. Cortex XSIAM combines vulnerability detection with an always up-to-date threat feed and knowledge about your runtime deployments to prioritize risks specifically for your environment.
Note
Cortex XSIAM vulnerability management provides the ability to identify and assess runtime vulnerabilities in every asset across traditional IT and cloud environments. For vulnerabilities detected in your software development lifecycle through application security scans, refer to the Cortex Cloud Application Security documentation.
Cortex XSIAM vulnerability concepts
Vulnerability
A vulnerability is a CVE or other known software security weakness that can occur in a network or system. Vulnerabilities are typically defined by the National Vulnerability Database (NVD) and other established security information sources, such as GitHub Security Advisory or Red Hat Security Advisory.
Note
CVE is an acronym for Common Vulnerabilities and Exposures, which is a list of publicly disclosed security threats. We often use the term "CVE" to refer to a vulnerability that has been assigned a CVE ID. Cortex XSIAM identifies CVEs and non-CVE vulnerabilities.
Vulnerability findings
A vulnerability finding is a specific instance of a vulnerability that was discovered in your system through a vulnerability scan. Findings include both actionable and informational context, including information about the asset on which the vulnerability was discovered. Some findings might be critical and should be addressed as soon as possible; others are less important and won’t require any action at all. Cortex XSIAM applies vulnerability policies to findings to prioritize them and create issues for the ones that are most critical to remediate.
Vulnerability issues
Cortex XSIAM creates a vulnerability issue when a specific instance of a vulnerability in your environment matches a vulnerability policy. Each issue has a priority, assignee, and progress status associated with it. Issues also provide contextual information about the asset on which the issue is found, exploitability, and other information required for remediation and mitigation.
Vulnerability Management dashboard
Vulnerability management analysts and managers can use the Vulnerability Management dashboard to visualize their most pressing risks, changes to risk over time, and remediation progress.
Navigate to Home > Modules > Vulnerability & Exposure Management and select Dashboard to see the detailed view.
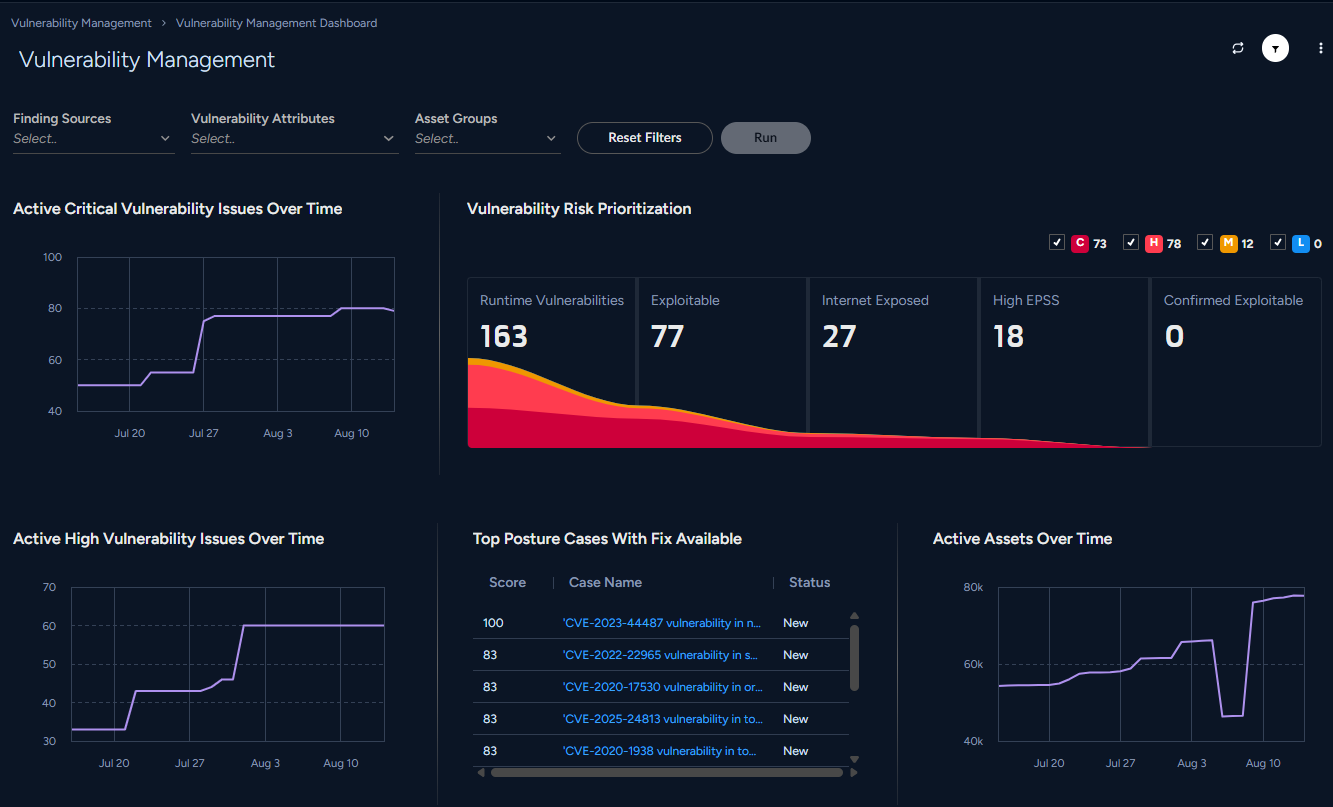
Cortex Vulnerability Risk Score
Cortex's Vulnerability Risk Score (CVRS) offers a dynamic vulnerability risk-scoring approach to help you synthesize critical organization-specific information along with public vulnerability intelligence to provide customized accurate risk scoring. Leverage CVRS to bring in asset context, exploitability information, and the latest updates, to your risk assessment.
Cortex Vulnerability Risk Scores range from 0 to 100, with 100 representing the highest risk. Scores are updated on a daily basis or whenever a findings revision takes place. They are included on vulnerability findings and issues to enable efficient sorting and filtering of vulnerabilities based on risk. Find more details about the risk factors that determine each score on the issue details panel.
Use CVRS to quickly analyze, report, and remediate the highest-priority issues. In addition, CVRS helps you inform and align your team, so you can focus on the most critical issues.
CVRS Assessment Framework
Cortex XSIAM uses the following factors to determine the CVRS.
| Risk factor | Description |
|---|---|
| Vulnerability Context | Uses the CVSS base score |
| Exploit Intelligence | Uses EPSS, CISA KEV, exploited in-the-wild, and exploit maturity data |
| Asset Risk | Evaluates public internet-exposed assets |
| Environment Risk | Leverages Attack Surface testing results to determine whether an asset is a package-in-use |
| Compensating Controls | Accounts for assets with Compensating Controls (requires Exposure Management add-on) |
View Cortex Vulnerability Risk Score
The CVRS is displayed in the Vulnerability Issues table, and CVRS details are included in the issue details.
-
Navigate to Home > Modules > Vulnerability & Exposure Management > Vulnerability Issues.
The Cortex Vulnerability Risk Score appears in the CVRS column in the table.
-
Click on a row in the table to open the details panel.
The Overview tab includes the vulnerability risk score, and the Evidence section includes a high-level summary of the evidence used to determine that score.
The Risk Details tab provides details about each risk factor that Cortex XSIAM uses to determine the risk score.
You can also find the Cortex Vulnerability Risk Score and high-level risk score evidence on Vulnerability Findings.
Vulnerability policies
A vulnerability policy defines the action you want to take for a specific set of vulnerability findings that match your policy criteria. Cortex XSIAM provides a set of predefined vulnerability policies based on CVSS severity, EPSS severity, and vulnerabilities confirmed through Attack Surface Testing. You can also create custom policies based on your unique business requirements. Custom policies allow you to focus on the risks that matter most to your organization. Some examples of custom vulnerability policies include the following:
- A policy that creates issues with a severity of critical for findings that have a CVSS score of 9 or more
- A policy that creates issues with a severity of low for findings that appear on dev servers
- A policy that specifies not to create issues for findings on assets in the asset group Leased to customers
- A policy which creates issues with a severity of critical for vulnerabilities that appear on the CISA KEV list and are in the asset group called Production Servers, regardless of CVSS score.
- A policy that prevents an image that contains code with a CVE with an EPSS score greater than 90% from being deployed to the Kubernetes cluster
Each time a new vulnerability finding is discovered, the system compares that finding to your vulnerability policies to determine whether one of the policies is a match. Vulnerability policies have an evaluation order, which means the system starts by evaluating the finding against the first policy. If it does not match, the second policy is evaluated for a match. As soon as a finding matches a policy, no further policies are evaluated for that finding.
The following sections describe the elements that make up a vulnerability policy:
Policy conditions and scope
Vulnerability policy conditions and scope define the specific set of findings that a policy applies to. You define the conditions by configuring a filter with criteria for including and excluding findings. You define scope by creating one or more Asset Groups and adding assets to those groups in the Assets view. Once the Asset Groups are created you may select one or more of them in the policy creation process, this will limit the scope of that policy to only the assets in the chosen asset groups.
Policy actions
Policy actions are the actions the policy will perform automatically on vulnerability findings that match the policy conditions and scope. There are two types of policy actions, issue creation and prevention.
Issue creation actions
Issue creation actions either create an issue and set the issue severity for matching findings or or ignore matching findings and do not create an issue.
Prevention actions
Prevention actions prevent vulnerabilities from being introduced into your systems by failing a build or blocking deployment. Available actions are described in the table below.
| Type of prevention action | Action | Description |
|---|---|---|
| Kubernetes pod actions | Block new deployments | New deployments are blocked by the Kubernetes Admission Controller when vulnerabilities matching the policy conditions are detected in an image. This requires that the agent be installed and activated. |
| Kubernetes pod actions | Do nothing | No action will be taken for matching findings on Kubernetes clusters with Kubernetes Admission Controller activated. |
| Build actions | Fail the build | Fails the build in your CI/CD system when an attempt is made to check in code that includes a vulnerability that matches the policy conditions. This requires that the agent be installed and activated on your CI/CD system. |
| Build actions | Do nothing | No action will be taken for matching findings from code repository assets where the agent is activated. |
Policy order
The order of policies in the policy list is important. Policies are executed in order from top to bottom, and the first policy that matches a finding determines the action on that finding. After that first match, no other policies are evaluated. We recommend placing your most important and most specific policies toward the top of the list and wider-reaching, more generic policies towards the bottom of the policy list.
Policy 0 is the Globally Ignored CVEs, Assets, and Asset Groups policy. It includes a list of CVEs and assets for which Cortex XSIAM will not create vulnerability issues. You can update the Globally Ignored CVEs, Assets, and Asset Groups policy by adding or removing CVEs, asset groups, and assets, but you cannot move the policy down list to change order.
Create a vulnerability policy
Before creating a policy, be sure to review the information in the Vulnerability Policies section.
- Navigate to Posture Management → Rules & Policies → Policies → Vulnerability Management.
- Click +Add Policy and select one of the options:
- Create a policy for issue creation
- Create a policy for prevention
- Add a Policy Name and, optionally, a Description, and then click Next.
-
Set the policy conditions by creating a query that defines the specific findings for which the policy will create issues. Your policy can specify which findings to include and which to exclude.
Preview the list of findings that match your policy. If the results look correct, click Next.
-
Define the policy scope by selecting one or more asset groups from the dropdown menu. If you don't choose an asset group, the policy will apply to all assets.
If you want to create a new asset group, click Create New Asset Group to open the Asset Groups page in a new browser tab. Click + Add Group and follow the instructions in the wizard. After you've created the new asset group, go back to your original tab and finish creating your policy with new asset group.
Click Next.
- Choose the action that will be executed on the findings that match the policy. If you select Create an issue for each matching finding, you must also select the issue severity that will be applied to those issues. You can base the severity of the issue on the severity of the underlying CVE by selecting Use Default CVE Severity in the dropdown menu.
-
Click Done.
The policy wizard will close, and you will be redirected back to the Vulnerability Policies page.
-
Set the order of evaluation for the policy.
By default, new policies are added to the bottom of the policy list. To move a policy up or down in the list, click and hold the arrows in the Name column and drag the policy to the desired position in the list.
We recommend placing wider-reaching, more generic policies towards the bottom of the policy list, and more specific policies towards the top of the list.
Click Save.
Update the Ignored CVEs, Asset Groups, and Assets policy
Policy number 0 in the policy list is the Ignored CVEs, Asset Groups, and Assets policy. This policy contains a list of vulnerabilities and assets for which Cortex XSIAM will not create vulnerability issues. Findings will still be created for these vulnerabilities and assets, and you can review those on the Vulnerabilities and Vulnerable Assets pages. You can update the Ignored CVEs, Asset Groups, and Assets policy at any time by using the following steps to add or remove assets, asset groups, and CVEs.
- Navigate to Posture Management → Rules & Policies → Policies → Vulnerability Management.
- The first policy in the policy list is the Ignored CVEs, Asset Groups, and Assets policy. Click on that policy to open the policy wizard.
- Add or remove vulnerabilities, asset groups, and assets as needed. Click Next.
- To add CVEs, asset groups, or assets, use the search bar in each section to find the value you are looking for, and select it to add it to the list.
- To remove CVEs, asset groups, or assets, click the X to the right of each item in the list.
- Review the Results Preview to see the list of findings that will not generate issues. If the list looks correct, click Done.
Modify a vulnerability policy
- Navigate to Posture Management → Rules & Policies → Vulnerability Management.
- Select either the Issue Creation or Prevention tab, depending on the type of policy you want to modify.
- Click on the name of the policy in the policy list to open the policy wizard. You can also right-click anywhere in the row and select Edit.
- Follow the steps in the wizard to update the policy.
Configure a block grace period
When you create a Vulnerability Management Prevention policy, you also have the option to establish a remediation buffer period. Configuring a block grace period gives you additional time to resolve a vulnerability before the blocking action resumes. The grace period is based on the fix date of the vulnerability and allows you to override the blocking action of a policy when new vulnerabilities are detected. Follow the steps below to set up a block grace period:
- Navigate to Posture Management → Rules & Policies → Vulnerability Management → Vulnerability Policies - Prevention.
- Select an existing policy or create a new policy with the Add Policy button.
- Add a Policy Name, Optional Description, and click Next.
- Set the Policy Conditions and Policy Scope, as described under Create a vulnerability policy.
- Select an Action that will be triggered when a finding matches the policy.
- For Kubernetes Runtime protection, if you opt to Prevent new deployment requests, you can also select a block grace period, during which the preventive action will be suppressed. Enter a value in the Grace Period Days before Blocking Deployment field. The grace period begins on the fix publish date, or the date the vulnerability was published if a fix is not available. Blocking enforcement begins once the grace period has passed. Enter 0, to immediately start blocking action.
- For Prevention Actions, if you opt to Fail the build, you can also select a block grace period, during which the preventive action will be suppressed. Enter a value in the Grace Period Days before Failing the Build. Select Done to save your changes.
Enable or disable a vulnerability policy
After disabling a policy, no new issues will be created or actions taken for new findings that match the policy.
- Navigate to Posture Management → Rules & Policies → Vulnerability Management.
- Select either the Issue Creation or Prevention tab, depending on the type of policy you want to modify.
- Right-click anywhere in the row for that policy and select Enable or Disable.
Investigate and remediate vulnerabilities
Cortex XSIAM provides several ways to view and track vulnerability data so you can monitor, investigate, and remediate vulnerabilities in your environment.
View all Vulnerabilities
The Vulnerabilities page displays all your vulnerabilities grouped by CVE or other vulnerability ID. This view shows you how prevalent each vulnerability is in your environment. The Vulnerabilities page includes key information about each vulnerability, with links to the related lists of instances (also called findings), related issues, and impacted assets.
Go to Home > Modules > Vulnerability & Exposure Management > Vulnerabilities.
View vulnerability issues
The Vulnerability Issues page displays all vulnerability issues along with critical vulnerability intelligence and context so you can assign an issue to an owner, investigate, remediate, and track progress. Follow the steps below to view Vulnerability Issues and investigate them further:
- Go to Home > Modules > Vulnerability & Exposure Management > Vulnerability Issues. Click on an issue in the table to display the issue details panel. You can also optionally generate a .tsv file export of the data if required from the Vulnerability Issues page.
- The issue details side panel provides the following investigation and remediation options:
- The Overview tab on the Vulnerability Issues panel captures all the relevant details to further investigate the vulnerability including Summary, Details, Linked Cases, and Evidence. Select Evidence to view the technical context necessary for effective action and remediation. Here you can view:
- At the top you can view the compromised asset or packages that led to Vulnerability creation.
- Vulnerability Details Highlights are provided to indicate if a fix is available.
- Vulnerability Summary provides granular details regarding impacted scores such as CVSS and EPSS.
- Vulnerability Asset & Code Details includes additional details regarding Asset Location, Package in Use, and Findings Sources.
- In addition, you can further isolate the vulnerability by examining the Exposure Graph. Review the Exposure Graph to understand where the vulnerability originates and how it impacts Findings and Assets. Select More Info to view granular details about each of the impacted assets. Use the graph to investigate relationships between K8s Namespaces, Clusters, Workloads, and Container Images. Note that Cortex Attack Surface Management and Cortex Network Scanner do not have graphs associated with them.
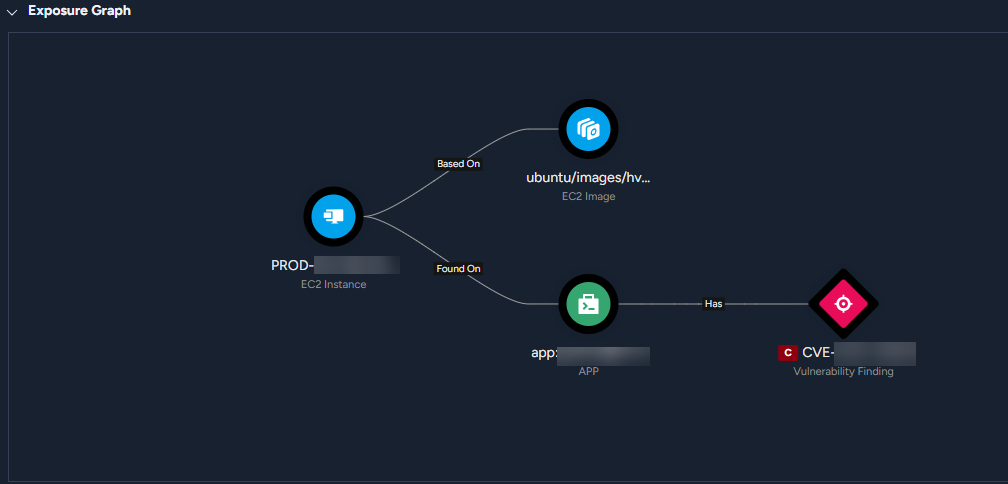
- Click Resolution to view remediation options. Here you can select Work Plan if you already have an automation Playbook in place. Learn more about Playbooks. Select Remediation Guidance to view manual steps to resolve the issue. Manual steps include:
- General and LLM generated Step-by-Step instructions to remediate the issue.
- Workarounds are only included for Exposure Management issues.
- Select Risk Details to view the Cortex Vulnerability Risk Score information as well as any existing Compensating Controls in place.
- Click War Room for real-time investigation capabilities powered by ChatOps. In the War Room you can capture context from different sources and collaborate and execute remote actions across integrated products.
- Work Plan is available when you select an autonomous playbook in an issue's resolution tab. This view presents only the executed key tasks and their defined outputs, providing a focused view of resolution actions.
View All Vulnerability Findings
A vulnerability finding is a specific instance of a vulnerability that was discovered in your environment. The All Vulnerability Findings page lists every instance of every vulnerability that was discovered in your environment.
Go to Vulnerabilities and click the All Vulnerability Findings button.
View vulnerable assets
The Vulnerable Assets page displays all assets with a vulnerability finding. This view enables you to prioritize vulnerabilities by asset and asset type and focus on assets most critical to fix. The Vulnerable Assets list provides links to the findings and issues for each asset. Click on an asset in the table to see the asset details.
Go to Home > Modules > Vulnerability & Exposure Management > Vulnerable Assets.
Vulnerability Intelligence
Vulnerability Intelligence is a real-time feed that contains vulnerability data and threat intelligence from a variety of certified upstream sources. This feed continuously pulls data from known vulnerability databases, official vendor feeds and commercial providers to provide the most accurate vulnerability detection results.
In addition to the information collected from official feeds, Vulnerability Intelligence is enriched with data curated by a dedicated research team. Our security researchers monitor cloud and open-source projects to identify security issues through automated and manual means. As a result, we can detect new vulnerabilities that were only recently disclosed, and even vulnerabilities that were quietly patched.
Vulnerability Intelligence provides comprehensive, actionable information including the following:
- CVE metadata, such as description, impact, severity, and CVSS v2/3/4 Scores
- CPE and product information, such as affected packages, versions, and OS
- Exploit intelligence, such as Exploit Availability, maturity, exploitability and EPSS scores
- Links to vendor advisories
How to view Vulnerability Intelligence
- Navigate to Home > Modules > Vulnerability & Exposure Management > Vulnerability Intelligence.
-
(Optional) Click a row in the Vulnerability Intelligence table to view detailed information about the vulnerability.
The details page has an Overview tab, which provides information about the vulnerability and an Affected Software tab, which shows information about all the software packages impacted by the vulnerability.
Emerging Vulnerabilities
Leverage the Emerging Vulnerabilities page to simplify and streamline your response to global attack surface threat events and zero-day exploits. Aggregated data about the zero day threat and its impact on your organization is available one place, to help you access all the information you need to prioritize remediation. Use the Emerging Vulnerabilities page to:
- Review a curated list of emergent and global threat events, and quickly identify the events that impact your organization.
- Research a threat event. The Palo Alto Networks Security Research Team provides a threat summary, potential exploit consequences, previous exploit activity, and links to other reputable sources for additional information.
- Assess the impact of a threat event on your organization. Review a detailed list of the impacted assets, identify relevant incidents and alerts, and see how the risk is distributed across your organization.
-
Build a Remediation Plan. Remediation guidance is available for each event, including lists of relevant alerts, and click-throughs to incident and alert pages to begin remediation.
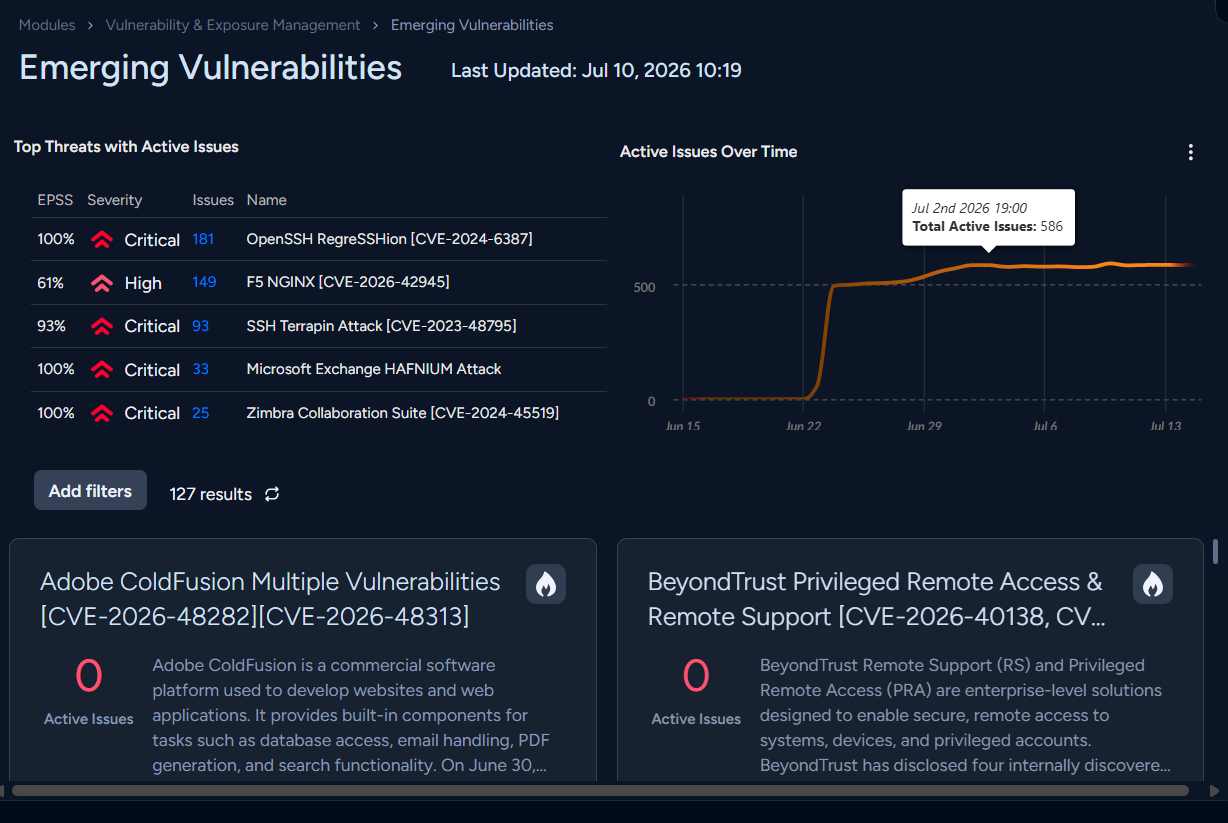
Emerging Vulnerabilities Actions
Navigate to Modules > Vulnerability & Exposure Management > Emerging Vulnerabilities to view a detailed list of emerging zero-day threat events. The widgets here provide telemetry on how your cloud assets are impacted by the CVEs and outlines steps you can take to immediately remediate the issue. Widgets include:
- Top Threats with Active Issues: Counts all active issues related to the Emerging Vulnerability events.
- Active Issues over Time: Includes all issues that have CVE-IDs, Attack Surface Rules that are included in Emerging Vulnerability events. Click the options icon to change the timeframe.
- CVE Detailed View: This view provides a complete list of threat events and links to related alerts. For each event in the list, Cortex displays the following information, enabling you to quickly identify which events are the highest priority for your organization. The list can also be sorted any of the data points below.
- Max CVSS Score—Highest CVSS score of the CVEs associated with the event.
- Max Exploit Prediction Scoring System (EPSS) Score—Calculates the likelihood of exploits in the wild.
- Active Issue Count—Number of your organization's active alerts related to this event.
- Findings Count
- CVEs—Number of CVEs related to this event.
- Affected Software—Names of the software affected by this event. The Issue details page lists the affected versions.
- Last Updated date
- First Published date
- Has Known Exploited Vulnerabilities (KEV) value—Denotes whether a specific software flaw is actively being attacked in the wild.
Recast CVSS scores and CVSS severities
In some situations, you might decide that a specific vulnerability poses a different level of risk to your environment than what is reflected in the original CVSS score or CVSS severity. In Cortex XSIAM you can override the CVSS score or severity within the platform. Customizing CVSS scores and severities enables you to align your risk management approach with your unique context and priorities.
When a CVSS score or severity is recast, the change is applied platform-wide, updating both existing and new vulnerability findings. This ensures consistency in how vulnerabilities are assessed and managed across the organization. After the CVSS score or severity is updated, the system automatically updates all affected findings within about one hour.
You can view the original CVSS score and severity and new values on the vulnerability details page in Vulnerability Intelligence.
Score changes do not occur in real time. Updates are triggered only when a Findings update takes place.
How to recast the CVSS score and CVSS severity of a vulnerability
- Navigate to Home > Modules > Vulnerability & Exposure Management > Vulnerability Intelligence.
- Use the filters to find the vulnerability in the Vulnerability Intelligence table.
- Click in the row for the vulnerability to open the vulnerability details panel.
- Click the Options icon in the upper right corner and select Override Severity or CVSS.
- Enter the new severity and score, and then click Save.
View vulnerabilities with overridden CVSS severities and scores
Perform these steps to display the complete list of vulnerabilities with overridden CVSS severities and CVSS scores.
- Navigate to Posture Management → Vulnerability Management → Vulnerability Intelligence.
-
Click the Show Overridden CVSS button in the upper right corner.
You could also use the filter Severity Source Contains Custom Override to display the list of vulnerabilities with overrides.
Exposure management
Learn about Exposure Management
Notice
Requires the Exposure Management add-on.
Cortex Exposure Management is a collection of features, capabilities, integrations, and content designed to help defenders holistically assess, consolidate, prioritize, and proactively respond to exposures in their organization.
-
Comprehensive Visibility
Through a robust set of Cortex sensors and third-party integrations, along with the Cortex XSIAM data stitching and normalization engine, Exposure Management provides a normalized, deduplicated view of exposures across multiple different sources.
-
Actionable Prioritization
Exposure Management precision filtering, compensating control identification, and the Exposure Management Command Center enable defenders to view their risks through a number of different dimensions and start each day with only the most critical cases. Fix-oriented case grouping makes it easier to maximize the impact of security and IT team’s remediation efforts by identifying common remediation actions to address the largest number of prioritized vulnerabilities.
-
Automation-first Remediation
Platform automation capabilities and specialized exposure management content enable teams to augment their existing triage workflows, and in permissible situations, automate them entirely. Automation content comes ready out of the box to take actions such as:
- Send notifications through a number of business and developer focused tools
- Create tickets in third-party IT management software
- Leverage AI-embedded remediation owner discovery
- Take fully automated remediation actions through available control surfaces
Supported data sources
Cortex Exposure Management gathers vulnerability data from the sources listed below.
Palo Alto Networks sensors:
- Cortex Agent
- Cortex Attack Surface Management
- Cortex Attack Surface Testing
- Cortex Cloud Agentless Scanner
- Cortex Container Registry Scanner
- Cortex Serverless Function Scanner
- Cortex Network Scanner
Third party sensors (using built-in integrations):
- Crowdstrike
- Qualys VMDR
- Rapid7 InsightVM
- Tenable.io
- Tenable.sc
Third-party sensors (using the Vulnerability Ingest API):
- Ingest vulnerabilities and related assets from any third-party scanner directly into your asset inventory and vulnerability management workflows.
Get started with Exposure Management
Complete the steps in this section to set up Exposure Management and begin to customize it to meet your organization's unique requirements. All of these steps are optional, but recommended.
| Step | Description | More information |
|---|---|---|
| Step 1: Configure the Cortex Network Scanner and other Palo Alto Networks sensors | These sensors scan your environment and ingest vulnerabilities so you can review, prioritize, and take action on them from one central location. | <ul><li>Attack Surface Testing</li><li>Cortex XDR agents</li><li>Cortex Cloud Agentless Scanner</li><li>Container Registry Scanning</li><li>Cortex Serverless Function Scanner</li></ul> |
| Step 2: Configure third-party integrations | Exposure Management can ingest vulnerabilities from Tenable.io, Tenable.sc, Rapid7 InsightVM, and Qualys VMDR scanners. | Ingest assets and vulnerabilities from third-party applications |
| Step 3: Ingest assets and vulnerabilities using the API | The Vulnerability Ingest API imports vulnerabilities and assets from your third-party tools directly into your asset inventory and vulnerability management workflows. | Ingest assets and vulnerabilities from third-party applications |
| Step 4 Enable Attack Surface Testing (AST) | AST validates that vulnerabilities are exposed to the internet and provides additional context for compensating controls. | Attack Surface Testing |
| Step 5: Review vulnerability policies | Review the out-of-the-box vulnerability policies and create custom policies to define which vulnerabilities trigger creation of an issue or other actions. | Vulnerability policies |
| Step 6: Review attack surface rules | Attack surface rules determine which attack surface management (ASM) findings create issues. Review the default enabled attack surface rules and enable or modify rules as needed. | Attack surface rules |
| Step 7: Set up asset groups | <p>Asset groups can be used to:</p><ul><li>define the scope of vulnerability policies</li><li>configure scope-based access control (SBAC), so users only see vulnerabilities for the assets they own</li></ul> | Asset Groups |
| Step 8: Enable issue enrichment and remediation automation | Install the Exposure Management Content pack to enable remediation owner information to be added to some issues automatically and automated remediation of some ASM issues. | Deploy ASM and Exposure Management enrichment and remediation automation functionality |
Ingest assets and vulnerabilities from third-party applications
Cortex Exposure Management gathers asset and vulnerability data from Palo Alto Networks sensors and third-party scanners. See Learn about Exposure Management for the list of supported data sources.
Ingest assets and vulnerabilities using built-in integrations
Cortex Exposure Management provides built-in integrations for ingesting assets and vulnerabilities from some third-party applications. These integrations only ingest vulnerabilities and assets associated with CVEs. Ingested assets all appear in Cortex XSIAM with the asset type Generic Device . Assets and vulnerabilities ingested through integrations are available in the following XQL data sets:
- {vendor}_{product}_assets_raw
- {vendor}_{product}_vulnerabilities_raw
How to configure built-in integrations to ingest assets and vulnerabilities
- Navigate to the Settings → Data Sources & Integrations.
- Search for the integration you want to set up, and click + Add New.
-
Complete the Connect section on the New Data Source page with credentials and other connection details.
For more information about the fields, click the question mark icon.
-
In the Collect section, select the checkbox for Fetch assets and vulnerabilities.
Depending on the vendor, you may be able to select additional types of data to be ingested in this section.
- Click Advanced Settings to specify the fetch settings.
- Click Test to test the configuration. If the test fails, you can Run Test & Download Debug Log to debug the error.
- Click Connect. Review the configuration in the summary screen.
- Click Finish to return to the Data Sources & Integrations page.
Ingest assets and vulnerabilities using the Vulnerability Ingest API
The Vulnerability Ingest API is a single API endpoint that ingests asset records along with nested vulnerabilities. This API enables you to import vulnerabilities and related assets from your third-party tools directly into your asset inventory and vulnerability management workflows.
Imported assets will be asset type Generic Device, and will include vendor and product fields in the asset record. On findings, the Findings Source field will indicate Third Party Scanner. Data imported with the Vulnerability Ingest API will not be available in an intermediary XQL data set, but will appear in platform datasets such as asset_inventory and uvm_findings.
Note
Uploading assets and vulnerabilities with this API requires the Manage Vulnerabilities permission, which is under Vulnerability Management & Import on the permissions page, and is included in Instance Admin and other admin roles.
See the Vulnerability Management API documentation for more information.
Security controls
Security controls allow you to reduce visibility gaps by providing a clear, granular picture of the security mechanisms deployed in your cloud environment. This helps you go from managing inherent risk (theoretical danger in a vacuum) to quantifying residual risk, meaning the actual danger remaining after your defenses do their job. With Security Controls you can move beyond counting defects and alert fatigue to a more accurate view of your risk landscape that takes into account the defenses you already have in place.
Before you proceed with implementation and rollout, it is important to understand the following key concepts:
- Security control: This is the security measure or technology you have deployed, for instance, a Palo Alto Networks Next Generation Firewall (NGFW). You can inform Cortex XSIAM about the existence of risk mitigation devices or custom security controls.
- Compensating control: This is the effectiveness of a technology against a specific finding, for instance, NGFW's effectiveness in mitigating against Log4Shell. You can specify how effective a control is to mitigate risk for specific findings and issues, using states like Effective, Partially Effective or Not Effective.
Control changes do not occur in real time. Updates are triggered only when a Findings update takes place.
Automatically detect security controls
The Cortex platform can automatically detect current security controls you may already have in place. The effectiveness of these controls is calculated without any additional effort on your part. Based on your environment's current topology and configuration, Cortex can asses the effectiveness of security controls such as Cortex XDR Agent and VM-Series NGFW (Next-Generation Firewall).
Using XDR Agent as an example, Cortex provides visibility into the efficacy of agent coverage and offers actionable steps to enhance this coverage. This is achieved by running the following checks for each vulnerability:
- Is a Cortex XDR agent associated with the vulnerable asset?
- Is the vulnerability associated with the asset exploitable?
- Does the Cortex XDR agent have coverage for that particular exploitable vulnerability?
- Is the vulnerable asset internet-exposed?
- Is the vulnerable asset confirmed to be reachable from the internet by the Attack Surface Management scanner?
- Is the vulnerable asset confirmed to be exploitable from the internet by the Attack Surface Testing scanner?
- Is the Cortex XDR agent running the minimally required version and content release to be effective as a compensating control?
- Does the agent's Exploit Protection Profile have the following settings set to Block, Report, or Disabled?
- Known Vulnerable Processes Protection
- Operating System Exploit Protection
Note
Auto-detection of controls is supported when certain constraints regarding topology and configuration are met. Learn more about Network Exposure Detection.
Third-party or custom security controls can also be added by manual attestation as described in the next topic.
Manually attested security control taxonomy
Before you proceed with creating security controls, it is important to review the taxonomy outlined below. to help you map your existing controls to this official schema.
This taxonomy requires four mandatory attributes for every control:
- Name (unique): The human-readable name (e.g., "Palo_Alto_NGFW_Datacenter").
- Category: The high-level security domain that the Security Control belongs to. See table below for possible values.
- Type: The specific security control capability, which is dependent on the Category.
- Vendor: The vendor that provides the security control as shown in the table below.
Available values for control Category and Type
| Control Category | Control Type |
|---|---|
| Network Security | Network Firewall, Next Generation Firewall, Web Application Firewall, Intrusion Prevention System, Virtual Private Network |
| Endpoint Security | Endpoint Detection and Response, Extended Detection and Response, Anti-Virus, Host Based FW |
| Data Security | Virtual Private Network, Disk Encryption, Data Loss Prevention, Database Activity Monitor |
| Identity Security | Multi-factor Authentication, Single Sign-On, Privilege Access Management |
| Other | Text String (4 chars min, 256 chars max) |
Tip
Take an inventory of your top 10-15 security controls, check which ones need to be manually added into the Cortex Platform, and use the taxonomy to map them into the system.
Establish security control roles
Before you get started with security controls, you must define who can manage it. The Exposure Management Administrator role, along with the Tenant Administrator role, possesses full Create, Read, Update, and Delete (CRUD) permissions to manually add Controls and Effectiveness Rules.
Crucially, they can also manage ownership and change a security control from public to private. Other roles (e.g., Vulnerability Management, Data Security Administrator, Identity Security Administrator) are permitted to create effectiveness rules in their respective domains.
Role-Based Access Control Roles
| Role | Permissions | Recommended Governance Model |
|---|---|---|
| Exposure Management Administrator | Can CRUD all controls and rules and change ownership/privacy | Centralized Model. Assign this role to 2-3 Senior Analysts. This small group learns the feature, defines the initial controls, and establishes best practices. |
| Tenant Administrator | Same as above | Used for initial setup and assignment of the Exposure Management Administrator role. |
| Vulnerability Management (and other domain-specific admins) | Can update effectiveness in their domains | Federated Model. After best practices are set, "deputize" these domain admins. This scales the feature, allowing endpoint teams to manage controls, while implementing strong central guidance on naming conventions and taxonomy. |
| Read Only All | Can view all Security and Compensating Controls objects, rules, etc. | Assign to general SOC analysts, auditors, and stakeholders (like Asset Owners) who need visibility but not edit rights. |
Tip
Start with a centralized model. This helps a core team master the new object models, states, and taxonomies to prevent confusion and ensure high-quality control creation.
Note
Ensure that you have clear visibility into the controls that are created and implemented by periodically reviewing the Audit Logs as part of your change management process. Audit logs track the following actions:
- Create/Update/Delete Security Controls
- Create/Update/Delete Effectiveness Rules
- Update an Effectiveness Value in a finding or issue
Create a security control
Focus your initial security control creation on high-impact assets and undetected technologies to achieve an optimal level of visibility into your internet-facing environments. Instead of modeling every implemented security measure focus instead on the top ten list of controls that fit the following criteria:
- High-Impact: Controls protecting your most critical, internet-facing applications (for example, the Network Gateway Firewall for your primary e-commerce site, the Security Agent solution for your production workloads).
- High-Noise: Controls that suppress the largest volume of low-to-medium-priority findings (for example, a host-based firewall that blocks certain ports).
Once you have identified the top ten measures you would like to classify as Security Controls, follow the steps below to manually classify them:
- Navigate to Vulnerability & Exposure Management → Exposure Management → Security Controls and select Create Security Control.
-
Enter the required details in the New Security Control panel. Learn more about all the available options for the Control Category and Control Type fields.
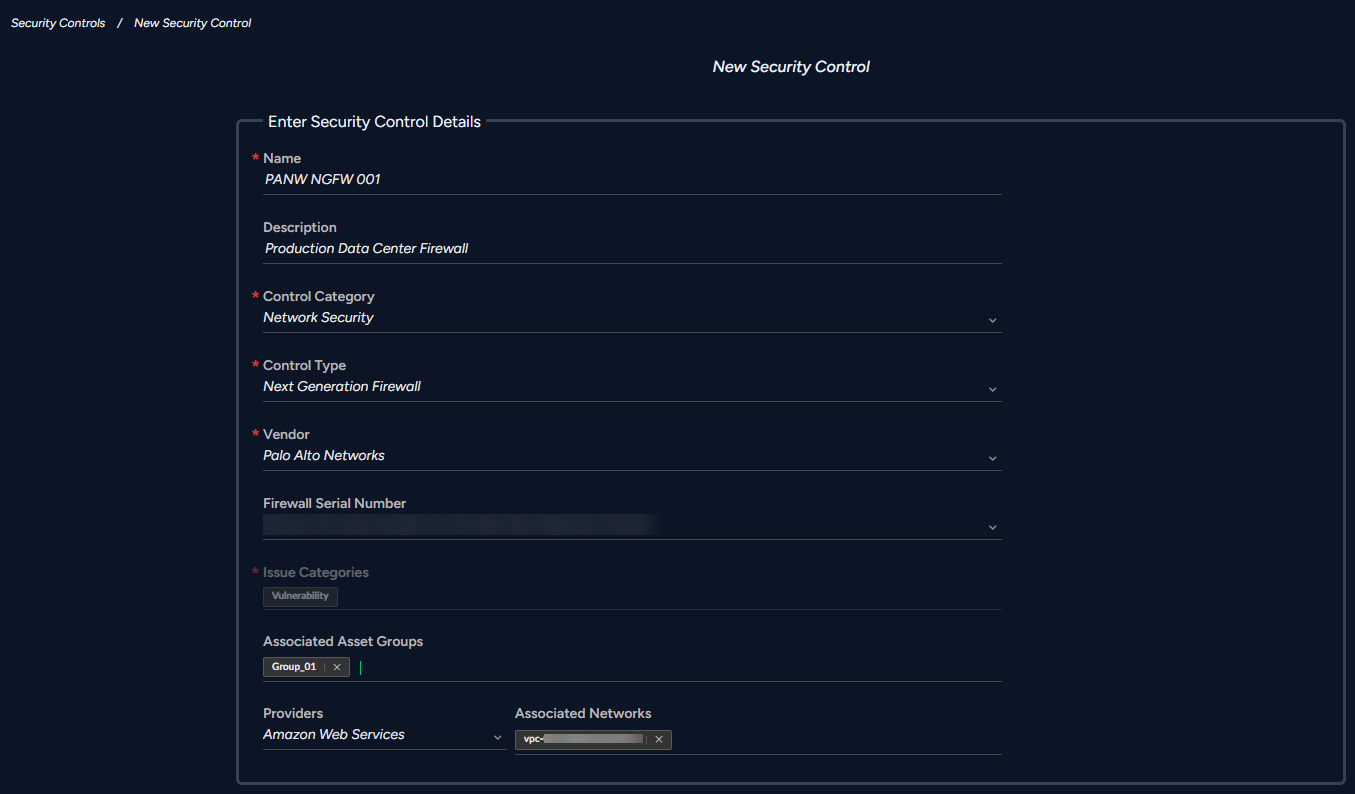
- Click on the applicable technology Vendor from the drop-down list.
-
Select an Associated Asset from the drop-down for all agent-based workloads. As a best practice, associate each control with one or more Asset Groups. New assets added to a group will have the Security Control automatically applied to it after the initial Discovery period.
Note
Discovery and Security Control application for new and updated assets may experience some latency.
- Select a Provider from the drop-down list of cloud service providers.
- Choose Associated Networks when asset-level identification is not possible. Use this option to map controls to on-prem data center subnets or entire cloud VPCs/VNets that you know are protected by a single perimeter control. The network objects are drawn from cloud V-Nets (Azure, EC2, Google).
- Click Save to complete the Security Control creation process.
Manage security controls
After a security control is created, it does not immediately enter an Active state. You cannot create a control and immediately see it on a finding. All security controls go through the lifecycle outlined below before they are fully active:
Table 8. Security control lifecycle and monitoring
| State | Definition | Take Action |
|---|---|---|
| Disabled | The security control is not associated with at least one Asset or Network. | This is an initial state that must be updated as soon as possible. You must edit the control and add an association (Assets or Networks). |
| Discovery | The control is newly created and associated with Asset Groups and Networks. | This state lasts for 24 hours. The platform is mapping assets. The control is not yet active. |
| Active | The control has successfully matched at least one asset in the inventory. | The control is now live. The platform will re-verify this association at least every 24 hours. |
| Inactive | The control was found to have no matching assets during its last check. | This health metric indicates that your Asset Group is outdated, the assets were decommissioned, or the control is stale. The platform checks for new Assets every 4 hours. |
View and edit security controls
Follow the steps below to view, edit, delete or copy security controls:
- Navigate to Vulnerability & Exposure Management Exposure Management Security Controls to view a list of all previously created controls. Select the filter icon to narrow your search by the categories provided in the drop-down.
-
Right-click on a control to view all available actions. Select Edit Control to update control details and click Save.
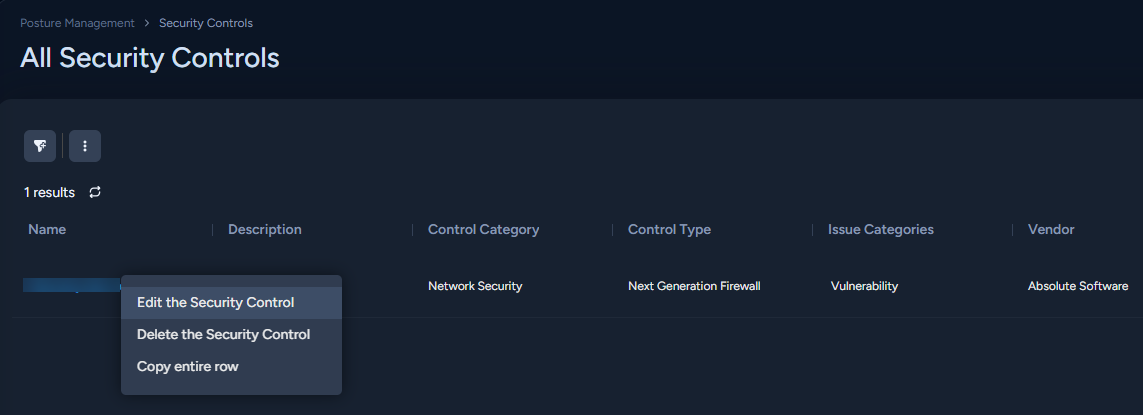
- Alternatively, you can also find Detected Controls and Detected Controls Coverage on the Vulnerability Issue (Posture Management → Vulnerability Management → Vulnerability Issues page.
Set compensating controls
Leverage the full potential of your security control by manually attesting its effectiveness.
Use the workflow below to manually set compensating control effectiveness:
- Navigate to Vulnerability & Exposure Management → Vulnerability Issues and sort the vulnerabilities listed by their CVRS score or Compensating Control Effectiveness. Select a a high-priority issue (e.g., a critical and exploitable vulnerability on a production and internet facing web server) to inspect further.
- Click on an issue to open the detailed issue side-panel view. In the Security Controls section, you will find active security controls that are in effect mitigating the issue. You can also sort issues by Control Effectiveness and select all issues that are Effective for instance. From this list, right click on any issue to update the effectiveness level.
-
Examine the Compensating Control Effectiveness column. If the security control was automatically detected and the platform has access to its configuration, the effectiveness will be also automatically defined.
If the effectiveness is listed as Unknown, you will have to manually define the security control's effectiveness. The Cortex platform does not presume effectiveness. It urges you to use your expertise to make a determination.
- Based on your knowledge of the Security Control configuration, manually change the Unknown value to one of the following effectiveness states:
- Effective: The control can fully mitigate the risk. (e.g., "I know this SC is in 'Block' mode for this vulnerability").
- Partially Effective: The control mitigates the risk under certain conditions. (e.g., The Security is in 'Log Only' mode or it only blocks some of the available exploits, but not all variants. This is a partial mitigation.).
- Not Effective: The control is not adequate. (e.g., This is an SSH 'root' login vulnerability; the Security Control in place does not mitigate the issue).
After you complete the workflow above, the Compensating Control state will be set as manually defined. The platform will re-prioritize the finding, potentially moving it out of the Critical remediation bucket, since an expert has reviewed this issue and their assessment is considered the source of truth.
Improve controls coverage
The Vulnerability Issues page provides you with control information, to help you evaluate the efficacy of your risk mitigation efforts. The Vulnerability Issues table includes fields for Detected Controls and Detected Control Coverage for each vulnerability issue, so you can filter and sort on these fields. The issue details panel also provides additional information on detected controls and coverage.
- Navigate to Vulnerability & Exposure Management → Vulnerability Issues.
-
On the Vulnerability Issues page, controls information can be found in the following columns:
Detected Controls: Lists the Security controls detected for this issue.
Detected Control Coverage: Summarizes the effectiveness of the control.
You can filter and sort on these fields as needed.
- Click on an issue to display the issue details panel. Details about Security controls appear on the Risk Details tab. Specifics include which control, if any, was detected, details about the control coverage, and information about recommended steps to improve the coverage.
-
Select the Actions tab and review the list of Recommended Actions.
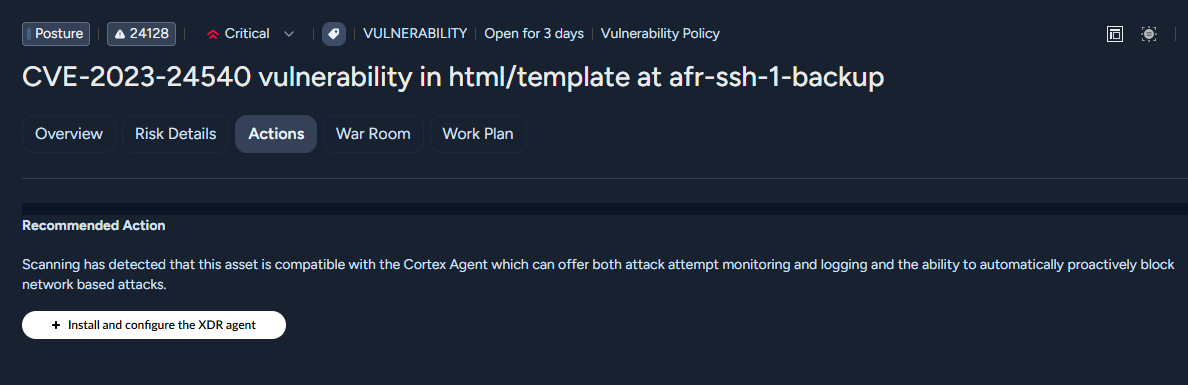
The Actions tab in a vulnerability issue lists the recommended actions as a set of links. Those links take you to Cortex XSIAM page where you can perform the recommended action. For example, if you click + Install the Cortex Security Agent, the system will not automatically install the agent; instead it will open the page where you can install agents. Current available actions are limited to installing the Cortex Security Agent.
- Click on an action to open the Cortex XSIAM page where you can complete that action.
Create effectiveness rules
Utilize compensating control effectiveness rules to automate effectiveness mapping for common, often repeated, high-confidence risk mitigation scenarios. Effectiveness Rules help you reduce the time spent triaging issues manually.
Note
Only users with the role Exposure Management Administrator can create effectiveness rules.
Follow the steps below to create an effectiveness rule:
- Navigate to Vulnerability & Exposure Management → Exposure Management → Compensating Control → Effectiveness Rules and select Create New Effectiveness Rules.
- Enter the required rule details in the fields as shown below:
- Name: e.g., NGFW-Effective-Rule
- Description: Automatically marks all NGFW-protected vulnerabilities findings as Effective.
- Issue Category: Vulnerability (A rule is restricted to a single Issue Category).
-
Source Risk: This is the "IF" condition. You can select CVE-ID, PRISMA-ID, GHSA-ID, or All.
Tip
Use All, rather than selecting individual CVEs, unless you explicitly only want to mark specific CVEs as Effectively Mitigated.
- Security Controls: Select one or more Security Controls this rule applies to (e.g., Prod-Datacenter-NGFW, Staging-NGFW).
- Compensating Control Effectiveness: This is the "THEN" action. Set to Effective.
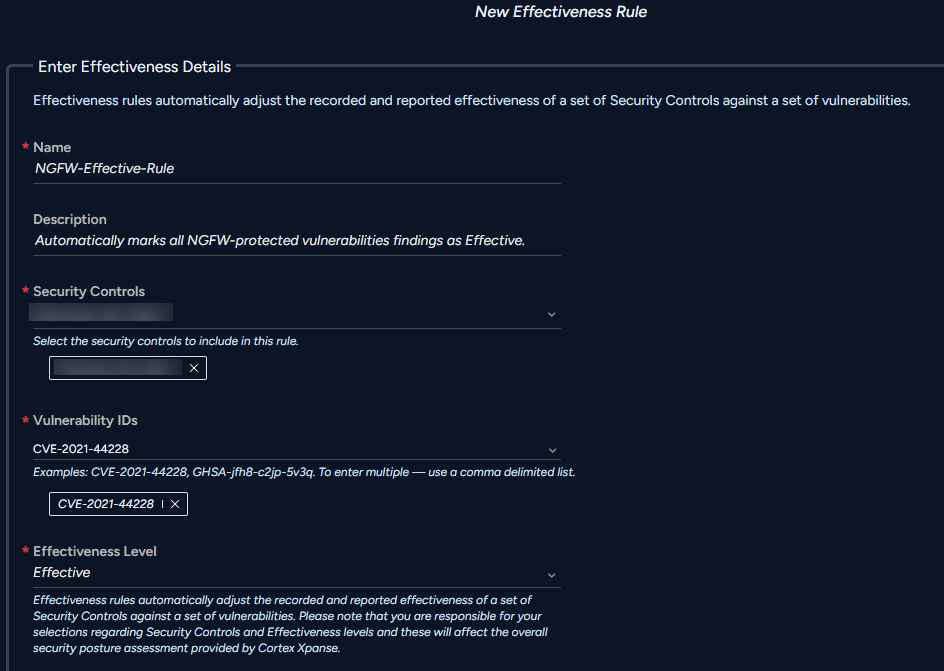
Save the rule. After it is in effect, any new finding that matches these criteria will automatically have its effectiveness set to Effective.
Manage effectiveness rules
Effectiveness rules allow you to automate 80% of your control decisions, with senior analysts having the option to override automations on a case-by-case basis as needed. In order to implement them correctly, it is important to understand the underlying logic. The precedence hierarchy logic outlined below, uses clear, strict guidelines to perfectly balance automation and human expertise,
Table 9. Effectiveness value precedence
| Precedence | Source | Logic |
|---|---|---|
| Highest | Manual Per Finding | A value set manually by an analyst on a specific finding will never be-overwritten by a rule. |
| Middle | Effectiveness Rule | Only applies if the current value is the default Unknown. It cannot override a Manually Defined value. |
| Lowest | Default Value | Unknown is applied if no manual setting or automated rule matches the finding. |
Cortex Network Scanner
The Cortex Network Scanner is a powerful application designed to identify and analyze devices, services, and vulnerabilities in your internal network.
What is Cortex Network Scanner?
The Cortex Network Scanner, a key component of the Exposure Management portfolio, is a robust tool for internal network vulnerability assessment. The scanner efficiently identifies live hosts and vulnerabilities using various methods, including remote and authenticated local checks. Distributed as a Broker VM applet, it integrates seamlessly into your existing infrastructure.
Cortex Network Scanner provides the following key capabilities:
-
Asset discovery
Cortex Network Scanner identifies responsive hosts within a specified IP range, covering both on-premises and cloud-hosted assets.
-
Vulnerability scanning
Cortex Network Scanner supports authenticated and non-authenticated scanning:
- Non-authenticated scans use various vulnerability tests to detect vulnerabilities in the target system based on system responses without requiring credentials, including sending tailored packets to target hosts.
- Authenticated scans use the supplied credentials to authenticate into a target host and identify vulnerabilities by performing deeper tests, including detailed software enumeration and service detection.
- Customizable and targeted scanning options
- Select from different scan profiles for quick turnaround or deeper assessments.
- Specify different network configurations to adapt to different environments, such as alive test methods, ports to scan, schedules, and performance settings.
- Scan for specific vulnerabilities quickly across your asset inventory.
-
Multi-scanner support to distribute scan loads across multiple scanners
Reduce the amount of time it takes to complete large network scans by assigning multiple scanners to the task.
-
Integration with the Cortex XSIAM inventory and vulnerability management
Scan results are seamlessly integrated into the inventory and vulnerability management views in Cortex XSIAM, providing a centralized view of all discovered assets, vulnerabilities, and issues.
-
Credential test scans
Check the credentials for service accounts before launching full-scale authenticated scan.
Get started with Cortex Network Scanner
To set up and configure Cortex Network Scanner for the first time, perform the following tasks.
- Review the Deployment recommendations and complete any prerequisites.
- Deploy a Broker VM
-
Activate Cortex Network Scanner
Cortex Network Scanner is distributed as an applet on a Cortex Broker VM. Follow the instructions to activate Cortex Network Scanner on the Broker VM.
- Add a network (Optional)
- Define target groups (Optional)
- Add credentials for authenticated scans (Optional)
- Create a new scan
After completing these set-up and configuration tasks, you can and view issues and findings from scans and manage scans.
Deployment recommendations
Broker VM recommendations
Network vulnerability scanning is a resource-intensive task. To ensure optimal and consistent scan performance, we recommend the following minimal configuration for Broker VM:
- Minimum: 4 CPU cores and 16Gb of RAM
- Recommended: 8 CPU cores and 16Gb RAM
We recommend deploying a dedicated Broker VM for the Cortex Network Scanner with no other applets running, though this is not a strict technical limitation. If you plan to run other applets on the same Broker VM alongside the scanner, we recommend configuring the VM with more than 16 GB of RAM.
Note
The Cortex Network Scanner applet is not supported in High Availability (HA) cluster configurations.
The Cortex Network Scanner applet is supported for FedRAMP customers.
Firewall and other security control recommendations
The Cortex Network Scanner uses various methods to actively detect, probe and assess detected services on all or most TCP and UDP ports. The nature of vulnerability scanning conflicts with security controls such as firewalls and IPS that are meant to block such activity. When deploying Broker VMs that run the Cortex Network Scanner (further - Scanners), we recommend taking one or both of the following actions:
- [Recommended] Deploy scanners strategically within each target security zone or segment (e.g., firewall-configured segments). This ensures scanner traffic remains local to the segment and avoids crossing the firewall or other network security device.
- Configure security policy rules on the firewall and other network security controls that prevent the blocking of traffic from Cortex Network Scanner. Follow the guidelines for your security controls and keep rules as narrow as possible. For Palo Alto Networks NGFW, you must allow traffic from the scanner to the target, using “
Application”(App-ID) and “Service” (port) set to “any”.
Authenticated scan recommendations
Authenticated scans can collect more detailed information about target assets, and detect vulnerabilities that are not detectable with purely remote non-authenticated scans. If credentials are provided for the authenticated scan, the Cortex Network Scanner will attempt to login into the target machines using the provided account.
To set up a successful authenticated scan:
- Provide correct credentials for SMB (Windows-bases systems) and SSH service (Unix-based systems).
- Make sure related traffic (SMB or SSH) is allowed from the scanner to the target host.
- Configure the account with permissions that allow remote logins.
See Add credentials for authenticated scans for more information about setting up authenticated scans.
Preventing false-positive Cortex XDR alerts
Some scanning activity (e.g. open port enumeration or local checks with authenticated scans) can trigger alerts on endpoint protection solutions, such as Cortex XDR. That is expected because the same techniques are used by the attackers. To avoid causing false positive alerts, be sure to add scanner source IP addresses into the exclusions.
Recommendations for Windows-based hosts
To ensure successful scans on Windows-based hosts, configure the following services and registry settings:
-
Under Services, enable the Remote Registry on startup.
-
Create a service account and add it to the Administrators group.
-
Navigate to the active network connection under Ethernet Properties → Networking and make sure File and Printer Sharing for Microsoft Networks is enabled.
-
If not part of a Windows domain, In the registry (regedit.exe), check that DWORD LocalAccountTokenFilterPolicy is set to 1.
Set-ItemProperty -Path 'HKLM:\SOFTWARE\Microsoft\Windows\CurrentVersion\Policies\System\ -Name 'LocalAccountTokenFilterPolicy' -Value 1
Configure the following Windows Firewall settings:
- Make sure ports 149, 445, and other services you want to scan are allowed in the firewall rules.
Activate Cortex Network Scanner
The Cortex Network Scanner identifies and analyzes devices, services, and vulnerabilities in your internal network. It discovers responsive hosts within specified IP ranges, including on-premises and cloud environments. The scanner supports both non-authenticated and authenticated vulnerability scanning, with authenticated scans providing deeper insights through credential-based access. Scan results are seamlessly integrated into the inventory and vulnerability management views in Cortex XSIAM, providing a centralized view of all discovered assets, vulnerabilities, and issues.
Cortex Network Scanner is installed as an applet on a Broker VM.
Notice
This feature is included with a Cortex XSIAM Premium license. It is also included with an active Cortex XSIAM NG SIEM and Cortex XSIAM Enterprise license that has the Exposure Management add-on.
Important
The Cortex Network Scanner applet is supported for FedRAMP customers.
Cortex Network Scanner does not support high availability (HA) Broker VM configuration.
Prerequisites
- Review the Cortex Network Scanner deployment recommendations and complete any prerequisites.
- Set up and configure Broker VM
How to activate Cortex Network Scanner
- Navigate to Settings → Configurations → Data Broker → Broker VMs.
- Right click the Broker VM, and select Add App → Network Scanner.
-
After the applet has installed, the scanner should automatically connect to the tenant. If the connection is successful, you’ll see a green dot next to Network Scanner in the Apps column of the Broker VMs table.
A red dot indicates that an error occurred and the scanner is not connected.
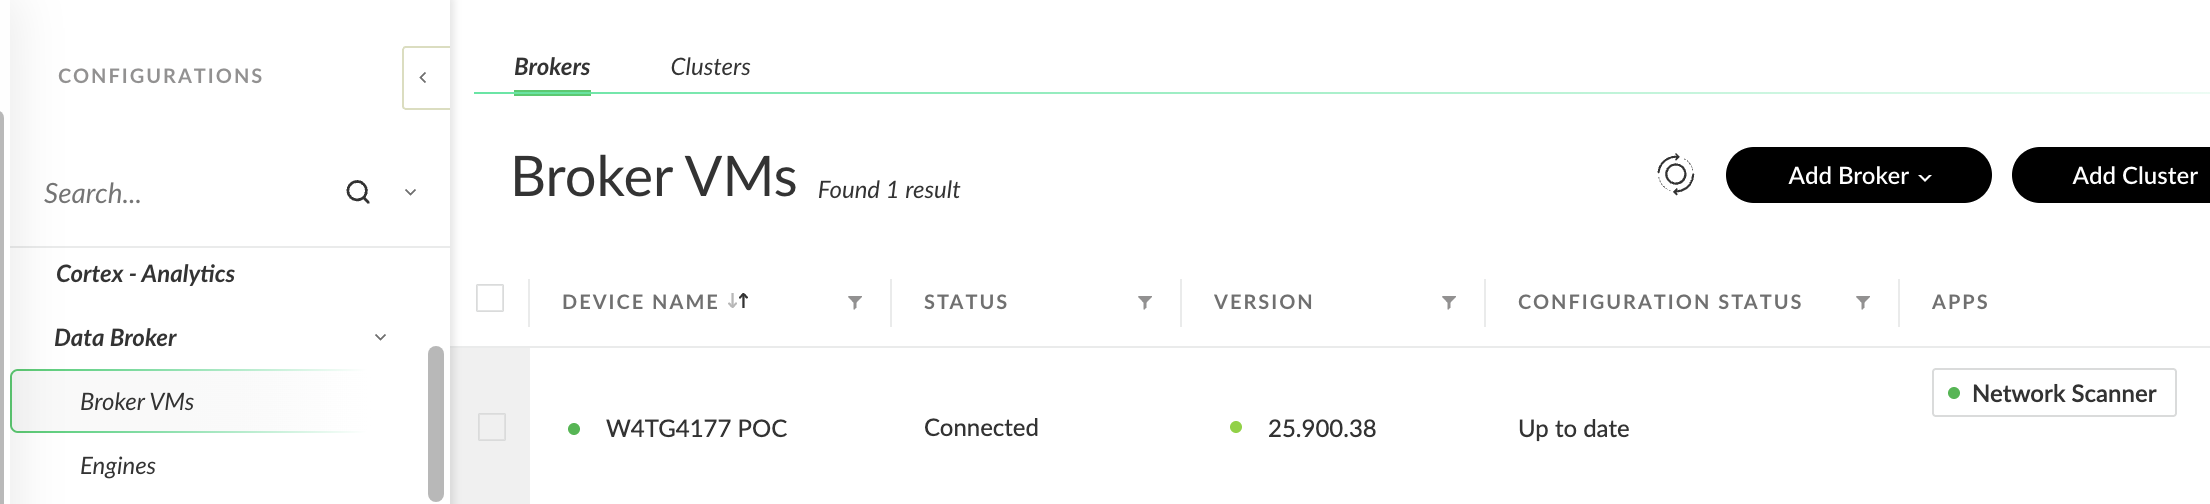
- (Optional) Click on the network scanner in the table to display details about the scanner or to deactivate it.
-
Validate the installation. Navigate to Modules → Vulnerability & Exposure Management → Network Scanners → Network Scanners and find your new scanner in the list.
The Network Scanners page displays all your deployed and configured scanners, along with additional details about each of them.
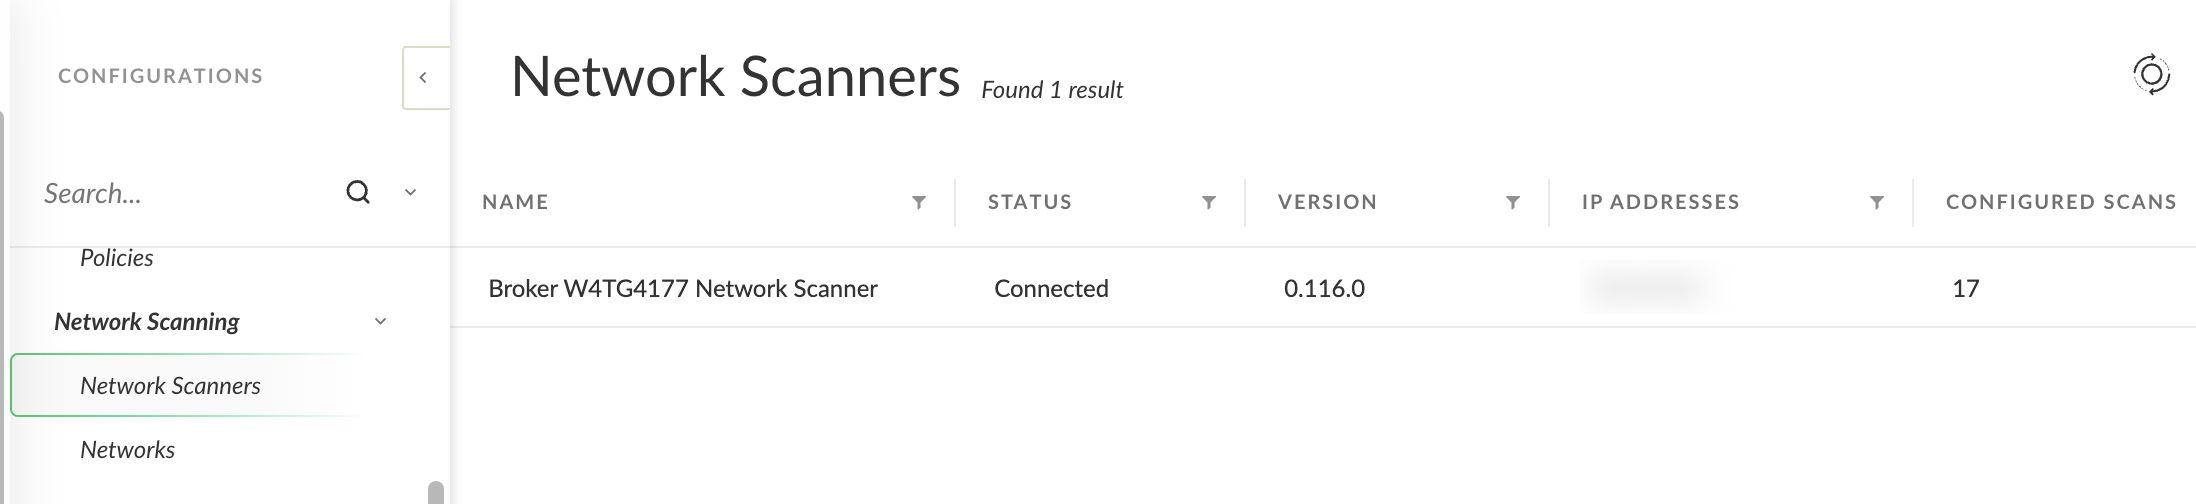
After setting up a Broker VM and activating Cortex Network Scanner, refer to Get started with Cortex Network Scanner for information about adding networks, adding credentials for authenticated scans, and configuring scans.
Add a network
When performing scans, Cortex Network Scanner primarily operates at the IP level, identifying assets as IP hosts. This means it recognizes and interacts with devices based on their unique IP addresses within the scanned network.
In certain environments, you might encounter overlapping or duplicate private IP ranges. For example, your New York and London branch offices could both be using the private network 172.16.1.0/20. If both offices are located behind Network Address Translation (NAT), a server in London and an employee's laptop in New York can legitimately have the same IP address (e.g., 172.16.1.100) without causing conflicts in their respective local networks. This is because NAT translates these private IP addresses to unique public IP addresses when they communicate outside their local network, effectively isolating the private IP spaces.
However, the scan results from the scans are being aggregated at the asset level, taking into the account that the same host can have multiple IP addresses or change the IP address during the asset’s lifecycle. To avoid confusion and mixing up the scan results at the asset level, you can configure a separate network for each location.
You can also add networks for better scan organization.
How to add a network
- Navigate to Settings → Configurations → Network Scanning → Networks and click + Add Network.
- Enter a Name and Description.
After you've added a network, you can specify that network when configuring a scan.
Define target groups
Cortex Network Scanner target groups help you collate a list of hosts to be scanned. Each target group contains a mandatory list of IP addresses, IP ranges, subnets, and hostnames to be scanned, and an optional list of IPs, ranges, subnets, or hostnames to be excluded from scans.
Target group definitions are saved, so you can reuse them in multiple scans and review, edit, and delete them as needed. You can create up to 100 target groups, with each one able to include up to 10,000 individual IP addresses, IP ranges, and hostnames.
Create target groups to streamline network scanning configuration by selecting and reusing target definitions. Another benefit is that the target group's name is added as a tag to the asset's definition, so you can find, sort, filter, and create asset groups based on the target group. Target group tags will not overwrite existing tags.
How to define target groups
-
Navigate to Settings → Configurations → Network Scanning → Target Group Management.
The Target Group Management page lists all of your saved Target Groups.
- Click + Add Target Group.
- Provide information in the following fields:
- Name: Provide a descriptive name for the Target Group.
- Description: (Optional) Enter a description.
-
Add or Upload Targets: Enter the targets to be scanned as a comma-separated list. Targets can be IP addresses, IP ranges, CIDR ranges, or hostnames. You can also add targets by uploading a .csv file.
The Cortex Network Scanner will use the DNS server configured in the network settings of the Broker VM for hostname resolution.
- Exclude Targets: (Optional) Enter the targets to be excluded.
-
Click Save Target.
Your Target Group will appear in the list on the Target Group Management page.
You can edit or delete target groups by right-clicking on the target group and selecting Edit Target or Delete.
Auto tag discovered assets
Leverage Network Scanner target groups to automatically tag discovered assets. You can use these tags to quickly filter assets, or create Asset Groups to narrow down Finding and Issues results to a specific scan job or asset group.
How to add a target group
- Create a Target Group: Navigate to Settings → Configurations → Network Scanning → Target Group Management and select Add Target Group. Enter the IP ranges, individual IPs, or hostnames you want to scan, along with any necessary exclusions.
- Enter the IP ranges, individual IPs, or hostnames you want to scan, along with any necessary exclusions.
- Configure the Scan: During scan configuration, select your Target Group from the dropdown menu, then launch or schedule the scan.
-
Verify Asset Tags: After the scan completes, all observed assets will automatically receive an asset tag. The tag follows this pattern:
- Key: network_scanner.target.%Target_Group_Name% (where %Target_Group_Name% is the name of the target group assigned to the scan).
- Value: true
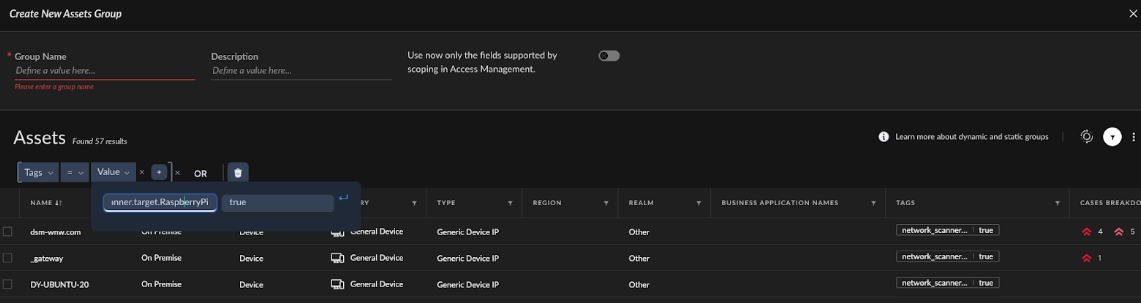
- Create a Dynamic Asset Group: You can use this tag to filter assets or create a dynamic Asset Group.
- Go to InventoryAsset Groups.Click Add Group.
- In the filter menu, select Tags and copy your tag key into the relevant field.
- Set the value to True.
- The Asset Group will automatically select all assets that have this tag, including those discovered in future scans.
- Filter Results: You can now use your new Asset Group to filter Issues and Findings within Posture Management.
Manage Network Scanner credentials
An authenticated scan provides a more comprehensive view of system vulnerabilities by examining the target both externally, via the network, and internally, using valid user credentials. For an authenticated scan, the scanner logs into the target system using pre-configured user credentials, which are used to authenticate to various services on the target.
The scanner will try credentials on all targets with a corresponding service, for example SSH credentials will be tried if the scanner detects an SSH server. You can add multiple credentials of the same type to a scan, and the scanner will try to authenticate with them one at a time until authentication is successful.
Scan results might be limited by the permissions associated with these user accounts.
Add credentials for authenticated scans
Complete this task to add and save credentials to be used for authenticated network scans.
Prerequisites
Before initiating an authenticated scan, complete the following prerequisites on your target hosts:
-
Create dedicated service accounts.
We highly recommend creating dedicated service accounts on your target devices specifically for the network scanner. Avoid using existing administrative accounts or personal user accounts. This practice enhances security by limiting the potential impact if the credentials are ever compromised and allows for granular control and auditing of scanner activities.
-
Ensure that required access rights are configured and remote access is enabled.
The service accounts must have the necessary permissions to collect system information and perform vulnerability checks remotely. Additionally, the respective remote access protocols must be enabled on the target devices.
For Windows Targets (SMB/WinRM): Follow the guidelines in the Get started with Cortex Network Scanner section.
For Linux Targets: The service account must have permissions to execute commands via SSH.
- Ensure the SSH daemon (sshd) is running on the target device.
- Verify that password authentication (or public key authentication, if configured) is enabled for the service account in the sshd_config file (located typically at /etc/ssh/sshd_config).
-
Verify firewall and network security device configuration.
Remote access traffic must not be blocked by any firewalls (host-based or network-based) or other network security devices (e.g., intrusion prevention systems, network access control).
For Windows Targets:
- Windows Defender Firewall: Ensure inbound rules are configured to allow traffic for "File and Printer Sharing" (TCP ports 139, 445) and/or "Windows Remote Management" (TCP port 5985 for HTTP, 5986 for HTTPS).
- Network Firewalls: If there's a network firewall between the scanner and the target, ensure that TCP ports 139, 445, 5985, and 5986 are open for communication from the scanner's IP address to the target's IP address.
For Linux Targets
- Host-based Firewall (e.g., ufw, firewalld): Ensure that SSH traffic (TCP port 22) is allowed. For example, using
ufw: sudo ufw allow ssh. - Network Firewalls: Ensure that TCP port 22 is open for communication from the scanner's IP address to the target's IP address.
How to add credentials for authenticated scans
Add and save the credentials to be used for authenticated scans on the Credential Management page.
-
Navigate to Settings → Configurations → Network Scanners → Credential Management.
The Credential Management page lists all of your saved credentials.
- Click + Add Credentials in the upper right.
- Provide information in the following fields:
- Name: Provide a descriptive name for this set of credentials.
- Description: Optionally, provide a description.
- Service: Select one of the service and credential types from the dropdown menu and add the credentials:
- SSH (Username/Password): Requires username, password, port.
- SSH (Username/SSH Key): Requires username, passphrase (optional), port. You will also upload your private SSH key in PEM or OpenSSH format.
- SMB: Requires username and password.
- ESXI: Requires a VMware vSphere UI username and password.
- Click Save Credential. Your new credentials will appear in the list on the Credential Management page.
Note
For security reasons, you cannot edit saved credentials, but you can delete them and create new ones as needed.
Test saved credentials
Cortex Network Scanner provides a convenient method for validating stored authentication credentials against target hosts. This functionality ensures that the credentials are valid and can be successfully used for authenticated scans.
When testing credentials, you'll specify one or more scanners and target hosts. Cortex Network Scanner will attempt to login to the hosts with the credentials and report back the results, without scanning for vulnerabilities. You can view credential test history and test results for each set of credentials
The solution supports authentication testing via SSH and SMB protocols.
How to test saved credentials
- Navigate to Settings → Configurations → Network Scanning → Credential Management.
- Right-click on a credential in the table, and select Test Credential.
- Provide the following information on the Test Credentials dialog box:
- Network: Select a network to be scanned.
- Network Scanner(s): Select one or more Cortex Network Scanners.
- Configure the targets by selecting previously defined target groups or manually adding and excluding targets.
-
Select Target Groups: Select one or more previously saved Target Groups from the drop-down menu.
Or
-
Manually Add Targets: List the targets to be scanned. Targets can be IP addresses, IP ranges, CIDR ranges, or hostnames.
Manually Exclude Targets: (Optional) List the targets to be excluded from the scan.
-
View credential test history and results
You can view the test history for each credential. For each entry in the history table, you can also view the credential test results, which includes the list of target IP addresses and whether the credential was successful or a failure for each target. Perform the following steps to view the credential test history and credential test results.
- Navigate to Settings → Configurations → Network Scanning → Credential Management.
-
In the Credential Management table, click on the credentials you want to test.
The Credential Test History page will open.
-
To view the test results for one of the credential test history entries, click on that row in the table.
The Credential Test Results page will open, which displays the list of targets that the credentials were tested on and whether each test was successful or not.
Create a network scan
Cortex XSIAM uses the Network Scanner to identify active hosts, services, and vulnerabilities within your internal network (on-premises and cloud). After installing Cortex Network Scanner, you can create one or more scans that you schedule to run periodically or run on demand. Learn more about scan templates, the steps to create and schedule a scan, and the advanced scan settings.
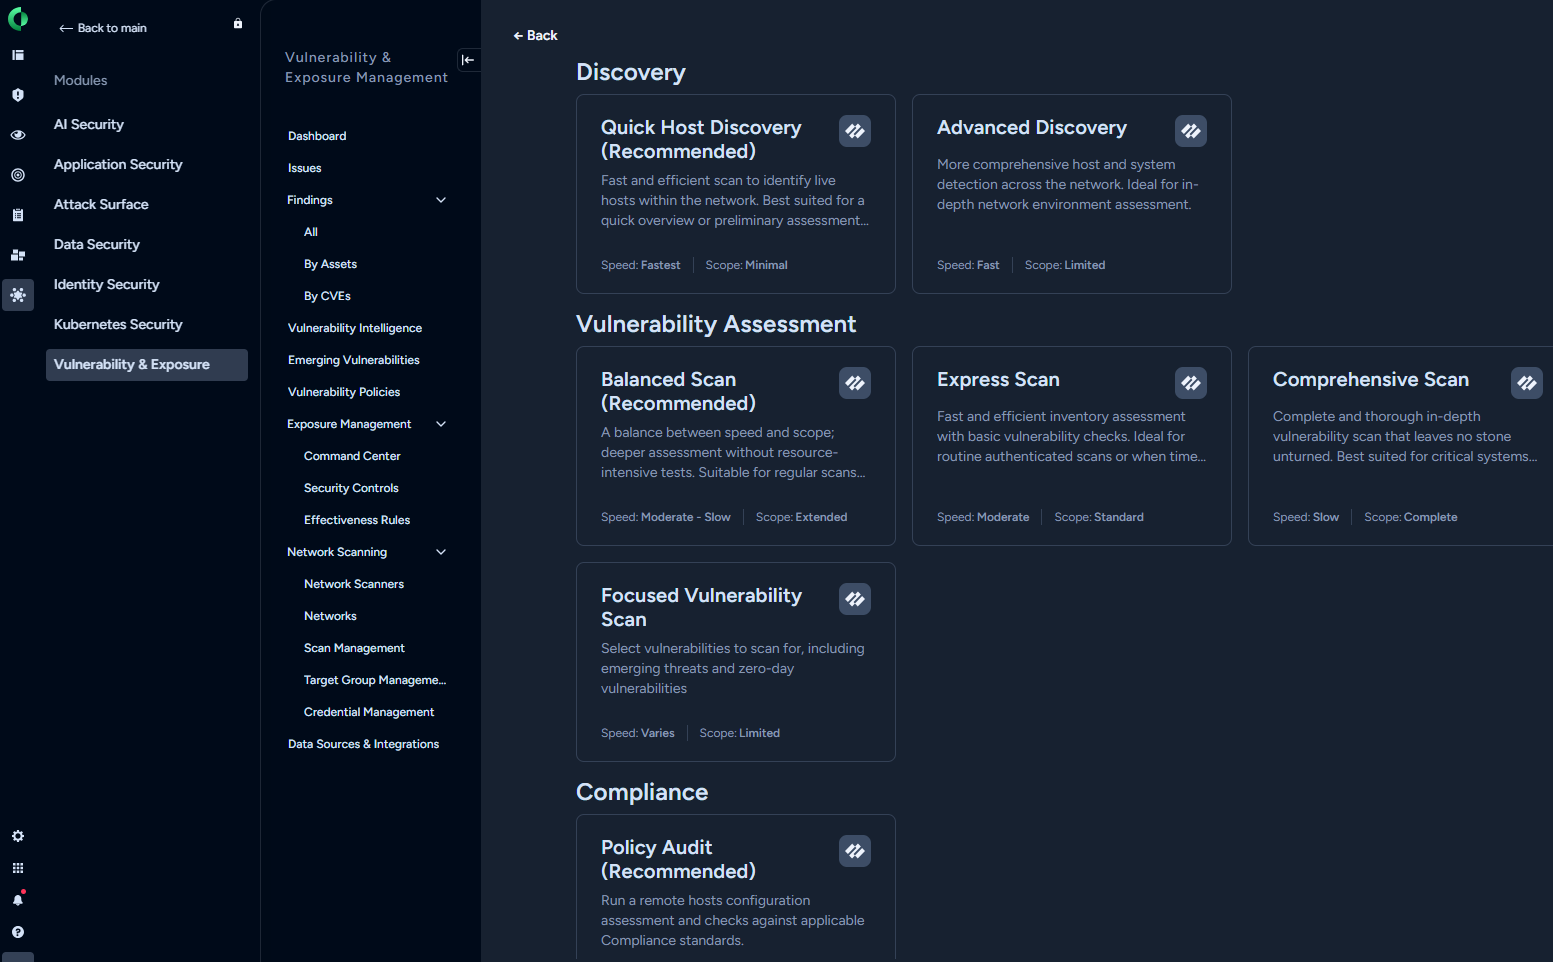
-
Prerequisites and Setup
Before creating a scan, ensure the appropriate components are configured based on your scan type:
- For Network Scans :
- Broker VM & Applet: A Broker VM must be active with the Network Scanner applet installed and connected indicated by a green status dot in Settings → Configurations → Data Broker → Broker VMs.
- Optional:
- Target Groups: Create reusable groups of IP addresses or hostnames.
- Credentials: Save SSH (Unix) or SMB (Windows) credentials in Settings+Configurations+General+Credentials.
- For Network Scans :
-
Scan Creation Wizard
To begin, navigate to Modules+Vulnerability & Exposure Management+Scan Management and click + Create Scan. Select a template based on your objective:
- Discovery Scan: Identifies active hosts and gathers high-level OS information.
- Vulnerability Scan: Performs deep inspection of services to identify known CVEs and security weaknesses.
- Focused Vulnerability Scan: Targets specific vulnerabilities, including emerging threats and zero-day vulnerabilities (ideal for verifying patches or high-priority CVEs).
- Policy Audit Scan: Helps you check if a specified Asset Group is in compliance with selected policies and standards. CIS Microsoft Windows 11 Enterprise Benchmark, Microsoft Windows Server 2022 Benchmark, Debian, and Ubuntu are currently supported
-
General Configuration
Configure the basic identity and timing for the scan:
- Name & Description: Provide a unique identifier and optional context.
- Scan Scheduling:
- Create and save the scan configuration. To launch a scan, right click on the configured scan and select Launch Scan.
- Launch Once: Schedules a single execution at a future date/time.
- Recurring (Days of Week/Month): Sets a repeating schedule.
- Quiet Hours: Define specific time windows where scanning is paused to prevent interference with business operations.
-
Scope Selection:
Define the boundaries of the scan:
- Network: Select the defined network environment to be scanned.
- Network Scanner: Choose one or more Broker VMs to execute the scan. Traffic is distributed across selected scanners; ensure firewall rules allow scanner-to-target traffic.
- Inclusions:
- Target Groups: Select previously configured and saved Targets.
- Asset Groups: Select previously saved Asset Groups, managed within the Asset Inventory as Targets .
- Manual Targets: Directly enter IP addresses, CIDR ranges, or hostnames.
- Exclusions:
- Manual Exclusions: List specific IPs or ranges to skip.
- Exclusions override Inclusions: When enabled, any asset excluded in one group remains excluded even if it appears in another included group.
- Saved Credentials: Select one or more credentials. For security reasons you can add only up to 5 credentials to the scan. The scanner attempts these sequentially on each host until authentication succeeds.
-
Scan Performance and Optimization
To ensure optimal performance without impacting network stability:
- Broker VM Resources: Ensure the scanner host has at least 4 CPU cores and 8GB RAM. 8 core CPU and 16 GB RAM is highly recommended for large scale scans
- Recommended Deployment Strategy: Deploy scanners strategically within target security zones to keep traffic local and avoid crossing firewalls.
- Firewall Rules: If scanning across network boundaries, allow traffic from the scanner to "Any" application and "Any" service/port on target devices.
- Windows Targets: Ensure ports 139 and 445 are open for SMB-based authenticated scans.
-
Monitoring Results
Once a scan is initiated, you can track its progress in the Scans table.
- Reviewing Issues: Completed scan data is integrated into the Vulnerability Management views. Navigate to Vulnerability & Exposure Management → Issues to investigate discovered vulnerabilities and unmanaged devices.
Advanced Settings
The following sections describe the advanced scan settings. Most Cortex Network Scanner use cases can use default settings.
Discovery settings
| Discovery setting | Description | Default |
|---|---|---|
| Host Detection Method | <ul><li><p>ICMP Ping</p><p>Uses Internet Control Message Protocol (ICMP) echo requests to determine if a host is reachable and responsive on the network.</p></li><li><p>TCP-ACK Service Ping</p><p>Sends TCP ACK packets to specific ports to check for acknowledgment responses, indicating an active host with open ports.</p></li><li><p>TCP-SYN Service Ping</p><p>Initiates a TCP handshake by sending SYN packets to target ports and waits for SYN-ACK responses to identify active hosts.</p></li><li><p>ARP Ping</p><p>Uses ARP requests to directly query the network for active hosts by mapping IP addresses to their corresponding MAC addresses.</p></li></ul> | <div data-gb-custom-block data-tag="hint" data-style="info" class="hint hint-info"><p>Tip</p><p>ICMP Ping provides the quickest discovery scan and is good for initial discovery and scoping, however in the modern enterprise environment ICMP response can be blocked by the firewall or endpoint security rules. Using additional methods increases the accuracy of the host discovery, although makes the scan take a longer time. The best approach is to use a combination of several methods to keep the balance between accuracy and speed.</p></div><p>The default setting is ICMP, TCP_ACK, ARP.</p> |
| Port List | List of ports that will be used to identify alive hosts (changing this setting does not change the ports to be scanned for vulnerabilities). | The default settings enables discovery scanning on the most commonly responding services. |
| Order in Which to Scan Hosts | Options are random, reversed, or sequential. | Sequential |
Assessment settings
| Assessment setting | Description | Default |
|---|---|---|
| Ports to Scan | Choose one one of the pre-defined port lists to scan for vulnerabilities. | The default is Common TCP ports, top 100 UDP ports, which was determined by the Palo Alto Networks security research team. |
| Include or Exclude Ports | <p>This setting allows you to precisely control which TCP and UDP ports are scanned by either adding them to be included or excluded from your selected port list.</p><p>Inclusion Logic: If you add a port to the inclusion list that is already present in your selected port list, it will not result in a duplicate entry or change the existing scan behavior for that port.</p><p>Exclusion Precedence: The exclude option takes precedence. If a port is present in both your selected port list and the "Exclude Port list", it will be excluded from the scan. This ensures that any explicitly excluded port will not be scanned, regardless of its presence in an inclusion list.</p> | None |
| Non-authenticated Test Only | When this option is enabled, the scanner will only perform tests that do not require authentication on the target machine. No login attempts will be made whatsoever. | Disabled |
| Trust Service Banners | When selected, the scanner trusts remote host banners and only launches plugins against services they have been designed to check. This default behavior optimizes scanning performance and avoids false positives. | Selected |
| Expand vHosts | If selected, the scanner will expand the list of target hosts with values gathered from sources such as reverse-lookup queries and VT checks for SSL/TLS certificates. | Enabled |
| Enable Advanced Windows Scanning | When selected, this option activates an enhanced scanning mode that attempts to start the Remote Registry service and uses WMI for file searches on Windows targets during authenticated scans. This improves vulnerability detection but may lead to alerts or blocks from endpoint protection solutions (e.g., Cortex XDR). Configure necessary exclusions in your endpoint protection policies. | Disabled |
Performance settings
| Performance setting | Description | Default |
|---|---|---|
| Test Timeout (Seconds) | Timeout per test. | 5 seconds |
| Wait Time Between Requests (Seconds) | Number of seconds the security check will wait before sending another request. | 5 seconds |
| Max Hosts to Test Simultaneously | Maximum number of hosts to test at the same time. This value must be computed given your bandwidth, the number of hosts you want to test, your amount of memory, and the performance of your processors. | 30 |
| Max Simultaneous Tests per Host | The maximum number of tests that will run against each host. Caution: launching too many tests simultaneously could disable the remote host. | 4 |
| Test Result Timeout (Seconds) | Maximum number of seconds for scanner to perform the scan. | 3600 seconds |
| Number of Test Retries After a Timeout | Maximum number of retries after a timeout. | 5 |
| Open Socket Max Attempts | Number of unsuccessful retries to open the socket before setting the port to closed. | 5 |
Manage scans
The Scan Management page lists all your configured scans along with important information about each scan, including scan progress. From this page you can perform most scan management operations.
- Navigate to Settings → Configurations → Network Scanners → Scan Management.
-
Right-click on a scan in the list to perform the following actions:
Action Description Launch Scan <p>Start the scan.</p><p>Note that scheduled scans start automatically. Manually launching a scan will run it without quiet hour restrictions and will cause it to skip any scheduled scan, if the runtimes overlap.</p> Edit Scan Modify the scan settings. Cancel Scan Cancel an actively running scan. Changes the Scan Progress field to Canceling and then Canceled. Pause Scan Pause an actively running scan. Changes the Scan Progress field to Pausing and then Paused. Resume Scan Resume a paused scan. View Rescan History View a list of all completed rescans to assess the effectiveness of remediation efforts. You can also download a CSV report scan results here. Delete Scan Remove scan from scan list. - (Optional) Click on a scan to display the scan history, including the status of every historical scan, whether a scan is currently running and the progress, scan duration, and the number of dead, alive, and completed hosts.
Scan Progress values
The following table explains the Scan Progress field values on the Scan Management page.
| Scan Progress value | Description |
|---|---|
| New | Scan has never been run. |
| Completed | The last scan completed successfully. |
| Canceled | The last scan was canceled. |
| Canceling | Scan is in the process of being canceled. |
| Failed | The last scan failed. |
| Paused | The scan was manually paused or automatically paused because of configured quiet hours. |
| Pausing | Scan is in the process of being paused. |
View issues triggered by network scanner findings
Cortex Network Scanner creates findings when it observes CVEs on scanned assets. Cortex XSIAM creates issues if any of those findings match vulnerability issue policies. Cortex Network Scanner findings are part of the overall Cortex XSIAM inventory and vulnerability management views and workflows. Complete the following steps to view issues triggered by network scanner findings:
- Navigate to Posture Management → Vulnerability Management → Vulnerability Issues.
- Filter the list of vulnerability issues on Source = Network Scanner.
Alternatively, you can also view issues triggered by the Network Scanner from the Findings page, Posture Management → Vulnerability Management → Vulnerability Issues → All Vulnerability Findings.When viewing an issue you also have the option to initiate a rescan to evaluate the success of remediation efforts as described below:
- Navigate to Posture Management → Vulnerability Management → Vulnerability Issues. From the list view, select the issue you wish to rescan.
-
Right-click on the issue and select Scan Now from the drop-down options.
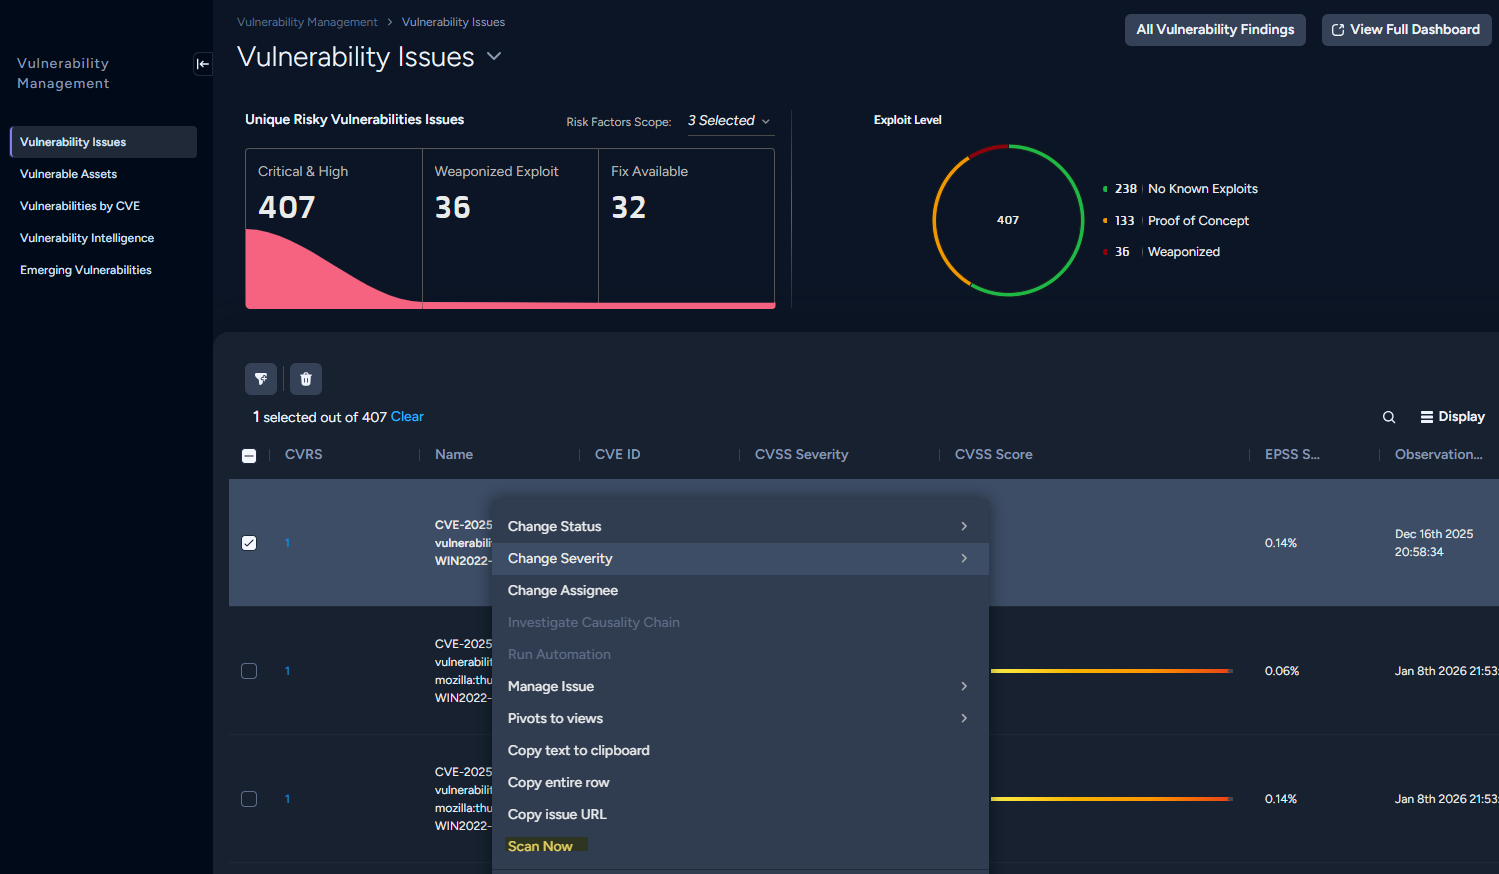
- Alternatively, Select Scan Now from the options menu to quickly repeat the scan for the already scanned assets. Keep in mind that the rescan option is only available for assets that have already been scanned by the Cortex Network Scanner.
- On the confirmation modal, select Scan Now to initiate the scan. Rescan can take up to a few hours. You will not be able to launch another rescan of the same asset until the previous one is completed or if less than 4 hours passed. You can cancel the ongoing rescan through the Scan History view (see below).
- Navigate to Settings → Configurations → Network Scanners → Scan Management → Rescan History to view updated scan history for the scanned asset. You will also receive an email confirmation when the rescan is complete. If the previously detected vulnerability no longer exists, the original issue or finding will be closed.
Exposure Management Command Center
The Exposure Management Command Center dashboard provides a dynamic, overall view of your exposure management operation with visualizations, key performance indicators, and actionable data that is useful to both executives and vulnerability management teams.
You can click on many elements in the command center to drill down to more focused dashboards or pages displaying data that is filtered by your selection.
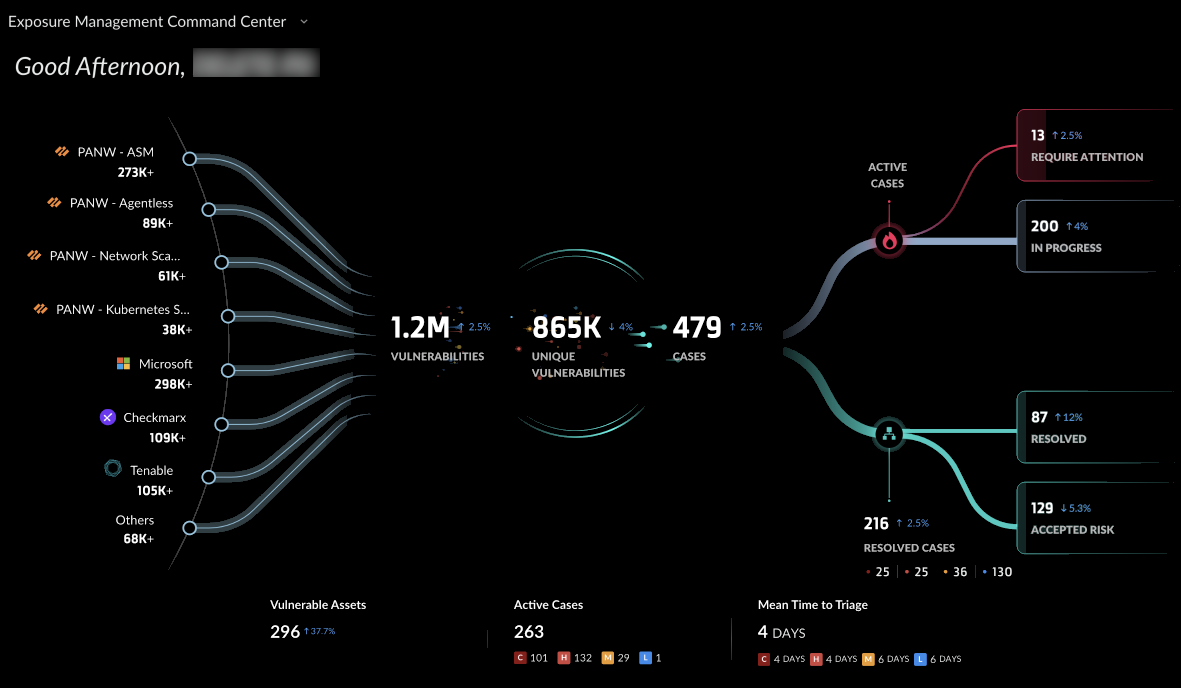
The table below describes each section of the visualization, from left to right.
| Section | Description |
|---|---|
| Sources | <p>Each vulnerability data source is displayed along with number of vulnerabilities findings. Click on this section to open the Source Coverage and Optimization section, which displays details about the overlap in vulnerabilities across the sources.</p> |
| Vulnerabilities | The total number of vulnerability findings from all sources. |
| Unique Vulnerabilities | <p>The total number of vulnerability findings after deduplication. Deduplication removes duplicate findings, which are defined as findings for the same CVE on the same asset. Click on Unique Vulnerabilities to display the Prioritization section, which shows how findings are deduplicated, prioritized, and grouped into cases.</p> |
| Cases | <p>The number of cases created after the system has prioritized the findings, created vulnerability issues, and groups the issues into cases.</p><p>Vulnerability issues are grouped into cases based on the fix for resolving the vulnerability. Issues with the same fix are grouped together into a single case.</p> |
| Active Cases | <p>Number of active cases, broken down into the following categories:</p><ul><li>Require Attention: Cases with the status New.</li><li>In Progress: Cases with the status In Progress</li></ul><p>Click on any of these Active Cases categories to display the list of cases along with case details, status, and recommended actions.</p> |
| Resolved Cases | <p>Total number of resolved cases, number of resolved cases by severity, and resolved cases broken down into the following categories:</p><ul><li>Resolved: Cases with any Resolved status except Accepted Risk.</li><li>Accepted Risk: Cases with the status Resolved - Accepted Risk.</li></ul><p>Click on either of these Resolved Cases categories to display the list of cases along with case details, status, and additional information.</p> |
The following table explains the data points displayed along the bottom of the Exposure Management Command Center.
| Data Point | Description |
|---|---|
| Vulnerable Assets | Number of assets with one or more active vulnerability issues. |
| Active Cases | Number of cases in an active status, broken down by case severity. |
| Mean Time to Resolve | Mean of the creation date to the date when the case was assigned a terminal closed status, broken down by case severity. |
The following sections describe the focused dashboards that appear when clicking on specific elements in the command center.
Source Coverage and Optimization
The Source Coverage & Optimization page shows a breakdown of the vulnerability findings from each source and the overlap in findings between third-party sources and Palo Alto Networks sources. The data and and visualizations on this page show you which of your sources are most effective and help determine if you can consolidate vulnerability tools.
| Section | Description |
|---|---|
| Vulnerabilities Before Deduplication | Total number of vulnerability findings from all sources before deduplication. |
| Overlap with <source> | Highest amount of vulnerability overlap between Palo Alto Networks sources and a third-party product. The label HIGH indicates a greater than 30% overlap between the Palo Alto Networks and this third-party vendor. |
| Findings bar | Number of vulnerability findings from Palo Alto Network sources, not deduplicated. Hover over the different sections of the bar to see the breakdown of findings come from each Palo Alto Networks source. |
| Overlap | List of third-party sources and the number of vulnerability findings from each source that overlap with Palo Alto Networks sources. |
| Findings | Total number of vulnerability findings from each third-party source. |
Prioritization
The Prioritization page breaks down how Cortex XSIAM starts with the total number of raw vulnerability findings in your environment and deduplicates, prioritizes, and consolidates them into a manageable number of cases that require attention. Percentages that appear next to some values indicate the change over the last 30 days. The table below explains each part of visualization, from left to right.
| Section | Description |
|---|---|
| Vulnerabilities | The total number of vulnerability findings across all sources. |
| Duplicative Findings | Number of duplicate findings that were eliminated. Duplicate findings are findings for the same CVE on the same asset. |
| Unique Vulnerabilities | The number of vulnerability findings after deduplication. |
| <p>Not Internet Exposed</p><p>Low Business Impact</p><p>No Known Public Exploits</p><p>Low and Medium CVSS Base Score</p><p>Deprioritized by Policy</p> | <p>These are the low-priority findings that did not result in the creation of an issue. The reason for deprioritization is provided along with the count.</p><ul><li>Not Internet Exposed: ASM and CNA data indicates that these vulnerabilities are not exposed to the internet.</li><li>Low Business Impact: The asset group for the vulnerability is dev, test, internal, or low business criticality.</li><li>No Known Public Exploits: These vulnerabiliities have an EPSS score less than 80% or other public data indicating the vulnerability hasn't been exploited.</li><li>Low and Medium CVSS Base Score: CVSS severity is Low or Medium.</li><li>Deprioritized by Policy: These vulnerabilities were deprioritized by custom policies created by your organization. Typically this is any policy that specifies not to create an issue for a specific type of vulnerability.</li></ul> |
| Open Issues | The number of open vulnerability issues. |
| Issues Consolidated into Cases | Number of issues that were consolidated into open cases. Issues are grouped together into cases based on whether they share the same fix. |
| Cases | Total number of vulnerability cases after vulnerability issues were grouped into cases. |
| Require Attention | Number of cases with the status New. Click to pivot to a filtered view of the cases that includes detailed information to help you investigate and remediate each case. |
| In Progress | Number of cases with the status In Progress. Click to pivot to a filtered view of the cases that includes detailed information to help you investigate and remediate each case. |
| Resolved | Number of cases with the status Closed - Remediated or Closed - No Longer Observed. |
| Accepted Risk | Number of cases with the status Accepted Risk. |
Cortex Advanced Email Security
Protect Microsoft 365 mailboxes from email-borne threats.
Plan and deploy
| Understand the module and its core capabilities. | cortex-advanced-email-security-module-overview |
| Review the system components and email data flow. | cortex-advanced-email-security-module-architecture-and-data-flow |
| Follow the high-level deployment workflow. | getting-started-with-the-cortex-advanced-email-security-module |
| Connect Microsoft 365 and configure the module. | deploy-and-configure-the-email-security-module |
Detect and respond
| Understand detections, insights, and generated issues. | cortex-advanced-email-security-threat-detection-and-issues |
| Investigate email security issues and take response actions. | investigate-and-respond-to-email-security-issues |
| Create response rules and manage remediation actions. | automate-remediation-for-the-cortex-advanced-email-security-module |
Monitor and manage
| Monitor your email security posture at a glance. | email-command-center |
| Triage and act on malicious email threats. | malicious-email-inventory |
| View and manage protected email assets. | mailbox-inventory |
| Review security controls and data residency. | Advanced Email Security module security and compliance |
Cortex Advanced Email Security module overview
Prerequisite
The following are prerequisites for using the Cortex XSIAM Advanced Email Security module.
| Requirement | Description |
|---|---|
| Setup and Permissions | Ensure Analytics is activated before enabling the Cortex Advanced Email Security module. |
| Licenses and Add-ons | Cortex Advanced Email Security add-on. |
The Cortex Advanced Email Security module provides a scalable detection, investigation, and response layer over cloud-hosted email environments. It connects directly to supported email platforms via secure API integrations to ingest rich message-level and identity-related telemetry.
Unlike legacy approaches that rely on inline enforcement, this module operates passively, requiring no mail flow changes, and is optimized for modern, distributed email infrastructures. After the module is connected, it continuously collects data across messages, artifacts (e.g., links, attachments), user identities, and authentication metadata. This data is processed through a multi-layered analysis engine designed to surface early-stage threats, campaign patterns, and high-risk behaviors.
This document provides detailed technical guidance for onboarding, configuring, and operating the module. It is intended for security administrators and operators with access to email platform APIs, and familiarity with foundational email security concepts for example, SPF/DKIM/DMARC, MIME structure, phishing tactics.
Key capabilities and functional highlights
The Cortex Advanced Email Security module is composed of the following core components:
Supported email platforms and services
The module supports cloud-native email platforms that expose secure APIs for mailbox telemetry, user directory access, and optional remediation actions.
Supported integration capabilities include:
- Read-access to user mailboxes
- Header and authentication metadata
- Access to reported phishing addresses
- Mailbox/user scoping via directory service
- Remediation permissions (delete, move, tag)
Unsupported environments:
- On-premise Exchange or SMTP-only deployments
- Hybrid email architectures with incomplete API visibility
- IMAP/POP-based collection (protocol-only)
For detailed setup instructions and platform-specific capabilities, refer to the Deployment and Configuration section.
Supported regions
The module is available in the following regions:
- Australia (AU)
- Canada (CA)
- France (FA)
- Germany (DE)
- India (IN)
- Japan (JP)
- Netherlands
- Singapore (SG)
- South Korea (KR)
- United Kingdom (UK)
- United States (US)
Cortex Advanced Email Security module architecture and data flow
The Cortex Advanced Email Security module is composed of several logical components, deployed in a cloud-native architecture. These components work together to ingest, analyze, and respond to email-borne threats.
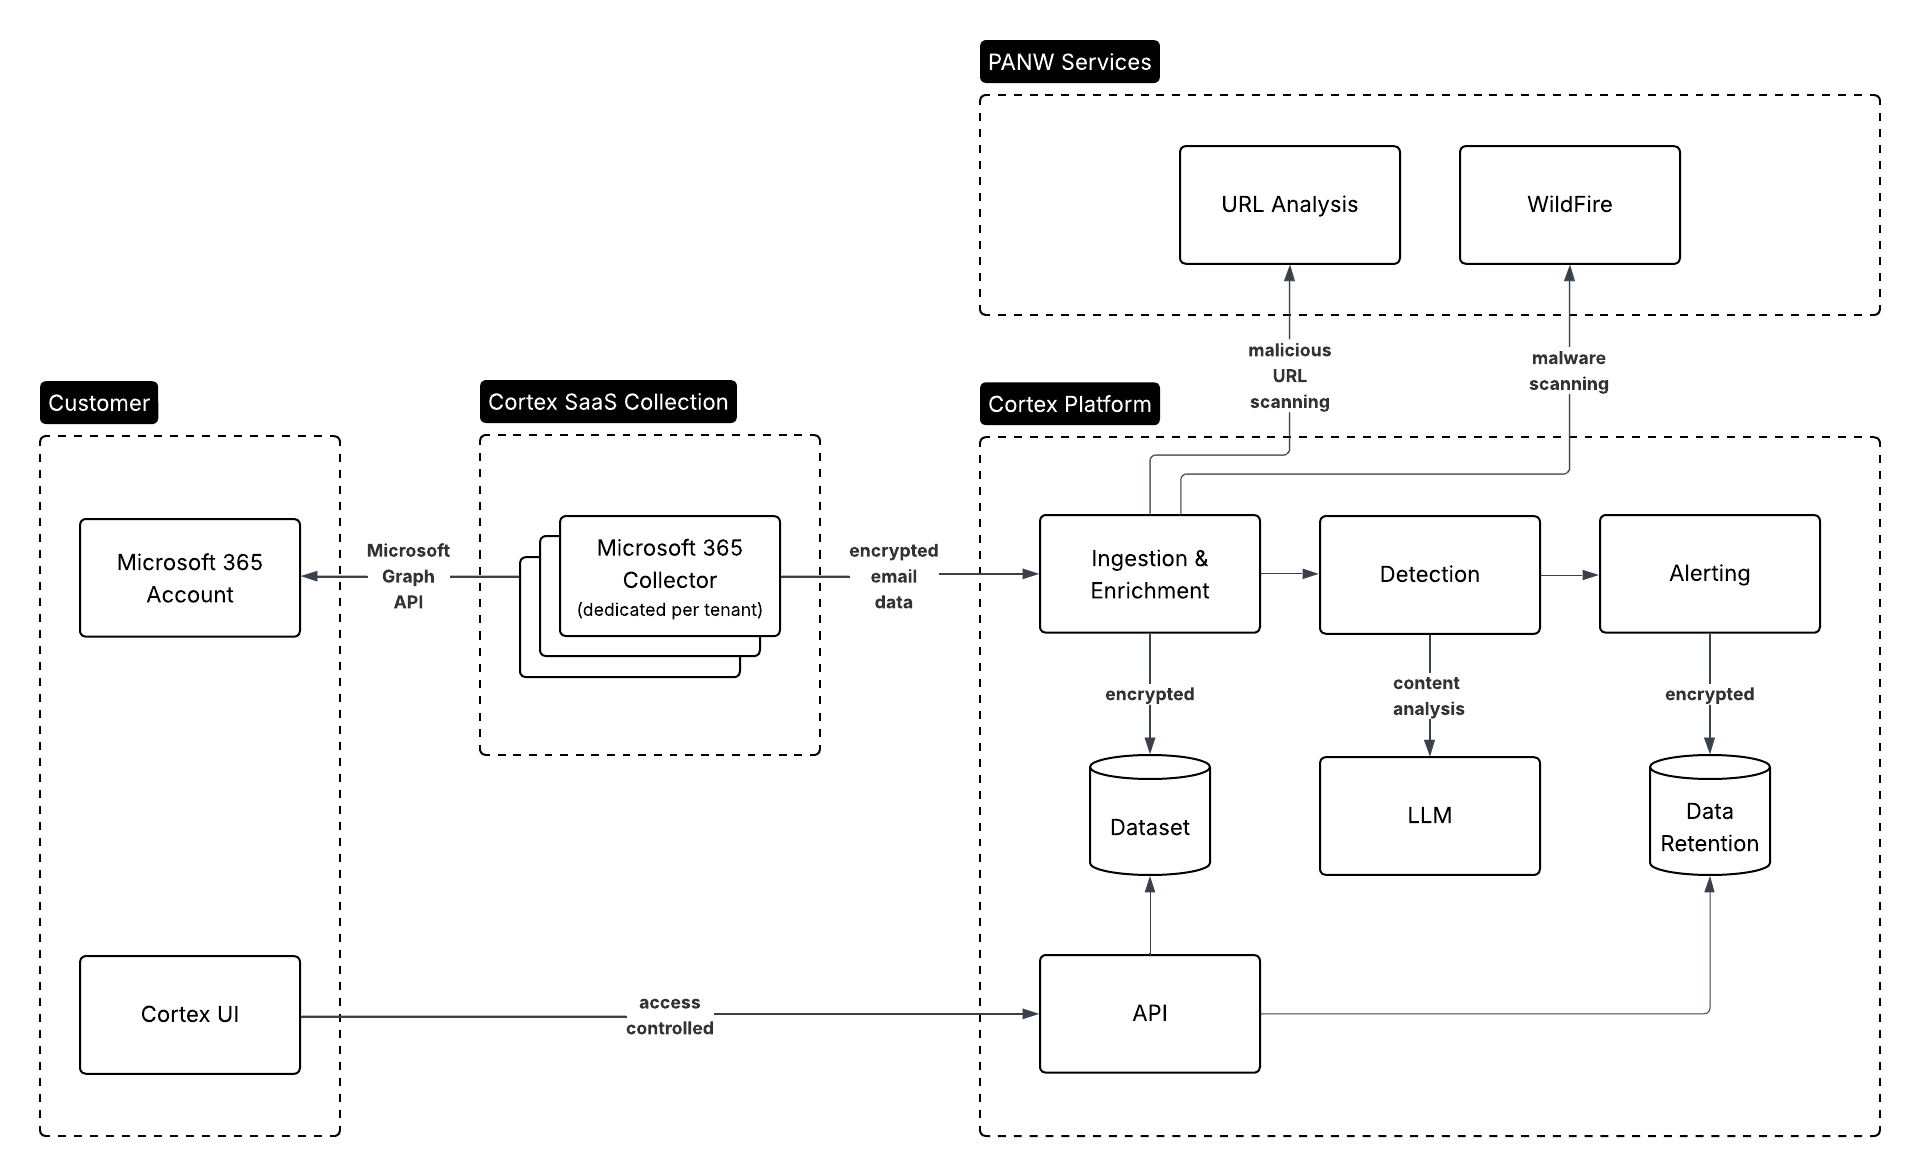
Data collector
The data collector connects to the email platform via secure APIs to ingest message metadata, content, URLs, attachments, authentication verdicts, and user context (for example, group membership, privilege level). Collection occurs on a continuous basis with support for incremental deltas where applicable.
Detection engines
The module supports a multi-layered detection architecture composed of three distinct detection engines, each focused on a different analytical layer:
- Artifact-based engine
- Analyzes discrete components embedded in the email such as file attachments and URLs.
- Leverages hash matching, sandbox integration (where available), and URL reputation systems to identify known or behaviorally malicious artifacts.
- Metadata Analytics engine
- Evaluates risk based on email metadata, sender-recipient relationship history, header anomalies, and identity context (for example, VIP status, role, group associations).
- Detects impersonation, spoofing, newly seen senders, and anomalous communication patterns based on statistical baselining and heuristic rules.
- Surfaces signals associated with business email compromise (BEC), supply chain impersonation, and domain lookalikes.
- LLM-based engine
- Processes the plain-text and HTML content of the email using large language models.
- Extracts semantic signals such as urgency, intent, emotional tone, and topic-based impersonation(for example, finance, HR, IT support).
- Feeds these high-level attributes into a broader social graph used to understand message deviation from historical tone and role-based communication patterns.
- Enhances detection of sophisticated phishing and text-only social engineering attacks that evade traditional signatures.
Issue processing and correlation layer
This layer normalizes output from the detection engines into a standardized issue format. It then correlates multiple issues into cases where shared indicators, for example, sender, URL, or theme, are identified. This layer also assigns a Score (using SmartScore) and enrichment metadata for downstream workflows.
Response engine
This engine executes response actions either automatically based on policy or manually via analyst intervention. It supports message removal, sender blocking, and false positive handling where platform permissions allow. All actions are logged with timestamp, executor, and result status.
User interface and admin console
The module includes a web-based management interface for the following:
- Viewing Issues and case timelines
- Investigating threat artifacts
- Configuring detection policies
- Managing exclusions and remediation rules
- Monitoring dashboard statistics and risky user profiles
Getting started with the Cortex Advanced Email Security module
Prerequisites
Before you configure the Cortex Advanced Email Security module, ensure you have the following:
- Admin-level access to the target email platform
- Dedicated service account (recommended) for integration purposes (response actions)
- List of domains and mailboxes to be protected (to be used during the wizard configuration)
- Access to an internal phishing reporting mailbox (to collect user-reported phishing - optional)
-
API permissions to read mailbox data, manage remediation (if desired), and access user directories
Permission Function User.Read.All Read the full profiles (e.g., department, manager, title) of all users. This is essential for providing context during threat analysis, such as identifying VIPs or spotting potential CEO fraud and impersonation. Mail.ReadWrite <p>Primary permission for Advanced Email Security.</p><p>Read: Allows the application to scan and collect emails from all mailboxes for threat analysis.</p><p>Write: Allows the application to perform remediation actions, such as deleting a malicious email, moving it to junk, or modifying it to add a warning banner.</p> Directory.Read.All Get a complete list of all users, groups, and other directory objects. This is necessary to discover which mailboxes are part of the organization and require protection. AuditLog.Read.All Ingest Azure AD audit logs. This allows Advanced Email Security to correlate email-based threats with other suspicious activities in the tenant (e.g., a suspicious login followed by a malicious email, reported as phishing events). IdentityRiskyUser.Read.All Access user risk data from Azure AD Identity Protection. This is a critical security signal, allowing Advanced Email Security to apply higher scrutiny to emails from an account that is flagged as at risk (e.g., credentials leaked). MailboxSettings.Read Read all user mailbox settings. This is crucial for detecting common attack techniques, such as an attacker setting up a malicious inbox rule or auto-forwarding rule to exfiltrate data. ThreatSubmission.Read.All Read threat submissions made by the end-users (e.g., via the Report Phishing button in Outlook). This provides a valuable feed of human-identified threats directly into Advanced Email Security. ThreatSubmission.ReadWrite Programmatically submit new threats detected by Advanced Email Security to Microsoft's security systems. This integrates our tool with the wider Microsoft 365 security ecosystem. Mail.Send Send security notifications and alerts. This is used to send a warning to the end-user about a high-priority threat that was detected and remediated. People.Read.All Read users' relevant people lists (derived from communication patterns). This helps build a social graph to better detect anomalies and sophisticated impersonation or Business Email Compromise (BEC) attacks. Contacts.Read Read the contacts in all mailboxes. Similar to People.Read.All, this helps analyze communication patterns and identify when a trusted contact may be compromised or impersonated. Domain.Read.All Read the organization's verified domains. This is essential for Advanced Email Security to accurately distinguish between internal and external senders and to detect email spoofing. Application.Read.All Read the list of all applications registered in the tenant. This can be used as part of a broader security posture assessment to identify other potentially risky or misconfigured applications.
Deployment workflow overview
A typical deployment follows the following sequence.
- Provisioning
- Authenticate to Microsoft 365 as admin
- Grant API access scopes to Cortex Advanced Email Security module
- Select domains/mailboxes to protect
- Verification
- Confirm data ingestion
- Generate sample test email for issuing validation
- Review initial dashboard population
- Configuration
- Define phishing report address (optional)
- Set up issue exclusions and remediation rules
- Operation
- Begin issue triage and investigation using issues table and email card view
- Fine-tune detection rules over time
- Monitor response actions and refine policies
Deploy and configure the Email Security module
To start using the Cortex Advanced Email Security module, configure the Microsoft O365 integration and then configure the module.
Integrate Microsoft 365 with the Cortex Advanced Email Security Module
Deploy the Cortex Advanced Email Security module by configuring integration permissions and settings for Microsoft 365.
API Permissions and Setup
Deploy the Cortex Advanced Email Security module to collect data from your organization's email network and to generate issues when suspicious activity is detected. To use the Cortex Advanced Email Security module, activate it and then configure the integration permissions and add the email collector as a data source to Cortex XSIAM.
- From Settings → Cortex XSIAM License, select Cortex Advanced Email Security Module, and click Enable.
- Configure the Microsoft 365 email collector. For more information, see Ingest logs and data from Microsoft 365.
Configure Quick Actions
Define remediation actions to be run for the email security issues.
Notice
To configure a quick action, you must first create an application in Microsoft O365.
To configure each set of actions, do the following:
-
Go to Marketplace and select the content pack that corresponds to the action(s) you want to add.
Quick action Content pack Integration <p>Block Sender</p><p>Unblock Sender</p> Microsoft Exchange Online EWS Extension Online Powershell v3 <p>Delete Email</p><p>Undelete Email</p> Microsoft Exchange Online O365 - Security And Compliance - Content Search v2 Send Email to Recipients - Office 365 Microsoft Graph Mail Microsoft Graph Mail Single User - Select the integration.
- Select Add Instance.
- Configure the connection using the credentials from Microsoft O365.
- Test the connection, and then Save.
After you onboard your domains and configure the quick actions, Cortex XSIAM manages your protected domains in Modules → Email Security → Email Security Configuration.
Configure the Cortex Advanced Email Security module
Notice
Requires the Advanced Email Security module.
Use the Email Security configuration page to manage your protected domains, allow and block lists, phishing email addresses, URL filtering, and your remediation actions. To access the page, navigate to Modules → Email Security → Email Security Configuration. You have the following options.
Protected Domains
View the domains you added to the collector for your organization.
Block List
View and manage indicators related to emails, including URLs, attachment file hashes, or sender email addresses that are flagged as malicious.
Right-click a row to edit, delete, disable, and copy each block list rule.
How to add indicators you want to include in your block list:
- Click Add.
- In Create Block List Rule, select the type - URL, Hash, or Email Address.
- Type the indicator, add any comments you want, and click Done.
Allow List
All the trusted indicators related to emails, including URLs, attachment file hashes, and sender email addresses. These exclusions also appear in the Issue Exclusions list under Exceptions Configuration.
Right click a row to edit, delete, disable, and copy each allow list rule. In this section, you can add indicators you want to exclude from generating issues.
To add indicators:
- Click Add.
- In Create Allow List Rule, select the type : URL, Email Sender, or Email Attachment.
- Type the indicator, add any comments you want, and click Done.
The new indicator is added to the Allow List and to the general Issue Exclusions tables.
Note
You can add email indicators to the Allow List also in Exceptions Configuration → Issue Exclusions. However, if you add multiple indicators in a rule using Issue Exclusions under Exceptions Configuration, you cannot edit the rule in the Email Security Allow List.
Phishing Email Address
Configure the email boxes for collecting the emails that users report as phishing. By default, the list includes the email address configured in your email provider for collecting reported phishing emails in your domain.
URL Filtering
Enable or disable analysis and identification of malicious URLs in emails.
Remediation Actions
Configure the following settings for your remediation actions.
Warning Email Template
Add the Sender Email address, the Subject, and the Body for the email you want to send to users when a malicious or suspicious email is detected and automatically remediated. An email body template is provided that you can customize to your organization's needs. The template contains the details of the suspicious email, including the sender email address, subject, and the time the email was received.
Move to Folder Action
Select a folder to which suspicious emails will be moved. If a folder isn't configured, the email is moved to the default PANW Quarantined folder. If the PANW Quarantined folder doesn't exist, it is automatically created in the mailbox of the user.
Cortex Advanced Email Security threat detection and issues
The Cortex Advanced Email Security module supports a wide range of detection types, designed to identify malicious, suspicious, or policy-violating emails. These detections are generated by the artifact-based, metadata-driven, and LLM-powered engines described in the Architecture and Data Flow section.
Threat detection categories
All analytics-based detections are documented in the external Analytics Issue Reference, including the following:
- Issue name
- Trigger conditions
- Associated MITRE TTPs (where applicable)
- Recommended response actions
In addition to Analytics listed in the reference, the module supports the following extended categories:
- WF Analysis issues: Generated based on WildFire verdicts (malicious/suspicious) for file attachments, where integration is enabled.
- AURL issues: Based on Advanced URL analysis verdicts (for example, detected phishing kit, dynamic redirects, credential harvesting behavior).
- IOC-Based issues: Triggered when an email contains known malicious indicators (SHA256, domain, URL, or sender) that match internal or external blocklists.
- User-Reported Phishing issues: Generated when users forward emails to a designated phishing report address. These issues can be generated independently or correlated with other detection logic if matches are found.
Each issue type may be subject to additional correlation and aggregation into case entities based on shared characteristics, for example, sender, artifact, theme, etc.
Email security issue metadata and fields
Each issue contains a structured set of metadata fields that provide forensic and contextual insight for downstream investigation. Below is a breakdown of key issue fields available via the console, APIs, or case export.
| Attribute | Field Name | Description |
|---|---|---|
| Issue Name | issue_name | High-level issue classification |
| Issue Description | issue_description | Human-readable description of the threat |
| Message ID | internet_message_id | Unique ID of the email message |
| Conversation ID | conversation_id | Thread/conversation identifier |
| Email Created Date | created_date | Timestamp when the message was sent |
| Subject | subject | Subject line of the email |
| Email Recipient(s) | recipients.name, recipients.email | All TO recipients of the email |
| CC Recipient(s) | cc_recipients.name, cc_recipients.email | All CC recipients |
| BCC Recipient(s) | bcc_recipients.name, bcc_recipients.email | All BCC recipients |
| From Address | from.address | Displayed From: email address |
| From Display Name | from.name | Display name shown in From field |
| Sender Address | sender.address | Actual sender address (SMTP-level) |
| Sender Name | sender.name | Display name of sender (SMTP envelope) |
| Return-Path | return_path_data.address | Return path address (SMTP envelope) |
| Attachment SHA256 | attachments.hash_str | Hashes of attached files |
| Attachment Name | attachments.name | Filenames of attached files |
| URLs | url_verdicts.url_name | URLs extracted from the message body |
| Internet Message Headers | internet_message_headers | Full set of original headers |
Note
Depending on data collection mode and platform capabilities, not all fields may be populated for every message. API and export documentation provides further clarification on optional vs required fields.
Email security issue correlation mechanism
The issue correlation layer is responsible for linking related issues into cohesive cases. Correlation is performed using the following logic.
- Sender-based correlation: Issues from the same sender with similar delivery patterns across multiple recipients.
- Artifact-based correlation: Issues with shared attachment hashes, URLs, or domains.
- User-based correlation: Issues involving the same recipient or identity in a short time window.
Correlated issues are grouped into a single case object with unified investigation timelines and shared contextual insights (for example, conversation metadata, risky user involvement, cumulative score).
Email Security Analytics Rules
The Email Security Analytics Rules page offers a consolidated view of all Analytics BIOC and XSIAM Analytics rules used in the Cortex Advanced Email Security module to keep your email domains secure. You can see every Analytics rule that could generate an email security issue and take action to customize the rules for your organization.
Within this unified table, you can leverage powerful capabilities to manage and investigate Analytics rules effectively.
- Get an understanding of all the rules that generated an issue in one place.
- Filter rules by name or description for seamless integration with issue investigations.
- Filter rules by any column, including "Variant Severities" to quickly locate rule variants associated with specific severity criteria.
- Order by any column, enabling you to prioritize and evaluate issues based on severity, name, modification time, and other critical factors.
- Fine-tune your XSIAM Analytics rules by disabling or enabling specific ones.
- View more information for a selected analytics rule, including all its variants, and pivot to the Cortex Analytics Reference for the specific rule.
The Email Security Analytics Rules page is in Modules → Email Security → Email Security Detection Rules.
The page displays the following properties of Analytics rules:
- Modification Time: When the rule was last changed.
- Name
- Severity: Severity of the basic variant.
- Severity Variations: Number of different variants for the rule, including their respective severities.
- Status
- Type: XSIAM Analytics or XSIAM Analytics BIOC
- Tags: Detector tag
- Description
- Mitre Att&ck Tactic
- Mitre Att&ck Technique
- # of Issues: Number of issues generated by the rule in all its variants.
- Activation Prerequisites
- Creation Time
- Global Rule ID
Use the right-click menu for the following actions:
- Disable or enable a rule to customize issue generation based on the Analytics rule.
- View all the email security issues that were generated by applying this rule.
- Show or hide all rows with a specific rule.
- View the rule with all its variants, including their respective descriptions, tags, and severities in the View Analytics Rule screen.
- For more information about the MITRE ATT&CK techniques and tactics, click the tag to display its explanation in the MITRE ATT&CK database.
- For more information about the rule, click More information to display the Analytics Alert Reference.
Investigate and respond to email security issues
Notice
Requires the Cortex Advanced Email Security module.
The Cortex Advanced Email Security module monitors all incoming, outgoing, and draft emails, and generates issues on suspicious emails. If a user sends a large number of emails or if the same email is sent multiple times to the users in the organization, the issues are stitched under one issue in the Email Security Issues table as a multiple event.
To view the Email Security Issues table that displays all the issues that contain a detected threat related to emails and to investigate the issues, go to Modules → Email Security → Email Security Issues.
In addition to all the actions available to issues in general, there are options that are specific to the Cortex Advanced Email Security module:
View the email security issue card panel
Click an email security issue to open the email security card where you can investigate the email issue, view the automated remediation actions taken, take any further manual actions required, and see the remediation suggestions.
From the three dot menu, you can open the issue in a new tab, pivot to the causality view, and copy the issue URL.
At the top of the card, you can view information about the issue including the severity, detection tags, category, and detection method. In the tabs, you can see more information about the cause of the issue, take any actions required, and see the remediation suggestions.
Overview
Displays a description of the issue and provides key information, such as the assignee, status, action taken, and time that the issue was created and updated.
You can also see the following:
- MITRE ATT&CK tactics used: Click View All to see the tactics and techniques.
- Affected assets
- Linked Cases: Number of cases linked to the issue and their severity. Click to see the cases to which the issue is linked.
War Room
A comprehensive collection of all investigation actions, artifacts, and collaboration. It is a chronological journal of the issue investigation. For information, see Use the War Room in an investigation.
Work Plan
A visual representation of the running playbook that is assigned to the issue. For more information, see Use the Work Plan in an investigation.
Investigate the email issue causality chain
The Email Issue causality view offers an interactive visualization of the email security issue generation. It displays the connected the events in the process execution chain to provide immediate, actionable insights into the cause and effect of email security issues.
To open the causality view, right click an email security issue and click Investigate Causality Chain.
The following sections describe the different areas of the causality view:
Causality chain
View the components of the events that generated the issue, including IP address and username of the sender, the alerts that were triggered by the email, and the name of the recipient user or distribution list. Hover over each node to find out more about the components of the causality chain. Click each node to see more details about it in the Issue Overview on the left and in the Events table under the Causality chain.
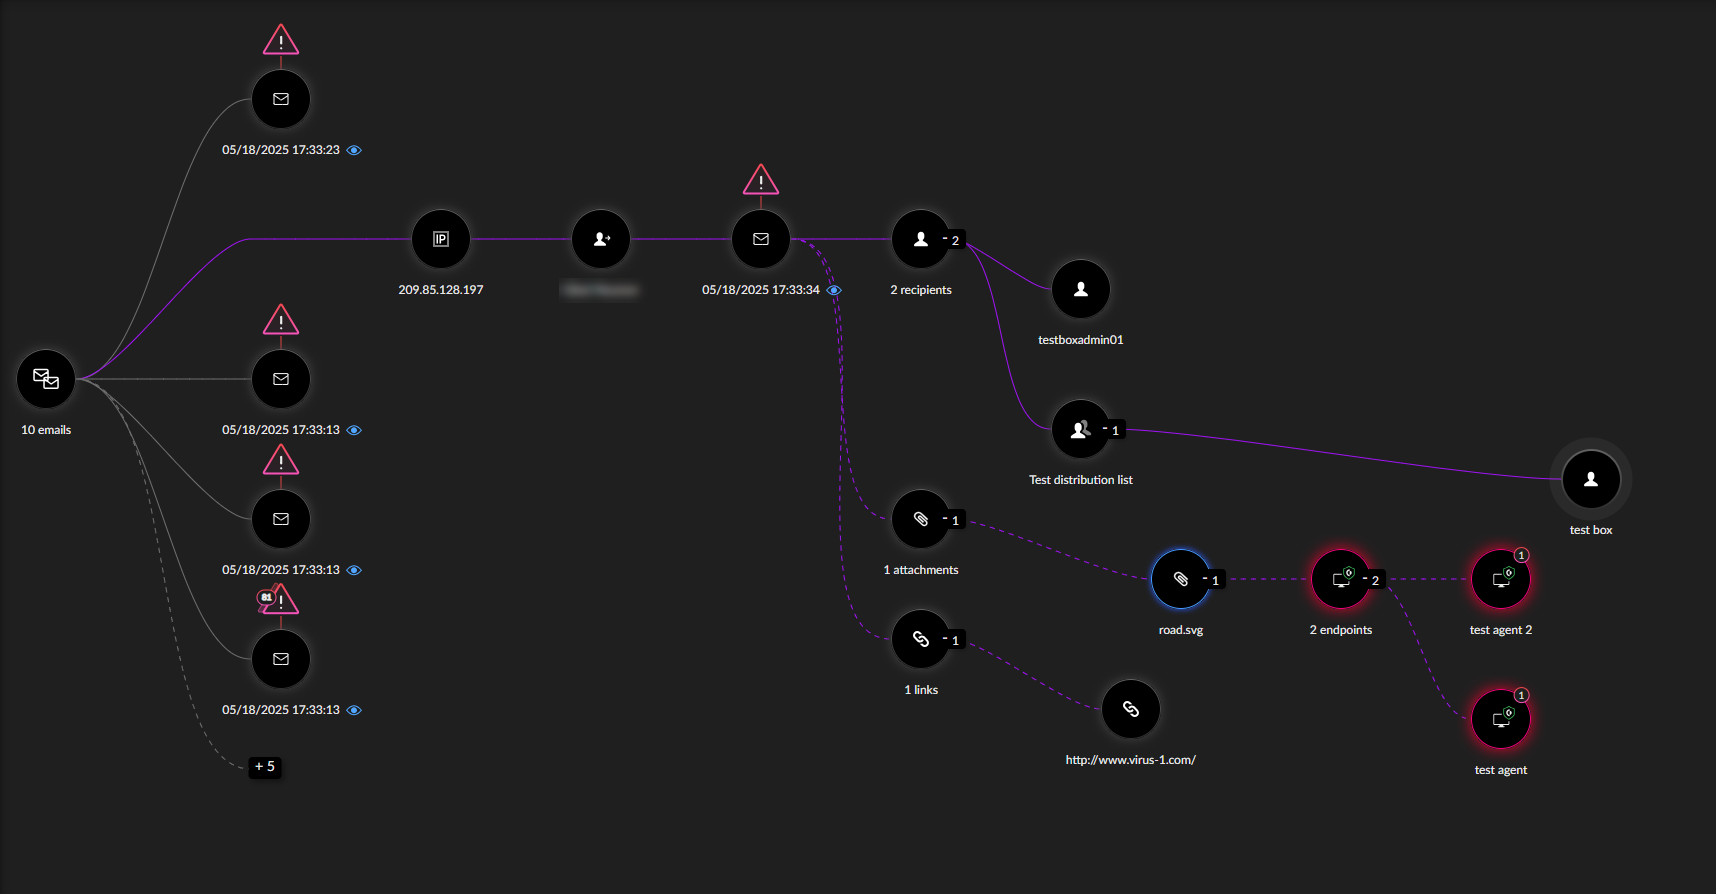
When you open the causality card for multi-event issues, you can see all the emails and the events that contributed to the triggering of this issue. Click each node to investigate the different components that make up the issue.
-
Emails stitched together: Displayed in multiple events, it groups all the events that contributed to the attack.
Click each envelope in the view to see the details of each event separately in the Issue Overview and the Events table.
-
IP address: Hover to view the number of emails seen from this address and the number of users who used it.
Click to view the geolocation and the Blocklist status in the Issue Overview and the details for the events in the Events table.
-
Sender username: Hover to view the organizations and the user emails that received emails from this user.
Click to view the details of the user in the Issue Overview and the issues from this domain and activities by the user in the Events table.
-
Sent emails: Displays the findings for the email event. The number of issues triggered by this email is displayed above the envelope. A lightning symbol above the email indicates an automated remediation action was taken for this email.
Click the number to see the issues generated by the event in a carousel in the Issue Overview.
-
Attachments: Number of attachments in the email. Click the number to see each file.
Click each file to see affected endpoints. Click an endpoint to see its related issues in the Events table.
-
Links: Number of links in the email. Click the number to view each link.
Click a link to see its details in the Issue Overview and the Events table.
Click the email envelope to see the email details in the Events table.
Click the eye icon to view the email. In the Email overview, you can see the remediation status of the email, details of the email, remediation recommendations including highlighted sentiments, and the option to View as image a snapshot of the email.
-
-
Recipients: Number of users who received this email. A lightning symbol above the recipient indicates an automated remediation action was taken for this user.
Click the number to see all the user names.
Click each recipient to see their details in the Issue Overview and their issues and past activities in the Events table.
Issue Overview
The overview displays detailed information for each email. Every time you click a node in the Causality chain on the right, the information in this pane is updated.
-
A summary of the email details, including the subject, number of users who have opened the email, attachment count, and the attack tactics. To see the full email message, click the eye icon.
In multiple event issues, this panel displays a summary of the issues, identities, endpoints, and attack types involved in the attack. When you click each event in the causality chain, this panel displays the email details common to each event.
- For multiple events, this panel displays the mail Indicators like attachment, URL, IP address, and email subject that are shared between the emails stitched together in the issue.
-
Affected Identities: A summary of the users affected by this issue and the risk score.
Click View All to see all the identities in the Events table.
-
Affected endpoints: A summary of the endpoints affected by this issue and the risk score.
Click View All to see all the endpoints in the Events table.
- Remediation: Remediation actions initiated by email remediation rules. Click the number to view the remediation actions in the Remediation tab of the Issue Events table.
-
Causality issues: Top issues that were generated by the email detection and their risk scores. If the event is part of a multi-event in the causality chain, you can pivot to the multi-event using the provided link to get a fuller picture.
Click View All to see all the causality issues in the Events table.
For every issue that's not Informational, click on three dots to Run Automations.
- Issue Tags that represent the detected MITRE ATT&CK tactics.
Issue Events table
The Events table displays up to 100,000 related events for the process node that matches the issue criteria. Every time you click a node in the causality chain or in Issue Overview, the information in the table is updated to display the details of the findings. The events in the table can be viewed in the following tabs grouped by the attributes:
- Emails with detected threats.
- Causality Issues generated based on the email threats.
- Affected Endpoints
- Remediation actions taken for the emails.
Run manual remediation actions specific to email security
The following quick actions are available out of the box in the causality card:
- View Raw Log
- Soft Delete Email
- Undelete Email
- Report As Phishing
- Send Warning Email
- Move Email to Folder
- Mark as Safe: Changes the status of all issues related to the email as Resolved.
- Mark as Malicious:
You can activate additional quick actions by first activating them in the Marketplace:
- Block Sender Office 365: Blocks the senders of the emails included in the issue.
- Unblock Sender Office 365: Unblocks the senders of the emails included in the issue.
- Delete Email - Office 365: Deletes the email
- Send Email to Recipients - Office 365: Sends an email to the recipients with the parameters you select.
For each quick action from the Marketplace, do the following:
Right click the issue, click Run Automation → Select Automation.
Select the relevant details or type and click OK.
This sends the request to Microsoft Office 365. The verdict on the request is displayed in the War Room of the issue.
These remediation actions are also available from the designated Actions button, located on the top right of the Email card.
Automate remediation for the Cortex Advanced Email Security module
The lightweight, real-time response engine inside the Advanced Email Security module executes automatic policy-driven actions to quickly respond to email threats before they manifest. Build your policy from the rules you configure by customizing the out-of-the-box templates.
Define the rules for your email security policy in Email Remediation Response Rules, located in Modules → Email Security → Remediation → Rules.
Review all the remediation actions initiated by your policy in the Email Remediation Action Center, located in Modules → Email Security → Remediation → Action Center.
The automated email response engine provides the following advantages:
- Accelerated response: Execution of time-sensitive email response actions directly within the application interface, significantly reducing response latency.
- Unified audit and visibility: A single source of truth for all response activities. Every email action, whether through the engine or through playbooks, is seamlessly logged and fully auditable.
- Optimized analyst workflow: SOC analyst efficiency through intuitive controls and a zero-switch environment, ensuring investigations move quickly and without interruption.
The email response engine supports the following actions:
- Soft delete email
- Undelete Email
- Report as phishing
- Send warning email
- Move Email to Folder
- Mark as Safe
- Mark as Malicious
Note
For extra automated actions, use the playbooks, scripts, and commands in the Cortex XSIAM automation engine. For more information, see Automation in Cortex XSIAM.
Email Remediation Response Rules
View all remediation rules that apply to email threats, create new rules and modify them to customize them to your needs.
The Email Remediation Response Rules page is under Modules → Email Security → Remediation → Rules and displays the following widgets and the Rules table.
Remediation Rules widgets
The widgets on this page summarize and give insights into which rules have been activated and applied.
- Rule Status: Overview of email rule statuses, Enabled or Disabled.
- Rule Actions: Actions taken as a result of the rules applied.
- Rule Hits: Breakdown of the number of rules that were applied.
Remediation Rules table
The table displays all email remediation response rules for your organization. The rules are applied in the order listed in the table. The higher the rule in the table, the more priority it has. If an email triggers a rule, the rest of the rules below it in the table aren't triggered for the same email.
You can change the priority ranking of a rule by dragging the rule to the desired location in the table.
Use the right click menu on any row to Disable Rule, Edit, Save as New, Delete rule and to copy the entire row.
Create an Email Remediation Response Rule
Create a remediation rule that will be applied automatically to all received emails that meet the conditions of the rule.
- In Modules → Email Security → Remediation → Rules, click Create Rule.
- Type a rule name and a description.
-
Select the actions to be taken. You can select one or more.
- Soft delete email: places the email in the Deleted Items folder.
- Tag as phishing: sends the marked email to a designated Phishing folder.
- Send warning email: sends an email with descriptions of the actions taken.
- Move email to folder: moves the email to a designated folder.
Note
For automated actions not yet supported by the response engine, use the playbooks, scripts, and commands in the Cortex XSIAM automation engine. For more information, see Automation in Cortex XSIAM.
- Change the rule activation toggle as necessary. The default is Enable Rule.
- Click Next.
- Select to which users to apply the rule.
- All Users: Select if you want to apply the rule to all the organization, except for a few specific users or groups who you want to exclude.
- Users Selection: Select if you want to apply the rule to specific users. From the Users list that opens, configure your selection in one of the following ways:
- Static list made up of specific users you select.
- Dynamic list automatically updated based on a filter you define. If the rule is defined for people in a certain group in the organization, and there's a change in the group, the rule will apply only to the current members of that group.
- Exclude Users from this rule if you don't want the rule to apply to them. You can exclude specific people or apply a filter to exclude users with shared details.
- Review the Users Preview and make any changes you want.
- Select a Quick Template from our recommended templates or define your own conditions from scratch.
Quick Template:
The conditions for the rule are displayed. You can use the template as it is or customize it by changing the predefined conditions or adding new conditions.
Note
If you apply a new template, all the customizations to the previous template you used will be lost.
| Template name | Description | Condition details |
|---|---|---|
| Malicious URL Detected | Automatically remediates emails containing URLs classified as malicious by Advanced URL Filtering. | <p>Detection Method = AURL</p><p>Alert Name = "AURL - Email contains URL(s) classified as malicious"</p><p>Severity &gt; Medium</p> |
| Malicious Attachment Identified | Triggers remediation for emails with attachments identified as malicious by WildFire. | <p>Detection Method = SaaS Attachments</p><p>Alert Name = "WildFire Malware"</p><p>Severity > Medium</p> |
| SPF & DMARC Failures | Removes spoofed emails failing both SPF and DMARC validation. | <p>Alert Name contains "Suspicious SPF Result" or</p><p>"Suspicious DKIM Result" or</p><p>"Suspicious DMARC result"</p> |
| Non-corporate Cloud Sharing Links | Detects suspicious links to file-sharing services not commonly used by your organization. | Alert Name contains "External email with file-sharing link" AND Severity >= LOW |
| Suspicious URL Categories | Targets emails linking to risky web content such as gambling or adult content. | urls.primary_category intersects ['gambling', 'adult-and-pornography'] |
Define Conditions:
Use the filters detailed in the following table to define rule conditions. This option provides an exceptional degree of granularity to customize your rule conditions.
| Attribute | Type | Condition example |
|---|---|---|
| Alert Name | String | |
| Severity | enum | High/Medium/Low |
| Detection type | enum | Detection type = WF/ AURL/Analytics |
| day_of_week | enum | day_of_week in ['Sat','Sun'] |
| sender_ip | IP | sender_ip not_in_cidr ['10.0.0.0/8','192.168.0.0/16'] |
| sender_ip_geo.country | String | sender_ip_geo.country not_in ['US','IL','GB'] |
| spf.result | enum | spf.result in ['fail','softfail'] |
| dmarc.result | enum | dmarc.result == 'fail' |
| body.language | Set (string) | body.language == 'en' |
| urls.count | Number | urls.count >= 3 |
| urls.any_malicious | Boolean | urls.any_malicious == true |
| urls.primary_category | enum | urls.primary_category intersects ['gambling','adult-and-pornography'] |
| urls.risk_level | Set (string) | urls.risk_level intersects ['high-risk'] |
| attachments.count | Number | attachments.count >= 1 |
| attachments.extensions | Set (string) | attachments.extensions intersects ['exe','js','hta'] |
| attachments.total_size | Number (bytes) | attachments.total_size > 1000000 |
| headers.has_list_unsubscribe | Boolean | headers.has_list_unsubscribe == true |
| headers.auto_submitted | enum | headers.auto_submitted in ['auto-replied','auto-generated'] |
| headers.reply_to | String | domain(headers.reply_to) != domain(from.address) |
- Click Next.
- Review the rule summary and either go back to change them or click Create.
- In the rules table, to configure the priority of the rule drag it to its place and click Save. You can only save the rule after you have configured its priority.
Email Security Remediation Action Center
The Email Remediation Action Center in the Advanced Email Security module presents an overall view of all the automatic actions taken against email threats. Use the Remediation Action Center to audit the remediation activities and to measure the effectiveness of your policy.
The center displays the following widgets for a comprehensive understanding of the remediation status.
- Rule Status: The number of total rules that were applied and how many of them were successful, failed and are in progress.
- Action Type: The action that was used to remediate the email.
- Top Rules Initiating Remediation: The top rules that triggered the remediation actions.
The table displays all the automated remediation actions and their details, including action type, action target, action status, timestamp, email ID, email subject, action target, sender email, initiator type.
- Action status: The status can be In Progress, Success, or Failed. The engine tries the action three times before it returns the value Failed.
Email Command Center
Notice
Requires the Cortex Advanced Email Security module.
The Email Command Center provides an interactive overview of your email security status that offers comprehensive visibility and control over email security threats and responses in your organization. With real-time insights and actionable intelligence, you can stay ahead of threats and make informed decisions with ease and confidence.
In the face of sophisticated AI-driven phishing attacks and other social engineering tactics, the Email Command Center is essential for ensuring organizational security. It moves beyond isolated email analysis to offer a holistic view of potential attack chains, enabling proactive protection and rapid response. With drill-down capabilities, reveal detailed metrics and insights for deeper analysis and proactive threat management.
Access the Email Command Center in Modules → Email Security.
Select a time frame for a visualization of the different components that make up the current risk status of your domains. You can select between Last 24 hours, 7 days, or 30 days. The default time frame is 30 days.
The Email Command Center is made up of the following components:
Cortex Advanced Email Security flow diagram
View general information about the email security status of your organization in an intuitive, interactive flow diagram. You can drill down to the details to get a comprehensive understanding of the email security status of your organization. The diagram is made up of the following sections:
Metrics about incoming data.
- Identities
- General email metrics: Numbers of scanned emails, domains, mail boxes, detected attachments and links.
- Click Attachments to display the Files Breakdown table on the right.
- Click Links to display the URL Reputation table on the right.
- Endpoints: Information coming from Cortex XDR Agents.
- Network data
Note
Adding more data into the Email Security module will ensure better detection of complicated email threat vectors.
Metrics about the issues and cases generated by the module.
The module groups related issues into a single case to give context. Click anywhere in this area to open the Trends and Metrics widgets on the right.
Under this section is a carousel that summarizes the remediation actions that were taken.
Metrics about the automated and manual remediation actions that were taken, including a breakdown of resolved and open cases.
Click Resolved Cases or Open Cases to see a breakdown of cases that were generated manually and by automation.
Trends and Metrics
The tables and widgets displayed on the right about the general insights. To return back to the general insights, click Back to Overview.
Trending Attack Vectors:
Details the type of identified attacks in the issues, with a description and the number of issues associated with each attack type. The percentage represents the change from the previous time frame, where red is an increase in attacks and green is a decrease. For example, if the attack count for the last 30 days is 6, and the percentage is 50%, in the previous 30 day time frame, there were 4 attacks, and in the current 30 day time frame there were 2 additional attacks.
Click a row to display the Issues table filtered by the specific attack type.
Mailboxes:
Surfaces statistics about the coverage of the emails boxes and email directionality. Mailboxes Coverage shows the numbers for the following mailboxes: User, Shared, Room, Uncovered, Other. Under Email Directionality, you can see how many total emails were scanned, how many were inbound or outbound, and how many were internal.
URL Reputation:
Groups the links according to category, and provides the number of identified links in the current time frame and the number of links in the previous time frame. Each category is made up of a number of different types of link, grouped together under a descriptive title. The numbers inside the parentheses represent the number of malicious links. Click a row that references a malicious link to see the issues that are generated from the emails that contain the links in the category.
Files Breakdown:
Categorizes the detected files according to file family type, and provides the number of attached files in the current time frame and the number of attached files in the previous time frame. Each family type is made up of a number of different file types, grouped together under a descriptive title. The numbers inside the parentheses represent the number of malicious files. Click a row to see the issues that are generated from the emails that contain the file types in the file family.
Top Cases by Smartscore:
Presents the top ten cases listed in order of descending smartscore, with a description and the number of impacted endpoints and users. The smartscore is displayed in a box with colors that represent the severity.
Click a row to see the case in detail.
Remediation:
Displays the remediation actions taken by the Email Security engine. Each row details the number of remediated emails, the number of remediation actions taken, and the detected errors. From each row, you can pivot to the Remediation Action Center.
When there's no rule in the policy that triggers a remediation action, the action is marked as Not Active in this table. Click Configure to define a rule that triggers this action.
Note
The number of remediated emails and the number of remediation actions may not always be equal. This is due to a number of reasons, including different policies that affect the email messages or manual actions taken.
Dynamic insight widgets
The widgets displayed on the bottom right of the Trends and Metric widgets provide information and enable drilldown to different parts of the system.
Issues Over Time:
Graph displaying the number of issues at each given point in the selected time frame. Click each section in the chart to view the Issues table filtered according to the selected time frame of the section.
Risky Users:
The number of users that were detected as being risky. The percentage represents the increase or decrease compared to the previous time frame.
This widget also displays the top five risky users in descending order of risk score, together with their title in the organization, and the number of risky emails per user. If you have the ITDR module, the normalized risk score is displayed, and the email numbers and the risk score will be color coded to represent the severity of the risk.
Click a user to open the User view.
Malicious Email Inventory
Notice
Requires the Advanced Email Security module.
Simplify your email threat triage with the Malicious Emails Inventory. Designed specifically for malicious email analysis, this dedicated view provides immediate context on which emails were suspicious and why emails were flagged, enabling you to view and act on malicious emails from a timeframe you select, and pivot to other views for forensic investigations and remediation actions.
Find the inventory under Modules → Email Security → Malicious Emails Inventory.
Use the three widgets at the top of the screen to get an overview of the malicious emails that were detected by the module.
If you filter any of the widgets or the table, all the widgets and the table on the page are updated accordingly.
Malicious Email widgets
- Email Verdict Overview: How many malicious emails were tagged out of all the emails collected. Malicious emails are emails for which at least one issue was created with a severity level of Medium or above. Use the filters for the following cases:
- Change the duration to last 24 hours, last 7 days, last 30 days, or a custom duration to update the displayed data according to your preferred time frame. The maximum is 30 days.
- Add a filter to update the display in the format: filtered/total malicious/total scanned emails.
- Detection Tags: Top five detection tags that appear in the displayed emails. Click the widget to get more detailed information in the malicious emails table below.
- Remediation Type: How many emails have a configured remediation policy. Click the widget to get more detailed information in the malicious emails table below.
Malicious Emails table
View the details of the emails tagged as malicious. You can filter the table by any field you're interested in to see the statistics in the table and in the widgets. Available fields are:
- Detected at: Date and time of detection
- Subject
- Direction: Inbound or outbound
- Internet Message ID
- URLs: Number of URLs in the email message.
- Attachments: Number of attachments in the email message.
- Issues Breakdown: Number of issues generated based on the email and their severities.
- Severity: Maximum severity of all the issues related to this email.
- Detection tags: Tags in the issues that are based on this email.
- Rarity: How rare an email exchange between the sender and recipient is. For emails with multiple recipients, this column reflects the strictest rarity level (the weakest connection) among all sender-recipient pairs.
- Source
- Remediation Type: If the email has remediation actions configured.
- Remediation Status: Which remediation actions were run.
- Case ID
- Status: A reflection of the statuses of all the issues based on this email. The status is Resolved only when all the issues based on this email are resolved. Otherwise it stays Open.
Click each row in the table to see the full details of the specific email.
Malicious email view
Email data, enriched with insights, is displayed for each email in the following tabs:
- Overview: General information including Internet message ID, Subject, Severity, Generated issue count, Rarity, Remediation action taken, Source, Case ID, and Status. Hover next to each field name to copy the values for further investigation.
- Message: The full body of the email and any attachments. Each detected sentiment is categorized and highlighted with a different color. Click View as image to see a snapshot of the email.
- Sender and Domain: Raw email headers, SPF, DKIM, and DMARC authentication indicators, Sender information , Network information, and Domain intelligence. Hover next to each field name to copy the values for further investigation.
- URLs: Included malicious URLs. For each URL, you can see the full address, domain, category, popularity and the verdict. You can further filter the results in the table.
- Attachments: Included attachments which are determined to be malware.
- Issues: Issues that were generated based on this email. The fields displayed are Observation Time, Name, Detection Method, Severity, and Description.
Quick remediation actions
Use the more options icon at the top of the email card to take the following quick remediation actions:
- Open Causality Card: Opens the causality card of the related issue that has the highest severity value. When the highest severity value is the same for a number of issues, opens the latest issue card.
- Soft Delete Email
- Undelete Email
- Report As Phishing
- Send Warning Email
- Move Email to Folder
- Mark as Safe: Changes the status of all issues related to the email as Resolved.
- Mark as Malicious
Mailbox Inventory
Notice
Requires the Advanced Email Security add-on.
The Mailbox Inventory provides centralized asset visibility for all mailboxes managed under the Email Security module. Connected to the Unified Asset Inventory (UAI), this dedicated page displays all active mailboxes in a single, comprehensive table. From this view, you can use dashboard widgets to see a high-level breakdown of your assets and filter the table by specific mailbox types (such as user, room, or shared) to manage your email environment.
When you filter using either the widgets or the table, both the widgets and the table are updated.
Mailbox Inventory widgets
Use the widgets to get a better understanding of your email security assets.
- Type breakdown: Displays distribution across mailbox types
- Onboarded / Non-Onboarded: Shows a breakdown of how many mailboxes are actively onboarded to Email Security .
Mailbox Inventory table
The unified inventory table displays all discovered mailboxes where the email field isn't empty. Each row represents one mailbox record with its associated metadata (owner, type, onboarding status, etc.). Rows with an empty email field are excluded.
Advanced Email Security module security and compliance
The Cortex Regional Machine Learning (ML) Processing and Data Residency Policy ensures that all data processing within your Cortex XSIAM tenant, including GenAI-powered features, remains in the region you selected. This guarantees that data is not transferred across regional boundaries without your explicit approval. The policy is enforced by ensuring that the physical location of our ML and GenAI compute resources, not just data storage, is confined to your chosen region, providing a transparent and unified approach to compliance.
Note
For information about how Cortex handles personal and private information, see the Cortex Privacy Datasheet.
Data Handling and Retention
In the context of cloud-based ML systems, it is critical to distinguish between data at rest and data processing, especially when considering data residency and compliance boundaries.
Data at rest
Data at rest refers to the physical location where data is stored when not actively being processed. This typically includes storage services such as object storage (e.g., GCS, S3) or databases (e.g., BigQuery, Cloud Spanner). Data at rest is governed by storage policies and encryption-at-rest controls.
Data processing
Data processing refers to where the data is actively loaded into memory, transformed, and used by compute resources, such as GPUs, TPUs, or CPU-based inference services, to perform ML/GenAI tasks like inference, embedding generation, summarization, etc.
Processing location
The physical location of the compute resource performing inference, for example, the zone where the GPU runs the model, is what determines the true location of data processing, not the location of the stored data or control plane. This has direct implications for data egress, compliance, and user consent.
Regional compliance
For example, if user data stored in europe-west3 is sent to a GenAI inference engine running in us-central1, then the data is no longer regionally contained, even if it returns post-processing. This cross-region processing is what our policy aims to prevent or explicitly disclose. This is crucial because customer expectations for regional processing often align with regulatory zones; for instance, a European customer might be comfortable with processing in another country in the EU, as both are part of GDPR, but an Asian customer may object to processing in another Asian country.
Policy enforcement
Our policy explicitly emphasizes regional ML inference locality as the primary control point for enforcing data residency, not just where data is stored.
Identity Threat Detection and Response (ITDR)
The Identity Threat Detection and Response (ITDR) add-on delivers comprehensive identity analytics and proactive posture management capabilities to secure organizational environments against identity-based threats. By integrating automated asset classification, behavior-based detection rules, and dynamic access policies, ITDR enables you to continuously monitor risk exposure, uncover anomalous activity, and enforce directory protections.
The ITDR add-on includes the following capabilities:
- User Risk View which provides additional information about the asset for easy uncovering of hidden threats.
- Risk Management Dashboard to help you review the risk exposure of the organization and enable faster decision making.
- Automated and customizable Asset Role classification based on constant analysis of the users in your network. You can edit and manage the User Asset Roles to meet the needs of your organization.
- Detection rules which monitor identity and authentication activity to identify identity-based threats, such as compromised accounts, privilege escalation, and anomalous access, and trigger issues when suspicious behavior is detected. See a complete list of the Analytics rules.
- Dedicated view for quickly reviewing all identity related issues at a glance under Modules → Identity Security → Issues → Threats.
- Active Directory Security Posture Management (AD-SPM) which scans your infrastructure to uncover security vulnerabilities and misconfigurations, including weak and compromised passwords, across all identity types and provides targeted remediation steps. For more information, see Improve Active Directory Posture with AD-SPM.
- Conditional Access Policy which enforces dynamic, context-driven access control by evaluating real-time authentication requests against user-centric security contexts and risk levels to immediately allow, block, or require multi-factor authentication. For more information, see Enforce dynamic access control with CAP.
- LDAP protection which analyzes and acts upon suspicious LDAP queries received by the Domain Controller, to detect and block Active Directory reconnaissance attacks. For more information, see Prevent malicious LDAP queries.
- Remediation actions using the Cortex Response and Remediation content packs, a collection of automated playbooks that enable you to focus on high-priority threats while automating repetitive tasks.\
For additional remediation capabilities, see the Idira documentation.
Get started with ITDR
To deploy and configure the Identity Threat Detection and Response module features, follow the steps below.
- Activate the ITDR add-on license from Settings -> Cortex XSIAM License. This activates the identity analytics features automatically.
- Activate and onboard the Cloud Identity Engine.
- Set up the dedicated Identity permissions and roles in Settings -> Configurations -> Access Management -> Roles -> Identity Security. For more information, see RBAC in ITDR.
- Set up the CyberArk ISP integration which collects the audit events for the analytics detectors.
- Configure Identity Profiles to unify AD-SPM, Conditional Access, and LDAP Protection controls in one centralized hub.
Set up Identity Profiles
The Identity Profile centralizes identity security policies for Domain Controllers. It supports consistent security controls across your environment. After configuration, the profile must be mapped to policies for Domain Controller endpoints.
Note
Identity Profile requires Cortex XSIAM 3.5, Cortex XDR 5.1, or Cortex Cloud Runtime 2.1 or later. It also requires Cortex XDR agent 9.1 or later. It is unavailable for Cortex XSIAM 2.x and Cortex XDR 3.x tenants.
Policies can contain an Identity Profile in mixed-agent environments. Agents earlier than version 9.1 ignore these settings.
Identity Profile is available in Windows endpoints.
To customize settings for specific agents, create an Identity Profile and assign it to policy rules for Domain Controller endpoints.
- Add a profile and define its basic settings.
-
Go to Inventory → Endpoints → Policy Management → Prevention → Profiles. Select + Add Profile, then select whether to create or import a profile.
Imported profiles are added. They do not replace existing profiles.
- Select the Windows platform and Identity profile type.
- Click Next.
- Enter a unique Profile Name. Use only letters, numbers, or spaces. Names must contain 30 characters or fewer.
- Add a Description with the profile's purpose or business reason. For example, include a case ID or help desk ticket link.
-
-
Use the toggle to enable or disable AD-SPM.\
Use Active Directory Security Posture Management to monitor Active Directory for risky account configurations, weak or compromised passwords, unused accounts, and excessive privileges. Use Weak Password to identify weak passwords used in Active Directory and define the scan frequency.When enabled, both Weak Password and AD-SPM are both enabled.
-
Use the toggle to enable or disable Conditional Access. When enabled, configure these options:
Item Options More details Silent Logging Mode OnOffWhen set to On, you can observe the impact of this profile before enforcing policies. Service Availability Fail-Mode Allow AccessBlock AccessDefines global system behavior when the entire Conditional Access service is unavailable and rule evaluation is impossible. Allow Access minimizes disruption and helps prevent user lockout. Block Access maximizes security. Conditional Access Policy — Open the Identity Access Rules page to view or change current Conditional Access policies. -
Configure LDAP Protection to analyze and act on suspicious LDAP queries sent to Domain Controllers. This feature detects and blocks Active Directory reconnaissance attacks. Use the toggle to enable or disable it.
LDAP Protection takes effect after an agent restart.
Item Options More details Action Mode Block, Report, Disabled The Cortex XDR agent performs this action when it detects suspicious Domain Controller queries. Monitor and Collect Domain Controller LDAP Events Enabled, Disabled When enabled, the agent collects LDAP query information and creates events for investigating suspicious queries. - Click Create to save the profile.
What to do next
Apply the new profile by adding it to a policy rule. You can also define other profiles first. Policy rules let you select the endpoints that receive the policy.
Manage role based access control (RBAC) in ITDR
Prerequisites
ITDR add-on
The following permissions enable users to use and manage ITDR features. You can manage these role permissions under Settings → Configurations → Access Management → Roles.
| Feature | Description | Roles |
|---|---|---|
| Conditional Access Policy | Configure and manage real time, risk-based authentication rules and MFA enforcement. |
|
| Identity Security Runtime | Access identity-specific risk dashboards, interactive risk views, and identity detection rules. |
|
Monitor user risk exposure
Use the Risk Management dashboard to evaluate risk exposure by investigating compromised accounts and insider threats. The issues displayed in the Risk Management dashboard are tagged by the research as Identity Threat issues or Identity Analytics issues. A case is displayed if any of its associated issues are tagged as an Identity threat or an Identity Analytics threat.
Access the risk management dashboard in Dashboards & Reports→ Dashboards.
Investigate user risk
License type: Available with the ITDR add on
The User Risk View aggregates all of the data collected for a user, displays the information in graphs and tables, and provides further drilldown options for easy investigation.
You can take the following actions to investigate a user:
- Assess the user's behavior and score.
- Star the user to be included in the watchlist.
- Review the user's working hours and related issues.
- Analyze the user's behavior over time and compare it to their peers with the same asset role.
How to investigate a user
- Right-click a user name and select Open User Risk View.\
You can also see a list of all users under Inventory → Assets → Asset Scores. -
Select the timeframe to view the user's details.
Note:
Cortex XSIAM normalizes and displays case and issue times in your time zone. If you're in a half-hour time zone, the activity in the Issues & Insights Heatmap is displayed in the whole-hour time slot preceding it. For example, if you're in a UTC +4.5 time zone, the time displayed for the activity will be UTC +4.5, however, the visualization in the Issues & Insights Heatmap will be in the UTC +4 slot. - Investigate the user.
User Risk view
The User Risk view provides a centralized and interactive overview of user identity activities and risk scores, enabling you to investigate user events across core identity data sources. It enables you to identify and prioritize high-risk users quickly, gives you immediate context for identity-related risks, helps prevent missed indicators of compromise, and accelerates triage by offering proactive mitigation strategies.
Customize the User Risk view for your use case by dragging and dropping each widget to position it where you want in the layout. You can also collapse the widgets to hide or show content as needed.
User identity and risk score
The user identity and risk score at the top provide an at-a-glance summary of the user's identity and risk posture. The user risk score displays the score assigned on the last day of the selected time frame and the change in the score for the selected time frame. The score is updated continuously as new issues are associated with cases.
Click the user to view more information about them in a panel that opens on the right. You can see the user's title, department, primary location and endpoint, when the user was created in the organization and when their last activity took place. You can also see their tags and the highlighted tags.
The highlight widgets under the username provide an overview of the user's risk posture. They change according to the selected tab, Risk Assessment or Activities. The elements in the widgets are clickable and filter the information displayed in the tabs.
Risk Assessment
Investigate user risk changes in detail.
- Highlights
- Case Breakdown: Open cases withing the selected timeframe, with a breakdown of how many cases were opened within each risk severity. Click the different severities to filter the rest of the page to display only the information relevant to that severity level.
- Mitre Att&ck Overview: Mitre Att&ck tactics and techniques detected for the user.
- Main section
-
User Risk Score Trend: The graph is based on new cases created within the selected time frame, and updates on past cases that are still active. The straight line represents the user score, which is based on the scores of the cases associated with the user.
The bubbles in the graph represent the number of issues and insights generated on the selected day. Bigger bubbles indicate more issues and insights, and a possible risk.
Drill down on a score for a specific day by clicking a bubble. Alternatively, review the user information for the selected timeframe (Last 7D, 30D, or custom timeframe).
For users with associated asset roles, compare the data with other peers with the same asset role. In the Risk Score Trend graph click Compare To and select an asset role to which you want to compare the data.
The dashed line presents the average score for peers with the same asset role as the user, over the same time period. Hover over a bubble on the dashed line to see the average score for the selected peer and a breakdown of the score per endpoint. Click Show x Users to see a full breakdown of the score on the Peer Score Breakdown, filtered by the selected asset role. From the Peer Score Breakdown, you can select any user name and pivot to additional views for further investigation.
- User Cases: Related cases triggered for the user for the selected timeframe or severity selected in the Case Breakdown widget. If you are drilling down on a score, you can see the cases that contributed to the total score on the selected day.
- The Status column provides visibility into the reason for the score change. For example, if a case is resolved, its score will decrease, bringing down the user score.
- Issues & Insights: All detection activities associated with the user. The issues are grouped into buckets according to MITRE ATT&CK tactics. Click on a tactic to filter the issues in the table. To further investigate an issue, click the issue to open the Issue Panel and click Investigate.
- Mitre Att&ck Matrix Breakdown: Detailed information about the Mitre Att&ck tactics and techniques detected. Click Open Mitre Triage to remediate the threat.
-
Activities
Investigate user activities in detail.
- Highlights
- Common User Locations: A breakdown of the countries from which the user connected in the past few weeks.
- Common Operating Systems: A breakdown of the operating systems that the user used to connect in the past few weeks.
- Failed Logins: Details about failed login attempts by this user.
- Main section
-
Activity Timeline: Consolidated timeline view aggregating the activities of the user from different sources like Auth, Cloud, Endpoint into a single chronological stream. Displays the volume and type of activities over the selected time period.
The list provides a detailed, chronologically ordered timeline of individual events. Each event includes its timestamp, description, event type, and data source icon.
-
Issues & Insights Heatmap: Grid visualizing the volume and density of user activity across specific times of the day and days of the week. It aggregates events to show when a user is most active versus when they are inactive.
The widget compares the user's actual activity data with their regular activity hours and highlights any differences or anomalies in the user's expected activity.
The cells are marked according to the activity that took place, and a dashed frame indicates that Cortex XSIAM detected uncommon activity in the time slot.
- A dashed ribbon highlights discrepancies between regular activity hours and actual activity.
- A colored ribbon indicates the level of activity on a specific day/hour.
- A numbered ribbon indicates the number of issues and insights that occurred on a specific day/hour.
- Login Attempts: Details of the user's login attempts and whether the attempts were successful. To further investigate login activity for the user, click View In XQL to link to a prefilled query in the Query Builder. Using Cortex Query Language you can create queries to refine your search.
- Authentication Attempts: User's latest authentication attempts during the selected timeframe. You can see details of the related authentication attempts, and whether the attempts were successful. To further investigate authentication attempts by the user, click View In XQL to link to a prefilled query in the Query Builder. Using Cortex Query Language you can create queries to refine your search.
-
SaaS Logs: User's SAAS Log activity during the selected timeframe or on the day selected in the Score Trend graph. You can see details of the SaaS logs that were ingested into the platform in the context of the user.
To further investigate SaaS log activity for the user, click View In XQL to link to a prefilled query in the Query Builder. Using Cortex Query Language you can refine your search.
-
Manage user asset roles
Prerequisites
- ITDR add-on
- View or View/Edit RBAC permissions for Identity Runtime Security
Cortex XSIAM continuously analyzes your users and automatically classifies them based on their activities under asset roles, for example, Domain Controller, Administrator, and Executive User. You can remove users from asset roles manually and override the automatically detected asset roles. You can edit, add, and fine-tune the assets associated with each asset role at any time. You can also import users using a CSV file.
Fine-tuned asset roles aid the module in the following areas.
- Enhancement of the accuracy of the analytics that runs on assets, enabling better detection of uncommon activities by the asset based on the baseline for the asset role.
- Asset role visualization in the Incident view and the User view as background information for risk assessment.
- Analysis of User peer groups for score trend comparison over selected timelines.
To access the management page, navigate to Inventory → Assets → Configurations → Asset Roles. The asset roles configuration page displays the asset roles, their type, the number of assets that are associated with each asset role, and the last modification date.
Edit user asset roles
\
To edit a user asset role, filter for User, right-click the role and select Edit Asset Role. Note that some asset roles are nested under parent roles higher in the hierarchy. For example, an Admin User asset role may be a child asset role of the parent asset role Sensitive User. You can hover over the information icon next to a role's name to see its parent rule.\
Depending on the type of asset, you can manage the user asset role list.
When editing an asset role, there are two primary lists:
- Included Users: Displays all the users Cortex XSIAM automatically detects as having this asset role, as well as any users you have manually added.
- Excluded Users: Displays the users that were manually removed from the asset role.
User role actions
- Exclude a User: In Included Users, right-click a user and select Exclude User. The user moves to the Excluded Users list, which overrides future automatic detections and ensures they are not added back to the role. By default, Cortex XSIAM also removes the user from the parent asset roles.
- Advanced Exclusion Settings: To remove a user from a child asset role but leave them in any parent asset roles, click Advanced Exclusion Settings and select Don't Exclude next to the name of the parent role.
- Manually Add Users: Click Add User to manually assign a role. To add users one by one, click Add New and type the usernames using the exact
Netbios\samAccountformat. To add users in bulk, click Import from File and upload a structured CSV file. - Delete vs. Exclude: If you right-click and select Delete User on a manually added user, the user is removed from the included list. If the system automatically detects the user acting in that role in the future, they appear in the Included User list again. To permanently prevent them from being associated with the role, you must use the Exclude action.
- Edit user name: To change the name of a user, right-click the user name and Edit User.
Honey user
A honey user is a decoy account designed to mimic a legitimate user within your environment. This kind of user looks attractive to potential attackers, with access to many assets, and is used for triggering alerts if accessed.
One of the techniques used by an attacker trying to gain access to your network is attempting to use the credentials of accounts in your organization. By setting up honey users, you can detect these access attempts as soon as they occur. Unlike genuine user accounts, honey users have no legitimate purpose within the organization, making any activity involving them inherently suspicious. Cortex XSIAM uses its out-of-the-box ITDR module to automatically detect activity on the honey user role for identifying suspicious activities.
To use a honey user account for detection, you must configure it manually.
Configure a honey user
- In Inventory → Assets → Configurations → Asset Roles, right click to select Honey User.
- Click Edit Asset Role.
- Select Add User → Add New and enter the honey user account details in the NetBIOS\SAM Account format.
Improve Active Directory posture with AD-SPM
Prerequisites
- ITDR add-on
- View or View/Edit RBAC permissions for Identity Runtime Security
Active Directory Security Posture Management (AD-SPM) scans your infrastructure against known misconfiguration patterns, and weak and compromised passwords, to detect security vulnerabilities and provide specific remediation guidance.
To enable AD-SPM, toggle the AD-SPM setting in the Identity profile of the agent. To see how to configure the Identity profile, see Set up Identity Profiles.
Explore AD identities
AD-SPM discovers the following on-premises identity types:
- Human identities
- Non-human identities
- Groups
- Policies
Review and manage AD posture detection rules
Monitor your organization’s detected AD misconfigurations and weak passwords in Modules → Identity Security → Detection Rules → Posture.
AD-SPM provides a comprehensive list of about 150 detection rules. Filter the Provider field for Active Directory to see the detection rules that apply to identities. Following are a few examples of these rules:
- Dangerous ACLs on AD certificate container
- Privileged user with a password that never expires
- Non-privileged users can set Server Trust Account
On this page you can do the following:
- Use the widgets to view your identity rules, identify top issues, and view impact by asset type.
- Click each rule in the table to open a side panel where you can see the rule details, remediation suggestions, and compliance controls. This panel also displays the XQL query used to generate the issue. You can customize it or copy it to use it in the XQL Query editor.
- Create a new rule. Cortex provides default rules for managing your cloud posture. To add more customized rules, click Create Rule, select Identity. For more information, see Create a custom detection rule in Cortex Cloud Identity Security.
Investigate AD misconfigurations
To review the AD misconfigurations in your organization and investigate the issues related to them, navigate to Modules → Identity Security → Identity Asset Inventory → All Identity Assets. In the On-premises Identities tab, filter the table using the following types to see the details about risky identities:
- AD Generic Principle
- AD Group
- AD Machine Account
- AD Service Account
- AD User
Filter according to the Weak/Compromised Password to see the accounts at risk for unauthorized access and credential exploitation.\
Each identity displays the number and severity of the issues triggered by the module.\
To investigate the issues do one of the following:
- Click the identity to see its side panel. From this panel, click the number of issues to open up the issues table.
- In Modules → Identity Security → Issues → Posture, select an issue.
Enforce dynamic access control with CAP
Prerequisites
- View or View/Edit RBAC permissions for Conditional Access Policy
- ITDR add-on license : Activate the ITDR add-on license for your Cortex tenant.
- Cortex agent on Domain Controllers : Deploy the Cortex agent on all Domain Controllers where you want to enforce Conditional Access Policy rules.\
Note: The CAP agent requires a minimum of 200 MB of RAM and 10 GB of storage. - Cortex Identity Engine (CIE) : Connect your Active Directory (AD) integration and MFA Provider via CIE.
- MFA provider : Configure Okta or Entra ID as the MFA provider in your environment.
Conditional Access Policy (CAP) provides context-driven access control by evaluating real-time authentication requests against user-centric security contexts, risk levels, and protocol data. Leveraging Cortex XSIAM-enriched telemetry, it enables you to dynamically enforce access decisions such as allowing, blocking, or triggering multi-factor authentication (MFA) challenges.
Key capabilities
Conditional Access Policy delivers the following core capabilities:
- Context-driven access control: Evaluate authentication requests in real time by checking user-centric security contexts, risk, and protocol structural data.
- Real-time enforcement: Enforce access decisions in near real time with minimal delays, leveraging Cortex XSIAM-enriched data.
- MFA integration: Trigger multi-factor authentication challenges based on risk conditions, with configurable challenge frequency and context scope.
- Simulation mode: Monitor access patterns without blocking users, allowing security teams to validate rules before enforcing access restrictions.
Supported environments
The following table summarizes the environments and integrations that Conditional Access Policy supports.
| Category | Supported options |
|---|---|
| Domain Controllers | Enterprise integration |
| Authentication protocols | Kerberos, NTLM |
| Operating system platforms | Windows, Linux, Mac |
| Device types | Managed devices, unmanaged devices, devices outside the organization domain |
| MFA providers | Okta, EntraID |
Conditional Access Policy use cases
The following table shows example rules based on common access conditions.
| Objective | Example rule |
|---|---|
| Critical Infrastructure Protection | Implement zero-trust boundaries by restricting RDP access to Domain Controllers exclusively to authorized "IT Admins". |
| Risk-Based Threat Mitigation | Dynamically trigger mandatory MFA challenges when an identity with a "High" User Risk Score attempts to authenticate to critical Database Servers. |
| Protocol Hardening | Enforce MFA for high-risk protocols such as RDP and SMB. |
| Third-Party Risk Management | Restrict the "Contractors" security group from accessing designated sensitive internal assets. |
Target personas
Conditional Access Policy serves three primary personas:
- SecOps engineer: Create and configure Conditional Access Policy rules, manage rule priority, and optimize policies based on audit data.
- SecOps analyst: Review audit logs, monitor policy enforcement trends, and identify security gaps.
- End-user: Receive MFA challenges or access-blocked notifications based on Conditional Access Policy enforcement.
High-level workflow
Conditional Access Policy follows a three-phase workflow:
- Create rules : Define Conditional Access Policy rules with conditions, actions, and MFA settings. Assign rule priority to control evaluation order.
- Enforce policies : Cortex XSIAM evaluates authentication attempts against Conditional Access Policy rules in real time, and enforces the configured action for the first matching rule: MFA Verification, Block, Monitor, or Allow.
- Monitor and optimize : Review audit logs and policy widgets to assess rule effectiveness. Adjust rules, conditions, and priorities based on observed access patterns.
Access the Conditional Access Policy page under Modules → Identity Security → Conditional Access
Deploy and configure the Conditional Access Policy
Configure your identity profiles, create and manage context-driven access rules, and analyze authentication results through centralized identity access logs.
Configure an Identity profile
Use the toggle in Set up an Identity profile to enable or disable the Conditional Access policy .
Important: To activate the engine, you must enable the Conditional Access Policy (CAP) feature flag and configure its specific system parameters within the Identity Profile settings. These global configurations determine how the underlying agent handles authentication interception and structural service errors across your domain.
Create a Conditional Access Policy rule
Define a new rule to control access based on contextual conditions. Your entire policy can contain a maximum of 20 rules.
- Go to Modules → Identity Security → Conditional Access → Rules.
- Click Create New Rule. Use one of the provided templates and customize according to your rules, or create the rule from scratch.
- In General, specify a Rule Name and a Rule Description.
- In Mode, select Enforcement if you want to apply the rule immediately and Simulation to monitor the rule and evaluate the potential impact before you decide to enforce the rule. The Simulation mode records the event in silent mode so that you can review and fine-tune the rules.
- Select the rule action:
- Allow: Approve the access request.
- Block : Deny the access request entirely. You can select whether to interact with the user, to send an email or to trigger a message on the screen.
- MFA Verification : Requires the user to complete an MFA challenge before granting access. Select how to interact with the user, by sending an email or by triggering a message on the screen. Configure the following MFA settings:
- MFA Provider: Okta or Entra ID. You must have an integration with the MFA provider configured. If you don’t, click Add MFA Integration to configure the integration. After you have integrated an MFA provider, continue with the rule configuration.
- MFA Challenge Duration: How often the user must re-authenticate using MFA. This value can be every 4 hours, every 8 hours, every 12 hours, every 24 hours, or every week.
- MFA Challenge Scope: How the MFA is applied, per user only across devices or per user and source device combination.
- Fail Mode: What to do if the verification fails due to the unavailability of the MFA provider due to an error or a timeout, to allow or block access.
- In Target, select who the rule will apply to. You can select all users or certain groups.\
When using Groups Selection, you can define groups of Asset Roles or Security Groups defined in the Active Directory, or any combination of them using AND and OR operators. You can define asset roles in Inventory → Assets → Asset Roles Configuration.\
You can then define exclusions by selecting them under Excluded Users.\
The two tabs under the configuration selections display all the Targeted Users and all the Excluded Users for this rule. - In Conditions, define rule conditions by selecting attribute-based criteria for the users configured in the previous step.
- Authentication Protocol: Kerberos or NTLM.
- Identity: Conditions based on the fields of the identity. When you select a risk level, the Identity attributes condition is displayed. Use the Identity attributes to specify the MITRE Tactics the user is involved in or Security Insights.
- Source: Source Host Name or Source IP.
- Destination: Destination Host name, IP, Authentication Service or SPN.
- Review the rule summary generated from the selected conditions. You can go back and edit rule details.
- Click Create.
The new Conditional Access Policy rule appears in the rule list on the Conditional Access Policy page.
Adjust the rule priority to control the evaluation order relative to other rules and click Save.\
If you activate the rule, the system begins evaluating authentication attempts against the rule conditions immediately.\
When the conditions of a rule are met for a user, the rule is applied and the rest of the rules aren’t considered.
Monitor and manage Identity Access Rules
The Conditional Access Rules page serves as the centralized management console for your context-aware security policies, accessible under Modules → Identity Security → Conditional Access → Rules. This interface provides a unified workspace to track policy impact metrics via interactive widgets, search and filter existing configurations, and access granular audit events. Using this centralized interface, you can dynamically manage the entire lifecycle of access rules, ensuring a strong corporate identity security posture.
Manage existing rules
In the Rule list, right-click a rule to edit, disable, move to change priority, or delete it as your security requirements change.
Manage rule priority
Control the order in which the system evaluates Conditional Access Policy rules. Because policies are processed sequentially, the engine applies a strict first-match-takes-effect execution flow. When an authentication attempt satisfies all criteria of a rule, that action is enforced, and subsequent rules are skipped. To adjust the evaluation order, drag and drop a rule to its new vertical position in the table grid.
Simulation Mode Exception: Rules configured in Simulation mode do not stop the priority evaluation chain. When an authentication attempt matches a simulation rule, the event is silently logged for impact analysis, and the engine immediately continues evaluating the next rule in the list.
The following table lists the columns available on the Conditional Access Rules table.
| Column | Description |
|---|---|
| Priority | Top-down processing order of the rule. |
| Rule Name | The title of the rule. |
| Description | Summary of the rule's logic and objective. |
| Status | Activation state toggle (Enabled or Disabled). |
| Mode | Rule state tier (Enforcement or Simulation). |
| Action | Security behavior triggered on match (Monitor, Allow, Block, or MFA Verification). |
| Hits | Total number of authentication attempts matching this rule. |
| Identity Impact | Total unique users affected by the rule. |
| Modified By | Email of the user who last edited the rule. |
| Last Modified | Timestamp of the most recent configuration save. |
| Created By | Email of the user who created the rule. |
| MFA Provider | An integrated third-party MFA service handles verification challenges (Okta or Entra ID). |
| Creation Time | Timestamp when the rule was first saved. |
Monitor and manage Identity Access Logs
The Identity Access Logs page provides a centralized, high-fidelity audit trail of all authentication events processed by the conditional access engine, accessible under Modules → Identity Security → Conditional Access → Logs. As your primary Policy Enforcement Point visibility interface, it captures real-time telemetry from every matched policy rule, tracking whether an access attempt was allowed, blocked, or challenged with MFA. Use this page for investigation and fine-tuning of your policy.
The following table lists the columns available on the Identity Access Logs table.
| Column | Description |
|---|---|
| Timestamp | Date and time the authentication attempt was evaluated. |
| Identity | Username of the user initiating the connection. |
| Source Device Name | Endpoint hostname or IP address originating the request. |
| Destination Device Name | Target system or asset being accessed. |
| Protocol | Intercepted network protocol used (Kerberos or NTLM). |
| Service Type | Connection type requested (RDP, SMB, SSH, etc). |
| Authentication Status | Final result of the connection attempt (Allowed, Denied, or Failed). |
| Reason | Explanatory context behind the authentication status (rule block, MFA timeout). |
| Rule Name | Conditional Access rule matched by the attempt. |
| Action | Security control is enforced by the rule (Monitor, Allow, Block, or MFA Verification). |
| Mode | Operational state of the rule (Enforcement or Simulation). |
| DC Name | Domain Controller that intercepted the request. |
Prevent malicious LDAP queries
Active Directory (AD) routinely processes millions of legitimate queries from users and services. Threat actors frequently exploit this open architecture during the reconnaissance phase of an attack to map the network, identify privileged users, and discover attack paths without triggering standard security alarms.
To accurately distinguish between legitimate administrative queries and malicious reconnaissance, ITDR analyzes the context of LDAP traffic in real time. Instead of viewing a single query in isolation, ITDR evaluates it in context to reveal malicious intent.
The module continuously evaluates traffic across four key behavioral dimensions:
- Source of query: Analyzes whether the request originates from a known, trusted admin workstation or an anomalous, unverified endpoint.
- Number of queries (volume): Monitors for massive spikes in read operations. Normal business logic usually involves looking up a few contacts, whereas reconnaissance tools query thousands of objects in seconds.
- Contextual patterns: Flags activity if a user suddenly deviates from their standard historical behavior or performs lookups that do not align with their role.
- Query attributes: Identifies specific search filters that are highly valuable to attackers but rarely used in typical operations (such as searches for
adminCount=1or unconstrained delegation).
The module identifies and blocks the unique signatures of specific reconnaissance tools at the source. Rather than generating generic alerts, ITDR provides precise alerts, for example, "Attack detected via BloodHound".
Key Benefits
Implementing this protection provides you with two primary advantages:
- Real-Time prevention: Stops attacks proactively during the reconnaissance phase. By blocking the LDAP queries, the system blinds the attacker and forces them to operate without a map of your environment.
- Enriched analytics: Every blocked query is fed back into the Cortex ITDR analytics engine. This data generates detailed issues within Cortex XSIAM, giving you actionable intelligence on exactly which tool was being used and who the attacker was targeting.
To enable LDAP protection, toggle the LDAP protection setting in the Identity profile of the agent. To configure the Identity profile, see Set up Identity Profiles.
Cloud Security
Monitor and track compliance adherence
Determine asset vulnerabilities and risk by checking whether assets adhere to industry standards or your organization's best practices for compliance.
You can view all compliance-related details in the tenant under Posture Management → Compliance.
This feature requires Cloud Posture Security, Cloud Runtime Security, or Cortex XSIAM Premium license.
Cortex XSIAM compliance flow
Cortex compliance workflow for evaluating your overall compliance posture for various compliance standards.
The following steps describe the flow for evaluating asset compliance.
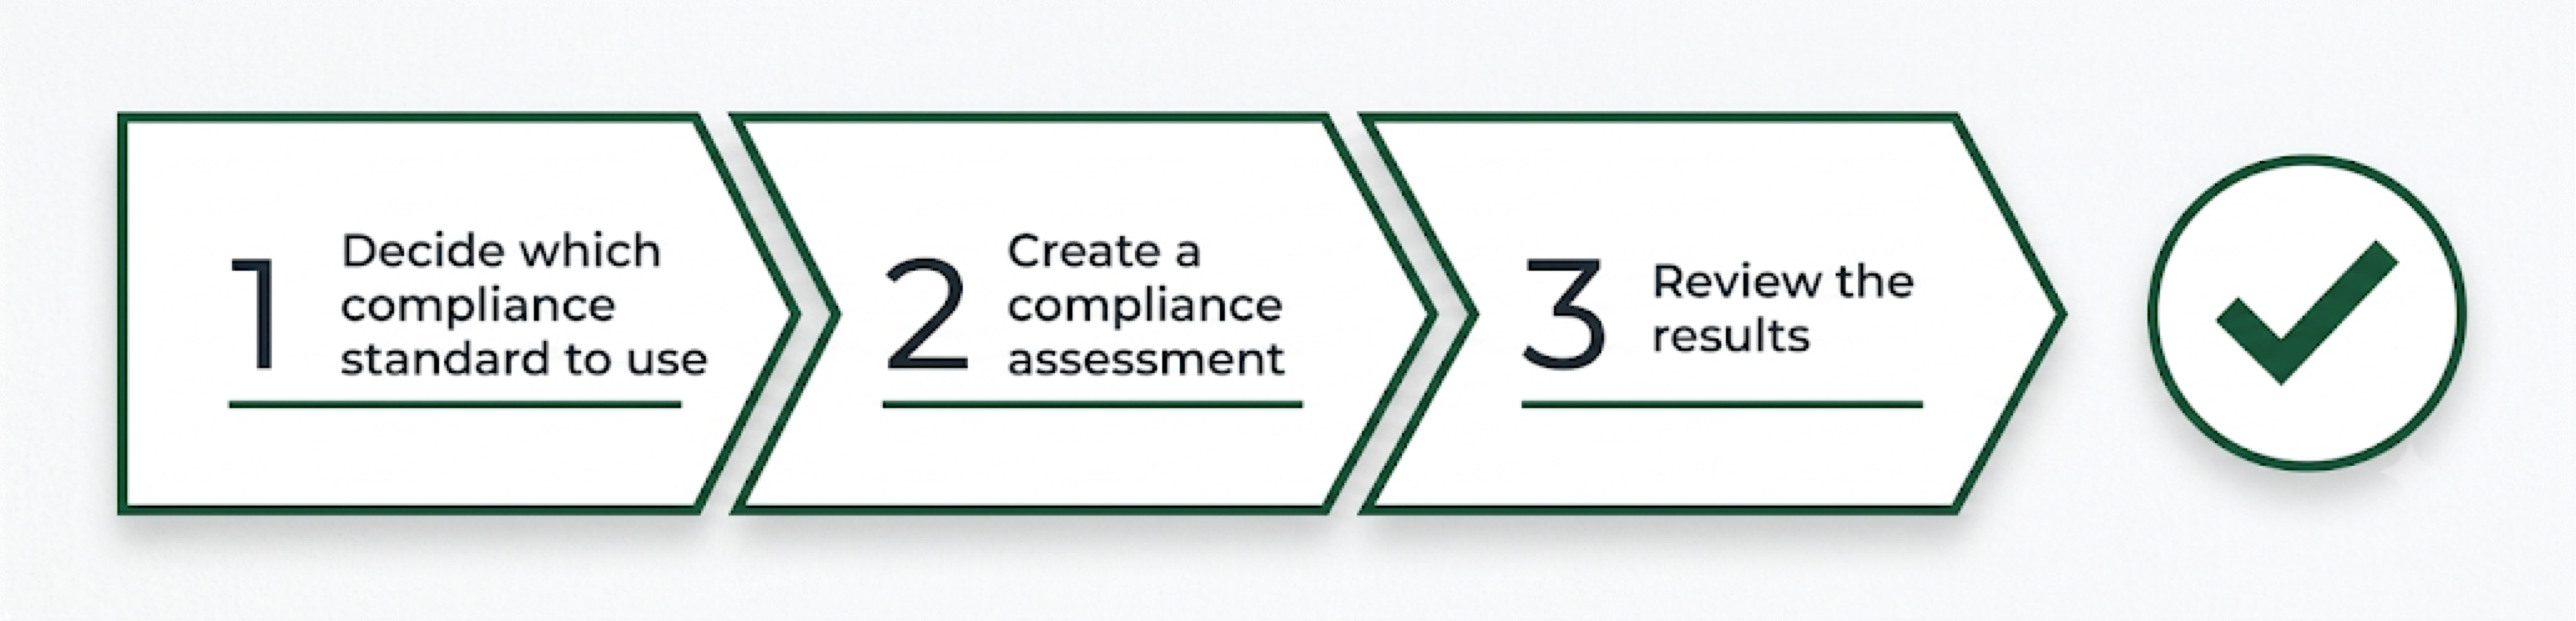
| Step | See more |
|---|---|
| Step 1. Decide which compliance standard to use. | Choose compliance standards from the compliance catalog |
| Step 2. Create a compliance assessment. | Use an assessment profile to run compliance checks on your assets |
| Step 3. Review the results. | View and manage compliance assessments and reports |
Choose compliance standards from the compliance catalog
The compliance catalogs provide a list of available compliance standards and controls.
Cortex provides lists of available standards and controls in the Standards and Controls catalogs under Posture Management → Compliance → Catalogs.
What are standards and controls?
Standards are guidelines that organizations follow in order to comply with industry best practices and regulations, as well as internal organizational policies and procedures. They improve security and quality in operational practices.
Standards consist of controls, which are measures related to the standard that ensure compliance and mitigate risks. Controls are built from one or more rules, the specific checks that run on an asset. Controls are grouped into categories and sub-categories.
The Standards and Controls catalogs include built-in industry standards and controls and custom organizational standards and controls.
Standards catalog
The Standards Catalog page displays a list of the available standards:
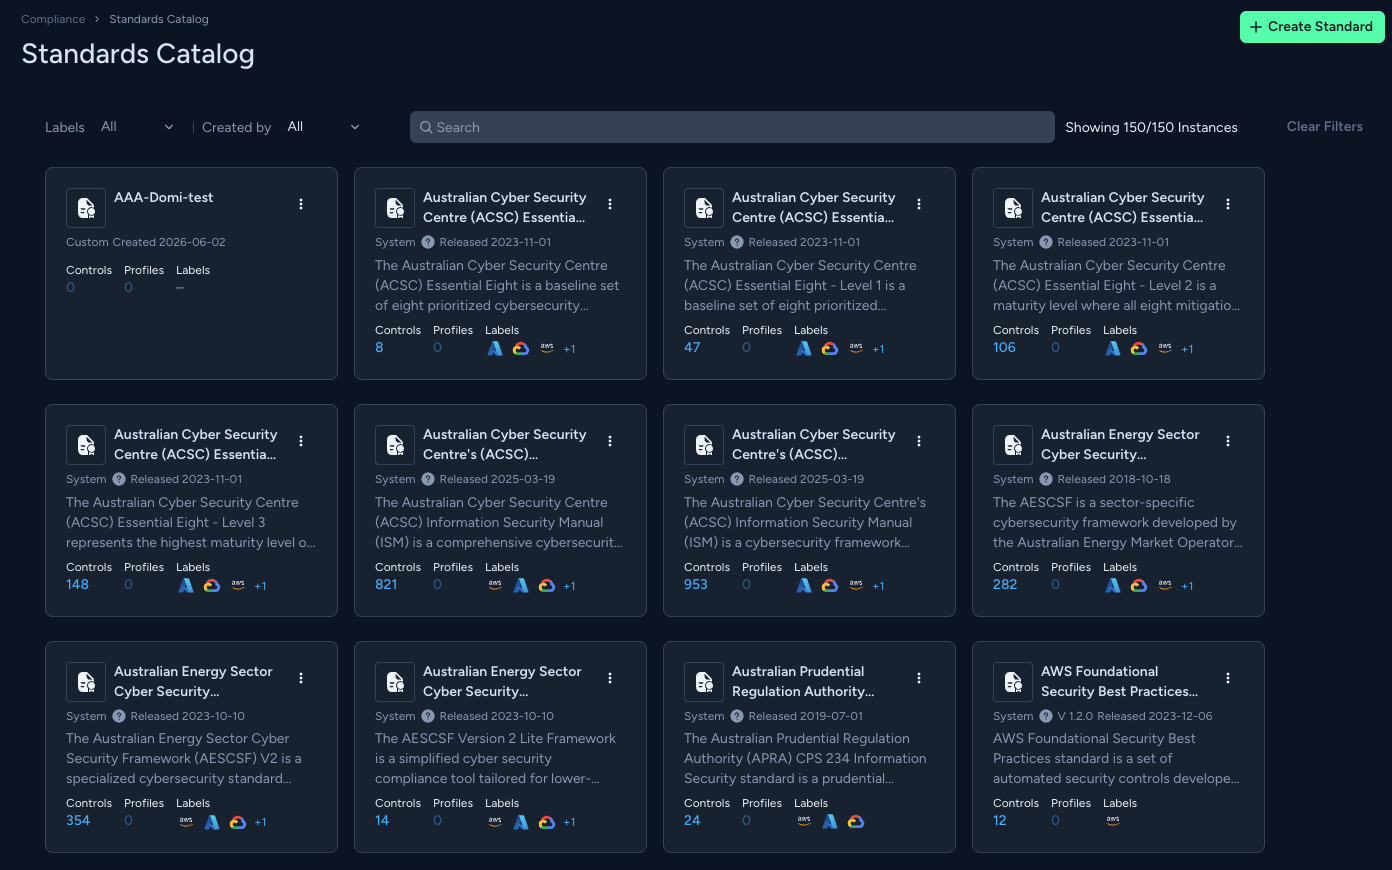
Click on a specific standard to open the standard overview side panel with detailed information about the standard:
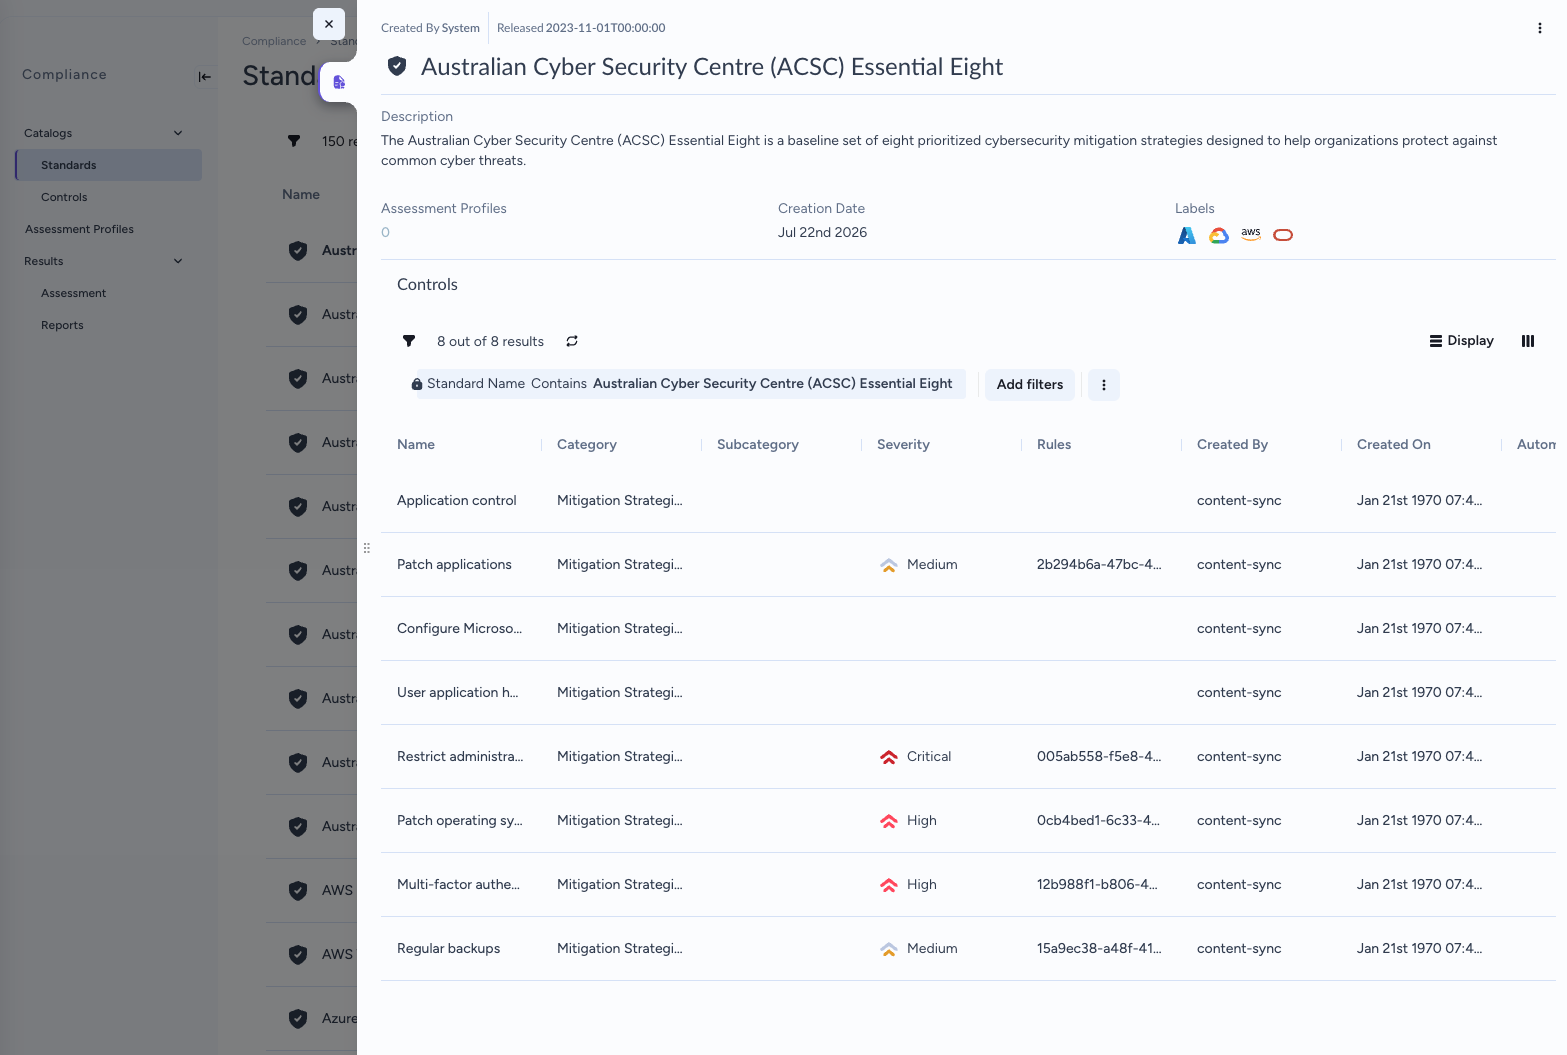
From the side panel, you can view and filter controls associated with the standard, and click on a control to view its details and the rules associated with it.
Built-in compliance standards
| Compliance Standard | Version |
|---|---|
| Australian Cyber Security Centre (ACSC) Essential Eight | – |
| Australian Cyber Security Centre (ACSC) Essential Eight - Level 1 | – |
| Australian Cyber Security Centre (ACSC) Essential Eight - Level 2 | – |
| Australian Cyber Security Centre (ACSC) Essential Eight - Level 3 | – |
| Australian Cyber Security Centre's (ACSC) Information Security Manual (ISM) | – |
| Australian Cyber Security Centre's (ACSC) Information Security Manual (ISM) Latest | – |
| Australian Energy Sector Cyber Security Framework (AESCSF) | 1 |
| Australian Energy Sector Cyber Security Framework (AESCSF) v2 | 2 |
| Australian Energy Sector Cyber Security Framework (AESCSF) v2 - Lite Framework | 2 |
| Australian Prudential Regulation Authority (APRA) - CPS 234 Information Security | – |
| AWS Foundational Security Best Practices standard | 1.2.0 |
| AWS Well-Architected Framework | – |
| Azure Security Benchmark | 3 |
| Brazilian Data Protection Law (LGPD) | – |
| California Consumer Privacy Act (CCPA) | 2018 |
| CIS Alibaba Cloud Foundation Benchmark - Level 1 | 2.0.0 |
| CIS Alibaba Cloud Foundation Benchmark - Level 2 | 2.0.0 |
| CIS Amazon Elastic Kubernetes Service (EKS) Benchmark | 1.4 |
| CIS Amazon Elastic Kubernetes Service (EKS) Benchmark | 1.7.0 |
| CIS Amazon Elastic Kubernetes Service (EKS) Benchmark | 1.8.0 |
| CIS Amazon Linux 2 Benchmark | 1.0.0 |
| CIS Amazon Linux 2 STIG Benchmark | 2.0.0 |
| CIS Amazon Web Services Foundations Benchmark v3.0.0 - Level 1 | 3.0.0 |
| CIS Amazon Web Services Foundations Benchmark v3.0.0 - Level 2 | 3.0.0 |
| CIS Amazon Web Services Foundations Benchmark v4.0.0 - Level 1 | 4.0.0 |
| CIS Amazon Web Services Foundations Benchmark v4.0.0 - Level 2 | 4.0.0 |
| CIS Amazon Web Services Foundations Benchmark v5.0.0 - Level 1 | 5.0.0 |
| CIS Amazon Web Services Foundations Benchmark v5.0.0 - Level 2 | 5.0.0 |
| CIS Amazon Web Services Foundations Benchmark v6.0.0 - Level 1 | 6.0.0 |
| CIS Amazon Web Services Foundations Benchmark v6.0.0 - Level 2 | 6.0.0 |
| CIS Amazon Web Services Foundations Benchmark v7.0.0 - Level 1 | 7.0.0 |
| CIS Amazon Web Services Foundations Benchmark v7.0.0 - Level 2 | 7.0.0 |
| CIS AWS Storage Services Benchmark | 1.0.0 |
| CIS Azure Kubernetes Service (AKS) Benchmark | 1.5 |
| CIS Azure Kubernetes Service (AKS) Benchmark v1.8.0 | 1.8.0 |
| CIS Critical Security Controls v8 | 8 |
| CIS Critical Security Controls v8.1 | 8.1 |
| CIS Debian Linux 13 - Server Level 1 | 1.0.0 |
| CIS Debian Linux 13 - Server Level 2 | 1.0.0 |
| CIS Debian Linux 13 - Workstation Level 1 | 1.0.0 |
| CIS Debian Linux 13 - Workstation Level 2 | 1.0.0 |
| CIS Distribution Independent Linux | 2.0.0 |
| CIS Docker Benchmark | 1.7.0 |
| CIS GitHub Benchmark | 1.0.0 |
| CIS GitLab Benchmark | 1.0.1 |
| CIS Google Cloud Platform Foundation Benchmark v3.0.0 - Level 1 | 3.0.0 |
| CIS Google Cloud Platform Foundation Benchmark v3.0.0 - Level 2 | 3.0.0 |
| CIS Google Cloud Platform Foundation Benchmark v4.0.0 - Level 1 | 4.0.0 |
| CIS Google Cloud Platform Foundation Benchmark v4.0.0 - Level 2 | 4.0.0 |
| CIS Google Kubernetes Engine (GKE) Benchmark v1.6.0 | 1.6.0 |
| CIS Google Kubernetes Engine (GKE) Benchmark v1.8.0 | 1.8.0 |
| CIS Kubernetes Benchmark | 1.11.0 |
| CIS Microsoft Azure Foundations Benchmark v3.0.0 - Level 1 | 3.0.0 |
| CIS Microsoft Azure Foundations Benchmark v3.0.0 Level 2 | 3.0.0 |
| CIS Microsoft Azure Foundations Benchmark v4.0.0 - Level 1 | 4.0.0 |
| CIS Microsoft Azure Foundations Benchmark v4.0.0 - Level 2 | 4.0.0 |
| CIS Microsoft Azure Foundations Benchmark v5.0.0 - Level 1 | 5.0.0 |
| CIS Microsoft Azure Foundations Benchmark v5.0.0 - Level 2 | 5.0.0 |
| CIS Microsoft Azure Foundations Benchmark v.6.0.0 - Level 1 | 6.0.0 |
| CIS Microsoft Azure Foundations Benchmark v.6.0.0 - Level 2 | 6.0.0 |
| CIS Microsoft Azure Storage Services Benchmark | 1.0.0 |
| CIS Microsoft Windows 11 Enterprise Benchmark | 4.0.0 |
| CIS Microsoft Windows Server 2016 Benchmark | 3.0.0 |
| CIS Microsoft Windows Server 2019 Benchmark | 3.0.1 |
| CIS Microsoft Windows Server 2022 Benchmark | 3.0.0 |
| CIS Oracle Cloud Infrastructure Foundations Benchmark v.2.0.0 - Level 1 | 2.0.0 |
| CIS Oracle Cloud Infrastructure Foundations Benchmark v.2.0.0 - Level 2 | 2.0.0 |
| CIS Oracle Cloud Infrastructure Foundations Benchmark v.3.0.0 - Level 1 | 3.0.0 |
| CIS Oracle Cloud Infrastructure Foundations Benchmark v.3.0.0 - Level 2 | 3.0.0 |
| CIS Red Hat OpenShift Container Platform | 1.7.0 |
| CIS Red Hat OpenShift Container Platform Benchmark - Level 1 | 1.9.0 |
| CIS Red Hat OpenShift Container Platform Benchmark - Level 2 | 1.9.0 |
| CIS Ubuntu Linux 24.04 LTS Benchmark - Server Level 1 | 1.0.0 |
| CIS Ubuntu Linux 24.04 LTS Benchmark - Server Level 2 | 1.0.0 |
| CIS Ubuntu Linux 24.04 LTS Benchmark - Workstation Level 1 | 1.0.0 |
| CIS Ubuntu Linux 24.04 LTS Benchmark - Workstation Level 2 | 1.0.0 |
| Cloud Security Assurance Program (CSAP) - IaaS | IaaS |
| Cloud Security Assurance Program (CSAP) - Low | Low |
| Cloud Security Assurance Program (CSAP) - Low SaaS | Low SaaS |
| Cloud Security Assurance Program (CSAP) - SaaS Simplified | SaaS Simplified |
| Cloud Security Assurance Program (CSAP) - SaaS Standard | SaaS Standard |
| CSA Cloud Controls Matrix (CCM) | 4.0.12 |
| CSA Cloud Controls Matrix (CCM) v4.0.6 | 4.0.6 |
| Cyber Risk Institute (CRI) Profile | 1.2.1 |
| Cyber Risk Institute (CRI) Profile | 2.0 |
| Cyber Risk Institute (CRI) Profile | 2.1 |
| CyberSecurity Law of the People's Republic of China | – |
| Cybersecurity Maturity Model Certification (CMMC) | 1.02 |
| Cybersecurity Maturity Model Certification (CMMC) Level 1 | 2 |
| Cybersecurity Maturity Model Certification (CMMC) Level 2 | 2 |
| Digital Operational Resilience Act (DORA) | – |
| EU AI Act | – |
| Federal Financial Institutions Examination Council (FFIEC) | – |
| FedRamp (High) | – |
| Fedramp (Low) | – |
| Fedramp (Moderate) | – |
| Framework for Adoption of Cloud Services by SEBI Regulated Entities (REs) | – |
| General Data Protection Regulation (GDPR) | – |
| Health Insurance Portability and Accountability Act (HIPAA) | – |
| HITRUST CSF | 11.2.0 |
| HITRUST CSF | 11.7.0 |
| HITRUST CSF | 9.6.0 |
| Information Technology Security Guidance (ITSG-33) | – |
| Insurance Regulatory And Development Authority Of India | 1 |
| ISO/IEC 27001:2022 | 2022 |
| ISO/IEC 27002:2022 | 2022 |
| ISO/IEC 27017:2015 | 2015 |
| ISO/IEC 27018:2019 | 2019 |
| ISO/IEC 42001:2023 | 2023 |
| Korea – Information Security Management System (ISMS) | – |
| Korea – Information Security Management System (ISMS) For Finance | - |
| MAS Technology Risk Management (TRM) | 2021 |
| Microsoft Cloud Security Benchmark | 1 |
| MITRE ATT&CK Cloud IaaS for Enterprise | 15.1 |
| Motion Picture Association (MPA) Content Protection Best Practices | 4.08 |
| Multi-Level Protection Scheme (MLPS) v2.0 - Level 1 | 2.0 |
| Multi-Level Protection Scheme (MLPS) v2.0 - Level 2 | 2.0 |
| Multi-Level Protection Scheme (MLPS) v2.0 - Level 3 | 2.0 |
| NCSC - Cloud Security Principles | 2.1 |
| NCSC - Cyber Essentials | 3.1 |
| NEW YORK STATE DEPARTMENT OF FINANCIAL SERVICES (NYDFS) 23 CRR-NY 500.0 | – |
| New Zealand Information Security Manual (NZISM) | 3.4 |
| New Zealand Information Security Manual (NZISM) | 3.9 |
| NIST AI 600-1 | – |
| NIST Cybersecurity Framework (CSF) | 1.1 |
| NIST Cybersecurity Framework (CSF) | 2 |
| NIST SP 800-171 | Rev 2 |
| NIST SP 800-171 | Rev 3 |
| NIST SP 800-172 | – |
| NIST SP 800-53 | Rev 5 |
| NIST SP 800-190 | - |
| Otoritas Jasa Keuangan (OJK) | 38/POJK.03/2016 |
| OWASP Top 10 for Agentic Applications | 2026 |
| OWASP TOP 10 CI/CD Security Risks | 2025 |
| OWASP Top 10 for LLM Applications | 2025 |
| PCI DSS | 4.0.1 |
| Personal Information Protection and Electronic Documents Act (PIPEDA) | – |
| RBI Baseline Cyber Security and Resilience Requirements | – |
| Risk Management in Technology (RMiT) | – |
| Sarbanes Oxley Act (SOX) | – |
| SEBI - Consolidated Cybersecurity and Cyber Resilience Framework (CSCRF) | – |
| Secure Controls Framework (SCF) | 2024.2 |
| Secure Controls Framework (SCF) | 2022.2.1 |
| SOC 2 | – |
| Telecommunications Security Act (TSA) | – |
| Texas Risk and Authorization Management Program (TX-RAMP) - Level 1 | - |
| Texas Risk and Authorization Management Program (TX-RAMP) - Level 2 | - |
| The Digital Personal Data Protection Act 2023 | – |
| Trusted Information Security Assessment Exchange (TISAX) | 6 |
Controls catalog
Review the list of all the built-in and custom compliance standards to monitor and audit your organization’s performance.
The Controls Catalog page shows a list of the available controls and their details, including:
- Name: The control name, including the control index number if available. For example,
2.1.1 Client certificate authentication - Description: A description of the control. For example,
Kubernetes provides the option to use client certificates for user authentication. - Standards: The standards the control is associated with. For example,
CIS Google Kubernetes Engine (GKE) Benchmark v1.6.0 - Category: The control category, including the category index if available. For example,
2 Control Plane Configuration - Sub category: The control sub category if available, including the sub category index if available. For example,
2.1 Authentication and Authorization - Rules: The number of rules associated with the control.
- Creation time: When the control was created.
- Created by: Who created the control. For built-in controls, it is
Palo Alto Networks.
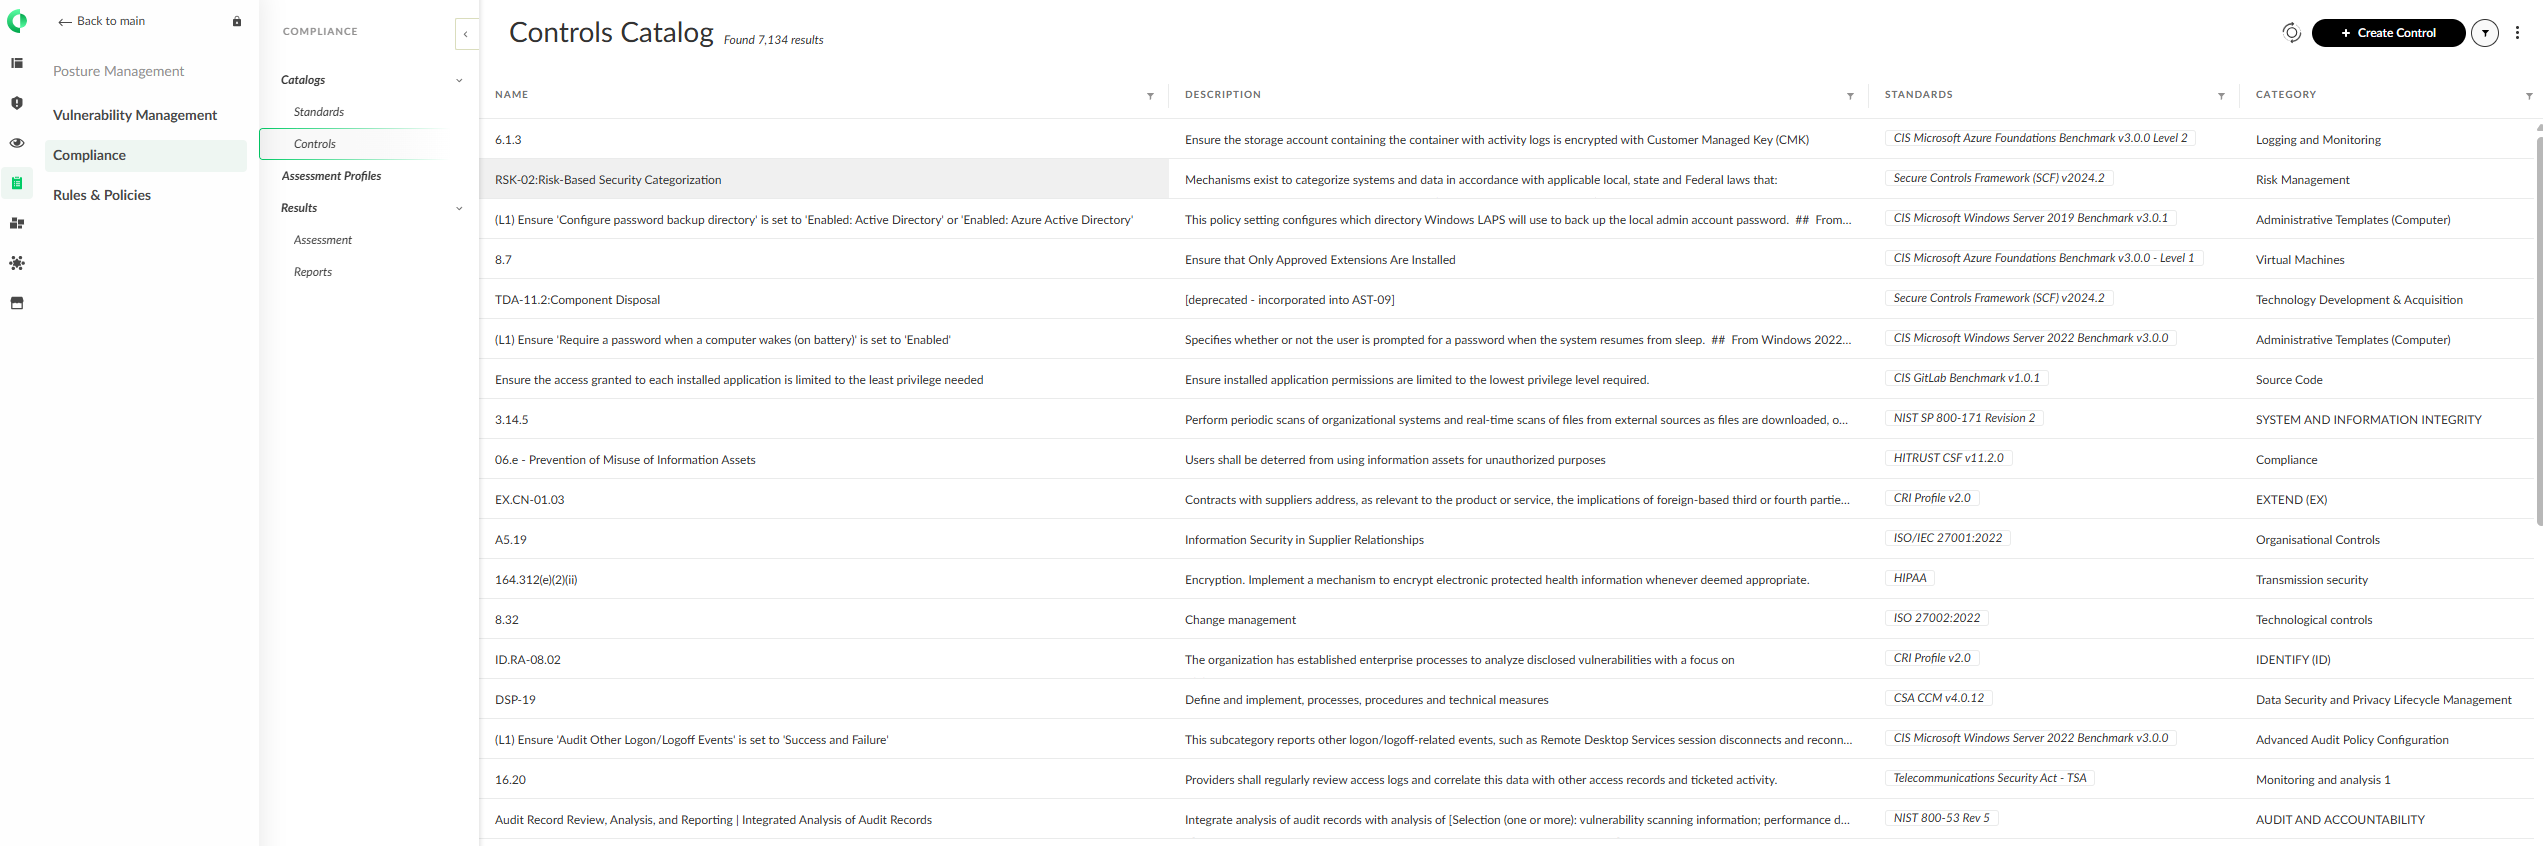
Clicking a control opens a side panel that displays all the control details in the Overview tab, and the list of rules associated with the control in the Rules tab.
Search for specific controls
All of the columns are sortable and filterable. By default, the table is sorted numerically by the control index number.
You can search for specific controls using the filter. For example, you can search for all custom controls with the filter Created by != Palo Alto
You can click on a specific rule to open the rule side pane.
Use a built-in or custom standard
You can use a built-in industry standard or create a custom standard. A custom standard can be either a copy of a built-in standard or a custom standard created from scratch.
Use a built-in standard
Cortex provides built-in industry approved regulatory compliance standards, for example GDPR. These standards cannot be edited or deleted, you can duplicate them to create a custom standard.
Clone a built-in standard
To reuse and modify a built-in standard, clone the built-in industry standard:
- In the Standards catalog, right-click on the custom standard you want to edit (or select
 next to it) and then select Save as new.
 - Define compliance standard metadata, including:
- Name: By default, the original built-in standard name is used with “_copy“ is appended. You can update it if needed.
- Description: You can update the description if needed.
- Select Controls: You can select or deselect controls as needed.
- Click Create.
Create a custom standard
You can create a custom compliance standard that is tailored to your own business needs and organizational policies.
To organize controls within a custom compliance standard, you establish categories and optional sub-categories. Every control is defined as part of a specific standard and assigned to a single category within it. Sub-categories offer an additional layer of organizational structure.
- In the Standards catalog, click Create Standard.
- Define compliance standard metadata, including:
- Name
- Description (optional)
- Labels (optional)
- Click Next.
- Under Select Controls, you select the controls that you would like to add to the standard.
- Click Create.
Edit a custom standard
You can edit an existing custom standard.
- In the Standards catalog, right-click on the custom standard (or select next to it) and then select Edit.
- Define compliance standard metadata, including:
- Name
- Description (optional)
- Labels (optional)
- Click Next.
- Under Select Controls, you can do one of the following, select the controls that you would like to add to the standard.
- Click Save.
Delete a custom standard
To delete an existing custom standard and all the categories, subcategories, and controls associated with it, perform the following steps.
- In the Standards catalog, right-click on the custom standard (or select next to it ) and then select Delete.
- Click Delete.
Use a built-in or custom control
When using custom standards, you can use built-in controls or create custom controls and then associate them with detection rules.
Add a built-in control to a custom standard
Cortex XSIAM provides built-in controls that cannot be edited or deleted. When you edit or create a custom standard you can add the built-in control.
Create a custom control to use in a custom standard
You can create a new control that is tailored to your own business needs, standards, and organizational policies to use in a custom standard.
- In the Controls catalog, click + Create Control.
- Define control metadata, including:
- A single category
- A single sub category (optional)
- Control name
- Description (optional)
- One or more custom standards to associate the control with
- Click Create.
- Assign a custom detection rule to the control as follows.
Associate a custom control to a detection rule
You can associate custom compliance controls with workload security and cloud security rules. This tailors compliance checks to your organization’s needs. You can associate controls while creating custom rules. You can also associate them when editing custom or built-in rules.
NOTE
Custom rules can only be associated with custom compliance controls.
The following table summarizes supported rule associations.
| Rule type | Built-in rules | Custom rules |
|---|---|---|
| Cloud workload rules | Not applicable. | Associate custom compliance controls while creating or editing custom cloud workload rules. |
| Cloud security rules | Associate custom compliance controls while editing built-in cloud security rules. | Associate custom compliance controls while creating or editing custom cloud security rules. |
NOTE
You can associate custom compliance controls only with ConfigIdentityAI cloud security rules.
To associate a custom compliance control:
- Go to Posture Management → Rules & Policies → Rules → Cloud Workload or Cloud Security.
- Create a custom policy, or edit an existing rule.
- In Overview → Compliance Controls, click Add.
- Select one or more custom compliance controls.
- Click Assign.
- Save your changes.
Edit a custom control
You can edit a copy of a built-in control or edit an existing custom control. You can also delete a custom control.
- In the Controls catalog, click on the built-in control you want to edit and click Save as new.\
To edit a custom control, click on the custom control and click Edit. - Click Next.
- Edit control metadata, including:
- Category: You can reassign the control to a different category.
- Sub category (optional): You can reassign the control to a different sub category.
- Control name: You can update the control name.
- Description (optional): You can update the control description.
- Select custom standards: You can modify the list of custom standards with which the control should be associated.
- Click Save.
If the control does not already contain a rule, assign a custom detection rule to the control.
Create a new custom detection rule
Create custom detection rules to check your organization’s assets.
Creating custom detection rules give you the flexibility to define and enforce security best practices tailored to your organization's objectives, as well as regulatory requirements not already covered by the compliance standards in our catalog.
Before you begin
Ensure you have a custom compliance control defined to associate the Custom Detection Rule to. For more information, see Use a built-in or custom control.
Create a custom detection rule
- Go to Posture Management → Rules & Policies → Rules → Cloud Workload.
- In the Cloud Workload Rules page, click Create Custom Rule.
- Enter the following settings:
- Rule name: A descriptive name for the custom rule.
- Description: An optional field for adding additional details or context about the rule, such as its purpose or intended behavior.
- Select a Scanner to execute the Custom Detection Rule and its associated script. The options are:
- Agentless Disk Scan
- Kubernetes Connector
- XDR Agent
- Configure settings specific to the scanner you select.
Agentless Disk Scan settings
| Field | Description |
|---|---|
| Operating System | The operating system targeted by the rule. The available options are:
|
| Input file(s) path | The full file path for one or more files. For example, /nfs/an/disks/jj/home/dir/file.txt |
| Define the Rule (Rego) | Use Rego to define the custom detection logic. Use the default code in this box as a reference or starting point. Click read here for more information how to use Rego syntax. Code "/var/log/auth.log": { "content": "Failed password for invalid user test from 192.168.1.1 port 22 ssh2\n", "metadata": { "file_type": "file", "gid": 1000, "last_modified": 1737292449, "permissions": 436, "size": 6000, "uid": 1001 },"path": "/var/log/auth.log" } Script package panw.complianceimport rego.v1 match contains {"msg": msg} if { authLogFile = input["/var/log/auth.log" ] contains(authLogFile.content, "Failed password") authLogFile.metadata.permissions == 436 authLogFile.metadata.size > 5000 msg := "Failed login attempts detected in /var/log/auth.log"} Output "match": [ { "msg": "Failed login attempts detected in /var/log/auth.log" }, ] Example 2 Code "/etc/passwd": { "content": "root0:0:root:/root:/bin/bash\nuser1:*:1001:1001:User One:/home/user1:/bin/bash\n", "metadata": { "file_type": "file", "gid": 1001, "last_modified": 1737292449, "permissions": 644, "size": 100, "uid": 1002 },"path": "/etc/passwd" } Script package panw.complianceimport rego.v1 match contains {"msg": msg} if { passwdFile = input["/etc/passwd"] passwdFile.metadata.file_type == "file" passwdFile.metadata.permissions == 644 passwdFile.metadata.size < 200 contains(passwdFile.content, ":*:") msg := "Empty or suspicious password detected in /etc/passwd"} Output "match": [ { "msg": "Empty or suspicious password detected in /etc/passwd" }, ] Example 3 Code "/etc/shadow": { "content": "root:$6$abc123$abc123abc123abc123abc123abc123abc123abc123abc123abc123abc123abc123abc123abc123abc123abc123:17542:0:99999:7:::", "metadata": { "file_type": "file", "gid": 1001, "last_modified": 1737292449, "permissions": 640, "size": 100, "uid": 1002 },"path": "/etc/shadow" } Script package panw.complianceimport rego.v1 match contains {"msg": msg} if { shadowFile = input["/etc/shadow"] shadowFile.metadata.file_type == "file" shadowFile.metadata.permissions != 600 shadowFile.metadata.size > 30 contains(shadowFile.content, "::") msg := "Empty or weak password detected in /etc/shadow"} Output "match": [ { "msg": "Empty or weak password detected in /etc/shadow" }, ] |
Kubernetes Connector Settings
| Field | Description |
| Kubernetes Resources | From the drop down, select one or more from the following:
|
| Define the Rule (Rego) | All custom Rego policies in Cortex must follow this pattern: package panw.compliance import rego.v1 match contains {"msg": msg} if { # Your detection logic here msg := "Description of the finding" } NOTE The custom rule must use the |
XDR Agent Settings
| Field | Description |
|---|---|
| Custom Code Execution | <div data-gb-custom-block data-tag="hint" data-style="info" class="hint hint-info"><p>NOTE</p><p>Enable this setting for the scanner to perform custom compliance checks by executing user-defined Python scripts.</p><p> Only users with the following roles can enable or disable Custom Code Execution:</p><ul><li>Account Admin</li><li>Instance Administrator</li><li>Deployment Admin</li><li>Privileged Security Admin </li></ul></div><p>Click Confirm to accept the following terms:</p><ul><li>The Python scripts you provide will be executed in your cloud environment(s).</li><li>This capability is solely for the purpose of enabling you to define the compliance check rules for your cloud environment(s). Any other purposes are expressly prohibited.</li><li>Any actions involving WRITE, MODIFY, or DELETE operations of your cloud environment(s) are strictly prohibited. It is your responsibility to ensure that your custom Python scripts only perform read-only operations of your cloud environment(s) explicitly for compliance check purposes.</li><li>You are solely responsible for the quality, content, use, and execution results of your Python script. You assume all risks and liabilities arising from executing your Python script(s), including any potential errors, damages, or consequences resulting from its use.</li></ul><p>After you confirm accepting the terms, the rest of the XDR Agent settings appear.</p> |
| Operating System | <p>The operating system targeted by the rule. The available options are:</p><ul><li>Linux</li><li>Windows</li></ul> |
| Define the Rule (Python) | <div data-gb-custom-block data-tag="hint" data-style="warning" class="hint hint-warning"><p>Important</p><p>Use Python to define the custom detection logic.</p><p>This section supports syntax highlighting and validation (IntelliSense) to help users create accurate and efficient rules.</p><p>Use the default code in this box as a reference or starting point.</p><p>The custom Python scripts are intended to be executed exclusively for compliance checks and validations. To ensure the scripts are used properly and no security risks or unintended changes occur, the system implements the following restrictions and safeguards:</p><ul><li>Only a predefined set of Python libraries and functions required for compliance checks are available for use. Libraries or functions that enable writing, deleting, or creating operations are excluded.</li><li>Only authorized users with specific permissions can create or update custom scripts. This ensures that only trusted individuals can define compliance checks.</li></ul></div> |
- For Compliance Violation Severity, define the severity level of the compliance violation to ensure proper categorization and prioritization. Possible values are:
- Critical
- High
- Medium
- Low
- Informational
- For Compliance Controls, assign the rule to one or more existing compliance controls.
NOTE
Only Custom Detection Rules (not built-in rules) can be assigned to custom controls.
a. Click Add.\
b. Select a custom compliance control from the list.\
c. Click Assign.
- For Remediation, you can optionally define the remediation steps to address any detected misconfiguration.
- Click Create.\
\
The new rule appears in the Rules List.\
\
You can now use the rule as a check to either create an issue or monitor adherence to a specific requirement.
Create an issue
Under Posture Management → Policies → Cloud Workload, add the Custom Detection Rule to a Policy. This policy automatically runs the rule and creates an issue if the check fails.
Monitor compliance adherence
Under Posture Management → Compliance → Catalogs → Standards, create a custom standard that includes the custom control associated with the Custom Detection Rule, and then create an assessment profile that runs the custom standard. You can then monitor the compliance results in a report. For more information, see Monitor and track compliance adherence.
Use an assessment profile to run compliance checks on your assets
What is a compliance assessment profile?
The compliance assessment profiles are configurations that define which standard to run on which asset group. An assessment profile runs scans on asset groups to check whether the assets adhere to a specific standard.
Compliance assessment profiles can be managed from Posture Management → Compliance → Assessment Profiles.
Create a new assessment profile
To create a new assessment profile, select a compliance standard and one or more asset groups you want to run it on.
- Under Posture Management → Compliance → Assessment Profiles, click Create New Assessment.
- Define assessment profile metadata, including:
- Profile name
- Description (optional)
- Optionally schedule generating a report.
- Enter one or more report email recipients, clicking
enteror - Set the cadence for the report generation.
- Enter one or more report email recipients, clicking
- Click Next.
- Select a compliance standard to associate with the assessment profile.
- Select an asset group to run the standard against.
- Click Next.
- Review the profile details in the Summary and click Create.\
\
The assessment profile evaluates the compliance posture and generates a report at the optionally defined cadence, and sends it to the defined emails.
Manage existing assessment profiles
Compliance assessment profiles can be managed from Posture Management → Compliance → Assessment Profiles. Right click on the profile to disable, edit, or delete an existing profile.
Configuring assessments for custom compliance standards based on custom cloud security rules
When using custom compliance standards based on custom cloud security rules make sure to create a cloud security policy including your custom rules to ensure accurate assessment results are generated
While a majority of these guidelines reflect standard practices applicable to other use cases, when using custom compliance standards based on custom cloud security rules make sure to create a cloud security policy including your custom rules to ensure accurate assessment results are generated.
The following table describes the components that are necessary to configure custom compliance standards based on custom rules to ensure that the standard will be assessed against a configured scope of assets:
| Component | Requirements | Documentation link |
|---|---|---|
| Custom compliance standard | Create a custom compliance standard as usual. | Create a custom standard |
| Custom compliance controls | Create custom compliance controls and populate the custom standard with the relevant custom controls. | Create a custom control |
| Custom cloud security rules | Create custom cloud security rules, which implement the detection capabilities necessary to determine the status of the corresponding controls. When creating the rules, make sure to associate them with the relevant custom compliance controls. | Create custom cloud security rules |
| Asset group | Create an asset group which includes the appropriate scope of assets based on the intended purpose of the custom compliance standard. | Create an asset group |
| Assessment profile | Create an assessment profile for the custom standard using the asset group created above. Configure reporting as desired. | Create an assessment profile |
| Custom cloud security policy | <p>To guarantee accurate assessment results, you must create a custom cloud security policy that incorporates all rules from the custom compliance standard. This is required because custom cloud security rules do not automatically generate findings. When creating the policy, make sure that the policy includes:</p><ul><li>The custom compliance standard as the rule scope.</li><li>The asset group used for the assessment profile as the asset scope.</li></ul> | See below |
Create a cloud security policy with the correct rules and scope
When creating a cloud security policy, make sure it fulfills the requirements listed above.
- Navigate to Posture Management → Rules & Policies → Policies → Cloud Security.
- Click Create Policy.
- On the Details page, provide Policy Name, Description, and Labels (optional).
- Click Next.
- (Important) On the Rules page, select All Matching Filter Criteria. Next, select “Compliance Standards”, “Contains”, and then select your custom compliance standard. This ensures that all the cloud security rules from your custom compliance standard are attached to the cloud security policy.\
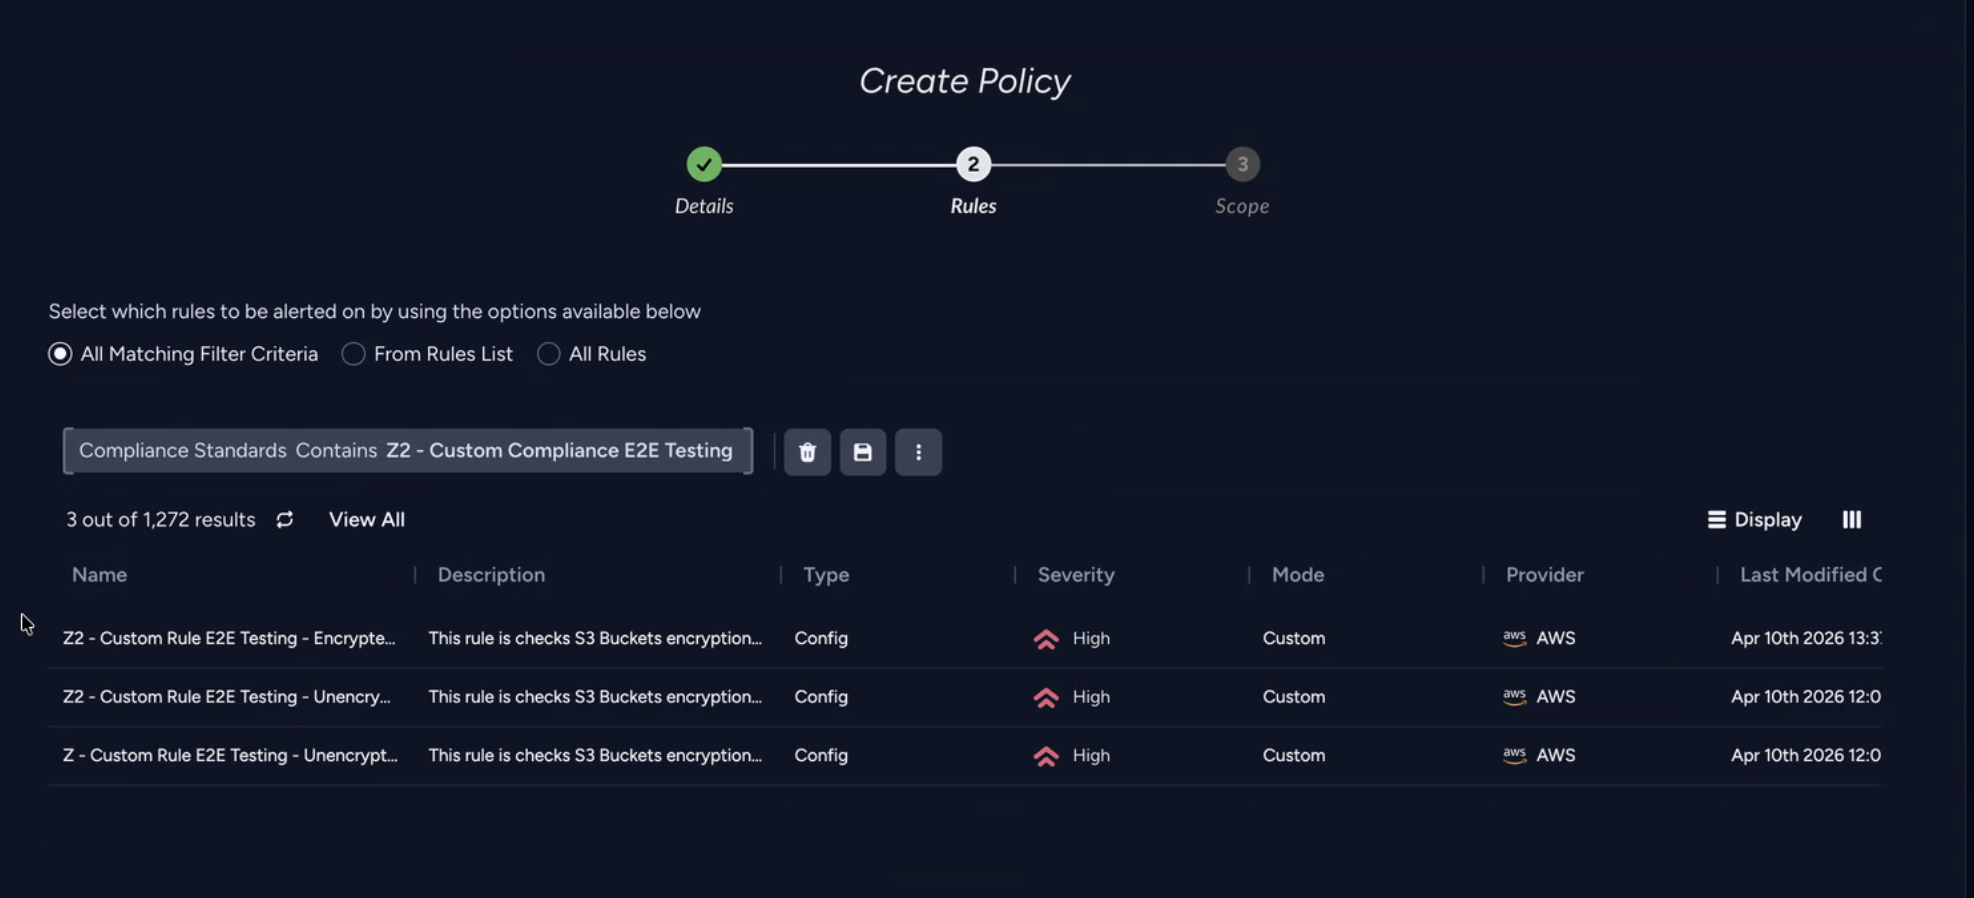
- Click Next.
- (Important) On the Scope page, select From Asset Groups and then select the asset group used for the assessment profile:\
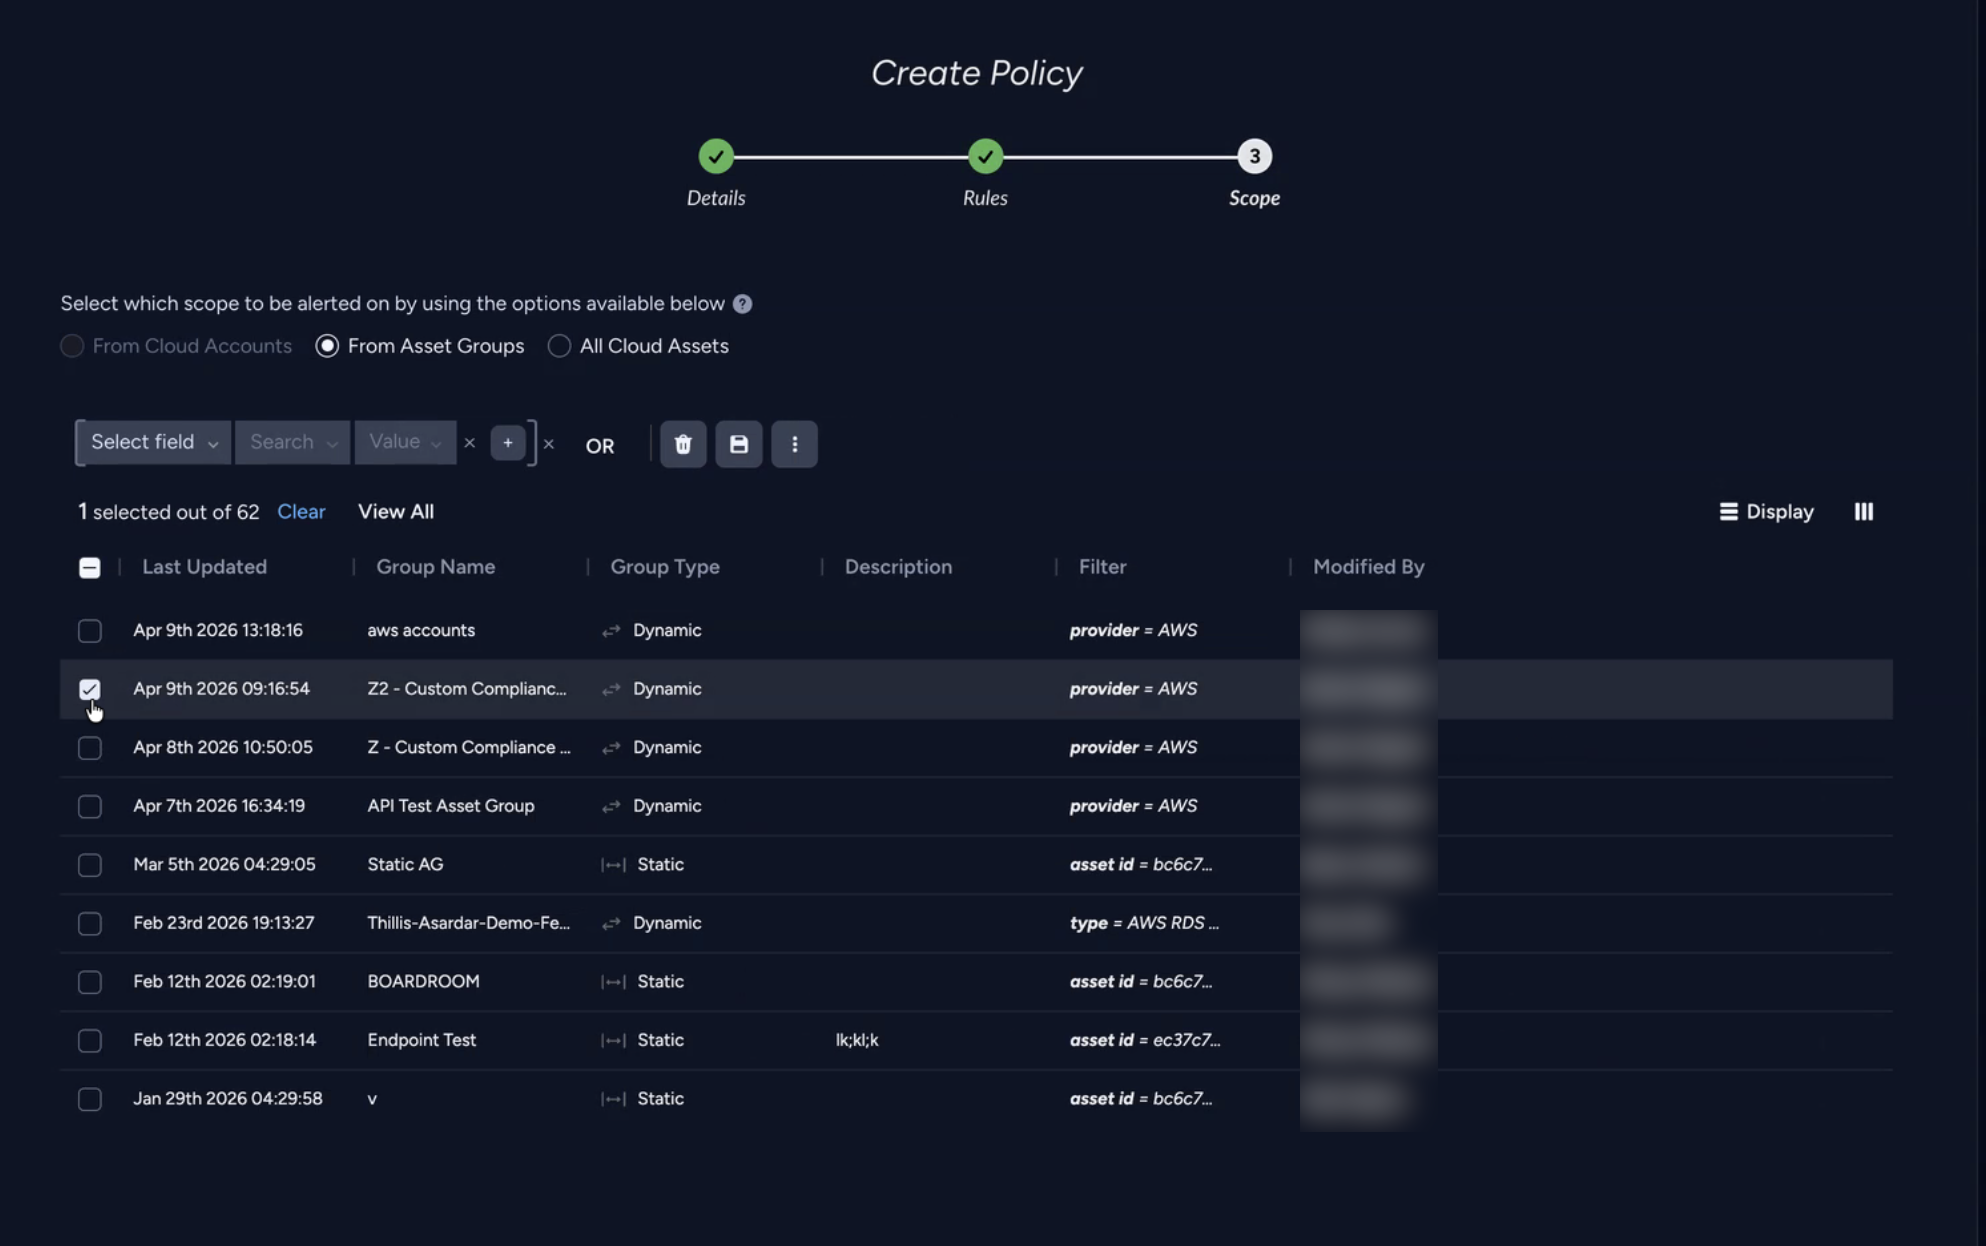
- Click Done to save the policy.
View and manage compliance assessments and reports
Create a compliance assessment report based on a Cortex compliance standard for immediate viewing or download, or schedule recurring reports to continue monitoring compliance over time.
What are compliance assessments and reports?
A compliance assessment provides you with a consolidated view of your organization's compliance with a selected standard. Compliance status is automatically updated in the Assessments results page for you to view.
NOTE
Compliance assessment results may take up to six hours to be generated.
When you configure your assessment profile, you can generate PDF or CSV reports and optionally receive them via email. You can also view a list of compliance reports and download them from the Reports page.
Compliance score
The compliance score represents the percentage of individual controls assessed against individual assets that adhere to the prescribed requirements. This score is calculated based on the ratio of controls in a passed status to the total number of controls assessed against a scope of assets.
By providing this high-level score based upon the granular controls performance, the platform enables you to quickly gauge your organization's overall compliance posture and identify which controls require immediate attention to mitigate security risks.
NOTE
The status of controls is determined by the evaluation of the associated rules. If an asset fails a check against any rule associated with a control, that control is considered failed for that asset.
Control statuses
The compliance scoring system evaluates assets against assessment rules and assigns one of three statuses:
- Passed: Asset meets compliance requirements
- Failed: Asset does not meet compliance requirements
- Not Assessed: Asset was not evaluated against this control
How compliance score is calculated
The formula for compliance score calculation is:
Compliance score = Passed Controls / (Passed Controls + Failed Controls) * 100%
The score is rounded up to the next whole digit and expressed as a percentage.
This formula is applied consistently across each of the four scoring levels: rule, control, category, and standard, and across all asset scopes.
Example compliance score calculation
Consider two assets A1 and A2, both assessed against two controls. While A1 passes both controls, A2 passes one control and fails one control.
The compliance score is calculated as follows:
3 passed controls / (3 passed controls + 1 failed control) * 100% = .75 * 100% = 75%
Review assessments
The Assessment page shows the latest compliance assessment profile results. It provides an up to date high level compliance view.
The display shows the following information:
| Display element | Description |
|---|---|
| Assessment by Score widget | <p>Shows how many assessment profiles were in each percentage of compliance range, color coded as follows: </p><ul><li>Red: 0-50%</li><li>Orange: 51-99%</li><li>Green: 100%</li></ul> |
| Assessment by Label widget | Shows how many of each label were assessed, for example, AWS or Azure. |
| Table showing assessment profiles grouped by compliance standard | <p>Displays assessment profiles grouped by standards, including:</p><ul><li>Standard name: The standard used in the assessment profile.</li><li>Asset Group: The asset group the assessment profile assessed.</li><li>Score: The score assigned to the asset group. It is calculated as the number of assets that passed divided by the sum of assets that passed plus failed (the total number of assets that were evaluated).</li><li>Control status: How many assets in an asset group passed the rule check (green), how many were not evaluated (grey), and how many failed (red).</li><li>Failed controls by severity: Of the assets that failed the rule check, what was the severity of the failure for each asset; critical (dark red), high (red), medium (orange), low (blue), and informational (grey).</li><li>Labels: The labels that were evaluated for the asset group in the assessment profile, for example, AWS or Azure.</li><li>Last evaluation time: The last time the rule was run.</li></ul> |
See specific assessment profile results in Cortex XSIAM
You can right-click a specific assessment profile and select View Profile Report, which opens the report generated by the assessment profile. The report contains two tabs, Controls and Assets. You can also access this page by hovering over the end of the row and selecting the view arrow.
Controls tab
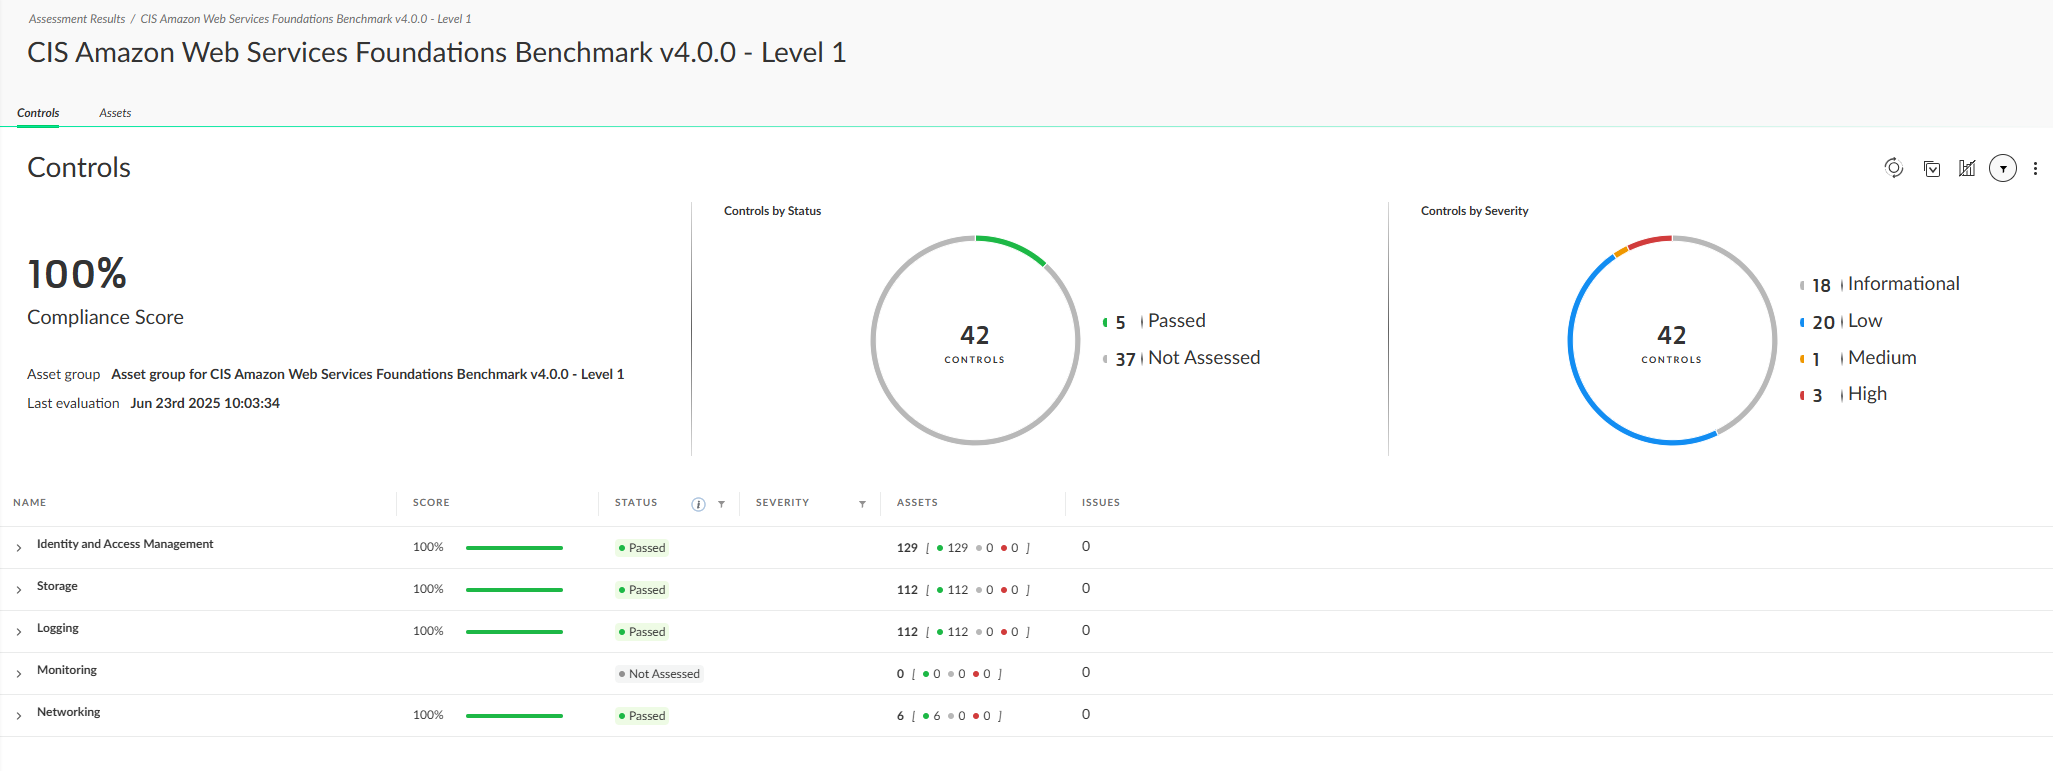
The Controls tab shows:
| Display element | Description |
|---|---|
| Compliance Score widget | Displays the overall compliance score for the assessment profile and when it was last checked. |
| Controls by Status widget | A pie chart indicating which controls passed, failed, or were not assessed for a specific asset group. If a control is not assessed, it will not cause the asset group to fail the rule check. The status is color-coded (green=passed, red=failed, grey=not assessed). |
| Controls by Severity widget | <p>A pie chart indicating severity level for controls for an asset group. Possible values:</p><ul><li>Critical</li><li>High</li><li>Medium</li><li>Low</li><li>Informational</li></ul> |
| Table showing controls and their rules grouped by category | <p>Displays rules grouped by controls and categories, including:</p><ul><li>Name: The control name.</li><li>Score: The rule score. For control, shows the average of the rule scores. For category, shows the average of the control scores.</li><li>Status: Whether the control/rule passed or failed. The definition of pass varies by rule. See Cortex documentation for details.</li><li>Severity: The control/rule severity rating (Critical, High, Medium, Low, Informational).</li><li>Assets: The asset status. Each number links to the Asset tab, filtered by control/rule with the status.</li><li>Issues: Links to the Issues table in a new tab, filtered for relevant issues.</li></ul> |
View control details
Clicking the row for a specific control in the Controls tab opens the Control Details side panel that shows information about the control in the Overview tab and the Rules tab.\
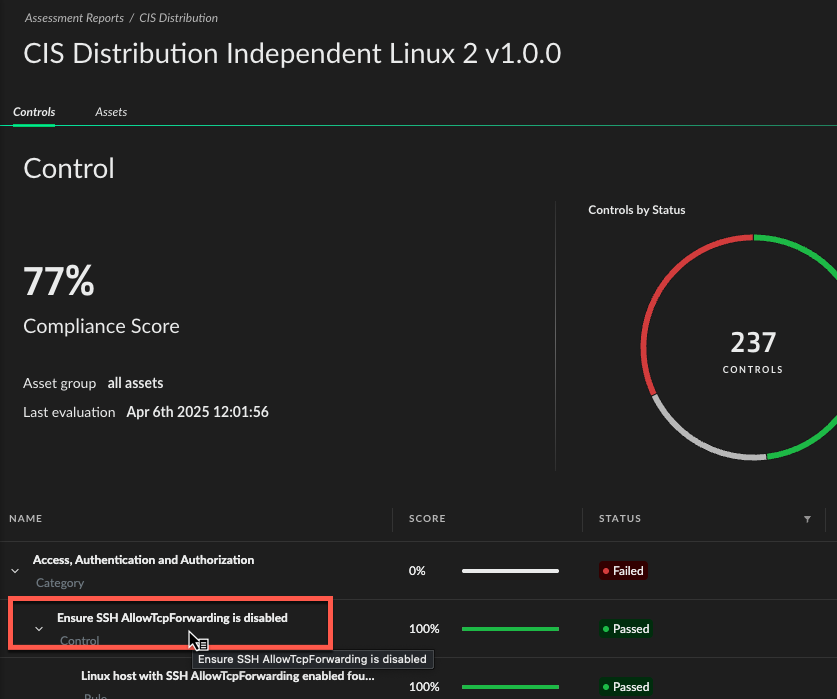
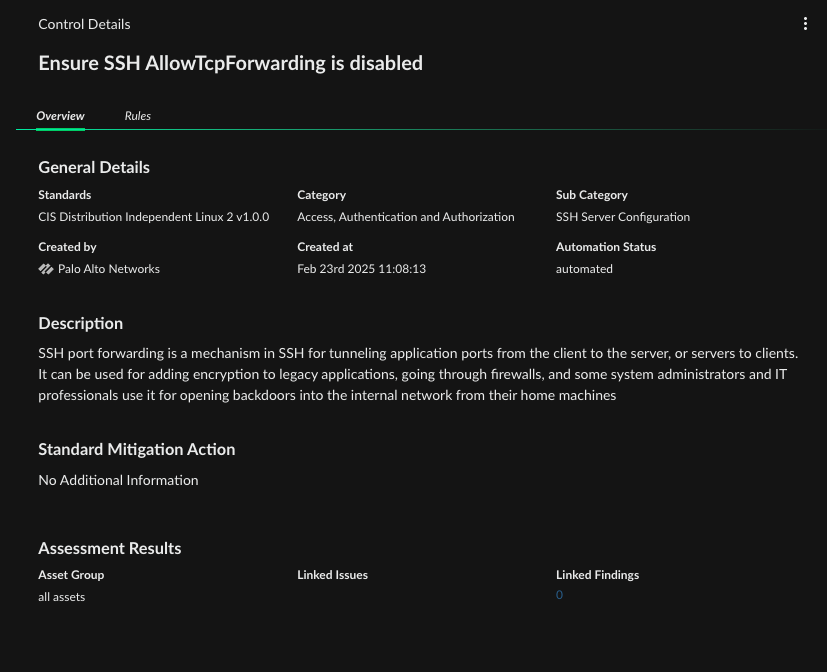
| Tab | Details |
|---|---|
| Overview | <p>The Overview tab shows the following control metadata.</p><ul><li>General Details: Includes the standards, category, sub category, created at, and automation status associated with the control.</li><li>Description: The control description.</li><li>Standard Mitigation Action: A predefined measure or step to address and reduce risk related to the control.</li><li>Assessment Results: Includes the asset group, linked issues, and linked findings.</li></ul> |
| Rules | <p>The Rules tab shows the following information about the rules in the control.</p><div data-gb-custom-block data-tag="hint" data-style="info" class="hint hint-info"><p>NOTE</p><p>If there are no rules associated with the control, the control will be assigned a severity of low.</p></div><ul><li>Rule name</li><li>Rule ID</li><li>Type</li><li>Severity: The overall severity of the control is determined by the rule with highest severity.</li></ul> |
View rule details
Clicking the row for a specific rule opens the Rule Details side panel.
This panel shows information about the rule, including:
- General Details: Rule name, rule ID, type, and severity, and scanned asset categories.
- Description: The rule description.
- Remediation steps: Actions from the standards provider or from custom controls to correct or resolve asset non-compliance identified during the assessment.
- Assessment Results: Includes the asset group, linked issues, and linked findings.
Assets tab
The Assets tab shows:
| Display element | Description |
|---|---|
| Compliance Score widget | Displays the overall compliance score for the asset group and when it was last checked. It represents the aggregated status per asset. Assets with one failure are considered failed. |
| Distinct Assets by Status widget | A pie chart indicating which assets in an asset group passed for all rules, failed one or more rules, or were not assessed. |
| Table listing all the assets in the asset group | <p>The distinct checks run for every asset covered by the assessment profile. Every row in the table represents a rule per asset for this standard.</p><ul><li>Asset name: The name of the asset.</li><li>Asset type: For example, storage bucket, endpoint, VM instance, human identity.</li><li>Status: Whether the asset passed or failed the rule.</li><li>Source: Whether the source is an issue and/or finding.</li><li>Rule: The rule that ran on the asset.</li><li>Control: The control that contains the rule.</li></ul> |
Clicking the row for a specific asset opens a side panel showing asset details organized under the following tabs:
- Overview
- SBOM
- Access
- Vulnerabilities
Right clicking on a row includes the following options:
- View in Asset Inventory: Opens the Inventory → Assets → All Assets page showing asset details.
- View Control Side Panel: Opens the Control Details side panel.
- View Rule Side Panel: Opens the Rule Details side panel.
View the compliance assessment of an individual asset
You can review the compliance performance of any asset to gain insight into how a specific asset aligns with assigned security standards and individual controls.
You can review the compliance performance of any asset to gain insight into how a specific asset aligns with assigned security standards and individual controls. This view allows you to:
- Focus on an individual asset’s compliance performance in the context of a specific standard, understand the standard and category placement of each individual control, and get immediate access to the findings or issues created in the case of violations.
- Identify the severity of the individual controls violations through their association with underlying rules. Access the underlying findings and issues for remediation guidance and the context necessary to perform the prescribed action.
- Identify the actions you need to take to improve the compliance score of an individual asset.
To view compliance assessment for an asset:
- Navigate to Inventory → Assets.
- Click on an asset to open asset details.
- Click on the Compliance tab.
The Compliance tab includes the following information:
| Section | Description | Functional tip |
|---|---|---|
| Overall Compliance Score | Displays asset’s compliance score and the number of standards and controls used for assessment. | Use this for a high-level quantification of asset compliance against assessed standards. |
| Controls by Status | Shows the distribution of controls across Passed, Failed, and Not Assessed. | Click a specific status to filter the Standards and Controls data. |
| Standards, Score, Controls Passed | Lists the standards by which the asset is assessed, including the score and passed control count for each. | Click a specific standard to filter the items in the Controls Overview table by that specific standard. |
| Controls Table | An exhaustive list of controls for which an asset may be assessed including columns for Standard, Category, Control, Severity, and Status. | Click a control to view the control details, or click a Failed status to view details of the related finding or issue. |
Review reports
The Reports page accessible from Posture Management → Compliance → Results → Reports shows a table listing compliance assessment report files.
The table displays report details, including:
- Standard name
- Assessment profile
- Asset group
- Score
- Controls status
- Failed controls by severity
- Evaluation time
The Evaluation time indicates when the compliance assessment was last performed, not when the report was generated. Because compliance assessments occur every six hours, the Evaluation Time typically precedes the actual report generation time.
Export compliance assessment reports
You can download a report by right clicking a report file in the table and selecting Export to PDF or Export to CSV. You can optionally delete reports.
You can also generate PDF or CSV reports and optionally receive them via email when you configure your assessment profile. For more information, see Use an assessment profile to run compliance checks on your assets.
The downloaded files contain the following information.
| Exported File Type | Information Included | File Retention after Report Generation |
|---|---|---|
| <p>An executive summary showing:</p><ul><li>Asset Group</li><li>Report generation date</li><li>Compliance standard used for the compliance assessment</li><li>Standard details</li><li>Overall compliance assessment status (passed or failed)</li><li>Number of assets the compliance assessment ran on</li><li>The number (and percentage) of assets that passed</li><li>The number (and percentage) of assets that failed</li></ul> | Up to six months. | |
| CSV | A report detailing assets, controls, and rules. | Up to three days. |
Example
The following is a sample compliance assessment report exported to PDF.
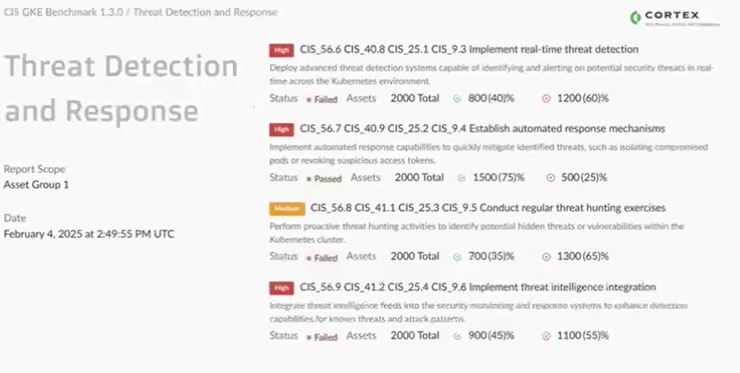
Compliance Overview Dashboard
The Compliance Overview Dashboard is an out-of-the-box dashboard that presents a centralized view of your organization's compliance performance against industry standards and your own internal security frameworks.
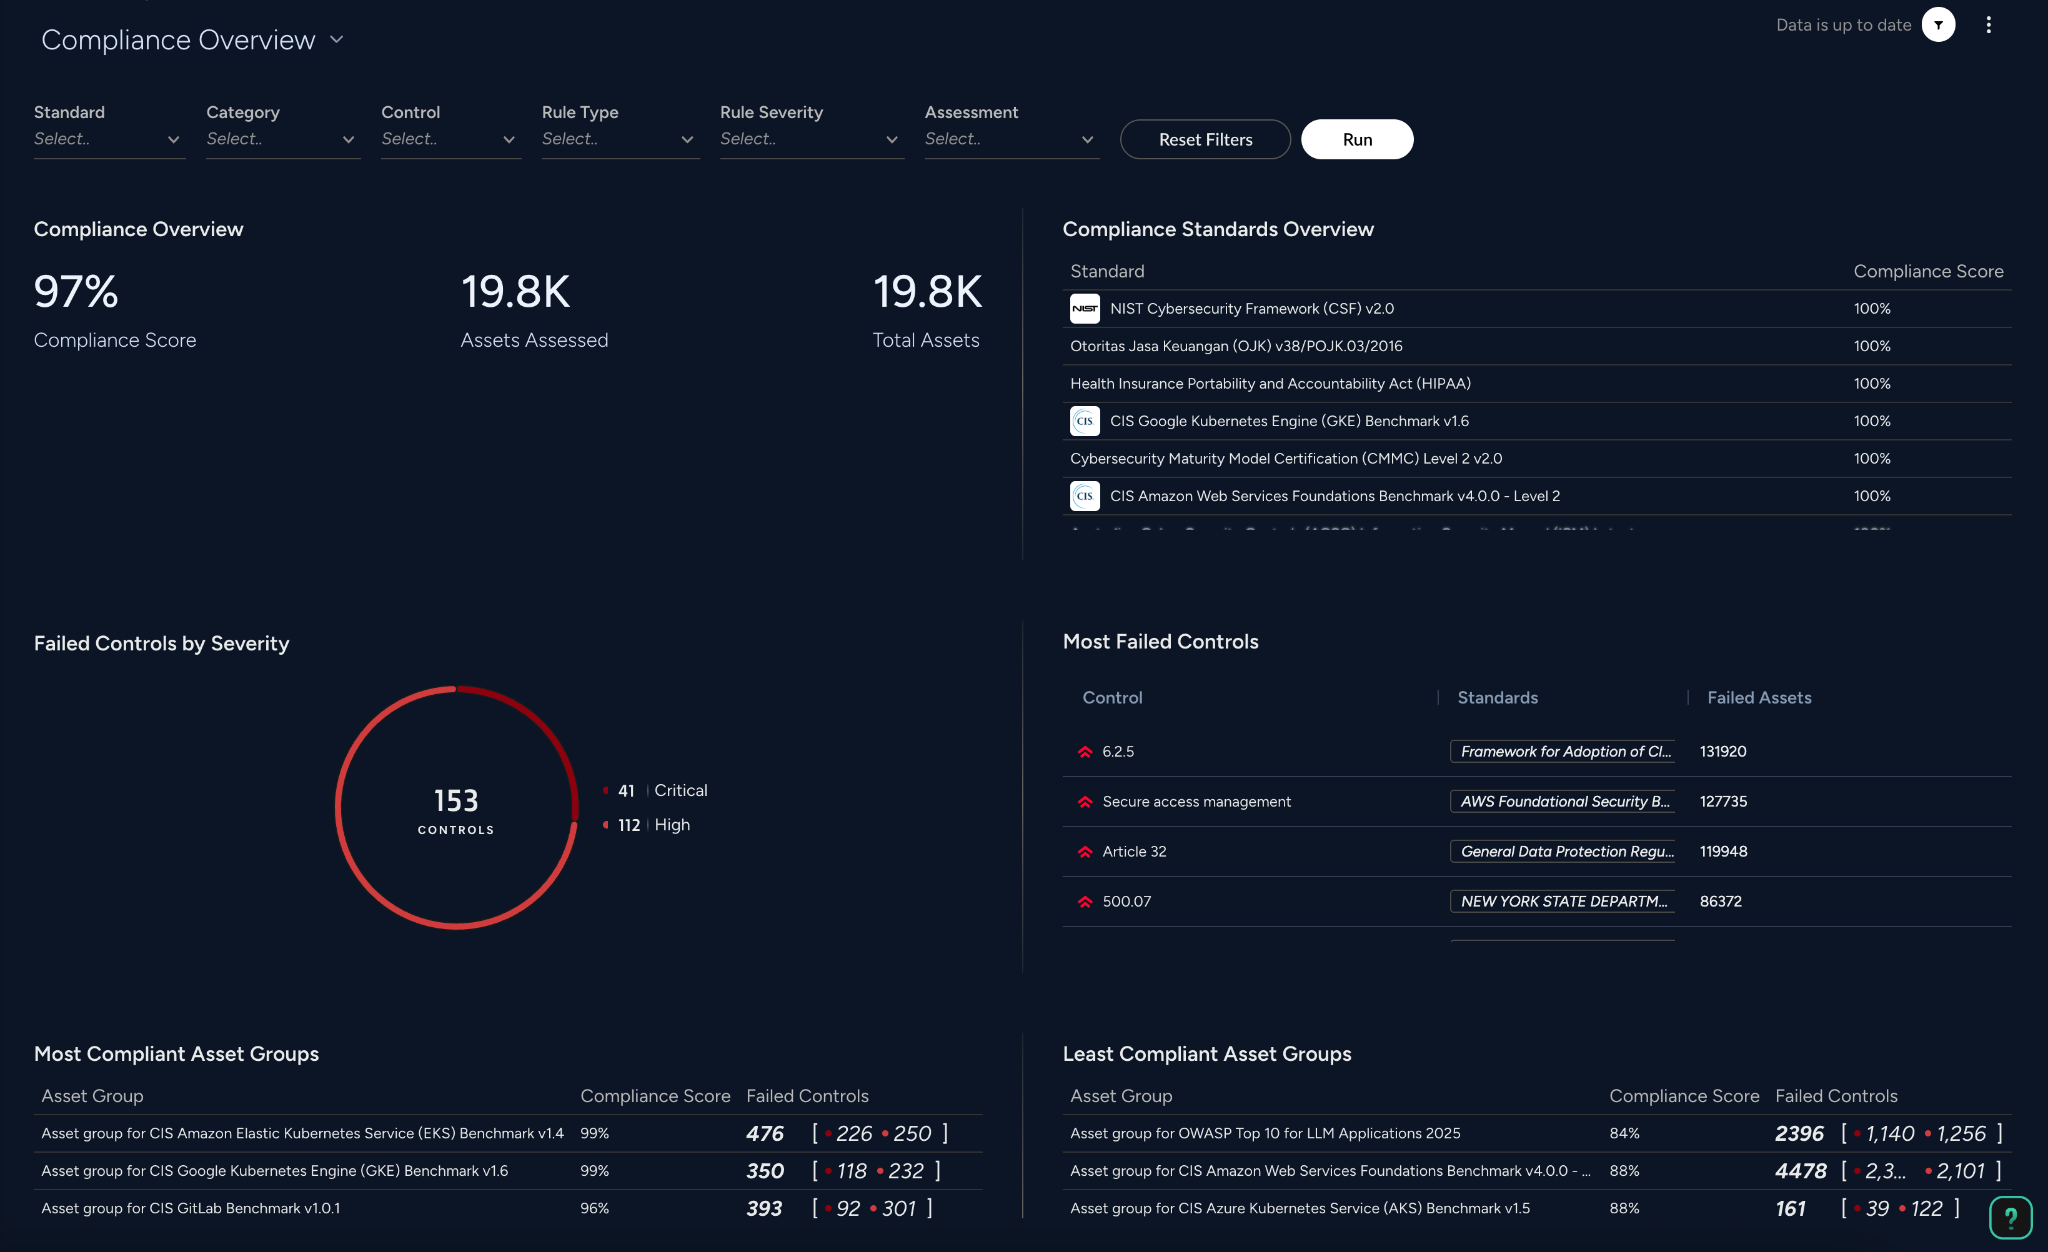
The Compliance Overview Dashboard provides an immediate and clear visual representation of the organization’s overall compliance posture. By integrating a comparative view, the dashboard allows you to evaluate performance across the monitored environment against assessed compliance standards.
How to access
- Navigate to Dashboards & Reports → Dashboard.
- From the dashboard header, a drop-down menu lists all available predefined and custom dashboards. Find the Compliance Overview dashboard on that list and click on it.
Dashboard filters
The global filters enable you to refine dashboard data for more granular analysis. You can filter the view using six filters:
- Standard: Select specific frameworks such as CIS, NIST, or PCI DSS.
- Category: Narrow results by high-level groupings within a chosen standard.
- Control: Drill down into specific compliance controls.
- Assessment: Isolate results from one or more specific compliance assessment runs.
Click Run to apply the selected filters.
Click Reset Filters to clear all filters.
Refreshing the dashboard
The Last updated date on top of the page provides the time stamp for when the dashboard was last updated. The widgets and filters are refreshed every 10 minutes. You can refresh the content of each widget manually by clicking on Refresh.
NOTE
If you just created an assessment profile, it may take up to 10 minutes for it to appear in the Assessment filter. As a workaround, you can refresh the URL in the browser.
Dashboard widgets
The dashboard includes the following information:
| Dashboard widget | Description |
|---|---|
| Compliance Overview | <p>These high-level compliance metrics provide an executive summary of the environment’s health:</p><ul><li>Compliance Score: An aggregated percentage representing overall adherence across all active standards and assets. For more information, see Compliance score.</li><li>Assets Assessed: The total number of unique cloud resources currently being evaluated against compliance rules.</li><li>Total Assets: The complete inventory of discovered assets, including those not currently included in a compliance assessment profile.</li></ul> |
| Compliance Standards Overview | Displays compliance progress (“Compliance Score”) against specific standards. This widget displays up to 200 standards sorted by compliance score in descending order. |
| Failed Controls by Severity | <p>Displays a chart and legend categorizing all compliance failures to assist in prioritization:</p><ul><li>Critical: Immediate risks that require urgent remediation.</li><li>High: Significant security gaps.</li><li>Medium: Moderate deviations from best practices.</li><li>Low: Minor deviations from best practices.</li><li>Informational: Observations that do not necessarily impact the score but provide environmental context.</li></ul><p>You can toggle between two views.</p> |
| Most Failed Controls | Identifies 10 specific security controls causing the highest volume of failures. For each control, it shows which standards it belongs to and provides the raw count of resources failing that specific check. |
| Most Compliant Asset Groups | Lists 10 asset groups with the highest compliance scores, sorted in descending order. Shows compliance score of asset groups, in descending order. This section highlights high-performing segments of the environment. This allows administrators to validate that security policies are effectively applied in production environments. |
| Least Compliant Asset Groups | Lists 10 asset groups with the lowest compliance scores, sorted by compliance score in ascending order. |
Cloud security rules and policies
Requires a Cloud Posture Security, Cloud Runtime Security or Cortex XSIAM Premium license.
Cloud security rules and policies are part of the Cortex Cloud posture management framework. Your cloud security administrators and application security practitioners can use cloud security rules and policies to define and manage security guardrails consistently across AWS, Azure, GCP, and other cloud providers. They can use them to define detections for specific environments when specific conditions occur so that findings and issues related to threats or misconfigurations are generated and can be addressed.
This topic includes the following information:
Cloud security rules
Cloud security rules are a set of conditions that apply to a specific cloud, code, or host resource. They define security detection logic or XQL queries used to identify threats or misconfigurations. Cloud security rules are designed to examine specific attributes within asset configurations to determine if those configurations could lead to threats. The rules are checked against all matching assets in your environment and findings are generated if resources matching the rule criteria are found.
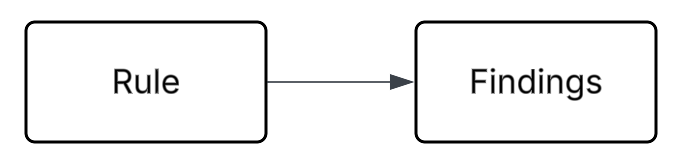
Cloud includes out-of-the-box cloud security rules and allows you to create custom cloud security rules:
| Rule type | Description |
|---|---|
| Out-of-the-box (OOTB) | <p>The out-of-the-box rules (or “Default” rules) are rule-based and heuristic-based (using AI and machine learning).</p><p>The out-of-the-box cloud security rules are based on security research, CIS benchmarks, customer requests, and Palo Alto Network’s internal threat research.</p> |
| Custom | You can create custom cloud security rules and use them in rule-based cloud security policies. See LINK. |
Findings
Findings are proactively gathered from your cloud environment to provide security context and are often non-actionable on their own. For example: “Workload X is attached to a role that grants access to databases”.
For more information about findings, see Issues, findings, and events and Review findings.
Note
Findings are only generated for OOTB rules.
Cloud security policies
Cloud security policies allow you to define the scope of assets for which to create issues when a rule matches.
While cloud security rules provide the detection logic (defining what to detect), cloud security policies provide the context (defining where to apply the rule) and enforcement (what to do when the rule is triggered).
A cloud security policy consists of:
- Rules: Select from a list of security detection rules or create a new rule.
- Scope: Filter which assets the rule applies to.
On their own, cloud security rules create findings across all assets. But when a rule is associated with a policy, for the assets within the scope of that particular rule, the findings are promoted to issues.
While cloud security rules establish the criteria for evaluation but do not initiate any actions unless incorporated within a policy, cloud security policies serve as enforcement mechanisms that govern the responses to the identified findings.
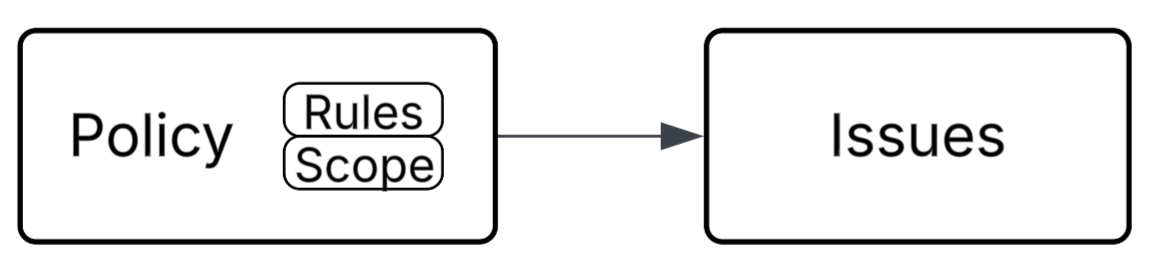
The Cloud Posture Security Policies page allows you to manage policies that define security and compliance actions for cloud posture. You can create, edit, filter, and manage policies through a structured table and widget panel.
Note
If you have the following Scope Based Access Control (SBAC) settings in place, User Settings → Cases and Issues Scope → Select domains → Posture, you may encounter a Case mismatch in Issues/Cases/Findings counts. This is because the Case count on the Rules page captures Cases belonging to the Posture domain. Whereas Platform pages, capture Issues within Cases belonging to the Posture domain.
Default Cloud Posture Security Policy
The Default Cloud Posture Security Policy is an out-of-the-box (OOTB) policy that evaluates your environment against out-of-the-box detection rules. These default rules are rule-based and heuristic-based (using AI and machine learning), drawing on security research, CIS benchmarks, customer requests, and Palo Alto Networks' internal threat research.
The Default Cloud Posture Security Policy is enabled by default, but can be disabled and enabled as needed.
Custom cloud security policies
If instead of using the default cloud security policy you prefer to define your own, you can define custom cloud security policies.
Issues
Issues are artifacts of the policy and represent actionable items that you need to address. A key distinction between findings and issues is that findings are not actionable, while you can take action on issues.
For more information about issues, see Issues, findings, and events and Investigate issues.
Create and manage cloud security rules
You can create your own custom rules to use them in custom cloud security policies for the following use cases:
| Rule type | Description |
|---|---|
| Graph | Graph rules leverage graph queries to monitor your environment for complex attack paths and potential breach paths. |
| Configuration (Config) | Configuration rules monitor your resource configurations for potential policy violations. |
| Data | Data rules protect against malware and enable data classification. |
| Identity | Identity rules monitor the identities in your cloud environment for excess or unused permissions. |
| Network Exposure | Network exposure rules detect assets exposed to the internet. |
| AI | AI rules monitor your AI ecosystem for risks and misconfigurations. |
| Attack Path (Legacy) | Attack path rules monitor the high risk attack paths for possible breaches. |
You can view and manage cloud posture security rules from the Posture Management → Rules & Policies → Rules → Cloud Security page.
Create a graph rule
Prerequisite: Creating a graph rule requires View or View/Edit RBAC permissions for Graph Search under Investigation & Response → Search.
The Graph Engine is a Cortex detection method that identifies threats by analyzing relationships between entities rather than evaluating individual events in isolation.\
The engine periodically queries a contextual security graph that represents your environment as:
- Nodes, such as identities, configurations, code repositories, data stores, and cloud resources.
- Edges and paths, which represent the relationships and access routes between those entities.\
Graph detection rules evaluate these relationships to identify risky combinations and potential attack paths. When a rule matches, the Graph Engine creates a live, evidence-backed issue in the Cortex issues experience.
Cortex includes predefined system Attack Path Graph rules. You can also create custom rules tailored to your organization’s environment and security requirements.
Key characteristics
- Detection type: Graph-based detection that evaluates relationships and paths between entities.
- Cyclic evaluation: Graph rules run periodically rather than evaluating each event as it arrives. By default, the engine runs every 6 hours.
- Path-based issue: Each issue is uniquely identified by the rule ID and the graph path that triggered it. This allows the engine to track matching paths across evaluation cycles and automatically close issues generated by outdated rule versions.
- Rule output: The Graph Engine creates issues that appear in the Cortex issues experience.
How to create a graph rule
To create a graph detection rule, navigate to Posture Management → Rules & Policies → Rules → Cloud Security.
- Select Create Rule → Graph.
- In the New Graph Rule page, under General, add the following details
- Main Settings:
- Name: A unique name for the rule.
- Description: A description of the rule.
- Labels (optional): Add labels to the rule.
- Severity: Select a severity level for the issue that will be triggered.
- Remediation (optional): Define Remediation instructions.
- Compliance Controls (optional): Select a control from the controls catalog.
- In the Condition page, select the relevant options to build your query. The core logic for an attack path rule is built by selecting a primary asset and attaching Finding or Vulnerability conditions to it. For more information about how to build your graph query, see Create Graph Search query. Use Generate Preview to see the results of your query.
- In the Summary page, review the rule and click Save.
After the rule is synchronized and enabled, the Graph Engine evaluates it during the next scheduled cycle. An issue is created for each graph path that matches the rule conditions.
Create a configuration rule
Configuration (config) rules monitor your resource configurations for potential policy violations or misconfigurations. Perform this task to create a custom configuration rule that you can use in a cloud security policy.
- Navigate to Posture Management → Rules & Policies → Rules → Cloud Security.
- Select Create Rule > Config.
- Complete the Overview step:
- Enter a Rule Name and Description.
- Select a Severity. This will be the severity of any issues created with this rule.
- (Optional) Add Labels. These rules can be used to find rules when creating custom policies.
- (Optional) Enable Remediation using the toggle. In a later step, you'll enter the remediation instructions.
- (Optional) Associate this rule with a Compliance Control. Click Add, select one or more custom compliance controls from the list, and then click Assign.Custom configuration rules can only be associated with custom compliance controls.
- Click Next.
- In the Rule Logic step, use the query builder to define the detection criteria. Select one of the following modes:
- Simple Mode: Presents a guided interface in which you can define basic conditions and address most common rule use cases.
- Advanced Mode: Presents a free-form XQL editor that allows you to build complex and flexible queries across unrestricted datasets. Supports advanced and custom use cases.
- If you selected Simple Mode, complete the following steps:
- Select options from the dropdown menus to define the logic for your config rule, such as “Find EC2 instances where accessKeys are allowed”, and then click Search to view all matching results.
- Click Next to define Remediation instructions (if you had turned on Enable Remediation in the Overview step) or click Done.
- If you selected Advanced Mode, complete the following steps:
- Define an XQL query for the rule, following the guidelines in Guidelines for creating cloud security rules. For detailed XQL query instructions, see XQL Language Structure.
- Click Test to determine if the query is valid.
- Select the Affected Asset Type. Generated issues will be linked to assets identified by the selected field.
- Check the list of query results to verify that the query is working as intended.
- Click Next to define Remediation instructions (if you had turned on Enable Remediation in the Overview step) or click Done.
- (Optional) In the text field, define remediation actions or provide other information that will be included on issues created by this rule.
- Click Done to save your config rule.
Guidelines for creating cloud security rules
Follow these guidelines when creating an XQL query in a cloud security configuration rule. These are the requirements for creating a valid XQL query.XQL queries are supported for cloud security configuration rules only. XQL queries are not yet supported for other types of cloud security rules.
- Use the
asset_inventorydataset in config rules. No other datasets are supported. - Construct query conditions using the configuration JSON located in xdm.asset.raw_fields. Example:
json_extract_scalar(xdm.asset.raw_fields, "$.Platform Discovery.metadataOptions.httpEndpoint") - The evaluated asset type must be explicitly specified in the filters stage. Example:
dataset = asset_inventory | filter xdm.asset.provider = "aws" andxdm.asset.type.id= "LAMBDA_FUNCTION"| alter authType = json_extract_scalar(xdm.asset.raw_fields, "$.Platform Discovery.AuthType") | fields xdm.asset.id as asset_id, xdm.asset.type.class as class_name, xdm.asset.type.id as asset_type_id - The query output must contain the
asset_id(representing the asset) andasset_type_id. (representing the asset type).dataset = asset_inventory | filter xdm.asset.provider = "aws" and xdm.asset.type.id = "LAMBDA_FUNCTION"| alter authType = json_extract_scalar(xdm.asset.raw_fields, "$.Platform Discovery.AuthType") | fields xdm.asset.id asasset_id, xdm.asset.type.class as class_name, xdm.asset.type.id asasset_type_id - The query results must contain a maximum of 10 fields, including
asset_idandasset_type_id. - The fields stage of the query must be positioned as the final step in the query pipeline.
dataset = asset_inventory | filter xdm.asset.provider = "aws" and xdm.asset.type.id = "LAMBDA_FUNCTION"| alter authType = json_extract_scalar(xdm.asset.raw_fields, "$.Platform Discovery.AuthType") |fields xdm.asset.id as asset_id, xdm.asset.type.class as class_name, xdm.asset.type.id as asset_type_id
Example: XQL queries for cloud security rules
Example XQL query for AWS EC2 in which IMDSv2 is not configured:
dataset = asset_inventory | filter xdm.asset.provider = "aws" and xdm.asset.type.id = "EC2_INSTANCE" | alter state = json_extract_scalar(xdm.asset.raw_fields, "$.Platform Discovery.state.name") | alter httpEndpoint = json_extract_scalar(xdm.asset.raw_fields, "$.Platform Discovery.metadataOptions.httpEndpoint") | alter httpTokens = json_extract_scalar(xdm.asset.raw_fields, "$.Platform Discovery.metadataOptions.httpTokens") | filter state contains "running" and httpEndpoint = "enabled" and httpTokens not contains "required" | fields xdm.asset.id as asset_id, xdm.asset.type.id as asset_type_id
Cloud security rule status for custom configuration rules
Out-of-the-box and custom cloud security configuration rules are enabled by default, and can be manually disabled and reenabled as needed. Additionally, the system may change the status of custom configuration rules based on resource consumption.The statuses of cloud security configuration rules are described in the table below.
| Status | Description |
|---|---|
| Enabled | Indicates that the rule is working normally. |
| Moderated | Indicates that the rule is consuming higher than expected resources, so the system is executing the rule less frequently.You will receive an in-product notification if the status of a rule is changed to Moderated. |
| Suspended | Indicates that the rule has been suspended for exceeding the maximum allowed resource consumption.You will receive an in-product notification if the status of a rule is changed to Suspended.To reenable a suspended rule, you must update the query in the rule. After saving the updated rule, the status will automatically change to Enabled. If the updated rule continues to use excessive resources, the system will move it back into the Moderated or Suspended status. |
| Disabled | Indicates that the rule has been manually disabled. |
Create a data rule
Data rules protect your environment against malware and enable data classification. To create a data rule:
- Navigate to Posture Management → Rules & Policies → Rules → Cloud Security.
- Select Create Rule → Data.
- In the Overview step, provide the following:
- Enter a Rule Name and Description.
- Select a Severity. Findings generated by this rule will inherit this severity.
- (Optional) Add Labels.
- (Optional) Enable Remediation using the toggle. In a later step, you'll enter the remediation instructions.
- Click Next.
- On the Rule Logic page, you can select options to build your data rule.
- Click Select and choose from the list of supported data assets categories such as database, disk, bucket.
- Click WHERE to choose from the attributes of the asset. Depending on the asset category you selected in the above step the list of attributes displayed will vary. For example, you can select FIND Bucket WHERE Type and Select values = S3 bucket.
- Click + to select the Findings such as Configuration Finding, Data Finding, Identity Finding, and so on.
- Click WHERE to choose from the attributes of the finding. Depending on the finding you selected in the above step the list of attributes displayed will vary.
- Once the logic is defined, click Search to test the rule against your current environment and view potential findings.
- Click Next to define Remediation instructions (if you had turned on Enable Remediation in the Overview step) or click Done to save your rule.
Create an identity rule
Identity rules detect security gaps such as over-permissive access or unused permissions by calculating net effective permissions across AWS, Azure, and GCP.
Perform these steps to create a custom identity rule:
- Navigate to Posture Management → Rules & Policies → Rules → Cloud Security .
- Select Create Rule → Identity.
- In the Overview step, provide the following:
- Enter a Rule Name and Description.
- Select a Severity. Findings generated by this rule will inherit this severity.
- (Optional) Add Labels.
- (Optional) Enable Remediation using the toggle. In a later step, you'll enter the remediation instructions.
- (Optional) Associate this rule with a Compliance Control. Click Add, select one or more custom compliance controls from the list, and then click Assign. Custom configuration rules can only be associated with custom compliance controls.
- Click Next.
- On the Rule Logic page, you can select options to build your rule. See more information below.
- Once your logic is defined, click Search to view real-time results from your environment
- Click Next to define Remediation instructions (if you had turned on Enable Remediation in the Overview step) or click Done.
- (Optional) In the text field, define remediation actions or provide other information that will be included on issues created by this rule.
- Click Done to save your rule.
Define identity rule logic
When building identity rule logic, you define the criteria based on the five pillars of a permission. You choose an asset and apply filters to its attributes and its relationships to other assets. The five pillars are:
- Permission Source: The human or non-human identity (such as a VM or function) that performs the action.
- Permission Destination: The specific cloud resource or wildcard pattern being acted upon.
- Policy: The IAM document, role, or resource-based policy that grants the rights.
- Granter: The entity connecting the source to the policy, such as an IAM group or the source itself in the case of inline policies.
- Permission: The actual action granted, including attributes like the last used time and access level (e.g., Administrative, Write, or Config).
To construct rule logic:
-
Select the primary asset (pillar): You begin by choosing one of the pillars to be the focus of the rule. The system will generate issues only for the first entity type you select (the Source, Granter, or Destination).
For example, if you want to flag risky users, start by selecting the Source entity.
-
Apply attribute filters: Once an asset is selected, you add logical conditions based on its attributes.
For example, you can filter for a Source where Cloud Type = AWS and Identity Type = IAM User.
-
Define relationships: You then connect this asset to other pillars to describe the risky permission path.
For example, You can define a relationship where the Source (User) has permission to access a specific Destination (e.g., Production DB) via a specific Permission (e.g., Delete).
-
Validate with search: After constructing the logic, click Search within the rule builder. This runs the query against your current environment to show real-time results, allowing you to verify that the logic correctly identifies the intended assets before you save the rule.
Example rule logic structure:
A common custom rule might look for an AWS IAM User (Source) who has Administrative access (Permission) but has MFA Disabled (Source Attribute). The logic would be constructed by:
1. Selecting Source (IAM User).
2. Filtering for MFA Enabled = False.
3. Connecting to Permission where Access Level = Administrative.
Create a network exposure rule
Network exposure rules detect your assets that are exposed to the Internet.
To create a network exposure rule:
- Navigate to Posture Management → Rules & Policies → Rules → Cloud Security.
- Select Create Rule → Network Exposure.
- In the Overview step, provide the following:
- Enter a Rule Name and Description.
- Select a Severity. Findings generated by this rule will inherit this severity.
- (Optional) Add Labels.
- In the Rule Logic step:
- In the Select Network Exposure Rule Type step, select Inbound, Outbound, or East-West.
- The rule creation process and the attributes that are available differ depending on the asset type. Use the tooltips next to parameter names to get more information about each option and see more information below.
- Click on Advanced Settings to access more options.
- Click Done to save your rule.
Define network exposure rule logic
When creating network exposure rules, you define the flow of traffic you want to monitor.
On the Rule Logic page, provide the following based on the type of network exposure rules that you would like to create:
Inbound
Provide the following information:
| Parameter | Description |
|---|---|
| Source Network | Define the origin of the traffic. The default is typically Untrusted Internet (all public IPs), but you can specify a specific IP or CIDR range if you are looking for exposure to a specific network. |
| Destination Asset Type | Select the specific resource type you would like to check for exposure. Supported types include VM Instance, Kubernetes, Managed DB, and Serverless Function. |
| Cloud Service Provider | Choose the provider (AWS, Azure, or GCP). |
| Advanced Settings | |
| Protocol/Port | Specify the protocols and ports that will generate findings if exposed (e.g., tcp/80, tcp/443, tcp/22). |
| Host State | For VM instances, you can configure the rule to alert on Active (running) workloads or Stopped workloads (which would be exposed upon restart). |
| Ingress Route (Kubernetes only) | If you selected Kubernetes as the asset type, you can specify a particular ingress route path (e.g., /home) to check for exposure. |
| Use External Probe Validation | Set this to Yes to actively scan the asset from the outside to confirm it is truly reachable before generating a finding. This reduces false positives caused by hidden security controls (such as external firewalls not visible in the cloud config), |
| HTTP Response Code | If External Probe Validation is enabled, you can further filter findings based on the HTTP response code returned by the asset (e.g., 200 OK, 403 Forbidden). |
Outbound
Provide the following information:
| Parameter | Description |
|---|---|
| Source Asset Type | Select asset type to be evaluated by the rule. |
| Destination Network | Allow the selection of the destination network that will be evaluated in this rule. |
| Cloud Service Provider | Choose the provider (AWS, Azure, or GCP). |
| Advanced Settings | |
| Protocol/Port | Specify the protocols and ports that will generate findings if exposed (e.g., tcp/80, tcp/443, tcp/22). |
| Host State | For VM instances, you can configure the rule to alert on Active (running) workloads or Stopped workloads (which would be exposed upon restart). |
East-West
Provide the following information:
| Parameter | Description |
|---|---|
| Asset Type | Select asset type to be evaluated by the rule. |
| Cloud Service Provider | Choose the provider (AWS, Azure, or GCP). |
| Cloud Account | Select the cloud account where the rule will be executed. |
| Advanced Settings | |
| Protocol/Port | Specify the protocols and ports that will generate findings if exposed (e.g., tcp/80, tcp/443, tcp/22). |
| Host State | For VM instances, you can configure the rule to alert on Active (running) workloads or Stopped workloads (which would be exposed upon restart). |
Create an AI rule
AI rules identify misconfigurations and security flaws across your organization's AI ecosystem. These rules detect risks associated with AI infrastructure, supply chains, and data models for services such as AWS Bedrock, Amazon SageMaker, Azure OpenAI, and GCP Vertex AI.
Perform these steps to create a custom AI rule:
- Navigate to Posture Management → Rules & Policies → Rules → Cloud Security.
- Click on Create Rule → AI.
- In the Overview step, provide the following:
- Enter a Rule Name and Description.
- Select a Severity. Findings generated by this rule will inherit this severity.
- (Optional) Add Labels.
- (Optional) Enable Remediation using the toggle. In a later step, you'll enter the remediation instructions.
- (Optional) Associate this rule with a Compliance Control. Click Add, select one or more custom compliance controls from the list, and then click Assign. Custom configuration rules can only be associated with custom compliance controls.
- Click Next.
- In the Rule Logic step, use the query builder to define the detection criteria.
- Use the "Select" dropdown to choose AI services, such as Dataset, AI Model, Model Endpoint.
- Click WHERE to choose from the attributes of an asset. The list of attributes displayed varies, depending on the asset category you selected.
- Set conditions, building logical statements that use attributes specific to AI assets. For example, you can create a rule that flags AI models trained on sensitive data buckets or AI models that have public exposures.
- Click Search to see real-time results from your environment.
- Click Next to define Remediation instructions (if you had turned on Enable Remediation in the Overview step) or click Done.
- (Optional) In the text field, define remediation actions or provide other information that will be included on issues created by this rule.
- Click Done to save your rule.
Create an attack path (legacy) rule
Attack path rules identify critical risks arising from combinations of individual risk signals—such as overly permissive identities, network exposures, and exploitable vulnerabilities—that together form a potential breach path to high-value assets.
Legacy attack path rules are based on discovering combinations and findings. We recommend using Graph rules for analyzing relationships between entities to identify risky combinations and attack paths.
Perform these steps to create a custom attack path rule:
- Navigate to Posture Management → Rules & Policies → Rules → Cloud Security.
- Select Create Rule → Attack Path (Legacy).
- In the Overview step, provide the following:
- Enter a Rule Name and Description.
- Select a Severity. Findings generated by this rule will inherit this severity.
- (Optional) Add Labels.
- (Optional) Enable Remediation using the toggle. In a later step, you'll enter the remediation instructions.
- Click Next.
- On the Rule Logic page, you can select options to build your rule. The core logic for an attack path rule is built by selecting a primary asset and attaching Finding or Vulnerability conditions to it. See more information below.
- Click Next to define Remediation instructions (if you had turned on Enable Remediation in the Overview step) or click Done.
- (Optional) In the text field, define remediation actions or provide other information that will be included on issues created by this rule.
- Click Done to save your rule.
Define attack path rule logic
On the Rule Logic page, you can select options to build your rule. The core logic for an attack path rule is built by selecting a primary asset and attaching Finding(s) and Vulnerability conditions to it. The system logic checks for the intersection of any these findings AND the vulnerability on the asset; It is not required that all the selected findings are available on the asset.
- Select the asset: In the "Find" field of the query editor, select the asset category (e.g., Compute) and the specific asset type (e.g., EC2 Instance).
- Add risk conditions: Use the + (plus) icon in the editor to add conditions. You can select one of the following:
- Finding: To correlate with existing misconfigurations or security findings.
- Vulnerability: To correlate with CVEs detected on the asset.
- Define finding logic: If selecting Finding, you must provide the Finding Name. This name corresponds to the detection rule that generates the specific security signal (e.g., "AWS Security Group allows internet traffic").
- Define vulnerability logic (if applicable). You can filter vulnerabilities by CVE ID (e.g., searching for a specific Log4j CVE), Vulnerability Severity (e.g., Vulnerability Severity > Medium) or by CVSS Score (e.g., Score >= 9.0).
- Once the logic is defined, click Search to test the rule against your current environment and view potential findings.
Example Logic Structure
A common attack path logic might look like this in the builder:
FIND EC2 Instance WHERE Finding = "Public Internet Exposure" AND Finding = "Overly Permissive IAM Role" AND Vulnerability = "Critical Severity"
View cloud security rule status
To view the status of a cloud security rule, do the following:
- Navigate to Posture Management → Rules & Policies → Rules → Cloud Security.
- Rule status is displayed in the status column.
- Filter and sort on this field as needed.
Edit a cloud security rule
You can edit custom cloud security rules and modify their parameters as needed.
In some cases, you can also edit and modify parameters of out-of-the-box rules:
- You can add labels to out-of-the-box attack path, config, and network exposure rules.
- You can associate AI, config, and identity rules with custom compliance controls.
To edit a rule:
- Navigate to Posture Management → Rules & Policies → Rules → Cloud Security.
- From the Rules page, there are two ways to access the option:
- Right-click the entry and then select Edit.
- Click on the rule. Next, on the Details page, click the more options icon (⋮) and then select Edit.
- Make the necessary changes.
- Click Done to save your changes.
Note that the following may happen as a result of editing a rule:
- When rule logic is modified, if the assets which were violating the rule earlier are not violating it anymore, the corresponding issues are closed.
- When certain rule attributes such as severity or labels are modified, if these attributes matched earlier but do not match after the edit, the rule may be excluded from the policy and the corresponding issues closed.
Enable or disable a rule
If you would like to temporarily suspend a rule, you can disable it. To enable or disable a cloud security rule:
- Navigate to Posture Management → Rules & Policies → Rules → Cloud Security.
- From the Rules page, there are two ways to access the option:
- Right-click the entry and then select Enable or Disable.
- Click on the rule. Next, on the Details page, click the more options icon (⋮) and then select Enable or Disable.
Use an existing rule to create a new one
To create a new cloud security rule using an existing rule:
- Navigate to Posture Management → Rules & Policies → Rules → Cloud Security.
- From the Rules page, there are two ways to access the option:
- Right-click the entry and then select Save as New.
- Click on the rule. Next, on the Details page, click the more options icon (⋮) and then select Save as New.
- Modify the Rule Name, Description, and Labels fields as necessary.
- Select the rule logic as needed.
- Click Done to save the new custom policy.
Delete a custom cloud security rule
You can delete custom cloud security rules. For example, you may consider deleting a previously defined cloud security rule if it is generating too many false-positive issues.
To delete a custom cloud security rule:
- Navigate to Posture Management → Rules & Policies → Rules → Cloud Security.
- From the Rules page, there are two ways to access the option:
- Right-click the entry and then select Delete.
- Click on the policy. Next, on the Details page, click the more options icon (⋮) and then select Delete.
Create and manage cloud security policies
You can create custom policies with rules that are tailored to meet your organization’s specific needs for compliance or monitoring of cloud resources.
Note
- When creating policies, note that rules with the Informational severity level are excluded.
- Policies can't be based on Graph rules.
You can view and manage cloud posture security policies from the Posture Management > Rules & Policies > Policies > Cloud Security page. Click on a specific policy to see the rules associated with that policy and its scope.
Create a cloud security policy
To create a cloud security policy:
- Navigate to Posture Management → Rules & Policies → Policies → Cloud Security.
- Click Create Policy.
- On the Details page, provide Policy Name, Description, and Labels (optional).
- Click Next.
- On the Rules page, select which rules to be alerted on by using the available filters. You have three options:
- All Matching Filter Criteria - Include rules that match specific attributes (e.g., all critical severity rules).
- From Rules List - Manually select specific rules from the available inventory.
- All Rules - Include all available rules.
- Click Next.
- On the Scope page, select which scope to be alerted on:
- From Cloud Accounts - Select the specific cloud provider account to which the asset belongs.
- From Asset Groups - Select the specific logical groupings of assets (e.g., "Production" or "PCI Environment"). An asset group can have assets across different accounts, as the filter logic for the group can be generic (e.g., provider = AWS).
- All Cloud Assets - Apply to the entire tenant.
- Click Done to save the policy.
Edit a cloud security policy
To edit a cloud security policy:
- To edit a cloud security policy:
- Navigate to Posture Management → Rules & Policies → Policies → Cloud Security.
- From the Policies page, there are two ways to access the option:
- Right-click the entry and then select Edit.
- Click on the policy. Next, on the Details page, click the more options icon (⋮) and then select Edit.
- Make the necessary changes on the policy Details, Rules, and Scope screens.
- Click Done to save your changes.
Enable or disable a policy
You can enable and disable custom or default cloud security policies as needed. To enable or disable a cloud security policy:
- Navigate to Posture Management → Rules & Policies → Policies → Cloud Security.
- From the Policies page, there are two ways to access the option:
- Right-click the entry and then select Enable or Disable.
- Click on the policy. Next, on the Details page, click the more options icon (⋮) and then select Enable or Disable.
Use an existing policy to create a new one
You can use an existing custom default cloud security policy to create a new one. To create a new cloud security policy using an existing policy:
- Navigate to Posture Management → Rules & Policies → Policies → Cloud Security.
- From the Policies page, there are two ways to access the option:
- Right-click the entry and then select Save as New.
- Click on the policy. Next, on the Details page, click the more options icon (⋮) and then select Save as New.
- Modify the Policy Name, Description, and Labels fields as necessary.
- Select the Rules that you would like to be alerted on:
- All Matching Filter Criteria
- Rules List
- All Rules
- Select the Scope that you would like to be alerted on:
- Cloud Accounts
- Asset Groups
- All Cloud Assets
- Click Done to save the new custom policy.
Delete a custom cloud security policy
You can delete custom cloud security policies. To delete a custom cloud security policy:
- Navigate to Posture Management → Rules & Policies → Policies → Cloud Security.
- From the Policies page, there are two ways to access the option:
- Right-click the entry and then select Delete.
- Click on the policy. Next, on the Details page, click the more options icon (⋮) and then select Delete.
Cloud Data Classification
Requires a Cloud Posture Security, Cloud Runtime Security, or Cortex XSIAM Premium license. If you have the Endpoint DLP add-on, Data Classification is automatically available.
What is Cloud Data Classification?
To access Data Classification management, click Settings → Configurations → Data Classification.
The main screens of Data Classification management are:
- Data Patterns: Types of data that are discoverable on a data object, such as credit card numbers, Social Security numbers (SSNs), and email addresses. Cortex Cloud Data Classification provides a complete list of hundreds of out-of-the-box patterns. Scroll to the right to see more information about each pattern (description, region and state location, whether enabled). You can disable the data patterns that are not relevant for you. For more information, see How to disable and enable data patterns in Data Classification.
- Data Profiles: A data profile defines a data-related business case and is applied to a data object such as a file or field. Six major data profiles are included out-of-the-box:
- Developer Secrets: Sensitive pieces of information, such as API keys, passwords, tokens, and other credentials, that are used to authenticate and access various resources, services, and APIs. These secrets play a crucial role in securing applications and systems by validating the identity and permissions of users or applications.
- Financial: A collection of information and data related to an individual or an organization's financial status, transactions, investments, assets, liabilities, income, expenses, and other financial activities. This profile includes details such as bank account information, credit card details, investment portfolios, income statements, tax returns, and any other financial records that provide a comprehensive view of a person or entity's financial health and behavior.
- PCI: A set of information and data related to Payment Card Industry (PCI) compliance requirements and standards. This profile includes details such as credit card numbers, expiration dates, security codes (CVV/CVC), and any other data associated with processing payment transactions securely and in accordance with PCI Data Security Standards (PCI DSS).
- PHI: A collection of information and data related to Protected Health Information (PHI), which includes sensitive and confidential health-related data about individuals. This profile may contain details such as health insurance information, patient identifiers, HIPAA-related identifiers, ICD identifiers, and any other data that can be used to identify or link to an individual's health condition.
- PII: Personally Identifiable Information (PII), which includes any data that can be used to identify or distinguish an individual uniquely. This profile may contain information such as full names, home addresses, email addresses, phone numbers, Social Security numbers, driver's license numbers, passport numbers, and other personal identifiers that can be linked to a specific person.
- Sensitive: A broad range of information that is considered confidential, proprietary, or personally sensitive. This profile may include various types of data that we did not use to classify any other profile, such as internal IP addresses, internal classless inter-domain routing (CIDR), IP addresses, license plate numbers, MAC addresses, passwords, political views, religious beliefs, or SIM card numbers (ICCID).
- Global Settings: By default, both the OCR scan and Collect Masked Patterns are relevant for all modules that are using data classification. In other words, these two settings are global and define the behavior of OCR and sample collection for all modules using data classification.
- OCR (Optical Character Recognition): Enabled by default. When enabled, OCR extracts text from images. Disabling this option reduces scanning time but does not cover image classification.
- Collect Masked Patterns: Collects three samples for each data pattern that was classified in each object (file or table) and is masked by the Data Classification engine in your environment. Data does not leave your environment before it is masked; therefore, the full data is always protected.
How to create and validate a custom data pattern
Requires a Cloud Posture Security, Cloud Runtime Security, or Cortex XSIAM Premium license. If you have the Endpoint DLP add-on, Data Classification is automatically available.
Overview
Custom data patterns allow you to define specific criteria for identifying sensitive data tailored to your organization's unique requirements. These patterns are applied globally across all modules that utilize Cortex Cloud Data Classification.
Parameters and definitions
To create a new custom data pattern, you will need to use the following parameters:
| Parameter | Definition |
|---|---|
| regex | Define your pattern using regular expressions that are compatible with Rust syntax. |
| context words | Specify keywords that should appear in proximity to the regex match. These words are included in the search. A context word can be just one word or a phrase of a few words. Separate the context words or phrases with a comma (,). |
| proximity | Define a proximity for each custom data pattern. The proximity parameter defines the maximum number of characters allowed between the context words and a regex match. The proximity parameter finds regex values only after the context word. |
| masking level | <p>Define a specific masking level for each custom data pattern you create. Any changes to this setting only affect future data collection.</p><p>The possible masking level options are:</p><ul><li>Mask all: Displays only the number of strings with asterisks (*).</li><li>Partial: Partial masking hides the last 70% of the value. Only alphanumeric characters are masked.</li></ul> |
| profile association | You can associate your custom data pattern with one or more custom data profiles. This allows the pattern to be included in the definition of a data profile. |
Create a new custom data pattern
- In the lower left part of the screen, click Settings → Configurations.
- In the Configurations column, under Data Classification, click Data Patterns.
- On the Data Patterns screen, click + Add Pattern.
- On the Create New Data Pattern screen, do the following (the starred fields are mandatory):
- In the Data Pattern Name field, enter a data pattern name. To add an optional description, click Add description and enter a description in the text box that opens. If you change your mind and want to remove it, click Remove description.
- In the Regular Expression (Regex) field, enter a regex.
- In the Context Words line, enter the context words you want to use for your new data pattern.
- In the Proximity field, enter an integer that is greater than 10 and less than 150. The proximity is the maximum distance in characters from the context word to a regex value. If a context word is found, the proximity is counted from the end of the context word. The entire regex value must be found within this proximity window to be considered as found.
- You can now test your new data pattern to validate it.
Note
Once a custom data pattern is saved, it runs on all data in the same way as any out-of-the-box (OOTB) pattern, becoming globally applicable for all modules using Cortex Cloud Data Classification.
Validate the data pattern
It is crucial to validate your custom data pattern before saving it to ensure that it functions as intended and does not negatively impact system performance.
Validation does the following:
- Helps you understand if your custom classifier is properly defined in order to capture the data that you require. If it is not properly defined, the validator provides insights into the problem and assists with modifications.
- Verifies that the custom pattern does not cause the classification engine to get stuck or work slowly, which could affect functionality or the user experience.
To validate your data pattern, do the following:
- In the Test Data Pattern text box, enter your test text and click Test. Based on your configured regex value, any matches that are found appear in the test results box and are highlighted.
- You can adjust your regex value and click Test again to get different results.
Validator behavior and results
- Check regex:
- A text that is found by regex appears with highlighting.
- If the regex text is found within the defined proximity range, it is highlighted in green, even if only one text is found within the correct proximity of a context word.
- If the text is found outside of the defined proximity range for all context words, it is highlighted in gray.
- Check context words:
- Texts that are found under different context words are underlined.
- If a text is found within the proximity range, it is highlighted in green.
- If a text is found outside the proximity range, it is highlighted in gray.
- Textual explanation and guidance: The checker provides messages based on the test results.
- Sanity check (performance): A critical check runs automatically when you click Save for your custom pattern, even if you don't manually run the data pattern check.
- If a regex fails the sanity check, a notification informs you that the regex is too broad and needs to be narrowed.
- You cannot save a custom classifier until its regex passes this performance test.
Manage custom data patterns
- Delete custom data patterns: You can delete custom data patterns. Be aware that deleting a data pattern erases all past data associated with it in each module using Cortex Cloud Data Classification. It can take up to two days for the data deletion process to be completed in all places where this custom data pattern exists.
- Attach Geo tags to patterns: You can attach Geo tags to each pattern to help filter or view information based on specific locations. These tags can be added or removed only from custom patterns.
- Enable or disable a data pattern: You can enable or disable a data pattern. This action is global and applies to all modules using Cortex Cloud Data Classification. Enabling or disabling only affects future scans; past results are still presented.
Note
For more information, see How to disable and enable data patterns in Data Classification.
Custom data patterns: Guardrails and syntax guide
Requires a Cloud Posture Security, Cloud Runtime Security, or Cortex XSIAM Premium license. If you have the Endpoint DLP add-on, Data Classification is automatically available.
This guide explains the capabilities and limitations of creating custom classifiers. Understanding these guardrails will help you create effective and functional data patterns.
Guardrails
This section details the configuration rules, the logic behind these requirements, and how they affect pattern detection.
One regex per detector
- Rule: Each custom detector supports a single regular expression.
- Why: This simplifies the configuration and ensures that each detector has a clear, singular purpose.
-
Impact: If you need to match multiple different patterns (for example, different formats of an ID), you need to create separate custom detectors for each pattern or combine them into a single regex using the alternation operator (pipe), provided that this does not violate complexity limits. Example: format1|format2
Context words are mandatory
- Rule: You must provide at least one context word for your classifier.
- Why: The Data Classification engine uses context words as a first-pass filter. It only runs your potentially regular expression (regex) if one of the context words is found in the proximity you defined. This ensures high performance across large datasets.
- Impact: If you don't provide context words, or if the context words don't appear near your target data, the regex does not execute, and no match is found.
Avoid start-of-string and end-of-string anchors (^ and $)
- Rule: Do not use the start-of string and end-of-string
^or$anchors. - Why: In many regex engines,
^and$match the start or end of a line. However, in Cortex Cloud Data Classification, they match the start or end of the entire text being scanned. Since your target data ( such as an ID or key) is usually embedded in the middle of a file or sentence, using these causes the match to fail. - Impact:
^[A-Z]{2}\d{5}fails to find "AB12345".[A-Z]{2}\d{5}$fails to find "AB12345".
Avoid using lookaround and backreference entities
- Rule: Cortex Cloud Data Classification does not support the following:
- lookahead
((?=...)) - lookbehind
((?<=...)) - backreference
(\1)
- lookahead
- Why: Using the
lookaroundandbackreferenceentities can lead to exponential execution time. Cortex Cloud Data Classification allowslookaroundentities using the context words, and it uses the Rust regex engine, which guarantees linear time executionO(n)to prevent ReDoS (Regular Expression Denial of Service) attacks and to ensure predictable performance. - Impact: You must rewrite patterns to avoid these constructs. For example, instead of using
lookbehindto ensure that a prefix exists, include the prefix in the match and use a capturing group for the data you want to extract.
Regex complexity limits
- Rule: Cortex Cloud Data Classification enforces limits on regex complexity to prevent performance issues.
- Unbound repetitions: If possible, avoid unbounded repetitions such as
.*or.+or ensure that they are not nested. - Nesting depth: Deeply nested patterns, such as
((((a)b)c)d)), are limited. - Branching: Too many alternations (such as
a|b|c|...) or nested alternations can trigger validation errors.
- Unbound repetitions: If possible, avoid unbounded repetitions such as
- Why: Complex patterns with excessive nesting or branching can lead to "combinatorial explosion," where the number of possible matches grows exponentially, causing the scanner to hang or crash.
- Impact: If your regex is too complex, Cortex Cloud Data Classification rejects it with a validation error. In short, simplify your pattern by reducing nesting or breaking it into smaller components.
Syntax: Supported vs. unsupported
This section lists the specific regular expression characters and groupings that are allowed or restricted for use in custom patterns.
- Supported syntax
- Character classes:
[a-z], [0-9], \d, \w, \s - Groupings:
- Capturing:
(...) - Noncapturing:
(?:...)
- Capturing:
- Alternation: Pipe
|(OR operator). Example:cat|dog - Case insensitivity:
(?i)flag. Example:(?i)patternmatches "Pattern", "PATTERN", and so on.
- Character classes:
- Unsupported syntax
- lookahead:
(?=...), (?!...) - lookbehind:
(?<=...), (?<!...) - backreference:
\1, \2
- lookahead:
Examples: Do's and don'ts
Example 1: Matching an ID (anchors)
Goal: Match an ID that starts with 2 letters followed by 5 digits (such as "XY12345").
-
Do:
[a-zA-Z]{2}\d{5}Reason: This allows the pattern to match anywhere in the text.
-
Don't:
^[a-zA-Z]{2}\d{5}or[a-zA-Z]{2}\d{5}$Reason: The
^and$anchors force the match to be at the start or end of the entire file. However, it misses IDs inside a sentence or JSON object.
Example 2: Case insensitivity
Goal: Match the word "Confidential" regardless of case.
-
Do:
(?i)confidentialReason: The
(?i)flag enables case-insensitive matching for the pattern. -
Don't:
[C|c][O|o][N|n]...Reason: This is inefficient and hard to read.
Example 3: Testing your pattern
Goal: Verify that your pattern works in the Test Data Pattern box.
-
Do: If a test fails, clear the Test Data Pattern box completely and retype or paste the test string.
Reason: This ensures that the test environment resets to a stateless condition before processing the new input.
-
Don't: Edit the existing text in the test box and expect immediate results if previous tests failed.
How to disable and enable data patterns in Data Classification
Requires a Cloud Posture Security, Cloud Runtime Security, or Cortex XSIAM Premium license. If you have the Endpoint DLP add-on, Data Classification is automatically available.
Disable data patterns
You can disable data patterns that you do not require. Disabled data patterns are not searched for in new scans. Existing results on past scans do not change.
Note
Disabling data patterns can cause changes in your data profile results and stop detection of these data patterns.
- In the lower left part of the screen, click Settings → Configurations → Data Classification → Data Patterns.
- Right-click the rows of the data patterns you want to disable, and in the context menu, select Disable.
- In the Disable Data Pattern screen, click Yes to disable the data pattern or patterns that you selected, or click No to cancel. If you click Yes, the data pattern will be disabled and appear grayed out. You can enable it again if required, as described below.
Enable data patterns
You can enable data patterns after they have been disabled. Once enabled, new scans classify these data patterns and the results are then visible in all relevant modules.
- Right-click the rows of the disabled data patterns that you want to enable, and in the context menu, click Enable.
- In the Enable Data Pattern screen, click Yes to enable the data pattern or patterns that you selected, or click No to cancel.
Note
For more information about data patterns in data classification, see What is Cortex Cloud Data Classification?.
How to create and validate a custom data profile
Requires a Cloud Posture Security, Cloud Runtime Security, or Cortex XSIAM Premium license. If you have the Endpoint DLP add-on, Data Classification is automatically available.
Overview
A data profile is a label which is applied to a data object such as a file or table and defines a data-related business case.
Data profiles are a fundamental component of your organization's data security strategy, serving as the vehicle that defines what is considered sensitive data. Data profiles specifically outline the sensitive data your organization aims to discover, monitor, or receive alerts about. Profiles can be applied to and calculated for various data sources, including files, tables, and text-based information such as API calls.
You can create data profiles to customize sensitive data definitions according to your requirements, complementing or extending the predefined out-of-the-box (OOTB) profiles.
Understand custom data profiles
Unlike OOTB profiles, which are fixed lists and cannot be edited or erased, custom data profiles offer full flexibility: they can be edited, duplicated, deleted, disabled, or enabled. This means you can either build a custom profile from scratch, or start by duplicating an existing OOTB profile and then modifying it. When you duplicate an OOTB profile, the system initially assigns it a name "copy of X," but you can rename it as required.
Create a new custom data profile
When creating a custom data profile, you need to define various parameters that specify what constitutes sensitive data.
- In the lower left part of the screen, click Settings → Configurations.
- In the Configurations column, under Data Classification, click Data Profiles.
- On the Data Profiles screen, click + Add Profile.
-
On the Create New Data Profile screen, do the following:
- In the Data Profile Name field, specify a data profile name. To add an optional description, click Add description and enter a description in the text box that opens. If you change your mind and want to remove it, click Remove description.
- Under Select Data Location, select the locations that you want to assign to your new data profile:
- Cloud: includes a variety of parameters.
- Endpoints: Includes only data patterns.
- APIs: Includes only data patterns.
- Under Set Conditions, select the filters you want to set for your new data profile.
- Cloud: Includes a variety of filters.
- Endpoints: Includes only data patterns.
- APIs: Includes only data patterns.
Note
If you choose two data locations, only the filters they have in common will be included in the possible filter options.
-
Click Create.
The new custom data profile now appears in the Data Profiles list.
Manage custom data profiles
You can manage custom data profiles as follows:
- Edit: You can fully edit any custom profile.
- Duplicate: All custom profiles can be duplicated using the context menu in the Data Profiles list.
-
Delete: Only custom data profiles can be deleted using the context menu in the Data Profiles list.
Important
Deleting a data profile deletes all past data associated with it in all modules using Cortex Cloud Data Classification after a warning notification is displayed.
-
Enable or Disable: You can enable or disable any data profile, custom or OOOB.
Important
Enabling and disabling a data profile removes or re-adds the data profile results to the data objects; that is, files and tables.
Enable and disable data profiles
Note
For more information, see How to disable and enable data profiles in Cortex Cloud Data Classification.
How to disable and enable data profiles in Cloud Data Classification
Requires a Cloud Posture Security, Cloud Runtime Security, or Cortex XSIAM Premium license. If you have the Endpoint DLP add-on, Data Classification is automatically available.
Understand data profile statuses
Data profiles define what constitutes sensitive data for your organization and are applicable to both files and tables. You have the flexibility to enable or disable both out-of-the-box (OOTB) and custom data profiles.
- Enabled: When a data profile is enabled, Cortex Cloud Data Classification actively applies its definitions to identify sensitive data.
- Disabled: When a data profile is disabled, all data profile results are removed from the object; that is, file or table.
Note
Existing results on past scans are updated in the Asset and Object inventories within two hours after being disabled or enabled.
Disable data profiles
You can disable data profiles that you do not require. Disabled data profiles are not searched for in new scans. Existing results on past scans are updated in the Asset and Object inventories within two hours after being disabled or enabled.
- In the lower left part of the screen, click Settings → Configurations → Data Classification → Data Profiles.
- Right-click the rows of the data profiles you want to disable, and in the context menu, select Disable.
- In the Disable Data Profile screen, click Yes to disable the data profile or profiles that you selected, or click No to cancel. If you click Yes, the data profile will be disabled and appear grayed out. You can enable it again if required, as described below.
Enable data profiles
You can enable data profiles after they have been disabled. Once enabled, within two hours, the profiles are recalculated on the existing data in the Asset and Object inventories. After the new scans calculate these data profiles, the results are then visible in all relevant modules.
- Right-click the rows of the disabled data profiles that you want to enable, and in the context menu, click Enable.
- In the Enable Data Profile screen, click Yes to enable the data profile or profiles that you selected, or click No to cancel.
Note
For more information about data profiles in Cortex Cloud Data Classification, see What is Cortex Cloud Data Classification?.
Important considerations
- Global impact of built-in data profiles: You can only enable or disable them.
- Flexibility for custom profiles: You can do the following with custom data profiles, including those you have duplicated from built-in data profiles:
- Edit
- Duplicate
- Delete
- Disable
- Enable
How to report a false positive in Cloud Data Classification
Requires a Cloud Posture Security, Cloud Runtime Security, or Cortex XSIAM Premium license. If you have the Endpoint DLP add-on, Data Classification is automatically available.
Overview
When reviewing a scan of your assets, if you notice or identify that a data object (such as a file, table, or field) has been incorrectly classified, you can use the provided support case submission feature to report the false positive.
You initiate a support case submission using the designated Report false positive button. This triggers a structured workflow designed to gather all the necessary technical and contextual information required for our data analysts to investigate and fix the issue quickly. You will be asked to confirm or provide essential details, including the specific Data Pattern that was incorrectly matched and your description and evidence (a screenshot or the actual file or text) explaining why it is a false positive.
Once submitted, this case is handled by the Palo Alto Networks support team, which checks all the requested information that you provided. The support team is engaged with both the Data Engineering team to investigate and fix the issue, and with you to provide updates on the progress of the support case. The fix is applied to the core classification logic. You will be able to see accurate results after the next scan occurs.
How to create a support case
- You will need your tenant details during the reporting process. To display your tenant details, on the lower left screen, click Your name → About. You can take a screenshot and save the file for a later step in the reporting process. Alternatively, you can click the Copy to clipboard link to copy the information and then paste it into a file of your choice.
-
On the screen where you found the false positive, click the More Options icon, and then click Report false positive.
Note
Alternatively, in Cortex Command Center, click Help → Submit a Support Case.
- On the Submit Support Case screen that opens, on the Case Information tab, do the following:
- In the Describe the issue text box, enter a description of the object that you are reporting.
- Under Enter your preferred contact number, enter either your telephone or cellphone number at your organization.
- (Optional) Under Issue frequency, select a frequency in the list. The options are Not applicable, Consistent, or Intermittent.
- (Optional) Under Most recent issue start date & time, select the date and time that you found the false positive.
- In the Indicate the impact of the issue list, select the one of the five options that most closely relates to your issue.
- In the Select an issue category list, select Modules.
- In the Problem concentration list, select Data Classification.
- Provide the Data Pattern name where you found the false positive.
- Under the question Does the object with the false positive contain test data or production data?, enter test data or production data.
- If you are reporting a file, enter the file path. If it is a table, enter the column name and column type.
- Use the Browse link to upload the file containing the false positive or a relevant screenshot that shows the false positive in context, such as the paragraph where it is located.
- Use the Browse link to upload the file with your tenant details that you saved in step 1.
- Select the checkbox allowing Palo Alto Networks' support team to access your CSP account.
- Click Next.
- On the Console Recording tab, do not create a recording. Simply click Submit Support Case.
- Click Submit. A support case is opened and you will be contacted by the Palo Alto Networks support team.
Topic classification
Requires a Cloud Posture Security, Cloud Runtime Security, or Cortex XSIAM Premium license. If you have the Endpoint DLP add-on, Data Classification is automatically available.
Overview
Data security has traditionally relied on automated pattern detection to find sensitive information like credit card numbers. However, highly sensitive files, such as customer contracts or corporate strategies, can be easily misclassified if they lack those specific data patterns.
The Topic Classification feature provides crucial context by automatically assigning a business-relevant topic to your files. This shifts your data security strategy from purely pattern-based detection to a holistic, context-driven approach, allowing you to accurately assess file sensitivity and apply the appropriate security controls.
Scope and supported file types
For this initial release, Topic Classification is available specifically for cloud data locations.
Note
SaaS and endpoint locations are not currently supported for topic scanning. On-premise files are displayed as N/A in the Topic column.
The feature applies to all unstructured textual files of these file types:
- .doc
- .docx
- .ppt
- .pptx
- .txt
- .rtf
Supported topics and profile mapping
Each file is assigned a single, primary topic based on its content. To ensure you can easily manage risk, each topic is automatically mapped to a single data profile.
| Topic | Descriptions | Mapped data profile |
|---|---|---|
| Legal Agreements | Formal contracts and service terms between parties. These files define legal obligations related to business operations. | Sensitive |
| CVs-Resumes of Potential Applicants | Professional profiles detailing candidate work history and qualifications. These documents contain personal information and are subject to privacy regulations. | PII |
| Medical Certificates-Records | Private health information and clinical documentation for individuals. This sensitive data requires high-level protection to maintain patient confidentiality and regulatory compliance. | PHI |
| Payroll & Transactions | Financial transaction records including invoices, receipts, and payment confirmations, as well as Employee compensation records including salary details, deductions, and payment history. | Financial |
| Tax Documents | Tax filings, returns, and related financial documents. These contain sensitive financial data subject to regulatory requirements. | Financial |
| Corporate Filings | Official corporate registration documents, annual reports, and regulatory filings. These records are essential for legal compliance and corporate governance. | Sensitive |
| Business Continuity Plans | Business continuity and disaster recovery plans. These strategic documents outline procedures for maintaining operations during disruptions. | Sensitive |
How scanning works
To maximize efficiency and provide the most accurate risk assessment, file scanning follows a specific logic:
- Privacy: The data never leaves the customer environment. The AI-based embedding model runs in the customer environment in the same way as the data patterns are scanned.
- Pattern dependency: A file is scanned for topics only if it has already been scanned for data patterns. Combining pattern data with business topics gives you a comprehensive view of a file's true risk level.
- Scanning cadence: Files are scanned for topics at the same defined cadence of the data patterns. Because the core business topic of a file rarely changes without significant content alteration, this cadence ensures accuracy while remaining cost-effective.
- Rescanning: Files are rescanned at the same defined cadence for data patterns, rendering the cost insignificant.
Viewing topics in the platform
Once a file is scanned, its assigned topic is visible across multiple areas of the platform. If Cortex Data Classification does not detect a supported topic, it is marked as "Not found."
You can view, filter, and analyze topics in the following locations:
- File inventory: A dedicated Topics column is located next to the data patterns and records columns. You can filter the inventory using the Topics list.
- File view: A summary of discovered topics appears between the Data Profiles and Data Patterns sections.
- Asset inventory & asset page: View a Distribution by Topics summary to see how many files within an asset belong to a specific topic.
- Overview map: Filter the global map component by specific topics.
- AI dashboards: View topic distributions for sensitive data used by AI, including model pages and datasets.
- Custom profiles: You can use topics as a specific parameter (using AND/OR logic) when building custom profiles.
Overriding classifications and false positives
Administrators have the ability to manually override the assigned topic if it is inaccurate.
- Manual override: Admins can change a file's topic to another supported topic or designate it as "File does not contain any supported topics."
- Persistent changes: Once an admin overrides a topic, future quarterly scans will respect that user definition and will not revert the change.
- False positive (FP) reporting: If you need to open a support case for a false positive, please attach the actual file because screenshots cannot be used for topic FP analysis.
Cloud Identity Security
Cloud Identity Security can help you address the security challenges of managing identity in cloud environments.
Explore Cloud Identity Security
- what-is-cortex-cloud-identity-security
- review-and-improve-your-identity-security-posture
- how-does-effective-permission-calculation-work
- cortex-cloud-identity-security-functionality
- configure-cortex-cloud-identity-security
- unified-human-identities
- achieve-the-principle-of-least-privilege-access
- explore-permissions-using-the-simple-and-advanced-access-tables
- create-a-custom-detection-rule-in-cortex-cloud-identity-security
- perform-advanced-identity-security-investigations-using-xql
- ingest-logs-and-data-from-okta
- enable-inactive-human-identity-logs-on-azure-in-cortex-cloud-identity-security
- manage-rbac-and-sbac-in-cortex-cloud-identity-security
What is Cloud Identity Security?
Requires a Cloud Posture Security, Cloud Runtime Security, or Cortex XSIAM Premium license.
Cloud Identity Security is a set of tools providing you with the following necessary capabilities to improve your identity estate's security posture:
-
Cloud Infrastructure Entitlement Management (CIEM): Provides full and clear visibility into identities and permissions in your cloud environments, and helps with rightsizing permissions to achieve least privilege. The main idea behind the principle of least privilege is to make sure that only those who should have access to a cloud resource and actually must use it are granted that access. All unused and unnecessary permissions expose your organization to additional risk, and therefore these need to be eliminated. When all users and applications have been granted only the specific permissions they need, your organization has achieved least privilege access. Core CIEM capabilities also include removing unused permissions, monitoring administrators, and reducing risky permissions, such as human and non-human identities, third-party vendors, cross-account and cross-cloud access.
CIEM supports Amazon AWS, Microsoft Azure, Google Cloud Platform (GCP), Oracle Cloud Infrastructure (OCI) and Okta, enabling consistent visibility and control across multi-cloud and identity platforms. Core CIEM capabilities also include removing unused permissions, monitoring administrators, and reducing risky permissions across human and machine identities, third-party vendors, and cross-account or cross-cloud access.
For more information about ingesting logs and data from Okta, see Ingest logs and data from Okta. For information about onboarding AWS, Azure, GCP, OCI, and other cloud service providers, see Ingest cloud assets.
- Identity Security Posture Management (ISPM): Helps you prevent identity misconfigurations by analyzing all identities across your cloud providers, identity providers (IdPs), and SaaS applications. By collecting and analyzing information from various services, ISPM creates advanced insights about your identity estate, helping you monitor and mitigate issues such as identity misconfigurations, shadow admins, and excessive permissions.
- Data Access Governance (DAG): By combining access information with data-related insights generated by Cortex Cloud Data Security, Cortex Cloud Identity Security detects and identifies which identities can access sensitive data, which sensitive data types can be accessed, and where specifically this data is stored. DAG capabilities are used to remove unnecessary or unintentional access to sensitive data in order to reduce the risk of sensitive data exposure.
- Identity Threat Detection and Response (ITDR): Collects and analyzes real-time events from your cloud providers and IdPs in order to establish usage and access patterns. ITDR detects identity-related anomalies in real time and triggers automatic responses to keep any unwanted party away from your environment.
The following image shows the Cloud Identity Security dashboard:
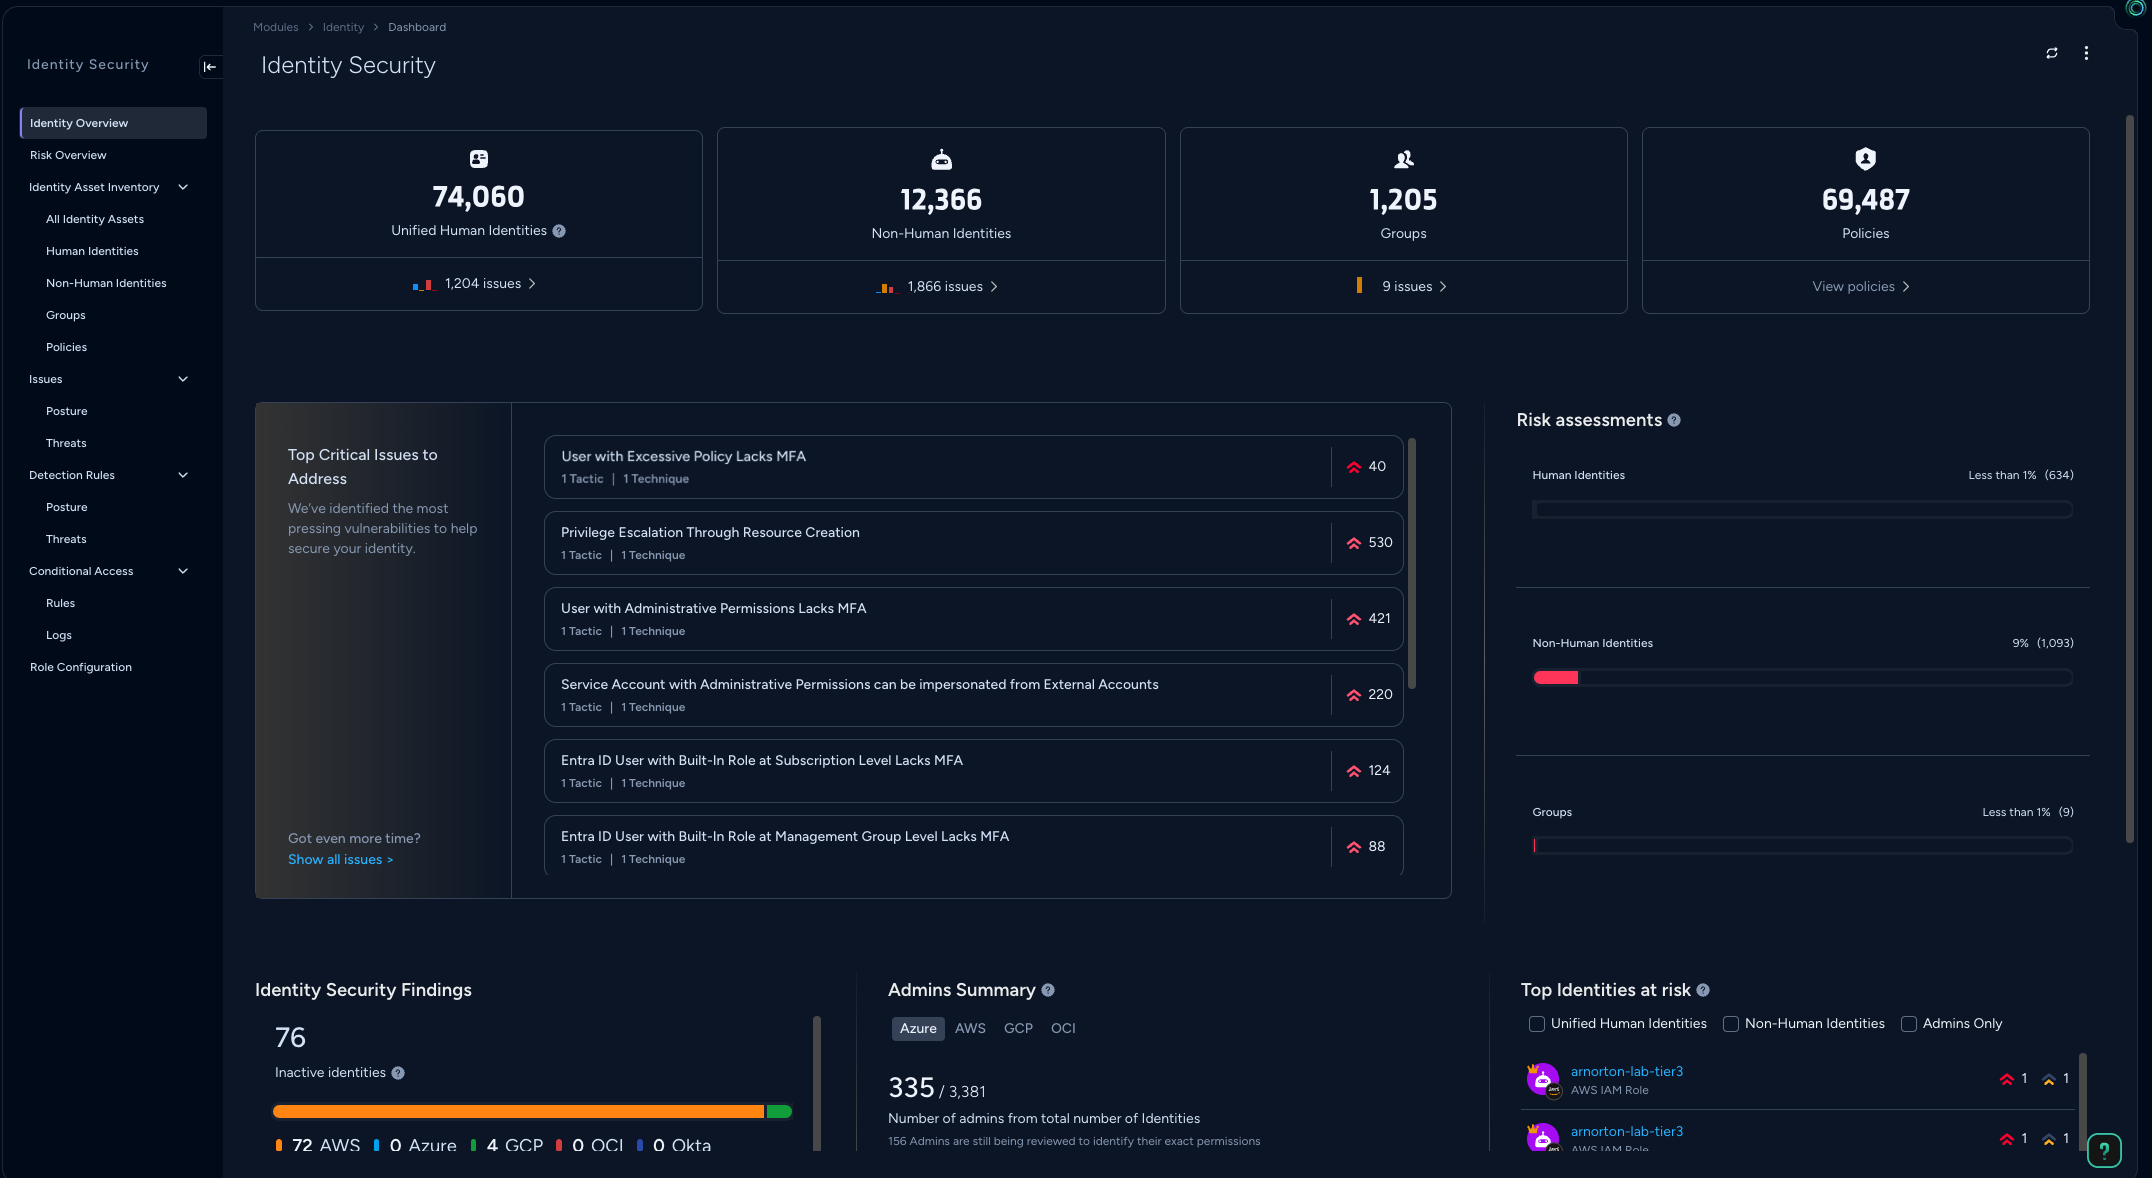
Cloud Identity Security runs a proprietary algorithm to calculate effective permissions and entitlements of the identities across your cloud service providers (AWS, Azure, GCP, and OCI) as well as permissions in your IdPs (Entra ID). This means creating a single graphical representation of all your cloud entitlements; taking all mechanisms affecting permissions into account. For example:
- Relevant access policies
- Deny and allow statements
- Organizational policies across single- or multi-cloud environments
Managing access and entitlement is an essential step in reducing your cloud attack surface. This includes mitigating identity misconfigurations in order to eliminate infiltration risk, and implementing least privilege access in order to minimize lateral movement, privilege escalation, or attack impact possibilities.
Cloud Identity Security can assist you with discovering your entire identity estate, fixing security gaps, and removing unused, excessive, and risky permissions to achieve the principle of least privilege. Additionally, you can use Cloud Identity Security to ensure that your environment meets any relevant compliance standards.
Cloud Identity Security can correlate identity information with configuration data, giving you the required depth of visibility and control. For example, if you use the Amazon S3 storage service, Cloud Identity Security can discover and identify sensitive data; the Cloud Network Analyzer (CNA) module can calculate true internet exposure, and Cloud Identity Security can provide granular insights into exactly who has access to the data and make appropriate recommendations to enforce least-privilege access.
You can use Cloud Identity Security to evaluate the effective permissions assigned to users, workloads, human identities, groups, roles, cloud service accounts, applications, identity providers (IdPs), and external accounts on your cloud provider so that you can properly administer identity and access management (IAM) policies and enforce access using the principle of least privilege.
Cloud Identity Security provides:
- Visibility: Discover your entire cloud identity estate and get a detailed inventory of all the identity assets in your environment. You can also get a detailed and precise modeling of who has permissions for which actions, and on which assets.
- Posture: Using a set of detection rules, find all privilege and misconfiguration security risks, with detailed reports of where exactly the issues are occurring and why they are important.
- Detection and response: Detect identity-related security events in real time and trigger automatic responses to make sure attackers do not gain access to your environment.
- Compliance: Test your identity estate against a wide set of compliance standards, and get a detailed report of what needs to be fixed for your assets to be 100% compliant.
- Remediation: Use Cloud Identity Security to create fixes for all your security and compliance issues.
Review and improve your Identity Security posture
Requires a Cloud Posture Security, Cloud Runtime Security, or Cortex XSIAM Premium license.
Cloud Identity Security provides tools to monitor and manage identity permissions across Cloud and IdPs, maintaining an inventory of human and machine identities and identifying security risks such as inactive accounts, excessive permissions, and role-chaining configurations. To improve your security posture, Cloud Identity Security offers remediation workflows to remove unused permissions and mitigate identified risks.
Analyze your current identity posture
The Cloud Identity Security dashboard provides an overview of various aspects of identity posture, which you can use to quickly assess your identity posture and the main identity security gaps. Each widget on the dashboard provides you with a specific context that you can use to learn about your environment, understand the most pressing issues, accessing the relevant pages in the product so you can remediate them.
Identity inventory summary widgets
The row of identity inventory widgets across the top of the dashboard shows you how many assets have been discovered, according to each asset category:
- Unified Human Identities: Displays all cloud identities, SaaS identities, and on-premises identities.
- Non-Human Identities: Can assume permissions and conduct cloud IAM actions. This includes, for example, VMs and functions.
- Cloud Service Accounts: A category unifying AWS roles, Azure service principals and managed identities, GCP service accounts, and OCI service accounts.
- Groups: Displays the number of IAM groups and issues.
- Policies: Permission documents. AWS and OCI policies, and Azure and GCP roles.
Top Critical Issues to Address area
Displays a refined list of the most important identity issues to take note of in your environment. Issues are prioritized based on the severity of detection rules, the number of violating assets, and their association with MITRE tactics and techniques. Use this view to quickly focus on the most critical security gaps and strengthen your security posture.
Identity Security Findings
Use the Identity Security Findings widget to find common misconfigurations in your environment:
- The Inactive Identities section shows the total number of users that have not logged in to the cloud environment for at least 90 days per cloud provider.
- The Identities with Unused Permissions section shows identities that have been granted permissions but have never accessed those permissions.
- The Identities with Excessive Policies section shows identities such as users, machines, groups, and cloud service accounts with excessive policies attached. The definition of excessive policy includes:
- Amazon AWS: A policy is considered excessive if it includes a full wildcard (resource and scope are:
*), or a service-level action wildcard (such as AmazonS3:*) , or a full wildcard in resource (meaning an action can be performed on all the resources of a service). - Microsoft Azure: When a role contains a wildcard and is bound to an entity on a management group scope, or grants an action wildcard and is bound to an identity at the subscription level.
- GCP infrastructure platform: When binding a specific predefined role on the organization, folder, or project level.
- Oracle Cloud Infrastructure (OCI): When a policy grants the
manageverb forall-resourcesat the tenancy level, granting unrestricted administrative control over every service and resource in the environment.
- Amazon AWS: A policy is considered excessive if it includes a full wildcard (resource and scope are:
Admins Summary
The Admins Summary widget provides you with valuable insight regarding the identities that are granted administrative permissions, in any way possible, in your environment. Admins are not necessarily found only in your administrators group, because identities can be granted administrative permissions in numerous ways, both intentionally or unintentionally. Use this widget to analyze how many administrators there are in your environment, and at what level they are granted administrative permissions.
Top Identities at Risk
In the Top Identities at Risk widget, you can view identities with the highest amount and severity of risks, to identify the riskiest identities in your environment.
Improve your identity posture through Issue remediation
You can find your identity issues in one of the following ways:
- By filtering the issues page according to issues detected by Cloud Identity Security.
- By following the identity issues link under the Cloud Identity Security module menu.
When opening each identity security issue, you are provided with relevant evidence, such as an explanation about the issue, what's causing it, why it is important and what you can do to fix it. Additionally, you are provided with detailed information about the risky permissions, misconfigurations, or any other detail relevant to understanding and solving the issue. For more information, see Issues.
Review and rightsize an identity’s permissions
You can review an identity's access by using the access table, which is found on the Access tab of an asset, and appears for the following assets:
- Identities (human and non-human)
- Cloud service accounts
- Groups
- Cloud destinations (assets on which IAM actions can be performed)
Since each asset plays a different role in a permission (a human identity performs actions, while a group grants permissions), each asset is therefore associated with a slightly different table, showing relevant information about the permission relevant to the asset.
Note that some assets can have more than one role in permissions. For example, a non-human identity can be both a source and a destination. For that reason, such assets get two tables. For example, a cloud service account has the following two tables:
- What can this Cloud Service account do, and to whom does it grant permissions?
- Who can access this asset?
For each row, which represents a direct relationship between a source, a destination and a granter, the access table shows additional information about the relevant permission, such as:
- Which access levels are granted.
- How many unused and excessive permissions are granted. Clicking on the number of unused or excessive permissions opens a new window, showing a detailed list of all these permissions.
- What is the account access type?
- Which sensitive data labels are found on the permissions destination (where relevant)?
Additionally, the destination assets overview page shows a list of identities that can access them. This table displays the top 100 most permissive identities for the asset, ordered according to the latest access that was performed on this asset.
To achieve the principle of Least Privilege Access (LPA), you can use the Review Unused Permissions feature to analyze audit logs and detect inactive permissions for AWS and Azure identities. Based on actual usage over a customizable timeframe, the system recommends specific actions and generates optimized, downloadable policy files in formats such as JSON, Terraform, or CloudFormation to help reduce your attack surface.
For more information about LPA, see Achieve the principle of least privilege access.
Note
Least Privilege Access (LPA) is not supported in OCI.
Review and mitigate 3rd-party access
For various reasons, you may choose to grant access to your account to a third-party vendor. However, are you monitoring for over-privileged third-party vendors? Are you removing unused permissions granted to third-party vendors?
Access tables: Filter a destinations access table on the third-party vendor account access to view all third-party vendors that can access the destination. You can now see what each vendor can do with the asset, whether each vendor has been granted excessive access, and if there are any unused permissions that can be removed.
Detect role chaining in Cloud Identity Security
Role chaining overview
Role chaining is an Identity Security concept that describes a configuration where one role is granted the permission to assume another role. This relationship creates a transitive link, meaning that any identity (user, service, or other role) that is able to assume the first role (Role A) can then leverage those permissions to assume the second role (Role B), as a result inheriting all the permissions and entitlements granted to Role B.
This configuration presents a significant security risk, as it can be exploited for lateral movement across the cloud environment and privilege escalation for the original identity, leading to unintended and potentially excessive access.
Detection
Cloud Identity Security provides capabilities to detect and monitor instances of role chaining, specifically focusing on configurations that enable potential lateral movement or privilege escalation.
- Detection mechanism: Cloud Identity Security is delivered with out-of-the-box rules to specifically identify scenarios where Role A has permission to perform the
AssumeRoleaction on Role B (Role A to Role B). - Visibility tools: Detection can be confirmed using permission exploration tools such as the advanced access table and XQL queries.
- From Role A's perspective: The tools reveal the permissions granted to Role A that allow it to assume Role B.
- From Role B's perspective: The tools reveal that Role A is configured as a principal authorized to assume Role B using Role B's trust policy.
- Custom rules: In addition to built-in rules, security teams can create custom detection rules targeting role chaining scenarios, specifying an AWS IAM role as the permission source and another IAM role as the destination.
Remediation
To mitigate the security risk associated with role chaining, you must remove the permissions that allow the role assumption. The actual remediation steps depend on how the permission was originally granted, such as in these scenarios:
-
Removing
AssumeRolepermissions from Role A:Policy modification: Remove the specific
AssumeRolepermission targeting Role B from the policies attached to Role A. This applies whether the permission is granted using a custom policy, a managed policy, or an inline policy directly embedded within Role A. -
Modifying Role B's trust policy:
Deny assumption: Edit role B's trust policy to explicitly remove or deny Role A as a trusted entity authorized to assume the role.
Improve your NHI posture
NHI posture overview
NHI (nonhuman identities) represents the majority of entities in modern cloud environments. These identities include service accounts, access keys, and tokens used by automated workloads. Because they are often created automatically by CI/CD pipelines, they can lead to identity sprawl, where unused or over-privileged credentials create significant security gaps.
By regularly reviewing your NHI posture, you can reduce your attack surface, ensure compliance with data residency requirements, and enforce the principle of least privilege for automated workloads.
Audit NHI by cloud provider
The platform provides a unified view of machine identities while maintaining the specific terminology used by each cloud provider. Use the table below to identify equivalent assets across your environment.
| Provider | Machine entity equivalent | Posture focus |
|---|---|---|
| AWS | IAM Users (Access Keys), Pod Identities, SAML/OIDC Providers. | Audit Last Used dates for access keys; monitor SAML provider private keys. |
| Azure | Service Principals, Managed Identities, Key Vault Certificates. | Monitor Key Rotation Policies; identify expired Key Vault certificates. |
| GCP | Service Accounts, OAuth Clients/Brands. | Map Service Account to Key relationships; audit IAP (Identity-Aware Proxy) configurations |
| OCI | Compute, Functions, Kubernetes Cluster, Autonomous DB, API Gateway | Audit Matching Rules for Dynamic Groups, Map Resource-to-Group Inheritance, API key usage. |
Key posture improvement workflows
-
Eliminate dormant credentials
The most common NHI risk is the "orphaned" or dormant credential. Use the Non-Human Identities and Secrets inventories to identify credentials that are no longer in use.
- Action: Navigate to Modules → Identity Security → All Identity Assets.
- Action: Filter for Non-Human Identities or Secrets where the Last Used attribute is greater than 90 days.
- Result: Deactivating these credentials in your cloud console reduces the risk of a compromised shadow identity.
-
Review secret replication and compliance
For organizations with strict data residency requirements, secrets must not exist in unauthorized regions.
- Action: In the Secrets inventory, review the Region or Location attributes.
- Action: For AWS Secrets Manager, specifically identify Replica secrets.
- Result: You ensure that sensitive credentials, such as Bedrock API keys, are only stored in approved geographic jurisdictions.
-
Analyze the Identity access chain
Attackers often use compromised machine identities to move laterally. You can visualize how an identity reaches a resource using the relationship graph.
- Action: Open an Asset Card for a User or Service Account.
- Action: Select the Identity tab and navigate to the Relationships subtab.
- Result: You can see every identity–human or non-human, that has permission to Read or Get a specific secret. If an identity does not require this access for a production workload, you should revoke the permission.
Common NHI misconfigurations to remediate
Prioritize the remediation of these common risks found within your inventories:
- Stale Access Keys: Access keys that have not been rotated within your organization's compliance window (typically 90 days).
- Dormant Identities: Non-human identities with no recorded activity in 30 days or more.
- Excessive Secret Access: A single non-human identity with Read or List permissions for an entire managed vault rather than specific secrets.
- Non-Compliant Secret Residency: Secrets replicated to cloud regions that fall outside of authorized geographic boundaries.
- Unprotected OAuth Clients: GCP OAuth brands or Azure identity providers that lack a designated owner.
Tip
Reducing the number of non-human entities that are either dormant or have administrative privileges is the most effective way to improve your security score.
How does Effective Permission Calculation work?
Requires a Cloud Posture Security, Cloud Runtime Security, or Cortex XSIAM Premium license.
Effective permission calculation
One of the core capabilities of Cloud Identity Security is its ability to analyze cloud permissions. Once you have onboarded your cloud organization, Cloud Identity Security gathers all the relevant information necessary for calculating permissions and then calculates the net effective permissions in your environment, which is a precise depiction of which identity can perform which specific actions and where can they be performed. Net effective permissions are used to provide context for other product features such as access tables, access to cloud resources and services count, as well as detection rules and issues.
When assessing whether a user has access to an Amazon S3 bucket, you must make sure that the permissions actually exist somewhere, while there is nothing that could deny access. A user can be granted access via a policy that is attached to the user (via direct attachment, a role the user can assume, or a group where they're a member), an inline policy, or a resource-based policy. Permissions can be denied via service control policies (SCPs), permission boundaries, a deny statement on a relevant policy, a deny statement on the resource-based policy and much more. The net effective permission calculator takes all these and more into account when determining effective permissions in your environment.
A permission consists of five main components:
-
Source: The identity that can perform an action. This can be a human identity or a non-human identity. In certain cases, permissions for cloud service accounts are calculated as sources as well. In some special cases, such as where public access is granted, or when permissions are granted to an entire specific cloud account, a source can be named “all”. In such cases, notice the source’s cloud account to identify whether the permissions are granted to the public or to all entities within an account.
For Oracle Cloud Infrastructure (OCI), sources include users, groups, and dynamic groups, which allow resources like Compute instances to act as identities."
- Destination: The resource on which the source can perform actions. In cases of wildcards, the relevant wildcard appears.
- Policy: The document where permissions are written, such as an IAM policy, Azure or GCP role, resource-based policy, or inline policy. OCI policies follow this syntax:
Allow <subject> to <verb> <resource-type> in <location> -
Granter: The asset that connects the source and the policy. Traditionally, this can be a group or a cloud service account. In the case of a direct attachment, or the use of inline policy, the granter and the source would be the same asset. In the case of a resource-based policy, the granter and the destination would be the same asset.
In OCI, this is typically a group or dynamic group.
- Action: The specific action that a source can perform on a granter.
Cloud permission calculations
A wide variety of tools are used by security teams to grant or revoke permissions. Cloud Identity Security takes the following parameters into consideration when calculating effective permissions.
Organization policy
Using organization policies, you can enable and turn off various types of policies across accounts and organization units. Cloud Identity Security analyzes organization policies as part of the permission calculation for:
- Amazon AWS: Service control policies (SCPs) are supported.
Deny statements
Deny statements can appear in the various permission tools in different cloud providers and are taken into consideration in the effective permissions calculation, when they appear in the following:
- AWS: Deny actions are supported in SCP and IAM policies. Overrides are allowed.
- Azure: Block operations or enforce rules in policies, resource groups, and subscriptions. Hierarchies can be applied across management groups. Overrides are allowed.
- GCP: Block actions and configurations are supported in the scope of organizations, folders, and projects. Hierarchies can be applied across hierarchy levels. Overrides are allowed.
- OCI: Deny statements are not supported.
"NotAction" element
- In a policy, actions specified under the
NotActionpolicy element are subtracted from the permissions that are granted in that policy. - The
NotActionelement is supported in AWS and Microsoft Azure. - The
NotActionelement is not supported in OCI.
Permissions boundary tool
You can use the IAM permissions boundary tool to limit the amount or scope of permissions granted to a principal.
The permissions boundaries tool is supported in AWS and Azure.
The permissions boundaries tool is not supported in OCI.
Resource-based policies
Resource-based policies are permissions that are configured on the destination resource. You can use resource-based policies to grant or deny permissions on a resource that is based on multiple parameters; for example, allowing or preventing a certain principal from acting on a resource.
- AWS: Resource-based policies are calculated for the following services: AWS Lambda, Amazon S3, Amazon Simple Queue Service (SQS), Amazon Simple Notification Service (SNS), AWS Secrets Manager, AWS Key Management Services (KMS), and Amazon Elastic Container Registry (ECR).
- Azure: Permissions granted of any scope are considered for effective permissions calculation.
- GCP: Resource-based policies are calculated for the following Google Cloud services: Cloud Storage, BigQuery, Cloud Pub/Sub, Cloud Key Management (KMS), Cloud Spanner, Cloud Run, Compute Engine, Cloud Functions, and Dataproc.
-
OCI: Permissions are calculated based on policies attached at the tenancy or compartment level. OCI does not use separate resource-based policies. Instead, access to specific resources is defined within the IAM policy using the
inclause (specifying a tenancy or compartment) and theWHEREclause (specifying individual resource IDs or tags).Note
Unlike GCP (organizations/folders/projects) or Azure (management groups/subscriptions), OCI uses a nested compartment structure.
Cloud Identity Security functionality
Requires a Cloud Posture Security, Cloud Runtime Security, or Cortex XSIAM Premium license.
The following explains the functionalities of Cloud Identity Security:
Asset categories
The Cloud Identity Security inventory is organized according to these asset categories:
- All Identity Assets: All Identity-related assets. Refine the results using the tabs:
- All Identities: Identities originating from all platforms and sources.
- Cloud Identities: Identities originating from cloud platforms.
- SaaS Identities: Identities originating from SaaS data sources.
-
On-premises Identities: Identities managed within your on-premises or enterprise directories.
Use the Weak Password widget to filter the users in your organization who are likely to be targeted because they have a weak password.
Note
Access to the Weak Password widget and column requires the ITDR add-on.
Note
Once a user updates their password to a strong password, they will no longer appear in the filtered weak password results.
- Human Identities: All cloud, identity provider (IdP), and platform users. Refine the results using the same sub-categories as All Identity Assets: Cloud Identities, SaaS Identities, and On-premises Identities.
- Non-Human Identities: Machine identities that can assume permissions and perform cloud Identity and Access Management (IAM) actions such as VMs and functions.
- Groups: Identity and Access Management groups.
- Policies: Permission documents, such as AWS policies, Azure roles, and GCP roles.
Asset relationships
One of the main pillars behind managing identity security is understanding the relationships that identity assets have with one another. In order to understand how an identity is granted its permissions, you first need to fully understand which groups the asset is a member of, which cloud service accounts it can impersonate, and if it has any policy attachments or inline policies. On the Identity tab of an asset, on the Relationships subtab, Cloud Identity Security displays all the relationships associated with an identity asset. All the relationships a given asset has with other identity assets are displayed in a table.
- Example: To view the groups associated with a user:
- In the Identity Security module, under Identity Asset Inventory, select an asset type.
- In the list on the right, click an asset whose associated groups you want to display.
- In the pane that opens, on the Identity tab, on the Relationships subtab, under Groups, a list is displayed containing each group name and its access levels for the user.
Effective permission calculation
Cloud Identity Security simplifies cloud complexity through Effective Permission Calculation. This foundational pillar analyzes your environment after onboarding to determine exactly what actions identities can take and which resources they can access. This calculation provides the essential context used across the product to populate access tables, track service usage, and trigger security detection rules.
Note
For more information about Effective Permission Calculation, see How does Effective Permission Calculation work?.
Last access calculation
Once you have onboarded to Cloud Identity Security, information about permission usage is collected. Cloud Identity Security keeps track of the last time each permission was used, creating a live picture of which permissions are used, and which are not. This information is presented in various features in Cloud Identity Security, helping you quickly identify permissions that are unused for 90 days or longer, and should therefore be considered for removal.
Excessive permission analysis
Defining AWS policies, Azure roles, GCP roles, or OCI policies to grant excessive permissions is considered a deviation from identity and permissions best practices. Excessive policies are defined as granting permissions on a very wide range of resources or allowing the performance of any action on resources.
The following specific scenarios are examples of excessive permissions:
- AWS: A policy is considered excessive when it includes any of the following:
- A full wildcard, where the resource and scope are:
* - A service-level action wildcard, such as
S3:* - A full wildcard in a resource, meaning that an action can be done on all resources of a service
- A full wildcard, where the resource and scope are:
- Azure: A policy is considered excessive when a role contains a wildcard and is bound to an entity on a management group scope, or grants an action wildcard and is bound to an identity at the subscription level.
- GCP: A policy is considered excessive when it binds a specific predefined role on the organization, folder, or project level.
- OCI: A policy is considered excessive when it grants permissions at the tenancy or compartment level with broad subjects, such as
any-userorany-group, or without restrictive conditions, such as statements lacking aWHEREclause.
Note
When a policy is analyzed and categorized as excessive, a relevant finding and highlight is attached to that policy and the various identities being granted excessive permissions.
Access categorization
Access categorization provides you with a high-level view of the type of access each identity has without your having to analyze each permission one by one.
The basic cloud permission categories are as follows:
- List: Permits users to view information about the metadata of cloud services and resources. For example, users can get a list of all resources under a specific service in an account.
- Read: Permits users to read data found in various cloud resources. For example, users with Read permissions may open and read files in object storage and run queries on databases.
- Write: Permits users to write data into cloud resources, including writing or deleting files and editing rows in databases.
- Config: Permits users to edit and configure cloud resources, such as editing firewall rules and adding users to groups.
-
Administrative: Permits users to perform highly privileged actions such as creating a new group or deleting an organization policy.
Note
Each action must be defined as either being administrative or not.
The administrative tag is an additional tag for administrative actions, along with one of the other access level types. For example, the AWS action
iam:CreateGroupis categorized as config and has the administrative tag as well.
Unused permissions and inactive identities
We recommend reviewing and removing all dormant identities from your environment, as well as reducing unused permissions. Inactive identities and unused permissions in your environment pose an unnecessary risk and widen your security gaps against potential attacks.
-
Unused permissions: Using the last access feature, you may find unused permissions, which are mentioned throughout the various features of Cloud Identity Security, such as the overview page and access tables. A permission is considered unused when at least 90 days have passed since it was last used.
Important
If you turn off the audit logs, even briefly, this temporarily impacts the accuracy of the Last Access data, potentially showing permissions as unused when actually they were active. Full accuracy is restored 90 days after you re-enable the audit logs.
- Inactive identities: Cloud Identity Security user login information and cloud service account usage to detect inactive users and inactive cloud service accounts. Per the industry standard, users and cloud service accounts that are considered inactive are those that have not been active for at least 90 days. When an asset is considered inactive, it is highlighted on the asset page and a relevant attribute appears on the asset, allowing you to query for it with the inventory.
- Inactive Azure human identities: For inactive Azure human identities on Azure, you must follow the steps described in Enable inactive human identity logs on Azure in Cloud Identity Security.
- Inactive human identities in OCI: Detects OCI users that have not logged in for at least 90 days.
Account access
Two capabilities of Cloud Identity Security are analyzing and identifying cross accounts and external access.
Getting information about permissions to your environment and access to sensitive data, and being informed about cross accounts or external access helps you determine and remove unauthorized access.
In Cloud Identity Security, access is labeled in one of the following ways:
- Same account access: When the source and the destination are in the same cloud account.
- Internal known access: When the source and the destination are in different accounts, while both these accounts have been onboarded to Cloud Identity Security. Additionally, permissions are categorized as internal known access when the source is from an onboarded SAML/OIDC provider; for example, an onboarded Okta account.
- Internal unknown access: When the source and destination are in different accounts, while one of the accounts is not onboarded but is part of the onboarded organization (when not all accounts under the organization have been onboarded). Additionally, permissions are categorized as internal unknown access when the source is from a non-onboarded SAML/OIDC provider; for example, an onboarded Okta account.
- 3^(rd)-party access: When the source account is a 3^(rd)-party vendor whose account is familiar to Cloud Identity Security.
- External unknown access: When the source and destination are in different accounts, and the source is in a non-onboarded account . Another example of this type of access is when the source is from an unknown web identity provider.
- Public access: When permission is granted to the public; for example, when an AWS role can be assumed by all users, or when an Amazon S3 bucket has a widely permissive resource-based policy.
Configure Cloud Identity Security
Requires a Cloud Posture Security, Cloud Runtime Security, or Cortex XSIAM Premium license.
You can configure how you want Cloud Identity Security to behave across your identities.
Trusted domains
Users may be sharing data across SaaS, Cloud, and on-premises environments externally. In order to highlight untrusted data sharing, this feature allows you to define which domains your organization trusts.
When non-internal identities are discovered, Cloud Identity Security flags them as External, and their domain is checked against your configuration as follows:
- Match found: The asset is designated as Trusted.
- No match found: The asset is designated as Untrusted.
Required roles
- Identity Security Administrator: Can view and manage trusted domains.
- Identity Security Reader: Can view trusted domains.
Manage domains
View existing domains
To see all the existing domains, do the following:
- Click Settings > Configurations.
- Open Identity Configuration.\
The Allowed Domains list is displayed.
Add a domain
To add a domain to the Trusted Domains list, do the following:
- Click Settings > Configurations > Identity Configuration.
- On the Trusted Domains screen, click Add Domain.
- In the Add Domain dialog box, enter a domain that you want to designate as trusted, for example domain.com, and click Add.
Note
To successfully add a domain to your trusted domains list, it must meet the following criteria:
- Valid format: The domain must contain at least one period (.), cannot contain spaces or empty sections, and must end with a valid top-level domain, such as
.comor.org. - No duplicates: Cloud Identity Security does not support duplicate domain entries.
- Limits: You can configure a maximum of 1,000 domains per tenant.
- The domain you added now appears in the Trusted Domains list.
Delete or edit a domain
If you want to delete or edit a domain, do the following:
- Click Settings > Configurations > Identity Configuration.
- On the Trusted Domains screen, click the More menu (three dots) for the domain you want to delete or edit, and select either Delete or Edit.
Unified Human Identities
Requires a Cloud Posture Security, Cloud Runtime Security, or Cortex XSIAM Premium license.
Overview
The Unified Human Identities (UHI) feature addresses identity fragmentation by automatically correlating disparate digital accounts into a single virtual asset. Modern enterprise environments manage identity across on-premises directories, cloud Identity Providers (IdPs), SaaS applications, and cloud platforms. Within these systems, individuals often accumulate multiple digital accounts, creating a visibility gap where risk is analyzed at the account level rather than the human level.
UHI functions as a central source of truth to provide a view of an individual's total effective access and security posture across the enterprise.
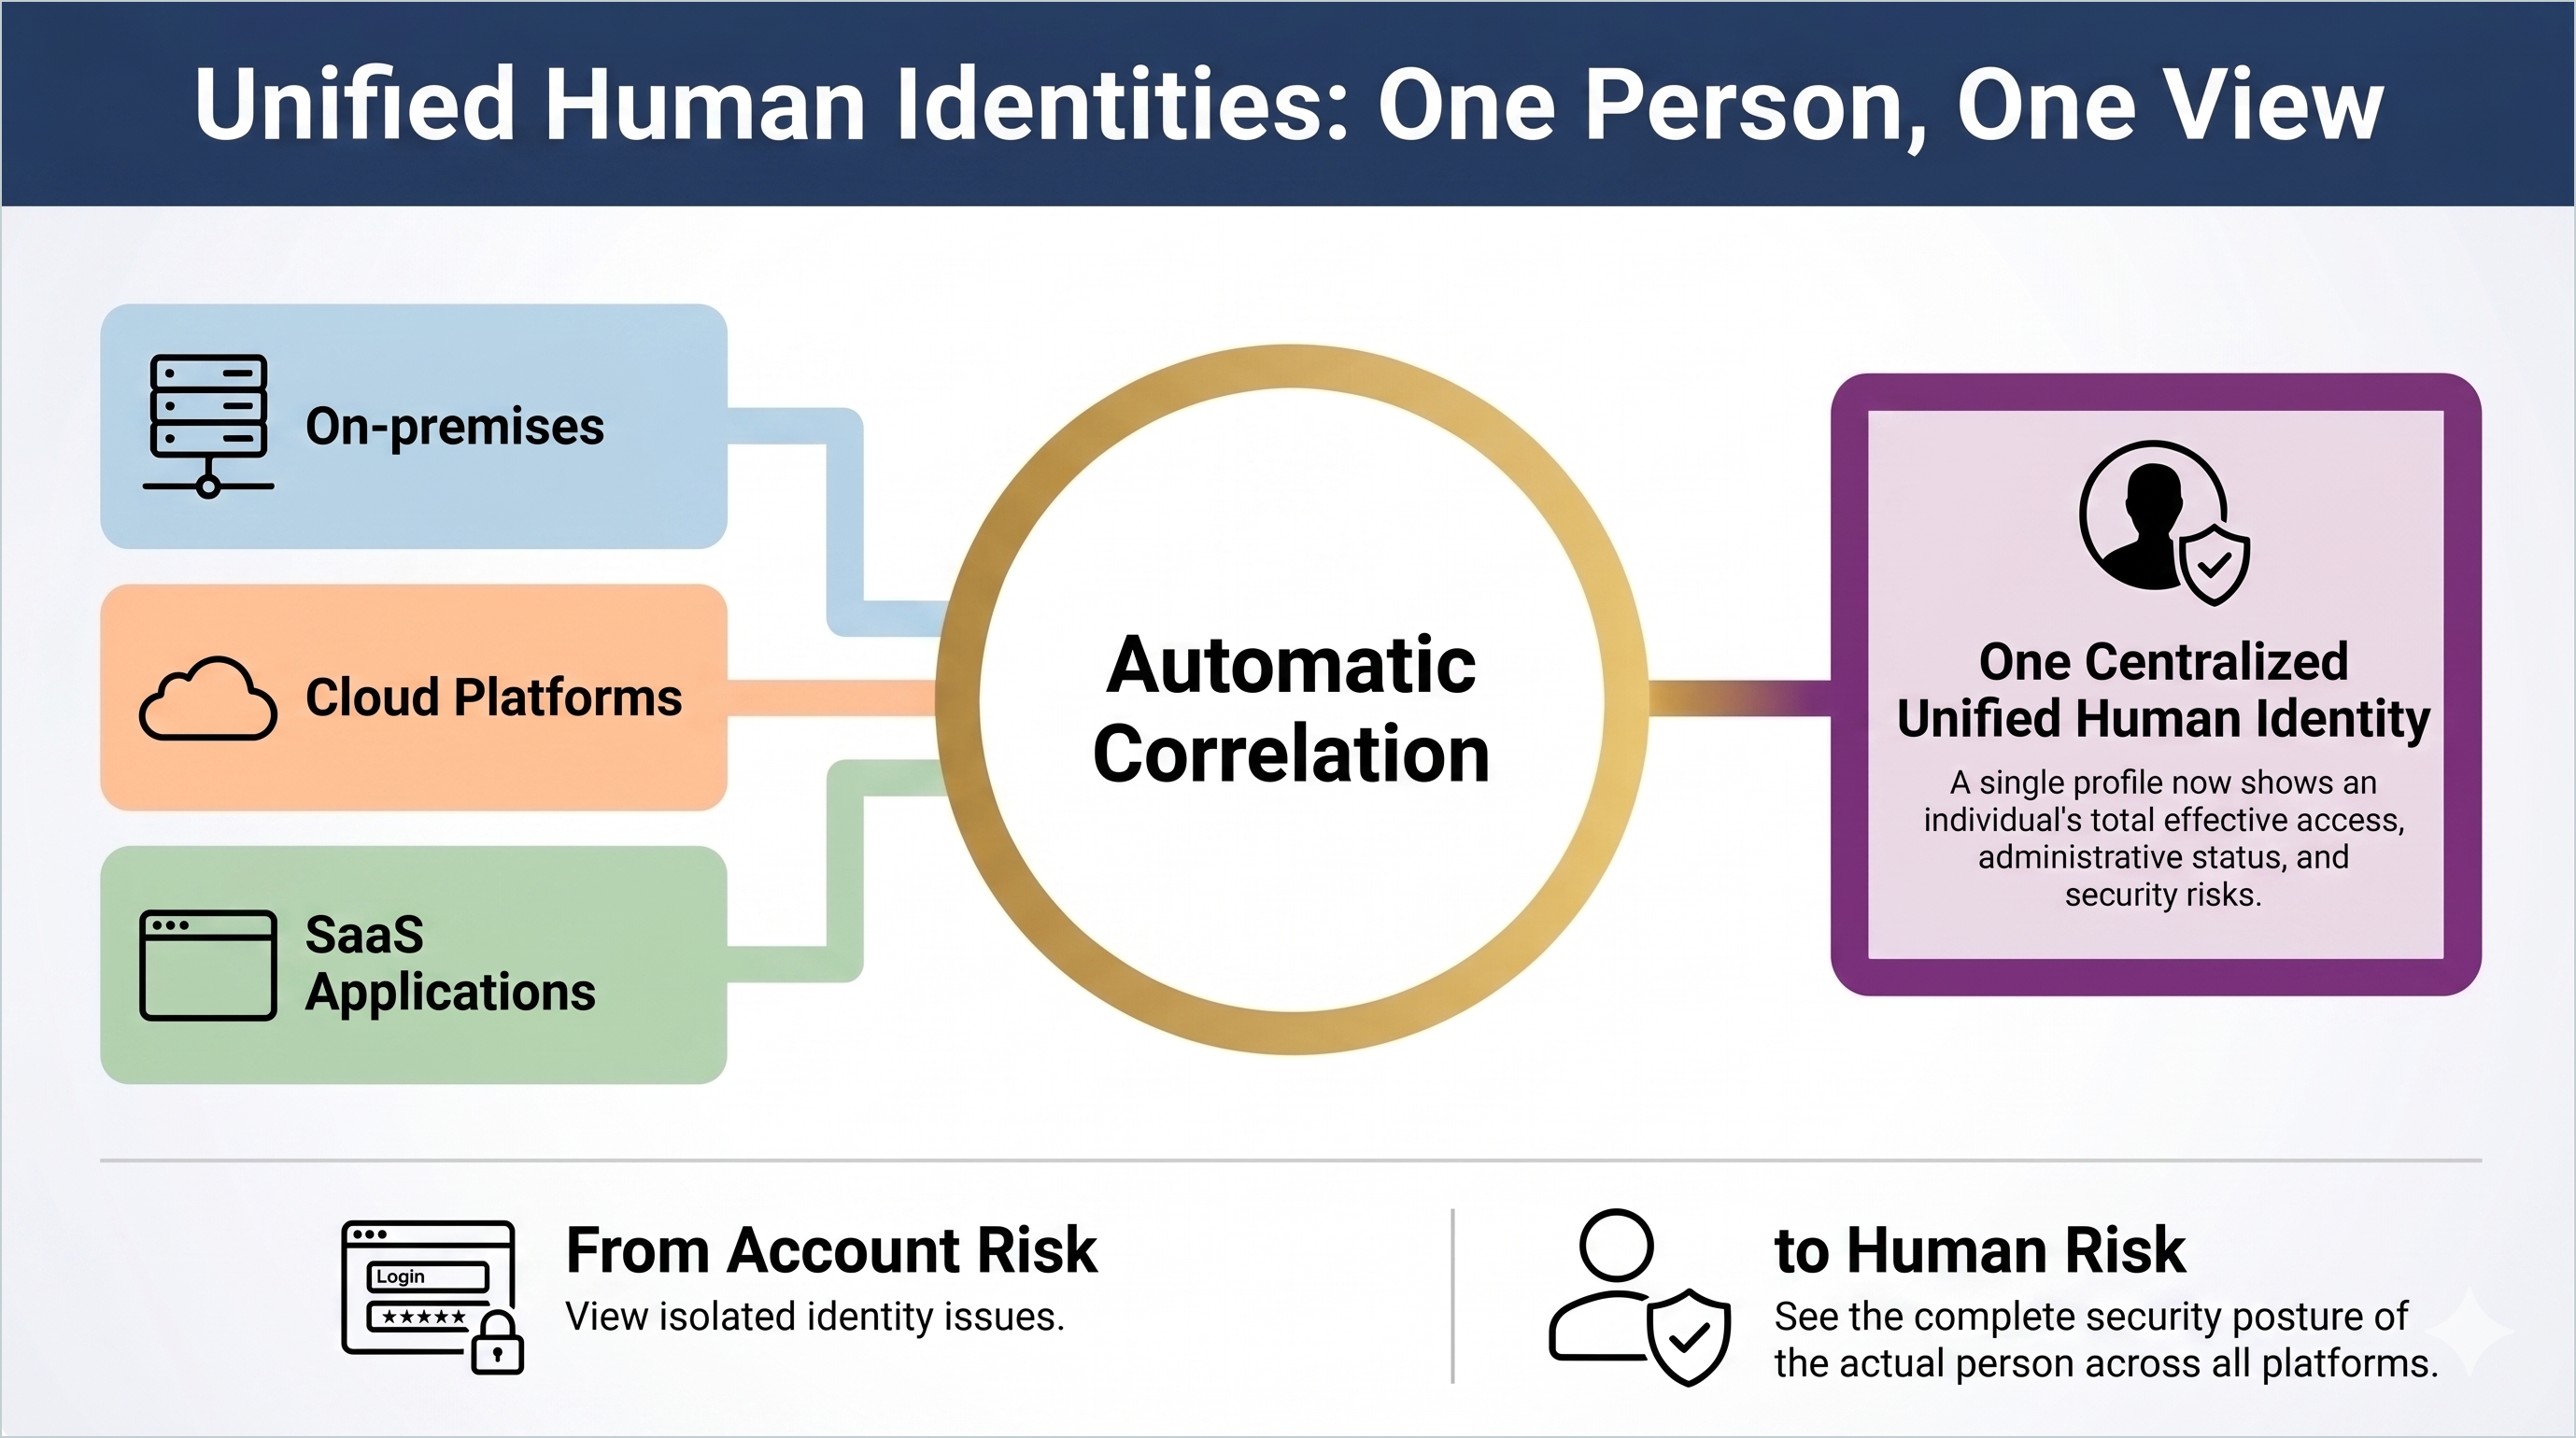
Product availability
The UHI feature is available for customers using the following products:
- Cloud Identity Security
- Cortex ITDR
- Cortex SaaS Security
Implementation and correlation
Cortex Identity Security creates and maintains Unified Human Identity assets automatically when a human identity is detected within the Cortex Data Lake.
- Correlation method: Cloud Identity Security uses the user email as the primary identifier to link accounts.
- Asset model: A Unified Human Identity serves as an umbrella container for every environment-specific identity belonging to a single person.
- Supported sources: Correlation includes data from the following environments:
- On-premises
- Identity providers (IdPs)
- Cloud platforms
- SaaS applications
Human Identities Inventory
The Human Identities Inventory provides a centralized location to audit and manage the individuals in your organization.
Inventory filter tabs
The inventory view is organized into four primary tabs to filter the unified asset list:
- All Identities: Displays every correlated human identity across all environments.
- Cloud Identities: Filters for identities with accounts in cloud service providers (AWS, Azure, GCP, and OCI).
- SaaS Identities: Filters for identities with accounts in SaaS applications.
- On-premises Identities: Filters for identities originating from local directory sources, such as Active Directory.
Inventory summary data
The top of the inventory provides a real-time summary of identity health:
- Risk Breakdown: A summary showing the total number of individuals with associated risks, categorized by high and low severity.
- Administrative Status: A count of individuals who hold administrative privileges across any connected system.
- Activity Tracking: An overview of inactive identities who have not accessed their accounts within a specified timeframe.
Individual Identity Details Panel
You can click an individual in the identity inventory list to open a detailed profile panel that consolidates information typically scattered across multiple consoles.
- Identity metadata: Displays the individual’s title, department, and employment type.
- Providers: Lists the source systems (such as Okta, AD, or specific cloud platforms) contributing identity data to the Unified Human Identity.
- Identity insights: Behavioral and posture-based analytics highlighting specific security risks or anomalies associated with the person’s combined footprint.
- Correlated accounts: Lists every specific account, including cloud roles, directory profiles, and SaaS logins, that has been correlated to a specific Unified Human Identity.
Operational Use Cases
- Detection of Privilege Creep: Identifies individuals who have accumulated excessive permissions across unrelated platforms, and who may be invisible when viewing accounts in isolation.
- Incident Investigation: Responders can search by name or email to view all associated system access, reducing the manual effort required to cross-reference logs from different providers.
Achieve the principle of least privilege access
Requires a Cloud Posture Security, Cloud Runtime Security, or Cortex XSIAM Premium license.
Overview
Cloud Identity Security uses audit logs to detect unused permissions. The Review Unused Permissions feature can help you analyze audit logs in order to identify and revoke excessive permissions. This allows you to generate precise IAM policies based on actual usage, reducing your attack surface and strengthening your overall security posture. You can customize the time frame for used permissions according to your specific operational needs.
The Review Unused Permissions feature is supported for these platform entities:
- Amazon AWS:
- IAM roles
- IAM groups
- Microsoft Azure:
- Service principals
- IAM groups
- Google Cloud Platform (GCP):
- GCP groups
- Service accounts
Cloud Identity Security does the following:
-
Analyzes last access data in order to detect the permissions that are being used.
Note
In the case of Amazon AWS, Cloud Identity Security also uses AWS Identity and Access Management (IAM) Access Advisor insights to expand the coverage of supported actions.
- Recommends the removal of unused permissions, displaying recommended actions, such as Keep and Remove.
- Generates downloadable policies in:
- Amazon AWS: IAM Policy (JSON), HashiCorp® Terraform, CloudFormation
- Microsoft Azure: Role Definition and Role Assignment (JSON), HashiCorp® Terraform
- Google Cloud Platform (GCP): IAM Policy (JSON), HashiCorp® Terraform
Reviewing Unused Permissions
- In the Cloud Identity Security module, under Identity Asset Inventory, on the Cloud Identities tab, select an identity in the list whose permissions you want to review.
- On the Overview tab, in the Review Unused Permissions area, click Analyze Permissions Usage, and select a time period in the list.
- Click Start Analysis.
- On the Permission Checkup Results screen, a summary of permissions usage is displayed according to the time period you selected, with the suggested Remove number in red and the recommended Keep number in blue.
- If you want to proceed with seeing the recommended changes and how you could reduce unused permissions, click Adjust Policy, and select one of these formats in the list:
- JSON
- Terraform
- CloudFormation (for AWS only)
- A code block with the format you chose now appears. You can do one of the following:
- Click Download File to save a copy of the file.
- Click Copy to clipboard and then paste the code into a file of your choice.
- You can now click Back to Checkup Result to return to the previous screen. You can review the policy list to see and consider the Cortex Recommendation column, which displays either Remove or Keep for each policy file.
Important
If you turn off the audit logs, even briefly, this temporarily impacts the accuracy of the Last Access data, potentially showing permissions as unused when actually they were active. Full accuracy is restored 90 days after you re-enable the audit logs.
Explore permissions using the simple and advanced access tables
Requires a Cloud Posture Security, Cloud Runtime Security, or Cortex XSIAM Premium license.
Overview
Analyzing an identity's permissions can be complex due to the numerous ways permissions are granted, including various granters, policy types, wildcards, and explicit resource access.
The access tables in Cloud Identity Security simplify this task by providing distinct views for exploring permissions of both identities and destinations at different levels of granularity.
Open an access table
- In the Cloud Identity Security module, open an asset.
-
Click the Identity tab.
The Graph view of the asset's identity is displayed.
-
Click Table to display the graph content in table view.
A simple table is displayed.
- To display the advanced view of the table, click the Advanced view toggle.
- To go back to the simple table display, click the Advanced view toggle again.
Access table granularities
Cloud Identity Security offers two access views: the Simple access table and the Advanced access table.
Simple access table
The Simple access table provides a high-level overview of the following:
- Identities: Shows the services an identity can access (such as RDS, cloud storage, or Vertex).
- Destinations: Shows the identity types that have access to the destination asset.
Advanced access table
The Advanced access table offers a deeper, more granular view of permissions, including crucial context for security analysis:.
- Granters: Identifies granters that provide the specific permission.
- Policy Patterns: Shows the patterns written in the policies that grant access to destination assets. For example, if a policy includes a wildcard pattern that is relevant to many assets, you are able to explore which specific patterns granted access to each one.
- Security Context: Provides additional insights, such as:
- Unused permissions
- Excessive policies
- Cross-account access
- Sensitive data related to the permission
Exploring an identity's permissions
When exploring an identity, its Access tab lists all the permissions that the identity holds.
- Simple view: Initially displays the broad service categories that the identity can access, such as RDS, cloud storage, or Vertex.
- Drill down: Clicking on each service reveals the exact assets the identity can access within that service.
- Advanced analysis: To understand how permissions are granted, use the Advanced access table.
- Hovering over an access line exposes a redirection button.
- Clicking the Advanced toggle button displays the Advanced access table, where you can analyze the granting policies, view the last used time for the permission, and check for associated sensitive data, unused permissions, or excessive permissions.
Exploring a destination asset's permissions
When exploring a destination asset, such as a specific Amazon S3 bucket or database, the focus shifts to who can access it.
- Simple view: The Simple access table shows all the identity asset types such as roles, users, and functions that can access the destination.
- Advanced analysis: To understand the details of access for a specific identity type:
- Explore that identity type in the Advanced access table.
- This view shows how the permission is granted, the specific permission pattern used, and provides contextual data, for example, the exact sensitive data that is related to the permission.
Create a custom detection rule in Cloud Identity Security
Requires a Cloud Posture Security, Cloud Runtime Security, or Cortex XSIAM Premium license.
Cloud Identity Security comes with a comprehensive set of out-of-the-box detection rules, helping you to detect, prioritize, and remediate Identity Security gaps in your environment. This set of rules is written and maintained by a team of Identity Security experts, aimed at looking for the most common and severe Identity Security use cases. In order to provide a complete solution and be able to create issues for any required use case, Cloud Identity Security allows you to create custom detection rules, which allow you to customize the identity and permissions scenarios you are looking for and trying to avoid and remediate. You can create a custom detection rule and attach it to a policy in order to raise issues from the rule.
Identity and permissions are based on relations entities have with one another, therefore the rule builder is based on defining a logic for entities, their attributes, and the relations they have with other entities.
Each identity rule you define scans your environment for permissions that answer the criteria of each rule, raising issues for each defined asset that match the criteria.
A permission consists of five main entities:
- Permissions source: The human or nonhuman identity, account, service account, or identity provider that can conduct actions in your cloud environment. With certain configurations, the source can also be the general public or all authenticated users.
- Permissions destination: The cloud resource, or wildcard pattern, where permissions are granted on (a source can act on a destination).
- Policy: The IAM policy or role that defines permissions. Permissions can be granted using IAM policies as well as resource-based policies.
- Granter: The entity that connects the source to the relevant policy. For a permission that is granted by a resource-based policy, the granter should be identical to the destination. For inline policies or managed policies directly attached to the source, the granter should be identical to the source.
- Permission: The actual action that is granted to the source on the destination. A permission is a single cloud action and also has additional attributes such as last access, access level, which conditions are applied to the permission, and more.
Each rule consists of choosing an asset that has certain permissions while filtering attributes of that asset, the relationships it has with other assets, and their attributes.
Each custom rule creates issues for one pillar only: the source, the granter, or the destination of the permissions. Each issue must be assigned to a single asset. Since a permission can involve multiple related assets (source, granter, or destination), the system determines which of these three pillars is correlated with the entity that you choose first.
Create a custom identity detection rule in Cortex XSIAM
- From the navigation pane on the left, go to Posture Management → Rules & Policies → Rules → Cloud Security.
- On the Cloud Posture Security Rules screen, click Create Rule → Identity.
- On the Overview tab of the Create Identity Rule screen, do the following:
- Enter a rule name.
- Enter a brief description of the rule (less than 300 characters).
- In the list, select a severity level.
- (Optional) Add a label.
- (Optional) Turn on the Enable Remediation toggle to add actions to take in the event that a rule is violated.
- In the Compliance Controls box, click + Add to add and assign compliance controls to the rule.
- Click Next.
- On the Rule Logic tab, define the logic for your rule.
- Click Search. The results of your query are shown at the bottom of the screen under Query Results.
- (Optional) On the Remediation tab, in the Remediation text box, define the actions to be performed when the new custom rule is violated.
-
Click Done.
The new rule appears in the list on the Cloud Posture Security Rules screen.
Example
Below is an example of a custom detection rule in Cloud Identity Security.
This is an example of a rule that looks for an AWS IAM user (source) with the following conditions:
- Has no MFA configured
- Gets administrative permissions from an IAM role whose name starts with “PROD”

Perform advanced Identity Security investigations using XQL
Requires a Cloud Posture Security, Cloud Runtime Security, or Cortex XSIAM Premium license.
Overview
Use Cortex Query Language (XQL) in Cortex XSIAM to investigate Cloud Identity Security permissions, access, identity risks, findings, and issues. Query identity datasets to identify security gaps and guide remediation.
For more information, see Get started with XQL.
You can use the following identity-related datasets:
| Dataset | Description |
|---|---|
| ciem_permissions_with_last_access | Contains the permissions of each identity that is discovered in your environments, including the time of their last access when applicable. |
| asset_inventory | Contains an inventory of all the assets that are discovered in your environments. For more information, see Asset management. |
| issues | Contains the issues that are related to the assets in your environments. For more information, see Issues. |
| findings | Contains the findings that are associated with the assets that are found in your environments. For more information, see Findings and events. |
Investigate Cloud Identity Security in Cortex XSIAM
To run queries on your Cloud Identity Security datasets:
- In Cortex XSIAM, in the navigation pane on the left, click Investigation & Response, then under Search, click XQL Search.
- On the XQL Search screen, under XQL Query, in the text box, start typing your query. Alternatively, you can search for existing queries on the Query Library tab.
- When you have finished entering your query, click Run. The results appear on the Query Results tab.
For more information, see Build XQL queries.
Example XQL queries for Identity Security
Use these XQL queries in Cortex XSIAM to investigate your identity security posture:
1. Count the number of admin sources per account
dataset = ciem_permissions_with_last_access | filter action_access_isadministrative in(true, TRUE) | dedup source_cloud_resource_uai, source_cloud_account_id | comp count(source_cloud_resource_uai) as admins_count by source_cloud_account_id | sort desc admins_count
2. Azure service principals granting write permissions on the subscription level
dataset = ciem_permissions_with_last_access | filter dest_cloud_type = "AZURE" and action_access_level contains "Write" and grantedby_level_type = "AZURE_SUBSCRIPTION" and grantedby_cloud_entity_type = "service principal" | fields source_cloud_resource_name, source_cloud_resource_type, grantedby_cloud_entity_name, grantedby_level_name, grantedby_level_type
3. Group permissions on production assets
dataset = ciem_permissions_with_last_access | filter dest_cloud_type = "GCP" and action_access_level = "config" and source_cloud_resource_type = "user" and grantedby_cloud_entity_type = "group" and wildcard_match("prod.*", dest_cloud_resource_name) | fields source_cloud_resource_name, grantedby_cloud_entity_name, dest_cloud_resource_name, dest_cloud_resource_type
4. Users without MFA and sensitive S3 and EC2 permissions
dataset = ciem_permissions_with_last_access | filter source_cloud_type = "aws" and source_cloud_resource_type = "user" and action_access_level contains "Config" and dest_cloud_service_name in ("s3", "ec2") | join (dataset = asset_inventory) as assets source_cloud_resource_uai = assets.xdm.asset.id | filter lowercase(json_extract_scalar(xdm.asset.normalized_fields, "$['xdm.identity.has_mfa']")) = "false"
5. Azure VM with data write permissions on the subscription levels
dataset = ciem_permissions_with_last_access | filter source_cloud_type = "azure" and source_cloud_resource_type = "virtualMachines" and (lowercase(action_access_level) contains "config" or lowercase(action_access_level) contains "write") and dest_cloud_resource_type ~= "^storageAccounts/blobServices" and grantedby_level_type = "AZURE_SUBSCRIPTION"
6. Policies granting wildcard permissions
dataset = ciem_permissions_with_last_access | filter dest_cloud_resource_name ~= "^\*$" and grantedby_cloud_policy_type in ("AWS_CUSTOMER_MANAGED_POLICY", "AWS_MANAGED_POLICY") | dedup grantedby_cloud_policy_id | fields grantedby_cloud_policy_id as policy_arn
7. Administrative roles open to third-party vendors and external unknown accounts
dataset = ciem_permissions_with_last_access | filter grantedby_cloud_entity_type = "role" and action_access_isadministrative = true and account_access in ("EXTERNAL_UNKNOWN", "THIRD_PARTY_VENDOR") | fields grantedby_cloud_entity_name, grantedby_cloud_entity_account_name, source_cloud_account_name, account_access
8. Show identities with unused permissions
dataset = ciem_permissions_with_last_access | filter last_access_time != null and timestamp_diff(current_time(), last_access_time, "DAY") > 90 and source_cloud_resource_name !~= "^\*$" | dedup source_cloud_resource_name, source_cloud_account_id, action_name, dest_cloud_resource_name, last_access_time | fields source_cloud_resource_name, source_cloud_account_id, action_name, dest_cloud_resource_name, last_access_time
9. Unused permissions by lambda functions
dataset = ciem_permissions_with_last_access | filter source_cloud_service_name= "lambda" and source_cloud_resource_type = "function" and source_cloud_region = "Virginia" and is_last_access_supported = true | alter days_since_used = timestamp_diff(current_time(), last_access_time, "DAY") | filter days_since_used > 90 | fields source_cloud_resource_uai, source_cloud_resource_name, days_since_used, action_name, action_access_level
10. Get all the non-admin sources that can assume an admin role
dataset = ciem_permissions_with_last_access | filter action_name = "sts:AssumeRole" | fields source_cloud_resource_uai, dest_cloud_resource_uai, dest_cloud_resource_id, dest_cloud_account_id | filter source_cloud_resource_uai not in(dataset = ciem_permissions_raw | filter action_access_isadministrative in(true, TRUE) | dedup source_cloud_resource_uai | fields source_cloud_resource_uai) | fields source_cloud_resource_uai as source, dest_cloud_resource_uai as dest_uai, dest_cloud_resource_id as dest_id, dest_cloud_account_id as dest_account_id | join(dataset = ciem_permissions_raw | filter grantedby_cloud_entity_type = "role" | filter action_access_isadministrative in(true, TRUE) | dedup grantedby_cloud_entity_id | fields grantedby_cloud_entity_account_id, grantedby_cloud_entity_id) as admin_roles (dest_id = admin_roles.grantedby_cloud_entity_id or (dest_id ~= "^\*$" and dest_account_id = admin_roles.grantedby_cloud_entity_account_id)) | fields source
11. Administrative permissions granted to EC2 instances that can access multiple services
dataset = ciem_permissions_with_last_access | filter source_cloud_resource_type = "instance" and source_cloud_service_name = "EC2" and action_access_isadministrative = true | comp values(action_name) as actions by source_cloud_resource_uai, source_cloud_resource_name, source_cloud_account_id, grantedby_cloud_entity_name | join (dataset = asset_inventory) as assets source_cloud_resource_uai = assets.xdm.asset.id | alter access_to_services = to_integer(json_extract_scalar(xdm.asset.normalized_fields, "$['xdm.identity.access_statistics.services']")) | filter access_to_services >= 10 | fields source_cloud_resource_name, source_cloud_resource_uai, access_to_services, grantedby_cloud_entity_name
Ingest logs and data from Okta
Product availability and licensing
The options available in the UI depend on your specific product license:
| Feature | Cloud Posture Security | Cloud Runtime Security | Cortex XDR Cloud | Cortex XSIAM NG SIEM, Cortex XSIAM Enterprise, and Cortex XSIAM Premium | Cortex XSIAM Enterprise Plus |
|---|---|---|---|---|---|
| Collect Logs | Enabled | Enabled with Data Collection add-on | Enabled with Data Collection add-on | Enabled | Enabled |
| Collect Configuration | Enabled | Enabled | Enabled with Cloud Posture Security or Cloud Runtime Security add-on | Enabled with Cloud Posture Security or Cloud Runtime Security add-on | Disabled |
Administrator privileges: Your Okta user must have a role capable of creating API tokens, such as Read-only Administrator, Super Administrator, or Organization Administrator. For more information, see the Okta Administrators Documentation.
To receive logs and configuration data from Okta, configure the Data Sources & Integrations settings. Once enabled, the system immediately begins ingesting activity logs and identity configuration metadata, according to your configuration settings.
Activity logs are searchable using the Cortex Query Language (XQL). For more information, see Perform advanced Identity Security investigations using XQL.
Configuration data is used for Identity Security visibility and is searchable in Identity Security → Identity Asset Inventory and using the ciem_permissions_with_last_access dataset.
API rate limits and monitoring
The Okta API enforces concurrent rate limits. To prevent service disruption:
- The Okta data collector includes a mechanism that automatically reduces the amount of requests whenever an error is received from the Okta API indicating that too many requests have already been sent.
- To ensure you are notified when this occurs, an alert is displayed in the Notification Area and a record is added to the Management Audit Logs.
How to configure the Okta collection?
Step 1: Configure Okta for integration
The same Okta domain, API token, and permissions are used for both log and configuration collection, as both features utilize the same Okta API.
Perform these steps in your Okta Admin Console to prepare for the connection.
-
Identify your Okta Domain:
- From the Okta Dashboard, click the down arrow under your name in the top-right corner.
- Copy the Org URL, such as
https://example.okta.com, and save it for the Okta Domain field in Cortex Cloud.
For more information, see the Okta Documentation.
-
Obtain your authentication token in Okta:
- Select Security → API → Tokens, and click Create token.
- Set the following parameters for the token:
- What do you want your token to be named?: Specify the name for your token, which is used for tracking API calls.
- API calls made with this token must originate from: Select Any IP.
- Click Create token. You may need to login to Okta again using your MFA administrator credentials.
- Your token is successfully created. Copy the Token Value and record it immediately. You will need this for the TOKEN field in Cortex Cloud. Once you close the dialog box by clicking Ok, got it, you won't be able to access the token again and will have to create a new one if you didn't record it.
Step 2: Configure the Okta Collector in Cortex Cloud
- Select Settings → Data Sources & Integrations.
- On the Data Sources & Integrations page, click + Add New, search for Okta, then hover over it and click Add.
- Integrate the Okta authentication service with Cortex Cloud:
- Enter the Okta Domain (Org URL) and Token obtained in Step 1.
- Collect Logs: Select this option to ingest activity logs.
- (Optional) Define an Event Filter to configure collection for events of your choosing.
- All events are collected by default unless you define an Okta API Filter expression, such as
filter=eventType eq “user.session.start”. - For Okta information to be woven into authentication stories,
“user.authentication.sso”events must be collected.
- All events are collected by default unless you define an Okta API Filter expression, such as
- Collect Configuration: Select this option to provide deep visibility into identities and permissions, offering comprehensive insights into users, user groups, and applications. It specifically highlights the permissions granted to Okta users in cloud environments, centralizing group memberships to secure your identity landscape.
- Test the connection.
- Click Enable.
Step 3. Accessing the data
Data is routed differently depending on which collection option is enabled:
Activity Data (using Collect Logs)
- XQL: Searchable using the Cortex Query Language (XQL). For more information, see Perform advanced Identity Security investigations using XQL.
Configuration data (using Collect Configuration)
- Identity inventory: Access the data in the Identity Asset Inventory within the Cortex Cloud Identity Security module (Identity Security → Identity Asset Inventory).
- XQL: Use the following dataset for CIEM (Cloud Infrastructure Entitlements Management) visibility:
ciem_permissions_with_last_access
Enable inactive human identity logs on Azure in Cloud Identity Security
Requires a Cloud Posture Security, Cloud Runtime Security, or Cortex XSIAM Premium license.
To enable inactive human identity logs on the Microsoft Azure platform in Cloud Identity Security, you must first configure diagnostic settings for the SignInLog log types. These log types provide information regarding how long human identities have been signed in.
To configure the SignInLog log types, do the following:
- Open the Azure console.
- Navigate to the Diagnostic settings screen.
- In the Logs area, under Categories, select the following categories that are related to sign-in logs:
- SigninLogs
- NonInteractiveUserSigninLogs
- ServicePrincipalSigninLogs
- ManagedIdentitySigninLogs
- ADFSSigninLogs
- Click Save.
Note
For more information, see Ingest logs from Microsoft Azure Event Hub.
Manage RBAC and SBAC in Cloud Identity Security
Requires a Cloud Posture Security, Cloud Runtime Security, or Cortex XSIAM Premium license.
Grant role-based access control (RBAC) to a user in Cortex XSIAM
Role-based access control (RBAC) helps manage access to Cloud components and Cortex Query Language (XQL) datasets, so that users, based on their roles, are granted the minimal access required to accomplish their tasks.
There are two out-of-the-box roles in Cloud Identity Security that you can use to grant access only to the areas that are relevant for those working with Cloud Identity Security:
- Identity Security Administrator: Has full access to all general administrator and Identity Security capabilities for AWS, Azure, GCP, and OCI.
- Identity Security Viewer: Can view most Identity Security features and edit reports for AWS, Azure, GCP, and OCI.
For information about managing access for Cloud Identity Security users, see Set up users and roles.
Important
You can use the Cloud Identity Security RBAC roles to define access to the various sections and functionalities of Cloud Identity Security, but these roles do not directly control the specific data a user sees within those sections. Data visibility is further refined and limited by scope-based access control (SBAC) capabilities.
How scope-based access control (SBAC) works in Cloud Identity Security
Scope-based access control (SBAC) refines RBAC permissions by granting access only to the relevant data that a user requires for their designated role. Users having Access Management permission apply scopes in Cloud to limit the data and content that users can be granted access to. These are divided into different scoping areas, including assets, cases and issues, and endpoints, which can be applied as relevant to the enforcement area or entity. For more information about user scopes, see Manage user scope.
Access table display behavior
The access table of an asset is displayed to users whose scope includes that specific asset. However, if this access table also lists other assets that are not within the user's defined scope, the entire table is still visible in order to ensure that the user has a full understanding of the asset being reviewed. In such cases, if the user attempts to click on an asset that falls outside their scope, an empty asset page is displayed.
For more information about assets, see Asset management.
Define SBAC policies
In the Cloud Identity Security area, we strongly recommend using scopes such as Cloud Provider type, Account (Tenancy in OCI), or Region when defining your SBAC policies for the Cloud Identity Security module. Using scopes that are based on asset types (such as restricting according to specific EC2 instances or Amazon S3 buckets) as your primary or sole scope can influence the effectiveness of your SBAC policies for the following reasons:
-
Interconnected permissions: Permissions in cloud environments often involve more than one asset type. For example, a single permission might grant access to an Amazon S3 bucket or to an EC2 instance also includes an related IAM (execution) role of the instance. This is why limiting the user scope to a specific asset type is not recommended when permissions are involved.
In OCI, a policy might grant a dynamic group permissions to manage resources within a specific compartment. If your scope is limited only to a single resource (like a specific database) and excludes the associated dynamic group or the parent compartment, you may not see the full context of how access is granted.
-
Partial visibility: Cloud Identity Security displays a permission if even one of the assets involved in that permission is not part of the user's defined scope. This ensures that users have sufficient context, even if not all associated assets are within their direct view.
Work with SBAC-related datasets
For investigating Identity Security permission data, Cloud provides one principal dataset: ciem_permissions_with_last_access.
For more information about this dataset, see Perform advanced Identity Security investigations using XQL. This dataset supports your defined SBAC policies. Users accessing this dataset will be able to see permission data that falls within their assigned scope.
Network exposure detection
Cortex XSIAM improves network security posture in your public cloud environments. It identifies assets exposed to the internet so you can prioritize and remediate risks.
Cortex XSIAM publishes network exposure findings and issues based on out-of-the-box and custom cloud security rules and policies. Security teams can review these findings and issues to gain visibility into network exposures, finding answers to the following questions:
- Which assets are exposed to the internet?
- Which assets can connect to the internet?
- Which assets can communicate across VPCs or cloud accounts?
- Which protocols, ports, or services are exposed to the internet?
- What is the network path between the source and destination?
What is Cloud Network Analyzer?
Cloud Network Analyzer (CNA) in Cortex XSIAM determines which assets—such as virtual machines, databases, containers, and serverless functions—are exposed to the internet, have unrestricted access to the internet, or can laterally move within a cloud account.
CNA creates an internal network topology to map the path between the internet and the asset. This map provides insights about existing network security controls, including security groups and internet gateways.
CNA helps you identify the following:
- Workloads exposed to access from the internet
- Workloads that have unrestricted outbound access to the internet
- Overly permissive security groups attached to sensitive workloads
- Production applications connected to testing or staging environments between cloud accounts or VPCs
- Object storage buckets with sensitive data exposed through network connectivity to external cloud accounts or networks
- Kubernetes services exposed to access from the internet, their underlying endpoints, and associated deployments
Detection capabilities: inbound, outbound, east-west
CNA detects which assets are exposed to the internet, have unrestricted access to the internet, or can laterally move within a cloud account. CNA supports three types of internet exposure detection:
- Inbound: Data or requests entering your network from external sources
- Outbound: Data or requests leaving your network to external destinations
- East-west: Data or requests moving laterally within your network
Inbound exposure detection is referred to as “Internet exposure detection” in this documentation.
Internet exposure detection
CNA detects assets that are exposed to unrestricted public network access. It uses three different methods to determine if an asset is exposed to the internet:
- Checks whether a routing path exists from source to destination.
- Verifies the effectiveness of all cloud-native network security policies in the path.
- Checks inbound reachability from the internet.
When CNA identifies an asset that is potentially exposed to the internet, it requests confirmation from an external scanning service. After the external scan finishes, CNA publishes network exposure findings and issues, as well as an internal network topology to map the path between the internet and the asset. You can review this information and mitigate risks.
External network scanning service
When CNA determines that an asset is potentially exposed to the internet, it forwards the public IP address or a fully qualified domain name (FQDN) to the external scanning service. The service verifies whether the IP or FQDN already exists in its database. If a match is found, the service notifies CNA and sends the additional information retrieved by the scan. The scan covers the entire internet rather than a subset of IP addresses owned by Cortex Cloud customers.
The following diagram illustrates what happens when CNA examines a virtual machine:
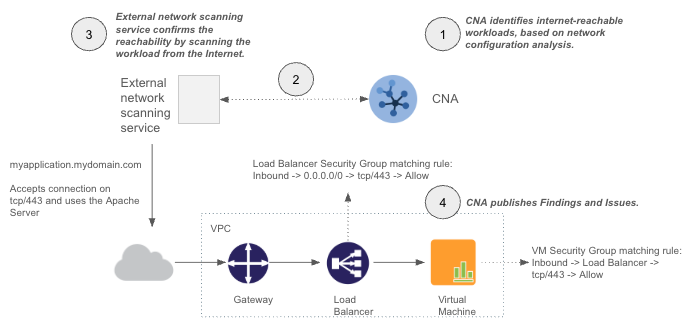
As illustrated in the diagram:
- CNA analyzes the network configuration and determines that the virtual machine is reachable from the internet.
- CNA passes the public IP address, FQDN, protocol, and port information to the external network scanning service.
- The external network scanning service confirms whether the asset’s public IP address or FQDN is reachable from the internet.
- If the virtual machine is exposed to the internet, CNA publishes findings and issues with additional information such as asset information, network path, and remediation guidance.
External scanning service details
The external network scanning service scans the entire internet CIDRs two times a day to identify assets that are exposed to the internet. The service is CFAA compliant and unintrusive. It establishes a session to each exposed IP address and collects the minimum amount of information required for CNA to validate the exposure.
The external network scanning service collects the following information:
| Information type | Examples |
|---|---|
| Protocol and port | tcp/80, tcp/443, tcp/22 |
| Server information (Service or daemon connected to an exposed port) | Apache, Microsoft IIS, OpenSSH |
If the exposed asset is a web service, the external network scanning service also collects HTTP server response code details. If an IP address or an FQDN does not respond to requests, the service retries in the next scanning cycle.
Scanned ports
The external network scanning service scans the following protocols and ports.
The following list of ports and protocols is not exhaustive. For current and complete lists, contact your customer success team.
- Protocols: FTS, FTP, HTTP, POP3, Postgres, RDP, SSH, SSL, TCP, Telnet, UDP, VNC, XMPP
- Ports: 0, 20, 21, 22, 23, 25, 53, 67, 68, 80, 81, 82, 83, 88, 110, 111, 118, 123, 135, 137, 138, 139, 143, 161, 179, 389, 401, 443, 444, 445, 465, 500, 502, 554, 587, 593, 808, 873, 888, 943, 987, 990, 993, 995, 1000, 1024, 1025, 1026, 1028, 1112, 1234, 1250, 1433, 1434, 1443, 1521, 1717, 1723, 1900, 1911, 2001, 2002, 2078, 2080, 2082, 2083, 2084, 2085, 2086, 2087, 2096, 2121, 2160, 2161, 2222, 2323, 2443, 2483, 2484, 2525, 3000, 3052, 3306, 3333, 3388, 3389, 3390, 3443, 3493, 3905, 3909, 3917, 3929, 3975, 3978, 4002, 4100, 4117, 4172, 4343, 4430, 4433, 4443, 4444, 4500, 4506, 4567, 4786, 4911, 5000, 5001, 5060, 5061, 5222, 5269, 5351, 5353, 5432, 5443, 5555, 5632, 5800, 5900, 5901, 5902, 5903, 5904, 5905, 5906, 5907, 5908, 5909, 5910, 5916, 5984, 5985, 5986, 6001, 6002, 6363, 6379, 6443, 7001, 7080, 7170, 7443, 7547, 7777, 8000, 8005, 8008, 8009, 8010, 8015, 8020, 8080, 8081, 8082, 8083, 8085, 8088, 8090, 8094, 8139, 8140, 8159, 8194, 8195, 8196, 8197, 8198, 8209, 8210, 8211, 8212, 8213, 8214, 8215, 8216, 8217, 8218, 8219, 8220, 8282, 8290, 8291, 8292, 8293, 8294, 8333, 8443, 8444, 8530, 8531, 8800, 8880, 8887, 8888, 8899, 8991, 8999, 9000, 9002, 9042, 9080, 9091, 9092, 9100, 9200, 9418, 9443, 9444, 9595, 9983, 9997, 10000, 10010, 10443, 11211, 11495, 11553, 12345, 16010, 17185, 17516, 17778, 18080, 18574, 20249, 21242, 22460, 25789, 25827, 27017, 28080, 30005, 30006, 30010, 30083, 30303, 32400, 37443, 37777, 38080, 38520, 40000, 40005, 42713, 44344, 44818, 47001, 47693, 47808, 49501, 49502, 50001, 50067, 50070, 50580, 50805, 50995, 50996, 50997, 51005, 51007, 51200, 51401, 52200, 52311, 52590, 52869, 53300, 53524, 53631, 54041, 54498, 54528, 55918, 56222, 58000, 58603, 60000, 60243, 60443, 61337, 62078
External scan IP ranges
The external network scanning service uses the following IP ranges. Exclude these IP ranges from anti-scanning rules.
- 35.203.210.0/24
- 35.203.211.0/24
- 144.86.173.0/24
- 147.185.132.0/24
- 147.185.133.0/24
- 162.216.149.0/24
- 162.216.150.0/24
- 172.105.147.0/24
- 198.235.24.0/24
- 205.210.31.0/24
Internet exposure rules
Cortex XSIAM includes out-of-the-box internet exposure rules and allows you to define custom internet exposure rules. See Create a Network Exposure Rule.
Supported asset types
CNA detects internet exposure for the following cloud services and asset types:
| Provider/ Service | AWS | Azure | GCP |
|---|---|---|---|
| Managed virtual machines | <ul><li>Amazon EC2</li></ul> | <ul><li>Azure Virtual Machines</li></ul> | <ul><li>GCP Compute Instances</li></ul> |
| Managed databases | <ul><li>RDS</li><li>Redshift</li></ul> | <ul><li>Azure SQL</li><li>Azure Database for Postgresql</li><li>Azure Database for MySQL</li><li>Cosmos DB</li></ul> | – |
| Serverless functions | <ul><li>AWS Lambda</li></ul> | – | – |
| Managed Kubernetes | <ul><li>EKS (Services behind load balancer and ingress)</li></ul> | <ul><li>AKS (Services behind load balancer and ingress)</li></ul> | <ul><li>GKE (Services behind load balancer and ingress)</li></ul> |
CNA supports Kubernetes containers exposed to the internet behind a load balancer or behind an ingress.
Internet exposure detection for Kubernetes services
CNA detects workloads exposed to the internet in Kubernetes clusters using Kubernetes configuration analysis and external scanning. The workloads must meet these requirements:
- Kubernetes clusters must be onboarded to Cortex XSIAM as described in Onboard the Kubernetes Connector.
- Managed Kubernetes offerings in AWS (EKS, ROSA), Azure (AKS, ARO), and GCP (GKE) are supported.
- Supported workloads include ReplicaSet, Deployment, DaemonSet, StatefulSet, and CronJob.
A workload is considered reachable from the internet when the following criteria are met:
- The Kubernetes workload is exposed behind a load balancer or an ingress.
- Kubernetes network policies permit inbound traffic.
Internet exposure detection for instances deployed behind a Palo Alto Networks Next-Generation firewall
CNA detects inbound exposure of workloads deployed behind a Palo Alto Networks Next-Generation firewall (NGFW). To scale security appliances in AWS, you can use Gateway Load Balancers (GWLBs) for "transparent" firewall deployments where AWS encapsulates/decapsulates traffic. This topology is considered isolated or distributed, since the firewall deployment is “embedded” within the VPC.
The following diagram illustrates a network topology supported by CNA:
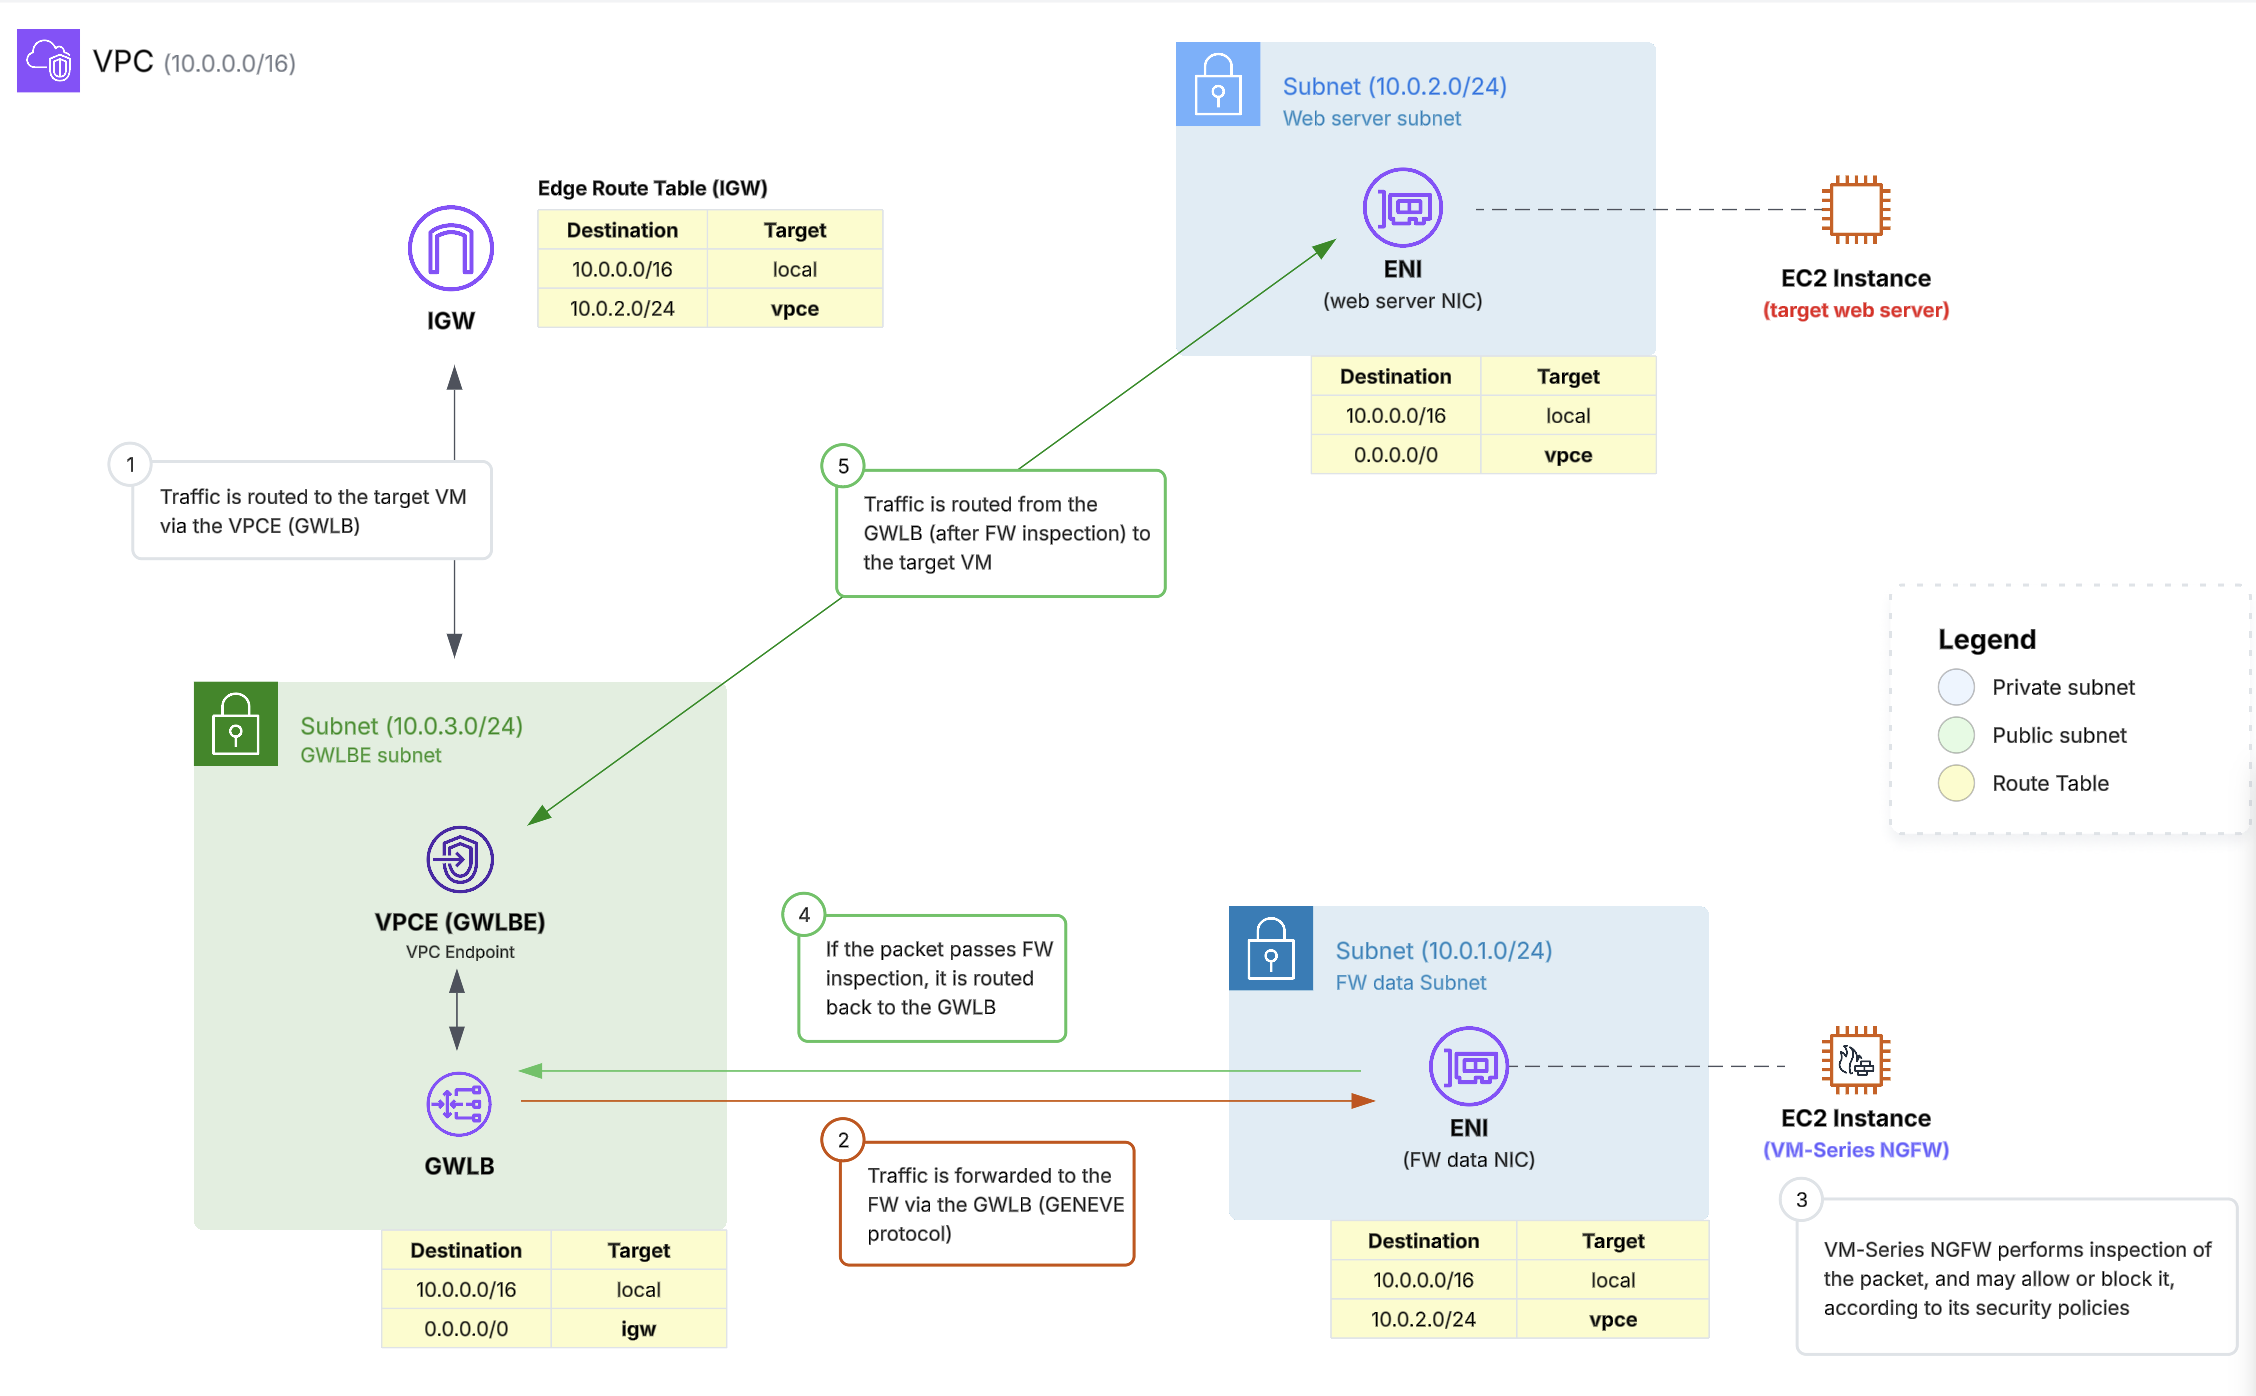
The example network topology includes a single VPC where traffic to the target web server (top right) is forced to go through the GWLB (and thus through the NGFW VM-Series instances) to allow firewall inspection of the incoming and outgoing traffic. In a real-life scenario, there may be several firewall instances in the GWLB target group; however, for brevity, the diagram only shows one. The firewall EC2 instance itself (bottom right) is detected as a NGFW based on its image.
Cortex XSIAM analyzes your VPC topology and verifies that it is similar to the one described in this example. Next, it verifies that the GWLB target group instances are NGFW VM-Series instances.
Currently, CNA supports only an isolated architecture with an AWS Gateway Load Balancer (GWLB) within a single VPC. Other more centralized topologies including one security VPC that forwards traffic to other workload VPCs are currently not supported.
Internet exposure detection for instances deployed behind AWS WAF
CNA detects inbound exposure of workloads deployed behind an AWS Web Application Firewall (AWS WAF). AWS WAF is a managed web application firewall service that can be associated with an Application Load Balancer (ALB) to inspect and filter incoming HTTP/HTTPS traffic based on configurable security rules (Web ACLs).
The following diagram illustrates a network topology supported by CNA:
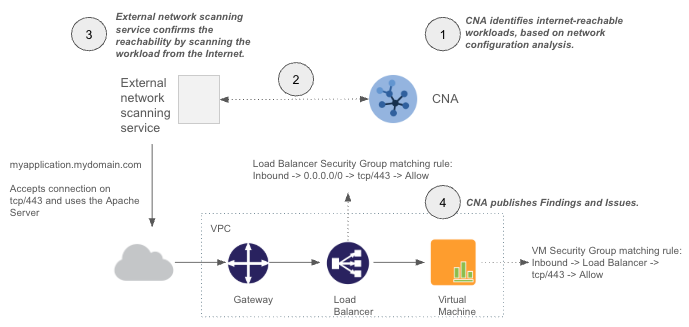
The example network topology includes a VPC where traffic to the target web server (top right) is forced to go through the AWS WAF Web ACL, which inspects incoming HTTP/HTTPS requests before they are forwarded by the ALB to the target instance.
Cortex Cloud analyzes your VPC topology, identifies ALBs with associated WAF Web ACLs, and includes the WAF as a protective node in the exposure path. Workloads behind a WAF-protected ALB are marked as protected by a firewall in the exposure findings.
Outbound exposure detection
CNA supports outbound internet exposure detection. If CNA detects a workload that based on their security configurations has unrestricted internet access, CNA generates a finding.
This helps you determine which assets have potentially unrestricted access to the internet, taking into account the effect of cloud native security controls, network firewalls and NAT gateways. It allows you to:
- Visualize the complete network path of an asset from source to destination.
- Periodically re-validate the status of an exposed asset.
- Find which security group or firewall rule is causing the exposure.
Outbound exposure rules
Outbound exposure rules do not have out of the box rules, but you can create custom ones. See Create a Network Exposure Rule.
Supported asset types
CNA can detect outbound internet exposure in the following cloud services and asset types:
| Provider/ Service | AWS | Azure | GCP |
|---|---|---|---|
| Managed virtual machines | Amazon EC2 | – | – |
East-west exposure detection
CNA supports east-west exposure detection. The east-west exposure detection capability allows CNA to detect VMs that have unrestricted access across their VPC in the same cloud account. This strengthens the visibility and security of your cloud environments by providing insights on which assets can access resources on different VPCs, namespaces, and cloud accounts. You can also find out details about an asset that is exposed to the internet, such as whether that asset can establish network sessions in violation of a compliance regulation.
This helps you determine which assets have potentially unrestricted access to the other internal resources, taking into account the effect of cloud native security controls, network firewalls, VPC peerings, and Kubernetes network security policies and transit gateways. This allows you to:
- Visualize the complete network path of an asset from source to destination.
- Periodically re-validate the status of an exposed asset.
- Find the security group, Kubernetes network security policy, or firewall rule causing the exposure.
East-west exposure rules
East-west exposure rules do not have out of the box rules, but you can create custom ones. See Create a Network Exposure Rule.
Supported asset types
CNA can detect east-west exposure in the following cloud services and asset types:
| Provider/ Service | AWS | Azure | Azure |
|---|---|---|---|
| Managed virtual machines | Amazon EC2 | – | – |
Investigate an internet exposure
You can investigate assets exposed to the internet by reviewing issues detected by Cloud Network Analyzer or by using Graph Search.
Investigate internet exposure issues
Review internet exposure issues to learn which assets are exposed to the internet. You can find internet exposure issues under Cases & Issues.
- Go to Cases & Issues.
- Select the Detection Method filter and then select the Cloud Network Analyzer as the Detecting Engine.
- Select a specific issue to investigate. You can review:
- Affected asset
- Policy that triggered the exposure
- Exposure details (Public IP, FQDN, protocol, port, and HTTPs response code)
- Exposure path
-
From an issue, you can navigate to a specific affected asset and investigate further by clicking on the Network tab. The Network tab provides in-depth visibility over specific network details and internal network reachability:
NOTE:
The Network tab is currently only available for virtual machines.
NOTE:
The Network tab is only displayed when you have access to the main asset and associated ones, such as security groups, VPCs and subnets. For more information on Scope-Based Access Control (SBAC) for configuring granular scoping, see Manage user scope.
- Networking Details: Access details such as where the VM is deployed, connected subnets, and associated network security controls. Review a visual representation of the asset and all the private IPs connected to it.
- Networking Security Rules: An interface to investigate the network rules associated with the asset.
Investigate internet-exposed assets using Graph Search
You can use What is Graph Search? to search for and investigate internet-exposed assets.
- Go to Investigation and Response → Search → Query Builder → Graph Search.
- Define a query that finds selected assets where Internet Exposed = True:
- Select one or more specific asset types that are supported by CNA exposure detection, such as a Virtual Machine or a Kubernetes Workload.
- Add a condition WHERE Internet Exposed = True.
- Click Search.
- Click on an object and then click on View Details to view details of the asset.
-
Investigate further by clicking on the Network tab. The Network tab provides in-depth visibility over specific network details and internal network reachability:
The Network tab is currently only available for virtual machines.
The Network tab is only displayed when you have access to the main asset and associated ones, such as security groups, VPCs and subnets. For more information on Scope-Based Access Control (SBAC) for configuring granular scoping, see Manage user scope.
- Networking Details: Access details such as where the VM is deployed, connected subnets, and associated network security controls. Review a visual representation of the asset and all the private IPs connected to it.
- Networking Security Rules: An interface to investigate the network rules associated with the asset.
Configure trusted IPs
You can define specific public IP ranges (CIDR blocks) that belong to your company, partners, or trusted services. By designating these networks as "trusted," the system will exclude them from Cloud Network Analyzer (CNA) internet exposure evaluations. This prevents assets from being flagged as "internet exposed" when they are only accessible to known and trusted external networks, reducing unnecessary security findings and noise.
The following restrictions apply when defining trusted networks:
- You must provide a valid public IPv4 address.
- Only public CIDR blocks are supported. CIDR blocks must not be within the RFC 1918 private network range.
Add a trusted network
You can define a trusted network by specifying and describing an external IPv4 address range or by uploading a CSV file with IP address ranges.
- Navigate to Inventory → Network Configuration → Trusted Networks.
- Click the +Add trusted networks and choose one of the following methods:
- Create New: Specify Name, Description (Optional) and single valid public IPv4 CIDR range.
- Upload from File: You can bulk-upload ranges using a CSV file. The file must follow the format presented in the example below. You can also download the example file from the UI.
- Click Update to save the trusted network.
Once it is saved, the specified network is automatically considered by CNA as a trusted network.
CSV file example
The CSV file should look similar to the following, with one external network per line:
Name,CIDR Range,Description My Network 1,200.0.0.0/8,Example description Another Network 2,200.0.0.0/24,Another example
Edit a trusted network
To modify an existing configuration, navigate to Inventory → Network Configuration → Trusted Networks, right-click the configuration, and then select Edit.
Delete a trusted network
To delete a configuration, navigate to Inventory → Network Configuration → Trusted Networks, right-click the existing entry, and select Delete.
Cortex Cloud SaaS Security
Software-as-a-Service (SaaS) environments optimize end-user workflows through rapid provisioning and native collaboration capabilities. However, this decentralized architecture presents a significant visibility challenge for cybersecurity.
Your security teams have to contend with the difficult task of managing this proliferation of both sanctioned and unsanctioned applications, while ensuring consistent cloud compliance and mitigating risks to critical information and users.
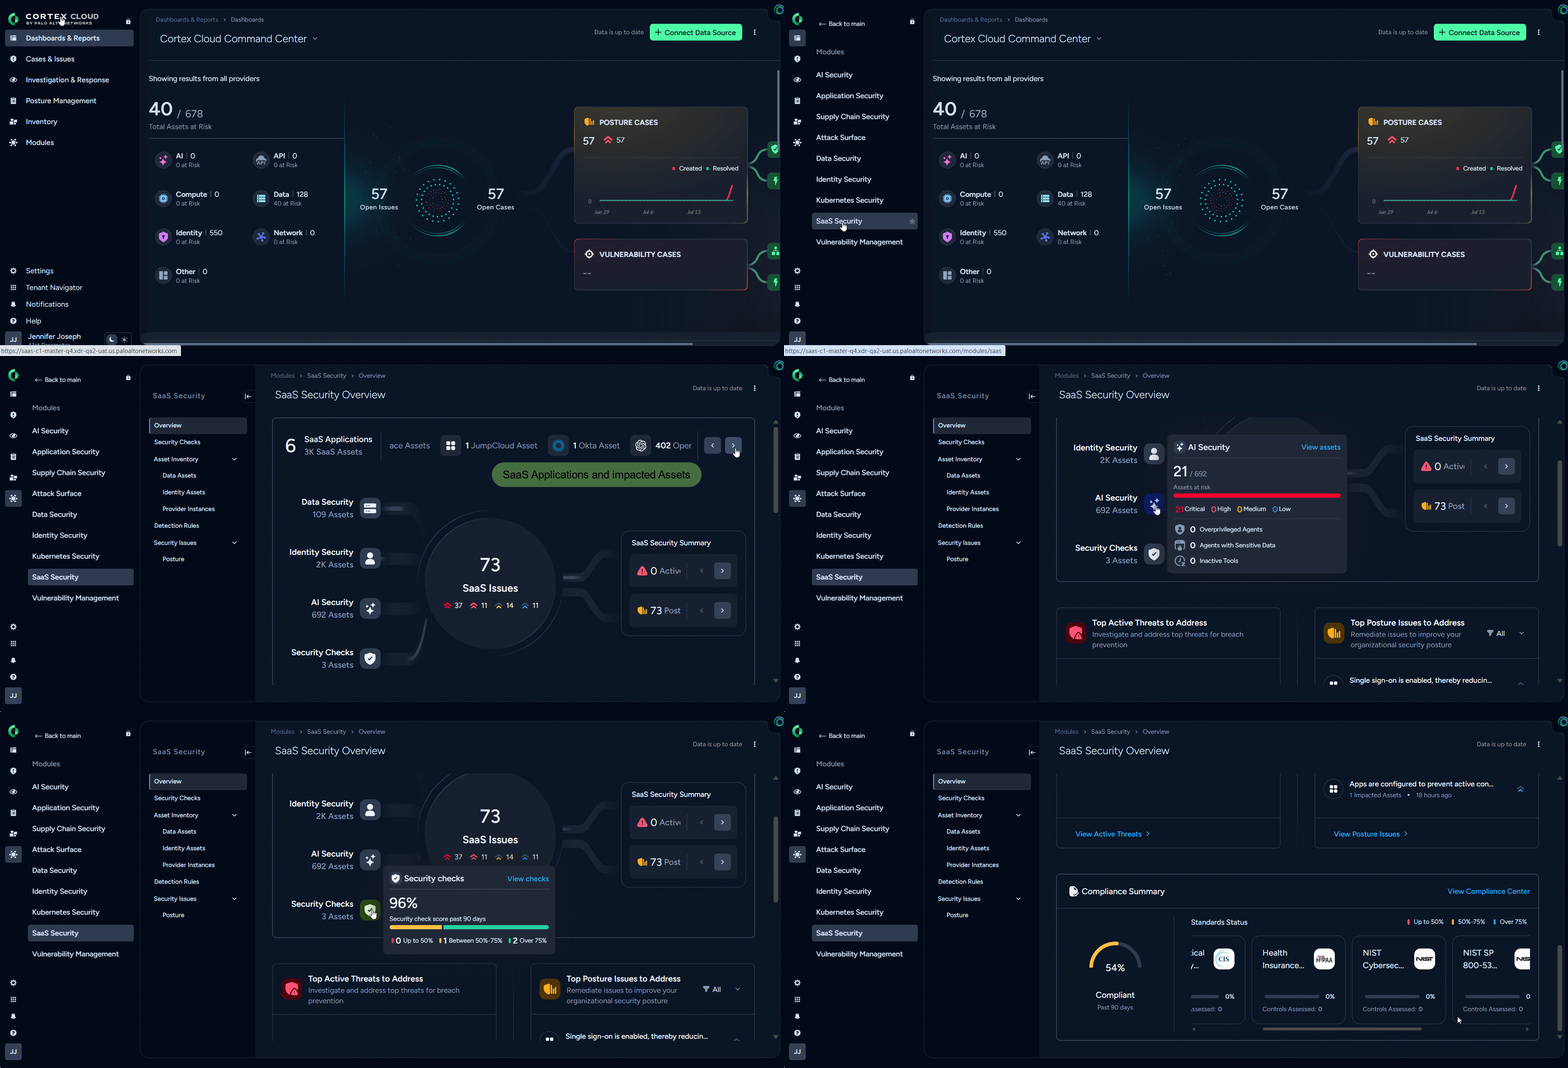
Note: SaaS Security is currently in Beta with limited availability. Contact your Customer Service Representative to activate SaaS Security in your environment.
SaaS Security offers a robust framework that:
- Delivers full visibility into security misconfigurations and ensures continuous hardening of the SaaS environment.
- Defends cloud applications against both identified and emerging threats.
- Ensures data protection and compliance across the entire SaaS environment.
- Restricts corporate application access to authorized individuals only.
- Hardens AI agent deployments to mitigate risks like prompt injections and unauthorized data movement.
\
To deliver these outcomes, the platform utilizes the following pillars:
- Implement SaaS Security Checks for continuous oversight of security configurations.
- Apply SaaS Agent Security for automated enforcement and visibility of AI agents on platforms such as Salesforce and Microsoft Copilot.
- Deploy Data Security for deep inspection and remediation of at-rest assets within sanctioned environments.
- SaaS Identity Security gives you the tools to implement Zero Trust access controls to defend against malicious insiders and sophisticated threat actors.
- SaaS Threat Security proactively identifies anomalous behaviors and simplifies monitoring with user risk scores and predefined situational policies.
Setup SaaS Security
Learn more about how SaaS security can help your security team reliably manage usage policies, close visibility gaps, and secure sensitive data housed across your entire cloud portfolio.
| Get Started with SaaS Security | <ul><li><p>Required Cortex License - SaaS Security requires one of the following Cortex Licenses:</p><ul><li>Cortex XSIAM</li><li>Cortex Runtime Security</li><li>Cortex Posture Security</li></ul></li><li>Allow List of IP Addresses - Ensure that you have whitelisted the required IPs to ensure optimal onboarding and connectivity.</li></ul> |
|---|---|
| Configure SaaS Security | <ul><li>Onboard a Supported SaaS Application</li><li><p>SaaS Security</p><ul><li>SaaS Security Overview</li><li>SaaS Security Checks</li><li>Provider Instances Security Check</li><li>Remediation Actions</li><li>Detection Rules</li><li>Create and monitor tickets</li></ul></li></ul> |
*
Connect a SaaS application
To detect posture risks, applications must first be connected to Cortex SaaS Security and have the necessary permissions to scan SaaS application settings. During data connection, Cortex SaaS Security prompts you for the configuration information required to establish a connection with the SaaS app. The configuration information that SaaS Security requires differs from app to app, and you might need to collect configuration information prior to onboarding.
When you connect an application you may also be prompted to provide required for application connection, such as administrator credentials for a service account. The required information varies, and in many cases you must first take some actions on the SaaS app, such as creating an API key.
The following table provides links to detailed connection instructions for most applications. Where detailed instructions are not available for a particular SaaS application, the table includes the relevant onboarding steps.
| SaaS app connection steps |
|---|
| Aha.io |
| Asana |
| Atlassian |
| Automox |
| BusinessMap |
| Celonis |
| Cisco Duo |
| Cisco Meraki |
| Clickup |
| Contentful |
| Couchbase |
| Coveo |
| Databricks |
| DataDog |
| Gainsight |
| Grammarly |
| Harness |
| Intercom |
| Jamf Pro |
| Jumpcloud |
| Kustomer |
| Microsoft Entra |
| Monday |
| MongoDB |
| Mulesoft |
| Mural |
| <p>Nintex Workflow Cloud </p><p>Complete the following steps to connect to a Nintex Workflow Cloud API:</p><ol><li>Log in to a Nintex Workflow Cloud account that is assigned to the Global administrator role.</li><li>From the Apps and Tokens page in your Nintex Workflow Cloud settings, add an app.</li><li>Copy the Client ID and the Client Secret that is associated with your app.</li><li>During onboarding, provide the Client ID and the Client Secret that is associated with your app.</li></ol> |
| Office365 |
| Okta |
| Pagerduty |
| <p>Ping Identity </p><p>Complete the following steps to enable to connect a Ping Identity API:</p><ol><li>Log in to Ping Identity as an administrator assigned to either the Organization Admin or Environment Admin role.</li><li>Create a Ping Identity worker application, which will inherit your role assignments and enable access to the API. Copy the application's Client ID and Client Secret.</li><li>Copy your Environment ID and Region, which are shown on your environment page in Ping Identity.</li><li><p>During onboarding, provide the following information:</p><ul><li>The Client ID and Client Secret of the worker application</li><li>Your Environment ID and Region</li></ul></li></ol> |
| <p>Pipedrive </p><p>Complete the following steps to connect to a Pipedrive API:</p><ol><li>Log in to Pipedrive as an administrator and copy the administrator's personal API token.</li><li>During onboarding , provide the API token.</li></ol> |
| <p>Qualtrics </p><p>Complete the following steps to enable configuration information access through an administrator account. Your organization must be using Okta as an identity provider. MFA using one-time passcodes must be configured.</p><ol><li>Identify the Qualtrics XM administrator whose credentials you will supply to SSPM. The account must have Brand Administrator authority.</li><li><p>To enable SSPM to access the account using Okta credentials:</p><ol><li>Identify your Okta subdomain.</li><li>Generate and copy an MFA secret key.</li></ol></li><li>Identify your Organization ID. After you log in to Qualtrics XM, your organization ID is included in the Qualtrics XM URL. The URL format is <org-ID>.qualtrics.com.</li><li>Identify your SSO display name. To get the display name, go to AdminOrganization> SettingsSSO and open the Edit page for the SSO connection.</li><li>During onboarding, provide the information above.</li></ol> |
| Redis Labs |
| Salesforce |
| SAP Ariba |
| Sentryio |
| ServiceNow |
| Shopify |
| Slack |
| <p>Splunk </p><p>Complete the following steps to enable access to configuration information through an administrator account. Your organization must be using Okta as an identity provider. MFA using one-time passcodes must be configured.</p><ol><li>Identify the Splunk administrator whose credentials you will supply to SSPM.</li><li><p>To enable SSPM to access the account using Okta credentials:</p><ol><li>Identify your Okta subdomain</li><li>Generate and copy an MFA secret key</li></ol></li><li>Identify your Splunk app domain, which is a subdomain included in the Splunk Cloud URL. The URL format is <app_domain>.cloud.splunk.com or <app_domain>.splunkcloud.com.</li><li>During onboarding, provide your organization's Okta domain, the administrator credentials, the MFA secret key, and the Splunk app domain.</li></ol> |
| sumologic |
| <p>VMware </p><p>Complete the following steps to to connect to a VMWare API.</p><ol><li>Log in to VMWare Cloud Services using an account that is assigned to the Organization Owner role.</li><li><p>Generate and copy an API token for the organization. Configure the API key to these specifications:</p><ul><li>Limit Organization Roles access to the Organization Owner role.</li><li>Limit Service Roles to Skyline Advisor.</li><li>Select the OpenID scope.</li><li>(Optional) Select the email preference option to be notified when the token is about to expire.</li></ul></li><li>Copy your Organization ID, which you can access from your profile.</li><li>(Optional) Activate MFA for tokens that are associated with the account, and copy the MFA secret key for the account.</li><li>During onboarding, provide the API token and your organization ID. If you configured MFA for tokens, also provide your MFA secret key.</li></ol> |
| Workday |
| Wrike |
| Youtrack |
Onboard Asana
For SaaS Security to detect posture risks in your Asana instance, you must onboard your Asana instance to SaaS Security. Through the onboarding process, SaaS Security connects to the Asana API by using an API token that you generate from the Asana admin console. After connecting to the Asana API, SaaS Security scans your Asana workspace for misconfigured settings and account risks.
The supported Asana account plans for SaaS Security scans are:
- Enterprise+
- Legacy Enterprise
To access your Asana instance, SaaS Security requires the following information, which you specify during the onboarding process.
| API Token | A service account token that Asana generates for a service account that you create. The token is an alphanumeric string that SaaS Security uses to authenticate to the Asana API and leverage the service account's permissions. |
| --------- | -------------------------------------------------------------------------------------------------------------------------------------------------------------------------------------------------------------------------------- |
To onboard your Asana instance, complete the following actions.
Step 1: Create a Service Account in Asana and Save the Token
An Asana service account is a non-human, programmatic identity that SaaS Security uses to scan your Asana workspace. When you create a service account, Asana generates and displays a service account token that SaaS Security uses to access the Asana API. Asana displays this token only once, so copy and save the token so you can provide it during onboarding.
- Open a web browser to the Asana website and log in as a Super Admin.
Note: To create an Asana service account, you must use an account assigned to the Super Admin role. Service accounts are an exclusive feature for organizations on Asana's Enterprise or Enterprise+ plans.
- Navigate to the Admin Console. Locate your profile picture in the upper-right corner of the Asana webpage and select <profile-picture> > Admin console.
- In the left navigation pane, select Apps > Service Accounts.
- On the Service Accounts page, click Add service account.
- Fill in the Add service account dialog:
- Specify a Name for the service account. For example, SaaS Security Service Account.
- Under Permission scopes, select Full permissions.
- Click Save changes to generate the service account token. Copy the service account token and paste it into a text file.
Important: Do not continue to the next step unless you have copied the service account token. You must provide this token to SaaS Security during the onboarding process.
Step 2: (Optional) Update the Token Expiration Period
By default, the lifespan for service account tokens in Asana is 10 years. To limit the attack window if the token becomes compromised, set service account tokens to expire after 90 days.
- From the left navigation pane in the Admin Console, select Apps > Service Accounts.
- On the App settings page, locate the Token Expiration settings.
- For When should service account tokens expire? setting, select 90 days.
- Click Save changes.
Step 3: Connect SaaS Security to Your Asana Instance
By adding an Asana app in Cortex, you enable SaaS Security to connect to your Asana instance.
- Log in to Cortex.
- Select Settings > Data Sources and Integrations > Add New. You can use the Search bar to find the app you want to connect to.
- Click the Asana tile.
- Under Capabilities, Enter a Name for your application.
- Select Security Posture under Default Capabilities and click Next.
- Under Connections, provide the Tenant ID, Client ID, and Client Secret.
- Under Configurations, select a Sync Interval. Choose a meaningful Tag to distinguish between various applications in different environments.
- Click Next to complete the onboarding validation process.
Onboard Atlassian
Connect an Atlassian instance to SaaS Security to detect posture and identity risks, and to enable third-party plugin scans for Jira and Confluence.
For SaaS Security to detect posture risks in your Atlassian instance, you must onboard your Atlassian instance to Cortex. Through the onboarding process, SaaS Security connects to an Atlassian API and, through the API, scans the Atlassian Administration settings for your organization. If there are misconfigured settings, SaaS Security suggests a remediation action based on best practices. SaaS Security also runs identity scans for account risks.
Note: Some of the Atlassian Administration settings that SaaS Security scans affect Jira and Confluence. These are high-level Atlassian Administration settings for your organization, and will differ depending on whether your organization has the free, Standard, or Premium versions of these products. To have SaaS Security scan settings at the Jira and Confluence level, you must onboard a Jira app and onboard a Confluence app.
If users have extended the capabilities of Jira and Confluence by installing third-party plugins, SaaS Security also detect the third-party plugins and the access that the plugins were granted. This information helps you determine the risks posed by third-party plugins so you can take action as needed. It is not necessary to onboard Jira and Confluence to SaaS Security to enable these third-party plugin scans.
To access your Atlassian instance, SaaS Security requires the following information, which you specify during the onboarding process.
| API Token | A token, generated by an Atlassian Org Admin, that enables SaaS Security to authenticate to the administrator account. |
|---|---|
| API Key | A key, generated by an Atlassian Org Admin, that enables SaaS Security to scan and update organization settings and user accounts. SaaS Security uses this key to identify and manage the third-party plugins that users have connected to Jira or Confluence. |
| Admin Email | The login email address of the Atlassian Org Admin who created the API token and API key. |
To onboard your Atlassian instance, complete the following actions.
Step 1: Generate and Copy an Administrator API Token
To authenticate to an administrator account using an Atlassian API, SaaS Security requires an administrator API token.
- Log in to Atlassian using Org Admin credentials.
- From the Atlassian account profile, navigate to the API tokens page. Select Security > Create and manage API tokens, or go directly to id.atlassian.com/manage-profile/security/api-tokens.
- Click Create API Token. A dialog prompts you to specify a label for the API token.
- Specify a label and click Create. Atlassian generates and displays your new API token.
- Copy the API token and paste it into a text file.\
Important: Do not continue to the next step unless you have copied the API token. You must provide this token to SaaS Security during the onboarding process.
Step 2: Generate and Copy an API Key for Your Organization
To identify and manage the third-party plugins that users have connected to Jira or Confluence, SaaS Security requires an API key generated from an administrator account. SaaS Security also requires this API key for identity scans.
- Log in to the Atlassian Admin Portal using Org Admin credentials.
- If you administer more than one Atlassian organization, select the organization you want SaaS Security to scan for third-party plugins.
- From the left navigation, select Organization settings > API keys.
- On the API keys page, click Create API key.
- On the Before you begin page, select API key without scopes and click Next.\
Note: You must select the API key without the scopes option. SaaS Security does not support scoped API keys. - In the Create an API key dialog, specify a name and an expiration date for the key and click Create. Atlassian generates and displays a new API key.
- Copy the API key and paste it into a text file.\
Important: Do not continue to the next step unless you have copied the API key. You must provide this key to SaaS Security during the onboarding process.
Step 3: Connect SaaS Security to Your Atlassian Instance
By adding an Atlassian app in Cortex, you enable SaaS Security to connect to your Atlassian instance for posture and identity scans. Connecting the Atlassian app also enables SaaS Security to scan for third-party plugins connected to Jira and Confluence.
- Log in to Cortex.
- Select Settings > Data Sources and Integrations > Add New. You can use the Search bar to find the app you want to connect to.
- Click the Atlassian tile.
- On the Capabilities page, Enter a Name for your application.
- Select Security Posture under Default Capabilities.
- Click Next.
- On the Connections page, enter the login email address of the Atlassian administrator who created the API token, and the API key.
- On the Configurations page, select a Sync Interval. Choose a meaningful Tag to distinguish between various applications in different environments.
- Click Next to complete the onboarding validation process.
Onboard Automox
For SaaS Security to detect posture risks in your Automox instance, you must onboard your Automox instance to Cortex. Through the onboarding process, SaaS Security connects to an Automox API by using an API key that you generate from the Automox console. After connecting to the Automox API, SaaS Security scans your Automox instance for misconfigured settings and account risks.
The supported Automox account plans for SaaS Security scans are:
- Automate Essentials
- Automate Enterprise
To access your Automox instance, SaaS Security requires the following information, which you specify during the onboarding process.
| API Key | A unique, alphanumeric string that you generate from an Automox account. SaaS Security uses the key to authenticate to the Automox API. The API key inherits the permissions of the Automox account. |
|---|---|
| Organization ID | A unique identifier for your organization within the Automox platform. |
To onboard your Automox instance, complete the following actions.
Step 1: Generate and Copy an API Key for Your Organization
- Identify the Automox account that you will use to create the API key.
Required Permissions: The account that you use to generate the API key must have the following permissions that SaaS Security requires. To adhere to the principle of least privilege, create a custom role with this exact set of permissions and assign it to the account. The API key inherits these permissions.
- Personal API Keys: Manage
- Organization: Read & Manage
- All API Keys: Read & List
- Groups: Read
- Patch Policy Management: Read
- User Management: Read
- Using the credentials of the account you identified, log in to the Automox console.
- Locate the settings menu icon (⋮) in the upper-right corner of the console and select Secrets & Keys.
- On the Secrets & Keys page, scroll to the API Keys section and click Add.
- Fill out the fields of the Create an API Key dialog and click Create. Automox adds the new key to the list of API keys.
- From the API key's entry in the list, click the copy icon to copy the key. Paste the key into a text file.
Note: Do not continue to the next step unless you have copied the API key. You must provide this key to SaaS Security during the onboarding process.
Step 2: Identify Your Organization ID
- Click the organization selector icon in the upper-right corner of the console and select Manage Orgs and Users.
- On the Setup and Configuration page, select the Organizations tab.
- From the list of organizations, copy your Organization ID and paste it into a text file.
Note: Do not continue to the next step unless you have copied the Organization ID. You must provide this information to SaaS Security during the onboarding process.
Step 3: Connect SaaS Security to Your Automox Instance
By adding an Automox app in Cortex, you enable SaaS Security to connect to your Automox instance.
- Log in to Cortex.
- Select Settings > Data Sources and Integrations > Add New. You can use the Search bar to find the app you want to connect to.
- Click the Automox tile.
- Under Capabilities, Enter a Name for your application.
- Select Security Posture under Default Capabilities and click Next.
- Under Connections, provide the API key and Organization ID.
- Under Configurations, select a Sync Interval. Choose a meaningful Tag to distinguish between various applications in different environments.
- Click Next to complete the onboarding validation process.
Onboard Businessmap
For SaaS Security to detect posture risks in your Businessmap (formerly Kanbanize) instance, you must onboard your Businessmap instance to SaaS Security. Through the onboarding process, SaaS Security connects to a Businessmap API by using an API key that you generate from a Businessmap account. After connecting to the Businessmap API, SaaS Security scans your Businessmap instance for misconfigured settings and account risks.
To access your Businessmap instance, SaaS Security requires the following information, which you specify during the onboarding process.
| Item | Description |
|---|---|
| API Key | A generated character string that identifies a Businessmap administrator to the Businessmap API. SaaS Security requires this API key to authenticate to the API. The key inherits the permissions of the administrator who creates it. Required permissions: The user who generates the API key must have the following Admin privileges: Manage Integrations, Access Audit Logs. |
| Host name | A unique subdomain for your Businessmap instance, which appears as part of your Businessmap URL. |
To onboard your Businessmap instance, complete the following actions.
Step 1: Identify the Businessmap Account for API Key Generation
Identify the Businessmap account that you will use to generate the API key.
Required permissions: The account that generates the API key must have the following Admin privileges:
- Manage Integrations
- Access Audit Logs
Step 2: Log In to Businessmap
Open a web browser to the Businessmap login page or your unique company subdomain URL, and log in to the account you identified.
Step 3: Identify Your Host Name
After you log in to Businessmap, your host name appears as a unique subdomain in the URL. For example, <subdomain>.kanbanize.com.
Note: Make note of your host name before you continue to the next step. You will provide this host name to SaaS Security during the onboarding process.
Step 4: Generate and Copy an API Key
- Click your profile icon in the top-right corner of the page and select API. Businessmap opens your My Account settings to the API tab.
- If an API key was already generated for the account, it is shown on the API tab. If not, click Generate API key.
- Copy your API key and paste it into a text file.
Note: Do not continue to the next step unless you have copied your API key. You will provide this key to SaaS Security during the onboarding process.
Step 5: Connect SaaS Security to Your Businessmap Instance
By adding a Businessmap app in Cortex, you enable SaaS Security to connect to your Businessmap instance.
- Log in to Cortex.
- Select Settings > Data Sources and Integrations > Add New. You can use the Search bar to find the app you want to connect to.
- Click the Businessmap tile.
- Under Capabilities, Enter a Name for your application.
- Select Security Posture under Default Capabilities and click Next.
- Under Connections, provide the API key and Host ID.
- Under Configurations, select a Sync Interval. Choose a meaningful Tag to distinguish between various applications in different environments.
- Click Next to complete the onboarding validation process.
Onboard Celonis
For SaaS Security to detect posture risks in your Celonis instance, you must onboard your Celonis instance to SaaS Security. Through the onboarding process, SaaS Security connects to a Celonis API and, through the API, scans your Celonis instance for misconfigured settings. If there are misconfigured settings, SaaS Security suggests a remediation action based on best practices.
SaaS Security gets access to your Celonis instance through an API access key. During the onboarding process, SaaS Security prompts you for the API access key and related information about your Celonis instance.
To onboard your Celonis instance, complete the following actions:
- Collect information for accessing your Celonis instance
- Connect SaaS Security to your Celonis instance
Step 1: Collect Information for Accessing Your Celonis Instance
To access your Celonis instance, SaaS Security requires the following information, which you specify during the onboarding process.
| Team API Key | A generated character string that identifies a Celonis administrator to the Celonis API. SaaS Security requires this API key to authenticate to the API. Required permissions: The API key must be generated by a user with admin access to your Celonis team. |
|---|---|
| Team domain | The URL for your Celonis team. |
As you complete the following steps, make note of the values of the items described in the preceding table. You will need to enter these values during onboarding to access your Celonis instance from SaaS Security.
- Identify your team domain URL.
The URL for your team domain appears in the address bar of your browser and has the format https://<team-domain>.<region>.celonis.cloud. If you are not certain of your team domain URL, you can query Celonis for a list of all of your teams. To query Celonis for your team domain URL, open a web browser to https://celonis.cloud/find-my-team.
Note: Before you continue to the next step, make note of your team domain URL. You will provide this information to SaaS Security during the onboarding process.
- Generate an API key for your team domain.
- Log in to your Celonis team domain as an administrator. The API key inherits the access permissions of the administrator account that generates the key. The account must have Admin access to your team domain.
- Select Profile menu > Edit Profile.
- On the Edit Profile page, locate the API-Keys section. Enter a New API Key Name and click Create API Key. Celonis generates and displays a new API key.
- Click Copy To Clipboard and paste the key into a text file.
Note: Do not continue to the next step unless you have copied the API key. You must provide this key to SaaS Security during the onboarding process.
Step 2: Connect SaaS Security to Your Celonis Instance
By adding a Celonis app in Cortex, you enable SaaS Security to connect to your Celonis instance.
- Log in to Cortex.
- Select Settings > Data Sources and Integrations > Add New. You can use the Search bar to find the app you want to connect to.
- Click the Celonis tile.
- Under Capabilities, Enter a Name for your application.
- Select Security Posture under Default Capabilities and click Next.
- Under Connections, provide the API key and Team Domain.
- Under Configurations, select a Sync Interval. Choose a meaningful Tag to distinguish between various applications in different environments.
- Click Next to complete the onboarding validation process.
Onboard Cisco Duo
For SaaS Security to detect posture risks in your Cisco Duo instance, you must onboard your Cisco Duo instance to SaaS Security. Through the onboarding process, SaaS Security connects to Cisco Duo's Admin API. After connecting to the Admin API, SaaS Security scans your Cisco Duo instance for misconfigured settings and account risks. To enable SaaS Security to connect to the Admin API, you create an Admin API application in Cisco Duo and configure it to grant SaaS Security only the permissions it needs to complete its scans.
The supported Cisco Duo editions for SaaS Security scans are:
- Duo Essentials
- Duo Advantage
- Duo Premier
To access your Cisco Duo instance, SaaS Security requires the following information, which you specify during the onboarding process.
| API Hostname | A unique URL that serves as a secure entry point for all API requests between SaaS Security and your Cisco Duo instance. It ensures that SaaS Security is communicating directly with your Cisco Duo account. |
|---|---|
| Integration Key | SaaS Security accesses the Admin API through an Admin API application that you create in Cisco Duo. Cisco Duo generates an Integration Key to uniquely identify this application. The Integration Key acts as a username for SaaS Security to identify itself during the connection process. |
| Secret Key | SaaS Security accesses the Admin API through an Admin API application that you create in Cisco Duo. Cisco Duo generates a Secret Key, which acts as a password that SaaS Security uses to securely authenticate to Cisco Duo. |
To onboard your Cisco Duo instance, complete the following actions.
Step 1: Create the Admin API Application
Creating an Admin API application establishes a secure identity for SaaS Security within your Cisco Duo account. This identity enables Cisco Duo to recognize SaaS Security and authorize its API requests. You control SaaS Security' level of access by selecting specific permissions during the application setup.
- Identify the Cisco Duo account that you will use to create the Admin API application. Required Permissions: To create an Admin API application, you must use an account assigned to the Owner role.
- Open a web browser to the Cisco Duo Admin Login page and log in to the Owner account you identified.
- From the Dashboard's left navigation menu, select Applications > Applications.
- On the Applications page, select + Add application.
- On the Application Catalog page, locate the entry for an Admin API application and click + Add.
- On your application's properties page, complete the following actions:
- Under Basic Configuration, specify a meaningful Application name, such as SaaS Security Integration. This name appears in the list of applications on the Applications page and in Cisco Duo administrator logs.
-
Under Details, copy the following items and paste them into a text file:
- Integration key
- Secret key
- API hostname
Note: Do not continue to the next step unless you have copied the Integration key, Secret key, and API hostname. You will provide this information to SaaS Security during the onboarding process.
- Under Permissions, select the following permissions:
- Grant administrators - Read
- Grant read the information
- Grant applications
- Grant settings
- Grant read log
- Grant resource - Read
- Click Save to save your Admin API application.
Step 2: Connect SaaS Security to Your Cisco Duo Instance
By adding a Cisco Duo app in Cortex, you enable SaaS Security to connect to your Cisco Duo instance.
- Log in to Cortex.
- Select Settings > Data Sources and Integrations > Add New. You can use the Search bar to find the app you want to connect to.
- Click the Cisco Duo tile.
- Under Capabilities, Enter a Name for your application.
- Select Security Posture under Default Capabilities and click Next.
- Under Connections, provide the Integration Key, Secret Key, and API Hostname.
- Under Configurations, select a Sync Interval. Choose a meaningful Tag to distinguish between various applications in different environments.
- Click Next to complete the onboarding validation process.
Onboard Cisco Meraki
For SaaS Security to detect posture risks in your Cisco Meraki instance, you must onboard your Cisco Meraki instance to SaaS Security. Through the onboarding process, SaaS Security connects to a Cisco Meraki API and, through the API, scans your Cisco Meraki instance for misconfigured settings. If there are misconfigured settings, SaaS Security suggests a remediation action based on best practices.
SaaS Security gets access to your Cisco Meraki instance through an API access key. During the onboarding process, SaaS Security prompts you for the API access key.
To onboard your Cisco Meraki instance, complete the following actions:
- Generate an API access key for your organization
- Connect SaaS Security to your Cisco Meraki instance
Step 1: Generate an API Access Key for Your Organization
To access a Cisco Meraki API, SaaS Security requires an API key that an organization administrator generates. This administrator must also enable access to the Cisco Meraki dashboard API. The API key inherits the permissions of the administrator who generates the key.
- Log in to Cisco Meraki.
Required Permissions: You must log in as an organization administrator with Full permissions.
- If more than one Cisco Meraki account and organization are associated with your login email address, Cisco Meraki prompts you to select an organization. Navigate to the organization for which you'll be generating the API access key.
- From the Cisco Meraki dashboard, navigate to your profile. Locate your login email address in the upper-right corner of the dashboard and select <login_name> > My Profile.
- On your profile page, locate the API access section and click Generate new API key.
Note: Each administrator can have only two keys associated with their account. If you already have two API keys, you will need to Revoke one before you can Generate new API key.
Cisco Meraki generates and displays your new key.
- Copy your API key and paste it into a text file.
Note: Do not continue to the next step unless you have copied the API key. You must provide this key to SaaS Security during the onboarding process.
- Enable access to the Cisco Meraki dashboard API.
- Select Organization > Settings to open the Organization Settings page.
- On the Organization Settings page, locate the Dashboard API access section. Select Enable access to the Cisco Meraki Dashboard API and click Save Changes.
Step 2: Connect SaaS Security to Your Cisco Meraki Instance
By adding a Cisco Meraki app in Cortex, you enable SaaS Security to connect to your Cisco Meraki instance.
- Log in to Cortex.
- Select Settings > Data Sources and Integrations > Add New. You can use the Search bar to find the app you want to connect to.
- Click the Cisco Meraki tile.
- Under Capabilities, Enter a Name for your application.
- Select Security Posture under Default Capabilities and click Next.
- Under Connections, provide your API key.
- Under Configurations, select a Sync Interval. Choose a meaningful Tag to distinguish between various applications in different environments.
- Click Next to complete the onboarding validation process.
Onboard ClickUp
For SaaS Security to detect posture risks in your ClickUp instance, you must onboard your ClickUp instance to SaaS Security. Through the onboarding process, SaaS Security logs in to ClickUp using administrator account credentials. SaaS Security uses this account to scan your ClickUp instance for misconfigured settings. If there are misconfigured settings, SaaS Security suggests a remediation action based on best practices.
To onboard your ClickUp instance, complete the following actions:
- Collect information for accessing your ClickUp instance
- Connect SaaS Security to your ClickUp instance
Step 1: Collect Information for Accessing Your ClickUp Instance
To access your ClickUp instance, SaaS Security requires connection information. During the onboarding process, you specify the following required and optional information.
| User Email | The login email address of a ClickUp administrator account. Required Permissions: The user must be assigned to the Admin role, or a role with greater permissions. |
|---|---|
| Password | The password for the ClickUp administrator account. |
| MFA Secret Key | (Optional) A key that is used to generate one-time passcodes for multi-factor authentication. |
As you complete the following steps, make note of the values of the items described in the preceding table. You will need to enter these values during onboarding to access your ClickUp instance from SaaS Security.
- Identify the ClickUp account that SaaS Security will use to access your ClickUp instance. Verify that the account is assigned to the Admin role, or a role with greater permissions.
- (Optional) Generate and copy an MFA secret key.
MFA provides an extra layer of security when accessing the ClickUp administrator account. To enable this extra layer of security, the administrator account must be configured for MFA that uses time-based one-time passcodes. These one-time passcodes are generated from authenticator apps such as Google Authenticator by using an MFA secret key. Like an authenticator app, SaaS Security uses the MFA secret key for passcode generation.
- Log in to your ClickUp administrator account.
- Navigate to your My Settings page. Locate your account avatar in the lower-left corner of the page and select <account-avatar> > My Settings.
- On your My Settings page, locate the Two-factor authentication (2FA) section and turn on the toggle for Authenticator App (TOTP).
- A pop-up is displayed, instructing you to install an authenticator app on your cellphone. Decide which authenticator app you will use and download it to your cellphone. After you install the authenticator, click Yes, ready to scan, but do not scan the QR code that is displayed.
- A pop-up window displays your MFA key as a text string and also as a QR code. Copy and paste the MFA key text string into a text file so you can provide it to SaaS Security during onboarding. Then continue configuring your authenticator app by scanning the QR code or by manually entering the MFA key.
Note: MFA is optional. However, if you want SaaS Security to connect to the administrator account by using MFA, do not continue to the next step unless you have copied the MFA Secret Key. You will provide this key to SaaS Security during the onboarding process.
Step 2: Connect SaaS Security to Your ClickUp Instance
By adding a ClickUp app in Cortex, you enable SaaS Security to connect to your ClickUp instance.
- Log in to Cortex.
- Select Settings > Data Sources and Integrations > Add New. You can use the Search bar to find the app you want to connect to.
- Click the ClickUp tile.
- Under Capabilities, Enter a Name for your application.
- Select Security Posture under Default Capabilities and click Next.
- Under Connections, enter the administrator login credentials and, optionally, the MFA secret key.
- Under Configurations, select a Sync Interval. Choose a meaningful Tag to distinguish between various applications in different environments.
- Click Next to complete the onboarding validation process.
Onboard Contentful
For SaaS Security to detect posture risks in your Contentful instance, you must onboard your Contentful instance to SaaS Security. Through the onboarding process, SaaS Security connects to an API to scan your Contentful instance for misconfigured settings. If there are misconfigured settings, SaaS Security suggests a remediation action based on best practices.
SaaS Security gets access to Contentful's content management API by using a personal access token that you generate for a Contentful administrator account. During the onboarding process, SaaS Security prompts you for the personal access token.
To onboard your Contentful instance, complete the following actions:
- Create a personal access token in Contentful
- Connect SaaS Security to your Contentful instance
Step 1: Create a Personal Access Token in Contentful
In Contentful, create a personal access token for an administrator account. The access token enables SaaS Security to carry out actions that require administrator permissions.
- Open a web browser and go to the Contentful login page at be.contentful.com/login.
- Log in as an administrator.
- Locate your profile icon and select <profile-icon> > Account settings.
- On the Account Settings page, navigate to the CMA Tokens tab and click Create personal access token.
- In the Create personal access token dialog, specify a name and expiration date for the access token. You can also specify that the token should never expire.
Note: SaaS Security uses the access token to establish the initial connection to your Contentful instance and to perform scans at regular intervals. These scans will fail after the token expires, and you will need to onboard your Contentful instance again.
- Click Generate. Contentful generates and displays your personal access token.
- Copy the generated token and paste it into a text file.
Note: Do not continue to the next step unless you have copied the access token. You must provide this token to SaaS Security during the onboarding process.
Step 2: Connect SaaS Security to Your Contentful Instance
By adding a Contentful app in Cortex, you enable SaaS Security to connect to your Contentful instance.
- Log in to Cortex.
- Select Settings > Data Sources and Integrations > Add New. You can use the Search bar to find the app you want to connect to.
- Click the Contentful tile.
- Under Capabilities, Enter a Name for your application.
- Select Security Posture under Default Capabilities and click Next.
- Under Connections, enter your personal access key.
- Under Configurations, select a Sync Interval. Choose a meaningful Tag to distinguish between various applications in different environments.
- Click Next to complete the onboarding validation process.
Onboard Couchbase
For SaaS Security to detect posture risks in your Couchbase instance, you must onboard your Couchbase instance to SaaS Security. Through the onboarding process, SaaS Security connects to a Couchbase API by using an API key that you generate from within Couchbase. After connecting to the Couchbase API, SaaS Security scans your Couchbase instance for misconfigured settings and account risks.
The supported Couchbase account plans for SaaS Security scans are:
- Developer Pro
- Enterprise
To access your Couchbase instance, SaaS Security requires the following information, which you specify during the onboarding process.
| API Key | A unique, confidential alphanumeric string that you generate using an Organization Owner account on the Couchbase Capella platform. This credential, which Couchbase calls the API Secret, proves your identity and grants SaaS Security the authority to authenticate and interact with your Couchbase instance. Couchbase displays this sensitive API Secret only once during key generation. |
| ------- | ----------------------------------------------------------------------------------------------------------------------------------------------------------------------------------------------------------------------------------------------------------------------------------------------------------------------------------------------------------------------------------------------- |
To onboard your Couchbase instance, complete the following actions.
Step 1: Generate and Copy the API Key for Your Organization
- Identify the Couchbase account that you will use to create the API key.
Required Permissions: You will need to assign the API key to the Organization Owner role. For this reason, the account that you use to create the key must also be assigned to the Organization Owner role.
- Open a web browser to the Couchbase login page and log in to the Organization Owner account.
- From the navigation bar at the top of the Couchbase page, navigate to Settings.
- From the settings menu in the left-hand navigation, select API Keys.
- On the Management API Keys page, click + Generate Key.
- On the Generate Management API Key page, complete the following actions:
- Specify a Key Name for the key. For effective logging and auditing, give the key a meaningful name. For example, SaaS Security Integration.
- (Optional) Provide a Description of the API key. For example, API key to enable SaaS Security scans.
- Under Organization Roles, assign your key to the Organization Owner role.
- Specify a Key Expiration period. The default expiration period is 180 days. Because this key is assigned to the highly-privileged Organization Owner role, we recommend that you set the period to 90 days or less to enforce regular key rotation.
- Click Generate Key. Couchbase generates the API key and its associated API secret.
- Copy the API secret and paste it into a text file.
Note: Although SaaS Security prompts you for an API key during onboarding, the value you enter in the API Key field is the API secret. Because Couchbase displays this API secret only once, do not continue to the next step without copying the API secret.
Step 2: Connect SaaS Security to Your Couchbase Instance
By adding a Couchbase app in Cortex, you enable SaaS Security to connect to your Couchbase instance.
- Log in to Cortex.
- Select Settings > Data Sources and Integrations > Add New. You can use the Search bar to find the app you want to connect to.
- Click the Couchbase tile.
- Under Capabilities, Enter a Name for your application.
- Select Security Posture under Default Capabilities and click Next.
- Under Connections, enter the API secret in the API key field
- Under Configurations, select a Sync Interval. Choose a meaningful Tag to distinguish between various applications in different environments.
- Click Next to complete the onboarding validation process.
Onboard Coveo
For SaaS Security to detect posture risks in your Coveo instance, you must onboard your Coveo instance to SaaS Security. Through the onboarding process, SaaS Security connects to a Coveo API and, through the API, scans your Coveo instance for misconfigured settings. If there are misconfigured settings, SaaS Security suggests a remediation action based on best practices.
To access your Coveo instance, SaaS Security requires the following information, which you specify during the onboarding process.
| Admin API Key | A generated character string that identifies a Coveo administrator to the Coveo API. SaaS Security requires this API key to authenticate to the API. Required permissions: The Admin API key must be generated by an administrator of your organization. |
|---|---|
| Organization ID | A unique identifier that Coveo assigned to your organization. |
To onboard your Coveo instance, complete the following actions.
Step 1: Generate and Configure an Admin API Key for Your Organization
- As an administrator of your organization, log in to the Coveo Administration Console.
- In the left navigation pane, select API Keys. The API Keys item is located in the Organization section of the menu.
- On the API Keys page, click Add key. Coveo displays the Add an API key page, which provides steps for defining the API key.
- Follow the steps on the API key page to define your API key:
- On the Key purpose page, do not choose any of the predefined templates. Instead, select the Custom option to create a custom combination of privileges. Click Next.
- On the Identification page, specify a meaningful Name for the API key, such as SaaS Security Integration. You can optionally specify a longer Description. Click Next.
- On the Privileges page, grant the API key the following privileges. Click Next.
| Groups | View all |
|---|---|
| Organization | View |
- On the Configuration page, set the Expiration date to 1 year. Click Next.
- Do not modify the Access page. Click Next.
- Review the details of your key on the Review page and click Add API key. Coveo generates and displays your API key.
- Copy the API key and paste it into a text file.
Note: Do not continue to the next step unless you have copied the API key. You will provide this key to SaaS Security during the onboarding process.
Step 2: Identify Your Organization ID
- In the left navigation pane of the Coveo Administration Console, select Settings. The Settings item is located in the Organization section of the menu.
- On the Settings page, select the Organization tab.
- View the organization Details, which include your Organization ID.
- Copy your Organization ID and paste it into a text file.
Note: Do not continue to the next step unless you have copied the Organization ID. You will provide this information to SaaS Security during the onboarding process.
Step 3: Connect SaaS Security to Your Coveo Instance
By adding a Coveo app in Cortex, you enable SaaS Security to connect to your Coveo instance.
- Log in to Cortex.
- Select Settings > Data Sources and Integrations > Add New. You can use the Search bar to find the app you want to connect to.
- Click the Coveo tile.
- Under Capabilities, Enter a Name for your application.
- Select Security Posture under Default Capabilities and click Next.
- Under Connections, enter the Admin API Key and Organization ID
- Under Configurations, select a Sync Interval. Choose a meaningful Tag to distinguish between various applications in different environments.
- Click Next to complete the onboarding validation process.
Onboard Databricks
This page covers two onboarding methods. Use the method that matches your environment:
- Onboard Using Credentials — for posture scans using an administrator account via Okta or Azure AD
- Onboard Using a Service Principal — for identity scans using a Databricks managed service principal
Method 1: Onboard Using Credentials (Okta or Azure AD)
For SaaS Security to detect posture risks in your Databricks instance, you must onboard your Databricks instance to SaaS Security. Through the onboarding process, SaaS Security logs in to Databricks using administrator account credentials via Okta SSO or Microsoft Azure AD.
To access your Databricks instance, SaaS Security requires the following information, which you specify during the onboarding process.
| Item | Description |
|---|---|
| Username | The username or email address of the account that SaaS Security will use to access your Databricks instance. Required Permissions: The user must be a Databricks administrator. |
| Password | The password for the login account. |
If you're logging in through Okta, you must also provide:
| Item | Description |
|---|---|
| Okta subdomain | The Okta subdomain for your organization, included in the login URL that Okta assigned to your organization. |
| Okta 2FA secret | A key used to generate one-time passcodes for MFA. |
If you're using Azure Active Directory (AD) as your identity provider, you must also provide:
| Item | Description |
|---|---|
| Azure 2FA secret | A key used to generate one-time passcodes for MFA. |
Step 1: Collect Credentials
- Identify the account that SaaS Security will use to access your Databricks instance. The user account must have administrator privileges in Databricks.
- Get a secret key for MFA. The steps differ depending on your identity provider:
- (For Okta login): Identify your Okta subdomain, then generate and copy an MFA secret key.
- (For Microsoft Azure login): Enable third-party software OATH tokens for the administrator account, then configure the account for MFA and copy the MFA secret key.
Step 2: Connect SaaS Security to Your Databricks Instance
By adding a Databricks app in Cortex, you enable SaaS Security to connect to your Databricks instance.
- Log in to Cortex.
- Select Settings > Data Sources and Integrations > Add New. You can use the Search bar to find the app you want to connect to.
- Click the Databricks tile.
- Enter a name for your app in the Capabilities field.
- Select Security Posture under Security Capabilities.
- Click Next.
- On the Connections tab, specify how you want SaaS Security to connect: Log in with Okta or Log in with Azure.
- When prompted, provide the login credentials and the information needed for MFA.
- Click Next to complete the onboarding validation process.
Method 2: Onboard Using a Service Principal
For SaaS Security to detect identity risks in your Databricks instance, you must onboard your Databricks instance to SaaS Security using a Databricks managed service principal. After connecting to the Databricks API, SaaS Security runs identity scans of your Databricks instance to detect account risks.
To onboard your Databricks instance, SaaS Security requires the following information.
| Item | Description |
|---|---|
| Client ID | SaaS Security accesses a Databricks API through a service principal that you create. Databricks generates the Client ID to uniquely identify this service principal. |
| Client Secret | SaaS Security accesses a Databricks API through a service principal that you create. Databricks generates the Client Secret, which SaaS Security uses to authenticate to the API. |
| Account ID | An alphanumeric string that uniquely identifies your Databricks account. |
| Warehouse ID | The unique identifier of the SQL warehouse that SaaS Security will use to query data from your Databricks instance. |
Required Permissions: You must be assigned to both the Account Admin and Workspace Admin roles.
Step 1: Identify Your Account ID
- Open a web browser to the Databricks Account Console login page and log in as an administrator assigned to both the Account Admin and Workspace Admin roles.
- In the upper-right corner of the console, locate and click your user icon or name. The drop-down menu includes your account ID.
- Copy your account ID and paste it into a text file.
Note: Do not continue to the next step unless you have copied the account ID. You will provide this information to SaaS Security during the onboarding process.
Step 2: Create a Databricks Managed Service Principal
A Databricks managed service principal is a non-human, programmatic identity that SaaS Security uses to scan your Databricks instance. When you create a service principal, Databricks generates and displays the Client ID and Client Secret that SaaS Security uses to access the Databricks API.
- From the left navigation pane, select User management.
- On the User Management page, select the Service principals tab and click Add service principal.
- In the Add Service Principal dialog, specify a meaningful name for the service principal. For example: SaaS Security Service Principal. Click Add service principal to create it.
Databricks displays a configuration page for your new service principal.
- On the configuration page, select the Roles tab and select the Account admin role.
- Select the Credentials & Secrets tab and click Generate secret.
- In the Generate OAuth Secret dialog, specify an expiration period and click Generate.
Databricks displays the Client ID and Client Secret for your service principal.
- Copy the Client ID and Client Secret and paste them into a text file.
Note: Do not continue to the next step unless you have copied the Client ID and Client Secret. You will provide this information to SaaS Security during the onboarding process.
Step 3: Create an SQL Warehouse
Note: If you already have an SQL warehouse, skip this step and provide its warehouse ID to SaaS Security during onboarding. It is not necessary to create a warehouse exclusively for SaaS Security.
The SQL warehouse provides SaaS Security with the compute resources needed to run SQL queries on your Databricks instance.
- Navigate to a workspace where you will create the SQL warehouse:
- From the left navigation pane, select Workspaces.
- On the Workspaces page, click the link for the workspace.
- On the workspace's page, click the URL link.
Note: If you have multiple workspaces, create the SQL warehouse in any one of them. Because all workspaces are linked to a central Unity Catalog metastore, the warehouse can query data across workspaces.
- From the left navigation pane, select SQL Warehouses. Databricks opens the Compute page at the SQL Warehouses tab.
- Click Create SQL Warehouse.
-
In the New SQL Warehouse dialog:
- Specify a Name for the warehouse. For example, SaaS Security Warehouse.
- Specify a Cluster size. The minimum requirement is 2X-Small.
- Set the Auto stop time to 5 minutes.
- Click Create. Databricks creates the SQL warehouse and displays an Overview of its properties.
- From the overview page, copy the warehouse ID and paste it into a text file.
Note: Do not continue to the next step unless you have copied the warehouse ID. You will provide this information to SaaS Security during the onboarding process.
- Grant your service principal permission to execute queries on the warehouse:
- From the overview page, select Permissions.
- Use the search field in the Manage Permissions dialog to select the service principal.
- Set the service principal's permission to Can use.
- From the overview page, click Start to start the warehouse.
Step 4: Enable Delta Sharing for Your Databricks Workspaces
Repeat the following steps for each of your workspaces:
- From the left navigation pane, select Workspaces.
- On the Workspaces page, click the link for the workspace's Metastore.
- On the Configuration tab for the metastore, select the check box to Allow Delta Sharing with parties outside your organization.
Step 5: Connect SaaS Security to Your Databricks Instance
By adding a Databricks app in Cortex, you enable SaaS Security to connect to your Databricks instance.
- Log in to Cortex.
- Select Settings > Data Sources and Integrations > Add New. You can use the Search bar to find the app you want to connect to.
- Click the Databricks tile.
- Under Capabilities, Enter a Name for your application.
- Select Security Posture under Default Capabilities and click Next.
- Under Connections, enter the Client ID, Client Secret, Account ID, and Warehouse ID.
- Under Configurations, select a Sync Interval. Choose a meaningful Tag to distinguish between various applications in different environments.
- Click Next to complete the onboarding validation process.
Onboard Datadog
For SaaS Security to detect posture risks in your Datadog instance, you must onboard your Datadog instance to SaaS Security. Through the onboarding process, SaaS Security connects to a Datadog API and, through the API, scans your Datadog instance for misconfigured settings. If there are misconfigured settings, SaaS Security suggests a remediation action based on best practices.
To onboard your Datadog instance, complete the following actions:
- Collect information for accessing your Datadog instance
- Connect SaaS Security to your Datadog instance
Step 1: Collect Information for Accessing Your Datadog Instance
To access your Datadog instance, SaaS Security requires the following information, which you specify during the onboarding process.
| Item | Description |
|---|---|
| Region | Datadog manages a number of independent sites in separate geographic areas around the world. Because these sites are separate from each other, you must specify which regional Datadog site you are using. |
| API Key | A generated character string that uniquely identifies your organization to the Datadog API. SaaS Security requires this API key to authenticate to the Datadog API. |
| Application Key | A generated character string that the Datadog API uses to determine the access permissions of a calling application. The application key is associated with the administrator who generates the key. |
As you complete the following steps, make note of the values of the items described in the preceding table. You will need to enter these values during onboarding to access your Datadog instance from SaaS Security.
- Identify the Datadog administrator account that will generate the API Key and Application Key.
Required Permissions: The administrator must have the Datadog Admin role with the following permissions:
- Org Management
- User App Keys
- API Keys Read
- API Keys Write
- Identify your Datadog region.
- Open a web browser and go to the Datadog login page that you use to access your Datadog instance.
- Make a note of the regional Datadog site that your organization is using. Use the following table to determine your region based on the site URL.
| URL | Region |
|---|---|
| https://app.datadoghq.com | US1 |
| https://us3.datadoghq.com | US3 |
| https://us5.datadoghq.com | US5 |
| https://app.datadoghq.eu | EU1 |
| https://app.ddog-gov.com | US1-FED |
Note: Do not continue to the next step unless you have recorded the region information. You must provide this information to SaaS Security during the onboarding process.
c. Log in to the administrator account.
-
Generate an API key for your organization.
- Click your Datadog account icon in the top-right corner and select Organization Settings.
- On the Organization Settings page, select API Keys.
- Click New Key.
- In the New API Key dialog, enter a name for the key and click Create Key. Datadog generates and displays your new key.
- Click Copy Key and paste the key into a text file.
Note: Do not continue to the next step unless you have copied the API Key. You must provide this key to SaaS Security during the onboarding process.
-
Generate an Application key to grant SaaS Security access permissions. Note: An application key inherits the permissions of the person who creates it, but you can further limit the application's access to certain authorization scopes. If you scope the application key, SaaS Security will be unable to access some of your Datadog instance's settings — up to 19 settings may be inaccessible, preventing SaaS Security from determining if those settings are misconfigured. To avoid restricting SaaS Security' access, create an unscoped application key.
On the Organization Settings page, select Application Keys.
- Click New Key.
- In the New Key dialog, enter a name for the key and click Create Key. Datadog generates and displays your new key.
- Click Copy Key and paste the key into a text file.
Note: Do not continue to the next step unless you have copied the Application Key. You must provide this key to SaaS Security during the onboarding process.
Step 2: Connect SaaS Security to Your Datadog Instance
By adding a Datadog app in Cortex, you enable SaaS Security to connect to your Datadog instance.
- Log in to Cortex.
- Select Settings > Data Sources and Integrations > Add New. You can use the Search bar to find the app you want to connect to.
- Click the Datadog tile.
- Enter a name for your app in the Capabilities field.
- Select Security Posture under Security Capabilities and click Next.
- On the Connections tab, enter the API Key, Application Key, and Region for your Datadog instance.
- Click Next to complete the onboarding validation process.
\
\
Onboard Gainsight PX
For SaaS Security to detect posture risks in your Gainsight PX instance, you must onboard your Gainsight PX instance to SaaS Security. Through the onboarding process, SaaS Security logs in to Gainsight PX using administrator account credentials. SaaS Security uses this account to scan your Gainsight PX instance for misconfigured settings. If there are misconfigured settings, SaaS Security suggests a remediation action based on best practices.
To onboard your Gainsight PX instance, complete the following actions:
- Collect information for connecting to your Gainsight PX instance
- Connect SaaS Security to your Gainsight PX instance
Step 1: Collect Information for Connecting to Your Gainsight PX Instance
To access your Gainsight PX instance, SaaS Security requires the following information, which you specify during the onboarding process.
| Item | Description |
|---|---|
| Email ID | The login email address of a Gainsight PX administrator account. |
| Password | The password of the Gainsight PX administrator account. |
| Subscription ID | A unique identifier for your Gainsight PX subscription. |
As you complete the following steps, make note of the values of the items described in the preceding table. You will need to enter these values during onboarding to access your Gainsight PX instance from SaaS Security.
- Identify the Gainsight PX administrator account that SaaS Security will use to access your Gainsight PX instance.
Required Permissions: To enable SaaS Security to scan your Gainsight PX instance, the account must have administrator access.
-
Identify your Gainsight PX subscription ID.
- Open a web browser to the Gainsight PX login page at app.aptrinsic.com/authentication/login and log in as an administrator.
- In the left navigation pane, select Administration > SET UP > Company & Timezone.
- Copy the subscription ID and paste it into a text file.
Note: Do not continue to the next step unless you have copied the subscription ID. You must provide this identifier to SaaS Security during the onboarding process.
Step 2: Connect SaaS Security to Your Gainsight PX Instance
By adding a Gainsight PX app in Cortex, you enable SaaS Security to connect to your Gainsight PX instance.
- Log in to Cortex.
- Select Settings > Data Sources and Integrations > Add New. You can use the Search bar to find the app you want to connect to.
- Click the Gainsight PX tile.
- Under Capabilities, Enter a Name for your application.
- Select Security Posture under Default Capabilities and click Next.
- Under Connections, enter the administrator login credentials and the subscription ID.
- Under Configurations, select a Sync Interval. Choose a meaningful Tag to distinguish between various applications in different environments.
- Click Next to complete the onboarding validation process.
Onboard Grammarly
For SaaS Security to detect posture risks in your Grammarly instance, you must onboard your Grammarly instance to SaaS Security. Through the onboarding process, SaaS Security logs in to Grammarly using administrator account credentials. SaaS Security uses this account to scan your Grammarly instance for misconfigured settings. If there are misconfigured settings, SaaS Security suggests a remediation action based on best practices.
SaaS Security gets access to your Grammarly instance by using Okta SSO credentials that you provide during the onboarding process. For this reason, your organization must be using Okta as an identity provider. The Okta account must be configured for multi-factor authentication (MFA) using one-time passcodes.
To onboard your Grammarly instance, complete the following actions:
- Collect information for accessing your Grammarly instance
- Connect SaaS Security to your Grammarly instance
Step 1: Collect Information for Accessing Your Grammarly Instance
To access your Grammarly instance, SaaS Security requires the following information, which you specify during the onboarding process.
| Item | Description |
|---|---|
| User email | An email address of an Okta user account. Required Permissions: The user must be a Grammarly administrator. |
| User Password | The password for the Okta user account. |
| Okta Subdomain | The Okta subdomain for your organization. The subdomain was included in the login URL that Okta assigned to your organization. |
| MFA Secret Key | A key that is used to generate one-time passcodes for multi-factor authentication. |
As you complete the following steps, make note of the values of the items described in the preceding table. You will need to enter these values during onboarding to access your Grammarly instance from SaaS Security.
- Identify the Okta user account that SaaS Security will use to access your Grammarly instance. The user account must have administrator privileges in Grammarly. SaaS Security needs this administrator access to monitor your Grammarly instance. Note: Remember which account you will use to access your Grammarly instance through Okta SSO authentication from SaaS Security. You will provide the login credentials to SaaS Security during the onboarding process.
- To access the administrator account using Okta credentials:
- Identify your Okta subdomain.
- Generate and copy an MFA secret key.
Step 2: Connect SaaS Security to Your Grammarly Instance
By adding a Grammarly app in Cortex, you enable SaaS Security to connect to your Grammarly instance.
- Log in to Cortex.
- Select Settings > Data Sources and Integrations > Add New. You can use the Search bar to find the app you want to connect to.
- Click the Grammarly tile.
- Under Capabilities, Enter a Name for your application.
- Select Security Posture under Default Capabilities and click Next.
- Under Connections, enter the user credentials, Okta domain, and MFA secret key for accessing your Grammarly instance.
- Under Configurations, select a Sync Interval. Choose a meaningful Tag to distinguish between various applications in different environments.
- Click Next to complete the onboarding validation process.
Onboard Harness
For SaaS Security to detect posture risks in your Harness instance, you must onboard your Harness instance to SaaS Security. Through the onboarding process, SaaS Security connects to a Harness API and, through the API, scans your Harness instance for misconfigured settings. If there are misconfigured settings, SaaS Security suggests a remediation action based on best practices.
SaaS Security gets access to your Harness instance through an API key. During the onboarding process, SaaS Security prompts you for the API key.
To onboard your Harness instance, complete the following actions:
- Generate an API access key and personal access token
- Connect SaaS Security to your Harness instance
Step 1: Generate an API Access Key and Personal Access Token
To access a Harness API, SaaS Security requires an API key that contains a personal access token of an administrator assigned to the Account Admin role. The API key inherits the permissions of the administrator who generates the key and token.
- Open a web browser to the Harness site at www.harness.io and log in as an administrator assigned to the Account Admin role.
Required Permissions: You must log in as an administrator assigned to the Account Admin role. The account must also have permission to View and to Create/Edit authentication settings.
- To open your profile, click the profile icon in the lower-left corner of the window.
- On your profile, click + API Key. The New API Key dialog is displayed.
- Enter a name for your key and click Save. The key appears in the My API Keys area.
- For the new API key, click + Token. The New Token dialog is displayed.
- Enter a name and expiration date for the token and click Generate Token.
Harness generates and displays the personal access token. Copy and paste the token into a text file so you can provide it to SaaS Security during onboarding.
Note: Do not continue to the next step unless you have copied the token. When SaaS Security prompts you for an API key during the onboarding process, enter this personal access token.
Step 2: Connect SaaS Security to Your Harness Instance
By adding a Harness app in Cortex, you enable SaaS Security to connect to your Harness instance.
- Log in to Cortex.
- Select Settings > Data Sources and Integrations > Add New. You can use the Search bar to find the app you want to connect to.
- Click the Harness tile.
- Under Capabilities, enter a name for your application.
- Select Security Posture under Default Capabilities and click Next.
- Under Connections, enter the API key (personal access token) for accessing your Harness instance.
- Under Configurations, select a Sync Interval. Choose a meaningful Tag to distinguish between various applications in different environments.
- Click Next to complete the onboarding validation process.
Onboard Intercom
For SaaS Security to detect posture risks in your Intercom instance, you must onboard your Intercom instance to SaaS Security. Through the onboarding process, SaaS Security connects to an Intercom API by using an access token that you generate from the Intercom Developer Hub. After connecting to the Intercom API, SaaS Security scans your Intercom instance for misconfigured settings and account risks.
To access your Intercom instance, SaaS Security requires the following information, which you specify during the onboarding process.
| Item | Description |
|---|---|
| Access Token | A unique, alphanumeric string that Intercom generates for an Intercom application that you create. The access token has the permissions that you specify in the Intercom application. |
| Region | The region where Intercom is hosting your data. |
To onboard your Intercom instance, complete the following actions.
Step 1: Generate and Copy an Access Token
To generate the access token, you need to create an app in Intercom's Developer Hub.
- Identify the Intercom account that you will use to create the Intercom app.
Required Permissions: To create the Intercom app, the account must be assigned to a role that has the Apps and Integrations Access permissions. This could be a custom Developer role or a role with greater permissions.
- Open a web browser to the Intercom login page and log in to the account you identified.
- Navigate to Intercom's Developer Hub:
- Click the settings icon (gear icon) in the lower-left corner of the window.
- From the Settings navigation pane, select Integrations > Developer Hub. The Your apps page lists any Intercom apps that you have created.
- On the Your apps page, click New app.
- In the New app dialog, complete the following actions:
- Specify an App Name. Give it a meaningful name, such as SaaS Security Integration Token.
- Select the Workspace where you want to add the app.
- Click Create app. Intercom displays a configuration page for the new app.
- Edit your app to limit its permissions to the minimum that SaaS Security requires. By default, your app has permission to all the data in your workspace.
- On the configuration page, make sure the Authentication tab is selected.
- On the Authentication page, click Edit.
- In the Workspace data area, deselect all the check boxes except for the Read admins check box.
-
Regenerate your access token. Intercom created an access token when you created your app, but that token was created before you modified the app's permissions. You must regenerate the token for the permission updates to take effect.
- In the left navigation pane, select Test and publish > Your workspaces.
- On the Your workspaces page, locate the access token and click Regenerate token.
- A confirmation dialog warns you that regenerating the token will delete the current token. Confirm that you want to Regenerate the token.
- On the Your workspaces page, copy the access token and paste it into a text file.
Note: Do not continue to the next step unless you have copied the access token. You must provide this token to SaaS Security during the onboarding process.
Step 2: Identify Your Intercom Region
Use the following table to determine, based on your login URL, the region where Intercom is hosting your data.
| URL | Region |
|---|---|
| https://app.intercom.com | US (United States) |
| https://app.eu.intercom.com | EU (European Union) |
| https://app.au.intercom.com | AU (Australia) |
Step 3: Connect SaaS Security to Your Intercom Instance
By adding an Intercom app in Cortex, you enable SaaS Security to connect to your Intercom instance.
- Log in to Cortex.
- Select Settings > Data Sources and Integrations > Add New. You can use the Search bar to find the app you want to connect to.
- Click the Intercom tile.
- Under Capabilities, enter a name for your application.
- Select Security Posture under Default Capabilities and click Next.
- Under Connections, enter your access token and region.
- Under Configurations, select a Sync Interval. Choose a meaningful Tag to distinguish between various applications in different environments.
- Click Next to complete the onboarding validation process.
Onboard Jamf Pro
For SaaS Security to detect posture risks in your Jamf Pro instance, you must onboard your Jamf Pro instance to SaaS Security. Through the onboarding process, SaaS Security connects to the Jamf Pro API and, through the API, scans your Jamf Pro instance for misconfigured settings and account risks.
SaaS Security gets access to your Jamf Pro instance through an OAuth 2.0 client that you create. During onboarding, you supply SaaS Security with the application credentials (Client ID and Client Secret) for your OAuth 2.0 client. SaaS Security uses these credentials to access the Jamf Pro API through the OAuth 2.0 client.
To access your Jamf Pro instance, SaaS Security requires the following information, which you specify during the onboarding process.
| Item | Description |
|---|---|
| Instance URL | The unique URL for your Jamf Pro instance. |
| Client ID | SaaS Security accesses the Jamf Pro API through an OAuth 2.0 client that you create in Jamf Pro. Jamf Pro generates the Client ID to uniquely identify this OAuth 2.0 client. |
| Client Secret | SaaS Security accesses the Jamf Pro API through an OAuth 2.0 client that you create in Jamf Pro. Jamf Pro generates the Client Secret, which SaaS Security uses to authenticate to the API. |
To onboard your Jamf Pro instance, complete the following actions.
Step 1: Identify Your Instance URL
Identify your instance URL, which appears in the browser's address bar. Jamf Pro typically creates your instance URL during the initial setup of your Jamf Pro environment. Your full instance URL has the format https://<instance-name>.jamfcloud.com.
Before you continue to the next step, make note of this instance URL. You will provide this URL to SaaS Security during the onboarding process.
Step 2: Create the OAuth 2.0 Client
An OAuth 2.0 client in Jamf Pro consists of one or more API roles and an API client. An API role is a custom privilege set designed for non-human API access. An API client is the non-human identity that SaaS Security uses to authenticate to your Jamf Pro instance.
Required Permissions: To create an API role and an API client, use an administrator account (an account assigned to the Administrator Privilege Set) with Full Access.
- Identify the Jamf Pro account that you will use to create the OAuth 2.0 client.
- Open a web browser to your Jamf Pro login page and log in to the administrator account you identified.
- Create an API role to assign to your API client.
An API role defines a set of permissions for an API client. Create an API role that allows access to the scopes that SaaS Security needs to complete its scans.
- From the left navigation pane, select Settings.
- On the Settings page, locate the System settings and select API roles and clients.
- On the API roles and clients page, select the API Roles tab and click + New.
- On the New API Role page, complete the following actions:
- Specify a Display name for the API role. For example, SaaS Security Role.
- In the Privileges field, add the following privileges:
| Privileges | Scan Type |
|---|---|
| Read Impact Alert Notification Settings, Read App Request Settings, Read Automatically Renew MDM Profile Settings, Read Policies, Read Re-enrollment, Read Computer Check-In, Read User-Initiated Enrollment | Posture |
| Read API Integrations, Read API Roles, Read Accounts, Read Webhooks | Identity |
- Click Save to save the API role.
- Create the API client.
The API client is the Jamf Pro non-human identity that SaaS Security uses to authenticate with Jamf Pro. You assign the API role you created to this API client to limit the client's permissions. Creating the API client generates the Client ID and Client Secret necessary for the integration with SaaS Security.
- On the API roles and clients page, select the API Clients tab and click + New.
- On the New API Client page, complete the following actions:
- Specify a Display name for the API client. For example, SaaS Security Integration.
- In the API Roles field, add the API role that you created.
- Click Enable API client.
- Click Save. Jamf Pro saves the API client and displays its configuration details.
- On the configuration details page for the API client, click Generate client secret. After you confirm that you want to create the secret, Jamf Pro generates and displays the application credentials (Client ID and Client Secret) for your API client.
- Copy the credentials and paste them into a text file.
Note: Do not continue to the next step unless you have copied both the Client ID and Client Secret. You must provide these credentials to SaaS Security during the onboarding process.
Step 3: Connect SaaS Security to Your Jamf Pro Instance
By adding a Jamf Pro app in Cortex, you enable SaaS Security to connect to your Jamf Pro instance.
- Log in to Cortex.
- Select Settings > Data Sources and Integrations > Add New. You can use the Search bar to find the app you want to connect to.
- Click the Jamf Pro tile.
- Under Capabilities, enter a name for your application.
- Select Security Posture under Default Capabilities and click Next.
- Under Connections, enter your instance URL and the application credentials (Client ID and Client Secret).
- Under Configurations, select a Sync Interval. Choose a meaningful Tag to distinguish between various applications in different environments.
- Click Next to complete the onboarding validation process.
Onboard JumpCloud
For SaaS Security to detect posture risks in your JumpCloud instance, you must onboard your JumpCloud instance to SaaS Security. Through the onboarding process, SaaS Security connects to a JumpCloud API by using an API key that you generate from the JumpCloud Admin Portal. After connecting to the JumpCloud API, SaaS Security scans your JumpCloud instance for misconfigured settings and account risks.
To access your JumpCloud instance, SaaS Security requires the following information, which you specify during the onboarding process.
| Item | Description |
|---|---|
| API Key | A unique, alphanumeric string that JumpCloud generates for a JumpCloud administrator account. SaaS Security uses the key to authenticate to the JumpCloud API. The API key inherits the permissions of the administrator account. |
| Organization ID | A unique identifier for your organization within the JumpCloud platform. |
To onboard your JumpCloud instance, complete the following actions.
Step 1: Generate and Copy an API Key for Your Organization
- Identify the JumpCloud account that you will use to create the API key.
Required Permissions: To create the API key, you must use an account assigned to the Administrator role in JumpCloud. The account must have API access enabled. To enable API access for the Administrator account, contact an administrator assigned to the Administrator with Billing role. Only administrators assigned to the Administrator with Billing role can enable API access for an Administrator account. The API key inherits the permissions of the Administrator account.
- Using the credentials of the Administrator account, log in to the JumpCloud Admin Portal.
- Locate your profile icon in the upper-right corner of the page and select <profile-icon> > My API Key.
- In the API Key dialog, specify a Custom expiration date of 365 days and click Generate New API Key. JumpCloud generates and displays a new API key.
- Copy the API key and paste it into a text file.
Note: Do not continue to the next step unless you have copied the API key. You must provide this key to SaaS Security during the onboarding process.
Step 2: Identify Your Organization ID
- In the JumpCloud Admin Portal, navigate to your Settings page. In the lower-left corner of the Admin Portal, click Settings.
- On the Settings page, navigate to the Organization Profile tab.
- Copy your Organization ID and paste it into a text file.
Note: Do not continue to the next step unless you have copied the Organization ID. You must provide this information to SaaS Security during the onboarding process.
Step 3: Connect SaaS Security to Your JumpCloud Instance
By adding a JumpCloud app in Cortex, you enable SaaS Security to connect to your JumpCloud instance.
- Log in to Cortex.
- Select Settings > Data Sources and Integrations > Add New. You can use the Search bar to find the app you want to connect to.
- Click the JumpCloud tile.
- Under Capabilities, enter a name for your application.
- Select Security Posture under Default Capabilities and click Next.
- Under Connections, enter your API Key and Organization ID.
- Under Configurations, select a Sync Interval. Choose a meaningful Tag to distinguish between various applications in different environments.
- Click Next to complete the onboarding validation process.
Onboard Kustomer
For SaaS Security to detect posture risks in your Kustomer instance, you must onboard your Kustomer instance to SaaS Security. Through the onboarding process, SaaS Security connects to a Kustomer API and, through the API, scans your Kustomer instance for misconfigured settings. If there are misconfigured settings, SaaS Security suggests a remediation action based on best practices.
SaaS Security gets access to your Kustomer instance through an API access key. During the onboarding process, SaaS Security prompts you for the API access key and related information for your Kustomer instance.
To onboard your Kustomer instance, complete the following actions:
- Collect information for accessing your Kustomer instance
- Connect SaaS Security to your Kustomer instance
Step 1: Collect Information for Accessing Your Kustomer Instance
To access your Kustomer instance, SaaS Security requires the following information, which you specify during the onboarding process.
| Item | Description |
|---|---|
| API Key | A generated character string that uniquely identifies your organization to the Kustomer API. SaaS Security requires this API key to authenticate to the Kustomer API. Required permissions: The API key must be generated by an administrator and configured with the org.permission role. |
| Region | The region (US or EU) where your organization deployed Kustomer. |
As you complete the following steps, make note of the values of the items described in the preceding table. You will need to enter these values during onboarding to access your Kustomer instance from SaaS Security.
- Log in to Kustomer as an administrator.
- Open a web browser and go to the Kustomer login page at www.kustomerapp.com/domain. Enter your organization name and click Continue.
- Log in using administrator credentials.
-
Generate an API key for your organization.
- Click the settings icon (gear icon) in the lower-left corner of the window and select SECURITY > API Keys.
- Click + Add API Key.
- Fill in the fields of the ADD API KEY dialog:
- Enter a name for the new API key.
- In the Roles field, specify org.permission. Required permissions: The key must be configured with the org.permission role.
- Specify an expiration date for the key.
- Click Create. Kustomer generates and displays your new key.
- Copy the API key and paste it into a text file.
Note: Do not continue to the next step unless you have copied the API key. You must provide this key to SaaS Security during the onboarding process.
- Identify the region (United States or European Union) where your organization instance was deployed. Because API calls are region-specific, you must provide this information to SaaS Security during the onboarding process.
Step 2: Connect SaaS Security to Your Kustomer Instance
By adding a Kustomer app in Cortex, you enable SaaS Security to connect to your Kustomer instance.
- Log in to Cortex.
- Select Settings > Data Sources and Integrations > Add New. You can use the Search bar to find the app you want to connect to.
- Click the Kustomer tile.
- Under Capabilities, enter a name for your application.
- Select Security Posture under Default Capabilities and click Next.
- Under Connections, enter your API Key and Region.
- Under Configurations, select a Sync Interval. Choose a meaningful Tag to distinguish between various applications in different environments.
- Click Next to complete the onboarding validation process.
Onboard Microsoft Entra ID
For SaaS Security to detect posture risks in your Microsoft Entra ID instance, you must onboard your Microsoft Entra ID instance to SaaS Security. Through the onboarding process, SaaS Security connects to the Microsoft Graph API and, through the API, scans your Microsoft Entra ID instance at regular intervals.
SaaS Security gets access to your Microsoft Entra ID instance through a service principal, which represents a Microsoft Entra application that you create. You configure this application's permissions to enable SaaS Security to access only the API scopes it requires to complete its scans. When you register this application, Microsoft Entra creates the associated service principal that SaaS Security uses to connect to the API.
The supported Microsoft account plans for SaaS Security scans are:
- Microsoft Business Premium
- Microsoft Entra ID P1
To access your Microsoft Entra ID instance, SaaS Security requires the following information, which you specify during the onboarding process.
| Item | Description |
|---|---|
| Tenant ID | A globally unique identifier (GUID) for your Microsoft Entra tenant. |
| Client ID | SaaS Security accesses the Microsoft Graph API through a Microsoft Entra service principal that represents an application that you create. Microsoft Entra generates the client ID to uniquely identify the application and its associated service principal. |
| Client Secret | SaaS Security accesses the Microsoft Graph API through a Microsoft Entra service principal that represents an application that you create. Microsoft Entra generates the client secret, which SaaS Security uses to authenticate to the service principal. |
To onboard your Microsoft Entra ID instance, complete the following actions.
Step 1: Log In to the Microsoft Entra Admin Center
- Open a web browser to the Microsoft Entra admin center.
- Log in to the administrator account.
Required Permissions: The administrator must be able to grant access to the API scopes required by SaaS Security.
Step 2: Create and Register Your Microsoft Entra Application
- From the left navigation pane in the Microsoft Entra admin center, select App registrations.
- On the App registrations page, select New application.
- On the Register an Application page, complete the following actions:
- Specify a name for the application.
- Select Accounts in this organizational directory only.
- Click Register. Microsoft Entra registers your application and displays the details page. Registering the application automatically creates its associated service principal.
Step 3: Copy the Tenant ID, Client ID, and Client Secret
- Copy the tenant ID and client ID.
- From the details page for your application, select Overview.
- Copy the client ID from the Application (client) ID field and paste it into a text file.
- Copy the tenant ID from the Directory (tenant) ID field and paste it into a text file. Note: Do not continue to the next step unless you have copied the client ID and tenant ID. You will provide this information to SaaS Security during the onboarding process.
- Create and copy the client secret.
- From the details page for your application, select Certificates & secrets > Client secrets.
- Select New client secret.
- In the Add a client secret flyout dialog, specify an expiration date for the client secret and click Add.
- Copy the Value of the new client secret and paste it into a text file.
Note: Do not continue to the next step unless you have copied the client secret. You will need to provide this information to SaaS Security during the onboarding process.
Step 4: Configure API Permissions for Your Application
Configure your application to enable access only to the Microsoft Graph API scopes that SaaS Security requires.
- From the details page for your application, select API permissions.
- On the API permissions page, select Add a permission.
- In the Request API permissions flyout dialog, select the Microsoft Graph API.
- Select Application permissions.
- Select the following API scopes and click Add permissions:
- AuthenticationContext.Read.All
- IdentityProvider.Read.All
- Policy.Read.All
- RoleManagement.Read.Directory
- On the API permissions page, verify that all the scopes were added as application permissions.
- On the API permissions page, select Grant admin consent for your organization.
Step 5: Connect SaaS Security to Your Microsoft Entra ID Instance
By adding a Microsoft Entra ID app in Cortex, you enable SaaS Security to connect to your Microsoft Entra ID instance.
- Log in to Cortex.
- Select Settings > Data Sources and Integrations > Add New. You can use the Search bar to find the app you want to connect to.
- Click the Microsoft Entra ID tile.
- Under Capabilities, enter a name for your application.
- Select Security Posture under Default Capabilities and click Next.
- Under Connections, select the Service Principal option, then enter the Client ID, Client Secret, and Tenant ID.
- Under Configurations, select a Sync Interval. Choose a meaningful Tag to distinguish between various applications in different environments.
- Click Next to complete the onboarding validation process.
Onboard Monday.com
For SaaS Security to detect posture risks in your monday.com instance, you must onboard your monday.com instance to SaaS Security. Through the onboarding process, SaaS Security logs in to monday.com using administrator account credentials. SaaS Security uses this account to scan your monday.com instance for misconfigured settings. If there are misconfigured settings, SaaS Security suggests a remediation action based on best practices.
To onboard your monday.com instance, complete the following actions:
- Collect information for connecting to your monday.com instance
- Connect SaaS Security to your monday.com instance
Step 1: Collect Information for Connecting to Your monday.com Instance
To access your monday.com instance, SaaS Security requires connection information. During the onboarding process, you specify the following required and optional information.
| Item | Description |
|---|---|
| The login email address of a monday.com administrator. Required Permissions: You must supply SaaS Security with Admin credentials to your monday.com account. | |
| Password | The password of the monday.com administrator. |
| Account Domain | The custom domain for your monday.com account. After you log in to monday.com, this domain is part of your monday.com URL in the format <account_domain>.monday.com. |
| MFA Secret Key | (Optional) A key that is used to generate one-time passcodes for multi-factor authentication. |
As you complete the following steps, make note of the values of the items described in the preceding table. You will need to enter these values during onboarding to access your monday.com instance from SaaS Security.
- Identify the monday.com administrator whose credentials you will supply to SaaS Security.
Required Permissions: You must supply SaaS Security with Admin credentials to your monday.com account.
- Identify your monday.com account domain.
After you log in to monday.com, the account domain is a unique subdomain included in the monday.com URL in the format <account_domain>.monday.com. You can also identify your account domain from your profile:
- Open a web browser and go to the monday.com login page at auth.monday.com/auth/login_monday.
- Log in to the administrator account that you identified.
- Navigate to the Administration page. Locate your account avatar and select <account-avatar> > Administration.
- On the Administration page, select General > Profile. The Account URL (Web Address) field shows your account domain.
- (Optional) Generate and copy an MFA secret key.
MFA provides an extra layer of security when accessing the monday.com administrator account. To enable this extra layer of security, you must configure the administrator account for MFA that uses time-based one-time passcodes. Like an authenticator app, SaaS Security uses the MFA secret key for passcode generation.
- Decide which authenticator app you will use and download it to your cellphone. You can use any authenticator app that generates time-based one-time passcodes (TOTP), such as Microsoft Authenticator or Google Authenticator.
- Open a web browser and go to auth.monday.com/auth/login_monday and log in to the administrator account.
- Navigate to the Administration page. Locate your account avatar and select <account-avatar> > Administration.
- On the Administration page, select Security > Login.
- Locate the Two-Factor Authentication section and click Enable Two-Factor Authentication.
- When monday.com prompts you to choose your authentication method, select Authentication App and click Continue.
- A pop-up window displays your MFA secret key as a QR code. Do not scan the QR code. Click Copy code instead to display a text version of the MFA secret key.
- Copy and paste the text version of the MFA secret key into a text file.
Note: Do not continue to the next step unless you have copied the MFA secret key. You will provide this key to SaaS Security during the onboarding process.
- Continue configuring your authentication app by scanning the QR code or by manually entering the MFA secret key.
Step 2: Connect SaaS Security to Your monday.com Instance
By adding a monday.com app in Cortex, you enable SaaS Security to connect to your monday.com instance.
- Log in to Cortex.
- Select Settings > Data Sources and Integrations > Add New. You can use the Search bar to find the app you want to connect to.
- Click the monday.com tile.
- Under Capabilities, enter a name for your application.
- Select Security Posture under Default Capabilities and click Next.
- Under Connections, enter the administrator login credentials, your account domain, and, optionally, the MFA secret key.
- Under Configurations, select a Sync Interval. Choose a meaningful Tag to distinguish between various applications in different environments.
- Click Next to complete the onboarding validation process.
Onboard MongoDB Atlas
For SaaS Security to detect posture risks in your MongoDB Atlas instance, you must onboard your MongoDB Atlas instance to SaaS Security. Through the onboarding process, SaaS Security connects to the MongoDB Atlas Administration API by using programmatic credentials (Client ID and Client Secret) that you provide. After connecting to the MongoDB Atlas Administration API, SaaS Security scans your MongoDB Atlas organization for misconfigured settings and account risks.
To access your MongoDB Atlas instance, SaaS Security requires the following information, which you specify during the onboarding process.
| Item | Description |
|---|---|
| Client ID | SaaS Security accesses the MongoDB Atlas Administration API through a MongoDB service account that you create. MongoDB Atlas generates a Client ID to uniquely identify the service account. |
| Client Secret | SaaS Security accesses the MongoDB Atlas Administration API through a MongoDB service account that you create. MongoDB Atlas generates a client secret for the service account. The API verifies the client secret against the client ID to confirm requests are legitimate. |
To onboard your MongoDB Atlas instance, complete the following actions.
Step 1: Create a Service Account in MongoDB Atlas and Save Its Credentials
A MongoDB Atlas service account is a non-human, programmatic identity that SaaS Security uses to scan your MongoDB organization. When you create a service account, MongoDB Atlas generates and displays the programmatic credentials (Client ID and Client Secret) that SaaS Security uses to access information about your organization.
Note: By following these steps, you onboard only one MongoDB Atlas organization to SaaS Security. If you want SaaS Security to scan multiple organizations, onboard each organization separately.
- Identify the MongoDB Atlas account that you will use to create the service account.
Required Permissions: A service account is scoped to one organization. To create a service account, you must be assigned to the Organization Owner role for the organization that you want SaaS Security to scan.
- Open a web browser to the MongoDB Atlas website and log in to the Organization Owner account.
- If you're a member of multiple organizations, make sure you're in the organization that you want SaaS Security to scan. A selection list in the top-left corner of the MongoDB Atlas page shows your current organization. If necessary, select a different organization from this list.
- From the left navigation pane, select Access Manager.
- On the Organization Access Manager page, select Add New > Service Account.
- On the Create Service account page, specify the following information:
- A Name for the service account. For example, SaaS Security Service Account.
- A Description of the service account. For example, Service account for SaaS Security authentication.
- A Client Secret Expiration date. The recommended expiration period is 90 days.
- The Organization Permissions to grant to the service account. Select Organization Owner permissions. SaaS Security requires this level of access to complete its scans.
- Click Create. MongoDB Atlas creates the service account and displays the programmatic credentials (Client ID and Client Secret) that SaaS Security uses for authentication.
- Copy the Client ID and Client Secret and paste them into a text file.
Note: Do not continue to the next step unless you have copied the Client ID and Client Secret. You will provide this information to SaaS Security during the onboarding process.
Step 2: Connect SaaS Security to Your MongoDB Atlas Instance
By adding a MongoDB Atlas app in Cortex, you enable SaaS Security to connect to your MongoDB Atlas instance.
- Log in to Cortex.
- Select Settings > Data Sources and Integrations > Add New. You can use the Search bar to find the app you want to connect to.
- Click the MongoDB Atlas tile.
- Under Capabilities, enter a name for your application.
- Select Security Posture under Default Capabilities and click Next.
- Under Connections, enter the Client ID and Client Secret.
- Under Configurations, select a Sync Interval. Choose a meaningful Tag to distinguish between various applications in different environments.
- Click Next to complete the onboarding validation process.
Onboard MuleSoft
For SaaS Security to detect posture risks in your MuleSoft instance, you must onboard your MuleSoft instance to SaaS Security. Through the onboarding process, SaaS Security connects to an Anypoint Platform API and, through the API, scans your MuleSoft instance for misconfigured settings and account risks.
SaaS Security gets access to your MuleSoft instance through an OAuth 2.0 application that you create. In the Anypoint Platform, an OAuth 2.0 application is called a Connected App. During onboarding, you supply SaaS Security with the application credentials (Client ID and Client Secret) for your Connected App. SaaS Security uses these credentials to access the Anypoint Platform API.
SaaS Security scans are supported for all MuleSoft paid plans.
To access your MuleSoft instance, SaaS Security requires the following information, which you specify during the onboarding process.
| Item | Description |
|---|---|
| Hosted Region | MuleSoft operates multiple independent regional sites worldwide. Because these regional environments are entirely separate from one another, you must provide SaaS Security with the region where MuleSoft hosts your data. You can determine your region from the MuleSoft URL displayed in your browser's address bar. |
| Client ID | SaaS Security accesses an Anypoint Platform API through a Connected App that you create in the Anypoint Platform. The Anypoint Platform generates the Client ID to uniquely identify this Connected App. |
| Client Secret | SaaS Security accesses an Anypoint Platform API through a Connected App that you create in the Anypoint Platform. The Anypoint Platform generates the Client Secret, which SaaS Security uses to authenticate to the API through the Connected App. |
To onboard your MuleSoft instance, complete the following actions.
Step 1: Identify the Anypoint Platform Account
Identify the Anypoint Platform account that you will use to create your Connected App.
Required Permissions: To create the Connected App, you must use an Anypoint Platform account assigned to the Organization Administrator role.
Step 2: Log In to the Anypoint Platform
Open a web browser to the MuleSoft Anypoint Platform login page and log in to the Organization Administrator account you identified.
Step 3: Identify Your Hosted Region
Use the following table to determine your region based on the MuleSoft URL displayed in your browser's address bar. You will provide this region information to SaaS Security during onboarding.
| URL | Region |
|---|---|
| anypoint.mulesoft.com | US |
| eu1.anypoint.mulesoft.com | Europe |
| ca1.anypoint.mulesoft.com | Canada |
| jp1.anypoint.mulesoft.com | Japan |
| gov.anypoint.mulesoft.com | Gov (MuleSoft Government Cloud) |
Note: MuleSoft Government Cloud is a dedicated, high-security instance of Anypoint Platform tailored for U.S. public sector organizations, including federal, state, and local agencies and their authorized partners.
Step 4: Create Your Connected App
SaaS Security uses this Connected App to authenticate to an Anypoint Platform API to run scans. You configure the Connected App to allow access to only the scopes that SaaS Security requires.
- From the Anypoint Platform home screen, navigate to the Access Management page. In some interface versions, a link to Access Management is on the home screen. If you do not see a link on the home screen, locate the Access Management link under the main navigation menu in the top-left corner of the Anypoint Platform page.
- From the left navigation pane of the Access Management page, select Connected Apps.
- On the Connected Apps page, click Create app.
- On the Create App page, complete the following actions:
- Specify a Name for your Connected App. For example, SaaS Security Integration.
- For the Type of application, select App acts on its own behalf (client credentials).
- Click Add Scopes and add the following scopes:
- View Policies
- Access Controls Viewer
- View Connected Applications
- View Environment
- View Organization
- View Users in a particular organization
- Click Save. The Anypoint Platform creates the Connected App and displays it in the list of Connected Apps.
- From the list on the Connected Apps page, click the name of your Connected App. The Anypoint Platform displays the Update App page, which shows the Connected App credentials (Client ID and Client Secret) that SaaS Security uses to authenticate to an Anypoint Platform API.
- Copy the Client ID and Client Secret and paste them into a text file.
Note: Do not continue to the next step unless you have copied the Client ID and Client Secret. You must provide this information to SaaS Security during the onboarding process.
Step 5: Connect SaaS Security to Your MuleSoft Instance
By adding a MuleSoft app in Cortex, you enable SaaS Security to connect to your MuleSoft instance.
- Log in to Cortex.
- Select Settings > Data Sources and Integrations > Add New. You can use the Search bar to find the app you want to connect to.
- Click the MuleSoft tile.
- Under Capabilities, enter a name for your application.
- Select Security Posture under Default Capabilities and click Next.
- Under Connections, enter the Client ID, Client Secret, and Hosted Region for your Connected App.
- Under Configurations, select a Sync Interval. Choose a meaningful Tag to distinguish between various applications in different environments.
- Click Next to complete the onboarding validation process.
Onboard Mural
For SaaS Security to detect posture risks in your Mural instance, you must onboard your Mural instance to SaaS Security. Through the onboarding process, SaaS Security connects to a Mural API by using an Enterprise API key. You generate this key from the Company Dashboard in Mural. After connecting to the Mural API, SaaS Security scans your Mural instance for misconfigured settings and account risks.
The supported Mural account plan for SaaS Security scans is the Enterprise plan. This plan is required for you to create an Enterprise API key.
To onboard your Mural instance, SaaS Security requires the following information, which you specify during the onboarding process.
| Item | Description |
|---|---|
| API Key | A generated character string that gives SaaS Security access to Mural's Enterprise API. You configure this key to limit SaaS Security' access to only the scopes it requires. Required permissions: You must be a Company Admin to create the Enterprise API key. |
To onboard your Mural instance, complete the following actions.
Step 1: Identify the Mural Account
Identify the Mural account that you will use to generate the Enterprise API key.
Required permissions: The account that generates the API key must be assigned to the Company Admin role in Mural.
Step 2: Log In to Mural
Open a web browser to the Mural login page and log in to the account you identified.
Step 3: Generate and Copy the Enterprise API Key
- Navigate to the Company Dashboard in Mural. Locate your avatar in the upper-right corner of the Mural page and select <your-avatar> > Manage company.
- From the Company Dashboard's left-hand navigation pane, select API keys. The API keys item appears under the Development section.
- On the API Keys page, click Create API Key. The Create API key dialog prompts you to select the API scopes that the key will authorize SaaS Security to access.
- In the Create API key dialog, select the following scopes, which SaaS Security requires:
- Member information
- User activity logs
- Reports
- Click Create API key. Mural generates and displays the Enterprise API key.
- Copy the API key and paste it into a text file.
Note: Do not continue to the next step unless you have copied the API key. This is the only time that Mural displays the API key, and you must provide this key to SaaS Security during the onboarding process.
Step 4: Connect SaaS Security to Your Mural Instance
By adding a Mural app in Cortex, you enable SaaS Security to connect to your Mural instance.
- Log in to Cortex.
- Select Settings > Data Sources and Integrations > Add New. You can use the Search bar to find the app you want to connect to.
- Click the Mural tile.
- Under Capabilities, enter a name for your application.
- Select Security Posture under Default Capabilities and click Next.
- Under Connections, enter your API key.
- Under Configurations, select a Sync Interval. Choose a meaningful Tag to distinguish between various applications in different environments.
- Click Next to complete the onboarding validation process.
Onboard Office 365
For SaaS Security to detect posture risks in your Office 365 instance, you must onboard your Office 365 instance to SaaS Security. Through the onboarding process, SaaS Security connects to a Microsoft API and, through the API, scans your Office 365 instance at regular intervals. You can onboard an Office 365 app by using OAuth 2.0 authorization or by using a Microsoft Entra (formerly Azure) service principal.
Note: Connecting to Office 365 enables SaaS Security to scan settings at a high level based on Microsoft's Secure Score. For greater visibility into a particular application in the Office 365 product family, onboard the individual product app. To scan more settings for Microsoft Word, Microsoft PowerPoint, and Microsoft Excel, onboard Office 365 - Productivity Apps. Other products in the Office 365 product family have their own tiles on the Applications page and can be onboarded separately.
Use the method that matches your environment:
- Method 1: OAuth 2.0 Authorization — SaaS Security redirects you to log in to Office 365 and grant access
- Method 2: Service Principal — SaaS Security connects through a Microsoft Entra application you create
Method 1: OAuth 2.0 Authorization
SaaS Security gets access to your Office 365 instance through OAuth 2.0 authorization. During the onboarding process, you are prompted to log in to Office 365 and to grant SaaS Security the access it requires.
You have the option to connect with read-only permissions or with read and write permissions:
- Read-only permissions enable SaaS Security to perform configuration scans, risky account scans, and third-party plugin scans.
- Read and write permissions enable additional features, including the ability to revoke a user's access to a third-party plugin, force a user out of their current SaaS application sessions from the Identity Security dashboard, and revoke a meeting bot's access to calendar applications from the Meetings dashboard.
Required Permissions: The account must be assigned to the Global Administrator role.
Step 1: Identify the Account for Granting SaaS Security Access
- Identify the Office 365 account that you will use to log in to Office 365 during onboarding. SaaS Security uses this account to establish a connection to your Office 365 instance.
- Log out of all Microsoft accounts. Logging out helps ensure that you log in under the correct account during the onboarding process. To prevent the browser from using saved credentials, you can open Cortex in an incognito window.
Step 2: Connect SaaS Security to Your Office 365 Instance (OAuth 2.0)
By adding an Office 365 app in Cortex, you enable SaaS Security to connect to your Office 365 instance.
- Log in to Cortex.
- Select Settings > Data Sources and Integrations > Add New. You can use the Search bar to find the app you want to connect to.
- Click the Office 365 tile.
- Under Capabilities, enter a name for your application.
- Select Security Posture under Default Capabilities and click Next.
- Specify whether you want SaaS Security to connect with Read Permissions only or with Read and Write permissions. The onboarding page lists the API scopes that SaaS Security will access.
- Click Connect with Office 365. SaaS Security redirects you to the Office 365 login page.
- Enter the credentials for the Microsoft account you identified and sign in to Office 365. Microsoft displays a consent form that details the access permissions that SaaS Security requires.
- Review the consent form and allow the requested permissions. SaaS Security connects to your Office 365 instance and displays whether it was able to access the API scopes required for its scans and actions.
Method 2: Service Principal
SaaS Security gets access to your Office 365 instance through a Microsoft Entra service principal, which represents a Microsoft Entra application that you create. You configure the application's permissions to give SaaS Security access to the API scopes it requires.
To onboard your Office 365 instance using a service principal, SaaS Security requires the following information.
| Item | Description |
|---|---|
| Tenant ID | A globally unique identifier (GUID) for your Microsoft Entra tenant. |
| Client ID | SaaS Security accesses a Microsoft API through a Microsoft Entra service principal that represents an application that you create. Microsoft Entra generates the client ID to uniquely identify the application and its associated service principal. |
| Client Secret | SaaS Security accesses a Microsoft API through a Microsoft Entra service principal that represents an application that you create. Microsoft Entra generates the client secret, which SaaS Security uses to authenticate to the service principal. |
Required Permissions: The administrator must be able to grant access to the API scopes required by SaaS Security. These scopes differ depending on whether you want to grant read-only or read and write permissions.
Note: After SaaS Security connects to your Office 365 instance, it performs an initial scan and then runs scans at regular intervals. The service principal must remain available for scans to continue. If you delete the service principal, scans will fail and you will need to onboard Office 365 again.
Step 1: Log In to the Microsoft Entra Admin Center
- Open a web browser to the Microsoft Entra admin center.
- Log in to the administrator account.
Step 2: Create and Register Your Microsoft Entra Application
- From the left navigation pane, select Enterprise applications.
- On the Enterprise applications page, select New application.
- On the All applications page, select Create your own application.
- On the Create your own application flyout dialog, complete the following actions:
- Specify a name for the application.
- Select Register an application to integrate with Microsoft Entra ID (App you're developing).
- Click Create.
- On the Register an application window:
- For supported account types, select Accounts in this organizational directory only.
- Click Register. Registering the application automatically creates its associated service principal.
Step 3: Identify the Required API Scopes from Cortex
To configure the correct API permissions, first retrieve the required scopes from the SaaS Security onboarding screen.
- Log in to Cortex.
- Select Settings > Data Sources and Integrations > Add New and click the Office 365 tile.
- Under Capabilities, enter a name and select Security Posture, then click Next.
- Select the option for Service Principal. The onboarding page lists the API scopes that SaaS Security requires for read access and for read and write access. Copy the API scopes that you want to allow. Note: Do not continue to the next step unless you have copied the permissions. You will add these permissions to your application.
- Click Cancel Onboarding. You will complete the onboarding process after you finish configuring your application.
Step 4: Configure API Permissions for Your Application
- From the left navigation pane in the Microsoft Entra admin center, select Enterprise applications.
- From the list of applications on the All applications page, open your application.
- From the details page for your application, select Permissions.
- On the Permissions page, click the Application registration link to go to the API permissions page.
- On the API permissions page, click Add a permission.
- On the Request API permissions flyout dialog, select Microsoft Graph > Application Permissions.
- Select each of the API scopes that you obtained from the Office 365 onboarding screen in Cortex and click Add permissions.
- On the API permissions page, verify that all the scopes were added as application permissions. The scopes you added should all have a type of Application. Only the User.Read permission (added automatically by Microsoft Entra) will have a type of Delegated.
- On the API permissions page, select Grant admin consent for your organization.
Step 5: Copy the Application Credentials and Tenant ID
- Copy the client ID:
- From the details page for your application, select Overview.
- Copy the client ID from the Application (client) ID field and paste it into a text file.
Note: Do not continue to the next step unless you have copied the client ID. You will provide this information to SaaS Security during the onboarding process.
- Create and copy the client secret:
- From the details page for your application, select Certificates & secrets > Client secrets.
- Create a New client secret.
- Copy the Value of the new client secret and paste it into a text file.
Note: Do not continue to the next step unless you have copied the client secret. You will provide this information to SaaS Security during the onboarding process.
- Copy the tenant ID:
- From the left navigation pane in the Microsoft Entra admin center, select Home.
- Copy the tenant ID and paste it into a text file.
Note: Do not continue to the next step unless you have copied your tenant ID. You will provide this information to SaaS Security during the onboarding process.
Step 6: Connect SaaS Security to Your Office 365 Instance (Service Principal)
- Log in to Cortex.
- Select Settings > Data Sources and Integrations > Add New. You can use the Search bar to find the app you want to connect to.
- Click the Office 365 tile.
- Under Capabilities, enter a name for your application.
- Select Security Posture under Default Capabilities and click Next.
- Select the option for Service Principal.
- Under Connections, enter the Client ID, Client Secret, and Tenant ID.
- Depending on the API permissions that you configured for your application, specify whether you want SaaS Security to connect with Read Permissions only or with Read and Write Permissions.
- Under Configurations, select a Sync Interval. Choose a meaningful Tag to distinguish between various applications in different environments.
- Click Next to complete the onboarding validation process.
Onboard Okta
For SaaS Security to detect posture risks in your Okta instance, you must onboard your Okta instance to SaaS Security. Through the onboarding process, SaaS Security connects to an Okta API by using an API token that you generate from Okta's administrator console. After connecting to the Okta API, SaaS Security scans your Okta instance for misconfigured settings. If there are misconfigured settings, SaaS Security suggests a remediation action based on best practices.
During onboarding, SaaS Security gives you an option to connect with read-only permissions or with read and write permissions:
- Read-only permissions enable SaaS Security to perform read-only scans.
- Read and write permissions enable additional actions, such as automated remediation.
After SaaS Security establishes a connection to your Okta instance, it notifies you if it was unable to access certain API scopes. SaaS Security might not be able to access certain scopes if the user who created the API token lacked the required permissions.
To onboard your Okta instance, complete the following actions:
- Create an API token for connecting to your Okta instance
- Connect SaaS Security to your Okta instance
Step 1: Create an API Token for Connecting to Your Okta Instance
To access your Okta instance, SaaS Security requires the following information, which you specify during the onboarding process.
| Item | Description |
|---|---|
| API Token | A generated character string that identifies an Okta administrator to the Okta API. SaaS Security requires this API token to authenticate to the API. The token inherits the permissions of the administrator who creates it. Required permissions: For read and write access, the API token must be created by a Super Administrator. For read-only access, the API token can be created by a read-only administrator. |
| Admin Instance URL | The URL for your administrator console. |
As you complete the following steps, make note of the values of the items described in the preceding table. You will enter these values during onboarding to enable SaaS Security to access your Okta instance.
- Identify the Okta administrator account that you will use to create your API token. The API token inherits the permissions of the administrator who creates it. For read and write access, create the token as a Super Administrator. For read-only access, create the token as a read-only administrator.
- Using the administrator account that you identified, log in to your Okta administrator console.
- Identify your administrator instance URL, which appears in the browser's address bar. Your administrator instance URL is your subdomain plus -admin.okta.com (format: https://<subdomain>-admin.okta.com).
Note: Before you continue to the next step, make note of your administrator instance URL. You will provide this information to SaaS Security during the onboarding process.
- In the left navigation pane, select Security > API.
- On the API page, select the Tokens tab.
- Click Create token. A dialog opens prompting you to name your token.
- Specify a name for your token and click Create token. Okta generates and displays your token.
- Copy the generated token and paste it into a text file.
Note: Do not continue to the next step unless you have copied the API token. You will provide this token to SaaS Security during the onboarding process.
Step 2: Connect SaaS Security to Your Okta Instance
By adding an Okta app in Cortex, you enable SaaS Security to connect to your Okta instance.
- Log in to Cortex.
- Select Settings > Data Sources and Integrations > Add New. You can use the Search bar to find the app you want to connect to.
- Click the Okta tile.
- Under Capabilities, enter a name for your application.
- Select Security Posture under Default Capabilities and click Next.
- Under Connections, enter your API token and your administrator instance URL.
- Specify whether you want SaaS Security to connect with Read Permissions only or with Read and Write permissions. The onboarding page lists the API scopes that SaaS Security will access to complete its various scans and to perform remediation.
- Under Configurations, select a Sync Interval. Choose a meaningful Tag to distinguish between various applications in different environments.
- Click Next to complete the onboarding validation process.
Onboard PagerDuty
For SaaS Security to detect posture risks in your PagerDuty instance, you must onboard your PagerDuty instance to SaaS Security. Through the onboarding process, SaaS Security logs in to PagerDuty using administrator account credentials. SaaS Security uses this account to scan your PagerDuty instance for misconfigured settings. If there are misconfigured settings, SaaS Security suggests a remediation action based on best practices.
To onboard your PagerDuty instance, complete the following actions:
- Collect information for accessing your PagerDuty instance
- Connect SaaS Security to your PagerDuty instance
Step 1: Collect Information for Accessing Your PagerDuty Instance
To access your PagerDuty instance, SaaS Security requires the following information, which you specify during the onboarding process.
| Item | Description |
|---|---|
| User | The username or email address of the administrator account. Required Permissions: The user must be the PagerDuty Account Owner. |
| Password | The password for the administrator account. |
| PagerDuty Subdomain | If your account has a personalized PagerDuty subdomain, the name of the subdomain. |
| Region | PagerDuty manages data centers in different geographical regions. You must specify your service region. |
If you are using Okta as your identity provider, you must also provide:
| Item | Description |
|---|---|
| Okta subdomain | The Okta subdomain for your organization, included in the login URL that Okta assigned to your organization. |
| Okta 2FA secret | A key used to generate one-time passcodes for MFA. |
If you are using Azure Active Directory (AD) as your identity provider, you must also provide:
| Item | Description |
|---|---|
| Azure 2FA secret | A key used to generate one-time passcodes for MFA. |
As you complete the following steps, make note of the values of the items described in the preceding tables. You will need to enter these values during onboarding to access your PagerDuty instance from SaaS Security.
- Identify the administrator account that SaaS Security will use to access your PagerDuty instance. The administrator must be the PagerDuty Account Owner. SaaS Security needs Account Owner permissions to monitor your PagerDuty instance.
- Determine whether you want SaaS Security to log in to the administrator account directly, or through an identity provider. Using an identity provider adds an extra layer of security by requiring MFA using one-time passcodes. You can use Okta or Microsoft Azure as the identity provider.
- (For Okta login): Identify your Okta subdomain, then generate and copy an MFA secret key.
- (For Microsoft Azure login): Enable third-party software OATH tokens for the administrator account, then configure the account for MFA and copy the MFA secret key.
- Determine if your organization has a personalized PagerDuty subdomain. You can determine this from your PagerDuty URL. If you have a personalized subdomain, it is prepended to your PagerDuty URL (for example, <subdomain>.pagerduty.com).
Note: If you have a personalized subdomain, make note of it before you continue to the next step. You must provide this information to SaaS Security during the onboarding process. If you do not have a personalized subdomain, leave the associated field blank during the onboarding process.
- Make note of your PagerDuty service region, which you can determine from your PagerDuty URL after you log in to your account. If the URL contains the string eu, your region is the European Union (EU). If the URL does not contain a region code, your region is the United States (US).
Step 2: Connect SaaS Security to Your PagerDuty Instance
By adding a PagerDuty app in Cortex, you enable SaaS Security to connect to your PagerDuty instance.
- Log in to Cortex.
- Select Settings > Data Sources and Integrations > Add New. You can use the Search bar to find the app you want to connect to.
- Click the PagerDuty tile.
- Under Capabilities, enter a name for your application.
- Select Security Posture under Default Capabilities and click Next.
- Under Connections, specify how you want SaaS Security to connect to your PagerDuty instance: Log in with Credentials, Log in with Okta, or Log in with Azure.
- When prompted, provide SaaS Security with the administrator credentials, PagerDuty subdomain, and PagerDuty service region. If you do not have a personalized subdomain, leave the PagerDuty subdomain field blank. If SaaS Security is connecting through an identity provider, specify the information needed for MFA.
- Under Configurations, select a Sync Interval. Choose a meaningful Tag to distinguish between various applications in different environments.
- Click Next to complete the onboarding validation process.
Onboard Redis Labs
For SaaS Security to detect posture risks in your Redis Labs instance, you must onboard your Redis Labs instance to SaaS Security. Through the onboarding process, SaaS Security connects to the Redis Cloud REST API by using a pair of API keys that you generate within Redis Labs. After connecting to the Redis Cloud REST API, SaaS Security scans your Redis Labs instance for misconfigured settings and account risks.
To onboard your Redis Labs instance, SaaS Security requires the following information, which you specify during the onboarding process.
| Item | Description |
|---|---|
| Account key | An API account key that Redis Labs generates the first time a Redis Labs account owner enables the REST API. The API account key is an alphanumeric string that uniquely identifies your Redis Labs account. SaaS Security uses this key and the API user key to authenticate to a Redis Labs API. |
| User key | An API user key that you create in Redis Labs and associate with a particular user. SaaS Security uses this key to authenticate to a Redis Labs API. Redis Labs authorizes requests from SaaS Security based on the key's role, which it inherits from the user associated with the key. |
To onboard your Redis Labs instance, complete the following actions.
Step 1: Identify the Redis Labs Owner Account
Identify the Redis Labs user who will get the API account key and API user key.
Required Permissions: The user must be assigned to the Owner role in Redis Labs. The Owner role is required to enable the Redis Cloud REST API and to create an API user key.
Step 2: Log In to Redis Labs
Open a web browser to the Redis Labs login page and log in as the Owner you identified.
Step 3: Locate and Copy Your API Account Key
Redis Labs generates a unique API account key the first time a Redis Labs account Owner enables the REST API. This API account key appears on the Access Management page.
- From the left navigation pane, select Access Management.
- On the Access Management page, select the API Keys tab. If another Owner previously enabled the API, the API account key appears on this page. Otherwise, the page contains an Enable API button.
- If necessary, click Enable API.
- Copy the API account key and paste it into a text file.
Note: Do not continue to the next step unless you have copied the API account key. You will provide this key to SaaS Security during the onboarding process.
Step 4: Create and Copy an API User Key
When you create an API user key, you associate the key with a specific Redis Labs user. The key's permissions are based on the associated user's role.
- On the Access Management page's API Keys tab, locate the API User Keys section.
- In the API User Keys section, click the add button (+). Redis Labs displays an empty entry for you to configure your API user key.
- In the empty entry, complete the following actions:
- Specify an API key name. For effective logging, auditing, and future maintenance, supply a descriptive name that clearly identifies the purpose of the key. For example, SaaS Security-integration.
- Select a User name from the list. The user you select must be assigned to the Owner role.
- Click Create. Redis Labs generates and displays your API user key.
- Copy the API user key and paste it into a text file.
Note: Do not continue to the next step unless you have copied the API user key. You will provide this key to SaaS Security during the onboarding process.
Step 5: Connect SaaS Security to Your Redis Labs Instance
By adding a Redis Labs app in Cortex, you enable SaaS Security to connect to your Redis Labs instance.
- Log in to Cortex.
- Select Settings > Data Sources and Integrations > Add New. You can use the Search bar to find the app you want to connect to.
- Click the Redis Labs tile.
- Under Capabilities, enter a name for your application.
- Select Security Posture under Default Capabilities and click Next.
- Under Connections, enter your API account key and API user key.
- Under Configurations, select a Sync Interval. Choose a meaningful Tag to distinguish between various applications in different environments.
- Click Next to complete the onboarding validation process.
Onboard a Redis Labs App to SaaS Security
Connect a Redis Labs instance to SaaS Security to detect posture risks.
SaaS Security connects to the Redis Cloud REST API using a pair of API keys that you generate in Redis Labs. After connecting, SaaS Security scans your Redis Labs instance for misconfigured settings and account risks.
The onboarding process requires the following credentials:
| Item | Description |
|---|---|
| Account key | An API account key that Redis Labs generates the first time an account Owner enables the REST API. This alphanumeric string uniquely identifies your Redis Labs account. |
| User key | An API user key that you create in Redis Labs and associate with a specific user. Redis Labs authorizes requests based on the key's role, which it inherits from the associated user. |
Step 1 — Identify the Owner account
Identify the Redis Labs user who will retrieve the API account key and create the API user key.
Required permissions: The user must be assigned the Owner role in Redis Labs. The Owner role is required to enable the Redis Cloud REST API and to create an API user key.
Step 2 — Log in to Redis Labs
Open a browser to app.redislabs.com and log in as the Owner you identified in Step 1.
Step 3 — Get the API account key
Redis Labs generates a unique API account key the first time an account Owner enables the REST API. The key appears on the Access Management page.
- From the left navigation pane, select Access Management.
- Select the API Keys tab.
- If another Owner previously enabled the API, the account key appears on this page.
- If not, click Enable API to generate the key.
- If necessary, click Enable API.
- Copy the API account key and save it to a text file.
Note: Do not proceed to the next step until you have copied the API account key. You will provide this key during the onboarding process.
Step 4 — Create an API user key
When you create an API user key, you associate it with a specific Redis Labs user. The key's permissions are based on that user's role.
- On the Access Management page, select the API Keys tab.
- In the API User Keys section, click the + (add) button. Redis Labs displays an empty entry for you to configure.
- Complete the following fields:
- API key name — Enter a descriptive name that identifies the key's purpose. For example, SaaS-Security-integration.
- User name — Select a user assigned to the Owner role.
- Click Create. Redis Labs generates and displays the API user key.
- Copy the API user key and save it to a text file.
Note: Do not proceed to the next step until you have copied the API user key. You will provide this key during the onboarding process.
Step 5 — Connect SaaS Security to Redis Labs
- Log in to Cortex.
- Select Settings > Data Sources and Integrations > Add New and click the Redis Labs tile.
- On the Capabilities tab, enter a name for this instance.
- Under Default Capabilities, confirm Security Posture is selected.
- Click Next.
- On the Connections tab, enter your API account key and API user key.
- Click Next.
- On the Configurations tab:
- Set the Sync Interval.
- (Optional) Add a Tag.
- Click Next to complete onboarding.
Onboard Salesforce
For SaaS Security to detect posture risks in your Salesforce instance, you must onboard your Salesforce instance to SaaS Security. Through the onboarding process, SaaS Security connects to a Salesforce API and, through the API, scans your Salesforce instance for misconfigured settings and account risks.
You can onboard your Salesforce instance through an interactive OAuth 2.0 Authorization flow or through a Salesforce External Client App.
- OAuth 2.0 Authorization relies on a Salesforce user account to authorize access through a browser-based login. This approach can be faster to set up and leverages any SSO or MFA requirements already established by your organization.
- External Client App authenticates using application credentials (Client ID and Client Secret), creating a persistent, system-to-system link that does not rely on OAuth refresh tokens.
Use the method that matches your environment:
Method 1: OAuth 2.0 Authorization
SaaS Security gets access to your Salesforce instance through OAuth 2.0 authorization. During the onboarding process, you are prompted to log in to Salesforce and to grant SaaS Security the access it requires.
Required information:
| Item | Description |
|---|---|
| Instance URL | The unique web address for your Salesforce instance. Format: https://<instance_name>.my.salesforce.com. |
Step 1: Identify Your Salesforce Instance URL
Make note of your organization's Salesforce instance (domain) URL. Your instance URL has the format https://<instance_name>.my.salesforce.com. Include the https:// prefix when you provide this URL to SaaS Security.
If necessary, locate your instance URL from the My Domain Settings page:
- Click the settings icon (gear icon) in the upper-right corner of the page and select Setup.
- From the Setup page's left navigation pane, select Company Settings > My Domain.
- The Current My Domain URL field contains your instance URL.
Step 2: Identify the Salesforce Account and Configure Permissions
Identify the Salesforce account that you will use to log in to Salesforce during onboarding. We recommend using a dedicated service account. If you delete the service account or change its password, scans will fail and you will need to onboard Salesforce again.
During onboarding, SaaS Security gives you an option to connect with read-only permissions or with read and write permissions.
Permissions for Read Access (configuration scans, identity scans, risky account scans):
| Scan Type | Required Permission |
|---|---|
| Configuration | API Enabled, View Health Check |
| Risky Accounts | API Enabled (plus disable login with Salesforce credentials on the Single Sign-on Settings page) |
| Identity | API Enabled, View Event Log Files, View Setup and Configuration, View All Users |
Additional Permissions for Write Access (third-party plugin scans and automated remediation):
| Scan Type / Remediation | Required Permission |
|---|---|
| Configuration Remediation | API Enabled, View Health Check, Download AppExchange Packages |
| Third-Party Plugins | API Enabled, Download AppExchange Packages |
To grant permissions to the user account, add the permissions to a permission set and assign the permission set to the Salesforce user account:
- From the setup home page, select Users > Permission Sets.
- Create a new permission set or edit an existing one.
- On the setup page for the permission set, locate the System area and navigate to System Permissions.
- Enable the required permissions and save.
- Assign the permission set to the Salesforce user account.
Step 3: Install the SaaS Security OAuth App in Salesforce
Important: In September 2025, Salesforce updated its security policy for connected OAuth apps. To onboard or re-authenticate to Salesforce, you must install the SaaS Security OAuth app in Salesforce. You only need to complete this step once per Salesforce instance.
Salesforce now requires connected OAuth apps to be formally installed. Because the SaaS Security connector uses the OAuth 2.0 flow (which creates an uninstalled OAuth app), you must navigate to the Connected Apps OAuth Usage page in Salesforce, locate the SaaS Security uninstalled OAuth app, and install it.
If you have never onboarded Salesforce to SaaS Security, first complete the Connect step below to have Salesforce create the uninstalled connected app, then return to install it.
Step 4: Connect SaaS Security to Your Salesforce Instance (OAuth 2.0)
By adding a Salesforce app in Cortex, you enable SaaS Security to connect to your Salesforce instance.
- Log in to Cortex.
- Select Settings > Data Sources and Integrations > Add New. You can use the Search bar to find the app you want to connect to.
- Click the Salesforce tile.
- Under Capabilities, enter a name for your application.
- Select Security Posture under Default Capabilities and click Next.
- Select the option for OAuth 2.0.
- Enter your Instance URL.
- Specify whether you want SaaS Security to connect with Read Permissions only or with Read and Write Permissions. The onboarding page lists the API scopes that SaaS Security will access.
- Click Connect with Salesforce. SaaS Security redirects you to the Salesforce login page.
- Log in to the Salesforce account. Salesforce displays a consent form that details the access permissions that SaaS Security requires.
- Review the consent form and allow the requested permissions. SaaS Security connects to your Salesforce instance and displays whether it was able to access the required API scopes.
Method 2: External Client App
The External Client App approach authenticates using application credentials (Client ID and Client Secret). This method offers long-term stability by creating a persistent, system-to-system link that does not rely on OAuth refresh tokens.
Required information:
| Item | Description |
|---|---|
| Instance URL | The unique web address for your Salesforce instance. Format: https://<instance_name>.my.salesforce.com. |
| Client ID | SaaS Security accesses the Salesforce API through an External Client App that you create in Salesforce. Salesforce generates the Client ID to uniquely identify this app. |
| Client Secret | SaaS Security accesses the Salesforce API through an External Client App that you create in Salesforce. Salesforce generates the Client Secret, which SaaS Security uses to authenticate to the API. |
Connect SaaS Security to Your Salesforce Instance (External Client App)
By adding a Salesforce app in Cortex, you enable SaaS Security to connect to your Salesforce instance.
- Log in to Cortex.
- Select Settings > Data Sources and Integrations > Add New. You can use the Search bar to find the app you want to connect to.
- Click the Salesforce tile.
- Under Capabilities, enter a name for your application.
- Select Security Posture under Default Capabilities and click Next.
- Select the option for External Client App.
- Enter your Instance URL and the application credentials (Client ID and Client Secret).
- Specify whether you want SaaS Security to connect with Read Permissions only or with Read and Write Permissions. The onboarding page lists the API scopes that SaaS Security will access.
- Under Configurations, select a Sync Interval. Choose a meaningful Tag to distinguish between various applications in different environments.
- Click Next to complete the onboarding validation process.
Onboard SAP Ariba
SaaS Security connects to your SAP Ariba instance using administrator credentials and your realm name. You can connect directly with credentials or through Microsoft Azure AD (which adds MFA using one-time passcodes).
The onboarding process requires the following information:
| Item | Description |
|---|---|
| Username | The username or email address of an SAP Ariba administrator account. The format depends on whether SaaS Security logs in directly or through an identity provider. The account must be registered to the SAP Ariba realm you want to scan. |
| Password | The password for the SAP Ariba administrator account. |
| Realm | The SAP Ariba realm that SaaS Security will scan for misconfigurations. |
If SaaS Security accesses the administrator account directly, you also need:
| Item | Description |
|---|---|
| FQDN | The fully qualified domain name for connecting to your SAP Ariba instance. For example: s1.ariba.com |
If you use Azure Active Directory as your identity provider, you also need:
| Item | Description |
|---|---|
| Azure 2FA secret | A key used to generate one-time passcodes for MFA. |
Step 1 — Identify the administrator account
Identify the SAP Ariba account whose login credentials you will supply during onboarding.
Required permissions: The account must have administrator permissions to the SAP Ariba realm you want SaaS Security to scan.
Step 2 — Choose a login method
Determine whether you want SaaS Security to log in to the administrator account directly, or through Microsoft Azure AD.
Using Microsoft Azure AD adds an extra layer of security by requiring MFA with one-time passcodes. If you use Azure AD, SaaS Security requires additional information for MFA.
Step 3 — (Azure AD login only) Configure MFA
If you are using Microsoft Azure AD as your identity provider:
- Enable third-party software OATH tokens for the administrator account.
- Configure the account for MFA and copy the MFA secret key.
Step 4 — Identify your realm name and FQDN
- Log in to your SAP Ariba realm using the administrator account you identified in Step 1. After login, the URL contains a realm query parameter showing your realm name.
- From the browser address bar, locate the realm parameter in the URL.
- Make note of the realm name. You will provide this value during onboarding.
- (Direct login only) Also make note of the fully qualified domain name shown in the browser address bar. During onboarding, you will select the FQDN from a list. Possible values include s1.ariba.com and s3.ariba.com.
Step 5 — Connect SaaS Security to SAP Ariba
- Log in to Cortex.
- Select Settings > Data Sources and Integrations > Add New and click the SAP Ariba tile.
- On the Capabilities tab, enter a name for this instance.
- Under Default Capabilities, confirm Security Posture is selected.
- Click Next.
- On the Connections tab, select how SaaS Security will connect:
- Log in with Credentials — for direct login
- Log in with Azure — for Azure AD login
- When prompted, provide the administrator credentials and your realm name.
- Direct login: Select the FQDN for your SAP Ariba instance.
- Azure AD login: Provide the Azure 2FA secret for MFA.
- Click Next.
- On the Configurations tab:
- Set the Sync Interval.
- (Optional) Add a Tag.
- Click Next to complete onboarding.
Onboard Sentry
SaaS Security connects to the Sentry API using a personal access token that you generate from a Sentry account. After connecting, SaaS Security scans your Sentry instance for misconfigured settings and account risks.
Note: The supported Sentry account plan for SaaS Security scans is the Business Plan.
The onboarding process requires the following credential:
| Item | Description |
|---|---|
| Personal Token | A personal access token generated from a Sentry account. This unique alphanumeric string gives SaaS Security read-only access to organization and member data for a Sentry organization. |
Step 1 — Generate a personal access token
- Identify the Sentry account you will use to generate the token.
Required permissions: No elevated permissions are required, but the account must be a member of the organization you want SaaS Security to scan.
- Open a browser to the Sentry login page and log in to the account you identified.
- On the Sentry dashboard, open the account drop-down menu in the upper-left corner and select Personal Tokens.
- On the Personal Tokens page, click Create New Token.
- Select the following permission scopes for the token:
- member:read
- org:read
- Enter a name for the token — for example, SaaS-Security-Integration-Token — then click Create Token.
- Copy the personal access token and save it to a text file.
Note: Do not proceed to the next step until you have copied the personal token. You must provide this token during the onboarding process.
Step 2 — Connect SaaS Security to Sentry
- Log in to Cortex.
- Select Settings > Data Sources and Integrations > Add New and click the Sentry tile.
- On the Capabilities tab, enter a name for this instance.
- Under Default Capabilities, confirm Security Posture is selected.
- Click Next.
- On the Connections tab, select Log in with Credentials and enter your personal token.
- Click Next.
- On the Configurations tab:
- Set the Sync Interval.
- (Optional) Add a Tag.
- Click Next to complete onboarding.
Onboard ServiceNow
SaaS Security connects to ServiceNow using OAuth 2.0 authorization. Before onboarding, you register an OAuth 2.0 application in ServiceNow. During onboarding, SaaS Security redirects you to ServiceNow to log in and grant access. After connecting, SaaS Security scans your ServiceNow instance for misconfigured settings, third-party plugins, and account risks.
You can also use the same OAuth 2.0 application to enable ServiceNow ticketing from SaaS Security. Onboarding for scans and linking for ticketing are separate procedures, but the OAuth 2.0 application can include redirect URLs for both.
The onboarding process requires the following credentials:
| Item | Description |
|---|---|
| Client ID | Generated by ServiceNow to uniquely identify your OAuth 2.0 application. |
| Client Secret | Generated by ServiceNow; used by SaaS Security to authenticate to the OAuth 2.0 application. |
| Instance URL | The unique URL for your ServiceNow instance. |
Step 1 — Get the redirect URL from Cortex
Before registering your OAuth 2.0 application in ServiceNow, retrieve the redirect URL that SaaS Security requires.
- Log in to Cortex.
- Select Settings > Data Sources and Integrations > Add New and click the ServiceNow tile.
- On the Capabilities tab, enter a name for this instance.
- Under Default Capabilities, confirm Security Posture is selected.
- Click Next.
- On the Connections tab, select OAuth 2.0. SaaS Security displays the Redirect URL value on the configuration page.
- Copy the redirect URL and save it to a text file.
Note: Do not complete the onboarding flow yet. You will return to this page after configuring ServiceNow.
Step 2 — Create an authentication scope in ServiceNow
By default, an OAuth token grants full access to all REST APIs the ServiceNow account can access. Create an authentication scope to limit SaaS Security access to the Table API only.
- Log in to ServiceNow as an administrator.
- Verify that the REST API Auth Scope plugin (com.glide.rest.auth.scope) is activated. Navigate to System Definition > Plugins and search for the plugin. If it is not installed, follow the ServiceNow documentation to activate it.
- Create the authentication scope:
- Navigate to the Authentication Scopes table (sys_auth_scope.list) using the filter navigator.
- Click New.
- Enter a Name for the scope — for example, SaaS-Security-Connector. Optionally add a Description.
Note: Record this name. You will need it when configuring the REST API Auth Scope and the OAuth 2.0 application.
- Click Submit.
- Create a REST API Auth Scope and link it to your authentication scope:
- Navigate to System Web Services > API Auth Scopes > REST API Auth Scope.
- Click New.
- Enter a Name for the REST API Auth Scope.
- From the REST API list, select Table API.
- Configure the access level:
- Read-only access (configuration scans, account scans, third-party plugin scans; no automated remediation): Deselect Apply auth scope to all http methods in this API, then set HTTP Method to GET.
- Read and write access (scans plus automated remediation): Select Apply auth scope to all http methods in this API.
- In the Auth Scope field, enter the name of the authentication scope you created.
- Click Submit.
Step 3 — Create an OAuth 2.0 application in ServiceNow
- Log in to ServiceNow as an administrator.
- Navigate to System OAuth > Application Registry.
- Click New and select Create an OAuth API endpoint for external clients.
- Fill in the application details:
- Redirect URL — Enter the redirect URL you copied from Cortex. If you also want to enable ticketing, add the ticketing redirect URL separated by a comma.
- Auth Scopes — Add the authentication scope you created in Step 2.
- If the form includes an Enforce Token Restrictions checkbox, make sure it is not selected.
- Click Submit. ServiceNow registers the application and displays it in the Application Registries list.
- Open your OAuth 2.0 application and copy the Client ID and Client Secret to a text file.
Note: Do not proceed until you have copied both values. You must provide them during onboarding.
Step 4 — Verify ServiceNow table access
SaaS Security must be able to access the following ServiceNow tables via the REST Table API:
sys_plugins, sys_properties, sys_scope, sys_user, sys_user_has_role, sys_user_role, oauth_entity, oauth_credential, v_plugin, sys_db_object, pwd_reset_request
For each table:
- Navigate to System Definition > Tables.
- Locate the table record and click its name to open it.
- Select the Application Access tab.
- Verify that Allow access to this table via web services is selected. If not, select it and click Update.
Step 5 — Connect SaaS Security to ServiceNow
- Return to the Cortex onboarding flow you started in Step 1 (or navigate to Settings > Data Sources and Integrations > Add New > ServiceNow tile).
- On the Connections tab, select OAuth 2.0.
- Enter your Instance URL, Client ID, and Client Secret.
- Select the permission level:
- Read Permissions — if you configured the authentication scope for GET only.
- Read and Write Permissions — if you configured the authentication scope for all HTTP methods.
- Click Connect. SaaS Security redirects you to the ServiceNow login page.
- Log in using a ServiceNow administrator account assigned to the admin role.
Note: The account must not be assigned to the snc_read_only role — this restricts the account to read-only access and will cause onboarding to fail. After onboarding is complete, you can restrict the account to read-only access. Full access is required only during onboarding and reauthentication.
- Review the consent form and click Allow to grant access.
- On the Configurations tab:
- Set the Sync Interval.
- (Optional) Add a Tag.
- Click Next to complete onboarding.
Onboard Shopify
SaaS Security connects to the Shopify API using an API token generated from a custom Shopify app. Creating a custom app ensures the token is scoped to only the permissions SaaS Security requires. After connecting, SaaS Security scans your Shopify store for misconfigured settings and account risks.
Note: These steps onboard a single Shopify store. To scan multiple stores, onboard each store separately. The supported Shopify account plan for SaaS Security scans is the Shopify Plus plan.
The onboarding process requires the following credentials:
| Item | Description |
|---|---|
| API Token | A unique alphanumeric string that Shopify generates for a custom app you create. SaaS Security uses this token to authenticate to the Shopify API with the scopes specified in the custom app. |
| Store Name | The permanent subdomain identifier for your store, derived from the default URL Shopify assigned: <store-name>.myshopify.com. |
Step 1 — Identify the Shopify account
Identify the Shopify account you will use to create the custom app.
Required permissions: The account must be assigned to the Organization Owner role to create a custom app and generate an API token.
Step 2 — Create a custom app and generate an API token
- Open a browser to the Shopify admin login page and log in to the store you want SaaS Security to scan.
- Click Settings in the lower-left corner to open store settings.
- From the left navigation pane, select Apps and sales channels.
- Click Develop apps.
- Click Create app.
- In the Create an app dialog, enter a name for the app and click Create app. Shopify displays a tabbed configuration page for the new app.
- On the Configuration tab, configure the Admin API Integration scopes:
- Click Configure under Admin API Integration.
- Select the following scopes:
- read_apps
- read_privacy_settings
Note: The read_users scope is also required but is restricted by default and not available for selection here. You will request access to this scope from Shopify Plus Support in a later step.
- Click Save.
- On the API credentials tab, click Install app, then confirm by clicking Install in the dialog.
- Contact Shopify Plus Support to request access to the read_users scope for your app:
- In the upper-right corner of the page, locate your store's brand name (default: My Store) and select <brand-name> > Shopify Plus Support.
- Click Chat with us and ask the support agent to enable the read_users scope for your application.
It can take a few minutes to an hour for Shopify Plus Support to enable the scope.
- After Shopify Plus Support enables read_users, add the scope to your app:
- On the Configuration tab, click Edit under Admin API Integration.
- Select the read_users scope.
- Click Save.
- On the API credentials tab, click Reveal token once to display the API token.
- Copy the API token and save it to a text file.
Note: Do not proceed until you have copied the API token. You must provide it during the onboarding process.
Step 3 — Identify your store name
Your store name is the subdomain of the default URL Shopify assigned when you created the store (<store-name>.myshopify.com).
- Click Settings in the lower-left corner to open store settings.
- In the left navigation pane, locate the default URL for your store. The store name is the value before .myshopify.com.
Step 4 — Connect SaaS Security to Shopify
- Log in to Cortex.
- Select Settings > Data Sources and Integrations > Add New and click the Shopify tile.
- On the Capabilities tab, enter a name for this instance.
- Under Default Capabilities, confirm Security Posture is selected.
- Click Next.
- On the Connections tab, select Log in with Credentials.
- Enter your API Token and Store Name.
- Click Next.
- On the Configurations tab:
- Set the Sync Interval.
- (Optional) Add a Tag.
- Click Next to complete onboarding.
Onboard Slack Enterprise
SaaS Security connects to the Slack Enterprise API using a User OAuth Token generated from a Slack org-wide app that you create. A Slack org-wide app is deployed across all workspaces in your organization.
Note: The Slack Enterprise connector was updated in May 2025 to support the Identity Security dashboard. If you onboarded your Slack Enterprise instance before this update and want to view account risks in the Identity Security dashboard, you must re-onboard your Slack instance. Before re-onboarding, add the admin.users:read OAuth scope to your existing org-wide app.
Onboarding consists of two tasks:
- Create an org-wide app and generate a User OAuth Token
- Connect SaaS Security to your Slack Enterprise instance
Task 1 — Create an App for Accessing Your Slack Enterprise Instance
Step 1 — Identify the administrator account
Identify the Slack administrator account you will use to create the org-wide app.
Required permissions: The account must be assigned to the Org Admin role or a role with greater permissions, because you will install the app across all workspaces in your organization.
Step 2 — Create the Slack app
- Log in to the Slack API console and navigate to the Your Apps page at api.slack.com/apps.
- Click Create New App.
- In the Create an app dialog, select From scratch.
- In the Name app & choose workspace dialog, enter a name for your app and select a workspace. You will configure the app in this workspace and later deploy it across your organization.
- Click Create App. Slack Enterprise displays the configuration settings for your new app.
Step 3 — Configure the app scopes and opt in to org-wide deployment
- Navigate to OAuth and Permissions settings and locate the Scopes section.
- Under Bot Token Scopes, click Add an OAuth Scope and select team:read.
- Navigate to Org Level Apps settings and click Opt in to the org apps program.
- Navigate back to OAuth and Permissions settings and locate the Scopes section.
- Under User Token Scopes, click Add an OAuth Scope and add the following scopes:
- admin.teams:read
- auditlogs:read
- team:read
- admin.users:read (required for identity scans)
Step 4 — Install the app and copy the User OAuth Token
- In the OAuth and Permissions settings, locate the OAuth Tokens for Your Workspace section and click Install to Organization. Slack Enterprise generates tokens for your app.
- Copy the User OAuth Token and save it to a text file.
Note: Do not proceed until you have copied the User OAuth Token. You must provide this token during onboarding when SaaS Security prompts you for an API Key.
Task 2 — Connect SaaS Security to Your Slack Enterprise Instance
- Log in to Cortex.
- Select Settings > Data Sources and Integrations > Add New and click the Slack Enterprise tile.
- On the Capabilities tab, enter a name for this instance.
- Under Default Capabilities, confirm Security Posture is selected.
- Click Next.
- On the Connections tab, enter your User OAuth Token in the API Key field.
- Click Next.
- On the Configurations tab:
- Set the Sync Interval.
- (Optional) Add a Tag.
- Click Next to complete onboarding.
Onboard Sumo Logic
SaaS Security connects to the Sumo Logic API using an access key that you generate as the Sumo Logic account owner. After connecting, SaaS Security Checks scans your Sumo Logic instance for misconfigured settings and account risks.
Note: The supported Sumo Logic account plan for SaaS Security scans is the Enterprise plan.
The onboarding process requires the following credentials:
| Item | Description |
|---|---|
| Admin Access ID | A unique alphanumeric string that identifies the access key pair — analogous to a user ID. |
| Admin Access Key | The secret credential SaaS Security Checks uses to authenticate API requests — analogous to a password. |
| Endpoint Region | The region where Sumo Logic hosts your data. |
Step 1 — Generate a Sumo Logic access key
- Identify the Sumo Logic account you will use to generate the access key.
Required permissions: You must generate the access key from the account designated as the Sumo Logic account owner — either the user who registered the account or a user later designated as owner.
- Log in to Sumo Logic as the account owner.
- Navigate to your preferences: click your profile icon in the upper-right corner and select <profile-icon> > Preferences.
- Select the Personal Access Keys tab and click Add Access Key.
- In the Add New Access Key window, enter a meaningful name for the key — for example, SaaS-Security-Integration.
- Under Scopes, select the Custom option and select the following scopes:
Note: Because the access key is generated from the account owner (highest privilege level), explicitly limit the key's permissions to the minimum required by SaaS Security Checks.
- Access Keys - View
- Access Keys - Manage
- Users And Roles - View
- Users And Roles - Manage
- Content admin
- Manage Library
- Run Log Search - View/Manage
- View Collectors
- View Security Settings
- View Account Status
- Click Save. Sumo Logic generates the key and displays the Access ID and Access Key.
- Copy the Access ID and Access Key and save them to a text file.
Note: Do not proceed until you have copied both values. You must provide them during onboarding.
Step 2 — Identify your endpoint region
Use the following table to determine your region based on your Sumo Logic login URL:
| URL | Region |
|---|---|
| api.au.sumologic.com | AU (Australia) |
| api.ca.sumologic.com | CA (Canada) |
| service.de.sumologic.com | DE (Germany) |
| service.eu.sumologic.com | EU (European Union) |
| service.fed.sumologic.com | FED (US Government) |
| service.in.sumologic.com | IN (India) |
| service.jp.sumologic.com | JP (Japan) |
| service.sumologic.com | US1 (United States) |
| service.us2.sumologic.com | US2 (United States) |
Step 3 — Connect SaaS Security Checks to Sumo Logic
- Log in to Cortex.
- Select Modules > SaaS Security > Add Data Source and click the Sumo Logic tile.
- On the Capabilities tab, enter a name for this instance.
- Under Default Capabilities, confirm Security Posture is selected.
- Click Next.
- On the Connections tab, select Log in with Credentials.
- Enter your Admin Access ID, Admin Access Key, and Endpoint Region.
- Click Next.
- On the Configurations tab:
- Set the Sync Interval.
- (Optional) Add a Tag.
- Click Next to complete onboarding.
Onboard Workday
SaaS Security connects to Workday using OAuth 2.0 authorization via an API Client for Integrations. To enable secure background scanning, you create a non-human integration system user account and associate it with the API client. SaaS Security also pulls data from a custom report that you expose as a web service.
Onboarding consists of four tasks:
- Create an Integration System User
- Register an API Client for Integrations
- Create a Custom Report
- Connect SaaS Security to Workday
The onboarding process requires the following credentials:
| Item | Description |
|---|---|
| Client ID | Generated by Workday to uniquely identify the API Client for Integrations you create. |
| Client Secret | Generated by Workday; used by SaaS Security to authenticate to the API client. |
| Token Endpoint | Used by SaaS Security to generate an authentication token. |
| Refresh Token | A persistent token that maintains a secure connection independently of user sessions. |
| Custom Audit Log Report Web Service URL | The JSON web service URL for the custom report that SaaS Security uses to pull data from your Workday instance. |
Task 1 — Create an Integration System User
Create a non-human integration system user account to allow SaaS Security to scan Workday independently of human user sessions.
Step 1 — Identify the administrator account
Required permissions: You must have Security Administrator permissions in Workday to create the integration system user.
Step 2 — Create the integration system user
- Log in to the Workday console using the Security Administrator account.
- In the search field, search for Create Integration System User and select it from the results.
- On the Create Integration System User page, specify a username and password.
- Select the Do Not Allow UI Sessions checkbox for enhanced security.
- Click OK.
Step 3 — Create a security group for the integration system user
- Search for Create Security Group and select it from the results.
- On the Create Security Group page:
- From the Type of Tenanted Security Group drop-down, select Integration System Security Group (Unconstrained).
- Enter a name for the security group and click OK.
- On the Integration System Security Group (Unconstrained) page:
- In the Integration System Users field, select the integration system user you created.
- Click OK.
Step 4 — Assign domain security policy permissions
- Search for Maintain Permissions for Security Group and select it from the results.
- On the Maintain Permissions for Security Group page:
- Set Operation to Maintain.
- Set Source Security Group to the security group you created.
- Click OK.
- On the second Maintain Permissions for Security Group page:
- Select the Domain Security Policy Permissions tab.
- Add the following domain security policies with View Only access:
| Domain Security Policy | Access |
|---|---|
| Workday Accounts | View Only |
| Worker Data: Public Worker Reports | View Only |
| Security Administration | View Only |
| Security Configuration | View Only |
| System Auditing | View Only |
Step 5 — Activate pending security policy changes
- Search for Activate Pending Security Policy Changes and select it from the results.
- Enter a comment describing the changes and click OK.
- On the confirmation page, select the Confirm checkbox and click OK.
Task 2 — Register an API Client for Integrations
Required permissions: You must have Security Administrator permissions in Workday.
- Log in to the Workday console using the Security Administrator account.
- Search for Register API Client for Integrations and select it from the results.
- On the Register API Client for Integrations page, complete the following fields:
| Field | Value |
|---|---|
| Client Name | A unique name — for example, SaaS_Security_Integration_Client. |
| Refresh Token Timeout (in days) | The number of days the refresh token is valid — for example, 365. Do not select Non-Expiring Refresh Tokens. |
| Scope (Functional Areas) | Select Tenant Non-Configurable and System. Verify that Workday Query Language appears under the Includes Domains column for the System functional area. |
| Include Workday Owned Scope | Select this checkbox. |
- Click OK. Workday registers the API client and displays the Client ID and Client Secret.
- Copy the Client ID and Client Secret and save them to a text file.
Note: Do not proceed until you have copied both values. You must provide them during onboarding.
- Generate a Refresh Token for the integration system user:
- On the Edit API Client for Integrations page, click the ellipsis (...) next to the client name.
- Select API Client > Manage Refresh Tokens for Integrations.
- In the Workday Account field, select the integration system user you created and click OK.
- On the Delete or Regenerate Refresh Token page, select Generate New Refresh Token and Confirm Delete.
- Click OK.
- Copy the Refresh Token and save it to a text file.
Note: Do not proceed until you have copied the Refresh Token.
- Get the Token Endpoint:
- Search for View API Clients and select it from the results.
- On the View API Clients page, copy the Token Endpoint value and save it to a text file.
Note: Do not proceed until you have copied the Token Endpoint.
Task 3 — Create a Custom Report
SaaS Security pulls data from a custom report exposed as a web service. Complete the following steps using the Workday Security Administrator account.
- Search for Create Custom Report and select it from the results.
- On the Create Custom Report page:
- Enter a Report Name.
- Select Advanced from the Report Type list.
- Select the Enable As Web Service and Optimized for Performance checkboxes.
- Set Data Source to Processed Transactions for Range, System Account, Task and Business Object.
- Click OK.
- On the Edit Custom Report page, select the Columns tab and add the following columns:
| Business Object | Field | Column Heading Override XML Alias |
|---|---|---|
| Processed Transaction | Classes Updated | Classes_Updated |
| Processed Transaction | Instances Updated | Instances_Updated |
| Processed Transaction | Secured Task Executed | Task_Behavior |
| Processed Transaction | Entry Moment | Entry_Moment |
| Processed Transaction | Secured Task Executed | Secured_Task_Executed |
| Processed Transaction | Processed Transaction | Processed_Transaction |
| Processed Transaction | System Account | System_Account |
| Attributes that Changed | Changed Attribute | Changed_Attribute |
| Attributes that Changed | Previous Value | Previous_Value |
| Attributes that Changed | Value | Value |
- Under Group Column Headings, add the Attributes that Changed business object.
- Select the Filters tab and add filters for the Task Behavior field. Add an Or condition for each of the following values (operator: exact match with the selection list, type: Value specified in this filter):
- Edit Tenant Setup - HCM
- Edit Tenant Setup - Global
- Edit Tenant Setup - Security
- Edit Tenant Setup - System
- Edit Tenant Setup - Reporting and Analytics
- Edit Tenant Setup - Recruiting
- Edit Tenant Setup - Payroll
- Edit Tenant Setup - Integrations
- Select the Prompts tab:
- Select the Display Prompt Values in Subtitle checkbox.
- Add the following prompts (mark From Moment and To Moment as Required):
| Field | Label For Prompt XML Alias | Required |
|---|---|---|
| From Moment | From_Moment | Yes |
| To Moment | To_Moment | Yes |
| Business Object | Business_Object | <p> </p> |
| Task | Task | <p> </p> |
| Workday Account | Workday_Account | <p> </p> |
Note: If the Business Object and Workday Account fields are not available, select Populate Undefined Prompt Defaults to add them.
- Select the Share tab and configure the following sharing options:
| Field | Value |
|---|---|
| Report Definition Sharing Options | Share with specific authorized groups and users |
| Authorized Groups | The security group you created for the integration system user |
| Authorized Users | The integration system user you created |
- On the Sort tab, do not add or modify any fields. The Sort tab must remain in its default state.
- Click OK to save the report.
- Get the web service URL:
- In the banner of the Create Custom Report page, click the ellipsis (...) next to the report name and select Web Service > View URLs.
- On the View URLs Web Service page, locate the JSON section.
- Copy the JSON URL and save it to a text file.
Note: Do not proceed until you have copied the JSON web service URL.
Task 4 — Connect SaaS Security to Workday
- Log in to Cortex.
- Select Settings > Data Sources and Integrations > Add New and click the Workday tile.
- On the Capabilities tab, enter a name for this instance.
- Under Default Capabilities, confirm Security Posture is selected.
- Click Next.
- On the Connections tab, select Log in with Credentials.
- Enter the following values:
- Client ID
- Client Secret
- Token Endpoint
- Refresh Token
- Custom Audit Log Report Web Service URL (JSON format)
- Click Next.
- On the Configurations tab:
- Set the Sync Interval.
- (Optional) Add a Tag.
- Click Next to complete onboarding.
Onboard Wrike
SaaS Security connects to Wrike using OAuth 2.0 authorization. Before onboarding, you create an OAuth 2.0 integration app in Wrike. During onboarding, SaaS Security redirects you to Wrike to log in and grant access.
Onboarding consists of two tasks:
- Collect credentials for accessing your Wrike instance
- Connect SaaS Security to Wrike
The onboarding process requires the following credentials:
| Item | Description |
|---|---|
| Client ID | Generated by Wrike to uniquely identify the OAuth 2.0 integration app you create. |
| Client Secret | Generated by Wrike; used by SaaS Security to authenticate to the integration app. |
| Email ID | The login email address of the Wrike Account Administrator who created the OAuth 2.0 integration app. |
Task 1 — Collect Information for Accessing Your Wrike Instance
Step 1 — Get the redirect URL from Cortex
Before creating your OAuth 2.0 integration app in Wrike, retrieve the redirect URL that SaaS Security requires.
- Log in to Cortex.
- Select Settings > Data Sources and Integrations > Add New and click the Wrike tile.
- On the Capabilities tab, enter a name for this instance.
- Under Default Capabilities, confirm Security Posture is selected.
- Click Next.
- On the Connections tab, the Redirect URL value is displayed.
- Copy the redirect URL and save it to a text file.
Note: Do not complete the onboarding flow yet. Return to the Add Data Source page and proceed to create the OAuth app in Wrike.
Step 2 — Identify the Wrike administrator account
Identify the Wrike administrator account you will use to create the OAuth 2.0 integration.
Required permissions: The OAuth 2.0 integration must be created by an Account Administrator.
Step 3 — Create the OAuth 2.0 integration app in Wrike
- Open a browser and go to login.wrike.com and log in as the Account Administrator.
- Navigate to the API Apps page:
- Click your profile icon in the upper-right corner and select Profile > Apps & Integrations.
- Select the API tab.
- Enter an app name and click Create new. Wrike displays a configuration page for your new app, including the Client ID and Client Secret.
- (Optional) Enter a description for the app.
- Copy the Client ID and Client Secret and save them to a text file.
Note: Do not proceed until you have copied both values. You must provide them during onboarding.
- Click Add Redirect URI and enter the redirect URL you copied from Cortex.
- Click Save.
Task 2 — Connect SaaS Security to Wrike
- Return to the Cortex onboarding flow (or navigate to Settings > Data Sources and Integrations > Add New > Wrike tile).
- On the Connections tab, enter your Client ID, Client Secret, and Email ID.
- Click Next. SaaS Security redirects you to the Wrike login page.
- Log in to the Wrike administrator account. Wrike displays a consent form listing the access permissions SaaS Security requires.
- Review the consent form and click Allow to grant the requested permissions.
- On the Configurations tab:
- Set the Sync Interval.
- (Optional) Add a Tag.
- Click Next to complete onboarding.
Onboard YouTrack
SaaS Security connects to the YouTrack API using a permanent token that you generate from a YouTrack administrator account. After connecting, SaaS Security scans your YouTrack instance for misconfigured settings.
Onboarding consists of two tasks:
- Collect the instance name and generate a permanent token
- Connect SaaS Security to YouTrack
The onboarding process requires the following credentials:
| Item | Description |
|---|---|
| Instance Name | The unique subdomain that identifies your organization's YouTrack instance, as shown in your YouTrack URL: <instance-name>.youtrack.cloud. |
| Permanent Token | A token generated from a YouTrack administrator account assigned to the System Admin role. The token must be scoped to YouTrack and YouTrack Administration. |
Task 1 — Collect Information for Accessing Your YouTrack Instance
Step 1 — Identify your YouTrack instance name
Open a browser and go to your YouTrack login page. Your instance name is the subdomain shown in the URL: <instance-name>.youtrack.cloud.
Note: Record your instance name before proceeding. You must provide it during onboarding.
Step 2 — Generate a permanent token
- Log in to YouTrack as an administrator assigned to the System Admin role.
- Click your account avatar in the upper-right corner and select <your-avatar> > Profile.
- On your profile page, go to Account Security.
- In the Tokens section, click New token.
- In the New Permanent Token dialog:
- Enter a name for the token.
- Select the following scopes:
- YouTrack
- YouTrack Administration
- Click Create. YouTrack displays the new permanent token.
- Click Copy token and save it to a text file.
Note: Do not proceed until you have copied the token. You must provide it during onboarding.
Task 2 — Connect SaaS Security to YouTrack
- Log in to Cortex.
- Select Settings > Data Sources and Integrations > Add New and click the YouTrack tile.
- On the Capabilities tab, enter a name for this instance.
- Under Default Capabilities, confirm Security Posture is selected.
- Click Next.
- On the Connections tab, enter your Instance Name and Permanent Token.
- Click Next.
- On the Configurations tab:
- Set the Sync Interval.
- (Optional) Add a Tag.
- Click Next to complete onboarding.
SaaS Security Overview
The SaaS Overview dashboard provides unified visibility into your multi-SaaS security posture to streamline daily operations. The dashboard seamlessly aggregates and presents security data from all four core SaaS Security pillars including: SaaS Security Posture Management, SaaS Identity Security, SaaS Data Security, and SaaS Agent Security. Leverage this view to:
- Triage Threats: Detect and investigate active security events in real time.
- Manage Posture: Surface and prioritize misconfigurations across connected applications and assets.
- Provide Executive Reporting: Track aggregate risk scores and compliance trends for stakeholder updates.
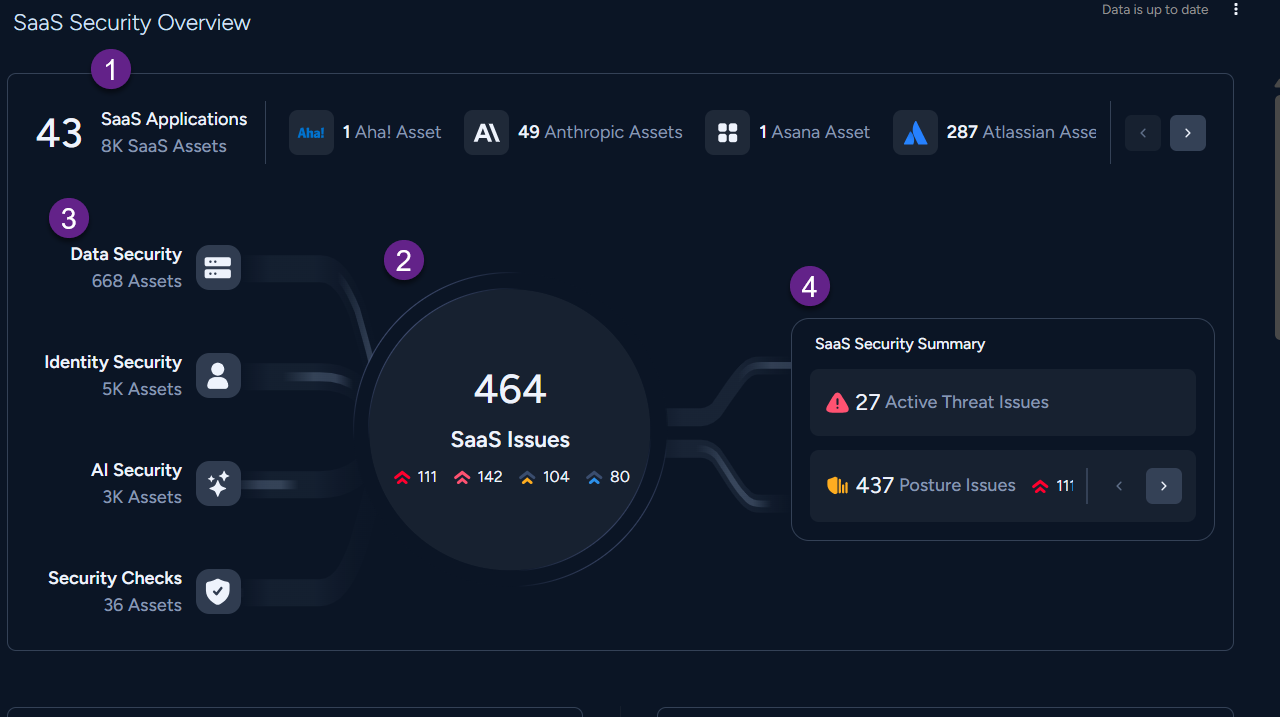
Review the descriptions below for a detailed breakdown of interactive widgets:
- The application inventory header bar displays high-level statistics for monitored applications and assets along with state sync indicators. This high-level indicator provides you with a comprehensive view of all your SaaS applications and impacted assets.
- The central interactive visual graph maps security domains to aggregated issues and severity classifications. This helps you gauge the overall health of your security operations and ensure that your team is maintaining a positive burn-down rate of vulnerabilities.
- Domain Security Nodes: Hover over or click a domain node to highlight tracked vulnerability data, such as Agents with Sensitive Data, and view domain-specific asset inventories.
- Summarizes Findings into two operational buckets:
- Active Threat Issues
- Posture Issues
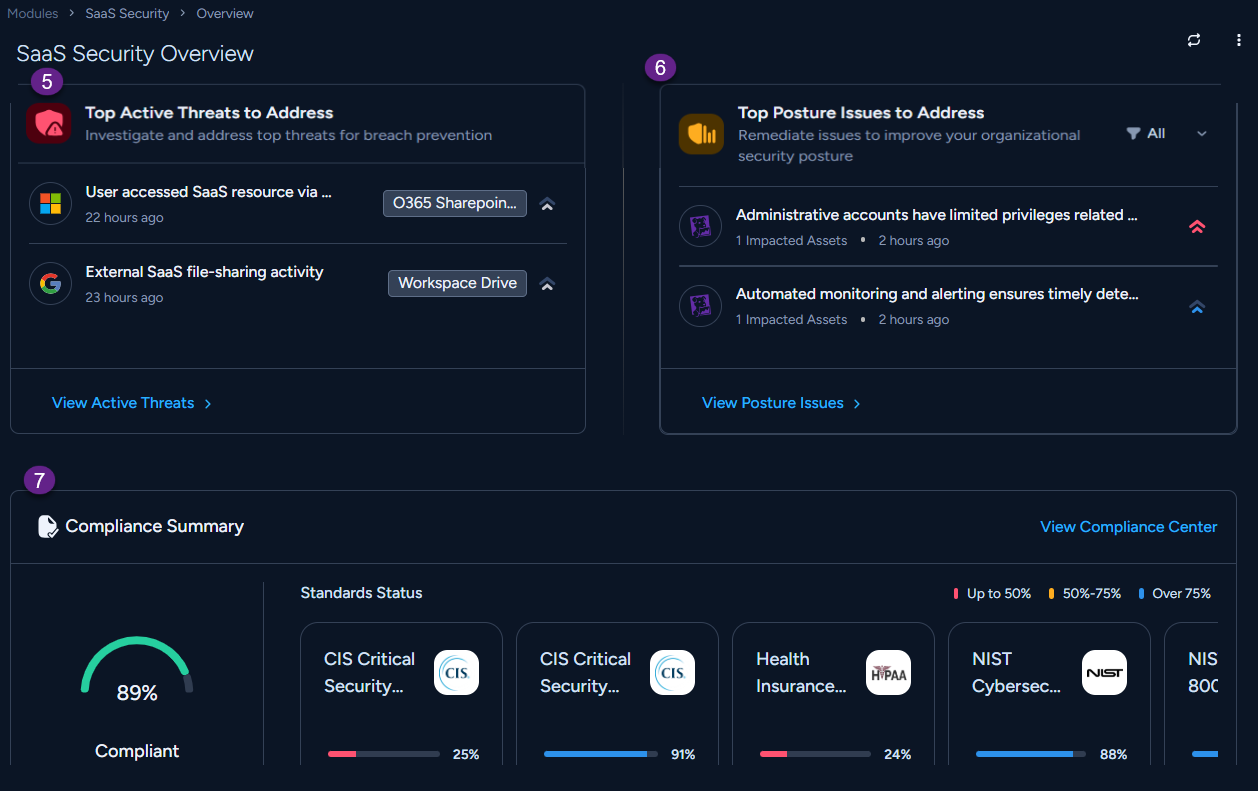
- Top Active Threats to Address: Displays a prioritized list of specific threat alerts to help you identify and investigate high-risk activities that could lead to a breach.
- Top Posture Issues to Address: Lists the most critical configuration issues and vulnerabilities, categorized by asset type (Data, Identity, API) and the number of impacted assets, to help your team remediate the most widespread risks to your organization’s security posture.
- Compliance Summary: Tracks compliance percentage across specific global standards, to help you report out regulatory readiness to stakeholders and prioritize efforts to close specific compliance gaps.
SaaS Security Checks
SaaS Security Checks provides security telemetry for posture misconfigurations, vulnerabilities, and compliance in one unified view. This consolidated dashboard provides a queryable, prioritized view of your attack surface, accelerating automated triage, incident response, and compliance auditing.
The dashboard captures the following key metrics to help you remediate assets at risk:
- SaaS Security Check Score: Renders the current, aggregate security posture score as a normalized percentage, while also tracking score volatility over a rolling 90-day window to monitor long-term posture drift.
- Overall Compliance: Monitors adherence to mapped compliance standards and frameworks.
- Provider Instances by Security Check Score: Categorizes individual SaaS tenant configurations (such as Salesforce, Mural, or Google Workspace) to identify low-performing integrations, based on their security scores.
- Issues to Address: Acts as a prioritized vulnerability backlog, organizing discovered misconfigurations by severity to guide triage queues.
Optionally, you can also navigate to Module > SaaS > Security Checks > Posture to view a tabular list of Posture Issues filtered by SaaS Issues. Select any Issue to view a full list of Remediation Actions. Here you can also view the Evidence section, that includes granular information about specific application settings that lead to misconfigurations.
Provider Instances Security Check
The Provider Instances page provides a high-level aggregation of tenant security scores and an interactive, list view for analyzing and remediating individual instances.
\
This page consolidates SaaS application security posture data across all onboarded instances:
- Overall Security Check Score: Displays the global average posture score across all integrated instances. Applications are further categorized into three security score-based buckets:
- Up to 50% (Red): Severe posture gaps
- Between 50%–75% (Yellow): Moderate posture alignment
- Over 75% (Green): High posture alignment
- Providers (Distribution Tiles): Lists onboarded SaaS Applications with active instance count for each provider.
Instance Inventory List
The table displays granular telemetry for each active SaaS application.
Provider Instances: The unique, user-defined identifier/name for the specific SaaS tenant. These are hyperlinked to route administrators to the deep-dive configuration and issues page for that specific instance.
- Provider Type: The underlying third-party SaaS vendor platform associated with the instance (e.g., Mural, Cisco Meraki).
- Application Tag: Custom metadata tags assigned to instances to categorize environments for scoped policies and reporting.
- Connector Status: The operational state of the API integration. A green Connected status indicates active, authorized data ingestion.
- Overall Security Check Score: The normalized security score (0–100%) computed for the individual instance.
Click on an instance to view Passed Checks and take action on Failed Checks.
Detection Rules
Detection Rules help you identify policies that are already in place and available out-of-the-box to help you remediate configuration issues with SaaS applications. Follow the steps below to view SaaS Detection Rules.
- Navigate to Modules > SaaS Security > Detection Rules. This takes you to the Cloud Posture Security Rules page.
- Here you can select SaaS or AI > Filter In to see a full list of available out-of-the-box rules.
- Select a Rule to view more details. Options include:
- Rule Details: Displays a detailed description of the Rule and outlines execution scope.
- Compliance Controls: Maps this rule's execution logic to framework controls (such as SOC 2, ISO 27001, or CIS Benchmarks) for compliance audits.
Remediation Actions
Review remediation actions to see a prioritized list of steps you can take to resolve posture issues originating from SaaS Applications. Follow the steps below to view all the Remediation options:
- Navigate to Modules > SaaS Security > Security Issues > Posture to view a list of all issues with vulnerabilities originating from SaaS Application Posture.
- Click on any Issue to be taken to the Issue view.
- Select the Issue you wish to investigate. This opens the Remediation Actions side panel.
- The detailed side panel provides the following investigation and remediation options:
- The Overview tab on the Vulnerability Issues panel captures all the relevant details to further investigate the vulnerability including Summary, Details, Affected Assets, and Evidence.
- Select Resolution to view remediation options including Remediation Guidance. Detailed manual steps are listed to resolve the issue.
- Click War Room for real-time investigation capabilities. In the War Room you can capture case context from different sources and collaborate and execute remote actions across integrated products.
- Work Plan is available when you select an autonomous playbook in an issue's resolution tab. This view presents only the executed key tasks and their defined outputs, providing a focused view of resolution actions.
- Ticketing and Notifications: Jira, Slack, and Service Now integrations are available to create a ticket to resolve any issue. Webhook notification routing is also available for your auditing requirements.
Create and monitor tickets
Integrate SaaS Security with Jira or ServiceNow to streamline misconfiguration remediation. This integration allows security teams to delegate manual remediation tasks directly to SaaS application administrators using your organization's existing issue tracking system.
Prerequisites
Before managing tickets from the Cortex console, ensure:
- An active Jira or ServiceNow instance is connected and authenticated within your tenant settings. Follow these steps to activate Issue Syncing.
Ticket Management Workflows
1. Create a Ticket
When a SaaS Security issue requires manual intervention within a target SaaS application:
- Navigate to Cases and Issues and locate the target SaaS Posture or AI Agent Issue.
- Right-click on the Issue you wish to create a ticket for and select Run Automation. Integrations are available for Jira and Service Now. The workflow below uses Jira as an example:
- Select Create a Jira ticket from the available automations. If the Jira integration is not already present, you will be directed to provide the URL for you Jira instance and the associated secrets to initiate the integration.
- On the Create a Jira Ticket side-panel, enter your data for the Description, Issue Type, Project Key, and Summary fields.
- Under Sync Configuration, select Bi-directional, and click OK.
- Assign the ticket to the appropriate team member or administrator for investigation and resolution.
Once created, SaaS Security establishes a bi-directional reference linking the specific issue to the new ticket ID.
2. View Linked Tickets
You can track remediation progress directly from the SaaS interface:
- Navigate to the targeted Issue and choose War Room to view the highlighted ticket reference. To track remediation progress, click on the ticket to open the issue directly in Jira, and Service Now.
Send issues to Slack for remediation
Streamline issue remediation by routing SaaS Posture and AI Agent alerts directly to a dedicated Slack channel.
Prerequisites
- Set up outbound Slack issue notifications to link your channel.
Procedure
- Navigate to Cases & Issues.
- Locate and right-click the target issue.
- Select Create a case.
A notification for the new case posts to the linked Slack channel.
SaaS AI Agent Security
Cortex's AI Security Posture Management (AISPM) module surfaces SaaS AI Agent data to help you tackle the unique challenges of securing AI agents deployed across enterprise SaaS environments. It provides your security teams with comprehensive visibility, proactive threat detection, and automated enforcement mechanisms specifically tailored for agentic platforms. To get started, see Setup SaaS Security for AISPM.
Note: SaaS AI Agent Security is currently in Beta with limited availability. Contact your Customer Service Representative to activate AI Agent Security in your environment.
Core Capabilities
AISPM helps protect the autonomous workflows in your cloud environment with following key functionality:
- Visibility & Discovery—Provides a unified inventory and visibility into deployed agents, mitigating against "shadow AI" risks.
- Addresses Security Posture Risks—Issues such as authentication misconfigurations, insecure actions and workflows (e.g., agents forwarding corporate emails to personal addresses).
- Identifies misconfigured privileges where agents may inherit excessive permissions, allowing unintended access or actions.
- Exposes Threats such as vulnerabilities that may lead to injection attacks via System Prompts, Tools or Skills.
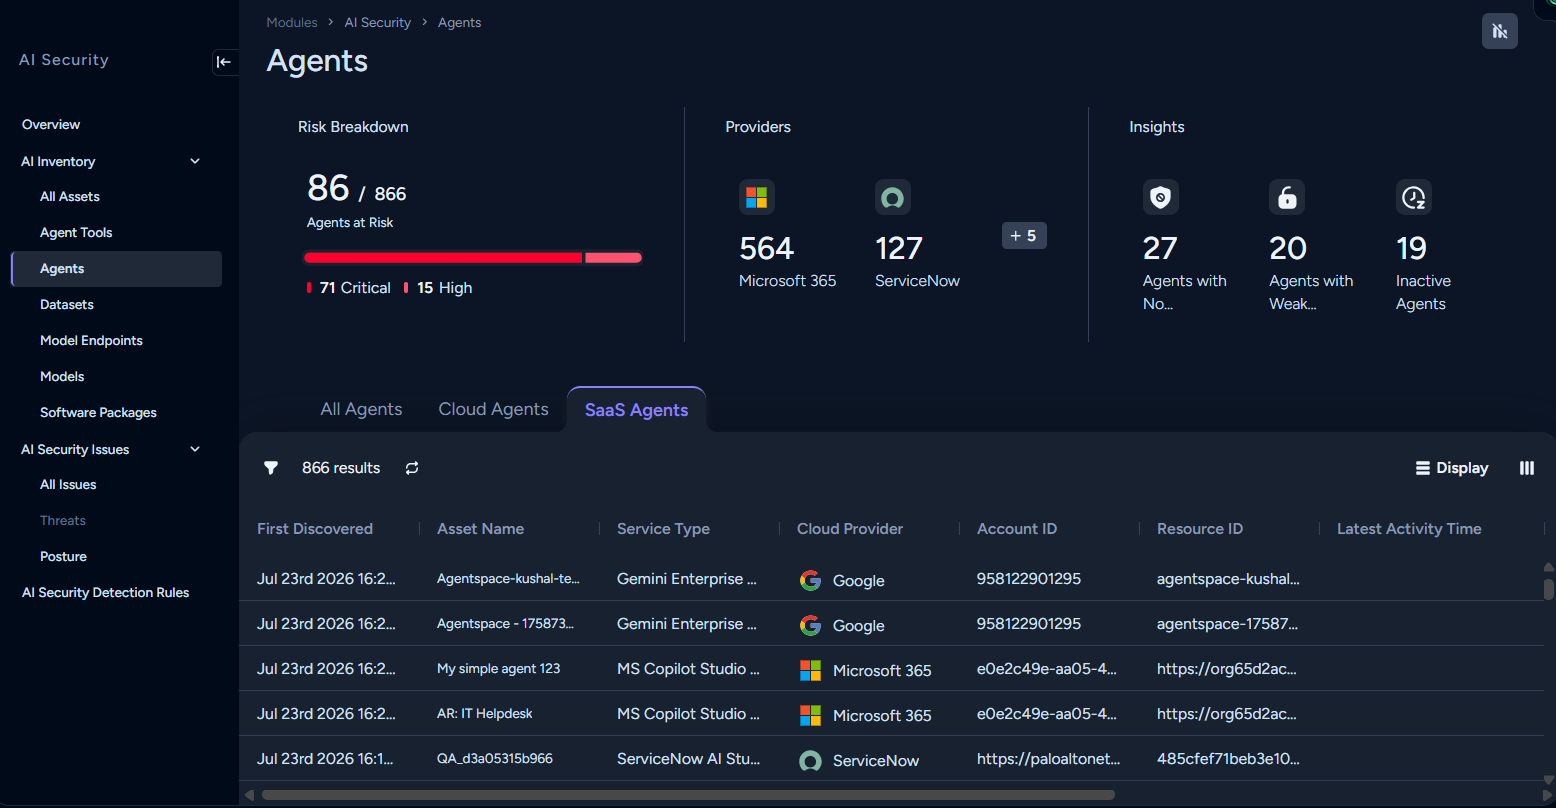
Supported Agent Platforms
AISPM is designed to onboard and secure a wide array of modern enterprise AI agent platforms, including:
- Atlassian Rovo
- Box AI Agents
- ChatGPT Enterprise
- Cursor Enterprise
- Gemini Enterprise
- Microsoft 365 Copilot and Copilot Studio
- ServiceNow AI Platform
AISPM provides a comprehensive view of all SaaS agents, their configurations, and security postures, offering end-to-end auditability and high-level dashboards for governance across your organization.
Setup SaaS Security for AISPM
Learn more about how SaaS security can help your security team reliably manage usage policies, close visibility gaps, and secure sensitive data housed across your entire cloud portfolio.
| Take Action | Start Here |
|---|---|
| Get Started with AISPM | <ul><li><p>Required Cortex License: SaaS Security requires one of the following Cortex Licenses:</p><ul><li>Cortex XSIAM</li><li>Cortex Runtime Security</li><li>Cortex Posture Security</li></ul></li><li>Enable Access: Ensure that you have whitelisted the required IPs to ensure optimal onboarding and connectivity.</li></ul> |
| Onboard SaaS Agents | <ul><li>Atlassian Rovo</li><li>Box AI Agents</li><li>ChatGPT Enterprise</li><li>Cursor Enterprise</li><li>Gemini Enterprise</li><li>Microsoft 365 Copilot</li><li>Microsoft Copilot Studio</li><li>ServiceNow AI Platform</li></ul> |
| Administration | <ul><li><p>Manage SaaS AI Agents</p><ul><li>View AI Agents</li><li>View Datasets</li><li>View Agent Tools</li><li>Remediation Actions</li></ul></li></ul> |
Onboard SaaS AI Agents
As you increasingly integrate AI agents—software powered by Large Language Models (LLMs) that connect to your enterprise systems and utilize memory to execute workflows—you also introduce new attack vectors. Effectively onboarding your AI agent platforms into a comprehensive AISPM framework is the critical first step to managing these risks.
Onboard your new and existing SaaS-based agent platforms to establish a secure, compliant cloud environment. Select a specific SaaS AI Agent to onboard:
- Atlassian Rovo
- Box AI Agents
- ChatGPT Enterprise
- Cursor Enterprise
- Gemini Enterprise
- Microsoft 365 Copilot
- Microsoft Copilot Studio
- ServiceNow AI Platform
Onboard Atlassian Rovo
To access your Atlassian instance, AISPM requires the following information, which you will specify during the onboarding process.
| Admin Email | <p>The login email address of the Atlassian Org Admin who created the API token and API key.</p><p> </p> |
|---|---|
| API Token | A token, generated by an Atlassian Org Admin, enables SSPM to authenticate to the administrator account. |
| API Key | A key, generated by an Atlassian Org Admin, that enables SSPM to scan and update organization settings and user accounts. SSPM uses this key to identify and manage the third-party plugins that users have connected to Jira or Confluence. |
| Organization ID | A unique, automatically generated identifier for your Atlassian Cloud account, serving as the primary identifier for managing users, products, billing, and settings centrally within the Atlassian ecosystem. Unlike organization names, which aren't unique, the Organization ID guarantees each organization has its own distinct identifier for use in the URL, API, and various integrations. |
- Generate and Copy an Administrator API Token.
- Log in to Atlassian using Org Admin credentials.
- From the Atlassian account profile, navigate to the API tokens page for the account (select Security > Create and manage API tokens or go to id.atlassian.com/manage-profile/security/api-tokens).
- Click Create API Token.
- Specify a name and an expiry date for your API token and click Create.
- Copy the generated API token. Do not continue to the next step unless you have copied it, as you must provide this token during the onboarding process.
- Generate and Copy an API Key and an Organization ID.
- Log in to the Atlassian Admin Portal (admin.atlassian.com) using Org Admin credentials.
- If you administer more than one Atlassian organization, select the organization you want SSPM to scan.
- Select Organization settings > API keys.
- Click Create API key.
- In the "Before you begin" page, choose "API key without scopes" and click Next.
- Specify a name and an expiry date for the key and click Next.
- Review your API Key details and click Create API key.
- Copy the Organization ID and the API key. Do not continue to the next step unless you have copied both, as you must provide this information during the onboarding process.
- Onboard Atlassian Rovo Platform to Cortex.
- Log in to Cortex.
- Select Settings > Data Sources and Integrations > Add New. You can use the Search bar to find the Atlassian connector.
- Click on the Atlassian tile and select the Add Another Instance.
- On the Capabilities page, provide an Instance Name and select the Agent Security scanning capability.
- Under Connections, provide Admin Email and Organization ID to authorize the connection. In addition, under Agent Security Scanning, provide the API Key and API Token to authenticate the application.
- Once Cortex validates the credentials and permissions, the onboarding process is complete.
- Validation and Scanning: Cortex will immediately begin scanning your onboarded platform. Note that scan time varies based on the amount of data; it takes at least one hour to display data in the AISPM dashboard.
Onboard Box AI Agents
Prerequisites
- Ensure you have the necessary administrative privileges in your Box instance, including the ability to access the Admin and Dev console.
- To access Box AI Studio and start building custom agents, your organization must have a Box - Enterprise Advanced license. If you would like to explore these capabilities, coordinate with your IT Administrator or Box Sales representative to ensure the proper licensing is in place.
Note: Box AI Studio is a Microsoft-native product, not a feature developed or managed by Palo Alto Networks.
- Ensure you have enabled Box AI. To do this, go to your Box instance > Box AI > Settings and click Enable Box AI.
- Create and Configure a Custom Box App
- Sign in to your Box instance.
- From the left navigation pane, select Dev Console > Create Platform App > Custom App.
- On the Custom App page, enter the following information:
- Give a suitable App Name.
- Give a suitable Description (optional).
- For Purpose, choose Automation from the drop-down and click Next.
- Select Server Authentication (Client Credentials Grant) for the authentication method and click Create App.
- On the newly created app page, select the Configuration tab.
- In the OAuth 2.0 Credentials section, copy the Client ID and the Client Secret (Fetch Client Secret) and keep it handy for use during onboarding.
- In the App Access Level section, choose App+Enterprise Access.
- In the Application Scopes > Content Actions section, ensure you select the following checkbox options:
- Read all files and folders stored in Box.
- Write all files and folders stored in Box.
- Manage AI.
- Ensure you deselect all other checkbox options under Application Scopes > Administrative Actions and Application Scopes > Developer Actions.
- Click Save Changes.
- Back on the newly created app page, select Authorization > Review and Submit and then click Submit. Your new app will move to the Pending Authorization state.
- Authorize the App in the Admin Console.
- Click Back to My Account on the left navigation pane and select Admin Console > Integrations > Platform Apps Manager.
- On the Server Authentication Apps list, find the app you created and select ... > Authorize App > Authorize.
-
Retrieve the Enterprise ID
- Go Back to My Account > Dev Console and select the app you created.
- Copy the Enterprise ID (available in the General Settings tab).
Note: Ensure you repeat the authorization process again if you modify any settings during configuration.
- Onboard Box AI Agents to Cortex:
- Log in to Cortex.
- Select Settings > Data Sources and Integrations > Add New. You can use the Search bar to find the Box connector.
- You may find multiple Box tiles, select the Box titled Box integration for SaaS Data and Posture Security for Box. Click on the tile and select the Add Another Instance.
- On the Capabilities page, provide an Instance Name and select the Agent Security scanning capability.
- On the Connections page, provide your Instance URL and select the Recommended authentication method. Provide your Client ID and Client Secret for the authentication flow.
- Once Cortex validates the credentials and permissions, the onboarding process is complete.
- Validation and Scanning: Cortex validates the credentials and permissions. After the validation is successful, you will see a confirmation message. Scanning begins immediately after a successful validation. The amount of time Cortex takes to scan varies based on the amount of scan data. At a minimum, it takes at least one hour to scan and display data in the Cortex dashboard.
Onboard ChatGPT Enterprise
- ChatGPT Enterprise & OpenAI Configuration
- Sign in to your ChatGPT Enterprise instance.
- Fetch the Organization ID and Workspace ID from ChatGPT Settings:
- Select ChatGPT > Manage Workspace > Settings and keep them handy.
- To fetch the Secret Key, go to the OpenAI API-Keys site and click + Create new secret key.
- In the Create new secret key page, enter the required details and click Create secret key.
- During key generation, ensure that the Permissions is set to All. (OpenAI will revoke it in the subsequent steps).
- Ensure that this key is generated in the same Organization as your ChatGPT tenant. To confirm this, select Settings on the OpenAI website and ensure the Org ID is the same as what you fetched previously.
- Copy the new key and keep it handy.
-
To enable the generated key for the Compliance API scopes, send an email to support@openai.com with the following information:
- Last 4 characters of the generated API Key
- Key Name
- Created By Name
- Requested Scope - Read. Ensure that the generated key is unique for AISPM and not used in any other product. For example, you cannot use the same key for both Data Security and AISPM since the scope is different for both of them.
- Organization ID
Note: Further instructions are available in the ChatGPT API Reference.
- After OpenAI enables the key for the Compliance API, proceed to add the ChatGPT Enterprise connector.
- Onboarding ChatGPT to Cortex:
- Log in to Cortex.
- Select Settings > Data Sources and Integrations > Add New. You can use the Search bar to find the ChatGPT connector.
- Click on the ChatGPT tile and select the Add Another Instance.
- On the Capabilities page, provide an Instance Name and select Agent Security scanning capability.
- On the Connections page, provide your Instance URL and select the Recommended authentication method, enter the following information (that you gathered in the steps above and click Complete:
- Organization ID
- Workspace ID
- API Key
- Once Cortex validates the credentials and permissions, the onboarding process is complete.
- Validation and Scanning: Cortex establishes the API connection and validates the credentials and permissions. After the validation is successful, you will see a confirmation message. Scan periods vary based on the amount of data it is required to scan. At a minimum, it takes at least one hour to scan and display data in the AISPM dashboard.
Onboard Cursor Enterprise
Cursor Enterprise is the secure, scalable version of Cursor, an AI-powered code editor built on VS Code. It is designed for large organizations needing advanced features like SSO, audit logs, usage analytics, and data privacy controls to manage AI-assisted software development for complex codebases. It provides features such as IP allowlisting, team management, centralized security, and compliance tools (GDPR, CCPA, SOC 2) to meet enterprise security and governance needs, allowing teams to build faster and more efficiently.
Important: Due to Cursor Enterprise API restrictions, any discovery for Tools and Knowledge Bases is limited to the last 30 days. If you want to increase this duration, contact Technical Support.
- Create an Admin API Key in Cursor Enterprise.
- Go to the Cursor Enterprise dashboard and select Settings > API Keys > New API Key.
- Copy the generated Admin API Key and keep it handy for the onboarding steps.
- Onboard Cursor Enterprise to Cortex.
- Log in to Cortex.
- Select Settings > Data Sources and Integrations > Add New. You can use the Search bar to find the Cursor connector.
- Click on the Cursor tile and select Add Another Instance.
- On the Capabilities page, provide an Instance Name and select Agent Security scanning capability.
- On the Connections page, provide your Instance URL and enter your API Key to initiate the authentication flow.
- Once AISPM validates the credentials and permissions, the onboarding process is complete.
- Validation and Scanning: Cortex establishes the connection and validates the credentials and permissions. After successful validation, you will see a confirmation message. The amount of time Cortex takes to scan varies based on the amount of data it is required to scan. At a minimum, it takes at least one hour to scan and display data in the AISPM dashboard.
Onboard Gemini Enterprise
Gemini allows employees to use pre-built agents or create their own custom agents to perform tasks, analyze data, and automate workflows by securely connecting to company data and applications like Google Workspace and Salesforce. The platform aims to shift employees from tedious tasks to high-impact work while providing central governance and security.
To access your Gemini Enterprise instance, AISPM requires the following specific information during the configuration process:
| Item | Description |
|---|---|
| Service Account Email | A service account email in Gemini Enterprise is a special non-human account. Applications and virtual machines use this account to authenticate and access Google Cloud resources securely. It provides a secure identity for programmatic access to the Gemini for Google Cloud API and related services. |
| Project ID | A Project ID in Gemini Enterprise is a unique identifier for a Google Cloud project. Gemini Enterprise uses the Google Cloud platform, so its services and resources are organized within the same project structure. A Project ID is needed for authentication, billing, and access control when working with Gemini models and related services. |
| Location | <p>In Google Cloud's Gemini Enterprise, a "location" is a specific geographic area for creating, processing, and storing data. Location selection allows enterprises to control data residency. This control is important for data privacy, compliance, and meeting requirements in different regions.</p><p>Note: New locations created by Gemini Enterprise will be added by AISPM in a phased manner.</p> |
- Configure Google Cloud Console.
- Go to your project home page (where you developed your agent) in the Google Cloud console. Copy your project ID and project number and keep it handy for onboarding later.
- From the Google Cloud console, select Menu > APIs & Services > Enabled APIs & Services > +Enable APIs and services.
- To create a new service account, select Menu > IAM & Admin > Service Accounts > +Create service account.
- In the list of service accounts, click on the service account that you just created. The service account details are displayed. Copy the service account email address and keep it handy for onboarding later.
- Select Principals with access > View by principals > Grant access.
- In the Add principals section, specify the name of the principal.
- In the Assign roles section, select the Service Account Token Creator role and click Save.
- Onboard Platform to AISPM
- Log in to Cortex.
- Select Settings > Data Sources and Integrations > Add New. You can use the Search bar to find the Gemini Enterprise connector.
- Click on the Gemini Enterprise tile and select Add Another Instance.
- On the Capabilities page, provide an Instance Name and select Agent Security scanning capability.
- On the Connections page enter the following information that you gathered in Step 1:
- Project ID (You can use either the project ID or the project number.)
- Service Account Email
- Once AISPM validates the credentials and permissions, the onboarding process is complete.
- Validation and Scanning: Cortex establishes the API connection and validates the credentials and permissions. Cortex immediately begins to scan your onboarded agentic platform after a successful validation. The amount of time Cortex takes to scan varies based on the amount of data it is required to scan. At a minimum, it takes at least one hour to scan and display data in the AISPM dashboard.
Onboard M365 Copilot
Microsoft 365 Copilot is an AI-powered assistant integrated into Word, Excel, PowerPoint, Outlook, Teams, and other Microsoft 365 apps. It uses Large Language Models (LLMs) and your organization's data to help with tasks like drafting content, analyzing data, summarizing meetings, and generating ideas. It acts as a "copilot" by streamlining workflows, boosting creativity, and increasing productivity by turning natural language prompts into actions and insights within your familiar work environment.
Prerequisites
- To access M365 Copilot and start building custom agents, your organization must have a Microsoft 365 Copilot license. If you would like to explore these capabilities, coordinate with your IT Administrator or Microsoft Sales representative to ensure the proper licensing is in place.
Note: M365 Copilot is a Microsoft-native product, not a feature developed or managed by Palo Alto Networks.
- To manage Microsoft 365 Copilot agents and settings, your account must be assigned a specific administrative role. You can verify your current access level by viewing the agent list. While a Global Administrator has full control over the entire organization, Microsoft recommends using the AI Administrator role. This is a dedicated persona designed specifically for managing Copilot features and agent governance without granting unnecessary access to other parts of your system. If you only need to monitor the environment, the Global Reader role provides "view-only" access, allowing you to see agent status and availability without the ability to make changes or upload new packages. Consult your internal IT team to ensure one of these roles is assigned to your account and you list agents via the URL mentioned above.
- In the Setting tab, select Active for assignment type and Permanently assigned for assignment duration. Add a justification for your settings and Assign.
- Configure OATH Token Authentication Methods in Microsoft
To ensure a standardized login experience and support automated data extraction, configure Microsoft Entra ID to use Open Authentication (OATH) Time-based One-Time Password (TOTP) methods for the dedicated administrative account.
Note: To avoid a misconfiguration, ensure that you complete the following steps EXACTLY in the sequence provided. Deviating from this order can lead to authentication errors or service disruption.
Part A: Extract the Secret Key
- During the multi-factor authentication (MFA) setup for your service/admin account on the Scan the QR code page, select the Can't scan QR code? link.
- Record the Account name and the Secret key.
- Store the secret key in a secure location, such as a password manager, for later use during onboarding or recovery (this acts as your TOTP Secret).
- Click Next.
Part B: Verify the Token
- Enter the secret key into your preferred OATH-compliant application (e.g., Google Authenticator, Authy, or a hardware token).
- Click Next in the Microsoft portal.
- Enter the 6-digit verification code generated by your application to verify the sync.
- Click Next and then click Done to complete the initial token setup.
Part C: Register the Microsoft Authenticator App
Prerequisite: Ensure you have the Microsoft Authenticator app installed on your mobile device.
- Log in to your account's security overview portal. If the setup screen does not appear automatically, proceed to the following sub-steps:
- Navigate to Security Info: Select your profile icon in the top-right corner and click View Account. You will be redirected to the mysignins.microsoft.com/security-info page (or you can navigate to the Security Info page from the left navigation section).
- Access Sign-in Methods: In the left navigation pane, select Security Info.
- Click + Add sign-in method. From the drop-down menu, select Microsoft Authenticator app and click Add.
- Initialize App Setup: When the Start by getting the app screen appears, click Next. On the Set up your account in app screen, click Next again to reveal the setup QR code.
- Scan the QR Code: Open the Microsoft Authenticator app on your mobile device, add a new account, and scan the QR code displayed on your computer screen. Once scanned, click Next.
- Verify the Connection: The portal will display a two-digit number. Enter this number into the prompt on your mobile device to complete the test notification.
- Finalize Registration: Once the Notification approved message appears, click Next, then click Done.
- Verification: Confirm that Microsoft Authenticator now appears in your list of registered Sign-in methods.
Part D: Confirm the Default Sign-in Method
- Return to the Microsoft Entra admin center and select Users > Authentication methods.
- Verify that the Software OATH token is listed under the authentication records.
- Select Add authentication method or Change default manual method (if available) to ensure that the Third-party software OATH token option is configured as the primary requirement for compliance.
2. Onboard M365 Copilot to AISPM
- Log in to Cortex.
- Select Settings > Data Sources and Integrations > Add New. You can use the Search bar to find the Microsoft 365 Copilot connector.
- Click on the Microsoft 365 Copilot tile and select Add Another Instance.
- On the Capabilities page, provide an Instance Name and select Agent Security scanning capability.
- On the Connections page, provide your Instance URL.
- Under Authentication, the CREDENTIALS authentication method is selected by default. Click Next.
- On the Onboard Agent Platform page, enter your admin account credentials and provide the Secret Key (OATH TOTP Secret) you recorded during Step 1.
- Once Cortex validates the credentials and permissions, the onboarding process is complete.
3. Validation and Scanning:
Cortex immediately establishes a secure backend connection and validates the extracted credentials, administrative scopes, and OATH sync configurations. After validation succeeds, a confirmation window will appear.
Cortex immediately begins to parse and scan your onboarded agentic platform environment. The amount of time required to crawl varies based on your tenant's data volume. At a minimum, expect at least one hour to populate telemetry maps, permissions vectors, and security trends within the AISPM dashboard.
Onboard Microsoft Copilot Studio
Prerequisites
- Licensing: To access Microsoft Copilot Studio and start building custom agents, your organization must have an active Microsoft Copilot Studio license. Coordinate with your IT Administrator or Microsoft Sales representative to ensure the proper licensing is in place. Note: Copilot Studio is a Microsoft-native product, not a feature developed or managed by Palo Alto Networks.
- Azure Permissions: Ensure you have Administrative privileges in the Microsoft Azure portal to register apps and grant API permissions. To perform onboarding, you must have an Application Administrator role. This role manages application settings and permissions within Microsoft Entra ID (Azure AD) and has the ability to restart provisioning of an enterprise application.
- Power Platform Permissions: Ensure you have a System Administrator or Power Platform Administrator role to add app users to the relevant environment.
- Environment Settings: Ensure you disable Administration mode in the Power Platform Admin Center.
- Configure Permissions in Microsoft Azure.
Create an app registration in your Microsoft Azure Portal to grant Palo Alto Networks® secure, read-only access to your Microsoft Copilot Studio environment.
- Register a new app in Microsoft Azure
- Log in to the Microsoft Azure Portal.
- Navigate to or search for App registrations.
- Click + New Registration.
- Enter a descriptive Name for the app (for example: PaloAltoNetworks_Agent_Security_Connector).
- Click Register.
- Configure API permissions for the new app
- From the new app details page, select Manage > API permissions.
- Click + Add a permission and select Application permissions under Microsoft Graph.
- Add the following Microsoft Graph permissions:
- Application.Read.All
- AuditLog.Read.All
- AuditLogsQuery-CRM.Read.All
- AuditLogsQuery.Read.All
- Click Add permissions to save the app API permissions.
- Grant Admin Consent: The permissions you added require admin consent. On the Configured permissions page, click Grant admin consent for <your-organization>.
- In the confirmation pop-up, select Yes to grant admin consent for your organization.
- Create a Client Secret for the new app
- From the new app details page, select Manage > Certificates & secrets.
- Click + New client secret.
- Enter a description (for example: SaaS_Security_Key) and select an expiration period.
- Click Add.
- CRITICAL: Copy the Client Secret Value immediately and store it in a secure location. This value will be hidden permanently once you leave the page.
- Grant the app access in the Microsoft Power Platform admin center
- Log in to the Microsoft Power Platform Admin Center.
- Select Manage > Environments and click on your target Copilot Studio environment.
- Navigate to Settings > Users + permissions > Application users and click + New app user.
- Click + Add an app and search for the application registration you created in Step 1.
- Select the correct Business unit from the drop-down menu.
- Click the pencil icon next to Security roles, assign the Service Reader role, and click Save.
- Click Create to finalize the app access privileges.
- Gather the required configuration values
- Before moving to the next step, ensure you have gathered and copied the following variables:
- Environment URL: Found on the environment's main page in the Microsoft Power Platform Admin Center.
- Application (Client) ID: Displayed in the app Overview tab in the Microsoft Azure Portal.
- Directory (Tenant) ID: Displayed in the app Overview tab in the Microsoft Azure Portal.
- Client Secret Value: The secret value you securely stored in Step 3.
- Before moving to the next step, ensure you have gathered and copied the following variables:
- Onboard Microsoft Copilot Studio to AISPM. Establish the API connection between the Palo Alto Networks platform and your Microsoft Copilot Studio environment using the gathered credentials.
- Log in to Cortex.
- Select Settings > Data Sources and Integrations > Add New. You can use the Search bar to find the Microsoft Copilot Studio connector.
- Click on the Microsoft Copilot Studio tile and select Add Another Instance.
- On the Capabilities page, provide an Instance Name and select Agent Security scanning capability.
- On the Connections page, provide your Instance URL and select an authentication method. Input the following:
- Tenant ID
- Power Platform Environment URL
- Tenant ID
- Under Agent Security Scanning, provide the Client ID and Client Secret.
- Once AISPM validates the credentials and permissions, the onboarding process is complete.
- Validation and Scanning: Cortex will process the credentials and notify you once onboarding is complete. The amount of time required to complete the scan varies depending on your tenant's total volume of data. At a minimum, expect it to take at least one hour to process logs and display security telemetry inside the AISPM dashboard.
Troubleshooting Potential Onboarding Failures
If Microsoft Copilot Studio fails to onboard, AISPM will flag one of the following error states:
- Permission Errors during Scan: Verify you entered all credentials correctly and double-check that you successfully executed the Grant Admin Consent step when configuring your Azure API Permissions.
- Connection Test Fails: Confirm that you assigned the Service Reader role to the application user inside the Power Platform Admin Center.
Onboard Service Now
To secure access to your ServiceNow data and successfully onboard to Cortex, you must complete two main phases:
- Create an application registry that the platform will use to access your ServiceNow data via the REST API. The configuration consists of creating a user, creating an authentication scope, and using them to create an application registry.
- Onboard the ServiceNow platform to AISPM via Strata Cloud Manager.
Prerequisites: Ensure you have the necessary administrative privileges in your ServiceNow instance, including the ability to elevate your role to security_admin to create and manage Access Control Lists (ACLs).
Create an Application Registry
- Create a Service User\
Note: Ensure you elevate your role to security_admin before creating the user and grant read-only access to the required tables using Access Control Lists (ACLs). You could also edit existing roles.- Sign in to your ServiceNow instance.
- In the search box, start typing and select User Administration > Users > New and enter the following details:
- User ID
- First name and Last name
- Select the Web service access only check box. (Note: This is critical as it ensures the user cannot be used for interactive sign-in.)
- Select the Active check box and Submit the new user record.
- Select a role for the new user:
- The role must have read and write permission to the sys_gen_ai_skill_applicability table.
- For all other tables, only read permission is required.
- If necessary, you can create a custom role in ServiceNow with these specific permissions. The read permission will enable AISPM to scan the ServiceNow AI Platform for agent risks. The write permission to the applicability table will enable you to remediate risky plugins and take agents offline.
-
Create the Authentication Scope\
Note: Before creating the OAuth 2.0 integration, create a scope that limits AISPM's access to only the Table API.- Navigate to the Authentication Scopes table (sys_auth_scope.list) by using the filter navigator.
- Click New to define the authentication scope.
- Specify a meaningful Name for your authentication scope, such as SaaS_Agent_Security_Scope or SSPM Agentic Scope.
- (Optional) Specify a Description. Click Submit.
Note: Keep the authentication scope name handy, as it is required when configuring the REST API Auth Scope and OAuth 2.0 integration.
- Create the Application Registry (OAuth Client)\
Standard Release Instructions:- Log in to ServiceNow as an administrator.
- Navigate to the Application Registries page (System OAuth > Application Registry).
- Select New > Create an OAuth API endpoint for external clients.
- Copy the auto-generated Client ID and Client Secret and keep them handy.
- Ensure the following additional details are filled in correctly:
- Set the Application to Global.
- Ensure it's accessible from all application scopes.
- Ensure the Active check box is selected.
- OAuth Application User: Enter the user you created in Step 1.
- Default grant type: Choose Client Credentials. (Ensure that the system property glide.oauth.inbound.client.credential.grant_type.enabled is set to true).
- Specify your OAuth Scope that you created in Step 2.
- Click Submit.
- Onboard ServiceNow Platform to Cortex.
- Log in to Cortex.
- Select Settings > Data Sources and Integrations > Add New. You can use the Search bar to find the ServiceNow connector.
- Click on the ServiceNow tile and select Add Another Instance.
- On the Capabilities page, provide an Instance Name and select Agent Security scanning capability.
- On the Connections page, provide your Instance URL and select an authentication method. Enter the information you gathered (Client ID, Client Secret, etc.) during Step 1 in the corresponding fields.
- Once AISPM validates the credentials and permissions, the onboarding process is complete.
Troubleshooting
If you see errors after onboarding, this is likely due to incomplete permissions. Return to the application registry creation procedure and verify that the assigned role possesses a read-only ACL rule for every single required table. Also, ensure that this role is correctly assigned to the service user you created.
Manage SaaS AI Agents
AISPM provides comprehensive management tools to monitor and control your AI agent ecosystem. Through centralized visibility, you can track agent activity, assess security posture, and perform targeted remediation to mitigate risks associated with autonomous workflows.
View AI Agents
AISPM provides you with a holistic view of all the agents deployed in your cloud environments. Start with a high-level view of all the agents deployed across all agentic platforms and drill down further to view all the active agents for a single platform.
View Agents Security Posture
You can view SaaS Agents assets and other actionable data from the SaaS Security Overview page. Follow the steps below to view Agent activity:
- SaaS Agents Overview
- Navigate to Home > Modules > SaaS Security > Saas Security Overview.
- Hover over the AI Security icon to view Assets at Risk and their severity level, Overprivileged Agents, Agents with Sensitive Data, Inactive Agents.
- Select View Assets to go to the Agents list view.
- Navigate to Home > Modules > SaaS Security > AI Agents to view all agents by agentic platform. Click on any agentic platform such as Service Now to view all agents currently deployed. You can further filter this list to double click on activity such dormant periods or delegation authority.
- From the all AI Agents list view you can also click on any agent to view all available actions you can take to remediate non-compliant agents.
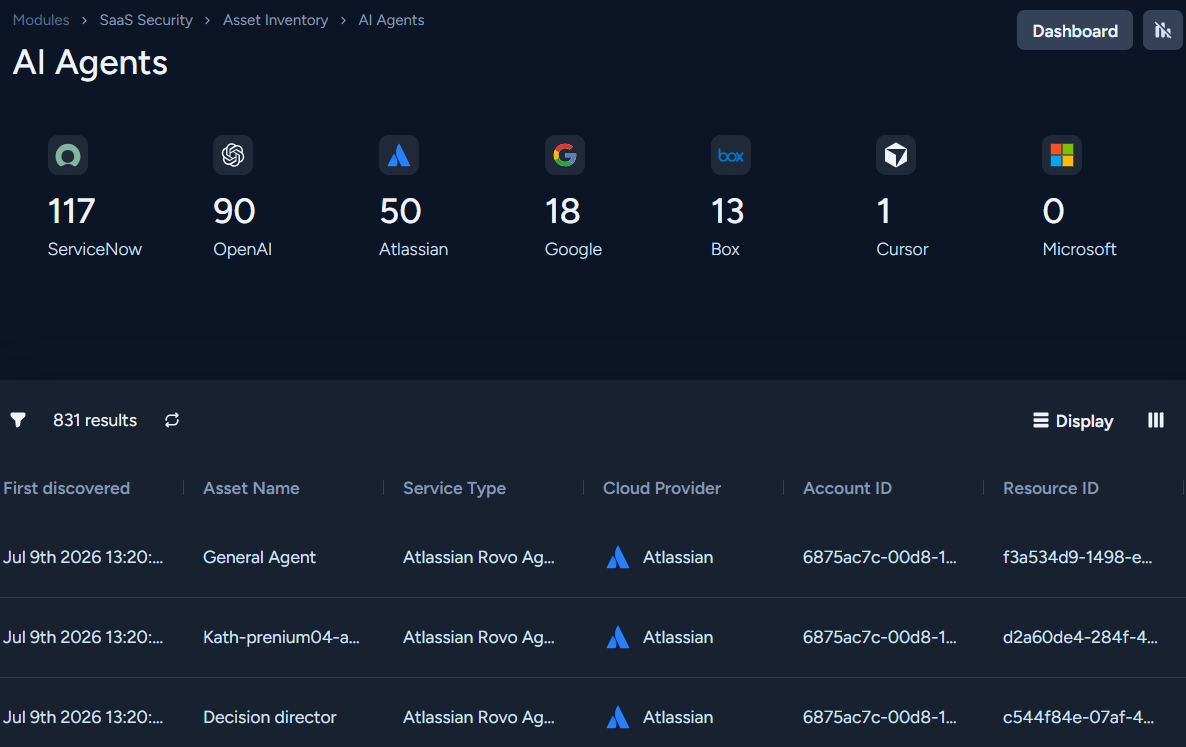
- Select the Dashboard link on the AI Agents list view page to be redirected to the complete Asset Inventory dashboard that provides a comprehensive look at all AI Assets including details such as Risk Breakdown, Providers, and Insights.
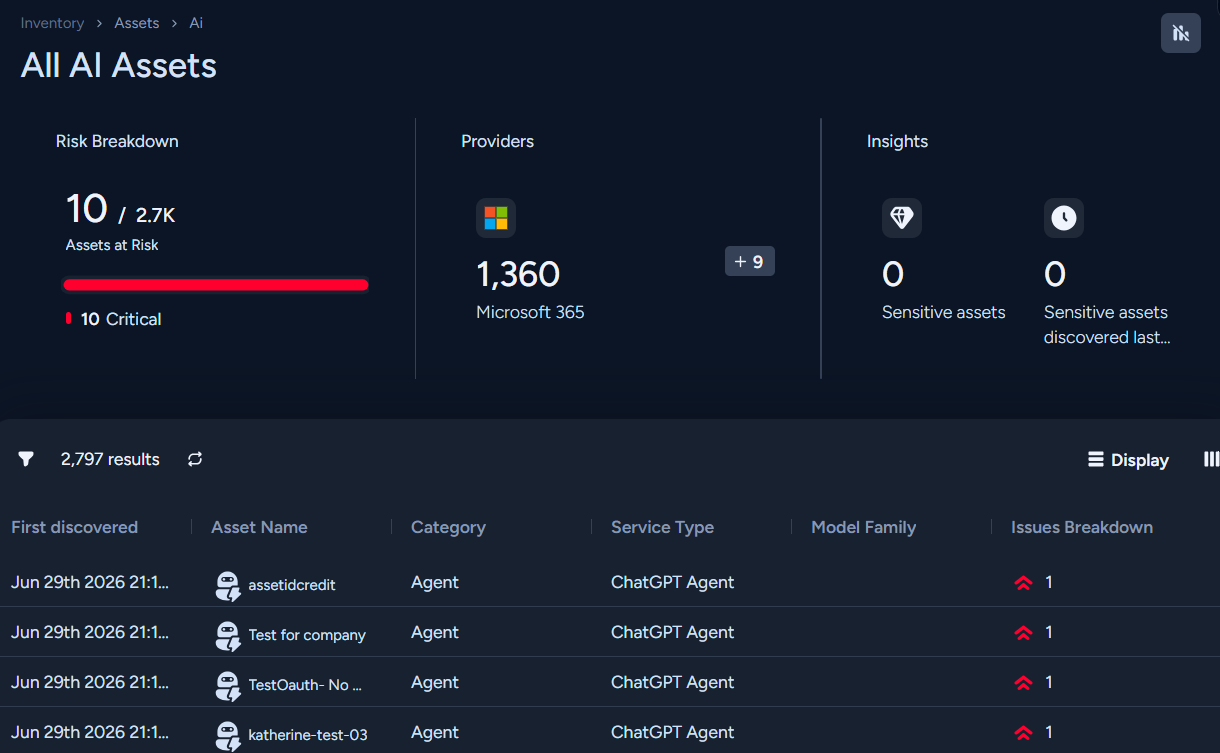
View Datasets
A Dataset is a collection of unseen, raw data, used by SaaS Agents to generate predictions, classifications, or recommendations. The Datasets view within the SaaS Security module (Modules > SaaS Security > Asset Inventory > Datasets) provides an aggregated overview and granular table of Cloud Datasets as well as datasets ingested, generated, or utilized by connected SaaS applications and AI agents.
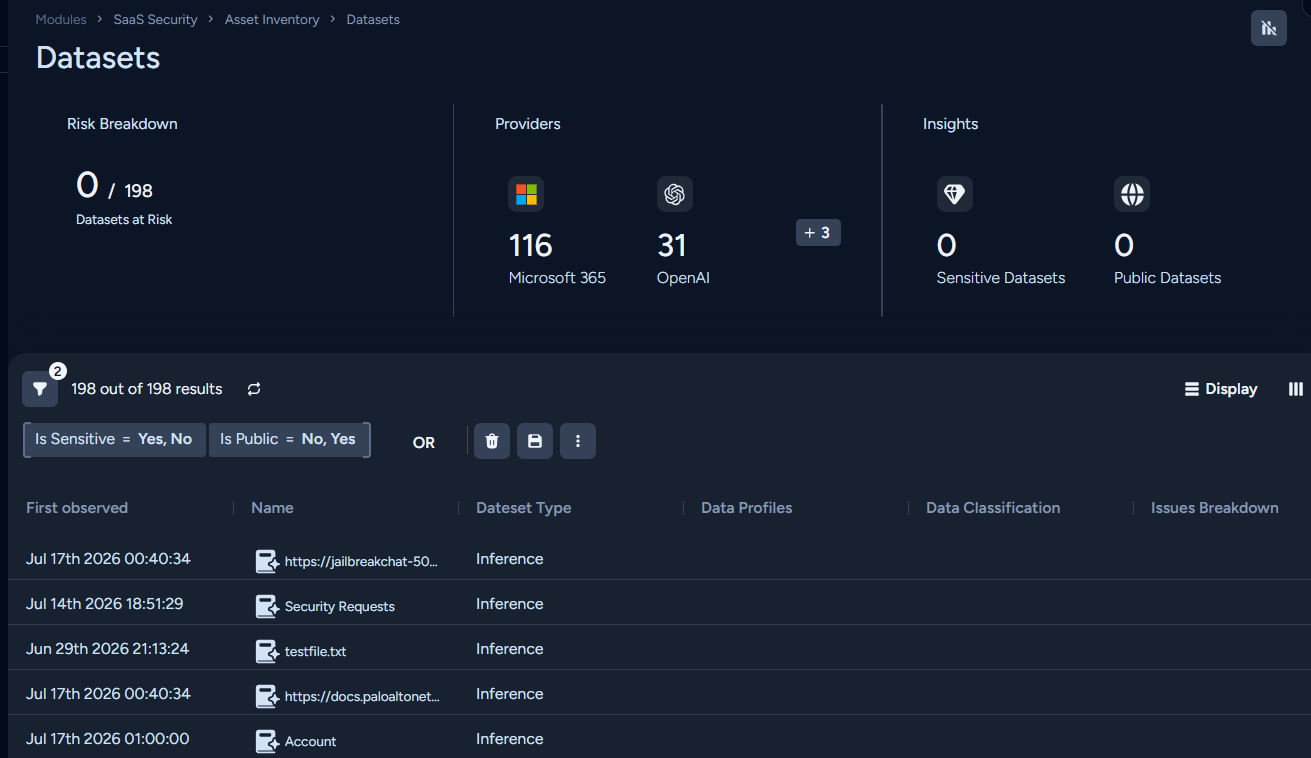
The top section contains three analytical widgets summarizing the current security and provider posture of the dataset inventory. Widgets include:
- Risk Breakdown: Displays the proportion of monitored datasets containing unresolved security vulnerabilities, policy violations, or anomalous access patterns.
- Providers: Tracks datasets exposed to the public internet or accessible outside authorized organizational boundaries.
From the List View you can click on any Dataset to view the entire Agent ecosystem. Select any option below to investigate further:
- Overview: Provides details such as Provider name, Owner, and Descriptions.
- AI Ecosystem: Provides a graphical view of the tools connected to the Dataset.
- Related Agents: Includes agent identity insights, tracking of dormant agents, as well as a breakdown of risks associated with agents connected to the Dataset.
View Agent Tools
The SaaS Agent Tools security page moves beyond assessment of tools to the real security surface the—Tool Wrapper (or "Agent Tool" instance). This is the configuration layer where an agent author defines how a tool is used. This analysis often reveals risks like overprivileged access, or insecure credentialing that arise here and not in the underlying function code.
An Agent Tool is a specific instance of a tool being utilized by a specific agent. It acts as a wrapper that encapsulates:
- Metadata Aliases: Custom names and descriptions provided by the agent author Configuration Settings: How the tool is pointed at specific data stores or environments
- Authentication/Identity: Whether the tool executes using a System Credential, a specific Service Account, or prompts the User on-the-fly.
The SaaS Agent Tool page and dashboard focuses exclusively on posture risks introduced by the misconfiguration of the Agent Tool Wrapper layer.
Utilize the SaaS Agent tools widgets to view the potential risks introduced. These widgets provide insights into the total number of Providers and the Risk Breakdown. Select any provider from the page view to see a detailed breakdown of the following:
- Overview: Provides detailed information information on the tool Metadata
- AI Ecosystem: This node-based graph shows the specific Parent Agent and all the Datastores and API connections accessed by the Tool.
- Related Agents: Lists linked agents using this specific tool configuration.
Cortex Cloud AI Security
Cloud AI Security provides a comprehensive overview of the AI assets within an organization. It is designed to ensure AI security by offering tools to review and prioritize AI risks effectively.
What is Cortex Cloud AI Security?
Requires a Cloud Posture Security, Cloud Runtime Security, or Cortex XSIAM Premium license.
Cloud AI Security provides:
- Comprehensive Visibility: Obtains a full picture of AI components, including models, agents, data flows, and infrastructure across all cloud environments. This broad visibility ensures that every AI asset is accounted for and continuously monitored, reducing blind spots in the AI ecosystem.
- Full supply chain protection: Maps the dependencies between data, models, and cloud resources to remediate risks such as poisoned datasets or unsanctioned models. Maintains the integrity of your AI bill of materials (AI-BOM).
- Detailed asset inventory: Access an in-depth inventory of all AI assets, enriched with contextual details. This deep insight into each asset’s specifics and functionalities facilitates a better understanding and more effective management of these resources.
- Advanced risk assessment: Proactively identifies and issues alerts on misconfigurations and security flaws in AI assets. Cortex Cloud AI Security employs sophisticated detection mechanisms to tackle risks associated specifically with AI, managing permissions, and ensures robust security practices are upheld throughout the AI supply chain.
- Dynamic risk prioritization: Utilizes insights into data sensitivity and the broader security context to effectively understand and prioritize risks. This strategic approach enables organizations to target and mitigate the most critical threats swiftly, thereby enhancing the overall security landscape.
- Governance and control: Implements comprehensive guardrails and controls for AI models both during development and in production. Ensures that AI assets operate within defined security parameters, reducing the likelihood of security breaches and data leaks.
- Compliance assurance: Regularly tests AI systems against emerging AI regulations and industry standards, such as the OWASP Top 10 for Large Language Models (LLMs). Gets clear guidelines on corrective actions needed to achieve full compliance and ensures that AI assets align with both current and future regulations.
These benefits help you maintain a robust security posture across your AI environment, proactively manage risks, and align with compliance and internal security policies.
Cloud AI Security overview dashboard
The Cloud AI Security overview dashboard serves as the central hub for information on the AI ecosystem within the organization. It provides a comprehensive overview of AI security posture and is designed to help users quickly access relevant information. The layout and organization of the dashboard are tailored to guide you in understanding the AI environment and determining the next steps to take for effective AI governance.
The following image shows the Cloud AI Security dashboard:
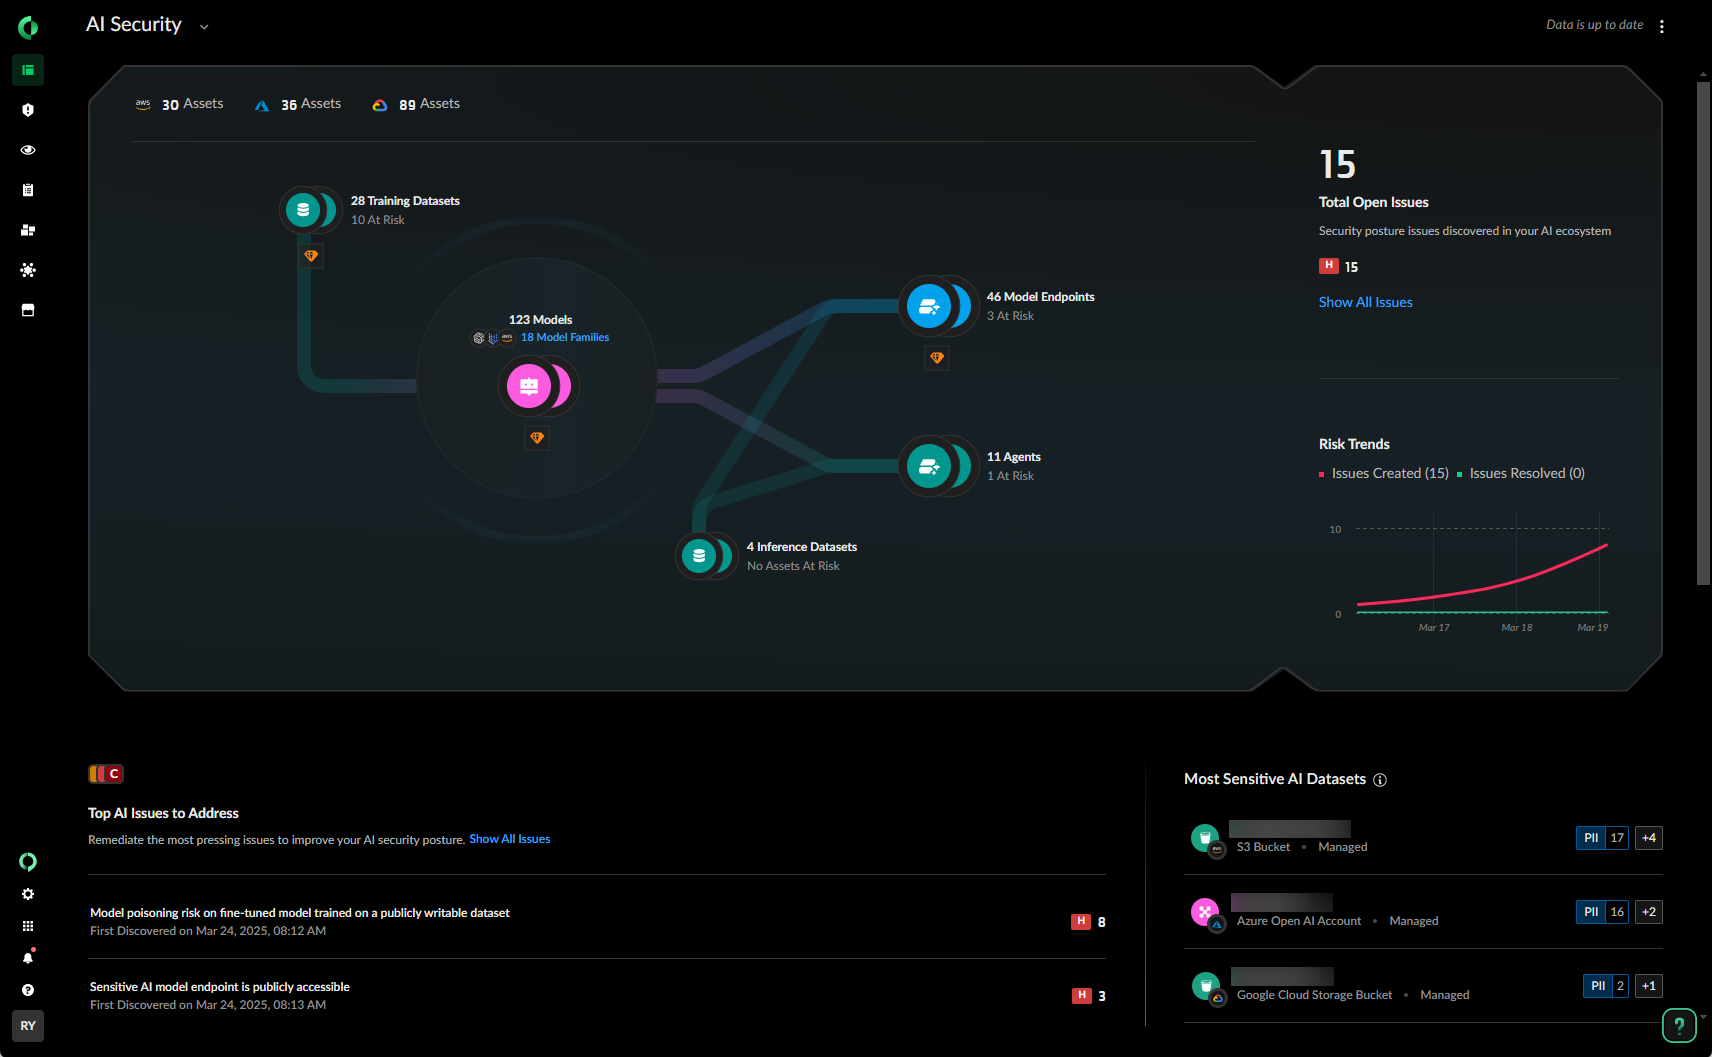
AI assets inventory
You can view all AI assets in your environment, regardless of deployment mode or cloud provider. Connected assets are discovered, contextualized, and presented with detailed information. You can dive deeper into the asset context as required.
Cloud AI Security provides visibility into how sensitive data is being utilized and potentially impacted by AI systems. By identifying the AI assets that interact with sensitive data, the platform helps ensure that appropriate protection protocols are applied where most needed, thereby enhancing overall data security and reducing the risk of data breaches and leakage.
AI security issues
Cloud AI Security provides risk assessment for the supported AI assets, with risk rules created by the research team. These risk rules are designed to detect misconfigurations and security flaws in AI assets and send alerts about them. In addition to the provided default risk rules, Cloud AI Security also supports custom risk rule creation, so you can codify and integrate internal policies into the Cortex Cloud AI Security risk engine, streamlining your remediation efforts.
When insecure models and deployments are used, several types of attacks can occur, such as the following:
- Data Poisoning Attacks: In "Training Data Poisoning", malicious actors manipulate the training data to introduce biases or vulnerabilities into the model, causing it to make incorrect or harmful predictions.
- Model Inversion Attacks: Attackers can infer sensitive information about the training data by querying the model, potentially leading to data breaches and loss of intellectual property.
- Adversarial Attacks: Crafted inputs can deceive the model into making incorrect predictions, which is particularly dangerous in critical applications like autonomous driving or medical diagnosis.
- Evasion Attacks: Evasion attacks are a prevalent threat to machine learning models during inference. This type of attack involves crafting inputs that appear normal to humans but are misclassified by machine learning systems. For instance, an adversary might alter a few pixels in an image prior to submission, causing an image recognition system to misidentify it.
- Model Extraction Attacks: Attackers can approximate a model's functionality by repeatedly prompting it, effectively stealing the intellectual property and potentially using it for malicious purposes.
- Data Leakage: If a model unintentionally reveals sensitive information it was trained on or data that is used in inference, it can lead to breaches of confidential or personal data.
- Model Manipulation: Unauthorized access to the model can allow attackers to alter its parameters or behavior, leading to compromised functionality and trustworthiness.
- Inference Attacks: Attackers exploit the model to deduce whether specific data was part of the training set, potentially exposing sensitive information.
These types of attacks highlight the importance of implementing robust security measures, as outlined by the OWASP (Open Web Application Security Project) Top 10 Risk & Mitigations for LLMs and Gen AI Apps.
Supported services in Cortex Cloud AI Security
Requires a Cloud Posture Security, Cloud Runtime Security, or Cortex XSIAM Premium license.
The following lists the various services that are compatible with Cloud AI Security, detailing the specific platforms and services where Cloud AI Security can be effectively used to ensure security and compliance:
- AWS: Amazon Bedrock, Amazon SageMaker, Amazon S3 Vectors
- Azure: Azure AI Foundry, Azure OpenAI, Azure AI Search
Using outpost scan mode is mandatory for full AI asset discovery in Azure. In addition, DSPM must be enabled. Note that you can enable DSPM while disabling it for all non-AI services. For more information, see How to configure the scanning settings for supported services and Cloud service provider onboarding.
- GCP: Vertex AI
- Self-managed AI models
- SaaS AI Agents
Cortex Cloud AI Security concepts
Requires a Cloud Posture Security, Cloud Runtime Security, or Cortex XSIAM Premium license.
Introduction to AI applications
The AI application ecosystem comprises several critical components that work together to enable the functionality of AI-driven applications. The following explains the main concepts and shows some examples.
Model
The model is the core component of the AI ecosystem. It is the trained machine learning model that takes input data, processes it, and produces output. In the context of large language models (LLMs), this involves understanding and generating human-like text based on the given input.
Example
OpenAI GPT-4 model, which can generate coherent and contextually relevant text, answer questions, and perform various other natural language processing tasks.
Model endpoint
The model endpoint is the interface through which applications interact with the AI model. It acts as an access point for sending inputs to the model and receiving outputs. The endpoint is responsible for managing requests, routing them to the appropriate model instance, and returning the results to the application.
Example
A Microsoft Azure OpenAI deployment using OpenAI GPT-4, which you can use to integrate natural language processing capabilities into your applications by sending text prompts and receiving generated text in response.
Example
Amazon Web Services (AWS) EC2 instances with GPU acceleration running Llama2 by Meta, which supports an application that communicates with the EC2 instance.
Plugin
A plugin is an auxiliary but highly capable model or tool that acts as a helper to the primary AI model. Plugins extend the functionality of the main model by providing specialized capabilities, such as accessing inference datasets, performing specific computations, or interfacing with other services. This approach, known as retrieval-augmented generation (RAG), enhances the primary model's ability to generate more accurate and contextually relevant outputs. For more information, see Inference datasets and Retrieval-Augmented Generation.
Example
A weather plugin integrated with an AI chatbot that allows the chatbot to fetch and provide real-time weather updates based on user queries. Another example is a language translation plugin that helps the main model translate text between different languages.
Training datasets
Training is a fundamental stage in the AI development process where the model learns to perform its tasks by processing large amounts of data. During this phase, the model is exposed to various examples and adjusts its internal parameters to minimize errors in predictions or classifications. The dataset is an integral part of the process, with the insights learned by the model influenced by the training data.
Example
Training a model like GPT-4 involves using vast text corpora from various sources to help the model understand language patterns, context, and nuances, enabling it to generate coherent and contextually relevant text.
Inference datasets
Inference datasets are specialized collections of data used during the inference phase of AI models, which is the stage where the model makes predictions or generates outputs based on new input data. Unlike training datasets, which are used to teach the model how to understand and process information, inference datasets help improve the model's performance by providing realistic, real-world data inputs for better contextual answering.
Example
When building a chatbot for customers to learn more about their spending habits, financial institutions use customer transactions as inference data to provide contextually accurate answers.
Fine-tuning
Fine-tuning in machine learning refers to the process of adapting a pre-trained model to perform specific tasks or cater to particular use cases. This technique has become essential in deep learning, especially for training foundation models used in generative AI. Fine-tuning leverages data (similarly to training) to adjust the responses of the model to certain inputs, making it more suitable for the intended business case.
Retrieval-Augmented Generation
Retrieval-Augmented Generation (RAG) enhances large language model (LLM) responses by incorporating information from knowledge bases and other sources. This allows the model to reference up-to-date inference data before generating a response, improving contextual accuracy. This approach is cost-effective and ensures the output remains relevant, accurate, and useful across different contexts.
Example scenario: AI-powered customer support chatbot
To illustrate how these components work together, consider an AI-powered customer support chatbot:
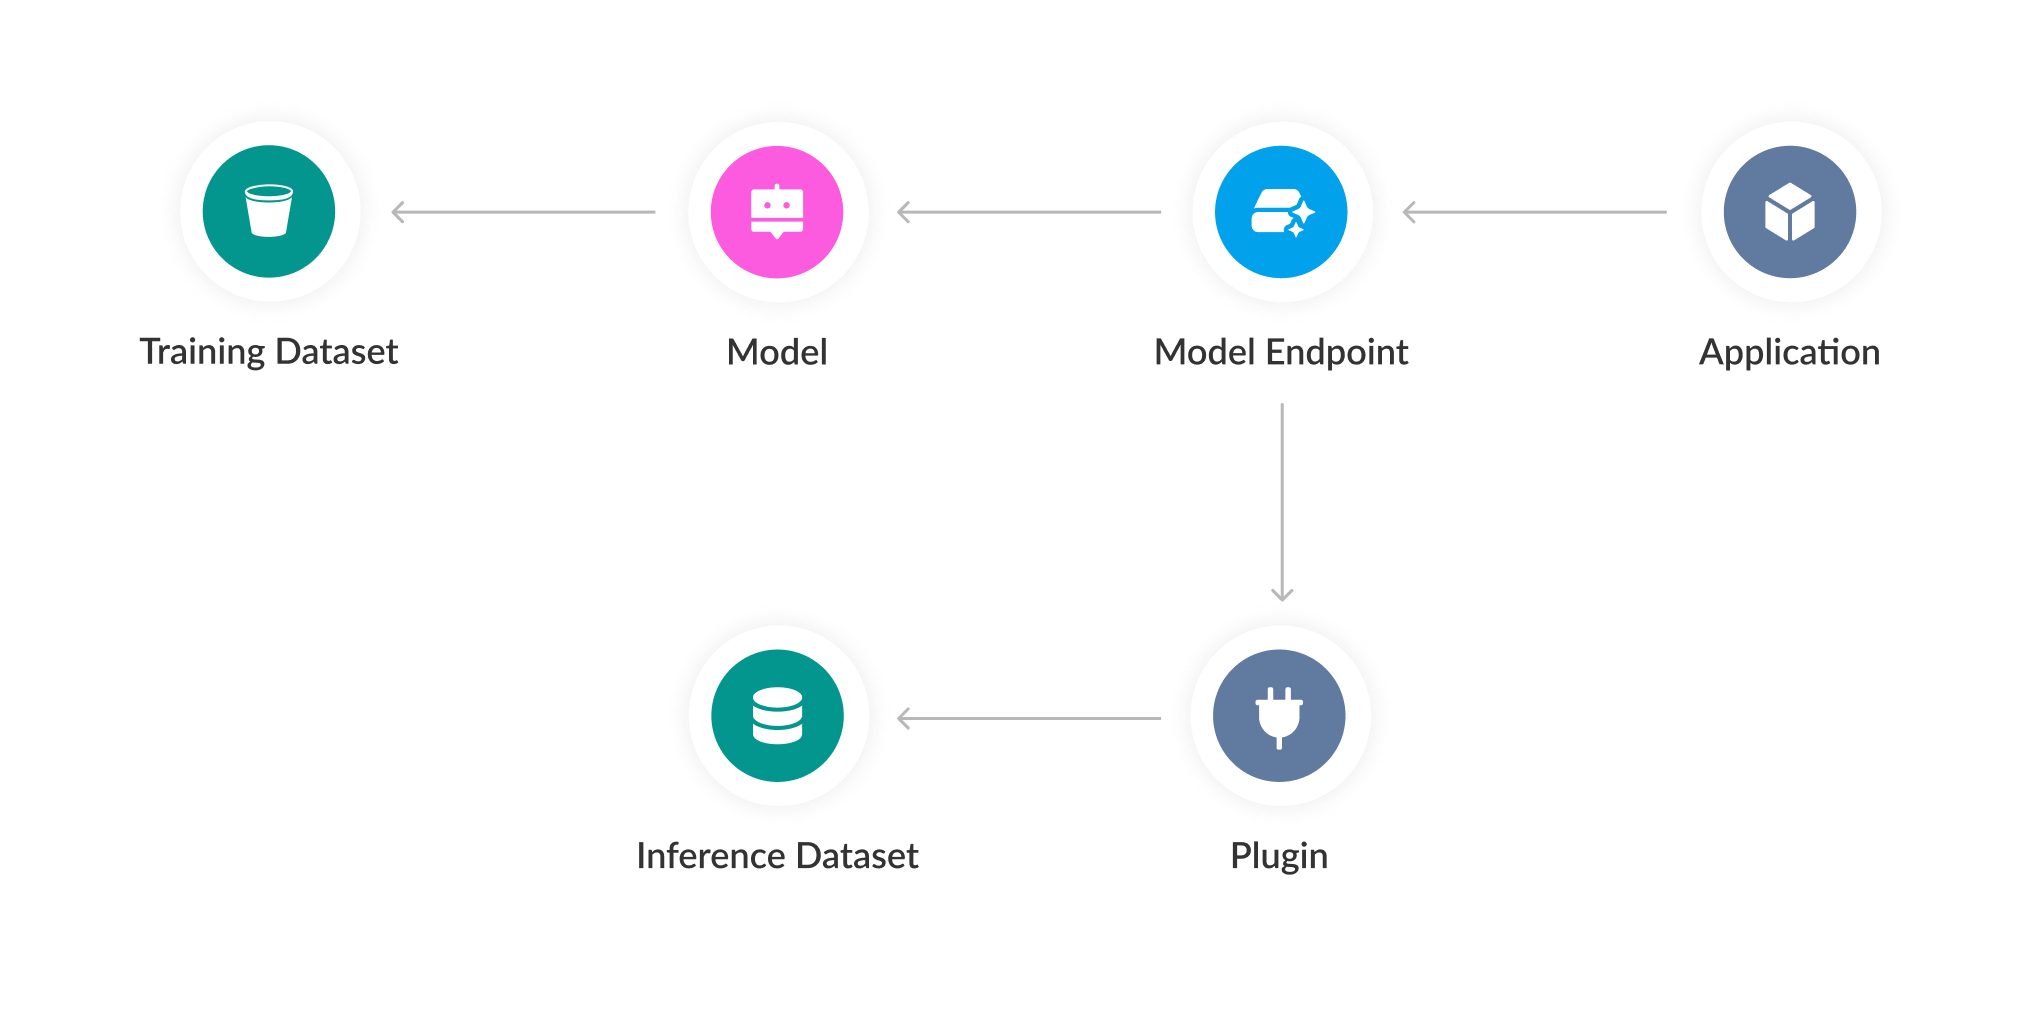
- Model endpoint: The chatbot application interacts with the GPT-4 model through the Azure OpenAI Deployment, which serves as the model endpoint. This endpoint handles user queries, processes them, and directs them to the GPT-4 model to generate responses.
- Model: The GPT-4 model receives the user's query, processes it, and generates a relevant and contextually appropriate response based on the information and nuances provided in the query.
- Plugin: The chatbot integrates a customer database plugin that allows it to fetch user-specific inference data, such as order status or account details, to provide more personalized and accurate support. The customer database used by the plugin is the Inference Dataset.
- Training dataset: The chatbot undergoes fine-tuning using a dataset of previous customer interactions and support tickets, making it adept at handling common inquiries and issues in the specific industry.
- Application: The customer support platform integrates the chatbot with a user-friendly interface.
Cortex Cloud AI Security use cases
Requires a Cloud Posture Security, Cloud Runtime Security, or Cortex XSIAM Premium license.
Understand your AI ecosystem
Understanding your AI ecosystem is crucial for identifying potential vulnerabilities and ensuring the robustness of your AI operations. A comprehensive view of your AI landscape helps in pinpointing where sensitive data is processed and stored, as well as how data flows between systems.
To understand your AI ecosystem, use the AI Security Dashboard, which provides visibility into all the AI components. You can also see how your AI assets relate to any other asset in the environment using the Graph Search. The complete list of your AI assets can be found under AI Inventory, where you can investigate each asset.
Investigate an AI asset
To understand a specific component of your AI ecosystem and identify any findings or security issues related to it, use its asset card and links to findings, issues, and cases created for the asset. When you select an asset, you can review all the tabs on its asset card. These tabs on the asset cards provide information about the following: overview, access, data, vulnerabilities, applications, and AI ecosystems.
Detect AI security issues
Detecting the AI security issues early is pivotal to safeguarding AI-powered applications and the sensitive data they handle. AI systems, due to their complexity, can often be opaque, making it difficult to identify vulnerabilities using traditional methods. To detect security issues in your AI ecosystem, use the AI Security Issues page.
Secure the data for AI
Securing the data utilized by AI systems is critical. Cloud AI Security helps you identify the data that is impacted by your AI ecosystem, whether it's training data, data used for RAG (Retrieval Augmented Generation) or any other related data such as prompt logs. It also classifies this data, using Cortex Cloud Data Security. Data classification across your AI ecosystem allows you to identify models that are trained on sensitive data and to prioritize all identified risks and issues based on their data impact. For example, missing guardrails on a sensitive model should be treated differently due to its context.
Discover self-managed AI models
Cloud AI Security helps organizations discover self-managed AI models.
Self-managed AI models refer to AI models that are deployed and operated on self-managed cloud infrastructure, rather than through cloud providers' managed services. These models are often sourced from public repositories like Hugging Face, and can lead to the proliferation of shadow AI.
The growing use of AI in business workflows makes it increasingly important to manage and secure all AI models, whether deployed through managed services or self-managed infrastructures. Self-managed AI models, in particular, introduce unique risks, such as security vulnerabilities and compliance gaps. Tracking and securing these models is essential to reducing risks and ensuring that AI applications remain safe, secure, and compliant.
Comply with AI regulations
Cloud AI Security ensures compliance with emerging AI mandates and industry standards, which is crucial because new frameworks require unique measures to govern AI-specific vulnerabilities. For example, data poisoning is a major risk for AI applications but traditional compliance programs are not designed to handle it; however, new frameworks for AI governance include relevant measures, such as the documentation of data sources used to train AI models. In addition, AI-powered applications also add complexity for existing regulations like GDPR, due to their data processing and interconnected systems.
Cloud AI Security allows for continuous monitoring and visualization of compliance with leading AI standards, such as the OWASP Top Ten for LLM.
Complying with current industry standards can help shorten the time needed to meet future binding regulations. Cloud AI Security helps you enforce policies, maintain audit trails, and achieve compliance, providing visibility into compliance violations and helping manage your AI Inventory, which is essential for controlling model sprawl and shadow AI.
Manage your AI software supply chain
As AI becomes deeply embedded in application development, security teams need comprehensive visibility into the software supply chain. This visibility must go beyond deployed AI models and agents, extending to the underlying AI software packages and SDKs that developers use to build these systems.
A key aspect of Cloud AI Security is implementing a shift-left approach to AI security. This helps organizations identify and manage risks early in the development lifecycle by providing visibility into the AI software supply chain. Understanding this supply chain is crucial for both generating an AI Bill of Materials (AI-BOM) and for identifying potential vulnerabilities before they are deployed to production. This proactive stance ensures that security is addressed at the source, preventing more complex and costly issues later on.
Detect open-source models
Cloud AI Security provides detection and risk assessment for open-source models, identifying and displaying the count of open-source models on the dashboard.
How to perform advanced AI Security investigations using XQL
Requires a Cloud Posture Security, Cloud Runtime Security, or Cortex XSIAM Premium license.
Overview
Cloud AI Security centralizes information about your AI ecosystem into a list of datasets, providing the foundation for comprehensive security investigations. Using Cortex Query Language (XQL) , security practitioners can create custom queries to extract valuable insights from these data sources within their appliance. For more information, see Get started with XQL.
You can use the following AI-related datasets:
| Dataset | Description |
|---|---|
| asset_inventory | Provides a normalized, structured inventory of all digital assets across your AI environment, including detailed metadata for each asset, such as type, cloud provider, region, and security configurations. The dataset also maps relationships between assets, enabling the identification of complex AI and cloud dependencies for a comprehensive AI security posture. |
| classification_mgmt_data_profile | Provides administrative insights into the data classification policies and profiles configured within the Cortex Cloud Data Classification service.This dataset is primarily used for monitoring and managing the data classification rules in the Cortex Cloud environment. |
| findings | Contains the findings that are associated with the assets that are found in your environments. For more information, see Findings and events. |
| issues | Consolidates all AI security vulnerabilities, misconfigurations, and threats detected by Cloud AI Security. Each entry includes detailed context, such as the affected asset ID, a risk score, a description of the issue, and suggested remediation steps. This dataset provides a unified, actionable view of all security risks for your organization. |
Investigate Cloud AI Security in Cortex XSIAM
To run queries on your Cloud AI Security datasets:
- In Cortex Cloud, in the navigation pane on the left, click Investigation & Response, then under Search, click Query Builder.
- Click XQL.
- You can start typing your query in the box at the top of the screen, or search for existing queries on the Query Library tab.
- Click Run. The results of the query appear on the Query Results tab.
Note
For more information, see Build XQL queries.
Examples
Here are some examples of AI-related queries you can run in Cortex Cloud to investigate your AI Security posture:
1. AI assets that were first discovered in the last 7 days
dataset = asset_inventory | filter xdm.asset.type.class = "AI" | alter found = xdm.asset.first_observed | filter timestamp_diff(found, current_time(), "DAY") >= 7 | fields xdm.asset.name as Asset_Name, xdm.asset.type.category as Asset_Type, xdm.asset.first_observed as First_Observed, xdm.asset.provider as Cloud, xdm.asset.cloud.region as Region
2. Sensitive AI assets, such as datasets containing sensitive data, models trained on sensitive data, or model endpoints using sensitive inference data
dataset = asset_inventory | filter xdm.asset.type.class = "AI" | join ( dataset = findings | filter xdm.finding.type_id = 110000001 ) as sensitive_AI sensitive_ai.xdm.finding.asset_id = xdm.asset.id | fields xdm.asset.name as Asset_Name, xdm.asset.type.category as Asset_Type, xdm.asset.provider as Cloud, xdm.finding.normalized_fields as Sensitive_Data
3. Fine-tuned AI models
dataset = asset_inventory | filter xdm.asset.type.category = "Model" and xdm.ai.model.kind = "FINE_TUNED" | fields xdm.asset.name as Asset_Name, xdm.asset.type.category as Asset_Type, xdm.asset.provider as Cloud, xdm.ai.model.kind as model_kind
4. Public AI deployments that are accessible from the public internet
dataset = findings | filter xdm.finding.type_id = 110000004 | join (dataset = asset_inventory | filter xdm.asset.type.category = "Model Endpoint") as public_endpoints public_endpoints.xdm.asset.id = xdm.finding.asset_id | fields xdm.asset.name as Asset_Name, xdm.asset.type.category as Asset_Type, xdm.asset.provider as Cloud
5. AI datasets containing sensitive PII data
dataset = asset_inventory | filter xdm.asset.type.class = "AI" and xdm.asset.type.category = "Dataset" | join( dataset = findings | filter xdm.finding.type_id = 110000001 | filter xdm.finding.is_active = TRUE | alter data_profile = json_extract_scalar_array(xdm.finding.normalized_fields, "$['xdm.data.data_profile']") | arrayexpand data_profile ) as sensitive_AI sensitive_ai.xdm.finding.asset_id = xdm.asset.id | join( dataset = classification_mgmt_data_profile | filter name = "PII" and enabled = True ) as data_profile_def data_profile_def.id = to_integer(data_profile) | fields name as data_type, xdm.asset.name as dataset_name, xdm.asset.strong_id as dataset_full_path, xdm.asset.provider as dataset_provider, xdm.asset.realm as dataset_realm, xdm.asset.type.name as dataset_type, xdm.finding.description as description
6. AI datasets containing sensitive PCI data
dataset = asset_inventory | filter xdm.asset.type.class = "AI" and xdm.asset.type.category = "Dataset" | join( dataset = findings | filter xdm.finding.type_id = 110000001 | filter xdm.finding.is_active = TRUE | alter data_profile = json_extract_scalar_array(xdm.finding.normalized_fields, "$['xdm.data.data_profile']") | arrayexpand data_profile ) as sensitive_AI sensitive_ai.xdm.finding.asset_id = xdm.asset.id | join( dataset = classification_mgmt_data_profile | filter name = "PCI" and enabled = True ) as data_profile_def data_profile_def.id = to_integer(data_profile) | fields name as data_type, xdm.asset.name as dataset_name, xdm.asset.strong_id as dataset_full_path, xdm.asset.provider as dataset_provider, xdm.asset.realm as dataset_realm, xdm.asset.type.name as dataset_type, xdm.finding.description as description
7. AI assets with more than one issue
dataset = asset_inventory | filter xdm.asset.type.class = "AI" and xdm.asset.type.category in ("Dataset", "Model", "Model Endpoint") | join ( dataset = issues_with_sbac | fields xdm.issue.id as issue_id, xdm.issue.domain, xdm.issue.status.progress as progress, xdm.issue.is_excluded as is_excluded | filter xdm.issue.domain = "POSTURE" and is_excluded != true and progress != "RESOLVED" | join type = inner ( dataset = issue_to_asset | fields xdm.asset.id as ita_assetid, xdm.issue.id ) as its its.xdm.issue.id = issue_id | fields issue_id, ita_assetid | comp count(issue_id) as issues_count by ita_assetid ) as iss iss.ita_assetid = xdm.asset.id
8. VMs deploying self-managed AI models
dataset = asset_inventory | filter xdm.asset.type.class = "AI" and xdm.asset.type.category in ("Model") and xdm.asset.type.id = "SELF_MANAGED_MODEL" | alter relation = json_extract_array(xdm.asset.normalized_fields, "$['xdm.asset.relations']") | arrayexpand relation | alter relation_type = json_extract_scalar(relation, "$['xdm.asset.relation.type']") | filter relation_type in("DEPLOYED_ON") | alter relation_asset_id_to_find = json_extract_scalar(relation, "$['xdm.asset.relation.asset_id']") | dedup relation_asset_id_to_find | join( dataset = asset_inventory ) as vm_asset vm_asset.xdm.asset.id = relation_asset_id_to_find | fields xdm.asset.name as compute_instance_name, xdm.asset.realm as compute_instance_realm, xdm.asset.provider as compute_instance_provider, xdm.asset.type.name as compute_instance_type
9. Disks storing self-managed AI models
dataset = asset_inventory | filter xdm.asset.type.class = "AI" and xdm.asset.type.category in ("Model") and xdm.asset.type.id = "SELF_MANAGED_MODEL" | alter relation = json_extract_array(xdm.asset.normalized_fields, "$['xdm.asset.relations']") | arrayexpand relation | alter relation_type = json_extract_scalar(relation, "$['xdm.asset.relation.type']") | filter relation_type in("STORED_IN") | alter relation_asset_id_to_find = json_extract_scalar(relation, "$['xdm.asset.relation.asset_id']") | dedup relation_asset_id_to_find | join( dataset = asset_inventory ) as vm_asset vm_asset.xdm.asset.id = relation_asset_id_to_find | fields xdm.asset.name as disk_name, xdm.asset.realm as disk_realm, xdm.asset.provider as disk_provider, xdm.asset.type.name as disk_type, xdm.asset.strong_id as disk_id
10. Active AI models with the number of days since last used
dataset = asset_inventory | filter xdm.asset.type.class = "AI" | filter xdm.asset.type.category in ("Model") | join ( dataset = findings | filter xdm.finding.type_id = 110000007 and xdm.finding.is_active = TRUE | alter days_since_invoked = json_extract_scalar(xdm.finding.extended_fields, "$['days_since_invoked']") ) as model_activity model_activity.xdm.finding.asset_id = xdm.asset.id | fields xdm.asset.name as Asset_Name, xdm.asset.type.category as Asset_Type, xdm.asset.first_observed as First_Observed, xdm.asset.provider as Cloud, xdm.asset.cloud.region as Region, days_since_invoked
Serverless function posture security
Cloud serverless function scanning capabilities provide comprehensive visibility into the security posture of your serverless functions across your code and CI/CD environments, without the need to install agents or disrupt your workload operations. By integrating scanning functionality directly into your serverless functions, Cortex Cloud automatically detects vulnerabilities, malware, and exposed secrets early in the development process, enabling proactive risk detection and mitigation before production.
The following events trigger Cortex Cloud serverless function scans:
- Periodic scans
- Settings modifications, including adding new functions for scanning
Supported platforms
- Supported architecture: x86_64
- Supported cloud providers:
- Amazon Web Services (AWS): Lambda functions
- Google Cloud Platform (GCP): Google Cloud Functions (1st-gen and 2nd-gen Cloud Functions API
- Microsoft Azure: Azure Functions
Use cases
- Scan Serverless Functions: You can set up automated security scans for all your serverless functions to regularly check for potential vulnerabilities, malware, and exposed secrets. You can schedule these scans to run periodically or automatically (event-driven) whenever changes are made to your functions. The scan results allow you to assess the security risks associated with your serverless applications.
- Visibility: Get a single view of all vulnerabilities, malware, and exposed secrets affecting your organization's serverless functions. This allows you to easily understand the overall security posture of these assets.
- Analyze and mitigate scan results: Gain insights about the vulnerabilities, malware and exposed secrets detected by serverless function security scans. This enables you to understand and mitigate potential risks to improve the security of your serverless applications.
- Monitor scan health: Gain detailed insights into serverless function scan health and status, allowing you to track scan data, troubleshoot errors and mitigate detected vulnerabilities, malware, and exposed secrets, ensuring the overall health of your serverless functions.
Onboard cloud providers for serverless functions
Integrate Cortex XSIAM with your cloud provider accounts to enable security vulnerability, malware and exposed secret scans of your serverless functions. This enables you to efficiently analyze, prioritize, and resolve security findings specific to your serverless deployments.
When scanning serverless functions with layers, those layers need to be from the same cloud account.
Supported cloud providers include:
- Amazon Web Services (AWS): Refer to Onboard Amazon Web Services for more information about integrating Cortex XSIAM with AWS Lambda functions.
-
Google Cloud Platform (GCP): Refer to Onboard Google Cloud Platform for more information about integrating Cortex XSIAM with GCP functions.
Cortex supports Google Cloud Functions: 1st gen and 2nd gen Cloud Functions API.
- Microsoft Azure: Refer to Microsoft Azure cloud onboarding for more information about integrating Cortex XSIAM with Azure functions.
Only functions containing zip files are supported.
Serverless function posture rules
Use serverless function posture rules to identify risks in your cloud functions. Create custom rules for attack paths, configuration issues, and network exposure. Review, edit, or clone rules as your environment changes.
Manage serverless function rules
Serverless function rules are designed to detect security threats within your serverless function environment that can potentially introduce vulnerabilities to its security. Serverless function rules identify and flag issues based on predefined criteria, ensuring that potential threats are proactively detected and addressed to enhance the overall security posture of your serverless functions. There are three categories or types of serverless function rules:
- Attack Path: These rules identify combined risks in your serverless function configurations, like overly permissive roles and network exposure, that could be exploited to breach your serverless applications
- Config: These rules detect security resource misconfigurations in your serverless function configurations and their related code and pipeline infrastructure
- Network Exposure: These rules detect internet-exposed serverless functions by leveraging network configurations monitored across your cloud environment
How to access serverless function rules
To access serverless function rules:
- Under Posture Management, select Rules & Policies → Cloud Security (under Rules).
- Select the Show filter panel icon.
-
Under the Select field menu, select the Asset Types category and select your cloud provider serverless function type from the Select values menu. Options:
- Azure Cloud Function
- Google Cloud Function (Gen 1 only)
- Lambda Function (AWS)
Note
You can select multiple types to view all your serverless function policies across your cloud providers.
A table of serverless function rules filtered by asset type is displayed. Serverless functions properties unique or important enough to mention to serverless functions include:
- Provider: The cloud provider (such as WAS) associated with the serverless function
- Severity: The severity level of findings associated with the rule
- Asset Types: The type of serverless function. Options: Lambda Function, Google Cloud Function, Azure Cloud Function
- Type: The type of serverless function rule. Options: Attack Path, Config, Network Exposure
Manage serverless function rules
You can edit or clone serverless function rules.
- Edit a rule to fine-tune existing rules
- Clone a rule to saves time by reusing settings and applying policies uniformly across similar assets, ensuring standardized policies and predictable behavior
- Under Posture Management, select Rules & Policies → Cloud Security (under Rules).
- Filter for the list of serverless function rules. Refer to How to access serverless function rules above for more information.
-
Right-click on a rule.
-
To edit a rule, click Edit.
You are redirected to the Overview step of the Edit Rule wizard.
-
To clone a rule, select Save as new.
You are redirected to the Overview step of the new rules wizard.
Note
Refer to Create serverless function rules for more information on how to define the steps of a rule in the wizard.
-
Create serverless function rules
You can create custom rules for serverless functions to suit your requirements. The following types of rules are supported:
- Attack Path: These rules monitor the high risk attack paths for potential breaches. Refer to Create an attack path rule for serverless functions for more information
- Config: These rules monitor resource configurations for potential breaches. Refer to Create a configuration rule for serverless functions for more information
- Network Exposure: These rules detect assets exposed to the internet. Refer to Create a network exposure rule for serverless functions for more information
Create an attack path rule for serverless functions
Attack Path policies for serverless functions identify critical risks arising from interconnected weaknesses across your serverless architecture (such as correlating findings across functions, triggers, and permissions), to expose complex attack paths revealing complex attack paths beyond individual findings.
- Under Posture Management, select Rules & Policies → Cloud Security (under Rules) → click Create Rule.
- Select Attack Path.
- On the Overview step of the Create Attack Path Rule wizard.
- Fill in these fields.
- Rule Name: (Required): A user-provided to identify the rule
- Rule Name: (Required): A user-provided to identify the rule
- Description (Required): A description of the policy
- Severity (Required): Select the severity level. Only findings with this exact severity level will trigger this rule. Findings with different severity levels will be ignored
- Labels: (Optional): Assign labels to categorize and organize the rule based on specific criteria or attributes. Labels help in easily identifying and filtering rules
- Enable How to Fix (Optional. Default: ON): Enable to take action when the rule is violated
- Click Next.
- Fill in these fields.
- Define the logic for the rule on the Rule Logic step of the wizard in the query editor.
- Under the value menu in the Find field:
- Select Compute.
- In the corresponding table, search for a serverless function. Options: Lambda Function, Google Cloud Function, Azure Cloud Function.
- Select the
+icon in the editor. - Select an option: Finding, Vulnerability.
- Findings: Define the logic for findings.
- Provide the finding name. The name must match the name of the policy that will generate the security finding.
- Click on the Finding Name card that is displayed In the WHERE field.
- Select the value
inunder the Operator field. - Select the required finding or findings from the list that is displayed.
-
Click Search.
All assets matching the search criteria are displayed. This allows you to validate the rule's effectiveness on existing functions and provides valuable context for refining the rule's logic to accurately identify future functions.
- Select Next.
- Provide suggested mitigation in the How to Fix step and click Done.
- Vulnerability: Define the logic rule for types of vulnerabilities. Options: CVE ID (The unique identifier of the vulnerability), Vulnerability Severity (The impact level of the vulnerability), CVSS Score (The numerical rating of a vulnerability's severity)
- CVE ID: Select in as the operator → enter the CVE ID → Search.
- Vulnerability Severity: Select > or >= as the operator → Severity level (such as High, Low) → Search.
- CVSS Score: Select > or >= as the operator → enter a score → Search.
- Findings: Define the logic for findings.
- Click Next if you have enabled a fix in step 1a above, or Done if fix is disabled.
- Under the value menu in the Find field:
- Define the fix in the How to Fix step (when enabled in step 1a above), and click Done.
Create a configuration rule for serverless functions
Config rules for serverless functions identify security misconfigurations within the settings and deployment infrastructure of your individual serverless resources.
- Under Posture Management, select Rules & Policies → Cloud Security (under Rules) → click Create Rule.
- Select Config.
- On the Overview step of the Create Config Rule wizard.
- Fill in these fields:
- Rule Name: (required): A user-provided to identify the rule
- Description (required): A description of the rule
- Severity (required): Select the severity level. Only findings with this exact severity level will trigger this rule. Findings with different severity levels will be ignored
- Labels: (optional): Assign labels to categorize and organize the rule based on specific criteria or attributes. Labels help in easily identifying and filtering rules
- Enable How to Fix: (Default: ON): Enable to take action when the rule is violated
- Click Next.
- Fill in these fields:
- Define the logic for the configuration rule on the Rule Logic step of the wizard in the query editor.
- Under the Value menu in the Find field:
- Select Compute.
-
Select the relevant serverless function from the list that is displayed. Options: Lambda Function, Google Cloud Function, Azure Cloud Function.
The JSON configuration file for the selected serverless function is displayed. Note that each type of serverless function has a unique configuration file and unique properties.
- Select a property or multiple properties of the serverless function configuration file and provide a value.
-
Click Search.
All assets matching the search criteria are displayed. This allows you to validate the rule's effectiveness on existing functions and provides valuable context for refining the rule's logic to accurately identify future functions.
- Click Next if you have enabled a fix in step 1a above, or Done if fix is disabled.
- Under the Value menu in the Find field:
- Define the fix in the How to Fix step (when enabled in step 1a above), and click Done.
Create a network exposure rule for serverless functions
Network Exposure rules allow you to monitor and control the network accessibility of your serverless functions, identifying configurations that might expose them to unwanted external traffic.
- Under Posture Management, select Rules & Policies → Cloud Security (under Rules) → click Create Rule.
- Select Network Exposure.
- On the Overview step of the Create Network Exposure Rule wizard.
- Fill in these fields:
- Rule Name: (required): A user-provided to identify the rule
- Description (required): A description of the rule
- Severity (required): Select the severity level. Only findings with this exact severity level will trigger this rule. Findings with different severity levels will be ignored
- Labels: (optional): Assign labels to categorize and organize the rule based on specific criteria or attributes. Labels help in easily identifying and filtering rules
- Click Next.
- Fill in these fields:
- Define the logic for the rule on the Rule Logic step of the wizard.
- Fill in these fields:
- Source Network: Select the source network to be evaluated by this rule. Options:
- Untrusted (default): all internet IPs
- A specific IP or CIDR range: Select Show Advanced Settings and fill in the following fields:
- Protocol/Port: Specify the protocols and ports that will generate findings if exposed. For example: tcp/80, tcp/20-23, tcp/80, tcp/443
- Host State: Configure the rule to alert on either active (running) or potentially exposed (stopped) workloads
- Use External Probe Validation: When enabled, network scanning verifies internet exposure and provides additional context (protocols, ports, services). Disabling it relies on configuration alone, which may increase inaccurate findings
- Destination Asset Type: Select Serverless Function as the asset type to be evaluated in the rule
- Cloud Service Provider: Select the target cloud provider in which the rule will be evaluated (AWS, GCP, Azure)
- Source Network: Select the source network to be evaluated by this rule. Options:
- Click Done.
- Fill in these fields:
Serverless function posture policies
Create and manage serverless function policies to detect threats and drive remediation.
Policies combine rules, cloud-account scope, and response actions.\
Create policies by selecting rules and target accounts.\
Edit, clone, or delete policies as requirements change.
Manage serverless function policies
Serverless function policies define how a system should respond to serverless function threats. They include conditions that trigger the policy, the scope of its application, and the actions to be taken when these conditions are met. When policies detect a threat, they generate issues for remediation.
How to access serverless function policies
- Under Posture Management, select Rules & Policies → Cloud Security (under Policies).
- Select the Show filter panel icon.
-
Filter the table by the Asset Types category and select your cloud provider serverless function type from the Select values menu. Options:
- Azure Cloud Function
- Google Cloud Functions: 1st gen and 2nd gen (Cloud Functions API and Cloud Run Admin API)
- Lambda Function (AWS)
Note
You can select multiple types to view all your serverless function rules across your cloud providers.
A list of serverless function rules filtered by asset type is displayed.
Manage serverless function policies
You can delete, edit or clone serverless function policies.
- Delete a policy when no longer relevant, to avoid overhead
- Edit a policy to fine-tune existing policies
- Clone a policy to saves time by reusing settings and applying policies uniformly across similar assets, ensuring standardized policies and predictable behavior
- Under Posture Management, select Rules & Policies → Cloud Security (under Policies).
- Filter for the list of serverless function policies. Refer to How to access serverless function policies above for more information.
-
Right-click on a policy.
- To delete a policy, click Delete, and confirm the deletion in the popup
-
To edit a policy, click Edit.
You are redirected to the Details step of the Edit Policy wizard.
-
To clone a policy, select Save as new.
You are redirected to the Details step of the new policy wizard.
Note
Refer to Create serverless function policies for more information on how to define the steps of a policy in the wizard.
Create serverless function policies
The following procedure describes how to create policies for serverless functions.
- Under Posture Management, select Rules & Policies → Cloud Security (under Policies) → click Create Policy.
- On the Details step of the wizard:
- Fill in these fields:
- Policy Name (required): An alias you provide to identify the policy
- Description (required): A description of the policy
- Labels (optional): Assign labels to categorize and organize the policy based on specific criteria or attributes. Labels help in easily identifying and filtering policies
- Click Next.
- Fill in these fields:
- On the Rules step of the wizard.
-
Select rules that check for violations when scanning serverless functions: Options:
- All Matching Filter Criteria: Allows you to filter for rules according to criteria
- From Rules List. Filter the rues list by the type of serverless function.
- Select From Rules List
- Select Asset Type from the Select Field menu of the query.
- Filter for the following serverless functions, depending on the target cloud provider for the rule. Options:
- Azure Cloud Function
- Google Cloud Function: Google Cloud Functions - 1st gen and 2nd gen (Cloud Functions API and Cloud Run Admin API.
-
Lambda Function
Note
You can select multiple options.
- Select a rule or multiple rules from the resulting list.
- All Rules: This option is not recommended as it will probably create a large number of issues/
Note
For more information about rules, refer to Manage serverless function rules.
-
Click Next.
-
- On the Scope step of the of the wizard:
- Define the scope of the policy by selecting the assets it will apply to. Options:
- From Cloud Accounts (recommended): Select one or more accounts to which this policy applies
- All Cloud Accounts (not recommended): Selecting this option will likely result in a large volume of issues. For more relevant and higher fidelity results, select the From Cloud Accounts option
- Click Done.
- Define the scope of the policy by selecting the assets it will apply to. Options:
Serverless function usage
Serverless functions is integrated as a feature across various sections of your tenant. Refer to the following sections for specific usage instructions within each context:
Serverless function assets
The Serverless Functions asset inventory provides a centralized view of all serverless functions in your environment.
To access serverless function assets, under Inventory, select All Assets → Compute → Serverless Functions.
For more information on serverless function assets, refer to Manage serverless function assets
Serverless function issues
Currently, only vulnerability issues are supported for serverless functions.
- To manage serverless function vulnerability issues through Vulnerability Management:
- Navigate to Posture Management → Vulnerability Management) → Vulnerability Issues.
- Select Add Filters → Asset Category → Serverless Function.
- To manage serverless function vulnerability issues through Vulnerability Assets:
- Navigate to Posture Management → Vulnerability Management) → Vulnerable Assets.
- Select Add Filters → Asset Category → Serverless Functions.
-
Select an asset in the inventory table.
The Overview tab is displayed.
-
Click on Issues.
You are redirected to the Issues page, displaying a list of serverless function vulnerabilities.
The serverless function vulnerabilities issues inventory includes these unique properties:
- Asset Type: The type of serverless function: Lamda Function for AWS, Google Cloud Function for GCP and Azure App Service Web App Function for Azure
- Asset Category: Serverless Functions
Selecting an issue opens the expanded card with additional details about the issue including a description of the issue, when fist and last detected, affected assets, linked cases and evidence (such as the vulnerability ID, CVSS severity, score and version, and the policy that detected the issue).
For more information on vulnerability issues, refer to Investigate and remediate vulnerabilities.
Serverless function findings
- To manage serverless function findings, navigate to Posture Management → Vulnerability Management) → Vulnerability Issues.
- Select All Vulnerabilities Findings.
- Select Add Filters → Asset Category → Serverless Function.
- Select an asset in the inventory table.
For more information on vulnerability findings, refer to View All Vulnerability Findings.
Monitor serverless function scan health
You can monitor and manage the health and status of your integrated serverless function scans, troubleshoot errors and mitigate detected vulnerabilities
For more information, refer to Monitor serverless function scan health.
Cortex Cloud Application Security
The Cortex Cloud Application Security module provides comprehensive security for your applications throughout their entire lifecycle. It offers unified visibility and control over your application's security from development through to deployment.
Use cases
- Application Security Posture Management (ASPM): Provides a consolidated view of application risks and vulnerabilities across your environment, enabling you to understand and manage your overall security posture. For more information refer to Application Security Posture Management (ASPM)
- Supply Chain Security: Focuses on securing your continuous integration and continuous delivery pipelines, ensuring the integrity and security of your automated build and deployment processes. For more information refer to Software supply chain security
- Code Security: Identifies and helps mitigate security issues directly within your source code, including exposed secrets, vulnerabilities in Infrastructure-as-Code (IaC) and open-source components, license miscompliance and package operational risk. from the earliest stages of development. For more information refer to Code Security
License requirements
To enable and utilize the components of the Application Security module, an active base license is required.
While some features are included by default, others require a dedicated add-on purchase.
Base licenses
You must have at least one of the following active base licenses to access the Application Security module:
- Cloud Posture Security or Cloud Runtime Security
- Cortex XSIAM Premium
Module components
- Application Security Posture Management (ASPM): Included with base license
- Supply Chain Security: Included with base license
- Code security: Requires a separate Application Security Add-on purchase in addition to your existing Cloud (Posture or Runtime) or Cortex XSIAM Premium base license
For more information, see Cortex Cloud Application Security
Cloud workload policies and rules
Cloud Workload Policies and Rules help organizations maintain security compliance, prevent misconfigurations, and reduce risks across cloud environments.
- Cloud Workload Policies define organizational security objectives by combining detection logic with preventive actions across selected asset scopes. Policies can generate issues and proactively block misconfigurations before they reach runtime, ensuring workloads remain compliant with security requirements throughout the Software Development Life Cycle (SDLC). They leverage identified security risks and enforce controls at the right stages of development and operations, such as during CI pipelines or in runtime environments.
- Cloud Workload Rules define the detection logic for misconfigurations and their applicable asset types, specifying the criteria and conditions used to identify security risks. These rules can be selected and enforced through Misconfiguration Policies within the designated policy asset scope.
Together, Policies define which risks must be addressed and what actions to take, while Rules specify how those risks are detected through precise logic and conditions.
Prerequisite
Users need View/Edit RBAC permissions (under Policies → Compute Policies) or the Instance Administrator role to view, edit, and modify Cloud Workload Policies policies.
Important
Users with SBAC granular scoping (in addition to the RBAC permissions required for Cloud Workload Policies) can only view Cloud Workload Policies, when their access is scoped to any of the available options: All assets, No assets, or Select asset groups. For more information on granular scoping, see Manage user scope. When no SBAC restriction is applied, the user’s access is determined solely by their RBAC permissions.
How policies and rules work together
Cloud Workload Policies serve as enforcement mechanisms that govern the responses to the identified findings, whereas Cloud Workload Rules establish the criteria for evaluation but do not initiate any actions unless incorporated within a policy.
In the absence of an associated policy, rules exist solely as evaluative criteria and do not generate alerts or trigger any response actions. Policies determine how findings from rules are escalated to issues or preventive measures.
Cloud workload policies
Cloud Workload Policies help you prevent and manage security violations in your cloud runtime instances. They enable you to apply detection logic to specific asset groups at the desired SDLC stage, and define what action needs to be taken if the conditions are met.
Depending on the nature of the security violation, a Cloud Workload Policy allows you to
- Prevent the violation. Enable proactive prevention of the violation. For example: Block an S3 bucket deployment that is open to the public.
- Create an issue. Create an issue when violation is seen. For example: Create an issue when an AWS credential file is found on a Linux server.
Note
Issues are automatically resolved when the finding is no longer applicable to the asset or when the affected asset is removed from the inventory.
For more details on Prevent and create issues, see Cloud Workload Preventive Action.
A Cortex Cloud Workload Policy has the following elements:
- SDLC Evaluation Stage: The SDLC stage at which the policy is applied and evaluated. Depending on the policy type, one or more of the following stages may be available:
- CI: The stage during which a pipeline builds the artifact. After building the artifact, the pipeline pushes it to a registry.
- Deploy: The stage when the artifact is pushed to a cloud instance for running.
- Runtime: The stage when the artifact is running on a cloud instance.
- Rule (Conditions): The logical conditions that will trigger the evaluation of this policy.
- Scope: A filter specifying which assets the rule applies to.
- Action: The response triggered when the rule evaluates successfully (only when part of a policy). Based on the rules included in the policy, it can create an issue or prevent the security violation.
Types of cloud workload policies
- Misconfiguration policies: Enables you to assess various workloads for misconfigurations against relevant security standards and your organization’s security guidelines. You can include both predefined and custom rules in these policies to either prevent violations or create issues for violations.
- Malware policies: Enable you to detect and manage malicious files within cloud workloads. These policies analyze files based on predefined parameters such as file name, path, size, and detection method.
- Secret policies: Enable you to identify and protect sensitive information—such as API keys and credentials—within workloads.
- Trusted Image policies: Enable you to ensure the authenticity, integrity, and security of container images and VMs deployed into your Kubernetes environments. This includes actions such as limiting allowed image sources, mitigating possible image tampering, and more.
Trusted image cloud workload policies
Trusted image policies ensure the integrity and security of container images and VMs deployed into Kubernetes environments. This topic details the policy enforcement logic that Cortex uses to determine if an image is trusted, what action to take, and which issues to generate.
Images are evaluated to see if they:
- Match the trusted image policy criteria.
- Should be allowed or prevented, based on policy criteria and scope.
- Should trigger the creation of security or posture issues when untrusted.
Note
Registry scanning is for finding problems that are objectively issues regardless of context, organization, or scope. Trust, however, is subjective. Depending on the scope and other factors, an issue may or may not be problematic, and can change over time depending on the context.
Trusted image policy actions
When defining a trusted image policy, you determine what actions should be taken if an image is not trusted.
-
Create an Issue. The image is allowed to run, but a violation is recorded as a posture and/or security issue. For the purposes of this documentation, we refer to this as an issue-only action.
The primary purpose of trusted image policies with the issue-only action is auditing and compliance. These violations are identified by Cortex periodic scans.
The issue-only action assesses trust across a range of assets, including Kubernetes workloads (which are cloud-agnostic, supporting AWS, Azure, GCP, OCI), virtual machines (VMs).
-
Prevent and Create an Issue. Images created after this policy is enabled will be blocked from running if they don't meet the trust criteria, and a violation will also be recorded as a security issue. For images that were already running—and which don't meet the trust criteria—a posture issue is created.For the purposes of this documentation, we will refer to this as the prevent action.
These issues block deployment in real-time.
The prevent action is cloud-agnostic (supports AWS, Azure, GCP, OCI) and enforced at the Kubernetes cluster level via the admission controller.
Before you begin working with trusted image policies
Consider the following prerequisite:
- All trusted image policies are designed for runtime security enforcement. However, to ensure that policies with the prevent action can successfully block untrusted images, the policy's scope must be on a Kubernetes cluster where the admission controller is enabled.
Trusted image policy enforcement logic
The evaluation of trusted image policies is based on logic that determines the following critical outcomes: Which container images are trusted in a given scope and which violations result in the creation of security and posture issues.
-
Utilizing an "OR-based" approach
Cortex utilizes an "OR-based" approach, with no explicit priority or rule order when resolving policy conflicts.
This enables Cortex to prioritize the most permissive result among conflicting policies with prevent actions, while enforcing the most restrictive result between policies with issue-only actions.
- Prevent actions: Minimizing prevention, and allowing as many images as possible to be trusted, is desirable in order to avoid blocking workloads from running.
- Issue creation: Minimizing the number of issues generated is desirable to avoid issue redundancy, unnecessary analysis, and issue handling.
Understanding the approach and the logic behind it helps you create policies efficiently.
Recommendations include:
- When possible, the optimal way to define all trust criteria is to define the criteria in one policy.
- If you are defining cluster-level trust criteria along with other options at the namespace/registry level, understand that because there are no priority/order options, you must plan your policies accordingly.
-
Trusting and allowing images by scope
Trusted image policies provide granular control by ensuring that policies only impact the specific environment (scope) for which they are defined. An image can be trusted in one scope and untrusted in another. For example, a third party image may be trusted in your Development environment but immediately untrusted in your Production environment.
If you have not defined any trusted image policies for a specific scope, the default behavior is that all images within that scope are implicitly trusted However, once a policy is defined for a scope, any image not explicitly trusted by that policy is automatically untrusted.
Policy enforcement is directly tied to the defined scope. When you define the Asset Group scope for a policy (for example, a specific cluster's Test namespace), the policy applies only to the resources within that exact definition. The more narrowly defined your scope, the more targeted the policy's enforcement will be, ensuring the enforcement does not affect unrelated resources.
If multiple policies with prevent actions cover the same scope, the logic is additive (allow-wins). As long as at least one of those policies results in the image being trusted, the image will be allowed to run.
Note
Trusted image policies do not override other policies and their rules, such as malware policies, misconfiguration policies, and secrets policies.
-
Generating issues
The following points clarify the logic for generating runtime security issues and posture issues based on your defined policies:
-
Runtime security issues:
A runtime security issue is generated only if an image is untrusted by all policies. If at least one policy trusts the image, no runtime security issue is created. Additionally, each policy with a prevent action that identifies an issue will generate only one corresponding runtime security issue.
-
Posture issues:
For policies with the prevent action:
- if an image is prevented from running, no posture issues are created by any policy within that scope.
- Posture issues are created if images that are running violate any policy within the scope.
For policies with the issue-only action, posture issues are created at the granular level of one issue per untrusted image per policy that fails the trust criteria. The posture Issues are created on the relevant asset type and are titled accordingly:
- Kubernetes workload asset type: The issue title will be Untrusted image running in Kubernetes workload X.
- Virtual machine asset type: The issue title will be Untrusted image running in Virtual Machine Y.
For each issue regardless of asset type, the description will be either:
-
For untrusted images:
[AssetType] [AssetName] is running the image {ImageName}. that does not comply with the trust criteria defined in the Trusted Images policy [PolicyName].
-
For cases when there's missing information:
[AssetType] [AssetName] is running the image {ImageName}. Information is missing to determine compliance with the trust criteria defined in the Trusted Images policy [PolicyName].
The issues will also include the image name, a link to the image asset page, the relevant Kubernetes hierarchy (cluster and namespace) for Kubernetes workloads only, and more.
-
-
Policy evaluation: Handling unknown, missing or partial image data
Situations may arise where insufficient information is available at the time of deployment to conclusively arrive at a trust verdict. This means Cortex cannot confirm an image's trusted or untrusted status. Examples of such situations where there is a lack of complete image metadata include:
- Initial discovery or missing scan data: If an image is being evaluated for the first time, some vital information may be temporarily unavailable that would generally have been derived from a prior comprehensive scan, such as the image's Base Layer data or its CLI scan status.
- Partial deployment metadata: The trust criteria specified in your trusted image policy may include image metadata that is not present in the deployment file. For example, a policy might mandate a specific tag, but the Kubernetes deployment resource uses only the image digest (SHA) and omits the tag.
Cortex handles these situations differently based on the policy's action:
- For policies with issue-only actions: Cortex creates a posture issue and a runtime security issue, flagging the image as potentially untrusted due to insufficient data. The image is allowed to deploy, but the issue prompts the user to investigate the data gap.
- For policies with prevent actions: Cortex relies on the user-defined Action when trust verdict is unavailable value in the policy's action section.
Caution
The default behavior for the prevent action when trust criteria are unavailable is Create an Issue. Be aware that changing this default will mean an incomplete deployment file can block a workload.
-
Policy decision logic for workloads
Situations might arise where within the same workload, multiple images or multiple policies yield conflicting trust results. When these conflicts occur—such as one policy trusting an image while another prevents it, or a single deployment containing both trusted and untrusted images—Cortex relies on the following defined logic to determine the final deployment outcome and what issues, if any, are generated.
- For policies with issue-only actions: Any time an image fails the trust criteria for an Issue-only action policy, a Posture Issue is created. This action is non-blocking; the image is allowed to deploy regardless of the issue.
- For policies with prevent actions:
- Conflicting allow vs. prevent policies: If multiple prevent action policies apply to a single image within a workload, and one policy allows the image while another does not trust it, the image is ultimately trusted and allowed to run. This follows the "Allow-Wins" principle.
- Conflicting Images within the same workload: If a single workload (meaning, one deployment) contains both trusted and untrusted images, the entire deployment is blocked. The security risk posed by the single untrusted image prevents the entire workload from running.
Policy enforcement examples
This section provides examples that help illustrate the policy enforcement logic described above.
Example: Handling contradictory policies
This example illustrates how Cortex determines how to allow or prevent images, and create issues, when multiple policies conflict.
- User deploys the docker.io/library/alpine:1.2.3 image.
- Trusted image policies are validated at set periodic scan intervals or when a resource is deployed.
- Two trusted image policies with prevent actions evaluate the image to determine its trust status. Cortex uses an "OR-based" evaluation for conflicting prevent action policies to determine if the image is trusted.
- Policy 1 allows the image because the image is in the docker.io registry. So even though Policy 2 does not trust the image, the trust verdict is trusted and image deployment proceeds.
- No runtime security issues are created because the image is trusted by one policy—namely, Policy 1.
- No posture issues are created because:
- There are no policies with issue-only actions—only policies with prevent actions.
-
The user defined two trusted registries, and a trusted image comes from one of them.
The user does not anticipate any further issues.
Example: Preventing images based on policies with prevent actions
This example illustrates how Cortex determines how images are prevented from deployment in cases where a data verdict is unavailable.
- User deploys the **production:alpine@sha256:554443 **image with the base image of base2.
- Trusted image policies are validated at set periodic scan intervals or when a resource is deployed.
- Three policies with prevent actions evaluate the image to determine its trust status. Cortex uses an "OR-based" evaluation for conflicting policies to determine if the image is trusted.
-
Policy 1's criteria production/alpine:1.2.3 only partially match the deployed image's full image identifier, production:alpine@sha256:554443. For example, the deployed image is missing the tag.
If the image developer built the image, pushed it to the registry, and tagged it as :1.2.3, and that specific content generated the digest sha256:554443..., then they are a match at that moment in time. But this could change, so there is no definitive trust verdict.
Because policy 1 has a prevent action with the additional Action when trust verdict is unavailable option set to Prevent and create an issue, the image is untrusted.
- Policy 2, with its issue-only action, only trusts **base1 **images, so this policy considers the image untrusted.
- Policy 3, with its issue-only action, requires the image to have been scanned by a CLI scanner, so the image is untrusted.
-
- Because all three policies do not trust the image, the image is prevented and deployment does not proceed.
-
A runtime security issue is created because of at least one policy does not trust the image. Only one runtime security issue is created, even though three policies don't trust the image.
No posture issues are created because the image was prevented. Posture images must be actionable, and no actions can be taken on a prevented image.
Example: Allowing images based on policies with prevent actions
This example illustrates how Cortex determines how images are allowed to deploy in cases where a data verdict is unavailable.
- User deploys the **production:alpine@sha256:554443 **image with the base image of base2.
- Trusted image policies are validated at set periodic scan intervals or when a resource is deployed.
- Three policies evaluate the image to determine its trust status. Cortex uses an "OR-based" evaluation for conflicting policies to determine if the image is trusted.
-
Policy 1's criteria production/alpine:1.2.3 only partially match the deployed image's full image identifier, production:alpine@sha256:554443. For example, the image is missing the tag.
If the image developer built the image, pushed it to the registry, and tagged it as :1.2.3, and that specific content generated the digest sha256:554443..., then they are a match at that moment in time. But this could change, so there is no definitive trust verdict.
Because policy 1 has a prevent action with the additional Action when trust verdict is unavailable option set to Create an issue, the image is trusted.
- Policy 2, with its issue-only action, only trusts **base1 **images, so the policy considers the image is untrusted.
- Policy 3, with its issue-only action, requires the image to have been scanned by a CLI scanner, so the image is considered untrusted.
-
- The image is allowed and deployment proceeds, because one of the three policies trusts the image and Cortex uses an "OR-based" approach.
-
No runtime security issue is created because of the trust verdict is to trust and allow.
No posture issues are created because the image was prevented. Posture images must be actionable, and no actions can be taken on a prevented image.
Cloud Workload Policies page
The Cloud Workload Policies page allows users to manage policies that define security and compliance actions for cloud workloads. Users can create, edit, filter, and manage policies through a structured table and widget panel.
Note
Keep the following caveats in my mind when working with Policies:
- Instance Administrators are able to view all facets of policies without restrictions, even if Scope Based Access Control (SBAC) roles are in effect. Learn more about SBAC.
- If you’ve been assigned a custom role with View/Edit permissions limited by SBAC, you may not be able to view certain policies.
- You can further narrow your search on the Inventory page by using SBAC to limit the scope of the finding, issue, and case counts.
The Cloud Workload Policies page displays all the configured policies with the following fields.
Policy table columns
| Field | Description |
| Policy Type | Defines the policy category: Misconfigurations, Secrets, Malware, Trusted Images. |
| Policy Name | The user-defined name of the policy. |
| Action | Defines the action taken when conditions match: Create an Issue (logs an issue) or Prevent and Create an Issue (prevents the action and logs an issue). |
| Severity | The severity level of the issue created: Critical, High, Medium, Low, or Informational. |
| Asset Groups | Predefined groups of assets to which the policy applies. |
| Open Issues | The number of unresolved issues associated with the policy. |
| Conditions | Define the detection rule by specifying the criteria that match relevant malware, secret, or trusted image findings. |
| Exceptions | Defines the exclusion criteria to omit malware, secret, or trusted image findings that meet specific conditions you want to exclude from the policy. |
| Evaluation Stage | Indicates at which stage in the SDLC the policy is evaluated. |
| Description | Additional details about the policy. |
| Created By | The user who created the policy. |
| Last Modified | The timestamp of the last modification. |
Widgets panel
The Cloud Workload Policies page includes a widget panel that provides a visual summary of policies:
- Policies by Type: Displays policies categorized as misconfiguration, secret, trusted images, or malware.
- Policies by Evaluation Stage: Shows the distribution of policies based on SDLC evaluation stages: Runtime, Deploy, or CI.
Show or hide the widget panel
The widget panel provides a visual summary of policies based on policy type or evaluation stage.
To hide the widget panel, do the following:
- Navigate to Posture Management → Rules & Policies → Policies → Cloud Workload.
- On the Cloud Workload Policies page, click the Widget Panel icon at the top of the page.
- The panel toggles between visible and hidden states.
Change the layout of the policies table
- Navigate to Posture Management → Rules & Policies → Policies → Cloud Workload.
- In the Cloud Workload Policies page, click the More Options icon (⋮).
- In the Layout tab, do the following:
- To remove columns, go to the In View section and search for a specific column. Click - next to the column to remove it from the table.
- To reorder columns, go to the In View section. Click and drag columns up or down to rearrange the columns.
- To add new columns, go to the Add Columns section. Click + next to the columns to include them in the table.
- The table layout updates automatically based on your selections.
Policy details panel
The policy details panel is displayed when you click a policy in the policy table. To view details of a cloud workload policy:
- Navigate to Posture Management → Rules & Policies → Policies → Cloud Workload.
- In the Cloud Workload Policies page, select the policy you want to check.
The policy panel displays the following details related to the selected policy:
- Policy details.
- Related rule settings.
- The number of issues opened as part of the policy. You can click on the link to navigate to the Issues and Cases section to check the issue details.
From the policy detail panel, you can:
- Enable or disable the policy
- Edit the policy
- Save as new
- Delete the policy
Enable or disable a cloud workload policy
- Navigate to Posture Management → Rules & Policies → Policies → Cloud Workload.
- In the Cloud Workload Policies page, click on the policy you want to enable or disable.
- In the Details page, click the toggle button at the top to enable or disable the policy.
Create a cloud workload policy
You can create policies to address specific types of security risks or compliance requirements.
To create a cloud workload policy:
Navigate to Posture Management → Rules & Policies → Policies → Cloud Workload.
In the Cloud Workload Policy page, click Create Policy and select the type of policy you want to create:
- Enter a unique name and description. Note that these are mandatory fields.
-
The Evaluation Stage will be selected as Runtime.
Note
The Evaluation stage for Misconfiguration policies is supported only in the Runtime SDLC stage and is enforceable through the Kubernetes Admission Controller for clusters onboarded using the Posture Management (KSPM) Connector.
- Click Next
- The Summary section on the right displays a real-time, interactive view of all policy configurations as users progress through the wizard. It automatically updates to reflect the current selections and settings, enabling seamless navigation between fields from any step in the wizard. It includes the following sections:
- General – Policy name and description.
- Rules – No. of selected rules and the asset types relevant to the selected rules.
- Scope - The defined scopes included in the policy and SDLC stage.
- In the Rules section:
-
Click on Add Rules to select the rules that identify the violations that you want to track.
A new window opens, displaying a list of all the existing predefined OOTB rules.
Note
Use Create a new Custom Detection Rule to define and add new custom rules as required.
- After completing your selection, click Select to confirm. The chosen rules are displayed in the Rules section, where you can toggle between the Cards and Grid view to display the rules in your preferred layout.
-
In the Rules section, you can select one or more rules to modify the Severity, Policy Action and Remediation values, either individually or in bulk.
Note
Each rule may support different actions. While some include both Create an Issue and Prevent and Create an Issue, others provide only the Create an Issue option.
-
-
In the Scope section, for the Scope Selection Method, select Asset Groups or Default Asset Scopes, depending on your preference.
- If you select Asset Groups, you can choose between the following options:
Select existing Asset groups
The displayed list shows all Asset Groups available in the Runtime SDLC stage. You can select the asset group to which you want this policy to apply.
Click Preview Selection to view all relevant Compute Assets associated with the selected asset groups.
All non-relevant (non-compute) assets are automatically excluded from the included asset list.
Add Group
Click on Add Group. A new window opens to create a new Compute Asset group.
- Enter a unique Group name and Description.
-
The displayed list of Compute Assets in the table is pre-filtered to show only the relevant assets based on the rules selected in the previous section. The asset list is dynamically updated and restricted to the applicable asset types of the selected rules, ensuring that users can select only valid and compatible assets for the new Compute Asset Group.
You can filter these assets using the Show Filter Panel button based on the fields Asset ID, Name, Provider, and more.
- When only an asset filter is defined, the system creates a dynamic asset group that automatically includes assets that meet the specified filter criteria.
Dynamic asset groups for Kubernetes Prevent Policies support these attributes:
- Kubernetes Resource Cluster: The cloud identifier for the cluster.
- Kubernetes Resource Namespace: The namespace where the resource is located.
- Kubernetes Resource Labels: The labels assigned to the resource.
- Kubernetes Resource Category: The category of the resource (Identity, Workload, Configuration, or Network).
- Kubernetes Resource Creation Time: The time the resource was created.
- Kubernetes Resource Name: The name of the resource.
When specific assets are manually selected from the asset list, a static asset group is created, containing only the explicitly chosen assets.
b. On selecting Default Asset Scopes, you can further select the Assets Scope from the predefined Asset Scopes that are filtered based on the selected rules in the previous section and their applicable Asset Types. The Scope options are dynamically updated and limited to the applicable asset types of the selected rules, ensuring that users can select only valid and compatible scopes.
-
Click Done to complete the process and create the new Misconfiguration Workload Policy.
- Enter a unique name and description. Note that these are mandatory fields.
- Select an SDLC Evaluation Stage. The following options are available.
- CI
- Runtime
- Deploy
- Click Next.
- The Summary section on the right provides a real-time, readable view of all policy configurations as users progress through the wizard. It automatically updates to reflect current selections and settings. It includes the following sections:
- General – Policy name and description.
- Conditions – Selected rule filter and exclusion criteria.
- Scope - The defined scopes included in the policy and SDLC stage.
- Actions - Selected action type.
- Configure the settings specific to the evaluation stage you select.
CI
- In the Conditions section, define the detection rule by specifying the criteria to identify relevant malware findings. You may also include exclusion criteria to filter out any malware findings that meet specific conditions you wish to exclude from this policy.
- Click Next.
- In the Scope section, select the checkbox to confirm that this selection applies the policy and its detection rules to All Cloud Workload Build Container Image asset types available at the CI SDLC stage.
- Click Next.
- In the Action section:
-
For Select an action, choose the option to Create an issue to log an issue if the policy is violated or Prevent and create an issue to prevent and create an issue.
Note
See Cloud Workload Preventive Action, to learn more about the Prevent action behavior and prerequisites.
If the Prevent and create an issue action is selected, the preventive actions in the CI pipeline will trigger a Fail Pipeline by returning an exit code of 2 in the CI tool.
- Under Issue Severity, choose Critical, High, Medium or Low to define the issue severity.
- In the Remediation Guidance field, enter the optional remediation instructions.
-
- Click Done to complete the process and create the new Cloud Malware Workload Policy.
Runtime
- In the Conditions section, define the detection rule by specifying the criteria to identify relevant malware findings. You may also include exclusion criteria to filter out any malware findings that meet specific conditions you wish to exclude from this policy.
- Click Next.
- In the Scope section, for the Scope Selection Method, select Asset Groups or Default Asset Scopes, depending on your requirement.
-
If you select Asset Groups, you can choose between the following options:
Select existing Asset groups
The displayed list contains all the asset groups for the Cloud Workload Container Images, Container Instances, Hosts (VM Instances), Serverless Functions or Kubernetes Workloads asset types that are available at the Runtime SDLC stage.
Add Group
- Click on Add Group. A new window opens to create a new Compute Asset group.
-
The displayed list of Compute Assets in the table is pre-filtered to show only the Compute asset types as Cloud Workload Container Images, Container Instances, Hosts (VM Instances), Serverless Functions or Kubernetes Workloads asset types, ensuring that users can select only valid and compatible assets for the new Compute Asset Group.
You can filter these assets using the Show filter Panel button based on the fields Asset ID, Name, Provider and more.
-
When only an asset filter is defined, the system creates a dynamic asset group, that automatically includes assets that meet the specified filter criteria.
When specific assets are manually selected from the asset list, a static asset group is created, containing only the explicitly chosen assets.
You can then select the asset group to which you want this policy to apply.
-
On selecting Default Asset Scopes, you can further select the Asset Scopes as:
-
All Cloud Workload Assets
Choosing this option results in the automatic selection of all other asset scopes in the list.
- All Cloud Workload Hosts(VM Instances)
- All Cloud Workload Container Images
- All Cloud Workload Container Instances
- All Cloud Workload Kubernetes Workloads
- All Cloud Workload Serverless Functions
-
-
- Click Next.
- In the Action section:
-
For Select an Action, choose the option to Create an issue to log an issue if the policy is violated or Prevent and create an issue to prevent and create an issue.
See Cloud Workload Preventive Action to learn more about the Prevent action behavior and prerequisites.
- Under Issue Severity, choose Critical, High, Medium or Low to define the issue severity.
- In the Remediation Guidance field, enter the optional remediation instructions.
-
- Click Done to complete the process and create the new Cloud Malware Workload Policy.
Deploy
- In the Conditions section, define the detection rule by specifying the criteria to identify relevant malware findings. You may also include exclusion criteria to filter out any malware findings that meet specific conditions you wish to exclude from this policy.
- Click Next.
- In the Scope section, for the Scope Selection Method select Registry Images in Cloud Workload Asset Groups or the All Cloud Workload Registry Images, depending on your requirement.
- If you select Registry Images in Cloud Workload Asset Groups ,this policy applies only to Cloud Workload Container Registry Images asset types in those groups that are available at the Deploy SDLC stage. A list of all these available asset groups is displayed. You can then select the asset group to which you want this policy to apply.
- On selecting All Cloud Workload Registry Images, the policy and its detection rules will apply to All Cloud Workload Container Registry Images asset types available at Deploy SDLC Stage.
- Click Next.
- In the Action section:
- For Select an Action, the default option is Create an issue to log an issue if the policy is violated.
- Under Issue Severity, choose Critical, High, Medium or Low to define the issue severity.
- In the Remediation Guidance field, enter the optional remediation instructions.
-
Click Done to complete the process and create the new Cloud Malware Workload Policy.
- Enter a unique name and description. Note that these are mandatory fields.
- Select an SDLC Evaluation Stage. The following options are available.
- CI
- Runtime
- Deploy
- Click Next.
- The Summary section on the right provides a real-time, readable view of all policy configurations as users progress through the wizard. It automatically updates to reflect current selections and settings. It includes the following sections:
- General – Policy name and description.
- Conditions – Selected rule filter and exclusion criteria.
- Scope - The defined scopes included in the policy and SDLC stage.
- Actions - Selected action type.
- Configure the settings specific to the evaluation stage you select.
CI
- In the Conditions section, define the detection rule by specifying the criteria to identify relevant malware findings. You may also include exclusion criteria to filter out any malware findings that meet specific conditions you wish to exclude from this policy.
- Click Next.
- In the Scope section, select the checkbox to confirm that this selection applies the policy and its detection rules to All Cloud Workload Build Container Images asset types available at the CI SDLC stage.
- Click Next.
- In the Action section:
- For Select an action, choose the option to Create an issue to log an issue if the policy is violated or Prevent and create an issue to prevent and create an issue.
- Under Issue Severity, choose Critical, High, Medium or Low to define the issue severity.
- In the Remediation Guidance field, enter the optional remediation instructions.
- Click Done to complete the process and create the new Cloud Malware Workload Policy.
Runtime
- In the Conditions section, define the detection rule by specifying the criteria to identify relevant malware findings. You may also include exclusion criteria to filter out any malware findings that meet specific conditions you wish to exclude from this policy.
- Click Next.
-
In the Scope section, for the Scope Selection Method, select Asset Groups or Default Asset Scopes, depending on your requirement.
- If you select Asset Groups, you can choose between the following options:
Select existing Asset groups
The displayed list contains all the asset groups for the Cloud Workload Container Images, Container Instances, Hosts (VM Instances), Serverless Functions or Kubernetes Workloads asset types that are available at the Runtime SDLC stage.
Add Group
- Click on Add Group. A new window opens to create a new Compute Asset group.
-
The displayed list contains all the asset groups for only the Compute asset types as Cloud Workload Container Images, Container Instances, Hosts (VM Instances), Serverless Functions or Kubernetes Workloads, ensuring that users can select only valid and compatible assets for the new Compute Asset Group.
You can filter these assets using the Show filter Panel button based on the fields Asset ID, Name, Provider and more.
-
When only an asset filter is defined, the system creates a dynamic asset group that automatically includes assets that meet the specified filter criteria.
When specific assets are manually selected from the asset list, a static asset group is created, containing only the explicitly chosen assets.
You can then select the asset group to which you want this policy to apply.
- On selecting Default Asset Scope, you can further select the Asset Scopes as
-
All Cloud Workload Assets
Note
Choosing this option results in the automatic selection of all other asset scopes in the list.
- All Cloud Workload Hosts(VM Instances)
- All Cloud Workload Container Images
- All Cloud Workload Container Instances
- All Cloud Workload Kubernetes Workloads
- All Cloud Workload Serverless Functions
-
- Click Next.
- In the Action section:
-
For Select an action, choose the option to Create an issue to log an issue if the policy is violated or Prevent and create an issue to prevent and create an issue.
Note
See Cloud Workload Preventive Action to learn more about the Prevent action behavior and prerequisites.
- Under Issue Severity, choose Critical, High, Medium or Low to define the issue severity.
- In the Remediation Guidance field, enter the optional remediation instructions.
-
- Click Done to complete the process and create the new Cloud Malware Workload Policy.
Deploy
- In the Conditions section, define the detection rule by specifying the criteria to identify relevant malware findings. You may also include exclusion criteria to filter out any malware findings that meet specific conditions you wish to exclude from this policy.
- Click Next.
- In the Scope section, for the Scope Selection Method select Registry Images in Cloud Workload Asset Groups or the All Cloud Workload Registry Images, depending on your requirement.
- If you select Registry Images in Cloud Workload Asset Groups ,this policy applies only to Cloud Workload Container Registry Images asset types in those groups that are available at the Deploy SDLC stage. A list of all these available asset groups is displayed. You can then select the asset group to which you want this policy to apply.
- On selecting All Cloud Workload Registry Images, the policy and its detection rules will apply to All Cloud Workload Container Registry Images asset types available at Deploy SDLC Stage.
- Click Next.
- In the Action section:
- For Select an Action, the default option is Create an issue to log an issue if the policy is violated.
- Under Issue Severity, choose Critical, High, Medium or Low to define the issue severity.
- In the Remediation Guidance field, enter the optional remediation instructions.
- Click Done to complete the process and create the new Cloud Malware Workload Policy.
- Enter a unique name and description. Note that these are mandatory fields. The SDLC Evaluation Stage is preset to Runtime.
- Click Next.
- Configure the policy's condition settings.
-
In the Conditions section, specify the criteria to identify relevant images.
You can specify criteria to define both broad policies and strict policies, for example:
Trust images (from registryX or registryY) OR (digestA or digestB). An example of criteria for a broad policy could beall images from gcr.io/myorg/while an example of criteria for a strict policy could be:gcr.io/myorg/app@sha256:abc123.You can also include exclusion criteria to filter out any images that meet specific conditions for exclusion from this policy.
Because trust is subjective, context-dependent, and scope-based, we recommend you create finely-tuned criteria. For example, an image might be trusted in a low-risk demo environment because it has relaxed patching requirements, but it would be instantly blocked as untrusted in a production environment. For more information, see Trusted Image Policies.
-
Considerations for specifying criteria for the policy's conditions
- If you include a base image as a criterion in your trusted image policy, ensure that the base image itself is successfully scanned and pre-ingested into the system.
- Do not use Scanned by CLI = Yes as the sole criterion for establishing image trust. The CLI scanning status is generally used as an indicator that contributes to overall trustworthiness. Instead, combine the CLI scanning status with stronger, verifiable identifiers like the image registry, signature, and/or base image.
- Define trust criteria only using metadata that is consistently and explicitly included in your deployment files. The policy cannot establish trust if the required metadata (for example, a specific tag or label) is missing from the image definition.
- Avoid using mutable tags as criteria for establishing image trust. Because the underlying image associated with a mutable tag can change without warning, basing trust on it can lead to unexpected outcomes. We strongly recommend enforcing immutable tags—a hallmark of secure, mature CI/CD pipelines—which is supported by all major registries (such as Docker Hub, ACR, ECR, GAR).
- When using trust criteria that rely on image metadata, such as the base layer information or specific tags, we recommend that you pre-ingest the images into Cortex Cloud. While it is possible to base trust on an image that has not been pre-ingested, omitting this step can significantly impact the performance of your policy evaluation, slowing down critical CI/CD workflows.
- Click Next.
4. Configure the policy's scope settings.
- In the Scope section, for the Scope Selection Method select Asset Groups or Default Asset Scopes.
-
Asset Groups. The policy applies only to Cloud workload container images, container instances, hosts (VM instances), serverless functions or Kubernetes workload asset types in those groups that are available at the Runtime SDLC stage. A list of available asset groups is displayed. You can then select the asset group to which you want this policy to apply.
\
We recommend narrowing the asset group scope to ensure that a policy only checks relevant assets. For more information, see Trusted Images Policies.Consider the following when specifying criteria for the policy's scope:
- Exclude system-critical Kubernetes namespaces, such as kube-system, from the policy scope to avoid interfering with core cluster operations.
- If you select an asset group that contains a specific namespace, the policy will apply only to resources in that namespace—not the entire cluster.
-
Default Asset Scopes. On selecting Default Asset Scopes, you can further select the Asset Types:
- All Cloud Workload Assets
- All Cloud Workload Container Images
- All Cloud Workload Kubernetes Workloads
- All Cloud Workload Serverless Functions
- All Cloud Workload Hosts (VM Instances)
-
- Click Next.
5. Configure the policy's action settings. In the Action section:
- For Select an Action, choose either Create an issue to log an issue if the policy is violated or Prevent and create an issue to prevent and create an issue. For more information, see Preventative action.
- If you select Prevent and create an issue as the policy's action, an additional Action when trust verdict is unavailable option becomes available. This is for situations where there is insufficient information available for determining if the image is trusted. The default is Prevent and create an issue.
- Under Issue Severity, choose Critical, High, Medium, or Low to define the issue severity.
- In the Remediation Guidance field, enter optional remediation instructions.
Issues are automatically closed when the affected asset is removed from the inventory or when the policy is deleted. You can manually close issues at any time.
6. Click Done to complete the process and create the new policy.
Use an existing policy to create a new cloud workload policy
- Navigate to Posture Management → Rules & Policies → Policies → Cloud Workload.
- In the Cloud Workload Policies page, click the policy you want to enable or disable.
- In the Details page, click the More Options icon (⋮) and then select Save as new.
- Modify the necessary fields in the Policy Name, Conditions, Scope, and Actions screens.
- Click Done to create the new custom policy.
Edit a cloud workload policy
- Navigate to Posture Management → Rules & Policies → Policies → Cloud Workload.
- In the Cloud Workload Policies page, click the policy you want to enable or disable.
- In the Details page, click the Edit icon.
- Make the necessary changes.
- Click Done to save the changes.
Delete a cloud workload policy
- Navigate to Posture Management → Rules & Policies → Policies → Cloud Workload.
- In the Cloud Workload Policies page, click the policy you want to delete.
- In the Details page, click the More Options icon (⋮) and then select Delete policy.
- Click Delete to confirm.
Cloud workload preventive action
Some Cloud Workload policies provide a Prevent and Create an Issue action that enforces compliance during deployments.
Prevention action for runtime stage policies
The Prevent action at Runtime applies only to Kubernetes Workload Images assets.
When a Kubernetes Workload image violates a policy, the Kubernetes Admission Controller (on clusters where the KSPM Connector is deployed and Admission Control is enabled) can block it from being admitted to the cluster.
For all other asset types within the policy scope, no runtime prevention will occur. Instead, the violation will result in an Issue being created.
Prerequisites
Ensure that your cluster has the Posture Management (KSPM) Connector deployed with the Admission Controller functionality enabled.
You can manage these deployments from the Kubernetes Connectivity Management page.
To access the Kubernetes Connectivity Management, navigate to the following URL in your tenant environment: https://[TENANT-ADDRESS]/cwp/k8s-management.
Important considerations
- Recommended Approach: Begin with the Create an Issue action to validate results before selecting Prevent and Create an Issue. This helps prevent potential disruptions to your applications or development workflows.
- Impact on New Deployments: The Prevent and Create an Issue action affects only new or future deployments that meet the prevention criteria. It does not impact cloud workload assets that are already deployed.
Prevention action for CI stage Policies
Prevention actions in the CI stage triggers a pipeline failure by returning an exit code of 2 in the CI tool.
Cloud workload rules
Cloud workload rules define the criteria for identifying security violations. These criteria can be applied to assets in your cloud environment and to findings generated by Cortex XSIAM.
Rules only enable the detection of security violations. They must be included in a policy to trigger a preventive response or to generate an alert as an issue.
Default (pre-defined) rules
Cortex XSIAM includes several pre-defined rules to secure your cloud runtimes. These rules are used by default policies to prevent security violations and create issues.
Custom (user-defined) rules
Custom Rules or Custom Detection Rules allow you to define and implement tailored security and compliance checks within cloud workloads. These rules enable organizations to detect specific conditions, vulnerabilities, or misconfigurations that might not be covered by built-in system rules.
A custom rule consists of the following components:
- Scanner: Defines the mechanism by which the rule inspects the cloud assets. You need to select the scanner type that will implement the rule. Every time the selected scanner runs, all the rules associated with that scanner are also executed. The available scanner types are:
- Agentless Disk Scan: Rules that use Agentless Disk Scanner to inspect the container images on which the Agentless scanner runs. You can specify different rules for containers running different OSes. For example, you can create a rule that checks for incorrect or malicious entries in the etc\hosts file on Windows images.
- Kubernetes Connector: Rules that use the Kubernetes Connector scanner to inspect Kubernetes environment variables and resources such as Namespaces, ReplicaSets, Deployments and more.
- XDR Agent: Rules that use XDR Agent Scanner to perform custom compliance checks by executing user-defined Python scripts, offering a tailored approach to compliance validation.
- Rule (Condition): Defines the detection criteria. This is specified as Rego or Python statements that evaluate assets, findings, and their associated attributes to identify security violations based on the selected scanner.
- Severity: The selected value is included in issues that are created as a result of rule violation.
- Compliance Controls: Associates the custom rule with a custom compliance control. If the rule detects the security violation, it will invoke the corresponding compliance control, thereby including the violation in relevant compliance reports.
Cloud Workload Rules page
The Cloud Workload Rules page allows users to manage rules. Users can create, edit, filter, and manage rules.
Note
Keep the following caveats in mind when working with Rules:
- Instance Administrators can view all facets of Rules without restrictions, even when Scope-Based Access Control (SBAC) roles are in effect.
- If you’ve been assigned a custom role with View/Edit permissions limited by SBAC, you may not be able to view specific Rules.
- You can further narrow your search in a Rules table by using SBAC to limit the scope of the findings, issues, and case counts.
The Widget section enables users to get 'at-a-glance' information based on Platform, Rule type, and Scanner type.
The Cloud Workload Rules page displays both the default rules and user-configured rules, with the following fields.
Rules table columns
| Column Name | Description |
| Rule ID | A unique identifier assigned to each rule. |
| Rule Name | The name of the rule, typically defined by the user or system. |
| Description | A brief summary of the rule's purpose and functionality. |
| Policies | Lists the policies in which the rule is included. |
| Controls | Compliance controls associated with the rule for regulatory adherence. |
| Platform | Specifies the platform or environment the rule applies to. For example: Linux, Windows or Kubernetes. |
| Scanner | The tool or method used to evaluate findings, such as Inventory Scanner, Agentless Disk Scan, Host Scanner, Kubernetes Connector or Kubernetes File System Scanner . |
| Severity | Defines the severity of the rule. |
| Data Type | The type of data the rule evaluates. For example: Hosts or Kubernetes Resources |
| Created By | The user who created the rule. |
| Last Modified | The date and time the rule was last updated. |
| Rule Type | Indicates whether the rule is a Built-in or Custom rule. |
| Remediation | Defines the remediation steps to address the detected misconfiguration. |
| Applicable assets | Supported applicable asset types. |
| Available actions | Indicates whether the available action is Prevent and Create an Issue or Create an Issue |
| Standards | Associated compliance standards or controls |
| Open issue | No. of open issue related to this rule. |
Filter page results
You can use Show filter Panel button in the upper-right corner of the Rules page to filter the existing rules based on different filter criteria, as described below:
Table 6. Rule Filter table
| Filter | Allowed Values |
| Rule Name | Rule names and empty values |
| Description | Rule description and empty values |
| Policies | No. of policies |
| Controls | No. of controls |
| Platform | Linux, Windows and Kubernetes |
| Scanner | Agentless Disk Scan, Host Scanner, Kubernetes Connector, Kubernetes File System Scanner and Inventory Scanner |
| Data type | Hosts, Kubernetes Resources |
| Severity | Informational, Low, Medium, High and Critical |
| Created by | System or specific username |
| Last modified | Selected date and time |
| Rule type | Built-in and Custom |
| Remediation | Remediation values |
| Applicable assets | Supported applicable asset types |
| Available actions | Prevent and Create an Issue and Create an Issue |
| Standards | Associated compliance standards or controls |
| Open Issues | No. of open issue |
| Rule ID | Unique Id of a rule |
Change the layout of the rules table
- Navigate to Posture Management > Rules > Cloud Workload.
- In the Cloud Workload Rules page, click the More Options icon (⋮).
- In the Layout tab, do the following:
- To add or remove columns, search for a specific column and:
- Click + to add it to the table.
- Click - to remove it from the table.
- To reorder columns, go to the In View section and click and drag columns up or down.
- To add new columns, go to the Add Columns section and click + to include them in the table.
- To add or remove columns, search for a specific column and:
- The table layout updates automatically based on your selections.
Rule details panel
The rule panel displays the following details related to the selected rule:
- Details of the rule like scanner details, remediation details, and more.
- Compliance Controls for the rule.
This panel enables you to:
- Edit the rule
- Save as new
- Delete the rule
Create a new custom detection rule
Creating Custom Detection Rules give you the flexibility to define and enforce security best practices tailored to your organization's objectives, as well as regulatory requirements not already covered by the compliance standards in our catalog.
Before you begin
Ensure you have a custom compliance control defined to associate the Custom Detection Rule to. For more information, see Use a built-in or custom standard.
How to create a custom detection rule
- Go to Posture Management → Rules & Policies → Rules → Cloud Workload.
- In the Cloud Workload Rules page, click Create Custom Rule.
- Enter the following settings:
- Rule name: A descriptive name for the custom rule.
- Description: An optional field for adding additional details or context about the rule, such as its purpose or intended behavior.
- Select a Scanner to execute the Custom Detection Rule and its associated script. The options are:
- Agentless Disk Scan
- Kubernetes Connector
- XDR Agent
- Configure settings specific to the scanner you select.
Agentless Disk Scan settings
| Field | Description |
|---|---|
| Operating System | The operating system targeted by the rule. The available options are:
|
| Input file(s) path | The full file path for one or more files. For example, /nfs/an/disks/jj/home/dir/file.txt |
| Define the Rule (Rego) | Use Rego to define the custom detection logic. Use the default code in this box as a reference or starting point. Click read here for more information how to use Rego syntax. Code "/var/log/auth.log": { "content": "Failed password for invalid user test from 192.168.1.1 port 22 ssh2\n", "metadata": { "file_type": "file", "gid": 1000, "last_modified": 1737292449, "permissions": 436, "size": 6000, "uid": 1001 },"path": "/var/log/auth.log" } Script package panw.complianceimport rego.v1 match contains {"msg": msg} if { authLogFile = input["/var/log/auth.log" ] contains(authLogFile.content, "Failed password") authLogFile.metadata.permissions == 436 authLogFile.metadata.size > 5000 msg := "Failed login attempts detected in /var/log/auth.log"} Output "match": [ { "msg": "Failed login attempts detected in /var/log/auth.log" }, ] Example 2 Code "/etc/passwd": { "content": "root0:0:root:/root:/bin/bash\nuser1:*:1001:1001:User One:/home/user1:/bin/bash\n", "metadata": { "file_type": "file", "gid": 1001, "last_modified": 1737292449, "permissions": 644, "size": 100, "uid": 1002 },"path": "/etc/passwd" } Script package panw.complianceimport rego.v1 match contains {"msg": msg} if { passwdFile = input["/etc/passwd"] passwdFile.metadata.file_type == "file" passwdFile.metadata.permissions == 644 passwdFile.metadata.size < 200 contains(passwdFile.content, ":*:") msg := "Empty or suspicious password detected in /etc/passwd"} Output "match": [ { "msg": "Empty or suspicious password detected in /etc/passwd" }, ] Example 3 Code "/etc/shadow": { "content": "root:$6$abc123$abc123abc123abc123abc123abc123abc123abc123abc123abc123abc123abc123abc123abc123abc123abc123:17542:0:99999:7:::", "metadata": { "file_type": "file", "gid": 1001, "last_modified": 1737292449, "permissions": 640, "size": 100, "uid": 1002 },"path": "/etc/shadow" } Script package panw.complianceimport rego.v1 match contains {"msg": msg} if { shadowFile = input["/etc/shadow"] shadowFile.metadata.file_type == "file" shadowFile.metadata.permissions != 600 shadowFile.metadata.size > 30 contains(shadowFile.content, "::") msg := "Empty or weak password detected in /etc/shadow"} Output "match": [ { "msg": "Empty or weak password detected in /etc/shadow" }, ] |
Kubernetes Connector Settings
| Field | Description |
| Kubernetes Resources | From the drop down, select one or more from the following:
|
| Define the Rule (Rego) | All custom Rego policies in Cortex must follow this pattern: package panw.compliance import rego.v1 match contains {"msg": msg} if { # Your detection logic here msg := "Description of the finding" } NOTE The custom rule must use the |
XDR Agent Settings
| Field | Description |
|---|---|
| Custom Code Execution | NOTE Enable this setting for the scanner to perform custom compliance checks by executing user-defined Python scripts.
Click Confirm to accept the following terms:
After you confirm accepting the terms, the rest of the XDR Agent settings appear. |
| Operating System | The operating system targeted by the rule. The available options are:
|
| Define the Rule (Python) | Important Use Python to define the custom detection logic. This section supports syntax highlighting and validation (IntelliSense) to help users create accurate and efficient rules. Use the default code in this box as a reference or starting point. The custom Python scripts are intended to be executed exclusively for compliance checks and validations. To ensure the scripts are used properly and no security risks or unintended changes occur, the system implements the following restrictions and safeguards:
|
- For Compliance Violation Severity, define the severity level of the compliance violation to ensure proper categorization and prioritization. Possible values are:
- Critical
- High
- Medium
- Low
- Informational
- For Compliance Controls, assign the rule to one or more existing compliance controls.
NOTE
Only Custom Detection Rules (not built-in rules) can be assigned to custom controls.
a. Click Add.\
b. Select a custom compliance control from the list.\
c. Click Assign.
- For Remediation, you can optionally define the remediation steps to address any detected misconfiguration.
- Click Create.\
\
The new rule appears in the Rules List.\
\
You can now use the rule as a check to either create an issue or monitor adherence to a specific requirement.
Create an issue
Under Posture Management → Policies → Cloud Workload, add the Custom Detection Rule to a Policy. This policy automatically runs the rule and creates an issue if the check fails.
Monitor compliance adherence
Under Posture Management → Compliance → Catalogs → Standards, create a custom standard that includes the custom control associated with the Custom Detection Rule, and then create an assessment profile that runs the custom standard. You can then monitor the compliance results in a report. For more information, see Monitor and track compliance adherence.
Use an existing rule to create a new custom detection rule
- Navigate to Posture Management → Rules & Policies → Rules → Cloud Workload.
- In the Cloud Workload Rules page, click the policy you want to enable or disable.
- In the Details page, click the More Options icon (⋮) and then select Save as new.
- Modify the fields as required.
- Click Create to create the new custom detection rule.
Edit a custom detection rule
- Navigate to Posture Management → Rules & Policies → Rules → Cloud Workload.
- In the Cloud Workload Rules page, click the rule you want to edit.
- In the Details page, click the More Options icon (⋮) and then click Edit.
- Make the necessary changes.
- Click Update to save the changes.
Delete a custom detection rule
- Navigate to Posture Management → Rules & Policies → Rules → Cloud Workload.
- In the Cloud Workload Rules page, click the rule you want to delete.
- In the Details page, click the More Options icon (⋮) and then select Delete.
- In the confirmation message, click Delete.
Base image rules
A Base Images rule defines which registry images your organization considers foundational base images and maps derived images to them. This association provides image lineage visibility, helping you trace vulnerabilities to their source and apply remediation at the base image level.
A Base Images rule associates registry images (for example, ubuntu:22.04) as designated base images. When a rule is applied, it creates a BASE_REFERENCE relation between images, enabling bidirectional tracing so you can:
- Identify the base image for any given image
- View all dependent images derived from a specific base image
By creating Base Images rule, you can:
- Identify approved base images across your organization
- Map Registry and Runtime images to base images for full lineage visibility
- Identify affected base images during vulnerability investigations
- Identify all dependent images impacted by a vulnerable base image
- Use base image associations in policies, queries, and filters
Create a base image rule
Before creating a rule, ensure:
- container registries are onboarded and actively scanned in your environment.
- you have View/Edit permission for Compute Policies or the Instance Administrator role to create or manage a Base Images Rule.
You can create a Base Images rule from either Rules & Policies or a Registry Image Asset Card.
How to create a base images rule from Rules & Policies:
- Navigate to Posture Management → Rules & Policies → Rules → Base Images.
- Select + Create Rule.
- Enter a Name and optional Description for the rule.
- Define the filter conditions, such as:
- Registry URL (for example, https://docker.io)
- Repository name.
-
(Optional) Refine the filter conditions by adding additional conditions, such as:
- Image Name
- Image Tag (for example, latest).
You can use supported operators such as Equals, Not Equals, Contains, Not Contains, starts with, and ends with to specify the conditions.
- Select Run Preview to view matching images.
-
Select Create to add the rule.
The rule is automatically applied to all existing and future images that match the defined criteria. After you create or modify a Base Images rule, it can take up to 6 hours for the system to apply the changes and update the relationships across your assets.
Create a base image rule from a registry image asset card
- Navigate to Inventory → Assets → All Assets → Compute → Container Images.
- Filter Asset Type = Registry Image.
- Select a registry image row to open the details pane
- Select the More options (⋮) menu.
- Choose Add base image rule. The Base Image Rules page opens with conditions pre-populated based on the selected image.
- Modify the conditions if required.
- Select Run Preview to view matching images.
-
Select Create to add the rule.
The rule is automatically applied to all existing and future images that match the defined criteria. After you create or modify a Base Images rule, it can take up to 6 hours for the system to apply the changes and update the relationships across your assets.
Manage a Base Images rule
To manage a Rule, follow these steps:
- Navigate to Inventory → Assets → All Assets → Compute → Container Images.
- Find the Base Images from the list of rules, or use the filter to search.
- Select the rule row to open the details pane
-
Select the More options (⋮) menu.
Actions Instructions Edit Modify the existing Base Images rule. Save as new Create a new rule using the existing Base Images rule as a template. Delete Remove the Base Images rule.
Find the base image for an asset
Container image assets include Base Image details that identify the foundational registry image they are derived from. If an asset is a base image, a Base Image property is displayed in the asset side panel.
When a Base Images Rule is created, a base image tag is assigned to matching container image assets. You can use this tag to create an Asset Group ( Inventory → Assets → Groups) by filtering on the Image Is Base Image. This allows you to group all base images and use the asset group for policies and issue management.
How to find the base image for an asset
- Navigate to Inventory → Assets → All Assets → Compute → Container Images.
- Open a container image asset (Registry Image or Runtime Image).
- In the Overview tab, under the Properties section, locate Base Image details to view the linked foundational registry image.
- View the Relationships section to explore upstream and downstream image lineage.
Web and API Security (WAAS)
Notice
Requires the Cloud Runtime Security or Cortex XSIAM Premium license.
Cortex Web and API Security (WAAS) capabilities offer comprehensive protection of APIs across integrated API gateways and web-based applications and APIs running on Linux-based workloads.
Use cases
- API Visibility: APIs are discovered through traffic mirroring and API Gateway logs. Cortex scans and collects metadata including domains, paths, HTTP methods, authentication types, protocol schemas (HTTP/HTTPS), and request/response content types. The source of discovery comes from analyzing these key elements.
- Posture Management and Risk Insights: WAAS assesses discovered APIs for internet exposure, sensitive data transmissions, weak authentication, lack of encryption, and specification drift. This evaluation provides critical posture management and risk insights to ensure the security of the APIs.
- Threat Detection: WAAS identifies API-specific threats, including SQL injection (SQLi), Cross-site scripting (XSS), CVE exploit attempts, authentication bypass, sensitive data leakage, bot and scanner activity, and traffic anomalies. This detection capability enhances threat identification and response measures for safeguarding APIs. Refer to Monitor and investigate API threats for more information on the threats.
Deployment options
WAAS is available through the following deployment options:
-
Agentless integration through API gateways (AWS API Gateway, Azure APIM, GCP Apigee, Kong):
Cortex Cloud offers agentless in-depth scans, thorough analysis, and timely alerts to detect and mitigate security risks and potential vulnerabilities effectively. It enhances the security of your APIs in Apigee, Azure, and AWS by integrating with Cortex API Security for complete protection against threats.
Refer to Secure your API landscape for more information about scanning your API sources of data and addressing issues, cases, and findings.
-
Agent-based protection (Beta), through lightweight agents on workloads:
Web and API Security profiles provide comprehensive real-time detection and protection for web-based applications and APIs running on Linux-based workloads. These profiles can be applied to policies for such workloads. These agent-based capabilities are offered as a Beta feature.
Refer to Agent-based protection for more information about setting up profiles and policies.
User roles and permissions
Cortex API security includes three main roles that are responsible for ensuring the security of the API landscape in the organization.
To grant access and configuration permissions for API security capabilities in the Cortex tenant, you must verify that the user has the correct settings in the linked role.
- SOC analyst: The Security Operations Center (SOC) team is responsible for live threat detection, investigation, and response. They continuously monitor, prioritize, and analyze security incidents, investigating the scope and context of attacks to determine if they are legitimate threats and deciding on appropriate actions such as prevention, remediation, or classifying them as normal activity.
- Security practitioner: A security team's role involves understanding the environment, its assets, and its security posture to assess and monitor risks. They define and enforce security policies, collect items requiring fixes, and collaborate with development and operations teams to remediate vulnerabilities and track outstanding risks, ensuring timely resolution.
- Workload owner: Application owners are responsible for building and modifying their applications, and they need to understand what is required to align their assets and API endpoints with established security standards. Their goal is to apply necessary fixes to achieve a consistent and secure posture.
Personas workflow
The workflow outlines the responsibilities of each persona to detect, assess, protect, and secure the API assets across the organization, focusing on the main API security elements:
- Visibility
- Posture Management & Risk Profiling
- Threat Detection & Response
SOC analyst
Responsibility: Real-time threat detection & response
The SOC analyst is the key to identifying and investigating API vulnerabilities and attacks within an organization.
Steps:
- Visibility: Reviews the Cases & Issues module for new attacks.
-
Investigate: Select a case or an issue, analyze involved APIs and their context, analyze request/response details, and distinguish normal from malicious activity.
To conduct a deeper investigation to eliminate or contain the threat, investigate the security issue
- Decide and Act: Determine if it's a true attack. If so, initiate an immediate response (often outside the UI) and flag for fixes. Close the case in the UI.
Security practitioner
Responsibility: Proactive posture management & risk reduction
The security practitioner uses the UI for continuous risk assessment and orchestration of remediation.
Steps:
- Overview of API landscape: In the API Security Management dashboard, review emerging threats and understand the overall security of the API landscape.
- Analyze APIs and Risks: Navigate to API endpoints to view all APIs, their risk factors (e.g., internet exposure, sensitive data, authentication/encryption status), and posture issues. Drill down for details.
- Manage OpenAPI Specifications: Access the OpenAPI specification files. Review findings on the specification file itself (misconfigurations) and verify API traffic conformance to its specification.
- Assign Remediation: Consolidate all findings, group them by application owner, and distribute tasks (via email/tickets with timelines) for fixes (code, gateway, specification updates).
Workload owner
Responsibility: Application security accountability
The workload owner acts on security tasks, primarily outside the UI.
Steps:
- Receive Tasks: Get detailed security tasks and timelines from the security practitioner.
- Implement Fixes: Apply necessary fixes to application code, API configurations, or OpenAPI specifications.
- Ensure Compliance: Bring their APIs and assets into alignment with security standards.
Secure your API landscape
Integrate Cortex Cloud with your API Gateway (AWS, Azure, GCP, Kong or F5 BIG-IP LTM) to scan traffic and analyze logs. With Cortex Cloud, use the API security features to monitor, manage, and enforce security policies across the integrated API gateways. In addition, the API specification can validate live traffic against specifications and alert on surface deviations, undocumented endpoints, or security gaps.
Refer to the relevant section for more information:
Gain visibility and assess risk of API endpoints
Cortex XSIAM API endpoints provide an overview of API assets across cloud providers and data sources (for example, API Gateway and API specifications), enabling you to analyze, assess, and implement security measures to safeguard against security risks and potential vulnerabilities.
In addition to observing API traffic, Cortex XSIAM scans AWS and Azure API gateways and extracts the API specification files. Once the specification files are in the inventory, Cortex Cloud scans them for misconfigurations and vulnerabilities, providing insights into your API landscape.
At a glance, we see a graphical representation of the APIs per cloud provider, including On-prem, and APIs per discovery source, including the XDR agent.

You can filter by provider or by discovery source.
The following table lists the fields that are available for each API endpoint.
| Field | Description |
|---|---|
| Server | Hosting server of the API. |
| Path | API endpoint path is used by applications to communicate with the server, enabling you to access data and execute actions. |
| API Category | Associated category of the API. For example, the API could be associated with Payment. |
| HTTP method | <p>The HTTP methods supported include:</p><ul><li>Get</li><li>Post</li><li>Put</li><li>Patch</li><li>Delete</li><li>Head</li><li>Options</li><li>Trace</li><li>Connect</li></ul> |
| Risk factors | <p>Indication of the risk type associated with the API:</p><ul><li>Internet Exposure ( )</li><li>Sensitive Data ( )</li><li>Sensitive Data ( )</li><li>No Authentication ( )</li><li>No Authentication ( )</li><li>No Encryption ( )</li><li>No Encryption ( )</li><li>Insecure Encryption</li><li>Unknown Encryption</li></ul> )</li><li>Insecure Encryption</li><li>Unknown Encryption</li></ul> |
| API spec name | API specification name is obtained from the title field of the specification imported to Cortex Cloud. |
| API spec conformance | <p>Indicates if the endpoint was found/not found in the specification.</p><ul><li>Undefined: Indicates that the endpoint from the gateway is not found in any known specification document.</li><li>Match: Indicates there's a match between the API path of the endpoint and a specification.</li><li>Mismatch: Indicates that the API path is the same in the endpoint and specification, but there is a missing query parameter in the specification.</li><li>Conflict: Indicates when the API endpoint matches more than one API specification file.</li></ul> |
| Provider | <p>Gateway provider:</p><ul><li>GCP</li><li>AWS</li><li>Azure</li><li>On-Prem</li></ul> |
| Source | <p>Indicates the service from which the data was obtained:</p><ul><li>Kong</li><li>Configuration  : Indicates that the source is from the API specification.</li><li>Azure API Management</li><li>Apigee</li><li>Amazon API Gateway</li><li>XDR Agent</li><li>F5 BIG-IP LTM</li></ul> : Indicates that the source is from the API specification.</li><li>Azure API Management</li><li>Apigee</li><li>Amazon API Gateway</li><li>XDR Agent</li><li>F5 BIG-IP LTM</li></ul> |
| Inspected | Number of requests or connections that have been analyzed and verified by Cortex Cloud. |
| Request/Response Sensitive Data | <p>Shows the sensitive data type in the request/response, such as passwords, credit card numbers, SSNs, or bank account numbers. Refer to What is Cortex Cloud Data Classification? for more information.</p><div data-gb-custom-block data-tag="hint" data-style="info" class="hint hint-info"><p>Note</p><p>Data classification findings are only available for enabled profiles.</p></div> |
| Request/Response Content Types | <p>Data format sent/received in the request/response of the API calls.</p><ul><li>application/json</li><li>application/xml</li><li>application/x-www-form-urlencoded</li><li>multipart/form-data</li></ul> |
| Request/Response Data Patterns | Data pattern types such as Credit Card Numbers, SSN, Email Addresses, API Keys. |
| Request/Response Data Profiles | Data profile types such as PCI, GDPR, PII, HIPAA. |
| Schema | <p>Protocol used to access the API resource:</p><ul><li>HTTP</li><li>HTTPS</li></ul> |
| Authentication Types | <p>Authentication methods include the following options:</p><ul><li>API key</li><li>Basic</li><li>OAuth</li><li>OIDC</li><li><p>Learning</p><div data-gb-custom-block data-tag="hint" data-style="info" class="hint hint-info"><p>Note</p><p>Indicates that a JSON Web Token was identified, but it is unknown how to determine its type from the given string. It could be a non-standard JSON Web Token creation algorithm.</p></div></li><li>Unknown: Indicates that the authentication method couldn't be identified.</li><li>Authentication not detected: Indicates that the API does not require authentication.</li></ul> |
| Discovery Method | <p>Based on asset discovery:</p><ul><li>HTTP</li><li>Logs</li><li>Traffic mirroring</li><li>Configuration</li><li>Unknown</li></ul> |
| Asset Status | The API's status is Active only when both an API gateway and an API specification are present; otherwise, it's deleted. An Inactive status means the endpoint is defined in the specification but isn't receiving traffic via the gateway. |
| Cloud | Cloud provider where the agent is running. In case of on-prem, this field shows On-prem. |
| Provider Type | <p>Indicates the cloud service provider:</p><ul><li>CSP</li><li>On Prem</li></ul> |
| Region | Region of the hosting server. |
When clicking on a specific API endpoint, a side card opens. Each tab includes detailed information as described.
Overview
Shows the highlights and properties of the API endpoint.
| Field | Description |
|---|---|
| Highlights | Provides an overview of the status of the asset, such as severity type, internet exposure status, and if it includes sensitive data. |
| Asset ID | UAI (Unified Asset Inventory) ID |
| Provider | <p>API Gateway:</p><ul><li>AWS</li><li>GCP</li><li>Azure</li><li>Kong</li><li>F5 BIG-IP LTM</li></ul> |
| Asset Category | Either API Endpoint or API Specification. |
| Cloud Region | Region of the cloud provider. |
| Asset Groups | Assigned asset groups to the API endpoint. |
| Applications | <p>Shows the business applications related to the API endpoint. Clicking the application opens the business application page.</p><div data-gb-custom-block data-tag="hint" data-style="info" class="hint hint-info"><p>Note</p><p>To link APIs to business applications, the two prerequisites must be met:</p><ul><li>The VM must have XDR agent with WAAS enabled.</li><li>Applications must be defined in Cloud Application Security.</li></ul></div> |
| Relations | <p>The Relations graph shows the connections between the API endpoint, API gateway, and VMs. This mirrors what's shown in Graph Search.</p><p>Click the API Gateway or API Endpoint to view more details about the asset.</p><p> </p> </p> |
| Account ID | Cloud account ID. |
| Cases/Issues/Findings | <p>The link from the number opens the page where you can review the details. Refer to Issues, findings, and events for detailed information.</p><p>You can view all API security issues and cases detected by Cortex Cloud.</p> |
| <p>Related Assets</p><p>Shows the data from the source of the traffic.</p><ul><li>If the source of the traffic is from the gateway, the related asset data shows AWS API Gateway or Azure Gateway, the name of the gateway, and the stage.</li><li>If the source of the traffic is from a specification from the gateway, the related asset data shows the API specification, the name of the specification, and the gateway provider.</li><li>If the source of the traffic is from the XDR agent, the related asset data shows the agent ID.</li></ul> | |
| Type | API specification |
| Name | Name of the API specification. |
| Provider | Cloud provider of the API specification. |
An issue is generated when the following Detection Method is triggered:
| Deployment option | Detection Method and Type | Description |
|---|---|---|
| Agentless for Posture | Detection Method: API Posture Scanner | If Cortex Cloud detects security vulnerabilities or compliance issues in the posture of an API during scanning, an issue is generated. |
| Agentless | Detection Method: API Traffic Scanner | If Cortex Cloud detects anomalies, suspicious activities, or potential security threats in the network traffic of the APIs, an issue is generated. |
| Agent-based | <p>Type: Security</p><p>Detection Method: XDR Agent</p> | If Cortex Cloud detects threats from cloud workloads, an issue is generated. |
Endpoint Data
Shows the details of the API endpoint and the components associated with authentication, such as token types, request/response body schemas, and usage statistics.
| Field | Description |
|---|---|
| API Endpoint | API endpoint path used by applications to communicate with the server, enabling you to access data and execute actions. |
| Method | HTTP Method. |
| Server | Hosting server of the API. |
| Query Parameters | Parameters included in the API endpoint URL. Only the keys are stored to avoid saving personal identifiable information (PII)? For example, ID. |
| Response Content Type | Specifies the response type format transmitted from the server to the client, such as JSON or XML. |
| Inspected Transactions | Number of requests scanned by Cortex Cloud. |
| First Observed/Last Observed | Timestamp of the first and last time the API was accessed. |
| Last Changed | Timestamp of when the API was updated. |
| Sensitive Data Pattern | Identifies sensitive data exposure risks. |
| Authentication | Specified the authentication of the API endpoint. Refer to Authentication Types. |
| Request/Response Body Schema | <p>Shows the structure and format of the data that's included in the request. It shows expected data types, format, and organization of the response payload, such as the fields, attributes, and valid values.</p><p>The schema is created based on the request/response.</p><p>Cortex utilizes the Cortex Data Security engine to analyze API traffic and classify sensitive data into two categories: Data Profiles and Data Patterns.</p><ul><li><p>Data Profiles: Represent the regulatory standards and compliance mandates that the API data is subject to.</p><p>Example: PCI, GDPR, PII, HIPAA</p></li><li><p>Data Patterns: specific data types and formats found within the API requests and responses.</p><p>Example: Credit Card Numbers, SSN, Email Addresses, API Keys</p></li></ul> |
| Usage Statistics | <p>Shows the metrics for Requests size distribution, Response size distribution, and Status code distribution. Using these statistics can help assess usage patterns, identify performance issues, and help optimize the API to enhance its security posture.</p><p>You can hover over the metric bar to view details.</p> |
Monitor and investigate API threats
Cortex XSIAM provides a comprehensive solution to counter API threats and attacks. It doesn't just address vulnerabilities, but actively protects against the misuse of legitimate API functions, mitigates risks from misconfigurations, and secures often-forgotten "shadow" or "zombie" APIs. By offering continuous visibility and monitoring, Cortex XSIAM ensures robust, proactive protection for all your APIs, safeguarding your organization against evolving and sophisticated threats.
Cortex XSIAM protects from the following threats:
| Module | Threat description |
|---|---|
| Advanced Threat Protection | Advanced Threat Protection (ATP) is a comprehensive security feature designed to detect, prevent, and respond to sophisticated Web and API threats, ensuring robust protection for workloads against evolving risks. |
| Authentication bypass | The Cortex XSIAM authentication bypass module protects against attacks that attempt to circumvent authentication controls through session manipulation, token exploitation, or credential abuse. |
| Automation tools | Cortex XSIAM detects and protects against automated tools or services that scrape website contents such as Scriptable headless web browsers, command line tools, or HTTP libraries. |
| Cross-Site Scripting (XSS) injection | Cortex XSIAM protects against XSS attacks, in which malicious JavaScript snippets are injected into otherwise benign and trusted websites. In such attacks, attackers try to trick the browser into switching to a JavaScript context and executing arbitrary code. |
| CVE exploits | Cortex XSIAM protects against exploitation attempts of known vulnerabilities (Common Vulnerabilities and Exposures (CVEs)). |
| Malformed Traffic | Cortex XSIAM identifies and protects against HTTP requests with anomalies that are not expected from common web browsers. |
| Injection attacks | Injection attacks are a form of attacks in which attackers attempt to insert malicious input into an application to manipulate its execution. For example, a code injection attack injects code which is interpreted by the application or other runtimes. Command and code payloads can either be injected as part of HTTP requests, or are included from local or remote files (also known as File Inclusion attacks). |
| Known bots | Cortex XSIAM can identify legitimate bots that properly declare their identity and purpose, such as search engine crawlers and authorized web indexers. These bots follow standard protocols and provide verifiable operator information, however some of them might cause undesirable behaviors, such as spam, and you might prefer to block such bots. |
| Offensive tools | Cortex XSIAM identifies offensive tools that scan web applications for known security vulnerabilities and misconfiguration, and exploit them. |
| Sensitive data exposure | <p>Cortex XSIAM protects workloads from providing responses that could expose sensitive data found in critical system files, including password hashes (/etc/shadow), user account information (/etc/password), and private encryption keys.</p><p>Such examples would be compromised accounts, credential stuffing, and ATO attacks.</p> |
| SQL injection (SQLi) | Cortex XSIAM protects against SQLi attacks, which can occur when an attacker successfully inserts a malicious SQL query into the input fields of a web application. A successful attack can read sensitive data from the database, modify data in the database, or run arbitrary commands. |
| Identity-based attacks | <p>Cortex XSIAM identifies and protects from compromised accounts, credential stuffing, and ATO attacks. These types of attacks involve exploiting stolen or weak login credentials to impersonate legitimate users and gain unauthorized access to accounts and systems.</p><p>The API inventory's category by type (e.g., login, sign-in, sign-up, register, create account, reset password) and sub-type (e.g., add to cart, show cart, general checkout page, add billing address, add credit card, gift card) is crucial. This enables a deeper investigation into potential discrepancies related to identity-based attacks.</p> |
SOC analyst workflow
The following workflow outlines a step-by-step action plan as a SOC analyst to monitor, investigate, and respond to API threats.
SOC analyst role overview
SOC analysts continuously monitor and analyze security incidents related to APIs. Their goal is to identify, investigate, and mitigate API endpoint attacks, ensuring API integrity, confidentiality, and availability. They prioritize issues based on severity and specific indicators.
- ISSUE DOMAIN: Security
- DETECTION METHOD: API Traffic Monitor
- SEVERITY: High or Critical
SOC analyst action plan
The following outlines the streamlined actions a SOC analyst takes when detecting an API threat:
Step 1: Initial examination (Cases & Issues):
- Objective: Quickly assess the type and severity of the API attack.
- Actions: Navigate to Issues, filter by key indicators, and review the high-level alert summary (timestamp, affected service, initial notes).
Step 2: In-depth analysis (Issue page - Overview tab):
-
Objective: Gather detailed attack context, identify affected assets, and collect evidence.
The API security issues page provides a single window into every API security threat. You get full investigation capabilities that let you immediately drill down to understand the true impact of the attack. An important insight into the issue, you can see the specific details of the attacker and the credentials that were used. All the details included give you a deep understanding of the complete attack narrative.
-
Actions:
- Affected Assets: Identify targeted API endpoints; click to navigate to their detailed pages for granular review.
- Evidence: Examine findings (request/response logs, payload, timestamps, source IP, user agent) to understand the attack vector.
-
Advance your investigation: The issue page also provides you with advanced investigation options to further analyze the attack narrative.
Select one of the options:
-
Trace the Actor: Gain full visibility into the actor's complete interaction sequence by viewing all raw API traffic. This allows you to understand every step they took, ensuring nothing is missed in your analysis.
Click Run to run a preconfigured XQL query.
-
Hunt for the Payload: Search is extended to include encoded and modified variations of the attack payload across all API traffic. This comprehensive detection capability ensures you find every single instance of the attack attempt, regardless of how the payload was obscured or altered.
Click Run to run a preconfigured XQL query.
-
Scope the Threat: Access a chronological record of all historical security issues tied to this specific API endpoint. Analyzing this data allows you to quickly identify attack patterns and pinpoint inherent vulnerabilities in the endpoint, enabling targeted hardening and risk reduction.
Click Go, which takes you directly to the Issues table to see all historic issues related to the attacked API endpoint.
-
Build the Attack Chain: Instantly display all historical security issues previously triggered by this actor. This automatically generates a clear, chronological timeline of their malicious activities, enabling you to understand their patterns, escalation, and overall risk profile.
Click Run to run a preconfigured XQL query.
-
Step 3: Refer to Gain visibility and assess risk of API endpoints for drilled-down details of the API data.
Step 4: Post-investigation actions & reporting:
- Objective: Mitigate the threat, prevent recurrence, and document findings.
- Actions:
- Reporting: Create a detailed incident report (detection, attack type, assets, evidence, vulnerabilities, actions, lessons learned). Communicate findings to stakeholders.
- Improvement: Conduct post-incident review, update policies/playbooks, and recommend security enhancements.
Configure API security from end to end
Implementing end-to-end API security means establishing comprehensive protection across the entire API lifecycle. This process begins by integrating with third-party cloud providers to enable thorough scanning of your APIs for threats and vulnerabilities. Following this, you'll configure profiles for agent-based protection, which actively safeguards your APIs in real-time. This ensures that every potential vulnerability, from authentication and authorization issues to data encryption and threat monitoring, is addressed across your entire API ecosystem.
For more information on how to configure, refer to:
Third-party integrations
Easily configure the settings in both Cortex XSIAM and your cloud service to retrieve and collect API data for further analysis by Cortex's comprehensive API security capabilities, which provide a transparent view of API traffic, helping to identify potential security threats.
Ingest AWS API Gateway
Integrate AWS API Gateway with Cortex XSIAM to begin scanning the APIs for potential threats and vulnerabilities.
Settings in Cortex XSIAM
In Cortex XSIAM, set up the AWS API Gateway data source to integrate with the AWS API Gateway.
- From Settings → Data Sources , click
 and search for AWS API Gateway and then click Connect or Connect Another Instance.
 - In the AWS API Collector wizard, enter a relevant name and click Create and Proceed.
-
Copy the key and save it for later.
Note
You must generate a new key if you did not save.
- Click Close.
Settings in AWS Management Console
Configure the settings in the AWS Management Console to integrate with Cortex XSIAM:
- Log in to the AWS Management Console.
- In AWS Management Console, navigate to API Gateway.
- Expand the left-hand menu of the API project.
- Go to Settings → Logging and click Edit. Verify that the CloudWatch log role ARN is filled.
- Click Stages and from Stages, select the relevant stage.
- From Logs and Tracing, click Edit and configure the following:
- CloudWatch Logs: Select Errors and info logs
- Select Data tracing
- Select Detailed metrics
-
Click Save.
This creates a unique log group inside CloudWatch.
- Open CloudWatch in another window by typing CloudWatch in the search bar.
-
Go to Logs → Log groups and search for the log group just created.
The group name follows the following format:
“API-Gateway-Execution-Logs_<gw ID>/<stage name>” -
Click the log group, and from the Log group details, copy the ARN.
-
-
Return to Edit logs and tracing, go to enable the custom access logging , and paste the ARN without the * in the Access log destination ARN field.
Example 45.
ARN:
arn:aws:logs:us-east-1:123456789012:log-group:API-Gateway-Execution-Logs_153tp249k2/Prod:*Paste in Access log destination ARN:
arn:aws:logs:us-east-1:123456789012:log-group:API-Gateway-Execution-Logs_153tp249k2/Prod -
In Log format, type the following and click Save:
($context.requestId) accountID: $context.accountId; requestTimeMs: $context.requestTimeEpoch; path: $context.path; region: us-east-1; apiID: $context.apiId; stage: $context.stage; extensionVersion: 1.0
- Click Create Firehose stream.
- Configure the following:
- Source: Direct PUT
- Destination: HTTP Endpoint
- Firehose stream name: Add a relevant name.
- In Destination settings, configure the following:
- HTTP endpoint URL : Add the API URL from Cortex XSIAM.
- Authentication: Select Use access key.
- Access key: Paste the generated token from AWS API Gateway.
- Content encoding: Select GZIP.
- In Backup settings, configure the following:
- Source record backup in Amazon S3: select Failed date only.
- S3 backup bucket: select a bucket or enter a bucket URI.
-
Click Create.
It takes up to 5 minutes for the stream to be activated.
- Configure the following:
-
Refer to Subscription filters with Amazon Data Firehose. To create an IAM Role and provide CloudWatch with the appropriate permissions for the streaming, refer to steps 8-11.
After the Data Firehose delivery stream is active and you have created the IAM role, you can create the CloudWatch Logs subscription filter. The subscription filter immediately starts the flow of real-time log data from the chosen log group to your Amazon Data Firehose delivery stream:
aws logs put-subscription-filter \ --log-group-name "<YOUR_LOG_GROUP_NAME>" \ --filter-name "<any_filter_name>" \ --filter-pattern "" \ --destination-arn "arn:aws:firehose:region:123456789012:deliverystream/<YOUR_DELIVERY_STREAM>" \ --role-arn "arn:aws:iam::<ACCOUNT_ID>:role/<YOUR_IAM_ROLE>"Important
Leave
–filter-patternempty as displayed above.After you create the filter, go back to Data Sources → AWS API Gateway to see the logs starting to come in.
Note
If no logs are showing, send some API requests on Postman or CURL.
Ingest Azure APIM
Integrate Azure APIM with Cortex XSIAM to start scanning its APIs for potential threats and vulnerabilities.
You need to set up a policy that enables you to customize the behavior of managed APIs. You can configure the sending of HTTP request/response data to Cortex XSIAM. The data is saved and analyzed by API security modules, which provide information on the security risks associated with the APIs.
Microsoft Azure APIM service must be running before starting to configure the integration.
Settings in Cortex XSIAM
In Cortex XSIAM, set up the Azure API Management data source to integrate with the Azure API Gateway.
- From Settings → Data Sources & Integrations , click + Add New, search for Azure API Management, then hover over it and click Add or Add Instance.
- In the APIM Collector wizard, enter a relevant name and then click Create and Proceed.
-
Copy the key and paste it somewhere so that you can access it for later.
If you forget to record the key and close the window, you must generate a new key and repeat this process.
- Click Close.
Settings in Azure APIM policy
Configure an inbound and outbound policy to send HTTP traffic data of the APIs to Cortex XSIAM. You can configure a policy for individual operations (endpoints) or all operations of a single API.
Follow the steps to configure the policy.
- Log in to Microsoft Azure.
- Go to API Management services and select the relevant service.
-
From the left-hand menu, select APIs → Named values.
Note
From the URL, save the UUID and the resource group -
/resource/subscriptions/<UUID>/resourceGroups/<ResourceGroup>.The UUID is the Azure account/subscription ID and the resource group, which is the group where the APIM Service is defined.
-
Configure the settings in each of the sections. Follow the steps in the order they are listed.
Note
Use the search to navigate to the specific section.
Named values: Add the values:
- cloud-account-id
- Type: Plain
- Value: The UUID you saved from the previous step.
- cloud-resource-group
- Type: Plain
- Value: The resource group you saved from the previous step.
- cortex-api-key
- Type: Secret
- Value: The token that you saved from data sources in Cortex.
- cortex-api-url
- Type: Plain
- Value: The API URL from data sources in Cortex.
- cortex-http-body-size-limit-bytes
- Type: Plain
-
Value: 131072
Note
131072 bytes = 128 KB. This value determines the size (in bytes) of request and response bodies to send to Cortex. Any bytes beyond this limit are truncated.
APIs: From the left-hand menu, go to APIs → APIs.
- You can create a policy on a specific API or choose to create a policy on all APIs.
-
From Inbound Processing, click
 .
.The Policies screen opens. There are three sections:
<inbound><backend><outbound>
The
<inbound>includes the request before it's sent to the<outbound>. The parameters are saved before they're sent.Add the following inside the
<inbound>:<!-- Save the request body and headers to be sent to Cortex. This should always be placed at the very beginning of the inbound element. --> <set-variable name="requestBody" value="@((context.Request?.Body?.As<string>(preserveContent: true)) ?? string.Empty)" /> <set-variable name="requestHeaders" value="@(JsonConvert.SerializeObject(context.Request.Headers))" /> <!-- End of setting variables for sending to Cortex -->Note
If any other inbound policies should be added, they must be added after these elements.
The
<outbound>includes the request before it returns a response.Add the following inside the <outbound> element, at the end, after the other child elements:
<!-- Send data to Cortex. This should always be placed at the very end of the outbound element. --> <send-request mode="new" response-variable-name="mirrorMessage"> <set-url>{{cortex-api-url}}</set-url> <set-method>POST</set-method> <set-header name="Content-Type" exists-action="override"> <value>application/json</value> </set-header> <set-header name="Authorization" exists-action="override"> <value>{{cortex-api-key}}</value> </set-header> <set-body>@{ string requestBody = context.Variables.GetValueOrDefault<string>("requestBody"); string responseBody = context.Response.Body.As<string>(preserveContent: true); int bodySizeLimit = {{cortex-http-body-size-limit-bytes}}; bool requestBodySizeExceedsLimit = requestBody.Length > bodySizeLimit; bool responseBodySizeExceedsLimit = responseBody.Length > bodySizeLimit; return JsonConvert.SerializeObject(new { accountId = "{{cloud-account-id}}", serviceId = context.Deployment.ServiceId, requestId = context.RequestId, url = context.Request.OriginalUrl, httpMethod = context.Request.Method, requestBody = requestBodySizeExceedsLimit ? requestBody.Substring(0, bodySizeLimit) : requestBody, requestBodyTruncated = requestBodySizeExceedsLimit, requestHeaders = JsonConvert.DeserializeObject(context.Variables.GetValueOrDefault<string>("requestHeaders")), timestamp = new DateTimeOffset(context.Timestamp).ToUnixTimeMilliseconds(), requestIpAddress = context.Request.IpAddress, statusCode = context.Response.StatusCode, responseBody = responseBodySizeExceedsLimit ? responseBody.Substring(0, bodySizeLimit) : responseBody, responseBodyTruncated = responseBodySizeExceedsLimit, responseHeaders = context.Response.Headers, region = context.Deployment.Region, subscription = context.Subscription, }); } </set-body> </send-request> <!-- End of sending data to Cortex -->Important
If you want to add additional data to the <outbound>, add it at the start of the <outbound> code.
-
Click Save. Your APIM traffic collection is now configured.
Request and response data for the configured endpoints are sent to Cortex XSIAM for inspection by API security modules.
- cloud-account-id
- Go to Azure API Management data source to validate that data is ingested from Azure APIM.
- Do the following to remove the integration of Azure APIM with Cortex XSIAM:
- Remove the snippets you added to the policies.
- Remove the named values from the API service.
- Delete the HTTP log collector from Data Sources & Integrations in Cortex.
Ingest Apigee Proxy
Integrate Apigee Proxy with Cortex Cloud to begin scanning the APIs for potential threats and vulnerabilities.
The integration uses Apigee’s JavaScript (JS) policy, implemented within a shared flow and deployed as a pre-proxy and post-proxy flow-hook in selected environments. The JS policy is designed to capture both request and response data from all traffic entering and exiting the proxy.
Settings in Cortex XSIAM
In Cortex XSIAM, set up the Apigee data source to integrate with the Apigee Gateway.
- From Settings → Data Sources & Integrations , click +Add New, search for Apigee, then hover over it and click Add or Add Instance.
- In the Apigee Collector wizard, enter a relevant name and then click Create and Proceed.
-
Copy the key and paste it somewhere so that you can access it for later.
If you forget to record the key and close the window, you must generate a new key and repeat this process.
- Click the Download Configuration Script link to download the plugin, which you can then upload from the Apigee Gateway.
- Click Close.
First, download the resource file and then select the method to set up the integration with Apigee.
Run an automated script to deploy configurations to Apigee
Use the script for full deployment (with or without connecting a flow hook).
Note
The steps include the prerequisites that run the automated script that deploys files and configurations to Apigee. For manual configuration, refer to the section Manual deployment.
-
Edit
deploy.shand add values for the following:Variable Description PROJECT_ID Google project ID where Apigee is provisioned. ORG Apigee organization. By default, this is the same as PROJECT_ID. ENV In Apigee, from the left-side menu, click Environments and copy the name of the environment you want to use. TARGET_URL Copy the URL for your Apigee Collector from the Custom Collectors page. For example, https://api-{tenant external URL}/logs/v1/event.APIsec_API_KEY Token generated from Cortex Cloud. -
Check that the GCP user running the script has
IAMpermissions.apigee.resourcefiles.list apigee.resourcefiles.create apigee.resourcefiles.update apigee.sharedflows.get apigee.sharedflows.create apigee.deployments.create apigee.sharedflowrevisions.deploy apigee.flowhooks.attachSharedFlow apigee.keyvaluemaps.create apigee.keyvaluemaps.delete apigee.keyvaluemapentries.create
-
Run the
deploy.shscript:chmod +x ./deploy.sh
-
Verify that the JavaScript policies have been added to the shared flows:
Go to Apigee → Proxy development → Shared Flows and check that the following policies have been added.
sf-api-sec-extension-postflowsf-api-sec-extension-preflow
-
Validate data ingestion:
Send a request to the gateway and go to Apigee data source to validate that the data has been received from Apigee.
- (Optional) Exclude unwanted domains from being tracked by APIsec:
- Uncomment: DOMAIN_EXCLUSION_LIST.
- Add the domains to exclude.
-
Edit
deploy.shand set the following variables:export DOMAIN_EXCLUSION_LIST="domain1,domain2"
- Discontinue the integration:
-
Edit
undeploy.sh:export PROJECT_ID=example-project-id export ORG=$PROJECT_ID export ENVIRONMENT=example-env
-
Run the undeploy.sh script:
chmod +x ./undeploy.sh
Go to Apigee → Proxy development → Shared Flows and check that the following policies have been removed.
sf-api-sec-extension-postflowsf-api-sec-extension-preflow
-
Configure Apigee's JavaScript for manual deployment
You can customize the shared flow and apply it to an existing flow hook (pre-proxy, post-proxy).
Set up Apigee's JavaScript policy to send Apigee Collector's API data to Cortex XSIAM.
Note
If you have an existing hook and would like to integrate with the shared flow, run the deploy.sh script, and select n' and exit at the prompt to create a new hook. Refer to the section Connect to existing hook.
- Edit
panw-api-sec-extension-configuration.propertiesfile:- Enter the
targetUrlandprojectID. - You can update 127KB of
maxBodyInspectionSizeKB. -
For domain exclusion, uncomment the line and add the URL to exclude.
targetUrl=<Cortex collector url> projectID=<GCP project id of apigee> maxBodyInspectionSizeKB=127 // This is default and can be modified if needed. commonBinaryContentType=audio/,video/,image/, application/octet-stream,application/ogg,application/ pdf,application/zip,application/gzip,application/ vnd.rar,application/x-7z-compressed #domainExclusionList=example.com,example2.com/shopping
- Enter the
- Upload the edited
property set:-
Get a token to upload updates via an API request. For more information, refer to property sets.
Input:
gcloud config config-helper --force-auth-refresh --format
Output:
configuration: active_configuration: properties: compute: region: zone: core: account: disable_usage_reporting: project: credential: access_token: <Copy this value> id_token: token_expiry: sentinels: config_sentinel: -
Copy the
<access_token>value from the output.
-
-
Upload the
property setto Apigee:curl --silent -X GET "https://apigee.googleapis.com/v1/organizations/ <ORG>/environments/<ENVIRONMENT>/resourcefiles/ properties" -H "Authorization: Bearer <access_token from above>"
-
Generate Key Value Map (KVM), which stores the Cortex API key that's encrypted
curl --silent -X POST "https://apigee.googleapis.com/v1/organizations/ <ORG>/environments/<ENVIRONMENT>/keyvaluemaps" -H "Authorization: Bearer <access_token from above>" -H "Content-Type: application/json" --data-raw '{"name": "'"APISec-KVM"'", "encrypted": true}'
If there's an error when creating the KVM because of an existing name, delete the KVM and recreate.
curl --silent -X DELETE "https://apigee.googleapis.com/v1/organizations/ <ORG>/environments/<ENVIRONMENT>/keyvaluemaps/ $APISEC_KVM_NAME" -H "Authorization: Bearer <access_token from above>"
Add the Cortex API key entry to the created KVM.
curl --silent -X POST "https://apigee.googleapis.com/ v1/organizations/<ORG>/environments/<ENVIRONMENT>/ keyvaluemaps/$APISEC_KVM_NAME/entries" -H "Authorization: Bearer <access_token from above>" -H "Content-Type: application/json" --data-raw '{"name": "api-key","value": "'"<Generated key from cortex env>"'"}'
-
Upload the shared flows:
Shared flows:
sf-api-sec-extension-postflowsf-api-sec-extension-preflow
Upload
Replace the
<sf>with the shared flows:curl --silent -X POST --data-binary "<sf>.zip" -H "Content-Type: application/octet-stream" -H "Authorization: Bearer <access_token from above>" "https://apigee.googleapis.com/v1/organizations/$ORG/ sharedflows?action=import&name=<sf>"
Deploy
Input:
curl --silent -X GET "https://apigee.googleapis.com/ v1/organizations/<ORG>/sharedflows/<sf>" -H "Authorization: Bearer <access_token from above>"
Output:
{ "metaData": { "createdAt": "1736952161610", "lastModifiedAt": "1736952161610", "subType": "SharedFlow" }, "name": "sf-api-sec-extension-postflow", "revision": [ "1" // This is the revision number ], "latestRevisionId": "1" }
-
Deploy
<sf>:curl --silent -X POST -H "Authorization: Bearer <access_token from above>" "https://apigee.googleapis.com/ v1/organizations/$ORG/environments/<ENVIRONMENT>/ sharedflows/$sf/revisions/<REVISION>/ deployments?override=true"
-
Verify API security shared flows were created:
Go to Apigee → Proxy development → Shared Flows and check that the following policies have been added.
sf-api-sec-extension-postflowsf-api-sec-extension-preflow
Connect to an existing hook
Follow the steps if you have an existing hook and would like to integrate with a shared flow.
- Check for existing flow hooks.
- Go to Apigee → Management → Environments and select the environment to hook the shared flow.
- In the Flow Hooks tab, select the relevant flow hook.
-
Configure policy for shared flow to the existing hook.
-
Go to Apigee → Proxy development → Shared Flows and select the flow hook from the relevant environment.
Note
Start with the hook in pre-proxy.
- From the Develop tab, expand Policies and select Flow Callout.
- Enter a meaningful name and select the Sharedflow:
sf-api-sec-extension-preflow, and then click Create. - From the Develop tab, select Shared flows and expand Default.
- From Select policy, select Select existing policy, and select the policy just created and then click Add.
- Repeat the previous steps for the post-proxy hook. Select the Sharedflow:
sf-api-sec-extension-postflow. - Click Save and Deploy.
The steps automatically run without linking to the hooks.
Important
This should only be done when there are already existing hooks, and API security shared flows can't be hooked as a standalone. Run the deployment script, but skip step 9 by passing
n. This step publishes API security shared flows to the desired Apigee environment without setting them to flow hooks. -
- Limitations:
-
The API security extension deployment scripts currently do not support archive-deployment Apigee environments. Refer to Manage archive deployment for more information.
Note
Archive deployments are currently in preview and are subject to change.
- The API security extension for Apigee relies on flow-hooks, which are available only with Intermediate or Comprehensive Apigee Environment types. Refer to Environments for more information.
- For requests/responses with binary payloads, the binary payload is not sent to the collector for analysis; only the metadata (for example, HTTP headers, query parameters, etc.) is sent.
-
Ingest Kong
Integrate Kong with Cortex Cloud to start scanning its APIs for potential threats and vulnerabilities.
You need to integrate a dedicated Kong HTTP log plugin. This plugin enables seamless traffic ingestion from your Kong API gateway to Cortex Cloud, allowing for comprehensive security measures such as OWASP Top-10, bot detection, access control, and more.
Settings in Cortex XSIAM
In Cortex Cloud, set up the Kong data source to integrate with the Kong API Gateway.
- From Settings → Data Sources & Integrations, click + Add New, search for Kong, then hover over it and click Add or Add Instance.
- In the Kong Collector wizard, enter a relevant name and then click Create and Proceed.
-
Copy the key and paste it somewhere so that you can access it later.
If you forget to record the key and close the window, you must generate a new key and repeat this process.
- Click the Download Custom Plugin link to download the plugin, which you can then upload from the Kong API Gateway.
- Click Close.
Follow the steps to integrate Kong's API gateway with Cortex XSIAM.
Download the Cortex custom plugin
Download the custom plugin gzip file. The file includes the handler.lua, utils.lua, and schema.lua files that make up the custom plugin.
Note
Contact support to obtain the custom plugin file.
Provision Kong API gateway with the custom plugin
To deploy the custom plugin, refer to the Kong API documentation online:
Kong as docker container
-
Add the plugin by mounting the plugin directory, adding it to the
Luapackage path variable, and then adding the plugin name to Kong’s plugin list variable.This can be done by passing the following arguments to the
docker runcommand, assuming./plugin_directory/kongis the directory containing theplugins/panw-apisec-http-log/ directory.-v "./plugin_directory/kong:/tmp/custom_plugins/kong" \ -e "KONG_LUA_PACKAGE_PATH=/tmp/custom_plugins/?.lua;;" \ -e "KONG_PLUGINS=bundled,panw-apisec-http-log"
You may want to adjust the size of the nginx body buffer which is used by Kong internally. This size sets the upper limit on the amount of HTTP body bytes that can be mirrored by the plugin. By default, this value is 8192 bytes (8 KB). To change it, another argument can be passed to the docker - for example, setting it to 128 KB:
-e "KONG_NGINX_HTTP_CLIENT_BODY_BUFFER_SIZE=128k"
See https://nginx.org/en/docs/syntax.html for information on the allowed values of this variable.
Important
The size of the buffer must be equal or larger than the max body size setting in the plugin configuration, on every data plane node.
-
To verify that the plugin is installed, query Kong’s Admin API using the following command:
curl admin-api-hostname:8001 | jq .configuration.loaded_plugins.'"panw-apisec-http-log"'This prints true to the terminal if the plugin is loaded into the Kong instance.
Add and configure the custom plugin
Add and configure the plugin.
- From the Kong Manager menu, go to Plugins.
- From the Plugins page, scroll down to the Custom Plugins section.
-
Select panw-apisec-http-log and click Edit to configure the panw-apisec-http-log plugin settings.
Configuration Description Example Protocols The request protocols the plugin will be applied to. Either http, https, or both Cloud Context Cloud context, such as AWS Account ID, GCP Project ID, Azure Subscription or an appropriate value for on-prem. 987654321000 Cloud Provider Cloud provider where Kong API Gateway is installed. AWS. Cloud Region Cloud region. us-east-2 Cloud API Key The collector authorization key provided by the Cortex platform. HTTP Endpoint The Cortex collector's endpoint URL. -
Click View Advanced Parameters to configure optional settings.
Note
The queue parameters can be updated to change when the plugin mirrors data to Cortex.
Configuration Description Example Instance Name A custom name for this plugin instance. This is useful when applying different instances to different scopes. Empty Tags <p>An optional set of strings for grouping and filtering,</p><div data-gb-custom-block data-tag="hint" data-style="info" class="hint hint-info"><p>Note</p><p>Use commas to separate tags.</p></div> Empty Keepalive An optional value in milliseconds that defines how long an idle connection will live before being closed. 60000 (60 seconds) Timeout An optional timeout in milliseconds when sending data to Cortex. 10000 (10 seconds) Max body size The maximum body size to mirror in bytes (for example: 1024 is 1KB). Any bytes beyond this size are omitted from the request and response bodies. Must be <= 4 MB and <= the value of Kong's nginx_http_client_body_buffer_size setting. 131072 (128 KB), or the nginx body buffer size if it’s smaller. Queue Concurrency Limit The number of queue delivery timers. -1 indicates unlimited. 1 Queue.Initial Retry Delay Time in seconds before the initial retry is made for a failing batch. 0.01 (10 milliseconds) Queue.Max Batch Size Maximum number of entries that can be processed at a time. 1 Queue.Max Bytes Maximum number of bytes that can be waiting in a queue, requires string content Unlimited Queue.Max Coalescing Delay Maximum number of (fractional) seconds to elapse after the first entry was queued before the queue starts calling the handler. 1 Queue.Max Entries Maximum number of entries that can be waiting in the queue. 10000 Queue.Max Retry Delay Maximum time in seconds between retries, caps exponential backoff. 60 Queue.Max Retry Time Time in seconds before the queue gives up calling a failed handler for a batch. 60 - Go to Kong data source to validate that data is ingested from the Kong API Gateway.
Limitations
- The plugin supports HTTP and HTTP/S protocols.
- The plugin supports Kong API Gateway version 3.4.x and above.
- The nginx body buffer size on each data plane node must be equal or larger than the max body size setting.
- Request and response bodies will not be mirrored if their size exceeds the nginx body buffer size. When this occurs, it is indicated in the metadata that is sent to Cortex along with the HTTP transaction data.
- The mirrored response body is the body returned from the upstream service. This means that changes made to the response body by other plugins, is not reflected in the mirrored data.
Ingest F5
Integrate F5 with Cortex XSIAM to start scanning its APIs for potential threats and vulnerabilities.
You need to integrate a dedicated F5 log plugin. This plugin enables seamless traffic ingestion from your F5 gateway to Cortex XSIAM, allowing for comprehensive security measures such as OWASP Top-10, bot detection, access control, and more.
Settings in Cortex XSIAM
In Cortex XSIAM, set up the F5 data source to integrate with the F5 API Gateway.
- From Settings → Data Sources & Integrations , click + Add New, search for F5 BIG-IP LTM , then hover over it and click Add or Add Instance.
- In the F5 BIG-IP LTM Collector wizard, enter a relevant name and then click Create and Proceed.
-
Copy the key and paste it somewhere so that you can access it for later.
If you forget to record the key and close the window, you must generate a new key and repeat this process.
- Click the Download iRules LX Plugin link to download the plugin to upload it from the F5 Gateway.
- Click Close.
Settings in F5 BIG-IP LTM
- Log in to your F5 environment.
-
Verify that the following is configured:
Navigate to System → Resource Provisioning and enable iRules Language Extensions (iRulesLX) . Check Provisioning and set to Nominal.
-
Navigate to Local Traffic → iRules → LX Workspaces and follow the steps under the relevant tab:
LX Workspaces:
-
Click Import. In the General Properties page, enter a Name and for Source, select apisec_bigip_plugin_tar.gz .
Note
Extract the files from the F5 plugin to a folder before selecting to upload to F5.
- In the General Properties page, enter:
- Name: Enter the name panw_apisec_workspace.
- Source: Select apisec_bigip_plugin_tar.gz.
- Select Import to import the plugin.
LX Plugins:
- Click Create.
- In the General Properties page, enter:
- Name: Enter panw_apisec_plugin.
- From Workspace: Select panw_apisec_workspace.
- Click Finished.
-
- Navigate to System → File Management → Data Group File List → Import.
- From File Name, select the panw_apisec_config.txt file that was extracted from the zip that was downloaded from Cortex Cloud.
- In the Name field, select Create New and enter panw_apisec_config.
- From File Contents, select String.
- For Data Group Name, enter panw_apisec_config.
- Click Import.
- Navigate to System → File Management → Data Group File List.
- Click panw_apisec_config.
-
In Definition, fill in the values for the following:
"context_account_id" := "", "context_provider" := "", "context_region" := "", "cortex_collector_key" := "", "cortex_collector_url" := "",
- Paste the F5 VIG-IP LTM Collector key you copied from Cortex Cloud in the
"cortex_collector_key". -
From Cortex Cloud, go to Data Sources & Integrations and from F5 BIG_IP LTM , copy the API URL and paste it in the
"cortex_collector_url".
-
The
context_account_id,context_provider, andcontext_regiondepend on the cloud environment. In this instance, AWS is the example:Note
- The provider for
"context_provider"should always be uppercase. - Supported providers: AWS, GCP, Azure, On-prem.
"context_account_id" := "12345", "context_provider" := "AWS", "context_region" := "us-east-2", "cortex_collector_key" := "collector key", "cortex_collector_url" := "API URL",
- The provider for
- Click Update.
- Paste the F5 VIG-IP LTM Collector key you copied from Cortex Cloud in the
- Navigate to Local Traffic → Virtual Servers → Virtual Server List . The virtual server functions as an API Gateway, handling all incoming and outgoing requests and responses, then forwarding that data to the Cortex XSIAM collector.
- From the virtual server that serves as the gateway, click Edit.
- In the Resources tab, under iRules, click Manage.
-
From the Available list, navigate to /Common/panw_apisec_plugin and select panw_apisec_data_collection and panw_apisec_set_ssl_data , and then click the left arrow button to move them to the Enabled list.
Note
Select panw_apisec_set_ssl_data only if your client SSL profile is enabled.
- Click Finished.
- Click the Properties tab.
- Test the request/response and verify that the logs are sent to Cortex XSIAM. This can be verified by checking that the counter has increased. The scanned API endpoint metadata from f5-bigip is ready for investigation in the API inventory.
Agent-based protection
Note
Web and API Security (WAAS) profiles and policies are currently a Beta feature.
Cortex XSIAM can protect your workloads from various types of injection attacks, exploitation attempts, known vulnerabilities, automated tools, and more. In addition, your cloud workloads can be protected against evolving threats aggregated from commercial threat feeds, open-source threat feeds, and input from the Palo Alto Networks Unit 42 research team.
Web and API Security profiles provide comprehensive real-time detection and protection for web-based applications and APIs running on Linux-based workloads, to prevent cloud attacks. These profiles can be applied to policies for such workloads.
You can configure Cortex XSIAM to either monitor traffic for threats, or to actively block them. A fully configurable profile gives you the flexibility to protect your workloads based on specific needs for each type of threat.
Follow these steps to configure profiles and policies for cloud workloads:
- Task 1: Set up Web and API Security profiles
- Task 2: Apply Web and API Security profiles to workloads
- (Optional) Task 3: Configure exception rules, such as legacy exception rules and support exception rules. Disable prevention rules for specific use cases.
The following table summarizes the workload protection features provided by Cortex Cloud prevention profiles and policies:
| Module | Threat description |
|---|---|
| Advanced Threat Protection | Advanced Threat Protection (ATP) is a comprehensive security feature designed to detect, prevent, and respond to sophisticated Web and API threats, ensuring robust protection for workloads against evolving risks. |
| Authentication bypass | The Cortex XSIAM authentication bypass module protects against attacks that attempt to circumvent authentication controls through session manipulation, token exploitation, or credential abuse. |
| Automation tools | Cortex XSIAM detects and protects against automated tools or services that scrape website contents such as Scriptable headless web browsers, command line tools, or HTTP libraries. |
| Cross-Site Scripting (XSS) injection | Cortex Cloud protects against XSS attacks, in which malicious JavaScript snippets are injected into otherwise benign and trusted websites. In such attacks, attackers try to trick the browser into switching to a JavaScript context and executing arbitrary code. |
| CVE exploits | Cortex Cloud protects against exploitation attempts of known vulnerabilities (Common Vulnerabilities and Exposures (CVEs)). |
| Malformed Traffic | Cortex Cloud identifies and protects against HTTP requests with anomalies that are not expected from common web browsers. |
| Injection attacks | Injection attacks are a form of attacks in which attackers attempt to insert malicious input into an application to manipulate its execution. For example, a code injection attack injects code which is interpreted by the application or other runtimes. Command and code payloads can either be injected as part of HTTP requests, or are included from local or remote files (also known as File Inclusion attacks). |
| Known bots | Cortex Cloud can identify legitimate bots that properly declare their identity and purpose, such as search engine crawlers and authorized web indexers. These bots follow standard protocols and provide verifiable operator information, however some of them might cause undesirable behaviors, such as spam, and you might prefer to block such bots. |
| Offensive tools | Cortex Cloud identifies offensive tools that scan web applications for known security vulnerabilities and misconfiguration, and exploit them. |
| Sensitive data exposure | Cortex Cloud protects workloads from providing responses that could expose sensitive data found in critical system files, including password hashes (/etc/shadow), user account information (/etc/passwd), and private encryption keys. |
| SQL injection (SQLi) | Cortex Cloud protects against SQLi attacks, which can occur when an attacker successfully inserts a malicious SQL query into the input fields of a web application. A successful attack can read sensitive data from the database, modify data in the database, or run arbitrary commands. |
Limitations
The following limitations currently exist for WAAS protection features:
- Only Linux kernel version 5.13 and later, and cgroup v2 are supported.
- The Linux kernel must be compiled with BPF support.
- K8s network policy is not enforced.
- Connections that were initiated before the XDR agent was started will not be inspected.
- Inspection size is limited to 128 KB
- In HTTP/2, XFF is only added when there is no existing XFF header.
- The following are not supported:
- localhost interface
- K8s pod traffic between containers within the same node
- Multiple NICs on K8s nodes (only traffic using the default route is supported)
- Direct HTTPS connection (end-to-end encryption)
- Service-Mesh based communication
- UDP-based communication, including HTTP/3 and QUIC
- gRPC
Set up Web and API Security profiles
Note
Web and API Security profiles and policies are currently a Beta feature.
You can configure Web and API Security profiles to provide comprehensive real-time detection and protection for web-based applications and APIs running on Linux-based workloads. These profiles can be applied to policies for such workloads.
For each setting that you want to override, clear the corresponding option to Use Default, and then select the setting of your choice.
Note
In this profile, the Report options configure the workload to report the corresponding malicious applications or APIs to Cortex XSIAM, without blocking them. The Disabled options configure the workloads to neither analyze nor report the corresponding malware or behavior.
- Add a new profile and define basic settings.
- From Cortex XSIAM, select Inventory → Endpoints → Policy Management → Prevention → Profiles. Click +Add Profile, and select whether to create a new profile, or to import a profile from a file.
- Select the Linux platform, and Web & API Security as the profile type.
- Click Next.
- Enter a unique Profile Name for the profile. The name can contain only letters, numbers, or spaces, and must be no more than 30 characters. The name will be visible from the list of profiles when you configure a policy rule.
- (Optional) Enter a description that describes the intention or business purpose of the profile.
-
Configure Action Mode options. If you choose Enable, you can then configure each item separately.
Item Options More details Action Mode <ul><li>Enable</li><li>Disable</li></ul> When set to Enable, Cortex XSIAM performs the configured action for each of the options. XSS <ul><li>Block</li><li>Report</li><li>Disable</li></ul> <p>When Cortex XSIAM detects cross-site scripting (XSS) injection, it performs the configured action.</p><p>XSS attacks are attacks in which malicious JavaScript snippets are injected into otherwise benign and trusted websites. In such attacks, attackers try to trick the browser into switching to a JavaScript context and executing arbitrary code.</p> SQL Injection <ul><li>Block</li><li>Report</li><li>Disable</li></ul> <p>When Cortex XSIAM detects SQL injection (SQLi) attempts, it performs the configured action.</p><p>(SQLi) attacks can occur when an attacker successfully inserts a malicious SQL query into the input fields of a web application. A successful attack can read sensitive data from the database, modify data in the database, or run arbitrary commands.</p> Injection Attacks <ul><li>Block</li><li>Report</li><li>Disable</li></ul> <p>When Cortex XSIAM detects injection attacks, it performs the configured action.</p><p>Injection attacks are a form of attacks in which attackers attempt to insert malicious input into an application to manipulate its execution. Command and code payloads can either be injected as part of HTTP requests, or are included from local or remote files (also known as File Inclusion attacks).</p> CVE Exploits <ul><li>Block</li><li>Report</li><li>Disable</li></ul> When Cortex XSIAM detects known vulnerabilities (Common Vulnerabilities and Exposures (CVEs)), it performs the configured action. Sensitive Data Exposure <ul><li>Block</li><li>Report</li><li>Disable</li></ul> <p>When Cortex XSIAM protects workloads from exposing sensitive data, it performs the configured action.</p><p>This module protects workloads from providing responses that could expose sensitive data found in critical system files, including password hashes (/etc/shadow), user account information (/etc/passwd), and private encryption keys.</p> Authentication Bypass <ul><li>Block</li><li>Report</li><li>Disable</li></ul> <p>When Cortex XSIAM detects attempts to bypass authentication controls, it performs the configured action.</p><p>This module protects against attacks that attempt to circumvent authentication controls through session manipulation, token exploitation, or credential abuse.</p> Advanced Threat Protection <ul><li>Block</li><li>Report</li><li>Disable</li></ul> <p>When Cortex XSIAM detects evolving threats, it performs the configured action.</p><p>Advanced Threat Protection (ATP) is a comprehensive security feature designed to detect, prevent, and respond to sophisticated web and API threats, ensuring robust protection for workloads against evolving risks.</p> Offensive Tools <ul><li>Block</li><li>Report</li><li>Disable</li></ul> Cortex XSIAM identifies offensive tools that scan web applications for known security vulnerabilities and misconfiguration, and exploit them. When such tools are found, this module can block or report them. Malformed Traffic <ul><li>Block</li><li>Report</li><li>Disable</li></ul> When Cortex XSIAM detects HTTP requests with anomalies that are not expected from common web browsers, it performs the configured action. Automation Tools <ul><li>Block</li><li>Report</li><li>Disable</li></ul> <p>When Cortex XSIAM detects automated tools, it performs the configured action.</p><p>Malicious automated tools or services can scrape website contents such as Scriptable headless web browsers, command line tools, or HTTP libraries.</p> Known Bots <ul><li>Block</li><li>Report</li><li>Disable</li></ul> <p>When Cortex XSIAM detects known bots, it performs the configured action.</p><p>Cortex XSIAM can identify legitimate bots that properly declare their identity and purpose, such as search engine crawlers and authorized web indexers. These bots follow standard protocols and provide verifiable operator information, however some of them might cause undesirable behaviors, such as spam, and you might prefer to block such bots.</p> - To save the profile, click Create.
What to do next
If you are ready to apply your new profile to endpoints, you do this by adding it to a policy rule. If you still need to define other profiles, you can do this later. During policy rule creation or editing, you select the endpoints to which to assign the policy. There are different ways of doing this, such as:
Create a policy rule from the Prevention Profiles page
- Navigate to Inventory → Endpoints → Policy Management → Prevention → Profiles.
- Right-click your new profile, and select Create a new policy rule using this profile.
- Configure the policy rule.
Edit an existing policy rule from the Policy Rules page
- Navigate to Inventory → Endpoints → Policy Management → Prevention → Policy Rules.
- Right click an existing policy and select Edit.
- Add your new profile to the policy rule.
Create a new policy rule from the Policy Rules page
- Navigate to Inventory → Endpoints → Policy Management → Prevention → Policy Rules.
- Click Add Policy.
- Configure a new policy that includes your new profile.
Apply Web and API Security profiles to workloads
Note
Web and API Security profiles and policies are currently a Beta feature.
Cortex XSIAM provides out-of-the-box protection for all registered workloads with a default security policy. To customize your security policy, create or edit one or more security profiles, and then attach the profiles to one or more policies.
Each policy you create must apply to one or more workload or workload groups. The Prevention Policy Rules table lists all the policy rules per operating system. Rules associated with one or more targets that are beyond your defined user scope are locked and cannot be edited.
-
From Cortex XSIAM, create a policy rule.
Do one of the following:
-
Select Inventory → Endpoints → Policy Management → Prevention → Policy Rules, and select + New Policy or Import from File.
Note
When importing a policy, select whether to enable the associated policy targets. Rules within the imported policy are managed as follows:
- New rules are added to the top of the list.
- Default rules override the default rule in the target tenant.
- Rules without a defined target are disabled until the target is specified.
-
Select Inventory → Endpoints → Policy Management → Prevention → Profiles, right-click the profile that you want to assign, and click Create a new policy rule using this profile.
-
- Enter a policy name, and a description (optional) that describes the purpose or intent of the policy.
- Select the Platform for which you want to create a new policy.
-
Select the desired profiles that you want to apply in this policy.
If you do not specify a profile, the default profiles are used.
- Click Next.
-
Use the filters to assign the policy to one or more workloads or workload groups.
Cortex XSIAM automatically applies the platform filter you selected and, if it exists, the Group Name according to the groups within your defined user scope.
- Click Done.
-
In the Policy Rules table, change the rule position, if needed, to order the policy relative to other policies.
The Cortex XDR agent evaluates policies from top to bottom. When the Cortex XDR agent finds the first match, it applies that policy as the active policy. To move the rule, select the arrows and drag the policy to the desired location in the policy hierarchy.
Right-click to display and use one of the following options View Policy Details, Edit, Save as New, Disable, and Delete.
-
If you want to export policies, select one or more policies, right-click, and select Export Policies. You can include the associated Policy Targets, Global Exceptions, and workload groups.
Note
The exported file is encoded in Base64 and cannot be edited.
Manage Web and API Security prevention profiles
After you create and customize your Web and API Security prevention profiles, you can manage them from the Prevention Profiles page as needed.
View the prevention policy rules that use a specific prevention profile
Before you modify or delete a profile, you can check which policy rules, if any, use the profile.
-
From Inventory → Endpoints → Policy Management → Prevention → Profiles, right-click the profile and select View policy Rules.
Cortex XSIAM opens the Prevention Policy Rules page on a new tab. This page is filtered, and only displays the rules that use the profile that you selected.
Edit, export, duplicate, or delete a prevention profile
Edit a profile:
- From Inventory → Endpoints → Policy Management → Prevention → Profiles, right-click the profile and select Edit.
- Make your changes, and then click Save.
Export a profile:
- From Inventory → Endpoints → Policy Management → Prevention → Profiles, right-click the profile and select Export Profile.
- Click Export. The profile is downloaded to your computer.
Duplicate a profile:
- From Inventory → Endpoints → Policy Management → Prevention → Profiles, right-click the prevention profile and select Save as New. A new profile is displayed, containing the values from the profile that you selected.
- Edit the profile name and description, edit any values that you want to change, and then click Create.
- Populate a new prevention policy rule with your new profile.
Delete a profile:
- If necessary, delete or detach any policy rules that use the profile before attempting to delete it.
- From Inventory → Endpoints → Policy Management → Prevention → Profiles, locate the profile that you want to remove. The profile's Usage Count cell must have a 0 (zero) value.
- Right-click the prevention profile and select Delete.
- To confirm the deletion, click Yes.
Populate a new prevention policy rule with a prevention profile
-
From Inventory → Endpoints → Policy Management → Prevention → Profiles, right-click the profile and select Create a new policy rule using this profile.
Cortex XSIAM automatically populates the Platform selection based on your profile configuration, and assigns the profile based on the profile type.
- For Policy Name, enter a meaningful name, and optionally, add a description for the policy rule.
- Assign any additional profiles that you want to apply to your policy rule, and click Next.
- Select the target workloads for the policy rule, or use the filters to define criteria for the policy rule to apply, and then click Next.
- Review the policy rule summary, and then click Done.
View information about your Web and API Security prevention profiles
The following table displays the fields that are available on the Prevention Profiles page, in alphabetical order. The table includes both default fields and additional fields that are available in the column manager. To view this page, go to Inventory → Endpoints → Policy Management → Prevention → Profiles.
| Field | Description |
|---|---|
| Associated Targets | The endpoints or endpoint groups to which the profile is assigned |
| Created By | The administrator who created the prevention profile |
| Created Time | The date and time at which the prevention profile was created |
| Description | An optional description entered by an administrator to describe the prevention profile |
| Modification Time | The date and time at which the prevention profile was modified |
| Modified By | The administrator who modified the prevention profile |
| Name | The prevention profile name |
| Profile ID | The ID assigned to to the profile by Cortex XSIAM |
| Summary | Summary of prevention profile configuration |
| Type | The prevention profile type |
| Usage Count | The number of policy rules that use the profile. If you want to delete a profile, ensure that this cell displays "0". |
Add a disable prevention rule for cloud workloads
You can create granular exceptions to prevention actions defined for your workloads. These exception rules may be useful when you have processes that are essential to your organization, and must not be terminated. To cover all your workloads, you can configure different exception rules per platform. Cortex Cloud still generates issues from the disabled rules.
Important
- All applicable prevention actions are skipped for the files and process that match the properties defined in the rule.
- Consider the consequences of disabling a prevention rule before you add the exception, and monitor it over time.
- Go to Settings → Exceptions Configuration → Disable Prevention Rules.
- Click Add Rule, and select Web and API Security.
- For Rule Name, enter a meaningful name for the rule.
- (Optional) Enter a description for the business reason or intent for the rule.
- Click Next.
- For Exception Effect, choose an option:
- Disable prevention and report: Disable the prevention modules included in this rule and report on it.
- Disable prevention and do not report: Disable the prevention modules included in this rule but do not report on it.
- For Platform, select the operating system that you require.
-
Under Target Properties, you can configure any combination of parameters. If a parameter is not specified, all values are allowed. You can use wildcards for matching. Press Enter to add the target properties. Repeat this step for additional target properties.
When you specify two or more values, the exception is applied only if the file satisfies all the specified target properties.
- Domain: Specify a domain.
- IP: Specify an IP address.
-
User Agent: Specify the application's User-Agent ID that is used in the headers of an API request.
For example, if the user agent is
"User-Agent:paypal.com", enterpaypal.comhere. - Path: Specify the path to the required files or folders.
-
For Modules, select one or more security modules that won't trigger prevention actions.
The actions triggered by the other modules are not affected.
- For Scope, select the scope for the rule:
- If you want to apply the rule to all workloads, select Global.
- If you want to apply the rule to only specific exception profiles, click Exception Profiles, and then select them from the list.
- Click Next.
- Review the configurations for the exception, and if the risks are acceptable to you, select I understand the risk, and then click Create.
Add a support exception rule for cloud workloads
You can define and manage exceptions based on files received from the customer support team. You can apply the rule across all of your workloads or to specific profiles.
- From Settings → Exceptions Configuration → Support Exception Rules, click + Import from file.
- Locate the JSON file that you received from the customer support team, and either drag and drop the file to this dialog box, or click Browse to locate the file.
- Select Profile/s to apply the rule to one or more specific profiles, or select Global to apply to all workloads.
- If you want to apply the rule to existing profiles, select them from the list.
- If you want to apply the rule to a new profile, click New Profile, and enter the name of the new profile.
- Click Import.
Add a legacy exception rule for cloud workloads
Legacy Exception rules enable you to configure an exception to prevention and protection modules on workloads for selected profiles.
Items included in allow lists may continue to generate Cortex Cloud security events. If you want to exclude event reporting, configure this on the Issue Exclusions page (Settings → Exception Configurations → Issue Exclusions).
- Select Cases & Issues → Issues.
- Locate an issue from which you can create an exception rule, and right-click it.
- Select Manage Issue → Create Issue Exception.
- Select the items that you want to be included in the exception rule:
- Domain: The domain to be excluded by the rule. For example, google.com
- Path: The path to files or folders to be excluded by the rule.
- User-Agent: The application's User-Agent ID to be excluded by the rule. For example, a User-Agent ID for the curl application could be
curl/7.68.0 - IP address: The IP address to be excluded by the rule.
- Select an option for Exception Scope:
- Global: Apply the exception rule globally for all workloads.
- Profile: Apply the rule only to workloads mapped to the profile selected in the next step.
- If you selected Profile, select a profile from the Exception Profile Name list.
-
Click Create.
Your rule is created, and can be viewed at the following location: Settings → Exceptions Configuration → Legacy Agent Exceptions.
Additional workload management tasks
Several management activities that can be performed on workloads are accessible from Inventory → Endpoints → All Endpoints and from Inventory → Endpoints → Groups. On these pages, select one or more workloads, and right-click to access the available actions and configuration options.
API specification inventory
Cortex XSIAM offers the option to import API specifications that comply with the OpenAPI format, including format, file structure, and data types.
In addition to observing API traffic, Cortex XSIAM scans AWS and Azure API gateways, and extracts the API specification files. Once the specification files are in the inventory, Cortex XSIAM scans them for misconfigurations and vulnerabilities, providing insights into your API landscape.
Use Cortex XSIAM to validate live traffic against specifications and alert on surface deviations, undocumented endpoints, or security gaps.
The following table describes the fields that are available for each API specification.
| Field | Description |
|---|---|
| Sources | <p>Source of the API specification:</p><ul><li>User</li><li>API Gateway Configuration</li></ul> |
| Asset Name | Asset name is obtained from the title field in the specification. |
| Servers List | <p>This field is automatically filled if the specification contains the server URL or host. You must manually add the URL or host address if there is no URL or host in the specification.</p><div data-gb-custom-block data-tag="hint" data-style="info" class="hint hint-info"><p>Note</p><p>Even if you have already imported the specification, you can edit the API specification in Cortex XSIAM and add or update the server list.</p></div> |
| API Versions | API version obtained from the API specification. |
| Associated Endpoints | <p>Shows the number of endpoints that match the specification.</p><p>You can right-click and select View Associated Endpoints to see the matched paths in the API Endpoints table.</p> |
| Format & Version | OpenAPI or Swagger and the relative version. |
| Spec File Name | Specification file name that was imported to Cortex XSIAM. |
| Findings | The total number of findings is broken down by severity, and findings with a severity of high trigger an issue. |
| Status | <p>Indicates if the specification is:</p><ul><li>Unknown</li><li>Active</li><li>Recently Active</li><li>Inactive</li><li>Deleted</li></ul> |
Click the API asset to open the side card. Each tab includes detailed information from the parsed data of the API.
You can add Comments ( ) to the specification, providing additional context about the API endpoints or other relevant information.
Overview
Shows the highlights and properties of the API endpoint asset.
| Field | Description |
|---|---|
| Asset ID | API asset ID. |
| Provider | <p>Gateway provider:</p><ul><li>GCP</li><li>AWS</li><li>Azure</li><li>On Prem</li></ul> |
| Asset Category | API Endpoint or API Specification |
| Account ID | Account ID of the API specification. |
| Asset Groups | Indicates the asset group that the API is associated with. For more information, go to Asset groups. |
| Cases/Issues/Findings | <p>The page shows issues and cases.</p><p>The link from the number opens the page where you can review the details. Refer to Cases and issues for detailed information.</p><p>You can view all API security issues and cases detected by Cortex XSIAM.</p> |
| Evidence | Shows findings that provide visibility into the risks and vulnerabilities of your API landscape. By continuously analyzing findings, you can maintain an up-to-date view of the API asset’s security posture and support more informed decision-making for detection, prioritization, and remediation efforts. |
An issue is generated when the following Detection Method is triggered.
| Deployment option | Detection Method and Type | Description |
|---|---|---|
| Agentless for Posture | Detection Method: API Posture Scanner | <p>If Cortex XSIAM detects security vulnerabilities or compliance issues in the posture of an API during scanning, an issue is generated.</p><p>The issue includes specification static scan findings relevant to the issue.</p> |
Code
The schema shows the actual API specification that includes the basic information of the API, the API path, method, and parameters.
Insights
At a glance, we see a graphical representation of the specification scan results by severity and by category.
You can filter in by severity or by category. Drill down to view details of the selected scan result.
The specification scan results by severity table include the following information:
| Field | Description |
|---|---|
| Severity | Indicates the severity of the scan result issue. |
| Category | <p>API category. The options are:</p><ul><li>Access Control</li><li>Networking and Firewall</li><li>Insecure Configurations</li><li>Data</li><li>Encryption</li><li>Structure and Semantics</li></ul> |
| Name | Name of API specification. |
| Description | Details of the scan results. |
| Modification Time | Time stamp of when the API specification was modified |
| Finding ID | For every vulnerability, a finding is created. |
You can drill down by clicking a severity to see the details/information of the findings (vulnerabilities).
| Field | Description |
|---|---|
| Severity | <ul><li>Critical/High/Medium/Low</li><li>Info</li></ul> |
| Category | API category. |
| Link to OpenAPI checks | .OpenAPI page of the scan results item includes a description of the issue and a link to Details You can: |
| Description | Details of the scan results. |
| Scan Result Issue | Refers to the number of findings. |
| Scan Results | Shows the findings in the API request. The issue is highlighted. |
Import API specification
Cortex XSIAM enables you to import YAML or JSON files. After importing the file, Cortex XSIAM analyzes the data to identify vulnerabilities to help you effectively manage and enforce security measures.
How to import an API Specification
- Go to Inventory → All Assets → APIs → Specification.
- Click Import API Specification.
-
Drop or browse for the API specification file and add the server of where the file is hosted. This field is automatically filled if the file contains the server URL or host. If there is no URL or host in the file, you must manually add the URL or host address.
Note
Even if you already imported the file, you can edit the API asset and add or update the server list.
-
Click Import.
It can take up to 30 minutes to import the file.
Serverless function runtime security
Cortex XSIAM enables runtime monitoring within a cloud environment by embedding Cortex XDR agent directly into the code of the serverless function. This allows for real-time monitoring of code execution, processes, networking, and filesystem activity, along with the enforcement of policies to permit or deny these actions. This in-depth runtime visibility enhances the overall security of your serverless functions.
Policy violations are detected and logged in Cortex Issues to allow for effective scoping and analysis in order to thoroughly assess the issues.
Use cases
- Visibility of policy violations in issues: Use the Issues entity to view the policy violations of serverless functions that have occurred. You can drill down and view information such as region, cloud function runtime, the specific serverless function name which indicates the issue that’s occurred, cloud function request id which is the instance id from the cloud provider.
- Monitor serverless functions in your cloud environment: After embedding the agent in the function, the agent monitors for policy violations as defined in the profile you have configured.
Supported platforms
Runtime protection for serverless functions is available for Cortex Cloud Runtime Security, Cortex XSIAM Premium, Cortex XSIAM Enterprise, and Cortex XSIAM NG Siem licenses.
- Supported runtime environments: Python, Node.js.
- Supported architecture: x86_64
- Supported cloud provider: Amazon Web Services (AWS)
User roles and permissions
To grant access and configuration permissions to serverless function capabilities in the Cortex tenant, you must verify that the user has the correct settings in the linked role.
- Go to Settings+Configuration+Access Management → Roles.
- Go to the relevant role, right-click and select Edit Role and in the Components tab, verify under Inventory, that Agent Profiles, Agent Installations and Agent Extension Policies are configured to View/Edit.
Set up serverless function protection
Setting up serverless function protection includes:
Serverless runtime issues
You can view all serverless function issues detected by an agent and generated from policy violations under Issues (under Cases & Issues) inventories.
Every policy violation creates an issue per type:
- Process activity - enables specifying specific allowed list processes, blocking all processes except the main process and detecting crypto mining attempts.
- Network activity - enables monitoring and enforcement of DNS resolutions, inbound and outbound network connections.
- Filesystem activity - enables defining specific paths in an allowed or denied list.
Additional issues from specific policy violation are raised, which include the same cloud provider, region, runtime, function name, function version, issue name and issue description, will be suppressed.
The Issues page includes the following information indicating unique serverless function issues raised by agents:
| Field | Description |
|---|---|
| Domain | For serverless, this is set to Security. |
| Category | For serverless, this is set to Cloud. |
| Name | <p>For serverless, the relevant issue name appears:</p><ul><li>Serverless function Network Policy violation for outbound ports</li><li>Serverless function Network Policy violation for listening ports</li><li>Serverless function Network Policy violation for DNS</li><li>Serverless function Network Policy violation for IPs</li><li>Serverless function File system Policy violation</li><li>Serverless function Process Policy violation</li></ul> |
| Detection method | For serverless, this is set to XDR agent. |
| Severity | For serverless, this is always set to High. |
| Cloud Function Runtime | <ul><li>Python</li><li>Node.JS</li></ul> |
| Cloud Function Request ID | Instance id from the cloud provider. |
Note
Issues triggered within 24 hours, sharing the same name and description, will be aggregated into cases along with issues from the same function per execution.
Data Security
Cortex Data Security
Requires a Data Security, Cloud Runtime Security, or Cortex XSIAM Premium license, or the Data Security add-on.
Cortex Data Security is the unified data security solution from Palo Alto Networks for protecting sensitive data wherever it lives across your organization. It covers cloud storage, SaaS applications, on-premises file shares and databases, database-as-a-service (DBaaS) environments, code repositories, and AI pipelines. The platform discovers, classifies, and protects your data from a single console, replacing the fragmented set of point tools that organizations have traditionally needed to cover each environment.
Cortex Data Security gives you access to the following capabilities:
- Data Security Posture Management (DSPM) to discover and assess your data at rest.
- Data Loss Prevention (DLP) to prevent exfiltration across communication channels.
- Data Detection & Response (DDR) to monitor real-time activity and stop breaches before they happen.
- Data Access Governance (DAG) to rightsize access and enforce least privilege across human, non-human, and AI agent identities.
For more information, see the Data Security Documentation.
Reference and developer docs
Cortex XSIAM XQL
Understand more about the Cortex Query Language called XQL, so you can build queries to gain insight from the data contained in the different data sources in Cortex XSIAM.
Get started with XQL
XQL is the Cortex Query Language. It allows you to form complex queries against data stored in Cortex XSIAM. This section introduces XQL, and it provides reference information on the various stages, functions, and aggregates that XQL supports.
XQL language features
The Cortex Query Language (XQL) enables you to query for information contained in a wide variety of data sources in Cortex XSIAM for rigorous endpoint and network event analysis. Queries require a dataset, or data source, to run against. In a dataset query, unless otherwise specified, the query runs against the xdr_data dataset, which contains all raw log information that Cortex XSIAM collects from all Cortex product agents, including EDR data, and PAN NGFW data. In XDM queries, you must specify the dataset mapped to the XDM that you want to run your query against. For both types of queries, you can also import data from third parties and then query against those datasets as well.
You submit XQL queries to Cortex XSIAM using the Investigation & Response → Search → Query Builder user interface.
XQL is similar to other query languages, and it uses some of the same functions as can be found in many SQL implementations, but it is not SQL. XQL forms queries in stages. Each stage performs a specific query operation and is separated by a pipe (|) character. To help you create an effective XQL query with the proper syntax, the query field in the user interface provides suggestions and definitions as you type. For example, the following dataset query uses three stages to identify the dataset to query, identify the field to be retrieved from the dataset, and then set a filter that identifies which records should be retrieved as part of the query:
dataset = xdr_data | fields os_actor_process_file_size as osapfs | filter to_string(osapfs) = "12345"
Tip
When creating XQL queries, you can:
- Use the up and down arrow keys to navigate through the auto-suggestion commands and definitions.
- Select an auto-suggestion command by pressing either the Enter or Tab key.
- Press Shift+Enter to add a new line, and easily ignore the auto-suggestion output.
- Close the auto-suggestion output by pressing the Esc key.
XQL supports:
- Simple queries.
- Filters that identify a subset of records to return in the result set.
- Joins and Unions.
- Aggregations.
- Queries against standard datasets.
- Queries against presets, which are collections of information that are specific to a given type of network or endpoint activity, such as authentication or file transfers.
- Queries against custom imported datasets.
- Queries against the XDM.
XQL Language Structure
Cortex Query Language (XQL) queries usually begin by defining a data source, be it a dataset, preset, or Cortex Data Model (XDM). You must specify the dataset mapped to the XDM that you want to run your query against. In a dataset query, unless otherwise specified, the query runs against the xdr_data dataset, which contains all log information that Cortex AgentiX collects from all Cortex product agents, including EDR data, and PAN NGFW data. It's possible to change the default dataset in the Dataset Management page of Cortex XSIAM. For more information, see What are datasets?.
After specifying a data source, you use zero or more stages to form the XQL query. Each stage is delimited using a pipe character (|). The function performed by each stage is identified by the stage keyword that you provide. XQL queries can contain different components depending on the type of query you want to build.
Adding comments in queries
You can add comments in any section when building a query in Cortex Query Language (XQL).
-
Comments are added on a single line using the following syntax.
//<comments>
For example,
dataset = xdr_data | filter event_type=1 //ENUM.process and event_sub_type = 1 //ENUM.execution
-
To write a comment that extends over multiple lines use the following syntax.
/*multi-line <comments> */
For example,
dataset = xdr_data | filter /*multi-line Adding comments is a great thing. Here is an example */ event_type=1
Supported operators
| Operator | Description |
| Comparison operators | |
| =, != | Equal, Not equal |
| <, <= | Less than, Less than or equal to |
| >, >= | Greater than, Greater than or equal to |
| Boolean operators | |
| and | Boolean and |
| or | Boolean or |
| not | Boolean not |
| String and range operators | |
| IN, NOT IN | Returns true if the integer or string field value is one of the options specified. For example:
For string field values, wildcards are supported. In this example a wildcard (
|
| CONTAINS, NOT CONTAINS | Performs a search for an integer or string. Returns true if the specified string is contained in the field. Example: lowercase(actor_process_image_name) contains "psexec" |
| ~= | Matches a regular expression. Example: action_process_image_name ~= ".*?\.(?:pdf|docx)\.exe" |
| INCIDR, NOT INCIDR | Performs a search for an IPv4 address or IPv4 range using CIDR notation, and returns true if the address is in range. Example: action_remote_ip incidr "192.1.1.1/24" It is also possible to define multiple CIDRs with comma separated syntax when building a XQL query with the Query Builder or in Correlation Rules. When defining multiple CIDRs, the logical Example: action_remote_ip incidr "192.168.0.0/24, 1.168.0.0/24" Both the IPv4 address and CIDR ranges can be either an explicit string using quotes ( |
| INCIDR6, NOT INCIDR6 | Performs a search for an IPv6 address or IPv6 range using CIDR notation, and returns true if the address is in range. Example: action_remote_ip incidr6 “3031:3233:3435:3637:0000:0000:0000:0000/64” It is also possible to define multiple CIDRs with comma separated syntax when building a XQL query with the Query Builder or in Correlation Rules. When defining multiple CIDRs, the logical Example: action_remote_ip incidr6 "2001:0db8:85a3:0000:0000:8a2e:0000:0000/64, fe80::/10" Both the IPv6 address and CIDR ranges can be either an explicit string using quotes ( |
| Add operator for tagging | |
| add | The Example:
|
Datasets and presets
Every Cortex Query Language (XQL) dataset query begins by identifying a data source that the query will run against. Each data source has a unique name, and a series of fields. Your query specifies the data source, and then provides stages that identify fields of interest and perform operations against those fields.
You can query against either datasets or Presets in a dataset query. XQL supports using different languages for dataset and field names. In addition, the dataset formats supported are dependent on the data retention offerings available in Cortex XSIAM according to whether you want to query hot storage (default) or cold storage. For more information, see XQL Language Structure.
Datasets
The standard, built-in data source that is available in every Cortex XSIAM instance is the xdr_data dataset. This is a very large dataset with many available fields. For more information about this dataset, see Cortex XQL Schema Reference Guide. Cortex Query Language (XQL) supports using different languages for dataset and field names. In addition, the dataset formats supported are dependent on the data retention offerings available in Cortex XSIAM according to whether you want to query hot storage (default) or cold storage. For more information, see XQL Language Structure.
This dataset is comprised of both raw Endpoint Detection and Response (EDR) events reported by the Cortex XSIAM agent, and of logs from different sources such as third-party logs. To help you investigate events more efficiently, Cortex XSIAM also stitches these logs and events together into common schemas called stories. These stories are available using the Cortex XSIAM Presets.
Building queries in XQL
When building queries in XQL, keep the following in mind about datasets:
- Use the
datasetkeyword to specify a dataset on your query. - Create custom datasets using the target stage.
- Dataset names can use uppercase characters, but in queries dataset names are always treated as if they are lowercase. In addition, dataset names are supported using different languages, numbers (
0-9), and underscores (_). Yet, underscores cannot be the first character of the name. - Upon ingestion, all fields are retained even fields with a null value. You can also use XQL to query parsing rules for null values.
- Schema changes to datasets may not be reflected in the autocomplete suggestions and definitions as you type in real time the XQL query and can appear with a slight delay.
Available datasets
Depending on your integrations, you can have the following datasets available for queries:
| Data | Dataset |
|---|---|
| Active Directory via Cloud Identity Engine | <p>pan_dss_raw</p><div data-gb-custom-block data-tag="hint" data-style="info" class="hint hint-info"><p>Note</p><p>To set up this Cloud Identity Engine (previously called Directory Sync Service (DSS)) dataset, you need to set up a Cloud Identity Engine. Otherwise, you will not have a pan_dss_raw dataset. For more information, see Set up Cloud Identity Engine.</p></div> |
| Asset groups | <p>asset_groupsProvides metadata for asset groups. Use this dataset to retrieve the human-readable group name for use in queries, reports, and dashboards.</p> |
| Issues table in Cortex XSIAM | <p>issues</p><div data-gb-custom-block data-tag="hint" data-style="info" class="hint hint-info"><ul><li>INFO issues are not included in this dataset.</li><li>This dataset includes issues from the Security and Health domains. For more information, see Overview of the Issues page.</li></ul></div> |
| Authentication logs (subset of xdr_data) | <p>Authentication logs, such as Okta: auth_logs</p><div data-gb-custom-block data-tag="hint" data-style="info" class="hint hint-info"><p>The fields contained in this dataset are a subset of the fields in the xdr_data dataset.</p></div> |
| AWS CloudTrail and Amazon CloudWatch | <Vendor>_<Product>_raw |
| Azure Event Hub | <ul><li>All logs: MSFT_Azure_raw</li><li>Normalize and enrich audit logs: cloud_audit_logs</li></ul> |
| Azure Network Watcher | <ul><li>All logs: MSFT_Azure_raw</li><li>Normalize and enrich flow logs: xdr_dataset dataset with a preset called network_story</li></ul> |
| BeyondTrust Privilege Management Cloud | beyondtrust_privilege_management_raw |
| Box | <p>Events (admin_logs)</p><ul><li>box_admin_logs_raw</li></ul><p>Box Shield Alerts</p><ul><li>box_shield_alerts_raw</li></ul><p>Users</p><ul><li>box_users_raw</li></ul><p>Groups</p><ul><li>box_groups_raw</li></ul> |
| Checkpoint FW1/VPN1 | <Vendor>_<Product>_raw |
| Cisco ASA | <p>Cisco ASA firewalls or Cisco AnyConnect VPN</p><ul><li>cisco_asa_raw</li></ul> |
| Collector status change audit for collection integrations, custom collectors, and marketplace collectors. | collection_auditing |
| Corelight Zeek | corelight_zeek_raw |
| Correlation rule executions | correlations_auditing |
| Cortex Data Lakes | xdr_data |
| Cortex XDR Collectors | panw_xdrc_raw |
| Cortex XSIAM Host Firewall enforcement events | host_firewall_events |
| CrowdStrike FDR | <ul><li>crowdstrike_falcon_incident_raw</li><li>crowdstrike_fdr_raw</li></ul> |
| CSV files in shared Windows directory | Custom datasets: Select from pre-existing user-created datasets or add a new dataset. |
| Database data (MySQL, PostgreSQL, MSSQL, and Oracle) | <Vendor>_<Product>_raw |
| Data ingestion health metrics | <p>Datasets:</p><ul><li>data_ingestion_health</li></ul><div data-gb-custom-block data-tag="hint" data-style="info" class="hint hint-info"><p>IMPORTANT: This dataset will not be updated after June 2024. Use the health_alerts dataset instead.</p></div><ul><li>metrics_source</li></ul><p>Presets:</p><ul><li>data_ingestion_metrics (this preset will be deprecated in the next release and replaced by metrics_view).</li><li>metrics_view</li></ul> |
| Dropbox | <p>Events</p><ul><li>dropbox_events_raw</li></ul><p>Member Devices</p><ul><li>dropbox_members_devices_raw</li></ul><p>Users</p><ul><li>dropbox_users_raw</li></ul><p>Groups</p><ul><li>dropbox_groups_raw</li></ul> |
| Elasticsearch Filebeat | <Vendor>_<Product>_raw |
| Elasticsearch Winlogbeat | <p><Vendor>_<Product>_raw</p><div data-gb-custom-block data-tag="hint" data-style="info" class="hint hint-info"><p>If the vendor and product are not specified in the Winlogbeat profile’s configuration file, Cortex XSIAM creates a default dataset called microsoft_windows_raw.</p></div> |
| Errors related to Parsing Rules and Data Model Rules | parsing_rules_errors |
| Errors related to event forwarding | event_forwarding_errors |
| Forcepoint DLP | forcepoint_dlp_endpoint_raw |
| Fortinet Fortigate | <Vendor>_<Product>_raw |
| GlobalProtect access authentication logs | <p>xdr_data</p><div data-gb-custom-block data-tag="hint" data-style="info" class="hint hint-info"><p>To ensure GlobalProtect access authentication logs are sent to Cortex AgentiX, verify that your PANW firewall’s Log Settings for GlobalProtect has the Cortex Data Lake checkbox selected.</p></div> |
| Google Cloud Platform (GCP) logs | <ul><li>All log types: google_cloud_logging_raw</li><li><p>Normalize and enrich audit and flow logs: cloud_audit_logs</p><ul><li>Audit logs: cloud_audit_logs</li><li>Network flow logs: xdr_dataset dataset with a preset called network_story</li></ul></li></ul> |
| Google Kubernetes Engine (GKE) | <Vendor>_<Product>_raw |
| Google Workspace | <ul><li>Google Chrome: google_workspace_chrome_raw</li><li>Admin Console: google_workspace_admin_console_raw</li><li>Google Chat: google_workspace_chat_raw</li><li>Enterprise Groups: google_workspace_enterprise_groups_raw</li><li>Login: google_workspace_login_raw</li><li>Rules: google_workspace_rules_raw</li><li>Google drive: google_workspace_drive_raw</li><li>Token: google_workspace_token_raw</li><li>User Accounts: google_workspace_user_accounts_raw</li><li>SAML: google_workspace_saml_raw</li><li>Alerts: google_workspace_alerts_raw</li><li>Emails: google_gmail_raw</li></ul> |
| Host Inventory and Vulnerability Assessment | <ul><li><p>Datasets</p><ul><li>host_inventory</li><li>va_cves</li><li>va_endpoints</li></ul></li><li><p>Presets</p><ul><li>host_inventory</li><li>host_inventory_accessibility</li><li>host_inventory_applications</li><li>host_inventory_auto_runs</li><li>host_inventory_cpus</li><li>host_inventory_daemons</li><li>host_inventory_disks</li><li>host_inventory_drivers</li><li>host_inventory_endpoints</li><li>host_inventory_extensions</li><li>host_inventory_groups</li><li>host_inventory_kbs</li><li>host_inventory_mounts</li><li>host_inventory_services</li><li>host_inventory_shares</li><li>host_inventory_users</li><li>host_inventory_volumes</li><li>host_inventory_vss</li></ul></li></ul> |
| Cases table in Cortex XSIAM | cases |
| Indicators | indicators |
| IT performance metrics | it_metrics |
| JSON or text logs from third-party source over HTTP | <Vendor>_<Product>_raw |
| Login logs (subset of xdr_data) | <p>Login logs, such as WEC: login_logs</p><div data-gb-custom-block data-tag="hint" data-style="info" class="hint hint-info"><p>The fields contained in this dataset are a subset of the fields in the xdr_data dataset.</p></div> |
| Logs from third party source over FTP, FTPS, or SFTP | <Vendor>_<Product>_raw |
| Microsoft Defender for Endpoint | msft_defender_raw |
| Microsoft 365 (email) | <ul><li>msft_o365_emails_raw</li><li>msft_o365_users_raw</li><li>msft_o365_groups_raw</li><li>msft_o365_devices_raw</li><li>msft_o365_mailboxes_raw</li><li>msft_o365_rules_raw</li><li>msft_o365_contacts_raw</li></ul> |
| Microsoft Office 365 | <ul><li><p>Microsoft Office 365 audit events from Management Activity API:</p><ul><li>Azure AD Activity Logs: msft_o365_azure_ad_raw</li><li>Exchange Online: msft_o365_exchange_online_raw</li><li>Sharepoint Online: msft_o365_sharepoint_online_raw</li><li>DLP: msft_o365_dlp_raw</li><li>General: msft_o365_general_raw</li></ul></li><li>Microsoft Office 365 emails via Microsoft’s Graph API: msft_o365_emails_raw</li><li>Azure AD authentication events from Microsoft Graph API: msft_azure_ad_raw</li><li>Azure AD audit events from Microsoft Graph API: msft_azure_ad_audit_raw</li><li>Alerts from Microsoft Graph Security API: msft_graph_security_alerts_raw</li></ul> |
| NetFlow | <ul><li>ip_flow_ip_flow_raw (default)</li><li>When configured, uses the format <Vendor>_<Product>_raw</li></ul> |
| Network Share logs | <Vendor>_<Product>_raw |
| Okta | okta_sso_raw |
| OneLogin | <p>Log collection</p><ul><li>onelogin_events_raw</li></ul><p>Directory</p><ul><li>onelogin_users_raw</li><li>onelogin_groups_raw</li><li>onelogin_apps_raw</li></ul> |
| PANW EDR | xdr_data |
| PANW IOT Security | <p>Alerts</p><ul><li>panw_iot_security_alerts_raw</li></ul><p>Devices</p><ul><li>panw_iot_security_devices_raw</li></ul> |
| PANW NGFW | <p>panw_ngfw__raw</p><p>Supports the following logs.</p><ul><li>Authentication Logs: panw_ngfw_auth_raw</li><li><p>Configuration Logs: panw_ngfw_config_raw</p><div data-gb-custom-block data-tag="hint" data-style="info" class="hint hint-info"><p>Prisma Access firewalls do not send configuration logs to the Structured Log Storage (SLS).</p></div></li><li>File Data Logs: panw_ngfw_filedata_raw</li><li>Global Protect Logs: panw_ngfw_globalprotect_raw</li><li>Hipmatch Logs: panw_ngfw_hipmatch_raw</li><li>System Logs: panw_ngfw_system_raw</li><li>Threat Logs: panw_ngfw_threat_raw</li><li>Traffic Logs: panw_ngfw_traffic_raw</li><li>URL Logs: panw_ngfw_url_raw</li><li>User ID Logs: panw_ngfw_userid_raw</li><li>Tunnel Logs: panw_ngfw_tunnel_raw</li><li>Configuration Logs: panw_ngfw_config_raw</li></ul><p>These datasets use the query field names as described in the Cortex schema documentation.</p> |
| PingFederate | ping_identity_pingfederate_raw |
| PingOne for Enterprise | pingone_sso_raw |
| Playbook runs | playbook_runs |
| Playbook tasks | playbook_tasks |
| Prisma Browser | panw_prisma_access_browser_raw |
| Prisma Cloud | prisma_cloud_raw |
| Prisma Cloud Compute | prisma_cloud_compute_raw |
| Proofpoint Targeted Attack Protection | proofpoint_tap_raw |
| Scripts and commands metrics | scripts_and_commands_metrics |
| SentinelOne DeepVisibility | sentinelone_deep_visibility_raw |
| ServiceNow CMDB | A ServiceNow CMDB dataset is created for each table configured for data collection using the format servicenow_cmdb_<table name>_raw. |
| Salesforce.com | <ul><li>salesforce_connectedapplication_raw</li><li>salesforce_permissionset_raw</li><li>salesforce_profile_raw</li><li>salesforce_groupmember_raw</li><li>salesforce_group_raw</li><li>salesforce_user_raw</li><li>salesforce_userrole_raw</li><li>salesforce_document_raw</li><li>salesforce_contentfolder_raw</li><li>salesforce_attachment_raw</li><li>salesforce_contentdistribution_raw</li><li>salesforce_tenantsecuritylogin_raw</li><li>salesforce_useraccountteammember_raw</li><li>salesforce_tenantsecurityuserperm_raw</li><li>salesforce_account_raw</li><li>salesforce_audit_raw</li><li>salesforce_login_raw</li><li>salesforce_eventlogfile_raw</li></ul> |
| Syslog/CEF | <CEFVendor>_<CEFProduct>_raw |
| USB devices connect and disconnect events reported by the agent | <p>xdr_data</p><div data-gb-custom-block data-tag="hint" data-style="info" class="hint hint-info"><ul><li>You can query in XQL for this data and build widgets based on the xdr_data dataset or using the preset device_control.</li><li>To view in an XQL query these events, the Device Configuration of the endpoint profile must be set to Block. Otherwise, the USB events are not captured. The events are also captured when a group of device types are blocked on the endpoints with a permanent or temporary exception in place. For more information, see Ingest Connect and Disconnect Events of USB Devices.</li></ul></div> |
VPN logs (subset of xdr_data) |
<p>VPN logs, such as GlobalProtect: vpn_logs</p><div data-gb-custom-block data-tag="hint" data-style="info" class="hint hint-info"><p>The fields contained in this dataset are a subset of the fields in the xdr_data dataset.</p></div> |
| Windows Endpoints using Cortex XDR Forensics Add-on | <ul><li>forensics_amcache</li><li>forensics_application_resource_usage</li><li>forensics_arp_cache</li><li>forensics_background_activity_monitor</li><li>forensics_chrome_history</li><li>forensics_cid_size_mru</li><li>forensics_command_history</li><li>forensics_dns_cache</li><li>forensics_edge_anaheim_history</li><li>forensics_edge_spartan_history</li><li>forensics_event_log</li><li>forensics_file_access</li><li>forensics_file_listing</li><li>forensics_firefox_history</li><li>forensics_handles</li><li>forensics_hosts_file</li><li>forensics_internet_explorer_history</li><li>forensics_jumplist</li><li>forensics_last_visited_pidl_mru</li><li>forensics_log_me_in</li><li>forensics_net_sessions</li><li>forensics_network</li><li>forensics_network_connectivity_usage</li><li>forensics_network_data_usage</li><li>forensics_open_save_pidl_mru</li><li>forensics_port_listing</li><li>forensics_prefetch</li><li>forensics_process_execution</li><li>forensics_process_listing</li><li>forensics_psreadline</li><li>forensics_recent_files</li><li>forensics_recentfilecache</li><li>forensics_recycle_bin</li><li>forensics_registry</li><li>forensics_remote_access</li><li>forensics_seven_zip_folder_history</li><li>forensics_shellbags</li><li>forensics_shimcache</li><li>forensics_team_viewer</li><li>forensics_typed_paths</li><li>forensics_typed_urls</li><li>forensics_user_access_logging</li><li>forensics_user_assist</li><li>forensics_windows_activities</li><li>forensics_winrar_arc_history</li><li>forensics_word_wheel_query</li></ul> |
| Windows event logs via Cortex XDR Windows agents | microsoft_windows_raw |
| Windows Event Collector (WEC) | <ul><li>xdr_data</li><li>microsoft_windows_raw</li></ul> |
| Windows DHCP using Elasticsearch Filebeat | microsoft_dhcp_raw |
| Windows DNS Debug using Elasticsearch Filebeat | <p>Raw Data</p><ul><li>microsoft_dns_raw</li></ul><p>Normalized Stories</p><ul><li>xdr_data with the preset called network_story.</li></ul> |
| Workday | workday_workday_raw |
| Zscaler Cloud Firewall | <p>ZIA</p><ul><li>Firewall logs: zscaler_nssfwlog_raw</li><li>Web logs: zscalar_nssweblog_raw</li></ul><p>ZPA</p><ul><li>zscaler_zpa_raw</li></ul> |
Presets
Presets offer groupings of xdr_data fields that are useful for analyzing specific areas of network and endpoint activity. All of the fields available for a preset are also available on the larger xdr_data dataset, but by using the preset your query can run more efficiently. Presets are sorted at random by the first one million results found.
Two of the available presets are stories. These contain information stitched together from Cortex XSIAM agent events and log files to form a common schema. They are authentication_story and network_story.
You use the preset keyword to specify a dataset in your query.
About examples
The examples included in the topics are intended to illustrate the behavior or usage of a particular stage or function. While these examples can be based on real data that you could use on real-world queries, you may need to tweak these queries to perform investigations or otherwise solve real-world problems.
For examples of queries that illustrate useful investigative queries, see the example Query Library that is available from the product user interface:
Investigation & Response → Search → Query Builder → XQL → Query Library
JSON functions
The Cortex Query Language (XQL) includes a number of JSON functions. Before using any of these functions, it's important to understand how Cortex XSIAM treats a JSON so you can accurately formulate your queries using the correct syntax.
Important
JSON field names are case sensitive, so the key to field pairing must be identical in an XQL query for results to be found. For example, if a field value is "TIMESTAMP" and your query is defined to look for "timestamp", no results will be found.
<json_path>
Each JSON function includes defining a <json_path> in both the regular syntax and when using the syntatic sugar format. The <json_path> argument identifies the data of the JSON object you want to extract using dot-notation. When using the regular syntax, the beginning of the object is represented by a $. This $ is not required when using the syntatic sugar format.
Example
If you have the following object:
{ "a_field" : "This is a_field value", "b_field" : { "c_field" : "This is c_field value" } }
Then the path using the regular syntax:
$.a_field
Returns "This is a_field value", while the path using the regular syntax:
$.b_field.c_field
Returns "This is c_field value".
Field in <json_path> contains characters
In the regular syntax
When using the regular syntax to write your XQL queries and a field in the <json_path> contains characters, such as a dot (.) or colon (:), the syntax needs to be tweaked slightly to account for the <json_field>.
For example, when using the json_extract function, the previous regular syntax would need to be changed to an updated syntax to account for the field in the <json_path> containing characters.
Previous regular syntax for the json_extract function:
json_extract(<json_object_formatted_string>, <json_path>)
Updated regular syntax for the json_extract function, where the <json_field> now includes single quotation marks as '<json_field>':
json_extract(<json_object_formatted_string>, "['<json_field>']")
For each JSON function, the regular syntax can change slightly, but the "['<json_field>']" format is the same. The "['<json_field>']" identifies the data you want to extract using dot-notation, where the data extracted is dependent on your syntax.
Example
If you have the following JSON object defined:
{"a.b": {"inn": {"one":1} } }
To extract the data {"one":1}, the "['<json_field>']" would need to be defined as "$['a.b'].inn" for all JSON functions. For example, when using the json_extract function, the regular syntax is:
json_extract(field_json_1, "$['a.b'].inn")
To extract the data {"inn": {"one":1}}, the "['<json_field>']" would need to be defined as "$['a.b']" for all JSON functions. For example, when using the json_extract function, the regular syntax is:
json_extract(field_json_1, "$['a.b']")
Example
If you have the following JSON object defined:
{"a.b": {"inn.inn": {"one":1} } }
To extract the data {"one":1}, the "['<json_field>']" would need to be defined as "$['a.b']['inn.inn']" for all JSON functions. For example, when using the json_extract function, the regular syntax is:
json_extract(json_field, "$['a.b']['inn.inn']")
In the syntatic sugar format
To make it easier for you to write your XQL queries, each JSON function includes an optional syntatic sugar format as opposed to using the regular syntax. When defining the syntatic sugar format and a field in the <json_path> contains characters, such as a dot (.) or colon (:), the syntax needs to be tweaked slightly to account for the <json_field>.
For example, when using the json_extract function, the previous syntatic sugar format would need to be changed to an updated syntax to account for the field in the <json_path> containing characters.
Previous syntatic sugar format for the json_extract function:
<json_object_formatted_string> -> <json_path>{}
Updated syntatic sugar format for the json_extract function, where the <json_field> now includes quotations as "<json_field>":
<json_object_formatted_string> -> ["<json_field>"]{}
For each JSON function, the syntax of the syntatic sugar format can change slightly, but the ["<json_field>"] format is the same. The ["<json_field>"] identifies the data you want to extract using dot-notation, where the data extracted is dependent on your syntax.
Example
If you have the following JSON object defined:
{"a.b": {"inn": {"one":1} } }
To extract the data {"one":1}, the ["<json_field>"] would need to be defined as ["a.b"].inn for all JSON functions. For example, when using the json_extract function, the syntatic sugar format is:
json_field -> ["a.b"].inn{}
To extract the data {"inn": {"one":1}}, the ["<json_field>"] would need to be defined as ["a.b"] for all JSON functions. For example, when using the json_extract function, the syntatic sugar format is:
json_field -> ["a.b"]{}
Example
If you have the following json_object defined:
{"a.b": {"inn.inn": {"one":1} } }
To extract the data {"one":1}, the ["<json_field>"] would need to be defined as ["a.b"]["inn.inn"] for all JSON functions. For example, when using the json_extract function, the syntatic sugar format is:
json_field -> ["a.b"]["inn.inn"]{}
How to filter for empty values in the results table
When building a query, you can filter for empty values in the results table, which can include or exclude null or empty strings. In the query syntax, empty strings are represented as "", while null fields are represented as null.
-
Exclude null and empty strings using the following syntax:
<name of field> != null and <field name> != ""
-
Include null or empty strings using the following syntax:
<name of field> = null or <field name> = ""
Example:
Below is an example of filtering your endpoint data in the results table to exclude all null values and any empty strings for a user.
config timeframe = 90d | dataset = endpoints | filter endpoint_status in (CONNECTED, DISCONNECTED) | filter user != null and user != "" | fields user, group_names, endpoint_name
Understanding string manipulation in XQL
When defining string fields in Cortex Query Language (XQL) queries, it's important to understand the various string manipulations available and the syntax required to build effective queries that return the results you're expecting. Cortex Query Language (XQL) uses RE2 for its regular expression implementation.
Cortex XSIAM enables you to use single double quotes ("<text>") or triple double quotes ("""<text>""") when defining your XQL syntax for string manipulation. This specific syntax is used with different stages, functions, and operators, with or without wildcards. Typically, the alter and filter stages are used with single or triple double quotes, so these stages are used in the examples provided below.
Using single double quotes
Single double quotes ("<text>") include the following functionality:
- Treats the string value literally.
- Wildcards using the asterisk (*) are processed as XQL wildcards, and match any sequence of characters.
- Escape sequences, such as
\n(new line) or\t(tab), are not processed and are treated as plain characters.
Example
"\test\" means to look for \test\
Using triple double quotes
Triple double quotes ("""<text>""") include the following functionality:
- Enables regex-style pattern matching and escape sequence interpretation.
- Escape sequences, such as
\n(new line) or\t(tab), are processed. - Wildcards using the asterisk (*) are processed as XQL wildcards, and match any sequence of characters.
Example
"""\\test\\""" means to look for \test\
Understanding the results:
- The double backslashes (
\\) at the beginning becomes a single backlash (\) as it's processed as an escaped backslash. testis interpreted as literal.- The double backslashes (
\\) at the end becomes a single backlash (\) as it's processed as an escaped backslash.
Query example using alter
When using the alter stage, you can use both single ("<text>") and triple ("""<text>""") double quotes when specifying string values. The difference lies in how special characters and pattern matching are interpreted.
Example
config timeframe = 10y | dataset = test_dataset | limit 1 | alter test = "\test\" | alter test_triple = """\\\test\\""" | fields test, test_triple
Understanding the query and results
testfield using single double quotes:- The field value is
"\test\". - The output results display
\test\exactly as defined in the field value as no escape sequences are processed.
- The field value is
test_triplefield using triple double quotes:- The field value is
"""\\\test\\""". - The output results display
\ est\(with a tab between\and the textest) because:\\: First two backslashes become single backslash\.\t: Interpreted as a tab.est: Is interpreted as literal.\\: Last two backslashes become single backslash\.
- The field value is
Query example using filter
When using the filter stage, you can use both single ("<text>") and triple ("""<text>""") double quotes when specifying string values. The difference lies in how special characters and pattern matching are interpreted.
The examples provided are based on the following data table for a dataset called test_dataset:
| _TIME | TEST |
|---|---|
| Mar 26th 2022 19:26:07 | 12\t3 |
| May 7th 2023 15:16:00 | 12 3 |
| Jun 8th 2024 16:56:27 | 1233 |
| Mar 26th 2024 19:26:07 | 123 |
| Apr 5th 2024 11:21:02 | 12\t34563 |
| Apr 9th 2025 13:22:22 | 1233345 |
| May 9th 2025 13:22:22 | 12 35897 |
| May 30th 2025 21:45:02 | 116 |
Example 86.
config timeframe = 10y | dataset = test_dataset | filter test = "12\t3*" | fields test
Output results table:
| _TIME | TEST |
|---|---|
| Mar 26th 2022 19:26:07 | 12\t3 |
| Apr 5th 2024 11:21:02 | 12\t34563 |
Explanation of results:
The asterisk (*) in "12\t3*" means to process the string field as an XQL wildcard by matching any sequence of characters that begins with 12\t3. In addition, the \t characters are not processed as an escape character, but as plain characters.
Example 87.
config timeframe = 10y | dataset = test_dataset | filter test = """12\t3*""" | fields test
Output results table:
| _TIME | TEST |
|---|---|
| May 7th 2023 15:16:00 | 12 3 |
| May 9th 2025 13:22:22 | 12 35897 |
Explanation of results:
The \t in """12\t3*""" is processed as a tab escape character. The asterisk (*) in """12\t3*""" means to process the string field as an XQL wildcard by matching any sequence of characters that begins with 12<tab>3.
Build XQL queries
To support investigation and analysis, you can search your data by creating queries in the Query Builder. You can create queries with the Cortex Query Language (XQL) or by using the Query Builder templates.
If you have the Cortex Agentic Assistant, you can use natural language prompts to create and run XQL queries within the chat interface. For more information, see Create and run XQL queries with Agentic Assistant chat.
About the Query Builder
The Query Builder aids in the detection of threats by allowing you to search for indicators of compromise and suspicious patterns within data sources. It assists in expanding case investigations by identifying related events and entities, such as activities associated with specific user accounts or network lateral movement. In addition, the Query Builder enables data analytics on suspected threats, helping organizations analyze large volumes of data to identify trends, anomalies, and correlations that may indicate potential security issues.
To support investigation and analysis, you can search all of the data ingested by Cortex XSIAM by creating queries in the Query Builder. You can create queries that investigate leads, expose the root cause of an issue, perform damage assessment, and hunt for threats from your data sources.
Cortex XSIAM provides different options in the Query Builder for creating queries:
-
XQL (Build your own queries)
You can use the Cortex Query Language (XQL) to build complex and flexible queries that search specific datasets or presets, or the entire Cortex Data Model (XDM). With XQL Search, you create queries based on stages, functions, and operators. To help you build your queries, Cortex XSIAM provides tools in the interface that provide suggestions as you type, or you can look up predefined queries, common stages and examples. For more information, see How to build XQL queries.
Note
Schema changes to datasets may not be reflected in the autocomplete suggestions and definitions as you type in real time the XQL query, and can appear with a slight delay.
Tip
When creating XQL queries, you can:
- Use the up and down arrow keys to navigate through the auto-suggestion commands and definitions.
- Select an auto-suggestion command by pressing either the Enter or Tab key.
- Press Shift+Enter to add a new line, and easily ignore the auto-suggestion output.
- Close the auto-suggestion output by pressing the Esc key.
-
Query Builder templates (No XQL knowledge required)
You can use the Query Builder templates to access your data without prior XQL knowledge. The templates include predefined filtering fields and key fieldsets, and can include any field from the XDM schema.
As the templates are also based on XQL, you can also translate your template queries into XQL. With this flexibility, you can enrich the basic queries created by templates for more detailed investigation, or use the templates as a starting point for creating complex queries with full XQL functionality. For more information, see Query Builder templates.
-
Graph Search to build queries to search assets, findings, and their contextual data. For more information, see How to build Graph Search queries?.
Tip
If you prefer to use the Query Builder in Legacy mode, switch the toggle in the header. In Legacy mode, the Query Builder searches predefined datasets only. To search the full XDM Data Model, switch to New mode or select XQL Search.
How to build XQL queries
The Cortex Query Language (XQL) enables you to query data ingested into Cortex XSIAM for rigorous endpoint and network event analysis. To help you create an effective XQL query with the proper syntax, the query field in the user interface provides suggestions and definitions as you type.
| XQL forms queries in stages. Each stage performs a specific query operation and is separated by a pipe character ( | ). Queries require a dataset, or data source, to run against. You can either query the Cortex Data Model (XDM) or you can query specific datasets. In a dataset query, unless otherwise specified, the query runs against the xdr_data dataset, which contains all log information that Cortex XSIAM collects from all Cortex product agents, including EDR data, and PAN NGFW data. In XDM queries, you must specify the dataset mapped to the XDM that you want to run your query against. |
Forensic datasets are not included by default in XQL query results, unless the dataset query is explicitly defined to use a forensic dataset.
Which datasets are mapped to XDM?
The Cortex Query Language (XQL) supports a single Cortex Data Model (XDM), which is a normalized data structure. Datasets are mapped to the XDM in 3 different ways:
- Automatic default mappings, including the following:
- The
xdr_datadataset is automatically mapped to the XDM with some data mapping exceptions. - Next-Generation Firewall (NGFW) network log data are mapped to the XDM from the following datasets:
panw_ngfw_traffic_rawpanw_ngfw_threat_rawpanw_ngfw_url_rawpanw_ngfw_filedata_rawpanw_ngfw_globalprotect_rawpanw_ngfw_hipmatch_raw
- The
- Out-of-the-box mappings of the datasets as part of the Data Model Rules via the Marketplace. For more information, see Cortex Marketplace.
- You can create your own mappings by creating your own Data Model Rules. For more information, see Create Data Model Rules.
For more information on the XDM Schema, specifically the fields, fieldsets, fields designated as ENUMS (CONST), and aliases, see the Cortex XSIAM Data Model Schema.
XDM query syntax
The basic syntax structure for querying the Cortex Data Model (XDM) is either:
datamodel dataset in (<dataset_name>,...) …
| <STAGE> ...
| <STAGE> ...
| <STAGE> ...
or
datamodel dataset = <dataset_name> … | <STAGE> ... | <STAGE> ... | <STAGE> ...
In a query using the datamodel command, a query runs against the specified datasets, which contain log information ingested by Cortex XSIAM. You can also install Marketplace Content Packs, or map an ingested dataset into the XDM, to query additional datasets.
Adding a wildcard suffix (*) is supported in the <dataset_name>, which matches all datasets that are mapped to the data model and begin with the specified text. For example, datamodel dataset = xdr* or datamodel dataset in (xdr*).
When querying the XDM, fields that are not mapped to the XDM are accessible by <dataset>.<field>. They can be used at any stage of a datamodel query.
When creating XDM queries, auto-suggestions are available, according to the existing XDM fields.
Dataset query syntax
In a dataset query, unless otherwise specified, the query runs against the xdr_data dataset, which contains all log information that Cortex XSIAM collects from all Cortex product agents, including EDR data, and PAN NGFW data. In a dataset query, if you are running your query against a dataset that has been set as default, there is no need to specify a dataset. Otherwise, specify a dataset in your query. The Dataset Queries lists the available datasets, depending on system configuration.
- Users with different dataset permissions can receive different results for the same XQL query.
- An administrator or a user with a predefined user role can create and view queries built with an unknown dataset that currently does not exist in Cortex XSIAM. All other users can only create and view queries built with an existing dataset.
- When you have more than one dataset or lookup, you can change your default dataset by navigating to Settings → Configurations → Data Management → Dataset Management, right-click on the appropriate dataset, and select Set as default. For more information about setting default datasets, see Dataset management.
The basic syntax structure for querying datasets that are not mapped to the XDM is:
dataset = <dataset name> | <stage1> ... | <stage2> ... | <stage3> ...
or
dataset in (<dataset name>)
| <stage1> ...
| <stage2> ...
| <stage3> ...
You can specify a dataset using one of the following formats, which is based on the data retention offerings available in Cortex XSIAM.
-
Hot Storage queries use the format
dataset = <dataset name>. This is the default option.Example 88.
dataset = xdr_data
-
Cold Storage queries use the format
cold_dataset = <dataset name>.cold_dataset = xdr_data
You can build a query that investigates data in both a cold dataset and a hot dataset in the same query. In addition, as the hot storage dataset format is the default option and represents the fully searchable storage, this format is used throughout this guide for investigation and threat hunting. For more information on hot and cold storage, see Dataset management.
When using the hot storage default format, this returns every xdr_data record contained in your Cortex XSIAM instance over the time range that you provide to the Query Builder user interface. This can be a large amount of data, which may take a long time to retrieve. You can use a limit stage to specify how many records you want to retrieve.
There is no practical limit to the number of stages that you can specify. See Stages for information on all the supported stages.
In the xdr_data dataset, every user field included in the raw data for network, authentication, and login events has an equivalent normalized user field associated with it that displays the user information in the following standardized format:
<company domain>\<username>
For example, the login_data field has the login_data_dst_normalized_user field to display the content in the standardized format. To ensure the most accurate results, we recommend that you use these normalized_user fields when building your queries.
Additional components
XQL queries can contain different components, such as functions and stages, depending on the type of query you want to build. For a complete list of the syntax options available with example queries, see Stages and Functions.
Get started with XQL queries
Before you begin running XQL queries, consider the following information:
-
Use the interface to help you build queries
Cortex XSIAM offers features in the XQL search interface to help you build queries. For more information, see Useful XQL user interface features.
-
Mitigate long-running queries
Querying the XDM enables searching of Cortex XSIAM's extensive data. We recommend that you use filters to streamline your queries. For more information, see XQL Query best practices.
-
Understand query defaults and limitations
Before you run a query, review this list to better understand query behavior and results. For more information, see Expected results when querying fields.
-
Translate Splunk queries to XQL
If you have existing Splunk queries, you can translate them to XQL. For more information, see Translate to XQL.
Tip
If you are new to creating queries, you can also try our simple search templates, which can help you get started in understanding how queries work. See Query Builder templates.
Useful XQL user interface features
The user interface contains several useful features for querying data and viewing results:
-
XQL query: Define your query parameters. The field provides suggestions and definitions as you type.
Dataset schema changes can take time to appear in autocomplete suggestions.
Tip
When creating XQL queries, you can:
- Use the arrow keys to navigate suggestions and definitions.
- Press Enter or Tab to select a suggestion.
- Press Shift+Enter for a new line, or Esc to close suggestions.
- Translate to XQL: Converts Splunk queries to XQL syntax. Enable this option to display SPL query and XQL query fields.
- Query Results: View, filter, and visualize results after you run a query.
- XQL Helper: Describes common stage commands and provides examples.
- Query Library: Contains predefined queries. You can save, manage, and share personal queries. For more information, see Manage your personal query library.
- Schema: Lists each result-set field, its data type, descriptive text, and dataset.
- For dataset queries, it lists fields from every involved dataset.
- For data model queries, it lists data model fields.
XQL Query best practices
Cortex XSIAM includes built-in mechanisms for mitigating long-running queries. These include default limits for allowed issues and returned rows. XDM queries search only specified mapped datasets. The following suggestions help streamline your queries:
-
Add a smaller limit by using a
limitstage.The default result limit is 1,000 for XDM and dataset queries. This applies when no limit is stated. It applies to basic queries with no stages except
fields. It does not apply to widgets, Correlation Rules, public APIs, saved queries, or scheduled queries. Those allow up to 1,000,000 results. Legacy templates allow 10,000 results.datamodel dataset = microsoft_windows_raw | fields *host* | limit 100
- Use a small Timeframe. Select Relative time and define Last 30 Minutes where possible.
- Use filters that exclude data, along with other applicable filters.
- Select only the fields required in the results.
Expected results when querying fields
The following are returned when querying fields:
- If specific fields are stated in the fields stage, those exact fields will be returned.
- If no fields are stated in the query, the
xdm_corefieldset will be returned. - Unmapped fields are treated as NULL. An unmapped field is a
xdmfield that hasn't been mapped from the relevant datasets using a Data Model Rule. - By default, the
_timesystem field will be added to all data model queries. Yet, the_timesystem field will not be added to queries that contain thecompstage. - For dataset queries, all current system fields will be returned, even if they are not stated in the query.
- For UNION between XDM and dataset, each part of the UNION will return its own fields.
- Each new column in the result set created by the alter stage will be added as the last column. You can specify a different column order by modifying the field order in the fields stage of the query.
- Each new column in the result set created by the comp stage will be added as the last column. Other fields that are not in the
group by / calculatedcolumn will be removed from the result set, including the core fields and_timesystem field. - When no limit is explicitly stated in a
datamodelquery, a maximum of 1000 results are returned (default). When this limit is applied to results using the limit stage, it will be indicated in the user interface.
Create XQL query
Review the following topics:
Build Cortex Query Language (XQL) queries to analyze raw log data stored in Cortex XSIAM. You can query the Cortex Data Model (XDM) or datasets using specific syntax.
How to create a XDM query
- From Cortex AgentiX, select Investigation & Response → Search → Query Builder.
- Click XQL.
-
(Optional) Change the default time period against which to run your query from the time picker at the top right of the window. You can select the required time period from any of the following options available:
- Preset time ranges easily available to select from, such as 24 hours and 30 days.
- Recently used selections from your previous queries.
- Relative time: Define the time frame as the last <number> minutes, days, or hours by setting the number.
- Calendar: Create a customized time period by selecting the date range from the calendar and the specific Start Time and End Time.
Note
- Whenever the time period is changed in the query window, the
config timeframeis automatically set to the time period defined for the entire query, including queries that are part of thejoinstage. Yet, this won't be visible as part of the query. Only if you manually type in theconfig timeframewill this be seen in the query. - These time picker options are available in XQL queries when using the Query Builder, XQL Widgets, and when defining XQL Widgets in Reports and Dashboards.
- (Optional) To translate Splunk queries to XQL queries, enable Translate to XQL. If you choose to use this feature, enter your Splunk query in the Splunk field, click the arrow icon to convert to XQL, and then go to Step 6.
-
Create your query by typing in the query field. Relevant commands, their definitions, and operators are suggested as you type.
Tip
When creating XQL queries, you can:
- Use the up and down arrow keys to navigate through the auto-suggestion command suggestions and definitions.
- Select an auto-suggestion command by pressing either the Enter or Tab key.
- Press Shift+Enter to add a new line, and easily ignore the auto-suggestion output.
- Close the auto-suggestion output by pressing the Esc key.
-
Specify the datasets to run your query against by typing either
datamodel dataset = <dataset name>...ordatamodel dataset in (<dataset name>,...).... For example:datamodel dataset in (amazon_aws_raw)
Note
While
datamodel dataset=*is supported in the query, we recommend that you specify specific datasets for quicker and more efficient results. - Press Enter, and then type the pipe character (
|). Select a stage, and complete the stage syntax using the suggested options. -
Continue adding stages until your query is complete. For example:
datamodel dataset in (amazon_aws_raw) | filter xdm.source.ipv4 = "10.9.165.1" | fields xdm.source.ipv4, xdm.source.port | limit 100
- Choose when to run your query:
- Run the query immediately.
- Run the query by the specified date and time, or on a specific date, by selecting the calendar icon ().
- (Optional) The Save As options save your query for future use:
- Correlation Rule: When compatible, saves the query as a Correlation Rule. For more information, see What's a correlation rule?.
- Query to Library: Saves the query to your personal query library. For more information, see Manage your personal query library.
- Widget to Library: For more information, see Create custom XQL widgets.
Tip
While the query is running, you can navigate away from the page. A notification is sent when the query has finished. You can also Cancel the query or run a new query, where you have the option to Run only new query (cancel previous) or Run both queries.
How to create a dataset query
- From Cortex XSIAM, select Investigation & Response → Search → Query Builder.
- Click XQL.
-
(Optional) Change the default time period against which to run your query from the time picker at the top right of the window. You can select the required Timeframe from any of the following options available:
- Preset time ranges easily available to select from, such as 24 hours and 30 days.
- Recently used selections from your previous queries.
- Relative time: Define the time frame as the last <number> minutes, days, or hours by setting the number.
- Calendar: Create a customized time period by selecting the date range from the calendar and the specific Start Time and End Time.
Note
- Whenever the time period is changed in the query window, the
config timeframeis automatically set to the time period defined for the entire query, including queries that are part of thejoinstage. Yet, this won't be visible as part of the query. Only if you manually type in theconfig timeframewill this be seen in the query. - These time picker options are available in XQL queries when using the Query Builder, XQL Widgets, and when defining XQL Widgets in Reports and Dashboards.
- (Optional) To translate Splunk queries to XQL queries, enable Translate to XQL. If you choose to use this feature, enter your Splunk query in the Splunk field, click the arrow icon () to convert to XQL, and then go to Step 6.
-
Create your query by typing in the query field. Relevant commands, their definitions, and operators are suggested as you type.
Tip
When creating XQL queries, you can:
- Use the up and down arrow keys to navigate through the auto-suggestion command suggestions and definitions.
- Select an auto-suggestion command by pressing either the Enter or Tab key.
- Press Shift+Enter to add a new line, and easily ignore the auto-suggestion output.
- Close the auto-suggestion output by pressing the Esc key.
-
(Optional) Specify a dataset.
You only need to specify a dataset if you are running your query against a dataset that you have not set as default. Otherwise, the query runs against the
xdr_datadataset. For more information, see How to build XQL queries.dataset = xdr_data
- Press Enter, and then type the pipe character (
|). Select a command, and complete the command using the suggested options. -
Continue adding stages until your query is complete.
dataset = xdr_data | filter agent_os_type = ENUM.AGENT_OS_MAC | limit 250
- Choose when to run your query:
- Run the query immediately.
- Run the query by the specified date and time, or on a specific date, by selecting the calendar icon ().
- (Optional) The Save As options save your query for future use:
- BIOC Rule: When compatible, saves the query as a BIOC rule. The XQL query must contain a filter for the event_type field.
- Correlation Rule: When compatible, saves the query as a Correlation Rule. For more information, see What's a correlation rule?.
- Query to Library: Saves the query to your personal query library. For more information, see Manage your personal query library.
- Widget to Library: For more information, see Create custom XQL widgets.
Tip
While the query is running, you can navigate away from the page. A notification is sent when the query has finished. You can also Cancel the query or run a new query, where you have the option to Run only new query (cancel previous) or Run both queries.
Review XQL query results
Review the following topics:
The results of a Cortex Query Language (XQL) query are displayed in the Query Results tab.
Note
It's also possible to graph the results displayed. For more information, see Graph query results.
Real-time query results
Cortex XSIAM displays partial results for queries run in the Query Builder as they are received, subject to the limitations below. In a long-running query, viewing the initial findings enables you to refine, validate, or stop the query.
The partial results are displayed only in the Table tab. The results are added to the table as they are received in real time. The incremental query results aren't ordered, so they may not be in sequence.
Limitations
- Real-time query results are available only in the Query Builder and in free text query.
- Real-time results are displayed only for queries run on hot datasets.
- The Sort option is available only after all the data is retrieved.
- When you formulate complex queries, the results will be displayed when the query has finished running completely, and not in real time. Some of the clauses that are included in this restriction are:
- JOIN - incremental results are supported only when the secondary dataset is smaller in size
- SORT
- COMP
- WINDOWCOMP
- TOP
Note
Results are received incrementally for the first 100K records, or up to 100MB worth of records, whichever comes first. After that, the next update is when the query has finished running completely.
Understanding the options available to investigate results
Use the following options in the Query Results tab to investigate your query results:
| Option | Use |
|---|---|
| Table tab | <p>Displays results in rows and columns according to the entity fields. Columns can be filtered, using their filter icons.</p><p>More options ( ) displays table layout options, which are divided into different sections:</p><ul><li>In the Appearance section, you can Show line breaks for any text field in the Query Results. By default, the text in these fields are wrapped unless the Show line breaks option is selected. In addition, you can change the way rows and columns are displayed.</li><li><p>In the Log Format section, you can change the way that logs are displayed:</p><ul><li>RAW: Raw format of the entity in the database.</li><li>JSON: Condensed JSON format with key value distinctions. NULL values are not displayed.</li><li>TREE: Dynamic view of the JSON hierarchy with the option to collapse and expand the different hierarchies.</li></ul></li><li>In the Search column section, you can find a specific column; enable or disable display of columns using the checkboxes.</li></ul><p>Show and hide rows according to a specific field in a specific event: select a cell, right-click it, and then select either Show rows with … or Hide rows with …</p> ) displays table layout options, which are divided into different sections:</p><ul><li>In the Appearance section, you can Show line breaks for any text field in the Query Results. By default, the text in these fields are wrapped unless the Show line breaks option is selected. In addition, you can change the way rows and columns are displayed.</li><li><p>In the Log Format section, you can change the way that logs are displayed:</p><ul><li>RAW: Raw format of the entity in the database.</li><li>JSON: Condensed JSON format with key value distinctions. NULL values are not displayed.</li><li>TREE: Dynamic view of the JSON hierarchy with the option to collapse and expand the different hierarchies.</li></ul></li><li>In the Search column section, you can find a specific column; enable or disable display of columns using the checkboxes.</li></ul><p>Show and hide rows according to a specific field in a specific event: select a cell, right-click it, and then select either Show rows with … or Hide rows with …</p> |
| Graph tab | Use the Chart Editor to visualize the query results. |
| Advanced tab | <p>Displays results in a table format which aggregates the entity fields into one column. You can change the layout, decide whether to Show line breaks for any text field in the results table, and change the log format from the menu.</p><p>Select Show more to pivot an Expanded View of the event results that include NULL values. You can toggle between the JSON and Tree views, search, and Copy to clipboard.</p> |
| Export to File | <p>Exports the results to a TSV (tab-separated values) file.</p><ul><li>More options () works in a similar way to how it works on the Table tab.</li><li>Show more in the bottom left corner of each row opens the Expanded View of the event results that also include NULL values. Here, you can toggle between the JSON and Tree views, search, and Copy to clipboard.</li><li><p>Log format options change the way that logs are displayed:</p><ul><li>RAW: Raw format of the entity in the database.</li><li>JSON: Condensed JSON format with key value distinctions. NULL values are not displayed.</li><li>TREE: Dynamic view of the JSON hierarchy with the option to collapse and expand the different hierarchies.</li></ul></li></ul> |
| Refresh | Refreshes the query results. |
| Free text search | Searches the query results for text that you specify in the free text search. Click the Free text search icon to reveal or hide the free text search field. |
| Filter | <p>Enables you to filter a particular field in the interface that is displayed to specify your filter criteria.</p><p>For integer, boolean, and timestamp (such as _time) fields, we recommend that you use the Filter instead of the Free text search, in order to retrieve the most accurate query results.</p> |
| Fields menu | <p>Filters query results. To quickly set a filter, Cortex XSIAM displays the top ten results from which you can choose to build your filter. This option is only available in the Table and Advanced tabs,</p><p>From within the Fields menu, click on any field (excluding JSON and array fields) to see a histogram of all the values found in the result set for that field. This histogram includes:</p><ul><li>A count of the total number of times a value was found in the result set.</li><li>The value's frequency as a percentage of the total number of values found for the field.</li><li>A bar chart showing the value's frequency.</li></ul><div data-gb-custom-block data-tag="hint" data-style="info" class="hint hint-info"><p>Note</p><p>In order for Cortex XSIAM to provide a histogram for a field, the field must not contain an array or a JSON object.</p></div> |
Available options for saving results
The Save As options save your query for future use:
- Correlation Rule: When compatible, saves the query as a Correlation Rule. For more information, see What's a correlation rule?.
- Query to Library: Saves the query to your personal query library. For more information, see personal query library.
- Widget to Library
Investigating results in the Causality View or Timeline View
You can continue investigating the query results in the Causality View or Timeline by right-clicking the event and selecting the desired view. This option is available for the following types of events:
- Process (except for those with an event sub-type of termination)
- Network
- File
- Registry
- Injection
- Load image
- System calls
- Event logs for Windows
- System authentication logs for Linux
For network stories, you can pivot to the Causality View only. For cloud Cortex XSIAM events and Cloud Audit Logs, you can only pivot to the Cloud Causality View, while for software-as-a-service (SaaS) related issues for audit stories, such as Office 365 audit logs and normalized logs, you can only pivot to the SaaS Causality View.
Add file path to Malware Profile allowed list
Add a file path to your existing Malware Profile allowed list by right-clicking a <path> field, such as target_process_path, and selecting Add <path type> to malware profile allow list.
Translate to XQL
To help you easily convert your existing Splunk queries to the Cortex Query Language (XQL) syntax, Cortex XSIAM includes a toggle called Translate to XQL in the query field in the user interface. When building your XQL query and this option is selected, both a SPL query field and XQL query field are displayed, so you can easily add a Splunk query, which is converted to XQL in the XQL query field. This option is disabled by default, so only the XQL query field is displayed.
Important
This feature is still in a Beta state and you will find that not all Splunk queries can be converted to XQL. This feature will be improved upon in the upcoming releases to support greater Splunk query translations to XQL.
Supported functions in Splunk
The following table details the supported functions in Splunk that can be converted to XQL in Cortex XSIAM with an example of a Splunk query and the resulting XQL query. In each of these examples, the xdr_data dataset is used.
| Splunk Function/Stage | Splunk Query Example | Resulting XQL Query Example |
| --------------------------- | ---------------------------------------------------------------------------------------------------------------------------------- | --------------------------------------------------------------------------------------------------------------- |
| avg | `index=xdr_data | stats avg(dst_association_strength)` |
| bin | `index = xdr_data | bin _time span=5m` |
| coalesce | `index= xdr_data | eval product_or_vendor_not_null=coalesce(_product, _vendor )` |
| count | `index=xdr_data | stats count(_product) BY _time` |
| ctime | `index=xdr_data | convert ctime(field) as field` |
| earliest | index = xdr_data earliest=24d | `dataset in (xdr_data) |
| eval | `index=xdr_data | eval field = "test"` |
| fillnull | `index=xdr_data | fillnull value = "missing ipv6" agent_ip_addresses_v6` |
| floor | `index=xdr_data | eval floor_test = floor(1.9)` |
| iplocation | `index=xdr_data | inputlookup append=true my_lookup.csv` |
| iplocation | `index = xdr_data | inputlookup agent_ip_addresses` |
| isnotnull | `index=xdr_data | eval x = isnotnull(agent_hostname)` |
| isnull | `index=xdr_data | eval x = isnull(agent_hostname)` |
| json_extract | `index= xdr_data | eval London=json_extract(dfe_labels,"dfe_labels{0}")` |
| join | join agent_hostname [index = xdr_data] | join type=left conflict_strategy=right (dataset in (xdr_data)) as inner agent_hostname = inner.agent_hostname |
| latest | index = xdr_data latest=-24d | `dataset in (xdr_data) |
| len | `index = xdr_data | where uri != null |
| ltrim(<str>,<trim_chars>) | `index=xdr_data | eval trimed_agent=ltrim("agent_hostname", "agent_")` |
| lower | `index = xdr_data | eval field = lower("TEST")` |
| max | `index =xdr_data | stats max(action_file_size) by _product` |
| md5 | `index=xdr_data | eval md5_test = md5("test")` |
| median | `index = xdr_data | stats median(actor_process_file_size) by _time` |
| min | `index =xdr_data | stats min(action_file_size) by _product` |
| mvcount | `index = xdr_data | where http_data != null |
| mvdedup | `index = xdr_data | eval s=mvdedup(action_app_id_transitions)` |
| mvexpand | `index = xdr_data | mvexpand dfe_labels limit = 100` |
| mvfilter | `index = xdr_data | eval x = mvfilter(isnull(dfe_labels))` |
| mvindex | `index=xdr_data | eval field = mvindex(action_app_id_transitions, 0)` |
| mvjoin | `index=xdr_data | eval n=mvjoin(action_app_id_transitions, ";")` |
| pow | `index=xdr_data | eval pow_test = pow(2, 3)` |
| relative_time(X,Y) | <ul><li>index ="xdr_data"</li></ul> | where \_time > relative\_time(now(),"-7d@d")</li><li>index ="xdr\_data" |
| replace | \index= xdr_data | eval description = replace(agent_hostname,"("."NEW")` |
| rex | `index=xdr_data action_local_ip!="0.0.0.0" | rex field=action_local_ip "(?<src_ip>\d+.\d+.\d+.48)" |
| round | `index=xdr_data | eval round_num = round(3.5)` |
| rtrim | `index=xdr_data | eval trimed_hostname=rtrim("agent_hostname", "hostname")` |
| search | `index = xdr_data | eval ip="192.0.2.56" |
| sha256 | `index = xdr_data | eval sha256_test = sha256("test")` |
| sort (ascending order) | `index = xdr_data | sort action_file_size` |
| sort (descending order) | `index = xdr_data | sort -action_file_size` |
| spath | `index = xdr_data | spath output=myfield input=action_network_http path=headers.User-Agent` |
| split | `index = xdr_data | where mac != null |
| stats | `index=xdr_data | stats count(event_type) by _time` |
| stats dc | `index = xdr_data | stats dc(_product) BY _time` |
| strcat | `index=xdr_data | strcat story_id "/" http_req_before_method comboIP` |
| sum | `index=xdr_data | where action_file_size != null |
| table | `index = xdr_data | table _time, agent_hostname, agent_ip_addresses, _product` |
| tonumber | `index=xdr_data | eval tonumber_test = tonumber("90210")` |
| top | <p>The following Splunk functions can be translated to XQL:</p><ul><li><p>limit</p><p>index = xdr_data</p></li></ul> | where action\_app\_id\_risk > 0 |
| upper | \index=xdr_data | eval field = upper("test")` |
| var | `index=xdr_data | stats var (event_type) by _time` |
How to translate a Splunk query to XQL syntax
- Select Investigation & Response → Search → Query Builder → XQL.
- Toggle to Translate to XQL, where both a SPL query field and XQL query field are displayed.
- Add your Splunk query to the SPL query field.
-
Click the arrow (
).The XQL query field displays the equivalent Splunk query using the XQL syntax.
You can now decide what to do with this query based on the instructions explained in Create XQL query.
Graph query results
To help you better understand your Cortex Query Language (XQL) query results and share your insights with others, Cortex XSIAM enables you to generate graphs and outputs of your query data directly from query results page.
Tip
Alternatively, you can use the Cortex Agentic Assistant to generate custom graphs and charts using natural language prompts. By simply prompting the agent, it will build and execute the query, returning the visual representation. For more information, see Use natural language to query and visualize your data.
- Select Investigation & Response → Search → Query Builder → XQL.
-
Run an XQL query.
Example 93.
Enter the following query:
dataset = xdr_data | fields action_total_upload, _time | limit 10
The query returns the
action_total_upload, a number field, and_time, a string field, for up to 10 results. - In the Query Results section, to graph the results either:
Use Chart Editor
Navigate to Query Results → Chart Editor () to manually build and view the graph using the selected graph parameters:
- Main
-
Graph Type: Type of graphs and output options available: Area, Bubble, Column, Funnel, Gauge, Line, Map, Pie, Scatter, Single Value, or Word Cloud.
Note
To display the result of as a time duration, choose the graph type Single Value and enable Show as Time. You can then select the Time Unit (millisecond, second, minute, or hour) and the Display format.
- Subtype and Layout: Depending on the selected type of graph, choose from the available display options.
- Header: Title your graph.
- Show Callouts: Display numeric values on the graph.
-
- Data
- X-axis: Select a field with a string value.
- Y-axis: Select a field with a numeric value.
- (Optional) Series: For an area, bubble, column, line, map, or scatter chart, you can specify a field (column) to group chart results based on y-axis values. This option is only displayed when one of the supported graph types are selected, and a single y-axis value is selected.
- Depending on the selected type of graph, customize the Color, Font, and Legend.
Use XQL query
Enter the visualization parameters in the XQL query section.
You can express any chart preferences in XQL. This is helpful when you want to save your chart preferences in a query and generate a chart every time that you run it. To define the parameters, either:
-
Define the following query:\
Exampledataset = xdr_data | view graph type = column header = "Test 1" xaxis = _time yaxis = action_total_upload series = _vendor
-
Select ADD TO QUERY to insert your chart preferences into the query itself.
-
(Optional) Create a custom widget.
To easily track your query results, you can create custom widgets based on the query results. The custom widgets you create can be used in your custom dashboards and reports. For more information, see Create custom XQL widgets.
Select Save to Widget Library to pivot to the Widget Library and generate a custom widget based on the query results.
Query Builder templates
You can use the Query Builder templates to create effective queries without using the Cortex Query Language (XQL).
From the Query Builder, you can select the following templates:
- Basic: Search by IP address, host name, user name, and domain.
- Free text: Search for a free text string.
The templates are set up with predefined filtering fields and fieldsets that are specific to the template type. You can specify values for the default fields and add any other required fields to refine and adapt your search. The Query Builder templates support any filtering fields from the Cortex Data Model (XDM) schema.
Tip
To get started with queries, you can run an empty template query with no values specified. The query results will include all of the fields in the template specific fieldset. Based on the query results, you can run subsequent queries to narrow down your search.
Get started with Query Builder templates
Before you start running queries with Query Builder templates, consider the following information:
- Learn about the templates: Although the templates don’t require XQL knowledge, they do require knowledge of operators and other factors. Understanding how the templates work will help you to build effective queries. For more information, see Considerations for using Query Builder templates.
- Look up field and alias descriptions: The templates are based on the fields and aliases in the Cortex Data Model (XDM). If you want more information about a field or alias, see the Cortex XSIAM Data Model Schema Guide.
- Try out our examples: To help you feel confident with Query Builder templates, start by following our step-by-step examples and tailor them for your environment. For more information, see Query Builder template examples.
Considerations for using Query Builder templates
The following sections provide information and considerations for using Query Builder templates.
The following sections provide information and considerations for using Query Builder templates.
General considerations
The following general considerations apply to Query Builder templates:
-
The templates run on the following datasets by default:
- Basic, Identity, Endpoint, and Network templates:
xdr_data - Cloud template:
cloud_audit_logs
It is also possible to run the templates on all datasets.
- Basic, Identity, Endpoint, and Network templates:
- The query uses an AND operator between the filtering fields.
- Separate multiple values with pipes and do not add spaces between the value and the pipe.
- Some of the filtering fields are aliases and therefore search all fields that are associated with the alias.
- Fields with dropdown options support ENUMs and free text values.
- In IP address fields, you can also specify subnets.
- The asterisk (
*) wildcard is supported, except in subnet values. - You cannot remove the predefined fields, but you can leave them blank.
- When filtering integer and float fields, you can only specify two operators from the four available options.
= (equal to) and != (not equal to) operators
Filtering fields support the = (equal to) and != (not equal to) operators, and you can specify both operators for the same field. The following conditions apply to these operators:
- If you specify multiple values for a field with the
=operator, the OR operator is applied. For example,User Name = aaa|bbbsearches for instances of user name equal to aaa OR bbb. - If you specify multiple values for a field with the
!=operator, the AND operator is applied. For example,User Name != aaa|bbbsearches for instances of user name not equal to aaa AND bbb. - If you specify both operators (
=and!=) for the same field, the AND operator is applied. For example,COUNTRY = Empty values AND COUNTRY != USA.
>= (greater than and equal) and <= (less than and equal) operators
Filtering fields support the >= (greater than and equal) and <= (less than and equal) operators, and you can specify both operators for the same field. The following conditions apply to these operators:
- Cortex XSIAM supports using these operators for integer and float fields.
- Empty values are not supported with these operators.
Include and exclude empty values
You can use the Empty values field to include or exclude fields with empty values and strings. In the search results, some fields might return empty values. This occurs if no data is mapped to a field. The following conditions apply to the Empty values field:
-
If you specify = and select Empty values, the query includes fields with empty values with an OR operator.
For example,
_vendor = aaa OR _vendor = Empty valuessearches the_vendorfield for any instances of aaa or empty values. -
If you specify != and select Empty values, the query excludes fields with empty values with an AND operator.
For example,
_vendor != aaa AND _vendor != Empty valuessearches the_vendorfield for values that are not equal to aaa AND do not contain empty values. -
If you specify != and select Empty values for an alias, you might not receive any results. The query searches all of the fields associated with the alias for non-empty values. If any of the associated fields contain empty values, no results are returned.
For example,
User Name != aaa AND User Name != Empty valuessearches the User Name alias fields for values that are not equal to aaa AND empty values. If the query finds either aaa or empty values in any of the alias fields, no results are returned.
Create a query from a template
You can use the Query Builder templates to create effective queries without using the Cortex Query Language (XQL).
Review the following topics:
- Query Builder templates
- Get started with Query Builder templates
- Considerations for using Query Builder templates
How to create a query from a Query Builder template
- Select Investigation & Response → Search → Query Builder.
-
In the Query Builder, select the template that you want to use.
If you want to use the Free Text Search template, see Run a free text query.
- (Optional) Change the Run on option (upper-right corner) that controls the datasets configured to run with the template. The templates are automatically configured to run on default datasets or you can choose to run them on all datasets. The templates run on the following datasets by default:
- Basic, Identity, Endpoint, and Network templates:
xdr_data - Cloud template:
cloud_audit_logs
- Basic, Identity, Endpoint, and Network templates:
- Enter values for any of the predefined fields and specify whether to include Empty values in the query.
Guidelines
- The query uses an AND operator between the filtering fields.
- Separate multiple values with pipes and do not add spaces between the value and the pipe.
- Some of the filtering fields are aliases and therefore search all fields that are associated with the alias.
- You can run an empty template with no values specified. The query results will show data from all of the fields in the template specific fieldset.
For more information about using the filtering fields, operators, and including Empty values, see Considerations for using Query Builder templates.
5. (Optional) Click Add Field and select the additional filtering fields or aliases to include in the query."
Note
- Field names and aliases are listed without their prefix, for example xdm.SOURCE.USER.USERNAME is listed as SOURCE.USER.USERNAME and XDM_ALIAS.ipv4 is listed as ipv4.
- Fields that are already included in the query template are shown as grayed out.
- In the Identity and Network templates,
xdm.event.outcomeshows as grayed out. In these templates, the ACTION STATUS and CONNECTION STATUS fields are linked to thexdm.event.outcomeenum. Therefore, you can't duplicate this field in a query.
6. Click TIME and select a time frame for the query.
-
Click Run to start the query, or click Schedule to run the query at a specific time.
You can also click Continue in XQL to open the XQL Query Builder showing the defined XQL fields. In XQL you have the flexibility to add additional stages and functions that are not available in the Query Builder templates.
-
Review the Results.
The search is limited to 1,000 results. In the Fields column, you can see all of the fields that were included in the query in the following order: (1) _time, (2) the filtering fields that you defined, and (3) the fields from the template specific fieldset.
Note
This order might change if you include a filtering field that is listed in the fieldset. In that case, the field is taken out of the fieldset and ordered at the top of the list with the other filtering fields.
The query is also saved in the Query Center. In the Query Center, you can identify your query by filtering the Created By column and looking in the Query Description column. Queries created from a template are prefixed with the template name.
Example
-
The following query searches for instances of IP 3.3.3.3 with a source host name equal to host1 or host2. IP is an alias field; therefore, the query searches all fields associated with the alias.
IP ADDRESS = 3.3.3.3, SOURCE.HOST.OS = host1|host2
-
The following query searches for the event outcome success with an event duration value that is not equal to null:
EVENT.OUTCOME = XDM_CONST.OUTCOME_SUCCESS, EVENT.DURATION != Empty values
What to do next
- To edit or rerun the query, click Back to edit to review the template, or Continue in XQL to review the XQL.
- Practice running queries with Query Builder template examples.
Run a free text query
You can use the Free text template to query your datasets for free-text strings without building a Cortex Query Language (XQL) query. The template queries all of the raw datasets that are stored in your tenant and returns up to 1,000 results.
Note
The query in free-text search in the Query Templates page runs only on raw datasets. You can only scope your search using the search stage available in the XQL editor.\
Use the search stage in the XQL editor to use scoping to query free-text strings in specific datasets, normalized datasets, or all datasets in your tenant.
How to run a free text query
- Select Investigation & Response → Query Templates.
- Under General Search, select Free text.
- In the Text Contains field, type one or more strings. Separate multiple strings with pipes, which applies the OR operator.
-
Click TIME and select a time frame for the query.
Note
Free text search is limited to the last 90 days of data. Specifying a time frame outside of this limitation will cause the query to fail.
-
Click Run to start the query, or click Schedule to run the query at a specific time.
Free text search searches the relevant columns in each dataset. Relevant columns are subject to a change and can vary between datasets.
You can also click Continue in XQL to translate the query with the fields that you specified into XQL. In XQL you have the flexibility to add additional stages and functions that are not available in the Query Builder templates.
-
Review the results.
The searched string is highlighted in the results.
In the Fields column, you can see all of the fields in which the string was discovered. Fields are listed in the following order: (1)
_time, (2)_dataset, and (3) the fields in which the string was discovered, ordered by highest to lowest number of hits.In the
RAW_DATAcolumn, click Show more to see the specific row in the dataset in which the string was discovered.
What to do next
- To edit or rerun the query, click Back to edit to review the template in the Query Builder, or Continue in XQL to review the XQL.
- Practice running queries with Query Builder template examples.
Query Builder template examples
The following examples can help familiarize you with running queries.
Use the Identity template to search for information about a specific user
Goal: Search for information about users working on the system.
This example uses the Identity template, but you can apply it to any of the templates. In the example, we run multiple queries that narrow down our search results and find the required information we require.
Query 1: Search for information about all users
- Select Investigation & Response → Search → Query Builder.
- Select the Identity template.
-
Specify USER = * and do not select Empty values.
This searches for all users, and excludes empty values or strings from the results. The
USERfield is an alias so all associated fields are also searched. - Specify TIME → Last 7D.
- Click Run.
In the Results page, scroll through the table to find a value or string that you want to investigate further. If you are not receiving results, you can broaden the TIME to Last 30D.
In this example, the results returned information about USER66 in the XDM.SOURCE.USER.USERNAME column. To refine the search for information about this user, run another query.
Query 2: Search for information about a specific user
- Copy the term that you want to search, in this case USER66.
-
Click Back to edit.
The Identity template opens with the original search options.
- Click Add field and select SOURCE.USER.USERNAME.
- Specify SOURCE.USER.USERNAME = USER66 and do not select Empty values.
- Click Run.
The Results page provides more information about USER66.
Look through the results for anything you would like to investigate further. In this example, there is information about the operations performed by this user in the XDM.EVENT.OPERATION column. We can refine the search to see all FILE_REMOVE operations for USER66.
Query 3: Search for FILE_REMOVE operations for a specific user
- Click Back to edit.
- Click Add field and select EVENT.OPERATION.
- Specify EVENT.OPERATION = and select XDM_CONST.OPERATION_TYPE_FILE_REMOVE from the list.
- Click Run.
Review the Results page and continue to refine your search by using this method.
Use the Network template to search for hosts triggering threat events in the United States
Goal: Search for information about source hosts in the United States that caused threat events over the last 7 days.
Query 1: Search for network information in the United States
- Select Investigation & Response → Search → Query Builder.
- Select the Network template.
-
Specify COUNTRY = United States and do not select Empty values.
This searches for network activity in the United States, and excludes empty values or strings from the results.
- Specify TIME → Last 7D.
- Click Run.
In the Results page, scroll through the table to find a value or string for which you would like to find more information.
In this example, the results returned information about XDM.EVENT.TYPE = threat for host DC3ENX4FGC07 in the XDM.SOURCE.HOST.HOSTNAME column. To refine the search, run another query.
Query 2: Search for information about a specific host and event type
- Copy the term that you want to search, in this case DC3ENX4FGC07.
-
Click Back to edit.
The Network template opens with the original search options.
- Click Add field and select EVENT.TYPE.
- Specify EVENT.TYPE = threat and do not select Empty values.
- Click Add field and select SOURCE.HOST.HOSTNAME.
- Specify SOURCE.HOST.HOSTNAME = DC3ENX4FGC07 and do not select Empty values.
- Click Run.
The Results page provides more information about EVENT.TYPE = threat actions from host DC3ENX4FGC07.
To investigate further we could run another query, or in this case, investigate the causality chain of the event. In the search results, right-click and Investigate Causality Chain.
Use the Free text template to search for an IP address
Goal: Search for information about IP address 175.18.7.29 in the last 24 hours.
- Select Investigation & Response → Search → Query Builder.
- Select the Free text template.
- Specify Text Contains = 175.18.7.29.
- Specify TIME → Last 24H.
- Click Run.
In the Results page the searched string is highlighted. In the Fields column, you can see all of the fields in which the string was discovered. In the RAW_DATA column, click Show more to see the specific row in the dataset in which the string was discovered.
If you want to deepen your search you can Continue in XQL, which opens an XQL search with the fields you defined in the template. You can add stages and functions to the XQL that narrow down your search.
Overview of the Query Center
The Query Center displays information about all queries that were run on the tenant, and the queries that are currently In Progress. The Query Center displays the following tabs:
-
Query History
View and manage all completed Cortex Query Language (XQL) and Graph Search queries. On this tab you can view query results, re-run and adjust queries, and schedule when a query runs. You can also see details of cancelled queries, including the query type and source, and the name of the user who cancelled the query.
-
Active Queries
View and manage all queries that are currently In Progress on the tenant. You can view details about a running query, including the user who ran the query, the context from which it ran, the source of the query, and the amount of time that the query has been running. From this tab you can also cancel active queries.
Note
- Very short queries might not be listed.
- You cannot cancel correlation queries.
- The default retention period for historic queries is aligned with issue retention.
Edit and run queries in Query Center
From the Query Center you can take action on the Completed and In Progress queries that are running on your tenant.
Right-click a query to see the available options, where some of the options differ depending on the type of query you've selected. The pivot (right-click) options described below are some of the ones that may require further explanation.
Note
If query limits are applied to your tenant, the number of concurrent running queries is limited per user. If query usage is reaching the defined limit, a system message warns you that a high query load is impacting performance. If you exceed the limit, new queries are blocked until query usage drops. You can view all active queries under Query Center → Active Queries, and cancel queries to reduce the load.
View the results of a query
You can view the original results of an XQL query when it was originally run in the Query Builder and added to the Query Center.
- Select Investigation & Response → Search → Query Center → Query History.
-
Identify the XQL query by looking in the Query Name and Query Description columns.
The Query Description column displays the parameters that were defined for a query. If necessary, use the filter on the column to reduce the number of queries displayed.
Queries that were created from a Query Builder template are prefixed with the template name.
-
Right-click anywhere in the XQL query row and select Show results.
You have the option to Show results in new tab or Show results in same tab.
- (Optional) Export to file to export the results to a tab-separated values (TSV) file.
-
(Optional) Perform additional investigation on the issues.
Right-click a value in the results table to see the options for further investigation.
Run a query
You can run a query for a Graph Search query.
- Select Investigation & Response → Search → Query Center → Query History.
-
Identify the Graph Search query by looking in the Query Name and Query Description columns.
The Query Description column displays the parameters that were defined for a query. If necessary, use the filter on the column to reduce the number of queries displayed.
-
Right-click anywhere in the Graph Search query row and select Run query.
You have the option to Run in same tab or Show in new tab.
- (Optional) The Graph Search results are displayed in a graph format by default. You can toggle to Table to view the results in a table format. In addition, you can always export the graph results using the icon at the top of the page to a PNG, SVG, or TSV file. Table results can only be exported to a TSV file.
-
(Optional) Perform additional investigation on the graph or table results.
On the graph results, you can either hover or select different nodes for further investigation. While in the table results, you can select any cell in the table for further investigation.
Modify a query
After you view the query results of an XQL query or run a Graph Search query as explained in the tasks above, you can change your search parameters to refine the search results or correct a search parameter.
- For queries created in XQL, type your changes in the XQL query field where the original query is listed and the results are displayed in the Query Results tab. After modifying the query, you can run, schedule, or save the query.
- For queries created with a Query Builder template, the defined parameters are shown at the top of the Results page. Select Back to edit to modify the query with the template format or Continue in XQL to open the query in XQL.
- For Graph Search queries, the graph results are displayed. Click anywhere in the Graph Search query interface, where your existing query is defined, to display the complete query, update your query, and rerun the search.
Schedule a query to run
You can schedule an XQL query to run on or before a specific date. Cortex XSIAM creates a new query in the Query Center, and when the query completes, it displays a notification in the notification bar.
How to schedule a query
- Select Investigation & Response → Search → Query Center → Query History.
- Right-click anywhere in the query and then select Schedule.
- Choose a schedule option and the date and time that the query should run:
- Run one time query on a specific date
- Run query by date and time: Schedule a recurring query.
-
Click OK to schedule the query.
Cortex XSIAM creates a new query and schedules it to run on or by the selected date and time.
-
View the status of the scheduled query on the Scheduled Queries page.
You can also make changes to the query, edit the frequency, view when the query will next run, or disable the query. For more information, see Manage scheduled queries.
Cancel a query
Note
You can cancel your own queries. To cancel queries run by other users, you must have View/Edit permissions for Configurations → Query Management. By default, Instance administrators have View/Edit permission.
On the Active Queries tab you can cancel one or more In Progress queries. You might want to cancel long-running queries, or cancel queries to reduce tenant consumption. If query limits are applied to your tenant and you exceed the defined limit of concurrent running queries, new queries are blocked until the number of active queries falls below the threshold. Canceling active queries allows you to unblock and run new queries.
How to cancel a query
- Select Investigation & Response → Search → Query Center → Active Queries.
- Select one or more queries and click Cancel Selected Queries.
Note
- Cancelled queries show a Canceled status. You can see details of all canceled queries in the Query History tab.
- You cannot cancel correlation rule queries.
- If you cancel a scheduled query, only the current query is cancelled. Future recurrences of the scheduled query are not affected.
Query Center reference information
The table below lists the common fields in the Query Center, where the options differ for an XQL query versus a Graph Search query.
Note
Certain fields are exposed and hidden by default. An asterisk (*) is beside every field that is exposed by default.
Query Center table
| Field | Description |
|---|---|
| BQL | <p>Indicates whether the Cortex Query Language (XQL) query was created by the native search.</p><p>Native search has been deprecated; this field allows you to view data for XQL queries performed before deprecation.</p> |
| COMPUTE UNIT USAGE | For XQL queries, indicates the number of query units that were used to execute the API query and Cold Storage query. |
| ISSUED BY * | For XQL queries, indicates the user who ran or scheduled the query. For Graph Search queries, indicates the user who ran the query. |
| DURATION (SEC) | Number of seconds it took to execute the XQL query. |
| EXECUTION ID | Unique identifier of XQL and Graph Search queries in the tenant. The identifier ID generated for queries executed in Cortex XSIAM and XQL query API. |
| NUM OF RESULTS* | Number of results returned by the query. |
| PUBLIC API | Whether the source executing the XQL query was an XQL query API. |
| QUERY DESCRIPTION* | Query parameters used to run the query. |
| QUERY ID | Unique identifier of the query. |
| QUERY NAME* | <ul><li><p>For saved queries, the Query Name identifies the query specified according to a randomly generated number.</p><ul><li>XQL queries use the format XQL-QUERY-<number>, such as XQL-QUERY-12.</li><li>Graph Search queries use the format Graph-Query-<number>, such as Graph-Query-1247.</li></ul></li><li>For scheduled queries, the Query Name identifies the auto-generated name of the parent XQL query. Scheduled queries also display an icon to the left of the name to indicate that the XQL query is recurring.</li></ul><p> </p> </p> |
| QUERY STATUS* | <p>Status of the query, where the options differ based on the query type:</p><ul><li><p>XQL queries:</p><ul><li>Queued: The query is queued and will run when there is an available slot.</li><li>Running</li><li>Failed</li><li>Partially completed: The query was stopped after exceeding the maximum number of permitted results. The default results for a Cortex Data Model (XDM) query or an XQL dataset query is limited to 1000, when no limit is explicitly stated in the query. This applies to basic queries with no stages except the fields stage. This default limit does not apply to widgets, Correlation Rules, public APIs, saved queries, or scheduled queries, where the limit is a maximum of 1,000,000 results. Queries based on legacy templates are limited to 10,000 results. To reduce the number of results returned, you can adjust the query settings and rerun.</li><li>Stopped: The query was stopped by an administrator.</li><li>Completed</li><li>Deleted: The query was pruned.</li></ul></li><li><p>Graph Search queries:</p><ul><li>Failed</li><li>Completed</li></ul></li></ul> |
| QUERY SYNTAX | The exact syntax used to write the query. |
| RESULTS SAVED* | For XQL queries, you can choose whether to save the query results, so the output of the field is either Yes or No. Yet, for Graph Search queries, the results can't be saved and must be run each time again, so the field is always No. |
| SIMULATED COMPUTE UNITS | Number of XQL query units that were used to execute the Hot Storage query. |
| Source | Source from which the query was run, for example Playbook, Report, or Investigation. |
| Source ID | ID of the source from where the query was run. |
| Source Name | Name of the source from where the query was run. |
| TIMESTAMP* | Date and time the query was created. |
| XQL | Indicates whether the XQL query was created by an XQL search. |
Manage scheduled queries
The Scheduled Queries page displays information about your scheduled and recurring queries. From this page, you can edit scheduled query parameters, view previous executions, disable, and remove scheduled queries. Right-click a query to see the available options.
View executed queries
- Select Investigation & Response → Search → Scheduled Queries.
-
Locate the scheduled query for which you want to view previous executions.
If necessary, use the Filter to reduce the number of queries returned.
-
Right-click anywhere in the query row, and select Show executed queries.
Cortex XSIAM filters the queries on the Query Center.
Edit the query frequency
- Select Investigation & Response → Search → Scheduled Queries.
-
Locate the scheduled query that you want to edit.
If necessary, use the Filter to reduce the number of queries returned.
- Right-click anywhere in the query row and then select Edit.
- Adjust the schedule settings, and then click OK.
Scheduled Queries reference information
The table below lists the common fields in the Scheduled Queries page.
Note
Certain fields are exposed and hidden by default. An asterisk (*) is beside every field that is exposed by default.
Scheduled Queries table
| Field | Description |
|---|---|
| BQL | <p>Whether the query was created by the native search.</p><p>Native search has been deprecated, this field allows you to view data for queries performed before deprecation.</p> |
| ISSUED BY | User who ran or scheduled the query. |
| MITRE ATT&CK TACTIC | MITRE ATT&CK tactics tagged in the scheduled query. |
| MITRE ATT&CK TECHNIQUE | MITRE ATT&CK techniques tagged in the scheduled query. |
| NEXT EXECUTION | <ul><li><p>For queries that are scheduled to run at a specific frequency, this displays the next execution time.</p><p>For queries that were scheduled to run at a specific time and date, this field will show None.</p></li></ul> |
| PUBLIC API | Whether the source executing the query was an XQL query API. |
| QUERY DESCRIPTION | Query parameters used to run the query. |
| QUERY ID | Unique identifier of the query. |
| QUERY NAME | <ul><li>For saved queries, the Query Name identifies the query specified by the administrator.</li><li>For scheduled queries, the Query Name identifies the auto-generated name of the parent query. Scheduled queries also display an icon to the left of the name to indicate that the query is recurring.</li></ul><p></p> |
| QUERY SYNTAX | The exact syntax used to write the query. |
| SCHEDULE TIME | Frequency or time at which the query was scheduled to run. |
| XQL | Whether the query was created by XQL search. |
Manage your personal query library
Cortex XSIAM provides a Query Library for saving and managing your custom Cortex Query Language (XQL) queries. When creating a query in XQL or managing your queries from the Query Center, you can save them in the Query Library.
The Query Library contains a powerful search mechanism that enables you to search in any field related to the query, such as the query name, description, creator, query text, and labels. In addition, adding a label to your query enables you to search for these queries using these labels in the Query Library.
How to add a query to your personal query library
-
Save a query to your personal query library.
You can do this in two ways:
- From the Query Builder
- Select Investigation & Response → Search → Query Builder → XQL.
- In the XQL query field, define the parameters of your query.
- Select Save as → Query to Library.
- From the Query Center
- Select Investigation & Response → Search → Query Center.
- Locate the query that you want to save to your personal query library.
- Right-click anywhere in the query row, and select Save query to library.
- From the Query Builder
- Set these parameters.
- Query Name: Specify a unique name for the query. Query names must be unique in both private and shared lists, which includes other people’s queries.
- Query Description (Optional): Specify a descriptive name for your query.
- Labels (Optional): Specify a label that is associated with your query. You can select a label from the list of predefined labels or add your label and then select Create Label. Adding a label to your query enables you to search for queries using this label in the Query Library.
- Share with others: You can either set the query to be private and only accessible by you (default) or move the toggle to Share with others the query, so that other users using the same tenant can access the query in their Query Library.
-
Click Save.
A notification appears confirming that the query was saved successfully to the library, and closes on its own after a few seconds.
The query that you added is now listed as the first entry in the Query Library. The query editor is opened to the right of the query.
-
Other available options.
As needed, you can return to your queries in the Query Library to manage your queries. Here are the actions available to you.
- Edit the name, description, labels, and parameters of your query by selecting the query from the Query Library, hovering over the line in the query editor that you want to edit, and selecting the edit icon to edit the text.
- Search query data and metadata: Use the Query Library’s powerful search mechanism that enables you to search in any field related to the query, such as the query name, description, creator, query text, and label. The Search query data and metadata field is available at the top of your list of queries in the Query Library.
- Show: Filter the list of queries from the Show menu. You can filter by the Palo Alto Networks queries provided with Cortex XSIAM , filter by the queries Created by Me, or filter by the queries Created by Others. To view the entire list, Select all (default).
- Save as new: Duplicate the query and save it as a new query. This action is available from the query menu by selecting the 3 vertical dots.
- Share with others: If your query is currently unshared, you can share with other users on the same tenant your query, which will be available in their Query Library. This action is only available from the query menu by selecting the 3 vertical dots when your query is unshared.
- Unshare: If your query is currently shared with other users, you can Unshare the query and remove it from their Query Library. This action is only available from the query menu by selecting the 3 vertical dots when your query is shared with others. You can only Unshare a query that you created. If another user created the query, this option is disabled in the query menu.
- Delete the query. You can only delete queries that you created. If another user created the query, this option is disabled in the query menu when selecting the 3 vertical dots.
Managing your queries
The ability to create, edit, or share queries is governed by access management. If certain options are unavailable, contact your administrator.
The visibility of saved queries in the Query Library is determined by access management. You can manage who can view (and run) or edit your queries by sharing them with specific users, user groups, or API keys. You can also view queries created and shared by others in your organization if they have granted you access or marked the query as Public.
The following icons in the Query Library table help you identify the sharing status of each query:
- : Identifies Restricted queries you created that have not been shared.
- : Identifies queries you created that are currently shared with others.
- : Identifies queries created by another user that have been shared with you.
- : Identifies out-of-the-box (OOTB) system queries provided by Palo Alto Networks.
Use the following tools and the vertical ellipsis (⋮) menu to manage your saved queries:
- Search and filter: Use the search field to find queries by metadata or content. Use the Show menu to filter by Owned by Me, Owned by Others, or Palo Alto Networks.
- Save as new: Duplicate a query using the vertical ellipsis (⋮) menu.
- Share/Manage Access: Once a query is saved to the library, the Owner (or an authorized Editor) can manage who else can interact with it using the vertical ellipsis (⋮) menu. The specific option available (Share or Manage Access) is determined by tenant-level settings.
- Change owner: Administrators can use the vertical ellipsis (⋮) menu to change the query owner to a different user.
- Delete: You can only delete queries that you own. Palo Alto Networks system queries cannot be deleted.
Manage access to saved queries
Once a query is saved to the library, the Owner (or an authorized Editor) can manage who else can interact with it. The options available depend on the tenant-level settings configured by your administrator.
- In the Query Library tab, locate the query you want to share in the table.
- Click the three-dot vertical ellipsis (⋮) and select the available action:
- Share: This option appears when Owners can Share objects they created is enabled in tenant-level settings. It allows you to manage both General access and specific principals (users, user groups, and API keys).
- Manage Access: This option appears when Owners can Share objects they created is disabled in tenant-level settings. It only allows you to change the General access state.
- (If sharing is enabled) To share with specific entities:
- Search for the User, User Group, or API Key.
- Assign the access level: Viewer (can run/view) or Editor (can modify and, if permitted by tenant-level settings, share).
-
Set the General access drop-down menu (if authorized by tenant-level settings):
- Restricted: The query is private. It is only visible to the Owner and the specific principals added to the list.
- Public: The query is visible to every user who has the Query Library enabled in their role.
When the tenant-level setting Owners and editors can change the general access is unselected, the drop-down is disabled, and only an administrator can configure this option.
- Click Save.
XQL macros
XQL macros are reusable XQL code snippets stored in the Macro Library that enable modular query design. Unlike full saved queries which are complete and executable queries, macros are code fragments designed to be inserted into other queries at specific points in the pipeline. The macro pre-processor resolves all macro calls by performing text substitution before the query is compiled and executed.
A query is a complete piece of code that you wrote for a specific dataset which is kept in the library for future use. A macro is a series of functions or queries that are dataset-agnostic, and can be used instead of writing out a long query. Macros are used to simplify complex queries by breaking them down into smaller, reusable components.
Syntax
call_macro "<macro_name>"
With parameters:
call_macro "<macro_name>" param1=value1, param2=value2
Parameters
| Name | Type | Required | Description |
|---|---|---|---|
macro_name |
string | Yes | The name of the macro as saved in the Macro Library. Must be enclosed in double quotes. |
param |
key=value | No | One or more parameters to pass to the macro. Parameters are substituted into the macro definition where ${param} placeholders appear. Multiple parameters are separated by commas. |
Returns
The call_macro statement is replaced by the macro's definition text after parameter substitution. The resulting expanded query is then compiled and executed as a single query.
How macros work
The macro resolution process follows these steps:
- The XQL pre-processor scans the query for
call_macrostatements. - For each
call_macro, it retrieves the macro definition from the Macro Library. - Parameter values are substituted into
${param}placeholders in the macro definition. - The macro call is replaced with the expanded text.
- If the expanded text contains additional
call_macrostatements (nested macros), steps 2–4 repeat. - The fully expanded query is compiled and executed.
Usage notes
- Macros support dynamic parameters using
${variable_name}syntax in the macro definition. - Macros can call other macros (nested macros). The pre-processor resolves all nested calls recursively. However, you can't create macros that reference each other in a circular chain. For example you can't have macro A that calls macro B, which in turn calls macro A.
- You can have 10
call_macrostages in a single query. Each query can have 3 nested macros. In total there can be 30 macros in a single query. - A macro cannot call a full saved query. Use the
callstage to execute full saved queries. - A macro definition cannot begin with a
datasetordatamodelstatement. Macros are code fragments, not complete queries. - There's no syntax validation for macros, so be careful when you build them.
- Macros are available in one-time queries, scheduled queries, widgets, dashboards, reports, and scheduled correlations.
- Macros are managed through the Macro Library with the same RBAC/SBAC access controls as saved queries.
- The Query History, Active Queries and Scheduled Queries views display the original query text with
call_macrostatements. The Query Builder displays the fully expanded (substituted) query. - You can use macros across stages.
- You can use APIs to run a query that includes a macro, which will be expanded in runtime.
Macros vs. saved queries
| Feature | Macros (call_macro) |
Saved Queries (call) |
|---|---|---|
| Purpose | Reusable code snippets for modular logic | Complete, executable queries |
| Position in pipeline | Anywhere in the pipeline | Must be the starting point of a query |
| Execution | Text substitution before compilation | Executes as a separate query call |
Can contain dataset/datamodel |
No | Yes |
| Can call macros | Yes | Yes |
| Can call saved queries | No | Yes (via call) |
| Location in UI | Macro Library | Query Library |
Macro display in different views
| View | Display behavior |
|---|---|
| Query Builder Editor | Hover over a call_macro statement to see the macro definition in an inline overlay. Click to expand and replace the macro call with the literal code (undo supported). |
| Query History | Shows the fully expanded query that was executed (all macros substituted). |
| Active Queries | Shows the original query text with call_macro statements (pre-substitution). |
| Scheduled Queries | Shows the original query text with call_macro statements (pre-substitution). |
Examples
Example 1: Basic macro usage
Goal: Use a macro to filter and select specific fields from network data.
Assume a macro named network_filter is saved in the Macro Library with the following definition:
filter action_country != "US" | fields agent_hostname, action_country, action_remote_ip
XQL code:
dataset = xdr_data | call_macro "network_filter"
Explanation: The pre-processor replaces call_macro "network_filter" with the macro definition. The expanded query becomes:
dataset = xdr_data | filter action_country != "US" | fields agent_hostname, action_country, action_remote_ip
Output:
| AGENT_HOSTNAME | ACTION_COUNTRY | ACTION_REMOTE_IP |
|---|---|---|
| server-01 | DE | 203.0.113.5 |
| workstation-12 | JP | 198.51.100.22 |
Example 2: Macro with parameters
Goal: Use a macro with dynamic parameters to create a reusable field transformation.
Assume a macro named classify_severity is saved with the following definition:
alter severity_label = if(${field} < 3, "Low", if(${field} < 7, "Medium", "High"))
XQL code:
dataset = xdr_data | call_macro "classify_severity" field=action_severity | fields event_id, action_severity, severity_label
Explanation: The parameter field is substituted with action_severity. The expanded query becomes:
dataset = xdr_data | alter severity_label = if(action_severity < 3, "Low", if(action_severity < 7, "Medium", "High")) | fields event_id, action_severity, severity_label
Output:
| EVENT_ID | ACTION_SEVERITY | SEVERITY_LABEL |
|---|---|---|
| evt-001 | 2 | Low |
| evt-002 | 5 | Medium |
| evt-003 | 9 | High |
Example 3: Nested macros
Goal: Demonstrate a macro that calls another macro.
Assume two macros are saved:
Macro extract_domain definition:
alter domain = arrayindex(split(${field}, "@"), 1)
Macro email_analysis definition:
call_macro "extract_domain" field=${email_field} | comp count() as email_count by domain | sort desc email_count
XQL code:
dataset = xdr_data | call_macro "email_analysis" email_field=sender_address | limit 10
Explanation: The pre-processor first expands email_analysis, substituting ${email_field} with sender_address. The intermediate result contains call_macro "extract_domain" field=sender_address, which is then expanded. The final query becomes:
dataset = xdr_data | alter domain = arrayindex(split(sender_address, "@"), 1) | comp count() as email_count by domain | sort desc email_count | limit 10
Output:
| DOMAIN | EMAIL_COUNT |
|---|---|
| example.com | 1,245 |
| corp.net | 892 |
| external.org | 456 |
Example 4: Macro called from a saved query
Goal: Show how a saved full query can include macro calls.
Assume a saved query named daily_threat_report contains:
dataset = xdr_data | filter event_type = ENUM.EVENT_TYPE.NETWORK | call_macro "classify_severity" field=action_severity | call_macro "network_filter" | comp count() as threat_count by severity_label, action_country | sort desc threat_count
XQL code:
call "daily_threat_report"
Explanation: The call stage executes the saved query. During execution, the pre-processor expands both call_macro statements within the saved query before compilation.
Output:
| SEVERITY_LABEL | ACTION_COUNTRY | THREAT_COUNT |
|---|---|---|
| High | CN | 342 |
| Medium | RU | 218 |
| Low | DE | 156 |
Related articles
- Stages: The
callstage, thefilterstage, thealterstage, thefieldsstage
Manage your macros
Save and manage your XQL macros in the Macro Library under Investigations & Response -> XQL Search. You can create, edit, share, and delete macros using the same workflows available for saved queries.
Macro visibility and access
The visibility of saved macros in the Macro Library is governed by RBAC (Role-Based Access Control) and SBAC (Scope-Based Access Control). You can manage who can view (and run) or edit your queries by sharing them with specific users, user groups, or API keys. You can also view queries created and shared by others in your organization if they have granted you access or marked the query as Public.
- Private macros are visible only to the creator.
- Public macros are available to all users with appropriate permissions.
- All access changes are recorded in the management audit log.
- You can have up to 200 macros in your macro library.
Add a macro to your macro library
- In the Query Builder, write the XQL code snippet you want to save as a macro. Highlight the XQL code you want to save as a macro, right-click it, and select Save as Macro to Library.
- In the dialog, provide the following details:
- Name (required): A unique name for the macro. Macro names must be unique in both private and shared lists.
- Description (optional): A description of what the macro does.
- Labels (optional): Assign labels for organizing and filtering macros. You can select a label from the list of predefined labels or add your label and then select Create Label. Adding a label to your query enables you to search for queries using this label in the Query Library.
- Sharing: Toggle to make the macro public (available to all users) or private.
- Click Save.
Use the following tools and the vertical ellipsis (⋮) menu to manage your saved queries:
Search and filter: Use the search field to find queries by metadata or content. Use the Show menu to filter by Owned by Me, Owned by Others, or Palo Alto Networks.
Save as new: Duplicate a query using the vertical ellipsis (⋮) menu.
Share/Manage Access: After a query is saved to the library, the Owner (or an authorized Editor) can manage who else can interact with it using the vertical ellipsis (⋮) menu. The specific option available (Share or Manage Access) is determined by tenant-level settings.
Change owner: Administrators can use the vertical ellipsis (⋮) menu to change the query owner to a different user.
Delete: You can only delete queries that you own.
Edit a macro
- In the Macro library, click the macro to open it in the detail pane.
- Modify the macro definition, name, description, or labels as needed.
- Click Save to update the existing macro, or Save as New to create a copy.
Note: You can't edit a saved macro if it is referenced in other objects, for example other queries, widgets, dashboards, or scheduled correlation rules.
Delete a macro
- In the Macro library, right-click the macro or use the actions menu and select Delete.
- Confirm the deletion.
Note: You can't delete a saved macro if it is referenced in other objects, for example other queries, widgets, dashboards, or scheduled correlation rules.
Usage notes
- Macro names must be unique within the Macro Library.
- All macro modifications (create, edit, delete, access changes) are logged in the management audit log.
Federated Search
Federated Search is a query mechanism designed to provide unified access to distributed data sources without requiring pre-ingestion or centralization. This capability enables you to query data in place, significantly reducing the complexity and operational costs associated with the ingestion process and long-term data retention.
Federated Search is not enabled by default. To enable it in your tenant, contact your Customer Support Team.
Modern enterprises store massive volumes of data across multiple cloud providers and hybrid environments. Centralized data ingestion and warehousing may be insufficient or expensive for cold or regulatory-mandated data. Federated Search allows you to:
- De-couple data management from data analytics for cost optimization.
- Maintain economic solutions for long-term data storage.
- Perform on-demand incident response or compliance audits against existing long-term storage solutions without the overhead of ingestion.
The main use cases for Federated Search include:
- Incident Investigation: Querying events that occurred a long time ago, where the data might not have been ingested into Cortex XSIAM.
- Compliance audits: Accessing historical data needed for audits without the need for extensive ingestion.
- Long-Term data storage: Providing an integrated solution for retaining data for many years.
- Data linking: Joining external datasets with ingested datasets for comprehensive and unified data analysis.
You can keep non-critical, high-volume data types in their native storage locations while preserving the ability to query this data using Cortex Query Language (XQL). This ensures that visibility is gained into a broader spectrum of data while maintaining the core value proposition of deep analytics on ingested data.
Federated search queries consume compute units, which are calculated according to timeframe, complexity, and any cross-cloud egress costs that may apply.
Supported configurations
Federated Search supports the following configurations.
| PROPERTY | CONFIGURATION |
|---|---|
| Storage solutions | <p>Amazon Web Services (AWS) S3 Google Cloud Storage (GCS) Azure Blob Storage</p> |
| Formats | <p>CSV Parquet JSONL NOTE: For optimal results, we recommend the Parquet format. Federated Search supports certain use cases of gzip compressed files. For additional information, please contact your support agent.</p> |
| Partitioning/File Structure | Your data must be partitioned and must follow the Hive partitioning format, which uses key-value pairs. Partitions must be named in the yyyy-mm-dd format (for example, ds=2023-07-07). |
| Supported Regions | <p>AWS: us-east-1, us-west-2, ap-northeast-2, ap-southeast-2, eu-west-1, eu-central-1 GCS: africa-south1, asia-east1, asia-east2, asia-northeast1, asia-northeast2, asia-northeast3, asia-south1, asia-south2, asia-southeast1, asia-southeast2, australia-southeast1, australia-southeast2, europe-central2, europe-north1, europe-north2, europe-southwest1, europe-west1, europe-west10, europe-west12, europe-west2, europe-west3, europe-west4, europe-west5, europe-west8, europe-west9, me-central1, me-central2, me-west1, northamerica-northeast1, northamerica-northeast2, northamerica-south1, southamerica-east1, southamerica-west1, us-central1, us-east1, us-east4, us-east5, us-south1, us-west1, us-west2, us-west3, us-west4 Azure Blob Storage: eastus2 NOTE: The list of supported regions may change in the future.</p> |
Limitations
The following limitations apply to Federated Search:
| LIMITATION | DESCRIPTION |
|---|---|
| Regions | <p>If your tenant is on a specific region server (and not on a multi-region server), the bucket must be in the same region as your tenant. If your tenant is on a multi-region server, you can only configure regions that are in the multi-region of your tenant. The bucket must be in the same multi-region as your Cortex tenant. For example, if your Cortex XSIAM tenant is located in the US multi-region, you can configure an external dataset only from regions in the US multi-region.</p> |
| Queries | <p>The following functions are not available in Federated Search and remain exclusive to fully ingested data: </p><ul><li>Complex, cross-source analytical functions, for example correlations, widgets, dashboards, playbooks, and APIs.</li><li>search, target and view XQL stages.</li></ul> |
Federated Search configuration
Before you run federated searches, you must first create an external dataset to run the query.
To define a new external dataset, go to Settings → Configurations → Data Management → Dataset management → External Datasets and click Add External Dataset. You can also access the wizard through the Query builder page Investigation & Response → Search → Query Builder → Federated Search.
- Prerequisites: Perform preliminary steps on your remote storage, such as creating a policy and attaching it to a role.
-
Connection setup and dataset definition:
Configure the connection and trust relationship with the CSP.
Define the dataset name, description, path within the storage, region, and format.
- Schema Validation: Initiate the process to access the remote storage, pull sample data, and deduce the schema. You can view the auto-detected schema and if the fields aren't accurate, add or delete fields as needed.
- Configuration review and dataset creation: Go over the details and create the dataset.
Amazon S3
Prerequisite
- Access to Cortex XSIAM communication. For a list of the authorized IP addresses, see Enable access to required PANW resources.
- An AWS bucket that contains your data sources.
- Permissions to modify IAM policies in AWS.
How to add an external dataset for an Amazon S3 bucket
-
In Amazon S3, create an IAM policy to allow access to your bucket.
- Navigate to IAM (Access Management) → Policies → Create Policy and select S3.
- In Actions Allowed, select Effect → Allow.
- In List, select ListBucket.
- In Read, select GetObject.
- In Resources, click ARN and fill your bucket name for both Bucket and Object. For Object, use an asterisk (*) and select Any object name.
- Check the details and click Next.
- Click Create Policy.
Your policy appears in the Policies table.
- Create a role for the policy you created.
- Navigate to IAM → Roles → Create Role.
- In the Trusted entity type page, select Web identity.
-
In the Web identity page, under Identity provider, select Google, and under Audience, type 00000, and click Next.
This will later be replaced by the identity created by Cortex XSIAM.
- Select your policy and click Next.
- Type a name for your role and select Create Role.
- Configure the connection.
- In the Federated Search wizard, type the Role ARN from AWS.
- Specify the bucket region. Supported regions are us-east-1, us-west-2, ap-northeast-2, ap-southeast-2, eu-west-1, eu-central-1.
-
Click Generate to create a new Identity for this connection and copy the generated Identity.
This is the identity provided by Cortex XSIAM to create a trust relationship with AWS.
- In the AWS IAM console, add a trust relationship by adding the identity you generated above to the role and set a maximum session duration.
- In AWS IAM, select Roles.
- Select the role you created.
-
Click Edit and set Maximum session duration to 12 hours.
This configures the length of time the session lasts before requiring re-authentication.
- Click Save changes.
- Select Trust Relationships and click Edit policy.
- Replace the value of
accounts.google.com:audwith the identity you generated above. You can also replace the policy content with the provided code snippet. - Click Update policy.
- Configure the dataset.
- In the Federated Search wizard, type a meaningful dataset name and add an optional description. External dataset names must always begin with
external_. -
In S3 URI, enter the Amazon S3 path of the partition directory using the S3 format. To find the path, in the AWS bucket click the directory to display Object overview and copy the S3 URI. The path can only include letters, digits, and the symbols "-","_","=",".". For example,
s3://bucket-name/table-name/. Don't use wildcards.Your partitioned data must follow the Hive partitioning format, which uses key-value pairs. In your directory, name your partitions in the yyyy-mm-dd format, for example ds=2025-10-07. This creates external datasets based on your partitioned data source paths.
When you filter a query using the Query Builder Time frame selection, the query uses the dates in the partition.
- Specify the format. For correct deduction of the schema, you must provide the correct file format. Federated Search supports CSV, Parquet, and JSONL files. For optimal results, we recommend using Parquet format with explicit schema definition. Federated Search supports certain use cases of gzip compressed files. For additional information, please contact your support agent.
- In the Federated Search wizard, type a meaningful dataset name and add an optional description. External dataset names must always begin with
- Test the connection.
- If the connection was successful, click Next.
-
Validate the schema.\
Cortex XSIAM performs an automated schema discovery process by sampling approximately 500 events, typically from the most recent partitions available in the configured path.\
The auto-discovery relies on sampling and may not capture less common event types or fields that appear infrequently within the dataset. As a result, some fields visible in broader searches may not be included in the initially detected schema. This process also conducts validations to catch as many field type mismatches as possible, though due to the high volume of data involved, it cannot detect all mismatches.\
\
The auto-discovery process is meant to accelerate onboarding by generating a baseline schema, however you can still refine the schema as needed.Note:
We highly recommend that you don't change the auto-detected schema. However, if the auto-detected schema is incorrect, you can add, edit, or delete fields.
- Missing fields: For json files and csv files, even if there are missing fields in the detected schema, your query will run successfully. For parquet files, the full schema is always deduced. If there's a partial schema and you add new fields to the actual data, the query will also run correctly.
- Field type mismatch: If a type mismatch is detected during onboarding, Cortex XSIAM displays an error message with the specific field name and allows you to change the field type by deleting the field and re-adding it with its proper type. If the type mismatch is found while running a query, the query fails and Cortex XSIAM displays an error message. In this case, you must delete the external dataset, re-onboard it and make the required changes to the field type accordingly.
- You can't delete the ds field, which is used for Hive partitioning.
- After you save the schema, you can't delete any fields you added during setup.
- Review all the details. You can go back to change any details you want, save the query and return to the external datasets table, or save and start a query in the XQL query page. Saving and starting a query can take some time.
When you create, delete, or update an external dataset, the action is recorded in the Management Audit Logs under the type External Datasets.
Google GCS
Prerequisite
- Access to Cortex XSIAM communication. For a list of the authorized IP addresses, see Enable access to required PANW resources.
- A GCS bucket that contains your data sources.
- Permissions to modify IAM policies in GCS.
How to add an external dataset for a Google Cloud Storage bucket
- Configure the connection.
-
Specify the bucket region. Federated Search supports the following regions: africa-south1, asia-east1, asia-east2, asia-northeast1, asia-northeast2, asia-northeast3, asia-south1, asia-south2, asia-southeast1, asia-southeast2, australia-southeast1, australia-southeast2, europe-central2, europe-north1, europe-north2, europe-southwest1, europe-west1, europe-west10, europe-west12, europe-west2, europe-west3, europe-west4, europe-west6, europe-west8, europe-west9, me-central1, me-central2, me-west1, northamerica-northeast1, northamerica-northeast2, northamerica-south1, southamerica-east1, southamerica-west1, us-central1, us-east1, us-east4, us-east5, us-south1, us-west1, us-west2, us-west3, us-west4
You can only configure regions that are in the multi-region of your tenant.
-
Click Generate to create a new Identity for this connection and copy the generated Identity.
This is the service account that will allow read access to the GCS bucket.
-
Grant access to the connection.
- In the GCS project, navigate to IAM.
- In Allow → View by principals, click Grant access.
- Under New principles, paste the Identity you generated in the Federated Search wizard.
- Under Assign roles, select the role Storage Object Viewer.
- Click Save.
-
- Configure the dataset.
- In the Federated Search wizard, type a meaningful dataset name and add an optional description. External dataset names must always begin with
external_. -
In GS URI, specify the partition directory. For example,
s3://bucket-name/table-name/. Don't use wildcards.Your partitioned data must follow the Hive partitioning format, which uses key-value pairs. In your directory, name your partitions in the yyyy-mm-dd format, for example ds=2025-10-07. This creates external datasets based on your partitioned data source paths.
When you filter a query using the Query Builder Time frame selection, the query uses the dates in the partition.
- Specify the format. For correct deduction of the schema, you must provide the correct file format. Federated Search supports CSV, Parquet, and JSONL files. For optimal results, we recommend using Parquet format with explicit schema definition. Federated Search supports certain use cases of gzip compressed files. For additional information, please contact your support agent.
- In the Federated Search wizard, type a meaningful dataset name and add an optional description. External dataset names must always begin with
- Test the connection.
- If the connection was successful, click Next.
- Validate the schema.\
Cortex XSIAM performs an automated schema discovery process by sampling approximately 500 events, typically from the most recent partitions available in the configured path.\
The auto-discovery relies on sampling and may not capture less common event types or fields that appear infrequently within the dataset. As a result, some fields visible in broader searches may not be included in the initially detected schema. This process also conducts validations to catch as many field type mismatches as possible, though due to the high volume of data involved, it cannot detect all mismatches.\
\
The auto-discovery process is meant to accelerate onboarding by generating a baseline schema, however you can still refine the schema as needed. -
Note:
We highly recommend that you don't change the auto-detected schema. However, if the auto-detected schema is incorrect, you can add, edit, or delete fields.
* Missing fields: For json files and csv files, even if there are missing fields in the detected schema, your query will run successfully. For parquet files, the full schema is always deduced. If there's a partial schema and you add new fields to the actual data, the query will also run correctly. * Field type mismatch: If a type mismatch is detected during onboarding, Cortex XSIAM displays an error message with the specific field name and allows you to change the field type by deleting the field and re-adding it with its proper type. If the type mismatch is found while running a query, the query fails and Cortex XSIAM displays an error message. In this case, you must delete the external dataset, re-onboard it and make the required changes to the field type accordingly. * You can't delete the ds field, which is used for Hive partitioning. * After you save the schema, you can't delete any fields you added during setup.
- Review all the details. You can go back to change any details you want, save the query and return to the external datasets table, or save and start a query in the XQL query page. Saving and starting a query may take some time.
When you create, delete, or update an external dataset, the action is recorded in the Management Audit Logs under the type External Datasets
Azure Blob Storage
Prerequisite
- Access to Cortex XSIAM communication. For a list of the authorized IP addresses, see Enable access to required PANW resources.
- An Azure Blob Storage blob with your data sources.
- Permissions to modify IAM policies in Azure Blob Storage.
How to add an external dataset for an Azure blob
-
Create a new registration in Azure Blob Storage to be used by Federated Search.
- In your Azure tenant, navigate to All Services → App registrations, and click New registration.
- Fill the following fields as below:
- Name: Type a name
- Supported account types: Accounts in this organizational directory only
- Redirect URI: Leave blank for now.
- Click Register.
Copy the Directory (tenant) ID, the Application (client) ID, and the Object ID. You will use these in the connection step.
- Configure the connection.
- In the Federated Search wizard, paste the following values from Azure: Directory ID, Application ID, Object ID.
-
Specify the blob region. Federated Search supports only eastus2.
You can only configure regions that are in the multi-region of your tenant.
-
Click Generate to create a new Identity for this connection and copy the generated Identity.
This is the identity used to establish the trust with Azure Storage.
- Create credentials for the application.
- In your Azure tenant, under All services → App registrations, select your application and click Add a certificate or secret.
- Select Federated credentials and click Add credential.
- In the Add a credential page, fill in the following values:
- Federated credential scenario: Other issuer
- Issuer: https://accounts.google.com
- Type: Explicit subject identifier
- Value: Identity you generated above in the Federated Search wizard.
- Type a name and description, and click Add.
- Assign a role to the application.
- In Azure → Storage accounts, select your blob.
- Select the container and, on the left menu, click Access Control (IAM).
- Under Check Access, click Add role assignment.
- In Role → Job function roles, select Storage Blob Data Reader and click Next.
- For the Assign access to field, select User, group, or service principal.
- Click Select members, search for the name of your app registration. Select the app registration and click Select.
- Click Review + assign to finalize.
- Configure the dataset.
- In the Federated Search wizard, type a meaningful dataset name and add an optional description. External dataset names must always begin with
external_. -
In Container URL, specify the partition directory. For example,
s3://bucket-name/table-name/. Don't use wildcards.Your partitioned data must follow the Hive partitioning format, which uses key-value pairs. Name your partitions in the yyyy-mm-dd format, for example ds=2025-10-07. This creates external datasets based on your partitioned data source paths.
When you filter a query using the Query Builder Time frame selection, the query uses the dates in the partition.
- Specify the format. For correct deduction of the schema, you must provide the correct file format. Federated Search supports CSV, Parquet, and JSONL files. For optimal results, we recommend using Parquet format with explicit schema definition. Federated Search supports certain use cases of gzip compressed files. For additional information, please contact your support agent.
- In the Federated Search wizard, type a meaningful dataset name and add an optional description. External dataset names must always begin with
- Test the connection.
- If the connection was successful, click Next.
-
Validate the schema.
Cortex XSIAM performs an automated schema discovery process by sampling approximately 500 events, typically from the most recent partitions available in the configured path.\
The auto-discovery relies on sampling and may not capture less common event types or fields that appear infrequently within the dataset. As a result, some fields visible in broader searches may not be included in the initially detected schema. This process also conducts validations to catch as many field type mismatches as possible, though due to the high volume of data involved, it cannot detect all mismatches.\
\
The auto-discovery process is meant to accelerate onboarding by generating a baseline schema, however you can still refine the schema as needed.We highly recommend that you don't change the auto-detected schema. However, you can add, edit, or delete fields.
- Missing fields: For json files and csv files, even if there are missing fields in the detected schema, your query will run successfully. For parquet files, the full schema is always deduced. If there's a partial schema and you add new fields to the actual data, the query will also run correctly.
- Field type mismatch: If a type mismatch is detected during onboarding, Cortex XSIAM displays an error message with the specific field name and allows you to change the field type by deleting the field and re-adding it with its proper type. If the type mismatch is found while running a query, the query fails and Cortex XSIAM displays an error message. In this case, you must delete the external dataset, re-onboard it and make the required changes to the field type accordingly.
- You can't delete the ds field, which is used for Hive partitioning.
- After you save the schema, you can't delete any fields you added during setup.
- Review all the details. You can go back to change any details you want, save the query and return to the external datasets table, or save and start a query in the XQL query page. Saving and starting a query can take some time.
When you create, delete, or update an external dataset, the action is recorded in the Management Audit Logs under the type External Datasets.
Query using Federated Search
To query using Federated search, navigate to Incident Response → Investigation → Query Builder and select XQL.
You can build queries across external datasets and ingested datasets, giving you a powerful tool.
In its current version, Federated Search enables only ad-hoc queries via the query builder. You can search, filter and use JOIN operations.
NOTE:
The following aren't available in Federated Search and remain exclusive to fully ingested data.
- Complex, cross-source analytical functions, for example correlations, widgets, dashboards, and APIs
search,targetandviewXQL stages
NOTE:\
\
If there is a type mismatch between the schema and the data in the field, the query fails and Cortex XSIAM displays an error message. In this case, you must delete the external dataset, re-onboard it and make the required changes to the field type accordingly
Manage external datasets
Manage external datasets created for federates searches in Settings → Configurations → Data Management → Dataset management → External Datasets.
On this page you can do the following:
- Add an external dataset: Click Add External Dataset.
- Check the connection status: The connection status is automatically checked once a week. To manually check the connection status, hover to the right on the dataset row and click Check connection.
- View: Hover to the right on the dataset row and click the eye icon.
-
Edit: This opens the setup wizard where you can change the description and the schema.
NOTE:
We highly recommend that you don't change the auto-detected schema. However, in the Edit window you can add new fields or delete the new fields you added in the Edit window. You can't delete the fields that were configured during setup.
-
Delete the dataset: Hover to the right on the dataset row and click Delete dataset.
This action deletes the dataset connection in Cortex XSIAM. The dataset in your external storage isn't affected.
- Run a query using the dataset: Hover to the right on the dataset row and click the triangle. This opens the Query Builder page, with the dataset already defined.
Legacy Query Builder
We recommend using the Query Builder in New mode to take advantage of the Query Builder templates and the ability to search the full Cortex Data Model (XDM).
In Legacy mode, the Query Builder searches predefined datasets only. To search the full XDM, switch to New mode or select XQL Search.
The Legacy Query Builder provides queries for the following types of entities:
- Process: Search on process execution and injection by process name, hash, path, command line arguments, and more. See Create process query.
- File: Search on file creation and modification activity by file name and path. See Create file query.
- Network: Search network activity by IP address, port, host name, protocol, and more. See Create network query.
- Image Load: Search on module load into process events by module IDs and more. See Create image load query.
- Registry: Search on registry creation and modification activity by key, key value, path, and data. See Create registry query.
- Event Log: Search Windows event logs and Linux system authentication logs by username, log event ID (Windows only), log level, and message. See Create event log query.
- Network Connections: Search security event logs by firewall logs, endpoint raw data over your network. See Create network connections query.
- Authentications: Search on authentication events by identity, target outcome, and more. See Create authentication query.
- All Actions: Search across all network, registry, file, and process activity by endpoint or process. See Query across all entities.
The Query Builder also provides flexibility for both on-demand query generation and scheduled queries.
Create authentication query
From the Query Builder, you can investigate authentication activity across all ingested authentication logs and data.
Some examples of authentication queries you can run include:
- Authentication logs by severity
- Authentication logs by the event message
- Authentication logs for a specific source IP address
How to build an authentication query
- From Cortex XSIAM, select Investigation & Response → Search → Query Builder.
- Select AUTHENTICATION.
-
Enter the search criteria for the authentication query.
By default, Cortex XSIAM will return the activity that matches all the criteria you specify. To exclude a value, toggle the
=option to=!. -
Choose when to run the query.
Select the calendar icon to schedule a query to run on or before a specific date or Run to run the query immediately and view the results in the Query Center.
While the query is running, you can always navigate away from the page and a notification is sent when the query completes. You can also Cancel the query or run a new query, where you have the option to Run only new query (cancel previous) or Run both queries.
- When you are ready, view the results of the query. For more information, see Review XQL query results.
Create event log query
From the Query Builder you can search Windows and Linux event log attributes and investigate event logs across endpoints with a Cortex XDR agent installed.
Some examples of event log queries you can run include:
- Critical level messages on specific endpoints.
- Message descriptions with specific keywords on specific endpoints.
How to build an event log query
- From Cortex XSIAM , select Investigation & Response → Search → Query Builder.
- Select EVENT LOG.
-
Enter the search criteria for your Windows or Linux event log query.
Define any event attributes for which you want to search. By default, Cortex XSIAM will return the events that match the attribute you specify. To exclude an attribute value, toggle the
=option to=!. Attributes are:- PROVIDER NAME: The provider of the event log.
- USERNAME: The username associated with the event.
- EVENT ID: The unique ID of the event.
- LEVEL: The event severity level.
- MESSAGE: The description of the event.
To specify an additional exception (match this value except), click the + to the right of the value and specify the exception value.
-
(Optional) Limit the scope to an endpoint or endpoint attributes:
Specify one or more of the following attributes: Use a pipe (** **) to separate multiple values. Use an asterisk (*) to match any string of characters.
- HOST: HOST NAME, HOST IP address, HOST OS, HOST MAC ADDRESS, or INSTALLATION TYPE.
- INSTALLATION TYPE can be either Cortex XDR agent or Data Collector.
- PROCESS: NAME, PATH, CMD, MD5, SHA256, USER NAME, SIGNATURE, or PID.
-
Specify the time period for which you want to search for events.
Options are Last 24H (hours), Last 7D (days), Last 1M (month), or select a Custom time period.
-
Choose when to run the query.
Select the calendar icon to schedule a query to run on or before a specific date or Run to run the query immediately and view the results in the Query Center.
While the query is running, you can always navigate away from the page, and a notification is sent when the query completes. You can also Cancel the query or run a new query, where you have the option to Run only new query (cancel previous) or Run both queries.
- When you are ready, view the results of the query. For more information, see Review XQL query results.
Create file query
From the Query Builder you can investigate connections between file activity and endpoints. The Query Builder searches your logs and endpoint data for the file activity that you specify. To search for files on endpoints instead of file-related activity, build an XQL query. For more information, see How to build XQL queries.
Some examples of file queries you can run include:
- Files modified on specific endpoints.
- Files related to process activity that exist on specific endpoints.
How to build a file query
- From Cortex XSIAM, select Investigation & Response → Search → Query Builder.
- Select FILE.
- Enter the search criteria for the file events query.
- File activity: Select the type or types of file activity you want to search: All, Create, Read, Rename, Delete, or Write.
-
File attributes: Define any additional process attributes for which you want to search. Use a pipe (
|) to separate multiple values (for examplenotepad.exe|chrome.exe). By default, Cortex XSIAM will return the events that match the attribute you specify. To exclude an attribute value, toggle the=option to=!. Attributes are:- NAME: File name.
- PATH: Path of the file.
- PREVIOUS NAME: Previous name of a file.
- PREVIOUS PATH: Previous path of the file.
- MD5: MD5 hash value of the file.
- SHA256: SHA256 hash value of the file.
- ACTION_DISK_DRIVER_NAME: The driver where the file was created.
- FILE_SYSTEM_TYPE: Operating system type where the file was run.
- ACTION_IS_VFS: Denotes if the file is on a virtual file system on the disk. This is relevant only for files that are written to disk.
- DEVICE TYPE: Type of device used to run the file: Unknown, Fixed, Removable Media, CD-ROM.
- DEVICE SERIAL NUMBER: Serial number of the device type used to run the file.
To specify an additional exception (match this value except), click the + to the right of the value and specify the exception value.
-
(Optional) Limit the scope to a specific acting process:
Select +PROCESS and specify one or more of the following attributes for the acting (parent) process.
Use a pipe (** ) to separate multiple values. Use an asterisk (***) to match any string of characters. - NAME: Name of the parent process.
- PATH: Path to the parent process.
- CMD: Command-line used to initiate the process, including any arguments, up to 128 characters.
- MD5: MD5 hash value of the process.
- SHA256: SHA256 hash value of the process.
- USER NAME: User who executed the process.
- SIGNATURE: Signing status of the parent process: Signature Unavailable, Signed, Invalid Signature, Unsigned, Revoked, Signature Fail.
- SIGNER: Entity that signed the certificate of the parent process.
- PID: Process ID of the parent process.
- Run search for process, Causality, and OS actors—The causality actor—also referred to as the causality group owner (CGO)—is the parent process in the execution chain that the Cortex XDR agent identified as being responsible for initiating the process tree. The OS actor is the parent process that creates an OS process on behalf of a different indicator. By default, this option is enabled to apply the same search criteria to initiating processes. To configure different attributes for the parent or initiate the process, clear this option.
-
(Optional) Limit the scope to an endpoint or endpoint attributes:
Select +Host and specify one or more of the following attributes:
-
HOST: HOST NAME, HOST IP address, HOST OS, HOST MAC ADDRESS, or INSTALLATION TYPE.
INSTALLATION TYPE can be either Cortex XDR agent or Data Collector.
-
PROCESS: NAME, PATH, CMD, MD5, SHA256, USER NAME, SIGNATURE, or PID.
Use a pipe (** ) to separate multiple values. Use an asterisk (***) to match any string of characters. -
-
Specify the time period for which you want to search for events.
Options are Last 24H (hours), Last 7D (days), Last 1M (month), or select a Custom time period.
-
Choose when to run the query.
Select the calendar icon to schedule a query to run on or before a specific date or Run to run the query immediately and view the results in the Query Center.
While the query is running, you can always navigate away from the page and a notification is sent when the query completes. You can also Cancel the query or run a new query, where you have the option to Run only new query (cancel previous) or Run both queries.
- When you are ready, view the results of the query. For more information, see Review XQL query results.
Create image load query
From the Query Builder, you can investigate connections between image load activity, acting processes, and endpoints.
Some examples of image load queries you can run include:
- Module load into process events by module path or hash.
How to build an image load query
- From Cortex XSIAM, select Investigation & Response → Search → Query Builder.
- Select IMAGE LOAD.
-
Enter the search criteria for the image load activity query.
- Type of image activity: All, Image Load, or Change Page Protection.
- Identifying information about the image module: Full Module Path, Module MD5, or Module SHA256.
By default, Cortex XSIAM will return the activity that matches all the criteria you specify. To exclude a value, toggle the
=option to=!. -
(Optional) To limit the scope to a specific source, click the + to the right of the value and specify the exception value.
Specify one or more attributes for the source.
Use a pipe (** ) to separate multiple values. Use an asterisk (***) to match any string of characters. - NAME: Name of the parent process.
- PATH: Path to the parent process.
- CMD: Command-line used to initiate the process, including any arguments, up to 128 characters.
- MD5: MD5 hash value of the process.
- SHA256: SHA256 hash value of the process.
- USER NAME: User who executed the process.
- SIGNATURE: Signing status of the parent process: Signature Unavailable, Signed, Invalid Signature, Unsigned, Revoked, Signature Fail.
- SIGNER: Entity that signed the certificate of the parent process.
- PID: Process ID of the parent process.
Run search for both the process and the Causality actor: The causality actor—also referred to as the causality group owner (CGO)—is the parent process in the execution chain that the app identified as being responsible for initiating the process tree. Select this option if you want to apply the same search criteria to the causality actor. If you clear this option, you can then configure different attributes for the causality actor.
-
(Optional) Limit the scope to an endpoint or endpoint attributes:
Specify one or more of the following attributes: Use a pipe (** **) to separate multiple values. Use an asterisk (*) to match any string of characters.
-
HOST: HOST NAME, HOST IP address, HOST OS, HOST MAC ADDRESS, or INSTALLATION TYPE.
INSTALLATION TYPE can be either Cortex XDR agent or Data Collector.
-
PROCESS: NAME, PATH, CMD, MD5, SHA256, USER NAME, SIGNATURE, or PID.
-
-
Specify the time period for which you want to search for events.
Options are Last 24H (hours), Last 7D (days), Last 1M (month), or select a Custom time period.
-
Choose when to run the query.
Select the calendar icon to schedule a query to run on or before a specific date or Run to run the query immediately and view the results in the Query Center.
While the query is running, you can always navigate away from the page and a notification is sent when the query completes. You can also Cancel the query or run a new query, where you have the option to Run only new query (cancel previous) or Run both queries.
- When you are ready, view the results of the query. For more information, see Review XQL query results.
Create network connections query
From the Query Builder, you can investigate network events stitched across endpoints and the Palo Alto Networks Next-Generation Firewall logs.
Some examples of a network query you can run include:
- Source and destination of a process.
- Network connections that included a specific App ID
- Processes that created network connections.
- Network connections between specific endpoints.
How to build a network connection query
- From Cortex XSIAM, select Investigation & Response → Search → Query Builder.
- Select NETWORK CONNECTIONS.
- Enter the search criteria for the network events query.
-
Network attributes: Define any additional process attributes for which you want to search. Use a pipe (
|) to separate multiple values (for example80|8080). By default, Cortex XSIAM will return the events that match the attribute you specify. To exclude an attribute value, toggle the=option to=!. Options are:- APP ID: App ID of the network.
- PROTOCOL: Network transport protocol over which the traffic was sent.
- SESSION STATUS
- FW DEVICE NAME: Firewall device name.
- FW RULE: Firewall rule.
- FW SERIAL ID: Firewall serial ID.
- PRODUCT
- VENDOR
To specify an additional exception (match this value except), click the + to the right of the value and specify the exception value.
-
-
(Optional) To limit the scope to a specific source, click the + to the right of the value and specify the exception value.
Specify one or more attributes for the source.
Use a pipe (** ) to separate multiple values. Use an asterisk (***) to match any string of characters. - HOST NAME: Name of the source.
- HOST IP: IP address of the source.
- HOST OS: Operating system of the source.
- PROCESS NAME: Name of the process.
- PROCESS PATH: Path to the process.
- CMD: Command-line used to initiate the process, including any arguments, up to 128 characters.
- MD5: MD5 hash value of the process.
- SHA256: SHA256 hash value of the process.
- PROCESS USER NAME: User who executed the process.
- SIGNATURE: Signing status of the parent process: Signature Unavailable, Signed, Invalid Signature, Unsigned, Revoked, Signature Fail.
- PID: Process ID of the parent process.
- IP: IP address of the process.
- PORT: Port number of the process.
- USER ID: ID of the user who executed the process.
- Run search for both the process and the Causality actor: The causality actor—also referred to as the causality group owner (CGO)—is the parent process in the execution chain that the app identified as being responsible for initiating the process tree. Select this option if you want to apply the same search criteria to the causality actor. If you clear this option, you can then configure different attributes for the causality actor.
-
(Optional) Limit the scope to a destination.
Use a pipe (** ) to separate multiple values. Use an asterisk (***) to match any string of characters. Specify one or more of the following attributes:
- REMOTE IP: IP address of the destination.
- COUNTRY: Country of the destination.
- Destination TARGET HOST,NAME, PORT, HOST NAME, PROCESS USER NAME, HOST IP, CMD, HOST OS, MD5, PROCESS PATH, USER ID, SHA256, SIGNATURE, or PID
-
Specify the time period for which you want to search for events.
Options are Last 24H (hours), Last 7D (days), Last 1M (month), or select a Custom time period.
-
Choose when to run the query.
Select the calendar icon to schedule a query to run on or before a specific date or Run to run the query immediately and view the results in the Query Center.
While the query is running, you can always navigate away from the page and a notification is sent when the query completes. You can also Cancel the query or run a new query, where you have the option to Run only new query (cancel previous) or Run both queries.
- When you are ready, view the results of the query. For more information, see Review XQL query results.
Create network query
From the Query Builder, you can investigate connections between network activity, acting processes, and endpoints.
Some examples of a network query you can run include:
- Network connections to or from a specific IP address and port number.
- Processes that created network connections.
- Network connections between specific endpoints.
How to build a network query
- From Cortex XSIAM, select Investigation & Response → Search → Query Builder.
- Select NETWORK.
- Enter the search criteria for the network events query.
- Network traffic type: Select the type or types of network traffic issues you want to search: Incoming, Outgoing, or Failed.
-
Network attributes: Define any additional process attributes for which you want to search. Use a pipe (
|) to separate multiple values (for example80|8080). By default, Cortex XSIAM will return the events that match the attribute you specify. To exclude an attribute value, toggle the=option to=!. Options are:- REMOTE COUNTRY: Country from which the remote IP address originated.
-
REMOTE IP: Remote IP address related to the communication.
When you run the query, depending on the outcome of the results, the value specified in this field might be displayed in the
dst_ipfield in the query results. This occurs if an RDP event is recorded whereby a user connected from the source IP to the destination IP. - REMOTE PORT: Remote port used to make the connection.
- LOCAL IP: Local IP address related to the communication. Matches can return additional data if a machine has more than one NIC.
- LOCAL PORT: Local port used to make the connection.
- PROTOCOL: Network transport protocol over which the traffic was sent.
To specify an additional exception (match this value except), click the + to the right of the value and specify the exception value.
-
(Optional) To limit the scope to a specific source, click the + to the right of the value and specify the exception value.
Specify one or more attributes for the source.
Use a pipe (** ) to separate multiple values. Use an asterisk (***) to match any string of characters. - NAME: Name of the parent process.
- PATH: Path to the parent process.
- CMD: Command-line used to initiate the process, including any arguments, up to 128 characters.
- MD5: MD5 hash value of the process.
- SHA256: SHA256 hash value of the process.
- USER NAME: User who executed the process.
- SIGNATURE: Signing status of the parent process: Signature Unavailable, Signed, Invalid Signature, Unsigned, Revoked, Signature Fail.
- SIGNER: Entity that signed the certificate of the parent process.
- PID: Process ID of the parent process.
- Run search for process, Causality, and OS actors: The causality actor—also referred to as the causality group owner (CGO)—is the parent process in the execution chain that the Cortex XDR agent identified as being responsible for initiating the process tree. The OS actor is the parent process that creates an OS process on behalf of a different indicator. By default, this option is enabled to apply the same search criteria to initiating processes. To configure different attributes for the parent or initiate the process, clear this option.
-
(Optional) Limit the scope to an endpoint or endpoint attributes:
Specify one or more of the following attributes: Use a pipe (** **) to separate multiple values. Use an asterisk (*) to match any string of characters.
- HOST: HOST NAME, HOST IP address, HOST OS, HOST MAC ADDRESS, or INSTALLATION TYPE.
- INSTALLATION TYPE can be either Cortex XDR agent or Data Collector.
- PROCESS: NAME, PATH, CMD, MD5, SHA256, USER NAME, SIGNATURE, or PID.
-
Specify the time period for which you want to search for events.
Options are Last 24H (hours), Last 7D (days), Last 1M (month), or select a Custom time period.
-
Choose when to run the query.
Select the calendar icon to schedule a query to run on or before a specific date or Run to run the query immediately and view the results in the Query Center.
While the query is running, you can always navigate away from the page and a notification is sent when the query completes. You can also Cancel the query or run a new query, where you have the option to Run only new query (cancel previous) or Run both queries.
- When you are ready, view the results of the query. For more information, see Review XQL query results.
Create process query
From the Query Builder you can investigate connections between processes, child processes, and endpoints.
For example, you can create a process query to search for processes executed on a specific endpoint.
How to build a process query
- From Cortex XSIAM, select Investigation & Response → Search → Query Builder.
- Select PROCESS.
- Enter the search criteria for the process query.
- Process action: Select the type of process action you want to search: On process Execution or Injection into another process.
-
Process attributes—Define any additional process attributes for which you want to search.
Use a pipe (
|) to separate multiple values. Use an asterisk (*) to match any string of characters.By default, Cortex XSIAM will return results that match the attribute you specify. To exclude an attribute value, toggle the operator from
=to!=. Attributes are:- NAME: Name of the process. For example,
notepad.exe. - PATH: Path to the process. For example,
C:\windows\system32\notepad.exe. - CMD: Command-line used to initiate the process including any arguments, up to 128 characters.
- MD5: MD5 hash value of the process.
- SHA256: SHA256 hash value of the process.
- USER NAME: User who executed the process.
- SIGNATURE: Signing status of the process: Signature Unavailable, Signed, Invalid Signature, Unsigned, Revoked, Signature Fail.
- SIGNER: Signer of the process.
- PID: Process ID.
- PROCESS_FILE_INFO: Metadata of the process file, including file property details, file entropy, company name, encryption status, and version number.
- PROCESS_SCHEDULED_TASK_NAME: Name of the task scheduled by the process to run in the Task Scheduler.
- PROCESS_TOKEN_INFORMATION: Bitwise token of the process privileges.
- DEVICE TYPE: Type of device used to run the process: Unknown, Fixed, Removable Media, CD-ROM.
- DEVICE SERIAL NUMBER: Serial number of the device type used to run the process.
To specify an additional exception (match this value except), click the + to the right of the value and specify the exception value.
- NAME: Name of the process. For example,
-
(Optional) Limit the scope to a specific acting process:
Select +PROCESS and specify one or more of the following attributes for the acting (parent) process.
- NAME: Name of the parent process.
- PATH: Path to the parent process.
- CMD: Command-line used to initiate the parent process including any arguments, up to 128 characters.
- MD5: MD5 hash value of the parent process.
- SHA256: SHA256 hash value of the process.
- USER NAME: User who executed the process.
- SIGNATURE: Signing status of the parent process: Signed, Unsigned, N/A, Invalid Signature, Weak Hash
- SIGNER: Entity that signed the certificate of the parent process.
- PID: Process ID of the parent process.
- Run search on process, Causality and OS actors: The causality actor—also referred to as the causality group owner (CGO)—is the parent process in the execution chain that the Cortex XDR agent identified as being responsible for initiating the process tree. The OS actor is the parent process that creates an OS process on behalf of a different initiator. By default, this option is enabled to apply the same search criteria to initiating processes. To configure different attributes for the parent or initiate a process,
-
(Optional) Limit the scope to an endpoint or endpoint attributes:
Select +HOST and specify one or more of the following attributes:
-
HOST: HOST NAME, HOST IP address, HOST OS, HOST MAC ADDRESS, or INSTALLATION TYPE.
INSTALLATION TYPE can be Cortex XDR agent.
-
PROCESS: NAME, PATH, CMD, MD5, SHA256, USER NAME, SIGNATURE, or PID.
-
-
Specify the time period for which you want to search for events.
Options are Last 24H (hours), Last 7D (days), Last 1M (month), or select a Custom time period.
-
Choose when to run the query.
Select the calendar icon to schedule a query to run on or before a specific date or Run to run the query immediately and view the results in the Query Center.
While the query is running, you can always navigate away from the page and a notification is sent when the query completes. You can also Cancel the query or run a new query, where you have the option to Run only new query (cancel previous) or Run both queries.
- When you are ready, view the results of the query. For more information, see Review XQL query results.
Create registry query
From the Query Builder you can investigate connections between registry activity, processes, and endpoints.
Some examples of a registry query you can run include:
- Modified registry keys on specific endpoints.
- Registry keys related to process activity that exist on specific endpoints.
How to build a registry query
- From Cortex XSIAM, select Investigation & Response → Search → Query Builder.
- Select REGISTRY.
- Enter the search criteria for the registry events query.
- Registry action: Select the type or types of registry actions you want to search: Key Create, Key Delete, Key Rename, Value Set, or Value Delete.
-
Registry attributes: Define any additional registry attributes for which you want to search. By default, Cortex XSIAM will return the events that match the attribute you specify. To exclude an attribute value, toggle the
=option to=!. Attributes are:-
KEY NAME: Registry key name.
Ensure the KEY NAME is entered as a real registry key name, and not as a symbolic link. Otherwise, the query will not retrieve results.
Instead of
HKEY_LOCAL_MACHINE\System\CurrentControlSet, which is a symbolic link, useKEY_LOCAL_MACHINE\System\ControlSet001.Instead of
HKEY_CURRENT_USER, useHKEY_USERS<SID>, where SID is either a SID of the current user or an asterisk (*) to represent any SID. - DATA: Registry key data value.
- KEY PREVIOUS NAME: Name of the registry key before modification.
- VALUE NAME: Registry value name.
To specify an additional exception (match this value except), click the + to the right of the value and specify the exception value.
-
-
(Optional) To limit the scope to a specific source, click the + to the right of the value and specify the exception value.
Specify one or more attributes for the source.
Use a pipe (** ) to separate multiple values. Use an asterisk (***) to match any string of characters. - NAME: Name of the parent process.
- PATH: Path to the parent process.
- CMD: Command-line used to initiate the process, including any arguments, up to 128 characters.
- MD5: MD5 hash value of the process.
- SHA256: SHA256 hash value of the process.
- USER NAME: User who executed the process.
- SIGNATURE: Signing status of the parent process: Signature Unavailable, Signed, Invalid Signature, Unsigned, Revoked, Signature Fail.
- SIGNER: Entity that signed the certificate of the parent process.
- PID: Process ID of the parent process.
- Run search for process, Causality, and OS actors: The causality actor—also referred to as the causality group owner (CGO)—is the parent process in the execution chain that the Cortex XDR agent identified as being responsible for initiating the process tree. The OS actor is the parent process that creates an OS process on behalf of a different indicator. By default, this option is enabled to apply the same search criteria to initiating processes. To configure different attributes for the parent or initiate the process, clear this option.
-
(Optional) Limit the scope to an endpoint or endpoint attributes:
Specify one or more of the following attributes: Use a pipe (** **) to separate multiple values. Use an asterisk (*) to match any string of characters.
- HOST: HOST NAME, HOST IP address, HOST OS, HOST MAC ADDRESS, or INSTALLATION TYPE.
- INSTALLATION TYPE can be either Cortex XDR agent or Data Collector.
- PROCESS: NAME, PATH, CMD, MD5, SHA256, USER NAME, SIGNATURE, or PID.
-
Specify the time period for which you want to search for events.
Options are Last 24H (hours), Last 7D (days), Last 1M (month), or select a Custom time period.
-
Choose when to run the query.
Select the calendar icon to schedule a query to run on or before a specific date or Run to run the query immediately and view the results in the Query Center.
While the query is running, you can always navigate away from the page and a notification is sent when the query completes. You can also Cancel the query or run a new query, where you have the option to Run only new query (cancel previous) or Run both queries.
- When you are ready, view the results of the query. For more information, see Review XQL query results.
Query across all entities
From the Query Builder you can perform a simple search for hosts and processes across all file events, network events, registry events, process events, event logs for Windows, and system authentication logs for Linux.
Some examples of queries you can run across all entities include:
- All activities on a host
- All activities initiated by a process on a host
How to build a query
- From Cortex XSIAM, select Investigation & Response → Search → Query Builder.
- Select ALL ACTIONS.
-
(Optional) Limit the scope to a specific acting process:
Select Add Process to your search, and specify one or more of the following attributes for the acting (parent) process. Use a pipe ( ) to separate multiple values. Use an asterisk (*) to match any string of characters. Field Description NAME Name of the parent process. PATH Path to the parent process. CMD Command line used to initiate the parent process including any arguments, up to 128 characters. MD5 MD5 hash value of the parent process. SHA256 SHA256 hash value of the process. USER NAME User who executed the process. SIGNATURE Signing status of the parent process: Signed, Unsigned, N/A, Invalid Signature, Weak Hash. SIGNER Entity that signed the certificate of the parent process. PID Process ID of the parent process. Run search on process, Causality and OS actors The causality actor, also referred to as the causality group owner (CGO), is the parent process in the execution chain that the agent identified as being responsible for initiating the process tree. The OS actor is the parent process that creates an OS process on behalf of a different initiator. By default, this option is enabled to apply the same search criteria to initiating processes. To configure different attributes for the parent or initiating process, clear this option. -
(Optional) Limit the scope to an endpoint or endpoint attributes:
Select Add Host to your search and specify one or more of the following attributes:
- HOST: HOST NAME, HOST IP address, HOST OS, HOST ADDRESS, or INSTALLATION TYPE.
- INSTALLATION TYPE can be either an agent, or data collector.
-
PROCESS: NAME , PATH , CMD , MD5 , SHA256 , USER NAME , SIGNATURE, or PID.
Use a pipe ( ) to separate multiple values. Use an asterisk (*) to match any string of characters.
-
Specify the time period for which you want to search for events.
Options are Last 24H (hours), Last7D (days), Last1M (month), or select a Custom time period.
-
Choose when to run the query.
Select the calendar icon to schedule a query to run on or before a specific date or Run the query immediately and view the results in the Query Center.
While the query is running, you can always navigate away from the page and a notification is sent when the query completes. You can also Cancel the query or run a new query, where you have the option to Run only new query (cancel previous) or Run both queries.
- When ready, view the results in a query.
Cortex XQL syntax, parameters, and examples
When building custom query pipelines, you must configure them with specific arguments and data types. For comprehensive syntax rules, structural requirements, and sample query code, use the Cortex XQL Command Reference.
Graph Search
What is Graph Search?
Notice
This feature is included with a Cortex XSIAM Premium license. It is also included with any other Cortex XSIAM license that has the Cloud Posture Security or Cloud Runtime Security add-on.
Prerequisite
Graph Search requires View or View/Edit RBAC permissions for Graph Search under Investigation & Response → Search.
Graph Search provides an interactive and visually intuitive way for you to search assets and findings by their relationship types and map them out in real-time. The resulting graphical illustration helps provide a unified and comprehensive view of complex relationships between assets, security findings, and contextual data that tie them together. This information without a clear visual representation in the form of a model can be difficult to understand through the data alone. The graph results can help you better grasp the full stack of your organization's posture and the associated risks it drives, including attack paths and discovering hidden risks. These results can be used to make informed decisions in less time to improve your security posture and operational efficiency.
Graph Search queries are created using the built-in query interface embedded in the Query Builder. Every query is structured to use a certain pattern and includes default data objects that you define by selecting the ones you want to query from the data collected in the applicable datasets based on the data sources configured. The resulting graph provides an illustration of your selections, which you can export to a PNG, SVG, or TSV file. In addition, Graph Search contains a Query Library for saving and managing your own queries, queries shared with you, and built-in Graph Search queries provided by Palo Alto Networks.
Show me around Graph Search
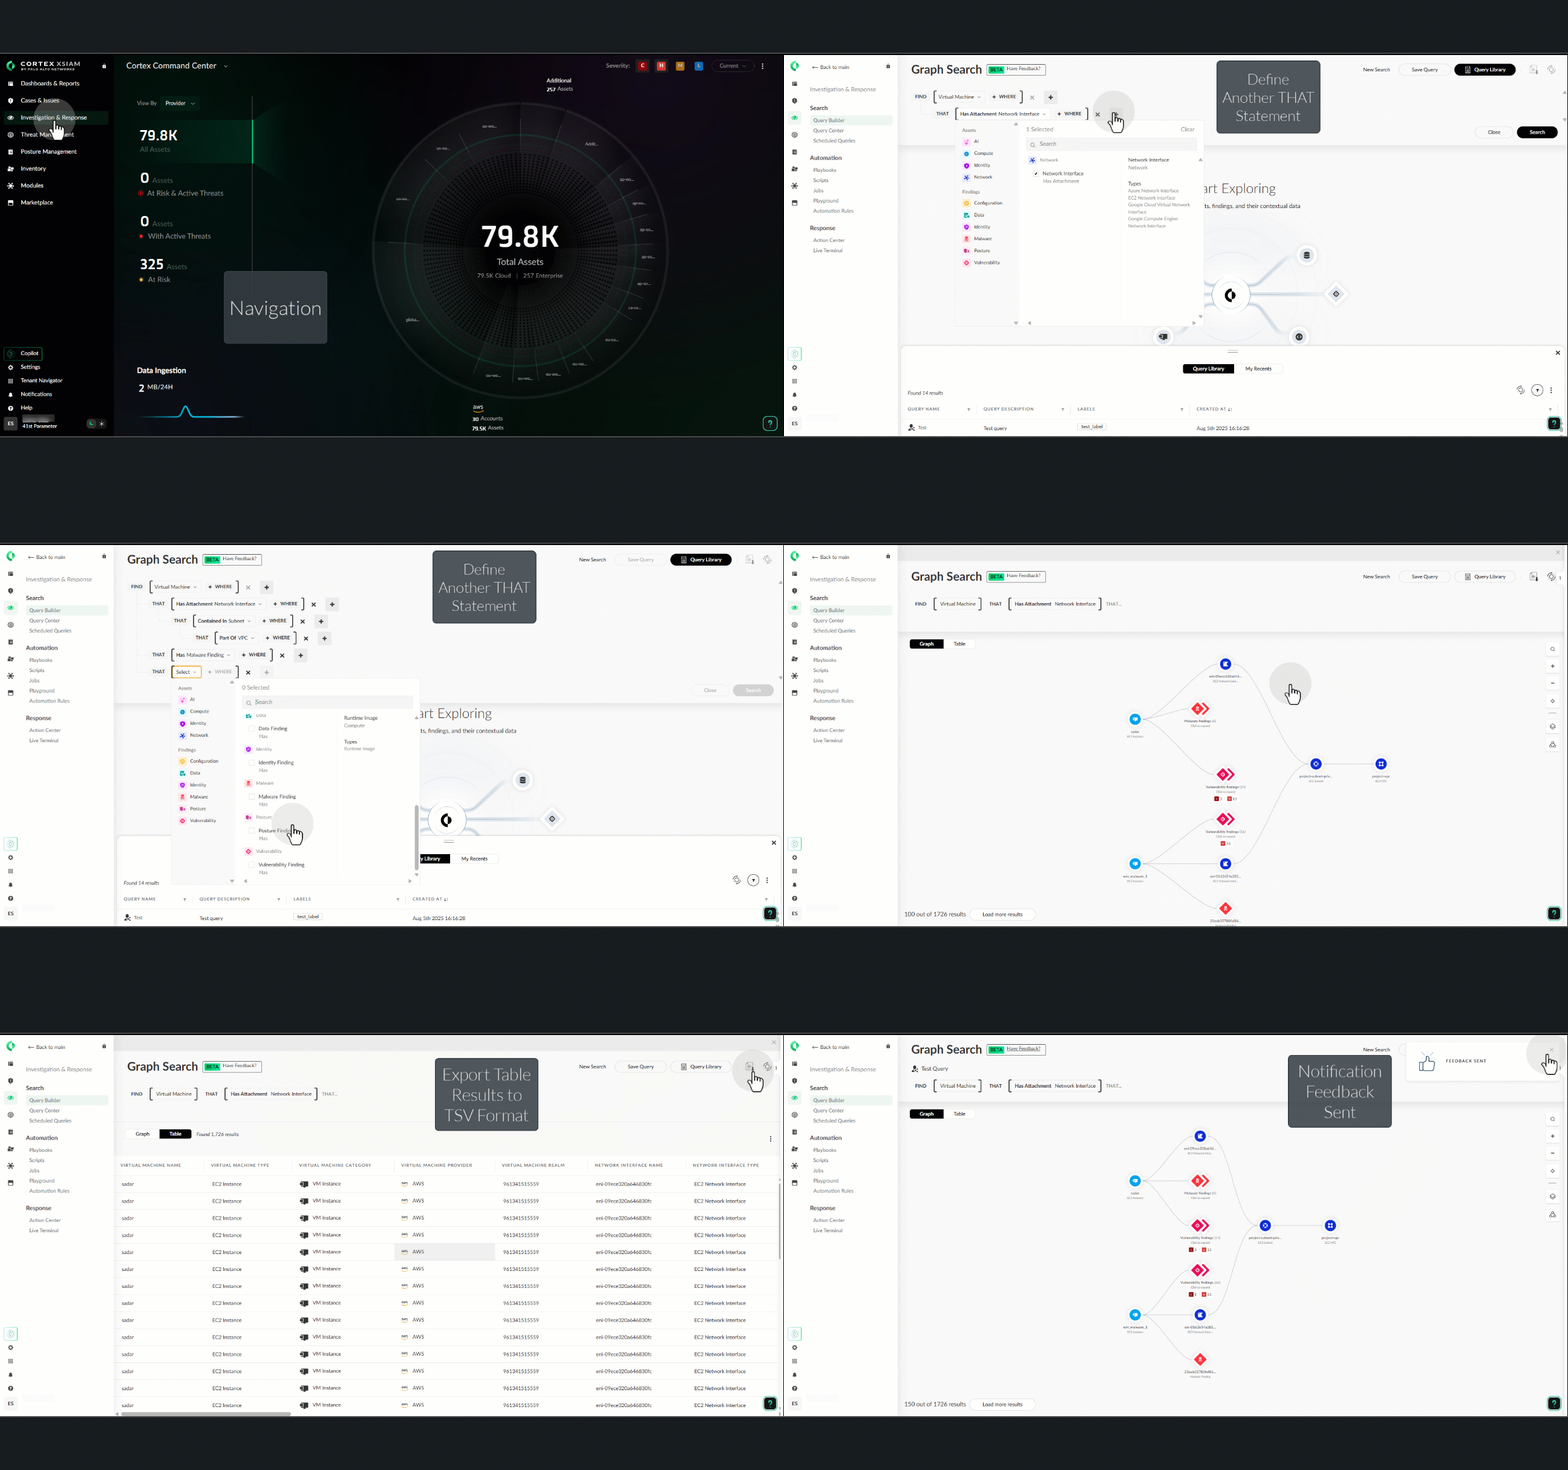
Get started with Graph Search queries
Notice
This feature is included with a Cortex XSIAM Premium license. It is also included with any other Cortex XSIAM license that has the Cloud Posture Security or Cloud Runtime Security add-on.
Prerequisite
Graph Search requires View or View/Edit RBAC permissions for Graph Search under Investigation & Response → Search.
Before you start to search assets and findings by their relationships by building Graph Search queries, consider the following:
- Understand your assets and findings data: Graph Search queries are based on the current data that has been collected for assets and findings from the data sources configured and then sent to the Unified Asset Inventory (UAI), which is displayed in the All Assets page (Inventory → Assets → All Assets). The built-in query interface enables you to filter the parameter values by selecting the relevant data from your assets and findings. Ensure to familiarize yourself with this data to build your queries.
- For more information on assets, see All assets.
- For more information on findings, see Findings and events.
- Learn more about the query structure using the built-in interface: Although the Graph Search queries are built using a built-in interface, you should understand the query structure to ensure that you build the queries correctly. For more information, see How to build Graph Search queries?.
- Understand the Graph Search query results: Once your query is complete, you can search for the results. The results can be viewed in a graph or table format. For more information, Understand Graph Search query results.
- Try out some examples: To help you feel confident with building Graph Search queries, start by following our step-by-step examples and tailor them for your environment. For more information, see Graph Search examples.
- Learn more about the Graph Search Query Library and run the built-in queries: Graph Search contains a Query Library for saving and managing your own queries, queries shared with you, and built-in Graph Search queries provided by Palo Alto Networks. We recommend that you run these built-in queries as these examples provide common, important, and popular use cases. For more information, see Manage the Graph Search Query Library.
How to build Graph Search queries?
This feature is included with a Cloud Posture Security, Cloud Runtime Security, or Cortex XSIAM Premium license.
Prerequisite
Graph Search requires View or View/Edit RBAC permissions for Graph Search under Investigation & Response → Search.
You can build Graph Search queries using the built-in query interface embedded in the Query Builder. Graph queries are composed of assets, findings, and relationship types that connect them. These data objects are represented by nodes and edges, and the paths are found based on the contextual data. Every query is structured to use a certain pattern and includes these default data objects that you define by selecting the available assets and findings that you want to query in the graph. The output is provided by default in a Graph format, but you can also view the results as a Table format. The resulting graph provides an illustration of the nodes, node attributes, and edges that can connect two nodes based on your selections in the query.
To support multi-cloud and hybrid environments efficiently and intuitively, Graph Search queries use a normalized data model that attempts to optimize finding categories of assets and findings. A subset of assets and finding types, referred to as nodes and edges, is supported. For more information, see Supported assets and findings.
You submit Graph Search queries using the Investigation & Response → Search → Query Builder → Graph Search built-in query interface.
Show me around the Graph Search built-in query interface
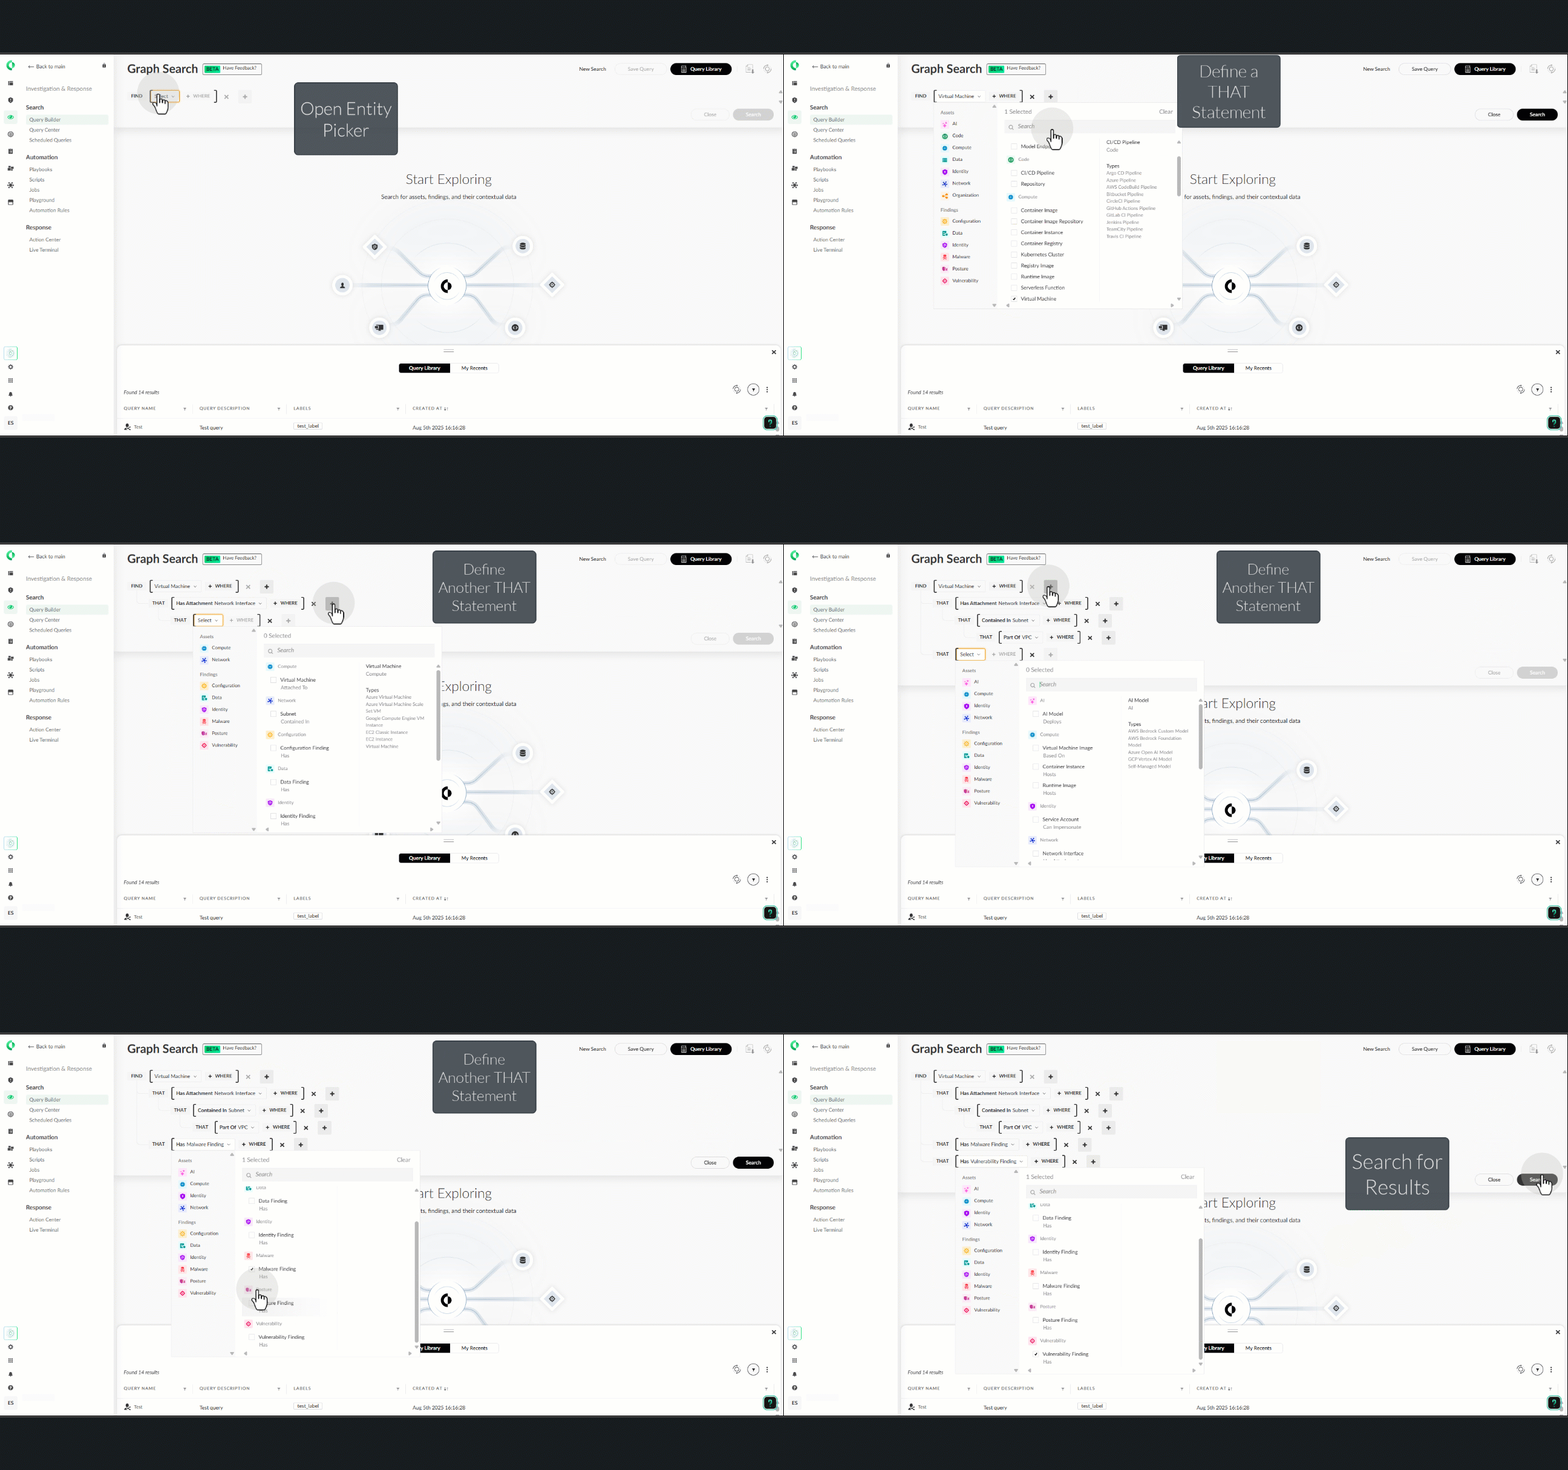
Keywords in the query interface
There are different key words that are included in the Graph Search query interface, which, as you select them, guide you through the query-building process:
- FIND: Defines the start of any Graph Search query, which is followed by the relevant node (entity) types.
- Select (mandatory): Opens the node picker dialog box, where you can select the different node types. Multiple nodes are defined with an
ORrelationship between them. The top-level node selection acts as the root of the query. There are two different types of nodes, where each node has its own unique shape, icon, and color:- Asset nodes: Each asset node is depicted as a circle in the resulting graph, where the color and icon displayed is dependent on the asset category and class types selected. There are multiple class types available for each asset node category selected. Once a class type is selected in the node picker dialog box, and you hover over it, all the available asset types are listed. For more information, see All assets.
- Finding nodes: Each finding node is depicted as a diamond in the resulting graph, where the color and icon displayed are dependent on the finding type selected. There is only one category type available for each finding selected.
-
WHERE: List of conditions that apply to the node types that were selected following the
FIND/THATstatements. The conditions are based on node attributes and their values. At each level of the query, the relationship between node attribute conditions isAND. No other logical operator is available.For each attribute type, there is a defined behavior for filtering data:
- Array values with
ORrelationship. - Multi-selection (
ORrelationship) from a predefined ENUM. - Multi-selection (
ORrelationship) from a list of data objects that exist in the Graph Search database. For example, the scope of cloud accounts enables you to choose from the available cloud account object that exists in the database.
The attribute operators are used to define the standard operators, such as
ContainsandGreater than. Depending on the attribute selected, different attribute operators are available. - Array values with
- THAT: Defines the relationship between nodes as every
THATmarks an edge to the next node type. The possible edges are selected based on the graph schema. You can add a THAT statement to a Graph Search query by clicking the + icon available on each line of the query interface.
Providing feedback
Use the Have Feedback? link in the Graph Search query interface to provide valuable feedback about the feature and any improvements you'd recommend.
Understand Graph Search query results
Notice
This feature is included with a Cortex XSIAM Premium license. It is also included with any other Cortex XSIAM license that has the Cloud Posture Security or Cloud Runtime Security add-on.
Prerequisite
Graph Search requires View or View/Edit RBAC permissions for Graph Search under Investigation & Response → Search.
Review the following topics:
Once the query is completed, you can search for your query results. The results displayed are dependent on your data.
You can view the Graph Search query results in two formats:
- Graph (default): Displays the paths on the graph that matched the node types and conditional attributes in the query. Each result is a full path of the matching query.
- Table: Displays the results in a table, where each row in the table represents a different path in the graph that goes through all the matching node types and attributes as they appear in the Graph Search query. Every asset and finding table shows different default columns. For more information, see Table view columns. You can view the full asset information of any cell in the table by clicking the cell.
You can export the Graph Search results as a PNG, SVG, or TSV file. You can always edit the query once the results are displayed, which means that the old results are discarded and the new results are displayed. In addition, you can save the results to the Query Library.
Graph output
The Graph Search resulting graph displays the paths according to the nodes and conditional attributes that you selected in your query. Here are a few things to keep in mind when viewing the graph results:
- There are two different types of nodes, where each node has its own unique shape, icon, and color:
- Asset nodes: Each asset node is depicted as a circle in the resulting graph, where the color and icon displayed is dependent on the asset category and class types selected. There are multiple class types available for each asset node category selected. Once a class type is selected in the node picker dialog box and you hover over it, all the available asset types are listed according to the data collected. For more information, see All assets.
- Finding nodes: Each finding node is depicted as a diamond in the resulting graph, where the color and icon displayed is dependent on the finding type selected. There is only one category type available for each finding selected.
-
In the resulting query, nodes are automatically grouped together to keep the graph looking cleaner and less busy. Nodes are grouped when there are at least five nodes that meet the following conditions:
- The node isn't a root node.
- The path is identical.
- For asset nodes, the nodes have the same class and category type.
- For finding nodes, the nodes have the same category type.
A grouped node icon is displayed as a duplicate node. For example, if it's a group node, the icon looks like two shapes, one on top of another. When you select the group node, a dialog box opens displaying all the nodes included in the group.
- When you select each node, or hover on it and select More Info, you'll see more information displayed in a dialog box. You can click View Details to drill down even further on the node to display more information on the node depending on the data collected for that asset or finding node selected.
- Vulnerability finding nodes automatically display under the node the breakdown of severity.
- Every Graph Search query returns a maximum of 50 paths with an indication displayed at the bottom of the page of the total number of results.
- On the right side of the graph results, different icons can help you drill down into your graph results:
- + and - icons: Use the plus and minus icons to zoom in and out of the graph.
 : Use the diamond icon to center your graph after you've manipulated the output.
-
 : Use the layers icon to easily add or remove additional information to the graph without having to define these parameters in your Graph Search query. You can decide when to include these built-in layers, as needed. The following are available:
- Public Exposure to the Internet: Tracks the asset nodes with internet exposure that could be targeted for external surface attacks by displaying the exposure path. A Globe node called Internet is added to the graph, which links all exposed asset nodes to this Globe node. You can expand this connection by clicking the + icon to reveal the full internet path to include, for example, the NIC, Subnet, and Gateway. In the exposure path, you can select each node or hover on it and select More Info; you'll see more information displayed in a dialog box. You can click View Details to drill down even further on the asset node to display more information on the node depending on the data collected for that asset node selected. Internet paths are collapsed by default.
- Related Cases: Displays the number of related Cases for each asset node with a breakdown by severity.
- Runtime Events: Adds 100 most recent runtime events to the graph results, which are refreshed every hour. This enables you to investigate real-time activity and identify critical events, such as access to sensitive information typically contained in a storage bucket, which generate issues and cases. All the bucket nodes in the path include a runtime icon
 underneath and run an animation on all the bucket and virtual machine nodes. You can click the runtime icon to reveal more info, such as connection details and runtime events. Click Show Recent Events to display the Runtime Events table with more details on the last 100 events.
The results from the different layers are displayed in tabs in the node dialog box, which enables you to quickly switch from one layer to the other.
 : Use the Group nodes icon to group by the Cloud Provider, Cloud Account, or Cloud Region. Selecting one of these grouping enables you to view the graph results in an aggregated format, providing a clearer and more organized perspective of the data. This feature also helps to identify patterns and trends more easily in your data by grouping similar entities together. In the future, the Group nodes feature will be expanded to enable additional groupings.
Show me an example of Graph Search results with general tips and tricks
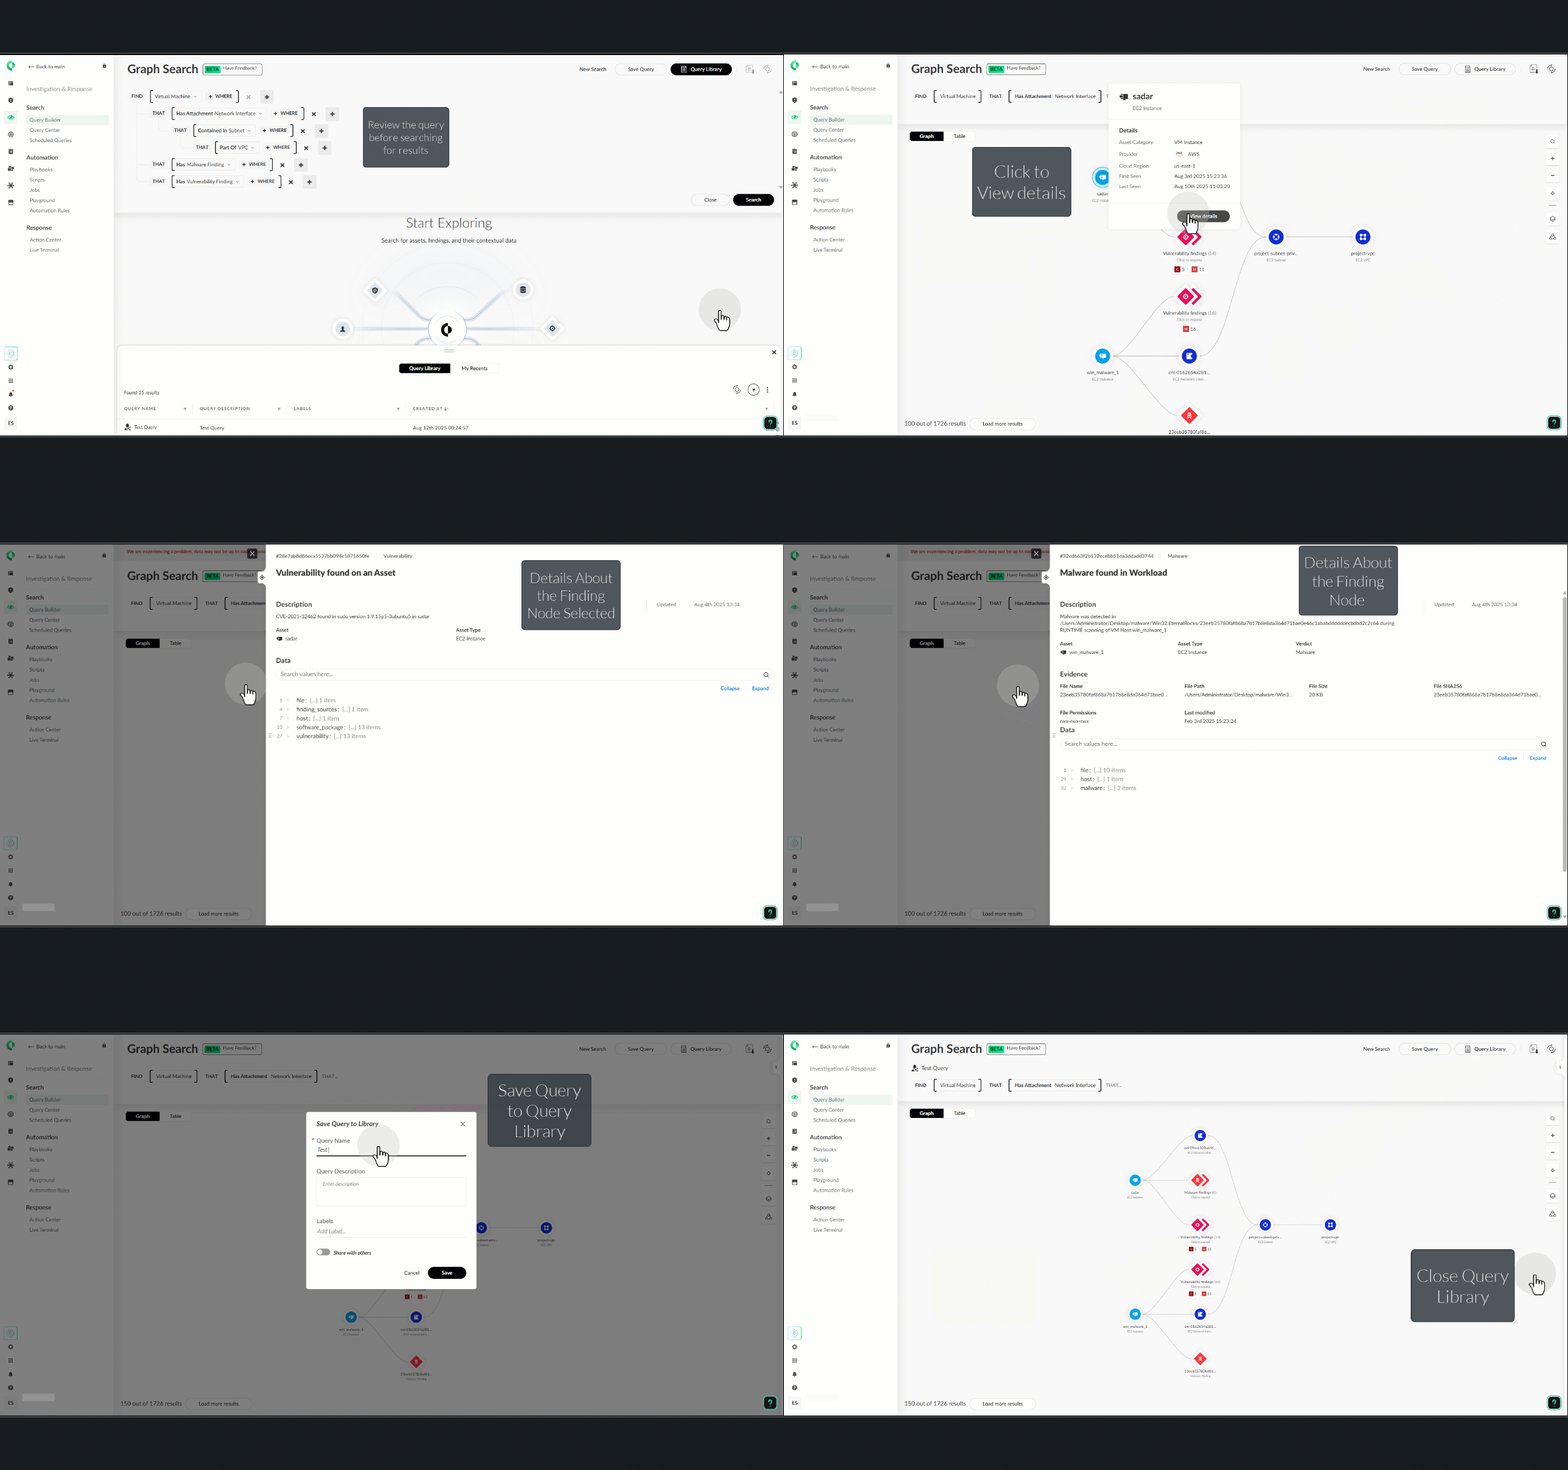
Show me how to use the layers and group node icons in the Graph Search results
This example focuses on using the layers icon to add or remove additional information to the graph and how to group information together using the Group node icon.
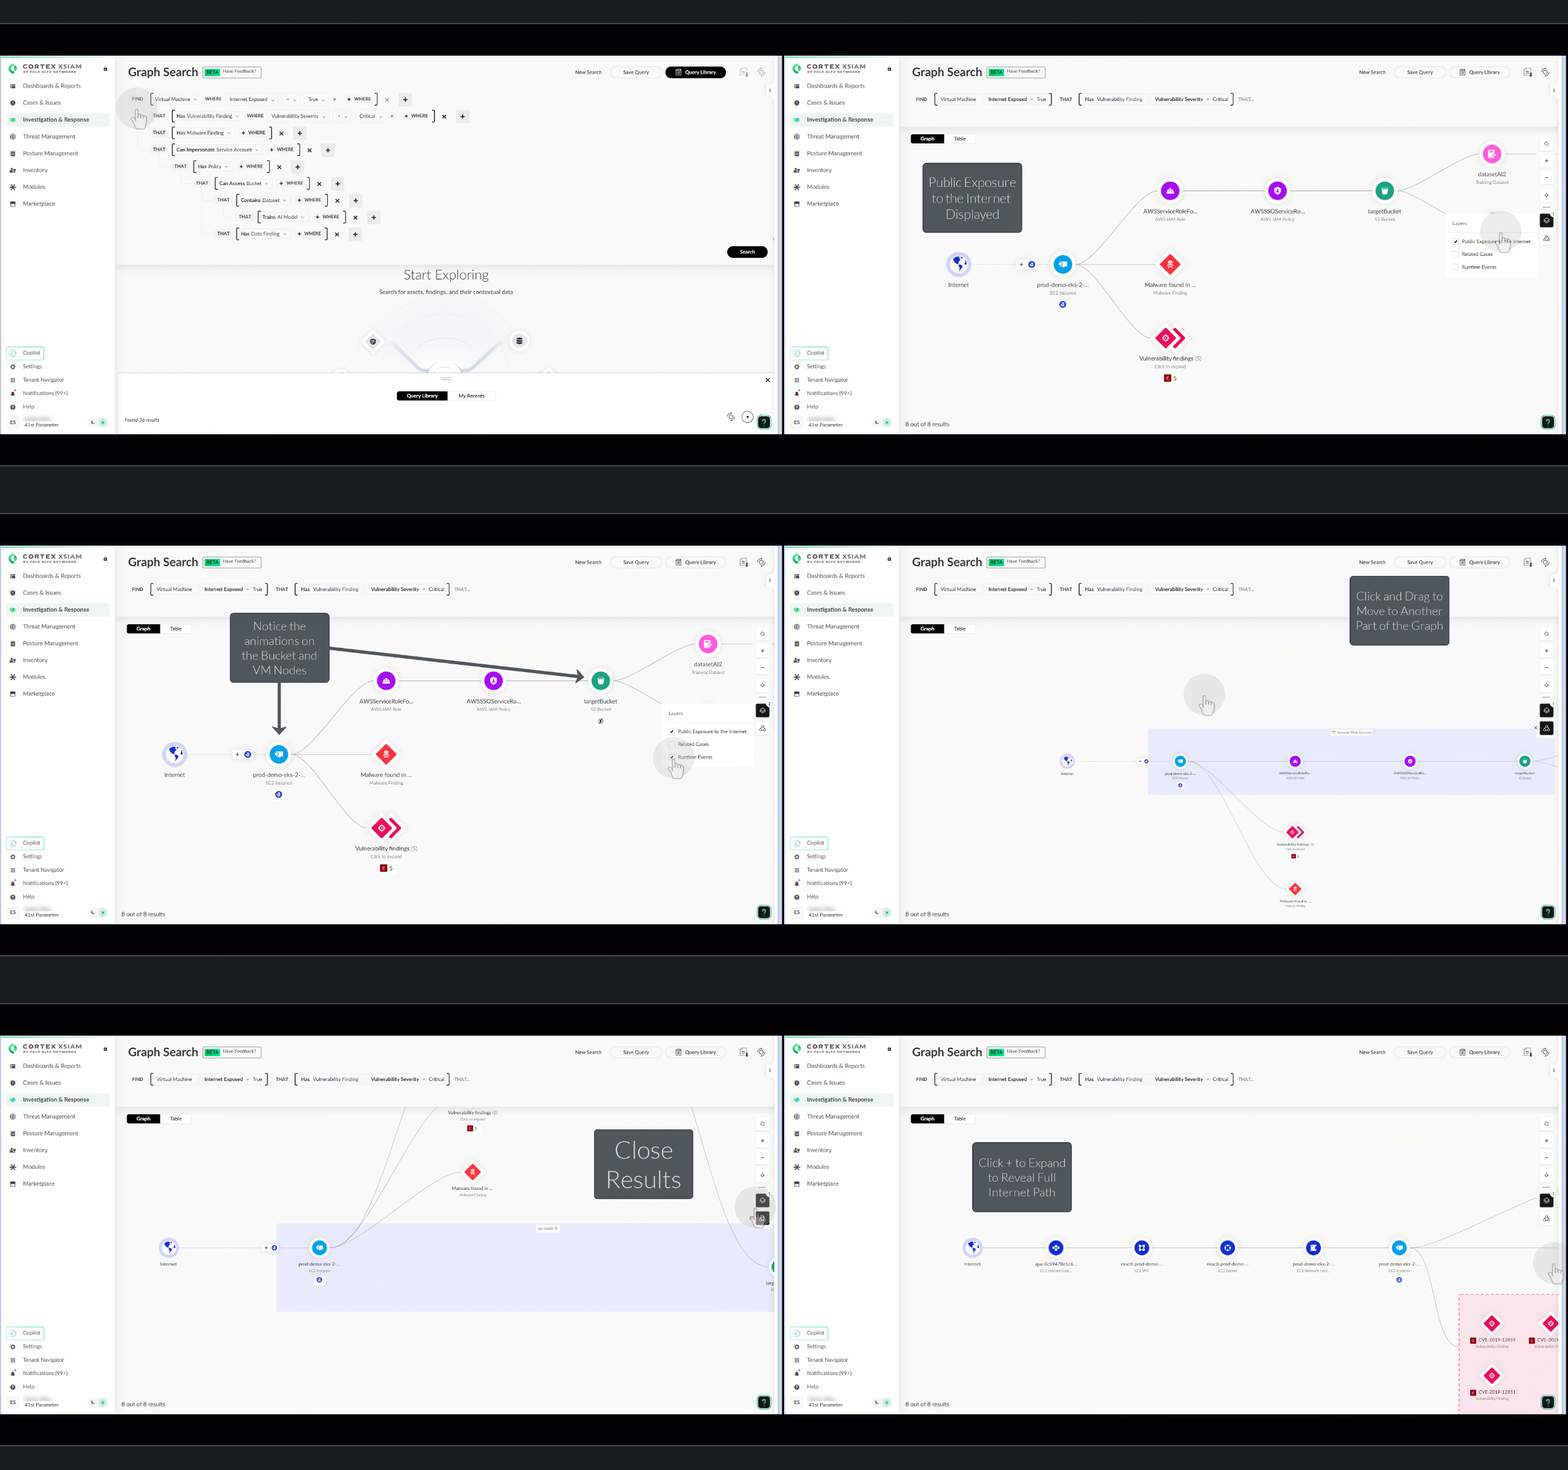
Table view columns
Below is a list of the different columns displayed by default in the assets and findings tables.
Asset table
Below is a list of the default columns that are displayed within any asset table, where the names of the columns can change slightly depending on the asset selected. In addition, some assets have additional columns.
- All assets tables:
- Asset Name
- Asset Type
- Asset Category
- Asset Provider
- Asset Realm
- All assets additional columns:
- <name of asset> ID
- Identity finding additional columns:
- Identity Account Access
- Identity Admin Permissions
- Identity Cloud Region
- Identity Empty
- Identity Excessive
- Identity Guest
- Identity Has MFA
- Identity Last Login
- Identity Last Used
Finding table
Below is a list of the default columns that are displayed with in any finding table, where the names of the columns can change slightly depending on the finding selected. In addition, some findings have additional columns.
- All findings tables:
- Finding Name
- Finding Category
- Vulnerability finding additional columns:
- Vulnerability Finding Package ID
- Vulnerability Finding CVE ID
- Vulnerability Finding Severity
- Vulnerability Finding Fix Versions
- Vulnerability EPSS Score
- Vulnerability Package ID
- Vulnerability Exploitable
- Vulnerability Affected Versions
- Vulnerability Status
- Vulnerability CVE Vendor Link
- Vulnerability Fix Date
- Vulnerability Publish Date
- Vulnerability Derived from Base Image
- Vulnerability CVSS Score
- Vulnerability CVSS Vector
- Vulnerability Has a Fix
- Vulnerability Fix Versions
- Vulnerability Severity
- Vulnerability CVE ID
- Malware finding additional columns:
- Malware Finding File Path
- Malware Finding SHA256
- File Permissions
- File Name
- File Size
- File Path
- File Last Modified Time
- Verdict
- SHA256
- Data finding additional columns:
- Data Finding Secret Location
- Data Finding Secret Snippet
- Secret Snippet
- Secret Location
- File Path
- File Code Line
Create Graph Search query
Notice
This feature is included with a Cortex XSIAM Premium license. It is also included with any other Cortex XSIAM license that has the Cloud Posture Security or Cloud Runtime Security add-on.
Prerequisite
Graph Search requires View or View/Edit RBAC permissions for Graph Search under Investigation & Response → Search.
Review the following topics:
- Get started with Graph Search queries
- How to build Graph Search queries?
- Understand Graph Search query results
- Graph Search examples
- Manage the Graph Search Query Library
Build Graph Search queries to search your assets and findings by their relationship types and map them out in a unified and understandable view. You can build Graph Search queries using the built-in query interface embedded in the Query Builder.
- Select Investigation & Response → Search → Query Builder → Graph Search.
- From inside the Graph Search query interface at the top of the Graph Search page, click Select to open the entity picker dialog box.
-
Choose the assets and findings nodes that you want to query.
Keep in mind that multiple nodes are defined with an
ORrelationship between them. The top level node selection acts as the root of the query. -
To apply a condition to the assets or findings nodes that you've selected, click WHERE. Otherwise, skip to the next step.
Select the applicable field (termed node attribute), operator, and value for the condition you want to define. The operators and values change according to the node attribute (field) that you select. At each level of the query, the relationship between node attribute conditions is
AND. No other logical operator is available. - To define a relationship between the assets or findings nodes already selected and a new node, click +.
- Define the THAT statement by selecting the new assets and findings nodes that you want to relate to the other nodes.
- To apply a condition to the new asset and findings nodes that you've selected, repeat step #4.
- Repeat steps #5 to #7 until you've finished building your query logic.
-
When your query is complete, or at any time that you want to view the query results, click Search.
The Graph Search results are displayed in a graph format by default. You can toggle to Table to view the results in a table format. In addition, you can export the graph results using the icon at the top of the page to a PNG, SVG, or TSV file.
Tip
- After running the query, you can view the complete query by hovering over the last THAT... in the Graph Search query interface, and the query is displayed in a tooltip.
- If your query doesn't find any results or you want to change your query for any reason, you can always click anywhere in the Graph Search query interface, where your existing query is defined, to display the complete query, update your query, and rerun the search.
-
You can save your query to the Query Library by clicking Save Query.
- Set these parameters:
- Query Name: Specify a unique name for the Graph Search query. Query names must be unique in both private and shared lists, which includes other people’s queries.
- Query Description (Optional): Specify a descriptive name for your Graph Search query.
- Labels (Optional): Specify a label that is associated with your Graph Search query. You can add a label and then select Create Label, or select a label from the list, if any exist from a previous query. Adding a label to your Graph Search query enables you to search for queries using this label in the Query Library.
- Share with others: You can either set the Graph Search query to be private and only accessible by you (default) or move the toggle to Share with others the query, so that other users using the same tenant can access the query in their Query Library.
-
Click Save.
A notification appears confirming that the query was saved successfully to the library, and closes on its own after a few seconds.
The Graph Search query that you added is now listed as the first entry in the Query Library.
Note
For more information about the Query Library, see Manage the Graph Search Query Library.
- Set these parameters:
Graph Search examples
Notice
This feature is included with a Cortex XSIAM Premium license. It is also included with any other Cortex XSIAM license that has the Cloud Posture Security or Cloud Runtime Security add-on.
Prerequisite
Graph Search requires View or View/Edit RBAC permissions for Graph Search under Investigation & Response → Search.
Review the following topics:
- Get started with Graph Search queries
- How to build Graph Search queries?
- Understand Graph Search query results
- Create Graph Search query
The best way to learn how to create Graph Search queries is to try out a few examples. The examples below provide a good guide to creating Graph Search queries. One thing to keep in mind if you try these queries in your own environment, the search results can differ according to your collected data.
This example takes you through building a query with asset nodes. The query looks at the virtual machines (VMs) in your network that are connected to the Internet, attached to a Network Interface, are contained in a subnet, and are part of a virtual private cloud (VPC).
Step 1: Search for all VMs on your network
- Select Compute → Virtual Machine, and click Search.
Graph Search results: A graph displaying all the virtual machines in your network, where some are connected to the internet, and some are not connected to the internet.
Step 2: Filter the VMs to only display the ones connected to the Internet
- Click Edit Query, and define the following WHERE statement:
- Select field = Internet Exposed
- Leave the equal (=) operator.
- Select values = true.
- Click Search.
Graph Search results: A graph displaying all the virtual machines in your network that are connected to the Internet.
Step 3. Display the VM connected to the Internet with an attachment to a Network Interface
- Click Edit Query and then +.
- Define the THAT statement by selecting Network → Network Interface.
- Click Search.
Graph Search results: A graph displaying all the virtual machines in your network that are connected to the Internet with a network interface attached.
Step 4. Display the VM connected to the Internet with an attachment to a Network Interface and is contained in a subnet
- Click Edit Query and then +.
- Define the THAT statement by selecting Network → Subnet.
- Click Search.
Graph Search results: A graph displaying all the virtual machines in your network that are connected to the internet with a network interface attached, and are contained in a subnet.
Step 5. Display the VM connected to the Internet with an attachment to a Network Interface, is contained in a subnet, and is part of a VPC
- Click Edit Query and then +.
- Define the THAT statement by selecting Network → VPC.
- Click Search.
Graph Search results: A graph displaying all the virtual machines in your network that are connected to the internet with a network interface attached, are contained in a subnet, and are part of a VPC.
Manage the Graph Search Query Library
Notice
This feature is included with a Cortex XSIAM Premium license. It is also included with any other Cortex XSIAM license that has the Cloud Posture Security or Cloud Runtime Security add-on.
Prerequisite
Graph Search requires View or View/Edit RBAC permissions for Graph Search under Investigation & Response → Search.
Cortex XSIAM provides as part of Graph Search a Query Library for saving and managing your own queries, queries shared with you, and built-in Graph Search queries provided by Palo Alto Networks to help illustrate how to build meaningful Graph Search queries on your data. When creating a query in Graph Search or managing your Graph Search queries from the Query Center, you can save queries to your personal query library as part of the Query Library. You can also decide whether the Graph Search query is shared with others (on the same tenant) in their Query Library or unshare it, so it is only visible to you. You can also view the Graph Search queries that are shared by others (on the same tenant) in your Query Library.
How to access the Query Library?
The Query Library is accessible from the Graph Search page. By default, it's open as a separate pane at the bottom of the page. Whenever the Query Library is closed, you can always click Query Library at the top right corner of the page to reopen it.
What does the Query Library include?
The Query Library consists of two tables called Query Library (default) and My Recents, which you can toggle. The Query Library table lists all the Graph Search queries available in your Query Library, while the My Recents table only lists the Graph Search queries that you've run from the Graph Search page, Query Library table, My Recents table, and Query Center.
The queries listed in your Query Library table have different icons to help you identify the different states of the queries:
- Created by me and unshared.
- Created by me and shared.
- Created by someone else and shared.
- Created by Palo Alto Networks.
Adding queries to the Query Library
Graph Search queries can be added to the Query Library in multiple ways.
-
Save a query to your personal query library.
You can do this in following ways:
- From Graph Search in the Query Builder
- Select Investigation & Response → Search → Query Builder → Graph Search.
- From inside the Graph Search query interface at the top of the Graph Search page, click Select to open the entity picker dialog box, and define the parameters of your query.
- Click Search to run your query and view the query results.
- Click Save Query.
- From Graph Search in the My Recents table of the Query Library
- Select Investigation & Response → Search → Query Builder → Graph Search.
- Click Query Library.
- Toggle to My Recents to open your recent queries.
- Right-click anywhere in the Graph Search query row, and select Save query to library.
- From the Query Center
- Select Investigation & Response → Search → Query Center.
- Locate the Graph Search query that you want to save to the Query Library.
- Right-click anywhere in the Graph Search query row, and select Save query to library.
- From Graph Search in the Query Builder
- Set these parameters:
- Query Name: Specify a unique name for the Graph Search query. Query names must be unique in both private and shared lists, which includes other people’s queries.
- Query Description (Optional): Specify a descriptive name for your Graph Search query.
- Labels (Optional): Specify a label that is associated with your Graph Search query. You can add a label and then select Create Label, or select a label from the list, if any exist from a previous query. Adding a label to your Graph Search query enables you to search for queries using this label in the Query Library.
- Share with others: You can either set the Graph Search query to be private and only accessible by you (default) or move the toggle to Share with others the query, so that other users using the same tenant can access the query in their Query Library.
-
Click Save.
A notification appears confirming that the query was saved successfully to the library, and closes on its own after a few seconds.
The Graph Search query that you added is now listed as the first entry in the Query Library.
Managing Graph Search queries in the Query Library
As needed, you can return to your queries in the Query Library to manage your queries in both the Query Library and My Recents tables. Here are the actions available to you, where the options differ depending on the table and states of the query:
- Filter the list of queries using the filters displayed on the column headings of the table.
- Run: Run the Graph Search query from either the Query Library and My Recents tables. This pivot (right-click) option will close the Query Library to display the query results.
- Save as new: Duplicate the query and save it as a new query. This pivot (right-click) option is only available from the Query Library table for all queries.
- Save query to library: This pivot (right-click) option is only available from the My Recents table.
- Share with others: If your query is currently unshared, you can share with other users on the same tenant your query, which will be available in their Query Library. This pivot (right-click) option is only available from the query menu of the Query Library table when your query is unshared.
- Unshare: If your query is currently shared with other users, you can Unshare the query and remove it from their Query Library. This pivot (right-click) option is only available from the query menu of the Query Library table when your query is shared with others. You can only Unshare a query that you created. If another user created the query, this option is disabled in the query menu.
- Remove the query. You can only remove queries that you created. If another user created the query or for Palo Alto Networks, this pivot (right-click) option is disabled in the query menu.
Edit and run queries in Query Center
From the Query Center you can take action on the Completed and In Progress queries that are running on your tenant.
Right-click a query to see the available options, where some of the options differ depending on the type of query you've selected. The pivot (right-click) options described below are some of the ones that may require further explanation.
Note
If query limits are applied to your tenant, the number of concurrent running queries is limited per user. If query usage is reaching the defined limit, a system message warns you that a high query load is impacting performance. If you exceed the limit, new queries are blocked until query usage drops. You can view all active queries under Query Center → Active Queries, and cancel queries to reduce the load.
View the results of a query
You can view the original results of an XQL query when it was originally run in the Query Builder and added to the Query Center.
- Select Investigation & Response → Search → Query Center → Query History.
-
Identify the XQL query by looking in the Query Name and Query Description columns.
The Query Description column displays the parameters that were defined for a query. If necessary, use the filter on the column to reduce the number of queries displayed.
Queries that were created from a Query Builder template are prefixed with the template name.
-
Right-click anywhere in the XQL query row and select Show results.
You have the option to Show results in new tab or Show results in same tab.
- (Optional) Export to file to export the results to a tab-separated values (TSV) file.
-
(Optional) Perform additional investigation on the issues.
Right-click a value in the results table to see the options for further investigation.
Run a query
You can run a query for a Graph Search query.
- Select Investigation & Response → Search → Query Center → Query History.
-
Identify the Graph Search query by looking in the Query Name and Query Description columns.
The Query Description column displays the parameters that were defined for a query. If necessary, use the filter on the column to reduce the number of queries displayed.
-
Right-click anywhere in the Graph Search query row and select Run query.
You have the option to Run in same tab or Show in new tab.
- (Optional) The Graph Search results are displayed in a graph format by default. You can toggle to Table to view the results in a table format. In addition, you can always export the graph results using the icon at the top of the page to a PNG, SVG, or TSV file. Table results can only be exported to a TSV file.
-
(Optional) Perform additional investigation on the graph or table results.
On the graph results, you can either hover or select different nodes for further investigation. While in the table results, you can select any cell in the table for further investigation.
Modify a query
After you view the query results of an XQL query or run a Graph Search query as explained in the tasks above, you can change your search parameters to refine the search results or correct a search parameter.
- For queries created in XQL, type your changes in the XQL query field where the original query is listed and the results are displayed in the Query Results tab. After modifying the query, you can run, schedule, or save the query.
- For queries created with a Query Builder template, the defined parameters are shown at the top of the Results page. Select Back to edit to modify the query with the template format or Continue in XQL to open the query in XQL.
- For Graph Search queries, the graph results are displayed. Click anywhere in the Graph Search query interface, where your existing query is defined, to display the complete query, update your query, and rerun the search.
Schedule a query to run
You can schedule an XQL query to run on or before a specific date. Cortex XSIAM creates a new query in the Query Center, and when the query completes, it displays a notification in the notification bar.
How to schedule a query
- Select Investigation & Response → Search → Query Center → Query History.
- Right-click anywhere in the query and then select Schedule.
- Choose a schedule option and the date and time that the query should run:
- Run one time query on a specific date
- Run query by date and time: Schedule a recurring query.
-
Click OK to schedule the query.
Cortex XSIAM creates a new query and schedules it to run on or by the selected date and time.
-
View the status of the scheduled query on the Scheduled Queries page.
You can also make changes to the query, edit the frequency, view when the query will next run, or disable the query. For more information, see Manage scheduled queries.
Cancel a query
Note
You can cancel your own queries. To cancel queries run by other users, you must have View/Edit permissions for Configurations → Query Management. By default, Instance administrators have View/Edit permission.
On the Active Queries tab you can cancel one or more In Progress queries. You might want to cancel long-running queries, or cancel queries to reduce tenant consumption. If query limits are applied to your tenant and you exceed the defined limit of concurrent running queries, new queries are blocked until the number of active queries falls below the threshold. Canceling active queries allows you to unblock and run new queries.
How to cancel a query
- Select Investigation & Response → Search → Query Center → Active Queries.
- Select one or more queries and click Cancel Selected Queries.
Note
- Cancelled queries show a Canceled status. You can see details of all canceled queries in the Query History tab.
- You cannot cancel correlation rule queries.
- If you cancel a scheduled query, only the current query is cancelled. Future recurrences of the scheduled query are not affected.
Query Center reference information
The table below lists the common fields in the Query Center, where the options differ for an XQL query versus a Graph Search query.
Note
Certain fields are exposed and hidden by default. An asterisk (*) is beside every field that is exposed by default.
Query Center table
| Field | Description |
|---|---|
| BQL | <p>Indicates whether the Cortex Query Language (XQL) query was created by the native search.</p><p>Native search has been deprecated; this field allows you to view data for XQL queries performed before deprecation.</p> |
| COMPUTE UNIT USAGE | For XQL queries, indicates the number of query units that were used to execute the API query and Cold Storage query. |
| ISSUED BY * | For XQL queries, indicates the user who ran or scheduled the query. For Graph Search queries, indicates the user who ran the query. |
| DURATION (SEC) | Number of seconds it took to execute the XQL query. |
| EXECUTION ID | Unique identifier of XQL and Graph Search queries in the tenant. The identifier ID generated for queries executed in Cortex XSIAM and XQL query API. |
| NUM OF RESULTS* | Number of results returned by the query. |
| PUBLIC API | Whether the source executing the XQL query was an XQL query API. |
| QUERY DESCRIPTION* | Query parameters used to run the query. |
| QUERY ID | Unique identifier of the query. |
| QUERY NAME* | <ul><li><p>For saved queries, the Query Name identifies the query specified according to a randomly generated number.</p><ul><li>XQL queries use the format XQL-QUERY-<number>, such as XQL-QUERY-12.</li><li>Graph Search queries use the format Graph-Query-<number>, such as Graph-Query-1247.</li></ul></li><li>For scheduled queries, the Query Name identifies the auto-generated name of the parent XQL query. Scheduled queries also display an icon to the left of the name to indicate that the XQL query is recurring.</li></ul><p></p> |
| QUERY STATUS* | <p>Status of the query, where the options differ based on the query type:</p><ul><li><p>XQL queries:</p><ul><li>Queued: The query is queued and will run when there is an available slot.</li><li>Running</li><li>Failed</li><li>Partially completed: The query was stopped after exceeding the maximum number of permitted results. The default results for a Cortex Data Model (XDM) query or an XQL dataset query is limited to 1000, when no limit is explicitly stated in the query. This applies to basic queries with no stages except the fields stage. This default limit does not apply to widgets, Correlation Rules, public APIs, saved queries, or scheduled queries, where the limit is a maximum of 1,000,000 results. Queries based on legacy templates are limited to 10,000 results. To reduce the number of results returned, you can adjust the query settings and rerun.</li><li>Stopped: The query was stopped by an administrator.</li><li>Completed</li><li>Deleted: The query was pruned.</li></ul></li><li><p>Graph Search queries:</p><ul><li>Failed</li><li>Completed</li></ul></li></ul> |
| QUERY SYNTAX | The exact syntax used to write the query. |
| RESULTS SAVED* | For XQL queries, you can choose whether to save the query results, so the output of the field is either Yes or No. Yet, for Graph Search queries, the results can't be saved and must be run each time again, so the field is always No. |
| SIMULATED COMPUTE UNITS | Number of XQL query units that were used to execute the Hot Storage query. |
| Source | Source from which the query was run, for example Playbook, Report, or Investigation. |
| Source ID | ID of the source from where the query was run. |
| Source Name | Name of the source from where the query was run. |
| TIMESTAMP* | Date and time the query was created. |
| XQL | Indicates whether the XQL query was created by an XQL search. |
Supported assets and findings
Notice
This feature is included with a Cortex XSIAM Premium license. It is also included with any other Cortex XSIAM license that has the Cloud Posture Security or Cloud Runtime Security add-on.
Prerequisite
Graph Search requires View or View/Edit RBAC permissions for Graph Search under Investigation & Response → Search.
The following tables list the supported assets and findings that can be used in Graph Search.
Supported assets table
Below are the asset classes and asset categories that are supported. When clicking on any asset category, the applicable asset types are displayed in the entity picker of the Graph Search user interface for building query based on the available data.
| Asset Class Name | Asset Category |
|---|---|
| AI | <ul><li>AI Model</li><li>AI Workspace</li><li>Dataset</li><li>Model Endpoint</li></ul> |
| API | <ul><li>API Endpoint</li><li>API Gateway</li></ul> |
| Code | <ul><li>CI/CD Pipeline</li><li>Repository</li></ul> |
| Compute | <ul><li>Container Cluster</li><li>Container Image</li><li>Container Image Repository</li><li>Container Instance</li><li>Container Registry</li><li>Container Service</li><li>Container Specification</li><li>Container Workload</li><li>Kubernetes Cluster</li><li>Kubernetes ConfigMap</li><li>Kubernetes Endpoint</li><li>Kubernetes Gateway API</li><li>Kubernetes Ingress</li><li>Kubernetes Namespace</li><li>Kubernetes Network Policy</li><li>Kubernetes Node</li><li>Kubernetes Secret</li><li>Kubernetes Service</li><li>Kubernetes Workload</li><li>Registry Image</li><li>Runtime Image</li><li>Serverless Function</li><li>Virtual Machine</li><li>Virtual Machine Image</li></ul> |
| Data | <ul><li>Backup</li><li>Bucket</li><li>Database</li><li>Disk</li></ul> |
| External Surface | <ul><li>Services</li></ul> |
| Identity | <ul><li>Group</li><li>Identity</li><li>Policy</li><li>Service Account</li></ul> |
| Network | <ul><li>Gateway</li><li>Load Balancer</li><li>Network Interface</li><li>Public internet</li><li>Subnet</li><li>VPC</li></ul> |
| Organization | <ul><li>Account</li><li>Organization</li><li>Organization Unit</li></ul> |
Supported findings table
Below are the findings categories that are supported, along with the name of the category that you select in the entity picker of the Graph Search user interface.
| Finding Category Name | Finding Category to Select in Graph Search |
|---|---|
| Configuration | Configuration Finding |
| Data | Data Finding |
| Identity | Identity Finding |
| Malware | Malware Finding |
| Posture | Posture Finding |
| Vulnerability | Vulnerability Finding |
FAQ on Graph Search
Notice
This feature is included with a Cortex XSIAM Premium license. It is also included with any other Cortex XSIAM license that has the Cloud Posture Security or Cloud Runtime Security add-on.
Prerequisite
Graph Search requires View or View/Edit RBAC permissions for Graph Search under Investigation & Response → Search.
Here are several Frequently Asked Questions (FAQ) about Graph Search:
What data is currently searchable in Graph Search?
For this release, several assets and findings are supported. For the upcoming releases, we will roll out more assets and provide the ability to model new services. For more information on the supported assets and findings, see Supported assets and findings.
Can the Graph Search results be exported and in what formats?
For this release, you can export the Graph Search results to a PNG, SVG, and TSV file.
Can the Graph Search results be grouped in the output?
Yes, there are two types of groupings possible - automatic groupings and manual groupings that you can apply to the graph results displayed.
How are the Graph Search query results displayed?
The query results are displayed in a graph (default) or table format. In a graph format the paths on the graph that matched the node types and conditional attributes in the query are displayed. Each result is a full path of the matching query. Yet, in a table format the results are displayed in a table, where each row in the table represents a different path in the graph that goes through all the matching node types and attributes as they appear in the Graph Search query. You can view the full asset information of any cell in the table by clicking the cell. Every asset and finding table shows different default columns.
Are there any built-in manipulations to the query results that I can apply or are they automatically displayed without having to update and rerun the Graph Search query?
Yes, the following are available:
- On the right side of the graph results, there are different icons that can help you drilldown into your graph results. These two icons provide built-in manipulations without having to make any changes to your Graph Search query:
- : Use the layers icon to easily add or remove additional information to the graph without having to define these parameters in your Graph Search query. You can decide when to include these built-in layers, as needed. The following are available:
- Public Exposure to the Internet: Tracks the asset nodes with internet exposure that could be targeted for external surface attacks by displaying the exposure path. A Globe node called Internet is added to the graph, which links all exposed asset nodes to this Globe node. You can expand this connection by clicking the + icon to reveal the full internet path to include, for example, the NIC, Subnet, and Gateway. In the exposure path, you can select each node, or hover on it and select More Info, you'll see more information displayed in a dialog box. You can click View Details to drill down even further on the asset node to display more information on the node depending on the data collected for that asset node selected. Internet paths are collapsed by default.
- Related Cases: Displays the number of related Cases for each asset node with a breakdown by severity.
- Runtime Events: Adds 100 most recent runtime events to the graph results, which are refreshed every hour. This enables you to investigate real-time activity and identify critical events, such as access to sensitive information typically contained in a storage bucket, which generate issues and cases. All the bucket nodes in the path include a runtime icon underneath and run an animation on all the bucket and virtual machine nodes. You can click the runtime icon to reveal more info, such as connection details and runtime events. Click Show Recent Events to display the Runtime Events table with more details on the last 100 events.
- : Use the Group nodes icon to group by the Cloud Provider, Cloud Account, or Cloud Region. Selecting one of these grouping enables you to view the graph results in an aggregated format, providing a clearer and more organized perspective of the data. This feature also helps to Identify patterns and trends more easily in your data by grouping similar entities together. In the future, the Group nodes feature will be expanded to enable additional groupings.
- Vulnerability finding nodes automatically display under the node a breakdown of severity.
Are Graph Search queries accessible from the Query Library and are there any built-in queries that come out-of-the-box to view?
Cortex XSIAM provides, as part of Graph Search, a Query Library for saving and managing your own queries, queries shared with you, and built-in Graph Search queries provided by Palo Alto Networks to help illustrate how to build meaningful Graph Search queries on your data.
Create detection rules based on graph search
Prerequisites\
License: This feature is included with a Cortex XSIAM Premium license. It is also included with any other Cortex XSIAM license that has the Cloud Posture Security or Cloud Runtime Security add-on.
Graph Search requires View or View/Edit RBAC permissions for Graph Search under Investigation & Response → Search.
The Graph Engine is a Cortex detection method that identifies threats by analyzing relationships between entities rather than evaluating individual events in isolation.\
The engine periodically queries a contextual security graph that represents your environment as:
- Nodes, such as identities, configurations, code repositories, data stores, and cloud resources.
- Edges and paths, which represent the relationships and access routes between those entities.\
Graph detection rules evaluate these relationships to identify risky combinations and potential attack paths. When a rule matches, the Graph Engine creates a live, evidence-backed issue in the Cortex issues experience.
The Graph engine includes system graph rules by default. You can also create your own custom rules to identify attack paths in your organization.
Key characteristics
- Detection type: Graph-based detection that evaluates relationships and paths between entities.
- Cyclic evaluation: Graph rules run periodically rather than evaluating each event as it arrives. By default, the engine runs every 6 hours.
- Path-based issue: Each issue is uniquely identified by the rule ID and the graph path that triggered it. This allows the engine to track matching paths across evaluation cycles and automatically close issues generated by outdated rule versions.
- Rule output: The Graph Engine creates issues that appear in the Cortex issues experience.
Create a detection rule based on a graph search
A graph detection rule tells the engine what pattern of connected entities to look for in the contextual search graph. Each rule pairs a graph query with metadata, for example, severity, category, description, resolution plan. When the query matches one or more paths in the graph, each matching path triggers a security issue.
To create a rule, navigate to Investigation & Response → Graph Search.
- Build your query as detailed in Create Graph Search query.
- In the three dot menu, click Save as Rule.
- In the New Graph Rule page, under General, add the following details
- Main Settings:
- Name: A unique name for the rule.
- Description: A description of the rule.
- Labels (optional): Add labels to the rule.
- Severity: Select a severity level for the issue that will be triggered.
- Remediation (optional): Provide remediation instructions.
- Compliance Controls (optional): Select a control from the controls catalog.
- In the Condition page, the graph query you have built is displayed. You can use the relevant options to edit your query. For more information about how to build your graph query, see Create Graph Search query. Use Generate Preview to view the results of your query.
- In The Summary page, review the rule and click Save.
After the rule is synced and enabled, the Graph engine picks it up on the next cycle and triggers issues for every matching path.
View and manage Graph rules
To view the Graph generated rules, in Posture Management → Rules & Policies → Rules → Cloud Security, filter the Rules widget by Graph. Manage the graph rules using the right click actions:
- System rules: Disable
- Custom rules: Disable, Edit, Save as, Delete
Click each row in the table to view the rule details in the side panel. To view the results of the query, next to the query click Show in Graph Search. The panel also displays any issues generated by the rule, affected assets, linked cases, and the graph evidence.
About Cortex CLI
The Cortex CLI is a unified command-line tool that integrates scanning for Cloud Workload Protection (CWP), API Security (WAAS), and Code Security (AppSec). From a single binary, security teams can enforce organizational policies and proactively detect vulnerabilities, misconfigurations, and exposed secrets across source code, container images, and API specifications.
Scope: The Cortex CLI evaluates findings against Unified Application Security Policies and returns structured results with policy correlation, severity breakdowns, and remediation guidance. The Cortex CLI does not create, edit, or delete policies; all policy management operations are performed through the Cortex Cloud tenant or the public API.
Primary use cases
The CLI supports the following primary workflows:
- Local code development (AppSec): Enable developers to detect hardcoded secrets, IaC misconfigurations, and vulnerable dependencies directly from their terminal before committing code
- CI/CD automation: Embed security checks into build scripts (such as Jenkins, GitHub Actions) to automatically detect issues and enforce security gates during the build process
- Container Workloads (CWP): Integrate container scanning directly into CI builds to detect vulnerabilities and malware before images are pushed to production registries
- API Testing: Evaluate application endpoints for high-risk vulnerabilities and specification leaks as a standard step prior to deployment
Core capabilities
The Cortex CLI consolidates multi-domain security scanning into a single executable tool:
- Unified scanning engine: Integrates native scanning for Cloud Workload Protection (CWP), API Security, and Code Security. A single set of global flags controls authentication, output format, upload behavior, and error handling across all scan types
- Code security: Detects hardcoded secrets, Infrastructure-as-Code (IaC) misconfigurations, and open-source dependency vulnerabilities (SCA) directly within developer environments. The SCA scanner generates Software Bills of Materials (SBOMs) for supply chain compliance
- Container security (CWP): Generates Software Bill of Materials (SBOMs) and detects vulnerabilities or malware in container images before registry push. Container scanning integrates directly into CI builds to prevent vulnerable images from reaching production registries
- API risk validation: Identifies vulnerabilities, sensitive data leaks, and configuration errors by analyzing OpenAPI and Swagger specifications. API testing validates application endpoints for high-risk vulnerabilities and specification leaks as a standard step prior to deployment
- Automated security guardrails: Enforces compliance directly within CI/CD pipelines by dynamically blocking deployments that violate organizational security policies
Prerequisites
Before installing and running the Cortex CLI, verify that your environment and account meet the following system and access requirements:
| Prerequisite | Description |
|---|---|
| License | An active Cortex Cloud license with the Application Security add-on for Code Security if required |
| Permissions | <p>The API key must be associated with a user or role that has CLI Tools permissions:</p><ul><li><p>View: grants read-only access (sufficient for --upload-mode no-upload).</p><p>This role is not supported for CWP, as the CWP system does not support offline mode.</p></li><li>View/Edit: grants full access including scan result upload (required for --upload-mode upload and --upload-mode no-code)</li></ul><p>There are no preconfigured CLI-specific roles. Add the CLI Tools permission to an existing role or create a dedicated custom role.</p> |
Connect Cortex CLI
Connect Cortex CLI to scan supported Cortex Cloud modules and gain insights into your security posture, enabling you to identify, analyze and address potential risks.
Prerequisites and requirements
System requirements
On Intel Core i7 Macs, such as Sequoia, install vectorscan:
brew install vectorscan
- RHEL 8.10 and Red Hat UBI 9: Install
patchelfandzstd. - Ubuntu 20: Install
prefetch. -
Ubuntu linux-amd64: Install
libhyperscan5.sudo apt install libhyperscan5
Windows supports AMD64 and ARM64 architectures.
Cortex Cloud IDE extension
If you run terminal actions from a Cortex Cloud IDE extension, use Command Prompt. PowerShell is unsupported for these actions.
Utility requirements for cURL-based downloads
Install both curl and jq. Install jq for your platform:
brew install jq
sudo apt-get install jq
sudo yum install jq
Download jq from jq GitHub releases, or run:
choco install jq
Authentication and permissions
- API key: The CLI authenticates with an API key. No CLI roles exist by default. Ensure the key's role has the required permissions
- API Security level: Set the API key security level to
Standard. Scans fail with theAdvancedlevel - Local scans only: Use a role with
CLI Read Onlyread-only permissions - Upload results: Use a role with
CLI View/Editwrite permissions
For permission details, see Cortex CLI.
Configure how the CLI uses your API key in Authenticate credentials.
Generate API keys in the UI, or use the self-service workflow to create role-restricted CLI and IDE keys through the Public API. The self-service workflow uses a Primary API key. See Self-service API keys for CLI scans.
Installation workflows
You can choose from three main installation workflows:
- Package manager: The recommended developer workflow. Use Homebrew on macOS or Linux, or Scoop on Windows
- Manual download: Download binaries directly for any operating system
- UI-based installation: Download and authenticate the CLI from your tenant
Post-installation configuration
After installation, you can upgrade, pin, uninstall, or update Cortex CLI through automated downloads. Refer to manage the CLI for more information.
Module-specific requirements
AppSec module support
Supported Linux environments
The AppSec module supports these Linux environments:
- RHEL 10: Kernel
6.12, glibc2.39 - Debian 12: Kernel
6.1.27, glibc2.36 - Ubuntu 18.04: Kernel
4.15, glibc2.27 - Ubuntu 20.04: Kernel
5.4, glibc2.31 - Ubuntu 22.04: Kernel
5.15, glibc2.35 - Ubuntu 24.04: Kernel
6.8, glibc2.39
SCA requirements
Runtime requirements
Install these runtime layers on the host running Cortex Unified CLI:
- Layer 1 (the baseline):
Node.js v22+is enforced. It is required to boot the SCA engine. - Layer 2 (per-ecosystem toolchain): Install the native language runtime or package manager for the code being scanned. Without the matching toolchain, the SCA engine cannot resolve dependencies.
| Scanned project type | Additional toolchain needed locally, beyond Node v22 |
|---|---|
| Java (Maven) | JDK and mvn |
| Java (Gradle) | JDK and gradle |
| .NET | .NET SDK (dotnet) |
| Python | Python and pip or pipenv |
| Ruby | Ruby and bundler |
| Go | Go toolchain |
| JavaScript/Node | npm or yarn (covered by Node v22) |
Suppression requirements
These practices are required for SCA vulnerability suppression:
- Run the CLI from the current working directory. Use its absolute path.
- Set
--repo-idto<repo_owner_name>/<repo_name>. - Exact match: The
<repo_name>in your parameter must precisely match the exact name of your local directory.
For example, when the working directory is Users/test/<repo_name>, use:
--repo-id <repo_owner_name>/<repo_name>
Troubleshooting
cortexcli --version shows an unexpected version
An older cortexcli binary may appear earlier in your PATH. This can come from a .pkg installer, manual download, or tenant download.
Find every installed copy
which -a cortexcli
where.exe cortexcli
Check the package manager location
The package-managed binary should be at one of these locations:
- macOS with Homebrew:
/opt/homebrew/bin/cortexclior/usr/local/bin/cortexcli - Linux with Homebrew:
/home/linuxbrew/.linuxbrew/bin/cortexcli - Windows with Scoop:
%USERPROFILE%\scoop\shims\cortexcli.exe
Remove the older copy
- macOS
.pkginstaller: Runsudo rm /usr/local/bin/cortexcli. - Manual or tenant download: Delete the binary path returned by the command.
- Windows installer: Uninstall it in Settings → Apps → Installed apps.
Open a new terminal. Then run cortexcli --version again.
Learn more
Installation workflows
Choose the installation workflow that fits your environment.
Before installing the CLI, complete the prerequisites.
Install through a package manager
Using a package manager is the recommended method for installing the Cortex CLI. Use Homebrew for macOS and Linux, or Scoop for Windows.
Homebrew for macOS and Linux
Supported on macOS, Apple Silicon and Intel, and Linux, x86_64 and arm64.
Requires Homebrew.
Standard installation
brew tap paloaltonetworks/cortexcli brew install cortexcli cortexcli --version
Pin a specific version (optional)
If your workflow requires a specific version, use one of these methods.
Pin a release line
For example, stay on the 0.18.x release line.
This locks the CLI to a minor version. Security patches continue automatically.
brew install cortexcli@0.18 # keg-only — add to PATH if needed: echo 'export PATH="$(brew --prefix cortexcli@0.18)/bin:$PATH"' >> ~/.zprofile
Pin an exact version
For example, install exactly 0.18.0.
This locks the CLI to one build. It prevents automatic updates.
Scoop for Windows
Supported on Windows x64.
Requires Scoop.
Standard installation
scoop bucket add cortexcli https://github.com/PaloAltoNetworks/homebrew-cortexcli scoop install cortexcli cortexcli --version
Install a specific version (optional)
If your workflow requires a specific version, use:
scoop install cortexcli@0.18.0
Manual download
You can manually download the binaries for macOS, Linux, or Windows.
Download the archive from the releases page. Verify it against SHA256SUMS, then extract it.
| Step | macOS / Linux | Windows |
|---|---|---|
| Download | Download the .tar.gz archive for your architecture |
Download the .zip archive |
| Extract | The executable is named cortexcli |
The executable is named cortexcli.exe |
Add to PATH |
Move cortexcli to a directory such as /usr/local/bin/ |
Move cortexcli.exe to a dedicated folder. Add that folder to Environment Variables |
UI-based installation
Install the CLI directly from your Cortex tenant. The UI generates a tenant-specific command that downloads and authenticates the binary.
Generate the installation command
- Navigate to Settings → Data Sources → + Data Source.
- Search for Cortex CLI.
- Select Connect or Connect Another Instance on the Cortex CLI card.
- In Configure, select your operating system. Then click Next.
- In Authenticate, generate an API key.
- Select With upload results permissions to create a CLI View/Edit role.
- Otherwise, the key receives a CLI Read Only role with CLI View permissions.
The Cortex CLI requires an API key with the Standard security level.
- Save the generated API Key ID and API key.
- Copy the command from Retrieve your API key.
On macOS ARM64, unpack the download to access the executable.
- Verify the key appears in the API Keys inventory.
Download the CLI
Before you run the command, replace any placeholders with your credentials:
- Replace
${API_KEY}with the saved API key. - If needed, copy the API URL from Settings → Configurations → API Keys.
- Paste the completed command into your terminal. Then press Enter.
The generated command follows this syntax:
curl -k -u $CORTEX_API_ID::$CORTEX_API_KEY --output ./cortexcli $CORTEX_FQDN/api/v2/remote-li/{version}/{platform}/artifacts
This securely connects to your specific Cortex tenant ($CORTEX_FQDN) and downloads the cortexcli application directly to your current folder.
Make the CLI executable
On macOS and Linux, allow the downloaded binary to run:
chmod +x cortexcli
Verify the installation
Run the command that matches the binary location:
cortexcli -v
./cortexcli -v
If the terminal displays a version, return to Cortex Cloud and click Done.
Configure credentials before running scans. See Authenticate credentials.
Manage the CLI after installation
Manage Cortex CLI with a package manager or download script. Use either method in CI/CD pipelines or local environments.
Package managers
macOS and Linux
-
Upgrade to the latest version
brew upgrade cortexcli
-
Pin the installed version
brew pin cortexcli
-
Uninstall the CLI
brew uninstall cortexcli
Windows
-
Upgrade to the latest version
scoop update cortexcli
-
Prevent upgrades
scoop hold cortexcli
-
Allow upgrades again
scoop unhold cortexcli
-
Uninstall the CLI
scoop uninstall cortexcli
Automate binary downloads
Use this script for a manual installation. It downloads the latest release for your operating system and architecture. Replace your existing binary with the downloaded file. On macOS and Linux, make it executable with chmod +x.
crtx_resp=$(curl --fail "<CORTEX_API_URL>/public_api/v1/unified-cli/releases/download-link?os=<OS>&architecture=<ARCH>" \ -H "x-xdr-auth-id: <AUTH_ID>" \ -H "Authorization: ${CORTEX_API_KEY}") \ && crtx_url=$(echo $crtx_resp | jq -r ".signed_url") \ && crtx_file=$(echo $crtx_resp | jq -r ".file_name") \ && curl -o $crtx_file $crtx_url
Replace the placeholders
CORTEX_API_KEY: Your API key<CORTEX_API_URL>: Your tenant API base URL<AUTH_ID>: Your API key ID value<OS>: Your operating system —linux,darwin, orwindows<ARCH>: Your system architecture — such asamd64orarm64
For credential configuration options, see Authenticate credentials.
How the script works
The script:
- Requests a signed download link from Cortex Cloud for the latest release matching your OS and architecture.
- Uses
jqto extract the signed URL and binary filename. - Downloads the binary from the signed URL.
Authenticate credentials
Configure credentials before running Cortex CLI. The installer does not save them.
Choose the method that fits your workflow:
- Use a configuration file for persistent local authentication.
- Use environment variables for CI/CD pipelines.
- Use command-line flags for one-off commands or overrides.
Generate API keys in the UI, or use the self-service workflow to create role-restricted CLI and IDE keys through the Public API. The self-service workflow uses a Primary API key. See Self-service API keys for CLI scans.
Do not commit API keys or credential files to source control.
Configuration file
Use a cortex.env file for persistent local authentication. Cortex CLI reads this file automatically from your home or current working directory.
The file uses KEY=VALUE pairs.
macOS and Linux
Create ~/cortex.env and restrict access to it.
cat > ~/cortex.env << EOF CORTEX_API_BASE_URL=https://api-<TENANT>.xdr.us.paloaltonetworks.com CORTEX_API_KEY=<YOUR_API_KEY> CORTEX_API_KEY_ID=<YOUR_KEY_ID> EOF chmod 600 ~/cortex.env
Windows
Create cortex.env in your user profile.
$configPath = "$env:USERPROFILE\cortex.env" @" CORTEX_API_BASE_URL=https://api-<TENANT>.xdr.us.paloaltonetworks.com CORTEX_API_KEY=<YOUR_API_KEY> CORTEX_API_KEY_ID=<YOUR_KEY_ID> "@ | Out-File -FilePath $configPath -Encoding UTF8
Environment variables
Use environment variables for CI/CD pipelines. Store values in your CI/CD platform's secret store.
| Variable name | Description |
|---|---|
CORTEX_API_BASE_URL |
Your tenant URL (such as https://api-example.xdr.us.paloaltonetworks.com) |
CORTEX_API_KEY |
The secret key token |
CORTEX_API_KEY_ID |
The ID associated with the key |
macOS and Linux
export CORTEX_API_BASE_URL="https://api-<TENANT>.xdr.us.paloaltonetworks.com" export CORTEX_API_KEY="<YOUR_API_KEY>" export CORTEX_API_KEY_ID="<YOUR_KEY_ID>"
Windows
$env:CORTEX_API_BASE_URL="https://api-<TENANT>.xdr.us.paloaltonetworks.com" $env:CORTEX_API_KEY="<YOUR_API_KEY>" $env:CORTEX_API_KEY_ID="<YOUR_KEY_ID>"
Command-line flags
Use flags for one-off scans or to override configured credentials. Place global flags before the module name.
cortexcli --api-base-url <URL> --api-key <KEY> --api-key-id <ID> code scan ...
Self-service API keys for CLI scans
This self-service model uses a Primary API key as its master credential. It lets developers programmatically generate task-specific CLI and IDE keys through the Public API. Developers can provision restricted-access keys, such as read-only keys for local scans, without administrative UI permissions. This keeps each scan within the principle of least privilege.
Prerequisite
You must have sufficient administrative permissions within your tenant to create new roles and manage API keys.
IMPORTANT: When generating an API key, ensure you select the Standard security level. CLI scans will fail if the security level of the API key is set to Advanced.
Create custom roles
Navigate to your role management settings in the tenant to generate the following three roles with these exact permission sets.
| Role name | Required permission and description |
|---|---|
| CLI Read-Only Custom | CLI Tools View: Grants permission to run CLI scans and view output locally without uploading results to the tenant |
| CLI Write Custom | CLI Tools View/Edit: Grants permission to run CLI scans and upload/manage results within the tenant |
| Public API (PAPI) Edit | Public API View/Edit: Grants the administrative permission required to programmatically generate and manage new API keys |
Assign roles to a privileged user
To establish a Primary key holder, you must grant a specific privileged user the permissions from all three custom roles. Because the UI allows only one role to be assigned directly to a user, you must use User Groups to grant multiple roles simultaneously.
- Create user groups: Create three separate User Groups in your tenant, assigning one of the custom roles to each group.
- Add user to groups: Add the designated privileged user to all three of these User Groups.
- Verify accumulated permissions: Edit the primary user and ensure that the User Groups field includes the three user groups.
This user now has the combined authority to generate the Primary API Key required to set up programmatic key generation.
Generate and use API keys
The designated privileged user must manually generate a Primary API Key through the console. This key must be associated with the CLI Read-Only Custom, CLI Write Custom, and Public API (PAPI) Edit roles. The primary key acts as the master credential for subsequent automation.
Using the Primary Key, developers can now make calls to the Public API to generate subsequent keys as needed for IDE or CLI scans:
- To run scans without uploading the results to the platform: Generate a key and associate it only with the
CLI Read-Only Customrole. - To run scans and upload the results to the platform: Generate a key and associate it only with the
CLI Write Customrole.
The following curl command demonstrates how developers can use the Primary Key to generate a new API key assigned with the CLI Read-Only Custom role:
curl --request POST \ --url https://api-viso-k2ibu8behynsxbzuncdau6.xdr-qa2-uat.us.paloaltonetworks.com/public_api/v1/api_keys/generate \ --header 'Accept: application/json' \ --header 'Content-Type: application/json' \ --header 'authorization: <YOUR_PRIMARY_KEY_HERE>' \ --header 'x-xdr-auth-id: <YOUR_AUTH_ID>' \ --data '{ "request_data": { "roles": [ "CLI Read-Only Custom" ], "security_level": "standard", "comment": "Developer CLI Read-Only scan key", "expiration": 1773147108 } }'
For more information about generating API Keys, refer to Manage API keys.
To ensure the keys are configured correctly, privileged users can verify their status by navigating to Settings → API Keys. Locate the generated key in the API Keys inventory and confirm that the Role column reflects the specific custom role assigned rather than a broad administrative role.
Cortex CLI usage
Run a Cortex CLI scan
Run scans with this command structure:
cortexcli [global flags] [module name] scan [module flags]
Place global flags before the module name. Place module flags after scan.
Command components
cortexcli— The Cortex CLI binary.-
Global flags — Apply across supported modules. Place them between
cortexcliand the module name.--api-base-url <value>--api-key <value>--api-key-id <value>
AppSec and CWP support additional global flags. WAAS does not. See the Cortex CLI common command line reference guide.
- Module name — Select the environment to scan.
api— API Security. See Cortex CLI for API Security.image— Cloud Workload Protection (CWP). See Cortex CLI for Cloud Workload Protection.code— Cortex Cloud Application Security. See Cortex CLI for Code Security.
- Module flags — Apply to the selected command.
Examples
Global flags
Global flags apply to all modules. Place them between cortexcli and the module name.
# Authenticate and scan with global authentication flags cortexcli --api-base-url https://api.xdr.us.paloaltonetworks.com --api-key <KEY> --api-key-id <KEY_ID> code scan --directory .
Global flags for AppSec and CWP
Upload mode, exit-code handling, and log output are not supported by WAAS.
# Run an AppSec scan in no-upload mode with soft-fail and log output cortexcli --upload-mode no-upload --soft-fail --no-fail-on-crash --log code scan --directory .
Cortex Cloud Application Security scan
Scan source code for IaC misconfigurations, SCA vulnerabilities, and secrets:
# Scan a repository directory and filter results to critical and high severity cortexcli --upload-mode no-upload code scan --directory /path/to/repo --severity critical,high
See Cortex CLI usage for Cortex Cloud Application Security.
Cloud Workload Protection scan
Scan a container image for vulnerabilities:
# Scan a container image with soft-fail enabled cortexcli --soft-fail image scan --image myapp:latest
See Cortex CLI for Cloud Workload Protection.
API Security scan
Scan APIs for security issues. Global flags (other than authentication) are not supported:
# Run an API Security scan cortexcli api scan --api-spec /path/to/openapi.yaml
Cortex CLI common command line reference guide
Use these command-line flags to manage Cortex Cloud Application Security (AppSec), Cloud Workload Protection (CWP), and API Security through the Cortex CLI. Common flags apply to all supported modules. Global flags are shared across AppSec and CWP and must appear before the command. When a flag appears in both categories, it works the same way but requires different placement.
Module-specific flags are documented in their module references:
- cortex-cli-application-security-command-line-reference
- cloud-workload-protection-command-line-reference
- cortex-cli-api-security-command-line-reference-guide
Common flags
The following table describes CLI commands common to all supported Cortex CLI modules.
| Command | Description |
|---|---|
--api-base-url / $CORTEX_API_BASE_URL |
Required: true. The public facing API URL. To retrieve the URL, under Settings, select Configurations → API Keys copy API URL |
--api-key / $CORTEX_API_KEY |
Required: true. The API key used for authorization |
--api-key-id / $CORTEX_API_KEY_ID |
Required: true.The API key ID |
--support / $SUPPORT |
<p>Enable debug logs and upload the logs to the platform. Usage: Before the module name. Example: cortexcli --api-base-url <URL> --api-key <KEY> --api-key-id <ID> --support code scan directory. --upload-mode no-upload --repo-id my/test --branch test</p> |
--log-level / $MIN_LOG_LEVEL |
Set the logging level (INFO, WARNING, ERROR, DEBUG) for Stdout output |
--http-proxy / $HTTP_PROXY |
The HTTP proxy server URL to route traffic through |
--https-proxy / $HTTPS_PROXY |
The HTTPS proxy server URL to route traffic through |
--ca-certificate / $CORTEX_CODE_CA_CERTIFICATE |
<p>Required: No</p><p>Path to a custom CA certificate (bundle) file, in PEM format, used for TLS certificate verification. It is intended for environments that use a corporate proxy or perform TLS interception, where the standard system CA bundle does not contain the intercepting proxy's certificate. EXAMPLE: cortexcli --ca-certificate /path/to/ca-bundle.pem code scan --directory</p> |
--no-cert-verify / $CORTEX_CODE_NO_CERT_VERIFY / $NO_CERT_VERIFY |
This flag disables TLS/SSL certificate verification (default: false). Skips TLS certificate verification when connecting to the API. Not recommended for production. Use only in test or development environments, as this reduces connection security |
--help |
Displays usage information, available subcommands, global flags, and flag descriptions for the Cortex CLI or any specific subcommand. Run --help at any level of the command hierarchy to discover available options:• cortexcli --help: Lists all available modules (AppSec, CWP, WAAS), global flags, and getting-started guidance.• Authentication: The --help flag works without API key authentication. No credentials, network connectivity, or platform access are required. This allows developers to explore the CLI interface before configuring authentication |
--version / $CORTEX_CLI_VERSION |
Retrieves the version of the Cortex CLI currently in use |
Global flags
The following table describes global CLI flags that are common specifically to the Application Security (AppSec) and Cloud Workload Protection (CWP) modules.
These flags must be placed before the command.
| Command | Description |
|---|---|
--upload-mode / $CORTEX_UPLOAD_MODE |
<p>Controls whether scan results are uploaded to the Cortex Cloud platform.</p><p>Accepts placement in both the global position (cortexcli --upload-mode no-upload code scan) and the command position (cortexcli code scan --upload-mode no-upload). The global position takes priority over the command position.</p><p>Accepted values:</p><p>• upload: Uploads results to the platform and triggers policy evaluation</p><p>• no-upload: Executes scanners locally without uploading results. Enables --severity filtering</p><p>• no-code: Uploads results without uploading source code</p> |
--soft-fail / $CORTEX_SOFT_FAIL |
<p>Required: false.</p><p>Allows CI/CD pipelines to continue without disruption by returning a successful exit code (0) when scan errors are detected.</p><ul><li>Visibility: Unlike skipped or suppressed checks, soft-fail errors remain fully reported in the output</li><li>Thresholds: Failed checks are evaluated against the defined severity threshold. If multiple severities are specified, the highest acts as the threshold</li><li>Exceptions: Fundamental execution errors (such as exit codes 126 or 127) are not suppressed and will still fail the build</li></ul> |
--no-fail-on-crash / $CORTEX_NO_FAIL_ON_CRASH |
<p>Prevents the CLI from returning a non-zero exit code during internal errors (such as scanner crashes or network timeouts), ensuring CI/CD pipeline continuity even if a scan fails.</p><ul><li>When to use: Enable in production pipelines where build availability takes priority over scan enforcement</li><li>EXAMPLE: Prevents a temporary Cortex Cloud platform outage from blocking all organizational builds</li><li>Best Practice: Combine with --log to ensure internal errors are still captured for post-incident review</li><li>Exceptions: Signal-based exit codes (126, 127, 128+) indicating the CLI itself failed to execute are never suppressed and require immediate investigation</li><li>IMPORTANT: The environment variable changed from $CORTEX_CODE_NO_FAIL_ON_CRASH to $CORTEX_NO_FAIL_ON_CRASH during the framework migration. Ensure CI/CD pipeline configurations referencing the previous variable name are updated</li></ul> |
--log / $LOG_FILE |
<p>Displays the path to the log file after command execution. Use this to troubleshoot CI/CD failures or provide details for support cases. By default, logs are stored at ~/.cortexcli/cortexcli-log/.</p><p>Log rotation: Includes automatic log rotation (10 MB per file, 3 backups, 24-hour retention)</p> |
--help |
See --help flag under Common flags above |
Cortex CLI for Code Security
Cortex CLI for Code Security scans allow developers and security teams to integrate security checks directly into their application development workflows.
The Code Security CLI supports the following scan types:
- Secrets: Identifies exposed sensitive secrets within your codebase
- Infrastructure-as-Code (IaC): Analyzes infrastructure configuration files to detect potential security misconfigurations
- Software Composition Analysis (SCA): Performs vulnerability detection in third-party dependencies, detects malicious packages, assesses their license compliance and their package operational risk
In addition, the Code Security CLI serves as the integration mechanism for security scanning within supported CI tools such as Jenkins, GitHub Actions, and others. This is achieved by adding a code snippet containing the CLI command into the configuration files of your CI tool when integrating the CI tool with Cortex Cloud. It acts as a wrapper, enabling security scanning within your pipelines, and direct upload of results to the platform.
Code Security CLI scan behavior and output
- Scans generate assets (see Code and CI/CD assets, issues, and findings
- If one scanner (such as Secrets) fails, the other scanners will continue to run and produce results
- Scan failures trigger an error message indicating the scanner that failed
-
The Code Security CLI provides these output modes for management and viewing of scan results:
- Upload to platform:
--upload-mode = upload(default). Uploads scan results directly to the platform for centralized analysis and management - Upload findings only.
--upload-mode = no-code. Upload findings, but without including the actual source code content. This prevents raw source code from leaving your local environment or being stored on the platform - CLI output only:
--upload-mode=no-upload. View scan results directly in your command-line interface without being uploaded to the platform
For more information about the output flags, refer to Cortex CLI Cortex Cloud Application Security command line reference.
- Upload to platform:
Supported outputs
The CLI supports the following outputs:
- json
- spdx
- cli
- junitxml
- sarif
- cyclonedx
- cyclonedx_json
Authentication
To authenticate the Code Security CLI, choose one of the following methods:
-
Local developer workflows: Run manual, ad-hoc scans on your local machine to catch vulnerabilities and misconfigurations before committing code to your version control system
The following flags are required to authenticate the Code Security CLI:
--api-base-url[$CORTEX_API_BASE_URL]--api-key[$CORTEX_API_KEY]--api-key-id[$CORTEX_API_KEY_ID]
For more information about these flags, refer to Cortex CLI common command line reference guide.
- Using a
cortex.envfile: Place your authentication details in acortex.envfile. You can download this file from the UI - CI/CD pipeline automation: The Application Security CLI serves as the core integration mechanism for security scanning within your automated pipelines. By inserting simple code snippets into CI tools like Jenkins, GitHub Actions, CircleCI, or GitLab Runner, the CLI acts as a wrapper to enforce security guardrails dynamically and block risky deployments
Requirements
- For the Cortex CLI binary:
- Install
Node.js v22on the host machine before running scans. The Cortex CLI requires Node.js for JavaScript analysis- Check the installed version with
node -v - Download Node.js from the official Node.js site.
- Check the installed version with
- On Linux systems, install GLIBC (GNU C Library) version 2.35 or later. This does not apply when using the CLI container image
- Install
- Permissions: Ensure you have the required user permissions. Refer to About Cortex CLI
- Onboard and install the Cortex CLI: Refer to Connect Cortex CLI
Configure proxy for the Code Security CLI
When operating the Code Security CLI within environments requiring internet access via a proxy server, you can configure the tool to route its traffic through your proxy using standard environment variables. For proxies that perform TLS inspection, you must also specify a CA certificate
- Environment variables: Set
HTTP_PROXYandHTTPS_PROXY(orhttp_proxyandhttps_proxy) to your proxy address - CA Certificate: Use the
--ca-certificateflag or the$CORTEX_CA_CERTIFICATEenvironment variable to provide your CA certificate for proxies that perform TLS inspection. The flag is now global and must appear beforecode scan. It is currently limited to the Application Security CLI. You can either:
Cortex CLI usage for Cortex Cloud Application Security
Run Cortex Cloud Application Security scans
To scan Cortex Cloud Application Security, run:
cortexcli –-api-base-url <API URL> --api-key <API key from the "Authenticate" step in the CLI connector screen> --api-key-id <API Key ID> code scan --directory {{DIRECTORY}} --branch main --repo-id organization/repo-name –output json --output-file-path ./output.json
Command line structure
The command structure includes global flags which are used for authentication, and then specifies the module name and command specific to Cortex Cloud Application Security which are followed by dedicated flags unique to this module as well as flags common to all modules.
-
Global flags: These flags are part of the initial
cortexclicommand and are necessary to authenticate and connect to Cortex Cloud--api-base-url: (Required = true). The public facing API URL. Refer to Connect Cortex CLI and the Cortex Cloud API reference for more information--api-key: (Required = true). The Cortex Cloud API key generated when onboarding the CLI as a data source. Refer to Connect Cortex CLI for more information--api-key-id: (Required = true). The Cortex Cloud API key ID generated when onboarding the CLI as a data source
For a comprehensive list of Cortex Cloud Application Security global flags, refer to Cortex CLI Cortex Cloud Application Security command line reference
-
Cortex Cloud Application Security specifics: Following the global flags, the command specifies the module and the commands required for initiating a scan using the Cortex Cloud Application Security module:
code scan: Required - true. This command instructs the CLI to perform an Cortex Cloud Application Security scan.- For the optional flags, refer to the dedicated Cortex Cloud Application Security command line reference
CLI usage examples
-
Send output to a file: Direct the command's output to a specified file instead of displaying it in the console
./cortexcli --api-base-url <BASE_URL> --api-key <API_KEY> --api-key-id <API_KEY_ID> code scan --branch <branch name> --repo-id <repo name> --directory <path> --output json --output-file-path <path>
-
Perform a scan without upload: Run a scan for local analysis or testing without uploading the results to Cortex Cloud. This command runs a code scan and saves all standard output (human-readable format) to
scan_results.txt./cortexcli --api-base-url <BASE_URL> --api-key <API_KEY> --api-key-id <API_KEY_ID> code scan --upload-mode no-upload --branch <branch name> --repo-id <repo name> --directory <path>
Sample outputs
The cortexcli provides different options for how scan results are presented.
- Standard output (stdout): When no specific output format flags (such as
--output jsonor--output sarif)are provided, the Cortex CLI will produce standard output directly to your terminal or console - JSON output: To obtain the output of a scan command as a JSON file, specify the flags
--output json --output-file-path ./output.json. This command will save the detailed scan results in JSON format to output.json in the current directory.
Supported flags
The Cortex Cloud Application Security CLI supports both common Cortex CLI and dedicated Cortex Cloud Application Security flags.
- For dedicated Cortex Cloud Application Security flags, refer to Cortex CLI Cortex Cloud Application Security command line reference
- For common flags, refer to Cortex CLI common command line reference guide
Cortex CLI Cortex Cloud Application Security command line reference
Use these command-line flags to configure Cortex Cloud Application Security scans. They are scoped to the code scan command and define what to scan and how results are reported. Their environment variables use the CORTEX_CODE_ prefix. The Application Security CLI also accepts flags that apply across modules, including authentication, TLS, proxy, logging, upload behavior, and exit-code policy.
--upload-mode and --no-fail-on-crash are the only flags supported in both global and command positions. They use the global variables $CORTEX_UPLOAD_MODE and $CORTEX_NO_FAIL_ON_CRASH, not CORTEX_CODE_ variables. Command-position support is retained for backward compatibility.
For global and common CLI commands, refer to Cortex CLI common command line reference guide.
Important
The Cortex CLI Cortex Cloud Application Security only supports single occurrences of each flag. If the same flag is passed multiple times, only the last provided value will be used. For example, in the following command, only TF CloudFormation will be the scanned framework.
EXAMPLE
cortexcli --api-base-url <YOUR_API_URL> --api-key <YOUR_API_KEY> --api-key-id <YOUR_API_KEY_ID> code scan --framework terraform --framework "terraform cloudformation
| Command/Variable | Description |
|---|---|
<p>--source</p><p>$CORTEX_CODE_SOURCE</p> |
<p>(Optional, default CORTEX_CLI)</p><p>The execution environment that launched the scan.</p><p>Use one of the following values: CORTEX_CLI, IDE_VSCODE, JENKINS, GITHUB_ACTIONS, CIRCLE_CI, AWS_CODE_BUILD, GIT_HOOK, GIT_HOOK_COMMITS.</p><p>EXAMPLE: In a GitHub Actions pipeline, pass --source GITHUB_ACTIONS</p> |
<p>--repo-id</p><p>$CORTEX_CODE_REPO_ID</p> |
<p>The unique identifier used to associate scan results with the correct repository in Cortex.</p><ul><li>Value: owner/repo (for example, my-org/my-repo). Value must contain a forward slash /</li><li>Requirement: Required for upload mode; otherwise, optional</li><li>Auto-detection: If omitted, the CLI automatically extracts this value from your Git remote URL using the last two segments of the path</li><li>Do not use the tenant Asset ID hash, as it will fail validation.For more information on how to retrieve the repository ID, refer to #how-to-retrieve-the-repository-id</li></ul> |
<p>--repo-url$CORTEX_CODE_REPO_URL</p> |
Optional: URL of the repository being scanned (for example, https://github.com/org/repo). If omitted, the CLI attempts to auto-detect the URL from the local Git remote of the scanned directory |
<p>--branch</p><p>$CORTEX_CODE_BRANCH</p> |
<p>The branch name associated with the scan.</p><p>Default: The branch detected from your local Git checkout in upload mode when upload permissions are valid</p> |
<p>--directory</p><p>$CORTEX_CODE_DIRECTORY</p> |
<p>Required.</p><p>The directory path to scan. Cannot be used together with --file</p> |
<p>--file</p><p>$CORTEX_CODE_FILE</p> |
The file path to scan. Cannot be used together with --directory. When using this option, the Cortex CLI will filter runners based on the file type provided. For example, if you specify a .tf file, only the Terraform and secrets frameworks will be included. You can further limit this (for example; skip secrets) by using the --skip-framework argument |
<p>--var-file</p><p>$CORTEX_CODE_VAR_FILE</p> |
Variable files to load in addition to the default files. This feature is currently supported for both source Terraform (.tfvars files) and Helm chart scans (for providing custom values or variable overrides). Refer to https://www.terraform.io/docs/language/values/variables.html#variable-definitions-tfvars-files) below for more information |
<p>--framework</p><p>$CORTEX_CODE_FRAMEWORK</p> |
<p>Filter to scan specific frameworks. Example: --framework arm.</p><p>Syntax: Use a single flag with comma-separated values for multiple frameworks. Both quoted ("arm,ansible") and unquoted (arm,ansible) formats are supported. Example: --framework arm,ansible.</p><p>Constraint: Do not use multiple --framework flags: --framework terraform --framework sca_package.</p><p>Environment variables: export CORTEX_CODE_FRAMEWORK=arm,ansible.</p><p>Supported frameworks: ARM, ANSIBLE, BICEP, CLOUDFORMATION, DOCKER, DOCKERFILE, HELM, KUBERNETES, KUSTOMIZE, OPENAPI, SCA, SECRETS, SERVERLESS, TERRAFORM, TERRAFORMJSON, TERRAFORMPLAN</p> |
<p>--skip-framework</p><p>$CORTEX_CODE_SKIP_FRAMEWORK</p> |
<p>Skip specific frameworks. Example: --skip-framework terraform.</p><p>Syntax: Use a single flag with comma-separated values for multiple frameworks. Both quoted ("arm,ansible") and unquoted (arm,ansible) formats are supported. Example: --skip-framework terraform, sca_package.</p><p>Constraint: Do not use multiple skip --framework flags: --skip-framework terraform --skip-framework sca_package.</p><p>Environment variables: export CORTEX_CODE_SKIP_FRAMEWORK="tf,sca"</p> |
<p>--rule</p><p>$CORTEX_CODE_RULE</p> |
Restrict the scan to specific check IDs; all other checks are skipped. Enter one or more comma-separated check IDs, for example --rule APPSEC_AWS_79,APPSEC_SECRET_80 |
<p>--severity$CORTEX_CODE_SEVERITY</p> |
<p>Filters scan results by severity level. Accepts one or more comma-separated values: unknown, low, medium, high, critical. Repeat the flag or use comma separation to specify multiple levels (for example, --severity high,critical).</p><p>Constraint: Only effective when --upload-mode is set to no-upload. When upload mode is active, the flag is ignored and an informational message is displayed</p> |
<p>--ignore-existing-secrets</p><p>$CORTEX_CODE_IGNORE_EXISTING_SECRETS</p> |
In CI/CD scans, report only newly introduced secrets. This flag filters out secret findings whose fingerprints already exist in the Cortex Cloud findings backlog, which a periodic baseline scan populates. This flag is ignored during pull request scans |
<p>--blocked-only</p><p>$CORTEX_CODE_BLOCKED_ONLY</p> |
Boolean flag. When set, shows only blocked findings in the output. Available only in upload mode |
<p>--summary-position</p><p>$CORTEX_CODE_SUMMARY_POSITION</p> |
Sets the position for displaying the summary information relative to the findings. Values: top, bottom |
<p>--upload-mode</p><p>$CORTEX_UPLOAD_MODE</p> |
Upload mode determines the method or mode used to upload data. See common flags for more information |
<p>--download-external-modules$CORTEX_CODE_DOWNLOAD_EXTERNAL_MODULES</p> |
<p>(Optional, default False)Download external Terraform modules from public Git repositories and the Terraform Registry so they are included in the IaC scan. . Use --external-modules-download-path to control the download location (defaults to .external_modules). Requires outbound network access</p> |
<p>--external-modules-download-path</p><p>$CORTEX_CODE_EXTERNAL_MODULES_DOWNLOAD_PATH</p> |
Specifies the directory to download external modules to. Defaults to .external_modules |
<p>--external-checks-dir</p><p>$CORTEX_CODE_EXTERNAL_CHECKS_DIR</p> |
Local directory containing custom Cortex Python (.py) checks. The directory must be a Python package. This flag is repeatable and cannot be used with --external-checks-git. |
<p>--external-checks-git</p><p>$CORTEX_CODE_EXTERNAL_CHECKS_GIT</p> |
Git URL containing custom Cortex Python (.py) checks. Supports //subdir and ?ref=.... This flag cannot be used with --external-checks-dir. |
<p>--external-checks-public-key</p><p>$CORTEX_CODE_EXTERNAL_CHECKS_PUBLIC_KEY</p> |
<p>Path to a PEM-encoded ECDSA P-256 public key used to verify signatures for custom Cortex Python (.py) checks.</p><p>When set, any tampered or unsigned file aborts the scan with exit code 2 before any check runs. When unset, verification is disabled for backward compatibility.</p><p>See Workflow: Sign and verify custom checks.</p> |
<p>--output</p><p>$CORTEX_CODE_OUTPUT</p> |
<p>Output format for reporting.</p><p>Supported formats: cli, json, spdx, junitxml, sarif, cyclonedx, cyclonedx_json</p> |
<p>--output-file-path</p><p>$CORTEX_CODE_OUTPUT_FILE_PATH</p> |
Specifies the output path for the scan result file |
<p>--deep-analysis</p><p>$CORTEX_CODE_DEEP_ANALYSIS</p> |
Enables or disables deep analysis of the Terraform plan and related files |
<p>--repo-root-for-plan-enrichment</p><p>$CORTEX_CODE_REPO_ROOT_FOR_PLAN_ENRICHMENT</p> |
Enriches Terraform plan findings by mapping them to their original .tf files |
<p>--skip-path</p><p>$CORTEX_CODE_SKIP_PATH</p> |
Specifies a path (file or directory) that should be skipped during the scanning process. This option is useful for excluding specific files or directories that are not relevant to the scanning analysis, increasing the efficiency and accuracy of scan results |
<p>--compact</p><p>$CORTEX_CODE_COMPACT</p> |
Do not display code blocks in the output |
<p>--no-fail-on-crash</p><p>$CORTEX_NO_FAIL_ON_CRASH</p> |
See common flags for a description |
<p>--validate-secrets</p><p>CORTEX_APPSEC_VALIDATE_SECRETS</p> |
Validate detected secrets against their respective services to confirm they are active. By default, this feature is disabled. Set CORTEX_APPSEC_VALIDATE_SECRETS = true to enable it |
<p>--timeout$CORTEX_CODE_TIMEOUT</p> |
<p>Sets the maximum time the Cortex CLI will wait for triggered local scan processes to complete. Default value: 15 minutes.</p><p>Syntax:</p><ul><li>To specify a duration: Use a numeric value followed by a unit (for example --timeout 10m)</li><li>Default unit: Numeric values entered without a unit are interpreted as seconds. For example, 30 is equal to 30 seconds.</li><li>Supported units: Milliseconds, seconds, minutes and hours</li></ul> |
--start-commit |
Starting commit hash for git history scanning (Git Hook flag). No environment-variable equivalent is available. |
--commit-list |
Comma-separated list of commit hashes to scan (Git Hook flag). No environment-variable equivalent is available. |
--hook-event |
Git hook event type, such as pre-commit (Git Hook flag). No environment-variable equivalent is available. |
--help |
See common flags for a description |
How to retrieve the repository ID
Option 1: From the local repository checkout (Recommended)
git config --get remote.origin.url
Remove any trailing .git and take the final two path segments. For example, https://github.com/my-org/my-repo.git yields my-org/my-repo. This matches the exact logic the CLI uses to auto-derive the value.
Option 2: From the Cortex Cloud console
- Navigate to Inventory → All Assets → Repositories.
- Select the repository row to open the side card.
- Copy the title displayed at the top of the side card (in
owner/repoformat).
Note: Two console fields are commonly mistaken for this value and neither is valid:
- Asset ID (in the side card Properties section) is an internal platform hash, not a repository path. Passing it will fail validation
- Repository Name (in the table column) is only the repository name without the owner
Option 3: From the Public API
GET /public_api/appsec/v1/repositories
In the response, locate your repository and join the owner and name fields with a forward slash (owner/name).
EXAMPLES
Explicitly defining the repository path and branch
Use this pattern for local scans or custom builds. It sets the repository and branch manually.
cortexcli code scan \ --directory . \ --branch main \ --repo-id my-org/my-repo \ --upload-mode upload
Providing --repo-id and --branch explicitly associates results with the correct platform asset. This works regardless of local Git status or API key permission levels.
Auto-deriving values from the local Git checkout
Use this minimal syntax from a developer workstation inside an active Git working tree.
# Auto-derive the repository path and branch from the local Git remote cortexcli code scan \ --directory . \ --upload-mode upload
When omitted, the CLI derives --repo-id from the origin remote URL. It derives --branch from the local HEAD checkout. Auto-derivation requires an API key with write or upload permissions. With a read-only API key, pass both values explicitly.
Running in GitHub Actions workflows
Use native GitHub Actions context variables to set the repository and branch dynamically.
# In GitHub Actions workflows
cortexcli code scan \
--directory . \
--branch ${{ github.ref_name }} \
--repo-id ${{ github.repository }} \
--upload-mode upload
Always pass --repo-id and --branch explicitly in CI. GitHub Actions checkouts often use a detached HEAD. Auto-derivation can resolve the branch as HEAD, rather than the target branch.
Running in GitLab CI pipelines
Use predefined GitLab CI variables to populate the repository path and branch.
# In GitLab CI pipelines cortexcli code scan \ --directory . \ --branch $CI_COMMIT_BRANCH \ --repo-id $CI_PROJECT_PATH \ --upload-mode upload
GitLab CI supports multi-segment subgroup paths, such as my-group/my-subgroup/my-repo. $CI_PROJECT_PATH provides the complete forward-slash-delimited path required by --repo-id.
Custom Cortex checks and signature verification
Cortex CLI supports custom Cortex checks from a local directory or Git repository. You can optionally verify custom Python checks cryptographically before the CLI loads them.
Overview
Use --external-checks-dir or --external-checks-git to load custom Cortex checks. To verify their integrity and authenticity, use --external-checks-public-key.
Supported flags
--external-checks-dir: Specifies a local directory containing custom checks.--external-checks-git: Specifies a Git repository containing custom checks.--external-checks-public-key: Specifies the public key file used to verify signed checks. You can repeat this flag to support key rotation.
Enforcement and exit codes
Signature verification is opt-in. CLI behavior depends on whether you provide a public key and whether the check signature is valid
- No verification: Without a public key, the CLI loads checks without verification. The scan runs normally. It returns exit code
1if it finds scan issues - Successful verification: With a valid public key and a correctly signed check, the scan runs with signature verification enabled. It returns exit code
1if it finds scan issues - Wrong key: If the check uses a different private key, the CLI refuses the scan before custom code runs. It returns exit code
2 - Tampered file: If a signed check changes after signing, verification fails. The CLI refuses the scan and returns exit code
2
Workflow: Sign and verify custom checks
1. Generate a P-256 key pair
Keep private.pem secret.
openssl ecparam -name prime256v1 -genkey -noout -out private.pem openssl ec -in private.pem -pubout -out public.pem
2. Sign the custom check (.py) and append the trailer
hex=$(openssl dgst -sha256 -sign private.pem my_check.py | xxd -p | tr -d '\n') printf '# checkov-digest: %s\n' "$hex" >> my_check.py
3. Run the scan with the matching public key
cortexcli code scan --directory ./target \ --external-checks-dir ./checks \ --external-checks-public-key ./public.pem
Cortex CLI pre-commit hooks
Integrate the Cortex Cloud Application Security secrets scanner as a pre-commit hook by installing the Cortex CLI. The scanner executes the hook locally before a commit. This setup ensures that secrets checks are enforced before any changes are committed.
When setting up pre-commit hooks, you can choose between local hooks and global hooks.
- Local: Installs the hook in the
.git/hooksdirectory of the current repository, ensuring that Cortex Cloud secrets scans automatically run on your code before every commit - Global: Installs the hook for all Git repositories on your machine, so Cortex Cloud secrets scans will automatically run on your code before every commit, regardless of the project
How to configure pre-commit hooks
Prerequisite
These common prerequisites are required for all types of installation (both local and global) of the Cortex CLI pre-commit hook.
- Ensure you have a license for Cortex Cloud Application Security
- Install the Cortex Cloud CLI binary locally. Refer to Connect Cortex CLI for information about onboarding the CLI
- Obtain Cortex Cloud API credentials (API Key ID and API Key) available from the CLI onboarding process (see above), and your API base URL. For more information on creating API keys, refer to Create a new API key
- Git: You must have Git installed on your machine. For installation instructions, refer to the official Git website
-
Create a directory:
mkdir -p ~/.cortexcli
- Create a
.cortex.yamlfile in the~/.cortexcli/directory. -
Open the
.cortex.yamlfile and add your Cortex Cloud API credentials and API base URL to theyamlfile:CORTEX_API_BASE_URL: <replace with the base API URL>CORTEX_API_KEY_ID: <replace with API Key ID>CORTEX_API_KEY: <replace with API Key>
Note
It is recommended you configure credentials for the Cortex CLI using a configuration file.
-
For local hooks: Install the Cortex CLI pre-commit hook package to set up a local hook for the current Git repository:
Prerequisite
For local installation: Install the pre-commit framework version 3.2.0 or greater. Refer to https://pre-commit.com/ for installation instructions.
1.
-
For macOS, you can use Homebrew:
brew install pre-commit
-
For other installations run:
pip install pre-commit
2. **Navigate to the root of your repository** → **run the following command**:
```programlisting cortexcli code pre-commit install --mode local ```
-
-
For Global hooks: Install the Cortex CLI pre-commit hook package to set up hooks for all Git repositories on your machine.
cortexcli code pre-commit install --mode global
Note
The pre-commit framework is not required for global mode.
References
To set up the Cortex CLI as a pre-commit hook on supported platforms, refer to the following official Git documentation for managing hooks:
- Git Hooks: A comprehensive guide on all available Git hooks, including
Pre-commit: https://git-scm.com/book/en/v2/Customizing-Git-Git-Hooks - Atlassian Git Tutorial: A tutorial that explains the purpose and usage of both local and server-side hooks, including
pre-commit: https://www.atlassian.com/git/tutorials/git-hooks
Pre-commit hook usage
You can run secrets checks on your code, customize its behavior using supported flags, and suppress detected secrets when required.
By default, Cortex CLI pre-commit hooks:
- Scan staged files only: The scan performs a quick and efficient check by only analyzing the changes you are about to commit, rather than the entire codebase
- Scan for secrets only: Pre-commit hooks support secrets scans only
- Do not upload results to the platform: All scan results are kept local to your machine, ensuring your data remains private
Command flag reference
Use the following flags with the cortexcli code pre-commit command to customize scanner behavior.
--ignore-existing-secrets: Ignores secrets that already exist from a periodic scan (default: false)[$CORTEX_CODE_IGNORE_EXISTING_SECRETS]--validate-secrets: Checks if the secrets are valid (default: false)[$CORTEX_CODE_VALIDATE_SECRETS]--skip-path: Specifies a file or directory path to skip during the scan[$CORTEX_CODE_SKIP_PATH]--compact: Prevents the display of code blocks in the output (default: false)[$CORTEX_CODE_COMPACT]--summary-position: Determines whether the summary appears on top (before the check results) or on bottom (after the check results). (default: top)[$CORTEX_CODE_SUMMARY_POSITION]--no-fail-on-crash: Returns exit code 0 instead of 2 in case of a failure in the integration with the platform (default: false)[$CORTEX_CODE_NO_FAIL_ON_CRASH]--help, -h: Displays a help message with available options
Secrets suppression
You can suppress secrets directly within your code by adding a comment. This is useful for secrets that are intentionally included or a false positive and are not a security risk. Currently, suppression is not supported in JSON files.
The comment format is:
cortex:skip=<SECRET_ID>:<suppression justification>
Replace <SECRET_ID> with the specific ID provided in the scan output, and provide a brief explanation for why the secret is being suppressed. The comment syntax will depend on the file type.
EXAMPLE
Comments in a Dockerfile begin with (#). Note the comment in the After suppression code-block below.
-
Before suppression:
ENV SEC_1="ghp_3xyKmc3W7XanE82IKHJ3Z3AfHbV"
-
After suppression:
# cortex:skip=APPSEC_SECRET_43: Suppress this key for testing purposes ENV SEC_1="ghp_3xyKmc3W7XanE82IKHJ3Z3AfHbV"
Cortex CLI pre-receive hooks
Integrate the Cortex Cloud Application Security secrets scanner as pre-receive hook into your workflows installing the Cortex CLI. The hook runs on the remote server before changes are pushed, allowing you to enforce checks before code is accepted into version control.
Supported version control systems
Pre-receive hooks are supported for GitHub Enterprise, GitLab self-managed, and Bitbucket Data Center. To setup pre-receive hook on these platforms refer to Setup on third-party platforms below.
Pre-receive hook workflow setup
- Fulfill prerequisites.
- Configure API credentials.
- Install the pre-receive hook.
- Setup the pre-receive hook on third party platforms.
Setup requirements
Prerequisites
Before you begin, ensure you have:
- Administrator access to the VCS server and console
- A valid license for Cortex Cloud Application Security
- The Cortex Cloud CLI binary or Docker image installed on the server (requires
GLIBC (GNU C library) version 2.35or greater). Refer to Connect Cortex CLI for information about onboarding the CLI - Cortex Cloud API credentials (API Key ID and API Key) and your API base URL. For more information on creating API keys, refer to Create a new API key
- Git installed on your machine. For installation instructions, refer to the official Git website
Configure credentials
It is recommended to configure credentials for the Cortex Cloud Application Security Cortex CLI using a configuration file, instead of embedding them directly in the hook script.
-
Create a directory:
mkdir -p ~/.cortexcli/.cortex.yaml
Note
Make sure to create the directory under the home directory of the Linux user that runs the Git hooks. This user is typically not the root user.
-
Configure credentials: Open the
.cortex.yamlfile in the~/.cortexcli/directory and add the following configuration parameters:CORTEX_API_BASE_URL: <API base URL>CORTEX_API_KEY_ID: < API key ID >CORTEX_API_KEY: < API key>
Setup on third-party platforms
To set up the Cortex CLI as a pre-receive hook on supported third-party platforms, refer to the official vendor documentation:
- GitHub Enterprise: About pre-receive hooks
- GitLab self-managed: Git server hooks
- Bitbucket Enterprise: Using repository hooks
Reference script
Use the script below as reference to extend or modify your existing pre-receive hooks in your VCS provider.
#!/usr/bin/env bash # This script is used to run Cortex CLI in a pre-receive hook. # Hide the update notice. export CORTEX_HIDE_UPDATE_NOTICE=1 CORTEX_CLI="/usr/local/bin/cortexcli" BASE_COMMAND="--api-base-url ${CORTEX_API_BASE_URL} --api-key-id ${CORTEX_API_KEY_ID} --api-key ${CORTEX_API_KEY} code pre-receive" OPTIONAL_FLAGS='' # Run cortex cli ${CORTEX_CLI} ${BASE_COMMAND:-''} ${OPTIONAL_FLAGS:-''} exit_code=$? exit $exit_code
Pre-receive hook usage
The hook executes a script on every git push.
By default, Cortex CLI pre-receive hooks:
- Only scans code changes: It analyzes the code difference included in the pushed commits, not the entire repository
- Scans for secrets only: The analysis is focused on detecting sensitive information
- Does not upload results to Cortex Cloud: All scan results are kept local to your machine (on the server)
Understanding the script variables
CORTEX_CLI: Defines the executable path, pointing to the absolute location of thecortexclibinaryBASE_COMMAND: Assembles the core command string, including authentication flags (--api-base-url,--api-key-id,--api-key) and the primary command:code pre-receive. The use of${...}ensures authentication variables are injected as flag valuesOPTIONAL_FLAGS: An empty variable placeholder for adding optional runtime arguments
Command flag reference
Use the following flags with the pre-receive command to customize scanner behavior.
Example command structure:
$ cortexcli code pre-receive [options]
| Command | Description |
|---|---|
--ignore-existing-secrets |
Ignores secrets that already exist in the periodic scan (default: false) [$CORTEX_CODE_IGNORE_EXISTING_SECRETS] |
--validate-secrets |
Checks if the secrets are valid (default: false) [$CORTEX_CODE_VALIDATE_SECRETS] |
--skip-path |
Specifies a file or directory path to skip during the scan [$CORTEX_CODE_SKIP_PATH] |
--compact |
Prevents the display of code blocks in the output (default: false) [$CORTEX_CODE_COMPACT] |
--summary-position |
Determines whether the summary appears on top (before the check results) or on bottom (after the check results). (default: top) [$CORTEX_CODE_SUMMARY_POSITION] |
--no-fail-on-crash |
Returns exit code 0 instead of 2 in case of a failure in the integration with the platform (default: false) [$CORTEX_CODE_NO_FAIL_ON_CRASH] |
--help, -h |
Displays a help message with available options |
Breakglass: Bypassing the hook
The breakglass feature allows you to intentionally bypass the pre-receive hook security scan. This is useful in urgent situations where a push must go through immediately, but it should be used with caution as it overrides your security policies.
-
Configure your server to accept custom push options:
```bash git config receive.advertisePushOptions true ```
-
Add the
-o breakglassoption to yourgit pushcommand:```bash git push -o breakglass ```
Troubleshooting and recommendations
- Refer to the Cortex CLI for more information on the Cortex CLI.
- Modify the script as required based on the server running the VCS
- The Cortex CLI must be available on the server. This documentation does not describe the CLI installation process
- Update the Cortex CLI periodically
-
Instead of adding the API URL and credentials directly in the script, consider creating a
~/.cortexcli/.cortex.yamlconfiguration file (owned by the git user and group) with the following contents:CORTEX_API_BASE_URL: <api base url> CORTEX_API_KEY: <api key> CORTEX_API_KEY_ID: <api key id>
Cortex CLI for Cloud Workload Protection
Integrate Cloud Workload Protection (CWP) scans for secrets, vulnerabilities and malware during your continuous integration (CI) process. By leveraging Software Bill of Materials (SBOM) analysis, you can identify and remediate vulnerabilities before images are pushed to the registry, shifting security left and reducing risk in your cloud environments.
Prerequisites
- Ensure you have the required user permissions. Refer to Cortex CLI for more information
- Onboard and install the Cortex CLI. Refer to Connect Cortex CLI for more information
- Verify that
Javaversion 11 and above is installed: Runjava -versionin your terminal. If not, refer to Java SE Development Kit 11.0.25 for information about installing Java
Run CWP security scans
The cortexcli image scan command allows you to perform CWP scans on container images. By default, cortexcli scans images directly from your local Docker daemon's repository. You can also specify an image archive file to scan instead.
Prerequisite
Before you begin, ensure you have sudo privileges to execute the image scan.
Note
CWP does not support container image secret scanning for systems running on ARM architecture.
Scan from local Docker daemon
For direct scanning from your Docker daemon, the image must already exist in your local Docker repository. The CLI will not pull a new image if it does not exist locally.
To scan an image that exists in your local Docker daemon, simply provide its name:
./cortexcli --api-base-url <API URL> --api-key <API key from the "Authenticate" step in the CLI connector screen> --api-key-id <API key ID from the "Authenticate" step in the CLI connector screen> image scan <image name>
The image scan accepts the following arguments:
--api-base-url: Required - true. The public facing API URL. Refer to Connect Cortex CLI for more information--api-key: Required - true. Your Cortex Cloud API key. Refer to Connect Cortex CLI for more information--api-key-id: Required - true. Your Cortex Cloud API key IDimage scan: Required - true. Refers to CWP as the type of scan
Note
For available CWP commands, refer to Cloud Workload Protection command line reference.
EXAMPLE
./cortexcli --api-base-url https://api.cortex.example.com --api-key your-api-key --api-key-id 1 image scan docker.io/library/nginx:latest
EXAMPLE
./cortexcli --api-base-url https://api.cortex.example.com --api-key your-api-key --api-key-id 1 image scan --docker-host unix:///var/snap/docker/common/run/docker.sock my-custom-image:latest
By default, Cortex Cloud looks for the Docker socket at unix:///var/run/docker.sock.
--docker-host <path> specifies the path to the Docker socket. Use this flag if your Docker socket is located elsewhere, for example unix:///var/snap/docker/common/run/docker.sock.
Scan from an image archive file
Danger
Before you begin, ensure you have sudo privileges to execute the image scan.
To scan an image from a previously saved archive file (such as a .tar file), use the --archive flag:
./cortexcli --api-base-url <API URL> --api-key <API key from the "Authenticate" step in the CLI connector screen> --api-key-id <API key ID from the "Authenticate" step in the CLI connector screen> image scan --archive <archive file of container image>
Note
--archive: When used with image scan, sets the scan source to an archive file. When used with image sbom, indicates the SBOM should be exported from an archive file- The
--archiveflag can also be explicitly set as--archive=true --archive-format <value>: The image archive format (such asdocker-archiveoroci-archive). Default:docker-archive.
Create an image archive
This example demonstrates how to create an image archive from your Docker or Podman environment, which can then be used for scanning or SBOM generation if you choose not to scan directly from the local daemon.
- With Docker:
docker save -o ubuntu.tar ubuntu - With Podman:
podman save --format oci-archive -o /tmp/alpine-oci.tar alpine:latest
Export SBOM
You can generate a Software Bill of Materials (SBOM) for your container images using the Cortex CLI and and save the output to a specified file. This functionality enables you to store the SBOM for further analysis, auditing, and compliance.
Export SBOM from local Docker daemon
To export an SBOM for an image from your local Docker daemon:
./cortexcli --api-base-url <API URL> --api-key <API key from the "Authenticate" step in the CLI connector screen> --api-key-id <API key ID from the "Authenticate" step in the CLI connector screen> image sbom <image name> [command options]
Command: cortexcli image sbom: Exports a Software Bill of Materials (SBOM) document for a container image archive.
Usage: cortexcli image sbom [command options]
Options:
--archive-format value: Specifies the image archive format. Values:docker-archive(default),oci-archive--output-format value: Specifies the SBOM document output format. Values:json(default),xml--output-file value: Specifies the path to the file where the SBOM document will be saved- -
-fields value[--fields value]: Specifies the fields to include in the SBOM document. Multiple fields can be specified including: author, binaries, license, name, purl, sourcePackage, type, version - -
-help,-h: Displays help information for the command
EXAMPLE
./cortexcli --api-base-url https://api.cortex.example.com --api-key your-api-key --api-key-id 1 image sbom docker.io/library/alpine:latest
Export from an image archive
To export an SBOM from an image archive file, use the --archive flag:
./cortexcli --api-base-url <API URL> --api-key <API key from the "Authenticate" step in the CLI connector screen> --api-key-id <API key ID from the "Authenticate" step in the CLI connector screen> image sbom --archive <archive file of container image>
NAME: cortexcli image sbom - Exports an SBOM document for an image from the local Docker daemon or an image archive.
USAGE: cortexcli image sbom [command options] [image name or archive file].
Troubleshooting
- Docker socket not reachable: If you encounter errors indicating the Docker socket cannot be reached, ensure the Docker daemon is running and verify the path to your Docker socket. If it's not in the default location (
unix:///var/run/docker.sock), use the--docker-hostflag to specify the correct path - Image not found: If you attempt to scan an image directly from the Docker daemon and receive an error that the image does not exist, confirm that the image is indeed present in your local Docker repository by running
docker images. The CLI will not pull images
Cloud Workload Protection command line reference
Use these Cloud Workload Protection-specific commands and flags to run scans with the Cortex CLI. Refer to Cortex CLI common command line reference guide for common flags that apply across all supported modules and global flags shared with Application Security.
| Command | Description |
|---|---|
--image scan |
Scans a container image archive |
--ci-pipeline-id value |
The CI pipeline identifier |
--ci-build-id value |
The CI build identifier |
--timeout value |
Timeout (in seconds) after which the scan will be terminated if it has not completed (default: 60) |
--output-format value |
Output format options: human-readable, json (default: human-readable) |
--archive-format value |
The image archive format options: docker-archive, oci-archive (default: docker-archive) |
--name value |
The name assigned to the image |
--docker-host <path> |
Specifies the path to the Docker socket |
--archive |
Specifies that the image scan should use an archive file |
Cortex CLI for API Security
API Security testing is implemented in Cortex Cloud through the Cortex CLI.
This testing evaluates APIs for vulnerabilities and misconfigurations using fuzzing techniques to ensure secure data transmission, prevent unauthorized access, and to ensure that the API behaves as expected under unexpected or malformed input.
Prerequisite
- Ensure you have the required user permissions. Refer to About Cortex CLI for more information
- Onboard and install the Cortex CLI. Refer to Connect Cortex CLI for more information
- Ensure your application exposes APIs and provides a corresponding OpenAPI Specification file
- Ensure that you have installed
Java v 11and above
Authentication
The authentication file schema defines the authentication method (such as JWT, Basic) used to authorize connections to your scanned application. The following example provides configurations examples for common methods, including Basic authentication, API Keys and bearer tokens.
EXAMPLE: Authentication File Schema Example
type: headers creds: name: <header name> value: <header value> ------------------------------------ For basic auth type: basic creds: username: {USERNAME} password: {PASSWORD} ------------------------------------ For API Keys type: headers creds: name: x-api-key value: {API key} ------------------------------------ For Bearer tokens type: headers creds: name: Authorization value: Bearer {BEARER_TOKEN}
Run API Security scans
To scan API Security, run:
./cortexcli --log-level <ERROR LEVEL> –-api-base-url <API URL> --api-key <API key from the "Authenticate" step in the CLI connector screen> --api-key-id 1 api scan --api-spec-file <OPENAPI SPEC LOCATION> --scanned-app-url <BASE URL OF THE SCANNED APP> --java-location <JAVA BIN LOCATION>
Output
The API Security scan generates a detailed scan report that includes:
- Findings: These include vulnerabilities and risks identified in the scanned application's APIs, such as SQL Injection, sensitive data leaks, and other issues
- Errors: This section lists error responses returned by the scanned application
- Metadata: Information such as runtime details, scan status (success or failure), scan duration, hostname and scan parameters
API Security scan report schema
Review the API Security scan report schema for report fields and types.
API Security scan output example
Review the API Security scan output example to see a complete report.
Cortex CLI API Security command line reference guide
Use these API Security-specific commands and flags to run scans with the Cortex CLI. Refer to Cortex CLI common command line reference guide for common flags that apply across all supported modules.
| Value | Description |
|---|---|
--scanned-app-url (string) |
Base URL of the app to scan (required) |
--api-spec-file (string) |
Path to the API specification file (required) |
--api-spec-type (string) |
Type of the API specification ('openapi) (default "openapi") |
--auth-file (string) |
Path to the authentication file (optional). For more information on authentication, refer to Cortex CLI for API Security |
--concurrency (int) |
Concurrency limit for scan requests (default 5) |
--java-location (string) |
Path to the Java (version >= 11) binary file (default: Java) |
--no-publish (boolean) |
Avoid publish results to Cortex |
--output-file (string) |
Output path for the report file (optional) |
--timeout (int) |
Scan timeout in seconds (default 300) |
--zap-port (int) |
Listening port to be used by ZAP (default 35391) |
API Security scan report schema
This schema defines the fields returned by an API Security scan report.
{ "reportID": "string", "results": [ { "id": "string", "name": "string", "description": "string", "url": "string", "method": "string", "risk": "string", "alert": "string", "tags": {}, "statusCode": "integer", "requestBody": "string", "curlCommand": "string" } ], "serverErrors": [ { "id": "string", "name": "string", "description": "string", "url": "string", "method": "string", "risk": "string", "alert": "string", "tags": {}, "statusCode": "integer", "requestBody": "string", "curlCommand": "string" } ], "scanStartTime": "string (ISO 8601 datetime)", "elapsedSeconds": "number", "hostname": "string", "scanStatus": "string", "parameters": { "scannedAppURL": "string", "apiSpecFile": "string", "apiSpecType": "string", "timeoutSeconds": "integer" } }
API Security scan output example
This example shows a complete API Security scan report.
{ "reportID": "0a739ae6-d18e-11ef-8a06-263731778ec0", "results": [ { "id": "0", "name": "Server Leaks Version Information via \"Server\" HTTP Response Header Field", "description": "The web/application server is leaking version information via the \"Server\" HTTP response header. Access to such information may facilitate attackers identifying other vulnerabilities your web/application server is subject to.", "url": "http://localhost:5000/api/v1/extract", "method": "POST", "risk": "Low", "alert": "Server Leaks Version Information via \"Server\" HTTP Response Header Field", "tags": { "CWE-200": "https://cwe.mitre.org/data/definitions/200.html", "OWASP_2017_A06": "https://owasp.org/www-project-top-ten/2017/A6_2017-Security_Misconfiguration.html", "OWASP_2021_A05": "https://owasp.org/Top10/A05_2021-Security_Misconfiguration/", "WSTG-v42-INFO-02": "https://owasp.org/www-project-web-security-testing-guide/v42/4-Web_Application_Security_Testing/01-Information_Gathering/02-Fingerprint_Web_Server" }, "statusCode": 404, "requestBody": "--d3b92f4f-e2e3-4caa-8b00-4e43c8df0d87\r\nContent-Disposition: form-data; name=\"file\"\r\nContent-Type: text/plain\r\n\r\n\"John Doe\"\r\n--d3b92f4f-e2e3-4caa-8b00-4e43c8df0d87--", "curlCommand": "curl -X POST \"http://localhost:5000/api/v1/extract\" -H host: localhost:5000 -H user-agent: Mozilla/5.0 (Windows NT 10.0; Win64; x64; rv:125.0) Gecko/20100101 Firefox/125.0 -H pragma: no-cache -H cache-control: no-cache -H accept: application/json -H content-type: multipart/form-data; boundary=d3b92f4f-e2e3-4caa-8b00-4e43c8df0d87 -H content-length: 165 -d '--d3b92f4f-e2e3-4caa-8b00-4e43c8df0d87\r\nContent-Disposition: form-data; name=\"file\"\r\nContent-Type: text/plain\r\n\r\n\"John Doe\"\r\n--d3b92f4f-e2e3-4caa-8b00-4e43c8df0d87--'" } ], "serverErrors": [], "scanStartTime": "2025-01-13T11:09:04.919359+02:00", "elapsedSeconds": 1.349090375, "hostname": "My Computer", "scanStatus": "Failed", "parameters": { "scannedAppURL": "http://localhost:5000", "apiSpecFile": "openapi.json", "apiSpecType": "openapi", "timeoutSeconds": 300 } }
Role-Based Access Control
Cortex XSIAM uses role-based access control (RBAC) to manage roles with specific permissions for controlling user access. This section provides reference information on role permissions by component.
Role permissions by component
Role-Based Access Control (RBAC) restricts system access to authorized users based on their assigned roles. RBAC ensures that user roles have only the permissions and dataset visibility necessary to perform their specific job functions. Custom roles govern not only which components a user can see or edit, but also which underlying datasets they are permitted to query.
You can manage role permissions in Cortex XSIAM under Settings → Configurations → Access Management → Roles.
Tip
While Cortex XSIAM provides predefined, out-of-the-box roles, it is highly recommended to make copies of these roles and edit them rather than creating new roles from scratch, ensuring you do not miss any critical underlying permission dependencies.
Custom Role personas
The following example roles explain the standard responsibilities and baseline permission needs for the security personas referenced throughout this section:
| Role | Responsibilities |
|---|---|
| SOC Tier-1 Analyst | First line of defense responsible for initial issue/case triage and basic investigation (triage). Requires View access to cases, issues, and endpoint data, with limited action capabilities (for example, acknowledging issues) and no configuration access. |
| SOC Tier-2 Analyst | Conducts an in-depth investigation of escalated cases and coordinates response (responder). Requires full View access to security data, with action capabilities for case response (isolate, scan, quarantine), but limited configuration access. |
| SOC Tier-3 Analyst | Handles complex cases and performs advanced forensic analysis (senior/forensics). Requires comprehensive View access, advanced action capabilities (live response, file destruction), and potential input on policy tuning. |
| Threat Hunter | Proactively searches for evaded threats using hypothesis-driven techniques. Requires extensive View access across all data, deep query/search capabilities, and visibility into policies/exceptions to identify coverage gaps. |
| Security Engineer | Designs, implements, and maintains security tools and configurations. Requires full View/Edit access to policies, agent deployments, rules, and exceptions, but typically lacks user/role administration access. |
Best practices
- Customization: The roles provided are examples. You should customize them based on your specific needs, keeping in mind that role overlap is normal in smaller organizations.
- Least privilege: Follow the principle of least privilege by granting only the minimum permissions necessary.
- Separation of duties: Separate configuration and operational roles to maintain proper controls, and periodically review assignments.
- Dependency priority legend:
- Required: Feature will not work without it.
- Strongly recommended: Significantly enhances the feature, and most users will need it.
- Recommended: Useful but optional.
Permission categories by function
Permissions are divided into macro-categories based on functional areas and operational workflows:
- Core Tenant and Administrative permissions: Fundamental system settings, user access controls, and backend infrastructure (data collection, integrations, brokers). Typically reserved for IT and Security Administrators.
- SOC Operations, Investigation & Response permissions: Daily operational tools for triage, investigation, and response (dashboards, cases, playbooks, Live Terminal).
- Agents and Endpoint protection permissions: Features relying on XDR Agent infrastructure (prevention policies, host firewalls, Device Control, and Endpoint DLP).
- Cloud Security and Posture Management permissions: Unifies cloud modules (CSPM, ASPM, DSPM) requiring specific licenses like Cloud Posture or Runtime.
- Exposure and Vulnerability Management permissions: Manages the vulnerability lifecycle from discovery (Attack Surface) to tracking (Vulnerability Management) and prioritization (Exposure Management).
- Inventory Permissions: Foundational visibility into assets and network topology. Controls access to the unified asset inventory and asset groups used for Scope-Based Access Control (SBAC).
Datasets tab
Under the Datasets (Disabled) tab, you have the following options for setting the Cortex Query Language (XQL) dataset access permissions for the user role:
- Set the role to have access to all XQL datasets by leaving dataset access management disabled (default).
- Set the role to have limited access to certain XQL datasets by selecting the Enable dataset access management toggle and selecting the datasets under the different dataset category headings.
Core tenant and administrative permissions
This section consolidates fundamental system settings, user access controls, and foundational platform configurations. These permissions govern access to backend infrastructure, including data collection, integrations, and object setup. They are typically reserved for Security Administrators and IT Administrators.
Configuration permissions
This section includes:
- auditing-permissions
- alert-notifications-permissions
- general-configuration-permissions
- cortex-xdr-analytics-permissions
- access-management-permissions
- data-broker-permissions
- log-collection-permissions
- data-sources-permissions
- external-issues-mapping-permissions
- integrations-instance-permissions
- integrations-permissions
- data-management-permissions
- public-api
- threat-intelligence-permission-api-configuration
- long-running-http-integrations-configuration
- credentials-permissions
- network-scanners-permissions
- apps-instance-permissions
- object-setup-permissions
Auditing permissions
Provides access to view audit logs that track all administrative and operational activities within Cortex XSIAM:
- Management Audit Logs: Track user actions, role modifications, and administrative operations. Go to Settings → Management Audit Logs.
- Agent Audit Logs: Track endpoint agent activities and related activities. Go to Settings → Agent Audit Logs.
- XDR Collector Audit Logs: Track XDR collector activities and data collection events. Go to Settings → XDR Collector Audit Logs.
Caution
The Auditing module is intentionally restricted to View-only access. Audit logs are immutable records designed to maintain compliance and forensic integrity. They cannot be modified or deleted by any user.
| Permission | Description | Roles Example |
|---|---|---|
| None | No access to any audit logs. | SOC Tier-1 Analyst: No Need for visibility into system activities, unless context is required. |
| View | <p>Read-only access to all audit log data.</p><p>Auditing is intentionally view-only. Audit logs are immutable records that cannot be modified or deleted to maintain compliance and forensic integrity.</p> | <ul><li>SOC Tier-2 and 3 Analysts, and Threat Hunters: Required for case investigation and understanding event timelines.</li><li>Security Engineer: Required for troubleshooting and validating configuration changes.</li></ul> |
Required and recommended permissions
Consider adding the following permissions:
| Permission | Permission Level | Reason |
|---|---|---|
| Cases & Issues | View | Provides context for audit events related to cases. Strongly recommended. |
| Query Center | View | Enables XQL queries against audit datasets. Strongly recommended. |
| Dashboards | Enabled | View audit-related dashboards for operational visibility. Recommended. |
| Agent Administrations | View | Understand agent-related audit events in the context of endpoint management. Recommended. |
| Host Insights | View | Correlate audit events with host-level context and asset information. Recommended. |
Alert Notifications permissions
Controls access to configure notification rules, templates, and external integration forwarding.:
- Configurations: Manage rules through Settings → Configuration → General → Notifications: Includes main notification rules and user notifications.
- External forwarding: Configure through Settings → Configuration → Integrations → External Applications.
Caution
Configuring alert notifications requires underlying infrastructure. If forwarding notifications via Syslog, users need access to the Broker Service. For Slack or Email, users need access to the Integrations permissions.
| Permission | Description | Roles Example |
|---|---|---|
| None | No access to notification configuration. | <ul><li>SOC Tier-1 or SOC Tier-2 Analyst: Typically don't need to configure notifications or check notification forwarding destinations.</li><li>Threat Hunter: Notification configuration is not typically part of threat hunting.</li></ul> |
| View | Read-only access to notification settings. | <ul><li>SOC Tier-3 Analyst: May review notification forwarding.</li></ul> |
| View/Edit | Full access to create, modify, and delete notification forwarding. | Security Engineer: Often responsible for configuring notification integrations. |
Required and recommended permissions
Consider adding the following permissions:
| Permission | Permission Level | Reason |
|---|---|---|
| Cases & Issues | View | Notifications can be configured for case-related events; understanding case workflow is essential. Strongly recommended. |
| Broker Service | View or View/Edit | <ul><li>View: Required if using Broker VM for Syslog forwarding of notifications.</li><li>View/Edit: Configure Broker-based Syslog notification channels.</li></ul> |
| Integrations | View | Provides visibility into integration health. Consider View/Edit to configure new integration instances used by notification channels. Strongly recommended. |
| Query Center | View | Query notification-related data and troubleshoot notification delivery. Recommended. |
| Auditing | View | Track changes to notification configurations for compliance. Recommended. |
| Dashboards | Enabled | View notification-related dashboards and delivery metrics. Recommended. |
General Configuration permissions
Controls access to core platform settings that affect system-wide behavior, such as server settings, timezone settings, and system preferences. Access these through Settings → Configurations → General → Server Settings.
For more information, see Configure server settings.
| Permission | Description | Roles Example |
|---|---|---|
| None | No access to the Server Settings page, apart from Keyboard Shortcuts. | <ul><li>SOC Tier-1 Analyst: No need to access or modify server configuration.</li><li>Threat Hunter: Server configuration is not typically relevant to threat hunting.</li></ul> |
| View | Read-only access to the Server Settings page. | <ul><li>SOC Tier-2 Analyst: May need View for troubleshooting context.</li><li>SOC Tier-3 Analyst: May need to understand system configuration during investigations.</li><li>Security Engineer: Should understand configuration, but changes should go through Admin.</li></ul> |
| View/Edit | Full access to modify server and retention settings on the Server Settings. |
Required and recommended permissions
Consider adding the following permissions:
| Permission | Permission Level | Reason |
|---|---|---|
| Auditing | View | Track all configuration changes for compliance and change management. Strongly recommended. |
| Access Management | View | Understand user access context when configuring system-wide settings. Strongly recommended. |
| Alert Notifications | View | Notification settings may be affected by general configuration changes. Recommended. |
| Cases & Issues | View | Understand how configuration changes impact alert processing. Recommended. |
| Broker Service | View | General settings may affect the behavior of the Broker VM and data collection. Recommended. |
| Dashboards | Enabled | View system health dashboards affected by configuration changes. Recommended. |
| Query Center | View | Query system data to validate configuration changes. Recommended. |
| Exception Approver Admin | View/Edit | Users who configure server settings may also need to configure exception approval workflows. Recommended. |
Cortex XDR Analytics permissions
Controls access to the Analytics Engine configuration page through Settings → Configurations → Cortex-Analytics.
Caution
This permission strictly controls access to enable or configure the backend Analytics engines. It does not control analytics rules management. Analytics rules (such as BIOCs and Correlation rules) are managed through the Detection Rules permission under the Threat Management section
On-demand analytics
Cortex XDR Analytics (on-demand analytics) includes the following:
- Cortex Analytics Engine: Analyzes your endpoint data to develop a baseline and raise Analytics and Analytics BIOC alerts when anomalies and malicious behaviors are detected.
-
Identity Analytics: Allows the Cortex Analytics engine to aggregate and display user profile details, activities, and alerts related to a user-based Analytics type alert and Analytics BIOC rule during an investigation.
Notice
Requires the Identity Analytics add-on.
- AI Detection & Response: Gain visibility into AI/ML usage in the cloud with a new dashboard that highlights related issues and cases.
For more information, see Cortex XSIAM - Analytics.
| Permission | Description | Roles Example |
|---|---|---|
| None | No access to the Cortex-Analytics page. | SOC Tier-1 Analyst: No need to access or modify analytics configuration. |
| View | Read-only access to the Cortex-Analytics page. Can see the status, but the enable buttons are disabled. | <ul><li>SOC Tier-2 and 3 Analysts: Should understand analytics settings during investigations</li><li>Threat Hunter: May need to understand analytics coverage during threat hunting.</li></ul> |
| View/Edit | Full access to the Cortex-Analytics page, including enabling Cortex Analytics, Identity Analytics, and AI Detection & Response. | Security Engineer: Often responsible for tuning analytics detection settings |
Required and recommended permissions
Consider adding the following permissions:
| Permission | Permission Level | Reason |
|---|---|---|
| Detection rules | View | <ul><li>View: View analytics rules (BIOC, Correlation) that the analytics engine processes. Strongly Recommended.</li><li>View/Edit: Consider View/Edit if creating and modifying analytics rules. Recommended.</li></ul><div data-gb-custom-block data-tag="hint" data-style="info" class="hint hint-info"><p>Note</p><p>If users need to create or modify these rules, they must have View/Edit for Detection Rules and View/Edit for the Query Center.</p></div> |
| Agent Administrations | View | View agent count and status. Strongly Recommended. |
| Cases & Issues | View | Analytics-generated alerts create cases that feed into case management. Strongly Recommended. |
| Auditing | View | Track analytics configuration changes for compliance. Recommended. |
| Dashboards | Enabled | View analytics dashboards showing detection coverage and engine performance. Recommended. |
| Forensics | View | Investigate analytics-generated alerts with forensic data. Recommended. |
| Host Insights | View | Correlate analytics detections with host-level context. Recommended. |
| Action Center | View | View response actions triggered by analytics-generated issues. Recommended. |
Access management permissions
Set permissions for Users, Roles, User Groups, and Authentication Settings under Access Management (Settings → Configurations → Access Management).
Caution
- SSO Configuration Risk: Granting View/Edit access allows users to modify the tenant's Single Sign-On (SSO) and authentication settings. Misconfigurations can cause tenant-wide lockouts. Ensure only authorized identity or infrastructure administrators hold this permission.
- Auditing is Mandatory: It is highly recommended that any user managing access also has visibility into the Auditing module to track changes.
- IT Admin: Unlike other modules, IT Admins require full View/Edit access here for user provisioning and SSO duties.
| Permission | Description | Roles Example |
|---|---|---|
| None | No access to Access Management. | SOC Tier-1 and 2 Analysts and Threat Hunter: No need to manage users or roles. |
| View | Read-only access to users, roles, and groups. | <ul><li>SOC Tier-3 Analyst: May need to understand team structure.</li><li>Security Engineer: Should understand role structure but not manage users</li></ul> |
| View/Edit | <p>Full access to create, modify, and delete users, roles, and groups, including configuring SSO settings.</p><div data-gb-custom-block data-tag="hint" data-style="info" class="hint hint-info"><p>Note Users with this permission are restricted from granting, modifying, or removing the Instance Administrator role for any user, user group, or API key, and cannot delete API keys that have this role.</p></div> |
Required and recommended permissions
Consider adding the following permissions:
| Permission | Permission Level | Reason |
|---|---|---|
| Auditing | View | Track user and role changes for compliance; critical for access control audit trails. Strongly recommended. |
| Cases & Issues | View | Understand case workflows when configuring role permissions for case management. Recommended. |
| General Configuration | View | System settings context when managing platform access. Recommended. |
| Dashboards | Enabled | View user activity dashboards and access patterns. Recommended. |
| Query Center | View | Query user activity data for access reviews. Recommended. |
Data Broker permissions
Data Broker permissions control access to the Broker VM infrastructure.
Broker Service
Manages Broker VMs that act as intermediaries for data collection from various sources. Brokers can host applets and other collection services. Go to Settings → Configurations → Data Broker → Broker VMs.
For more information, see Manage Broker VM.
Caution
Pathfinder Applet and Pathfinder Data Collection permissions have been deprecated.
IT Admin Role: IT Admins require full View/Edit access as they are responsible for the VM infrastructure and network connectivity.
| Permission | Description | Roles Example |
|---|---|---|
| None | Cannot view or manage Broker VMs | SOC Tier 1 and 2 Analysts: Infrastructure management is not part of analyst duties. |
| View | Can view Broker VMs, their status, applet configurations, and clusters. | <ul><li>SOC Tier 3 Analyst: May need visibility into data collection infrastructure.</li><li>Threat Hunter: May need to understand data collection sources,</li></ul> |
| View/Edit | Can create, configure, and manage Broker VMs, applets, and clusters. | Security Engineer: Responsible for data collection infrastructure and Broker management. |
Required and recommended permissions
Managing Broker VMs effectively requires visibility into the data sources they collect from, the agents they interact with, and the infrastructure settings that govern them. Consider adding the following permissions:
| Permission | Permission Level | Reason |
|---|---|---|
| Log Collections | View | Broker VMs are the primary infrastructure for log collection and need visibility into the collection status. Strongly recommended. |
| Data Sources | View | Understand data sources feeding through Broker VMs. Strongly recommended. |
| Agent Administrations | View | Brokers interact with agent infrastructure; agents connect through Brokers. Strongly recommended. |
| Auditing | View | Track changes to Broker configurations for compliance. Strongly recommended. |
| Cases & Issues | View | Broker issues may generate cases requiring investigation. Recommended. |
| Integrations | View | Brokers host integrations; need visibility into integration health. Recommended. |
| Alert Notifications | View | Syslog forwarding through Brokers is tied to notification configuration. Recommended. |
| Live Terminal | View | Remote terminal access to Broker VMs for troubleshooting. Recommended. |
| General Configuration | View | Server settings may affect Broker behavior. Recommended. |
| Query Center | View | Query Broker-related data for troubleshooting collection issues. Recommended. |
Log Collection permissions
Configure XDR Collectors, installers, and collection policies through Settings → Configurations → XDR Collectors.
| Permission | Description | Roles Example |
|---|---|---|
| None | No access to the XDR Collectors configuration pages. | SOC Tier-1 Analyst: Focus on issue triage; log collection configuration is not within their scope. |
| View | Read-only access to the XDR Collector menu, including configuration, administration, and groups. | <ul><li>SOC Tier 2 and 3 Analyst: May need to verify collection status when investigating cases.</li><li>Threat Hunter: May need to verify data collection during threat hunting activities.</li></ul> |
| View/Edit | Full read and write access. The user can view, create, modify, and delete configurations, collection profiles, and policies. | Security Engineer: Responsible for configuring and maintaining log collection infrastructure. |
Required and recommended permissions
Consider adding the following permissions:
| Permission | Permission Level | Reason |
|---|---|---|
| Broker Service | View/Edit | Managing broker VMs that host collectors; collectors often run on Broker VMs. Strongly recommended. |
| Agent Profiles | View/Edit | Managing collection profiles referenced by policies. Strongly recommended. |
| Agent Administrations | View | Viewing endpoint agents that may be related to collection. Recommended. |
| Data Sources | View | Viewing data source status related to collected logs. Recommended. |
Data Sources permissions
Enables the configuration and management of cloud and third-party data source integrations. This includes Cloud Service Provider (CSP) integrations (AWS, Azure, GCP), Cloud Workload Protection (CWP) instances, Cloud Access Security (CAS) connectors, and Outposts.
Data Sources & Integrations page
Data Sources is managed under Settings → Configurations → Data Collection → Data Sources & Integrations. Access levels to the Data Sources & Integrations are determined with the Integrations permissions:
- Data Sources permission only: Users can view the page and manage cloud accounts (CSP), Cloud Workload Protection (CWP) instances, and Cloud Access Security (CAS) connectors.
- Integrations permission only: Users can view the page and manage data collection integration instances, specifically automation and feed integrations.
- Both permissions: Users have full visibility and can manage both data sources and integrations on the same page.
| Permission | Description | Roles Example |
|---|---|---|
| None | Users cannot access the Data Sources & Integrations and Outposts pages. | SOC Tier-1 Analyst: Data source configuration is outside Tier-1 responsibilities. |
| View | Read-only access to view all configured instances, connection status, last sync times, and configuration details on the Data Sources & Integrations and Outposts pages. | <ul><li>SOC Tier-2 and 3 Analysts: May need to verify data source status/configurations during investigations.</li><li>Threat Hunter: May need to understand data sources for comprehensive threat hunting.</li></ul> |
| View/Edit | Full control over data source management. Users can add new sources via the wizard, modify settings (credentials, sync intervals), enable/disable sources, and manage associated content items. | Security Engineer: Primary responsibility for configuring and maintaining data sources. |
Required and recommended permissions
Consider adding the following permissions:
| Permission | Permission Level | Reason |
|---|---|---|
| Integrations | View/Edit | Data Sources & Integrations is a shared page; need to manage integrations on the same page. Strongly recommended. |
| Marketplace | View/Edit | Browse and install new data source content packs from the Marketplace. Strongly recommended. |
| Log Collections | View | Managing XDR Collectors that may feed into data sources. Recommended. |
| Ingestion Monitoring (dashboards) | View | Viewing data ingestion dashboards. Recommended. |
External Issues Mapping permissions
Configure how alerts from third-party systems are translated into Cases through Settings → Configurations → Data Collection → External Issues Mapping.
For more information, see External alerts using External Issue Mapping.
| Permission | Description | Roles Example |
|---|---|---|
| None | Users cannot access the External Issue Mapping page. | SOC Tier-1 Analyst: External mapping configuration is not within Tier-1 scope. |
| View | Users can access the External Issue Mapping page and view all configured issue mappings and parsers. They can review how external alerts from third-party systems (such as Splunk, QRadar, or other SIEMs) are being mapped to issue fields. They can examine parser configurations, field mappings, and transformation rules. | <ul><li>SOC Tier 2 and 3 Analysts: Can review mappings for investigation purposes.</li><li>Threat Hunter: Understanding issue sources is valuable for threat hunting.</li></ul> |
| View/Edit | Users have full control over external issue mapping configurations. They can create new parsers and mapping rules, modify existing field mappings and transformation logic, enable or disable specific mappings, configure how external issue fields map to issue properties, and delete mapping configurations. | Security Engineer: Responsible for configuring alert mappings and parsers. |
Required and recommended permissions
Consider adding the following permissions:
| Permission | Permission Level | Reason |
|---|---|---|
| Cases & Issues | View | View the issues that result from external mappings. Required. |
| Detection Rules | View | Understanding correlation rules that may use external issues. Strongly Recommended. |
| Data Sources | View | Understanding which data sources feed into external issue mappings. Recommended. |
Integrations - instance permissions
Controls access to data collection integration instances, such as automation and feed integrations that collect and process data on the Data Sources & Integrations page (Settings → Data Sources & Integrations). It also controls access to classifiers and mappers Settings → Configurations → Object Setup → Issues → Classification & Mapping.
Data Sources & Integrations page
The Data Sources & Integrations page is a unified interface. Access levels are determined as follows:
- Data Sources permission only: Users can view the page and manage cloud accounts (CSP), Cloud Workload Protection (CWP) instances, and Cloud Access Security (CAS) connectors.
- Integrations permission only: Users can view the page and manage data collection integration instances, specifically automation and feed integrations.
- Both permissions: Users have full visibility and can manage both data sources and integrations on the same page.
There are two integration permissions:
- Integrations (under Data Collection): Configure data collection integrations
- Integration Permissions (under Integrations): Configure command permission for integrations.
| Permission | Description | Roles Example |
|---|---|---|
| None | Users cannot view or configure any data collection integrations, including feed and automation integrations, on the Data Sources & Integrations page. | SOC Tier-1 Analyst: Integration configuration is outside Tier-1 responsibilities. |
| View | Read-only access to the Data Sources & Integrations page. Users can see integration instances, their status, configuration details, and associated classifiers/mappers. | <ul><li>SOC Tier 2 and 3 Analysts: Verify integration status during case response/advanced analysis.</li><li>Threat Hunter: May need to understand data collection sources for threat hunting.</li></ul> |
| View/Edit | <p>Full control over integration configurations. Users can create, modify, and delete integration instances, manage credentials, and configure classifiers and mappers for data ingestion.</p><p>Users can view the Credentials page, but cannot edit it without the Credentials View/Edit permission.</p> | Security Engineer: Primary responsibility for configuring integrations. |
Required and recommended permissions
Managing integrations effectively often requires visibility into overlapping functional areas. Consider adding the following permissions:
| Permission | Permission Level | Reason |
|---|---|---|
| Data Sources | View/Edit | These are often used together on the Data Sources & Integrations page. Strongly recommended. |
| Marketplace | View/Edit | Strongly recommended. Necessary to install new integration content packs. Strongly recommended. |
| Log Collections | View/Edit | Strongly recommended. Log collection integrations that may be configured alongside data collection integrations. Strongly recommended. |
| Credentials | View/Edit | Strongly recommended for users who need full integration management capabilities, including credential lifecycle management (creation, rotation, deletion). |
Integrations Permissions
Controls access to the Integration Permissions page, a command-level access control layer that determines which roles are allowed to execute specific integration commands. This is distinct from the Integrations permission, which controls access to integration instances and their configuration.
Integrations Permissions provides fine-grained, per-command role restrictions on top of the broader integration access model. Access the Integration Permissions page by going to Settings → Configurations → Data Collection → Integration Permissions.
| Permission | Description | Role Example |
|---|---|---|
| None | Users cannot access the Integration Permissions page and have no visibility into command-level role restrictions. | |
| View | The user can view the hierarchical table of integrations, instances, and commands along with their assigned role restrictions on the Integration Permissions page, but cannot edit, modify, or use batch edit. | SOC 1, 2, and 3 Analysts, and Threat Hunters: Modifying command permissions is an administrative function. |
| View/Edit | Read and Write permission on the Integration Permissions page, including edit, assign, or remove roles from commands, use batch edit, and save changes. | Security Engineer: Responsible for configuring and maintaining integration command permissions. Needs to assign roles to commands, use batch edit for bulk changes, and manage the command-level access control model. |
Required and recommended permissions
To access the Integration Permissions page, the following permissions are required/recommended:
| Permission | Permission Level | Reason |
|---|---|---|
| Integrations | View | <ul><li>View: Having the Integrations View ensures the parent navigation section is accessible and provides context for the integration instances whose commands are being restricted. Strongly recommended.</li><li>View/Edit: Users who manage command-level permissions typically also need to configure integration instances. Recommended.</li></ul> |
| Credentials | View | Provides context about credential sets used by the integrations whose commands are being managed. No direct dependency, but useful for holistic integration management. |
Data Management permissions
Controls access to dataset configuration, data transformation rules, and data lifecycle management in Cortex XSIAM through Settings → Configurations → Data Management.
This permission includes:
- Dataset Management: For viewing and managing datasets
- Parsing Rules: For data transformation during ingestion
- Data Model Rules: For data normalization
- Event Forwarding: For sending data to external systems
This permission only offers None or View/Edit access. While SOC Tier-2, Tier-3, and Threat Hunters may need to view data schemas for advanced investigations, granting them View/Edit access gives them full control to alter parsing rules, modify datasets, and change ingestion pipelines. Grant this permission with caution and ensure proper change management protocols are in place.
| Permission | Description | Roles Example |
|---|---|---|
| None | Users cannot access any Data Management configuration pages. | SOC Tier-1 Analyst: Data management configuration is outside Tier-1 responsibilities. |
| View/Edit | Full control over creating/managing datasets, modifying parsing rules, and configuring advanced ingestion pipelines. | <ul><li>SOC Tier-2 and 3 Analysts: May need to understand data schemas during investigations/advanced analysis.</li><li>Threat Hunter: May need to understand data schemas and transformations for hunting.</li><li>Security Engineer: Primary responsibility for configuring data pipelines and transformations.</li></ul> |
Required and recommended permissions
Consider adding the following permissions:
| Permission | Permission Level | Permissions |
|---|---|---|
| Public APIs | View/Edit | Compute Unit Usage page access; without this, the Compute Unit Usage page is inaccessible. Required. |
| Forensics | View/Edit | Data Export functionality; without this, the Data Export page is inaccessible. Required. |
| Agent Profiles | View/Edit | Some dataset operations reference profiles; needed for full context. Strongly recommended. |
| Query Center | View/Edit | Running XQL queries against managed datasets. Strongly recommended. |
| Data Sources | View/Edit | Understanding which data sources feed into managed datasets. Recommended. |
Public API
Controls access to API key management for external integrations. This includes creating, viewing, editing, and revoking API keys that allow external systems to interact with Cortex XSIAM in Settings → Configurations → Integrations → API Keys. The Public API permissions also manage access to the Compute Unit Usage page.
Error Handling
Any API call attempting to fetch, list, or modify stored secrets using a restricted key will return a 403 Forbidden error with an Insufficient permissions message. This ensures that automated workflows, scripts, and CLI interactions follow a strict least-privilege model.
| Permission | Description | Roles Example |
|---|---|---|
| None | <p>The user cannot see the API Keys page or view or manage the Compute Unit Usage page.</p><ul><li>Access level: 403 Forbidden</li><li>Capabilities: All credential endpoints are blocked. Automated workflows, scripts, and CLI interactions cannot view, list, or reference stored secrets.</li></ul> | SOC Tier-1 Analyst: No need for API or Compute Unit Usage page access. |
| View | The user can view the list of existing API keys but cannot create, edit, or delete them. The user can view the Compute Unit Usage page, but cannot edit the daily compute unit limit. | <ul><li>SOC Tier-2 and 3 Analysts: May need to verify API integrations.</li><li>Threat Hunter: Review API integrations for hunting.</li></ul> |
| View/Edit | The user has full control over API keys, including creating, editing, and deleting them. The user can view the Compute Unit Usage page and edit the daily compute unit limit. | Security Engineer: Develop and manage API integrations. Manage daily usage of compute units. |
Required and recommended permissions
As API keys are often used to bridge data between modules, consider the following dependencies:
| Permission | Permission Level | Reason |
|---|---|---|
| Audit | View | Strongly recommended to track API key creation, modification, and deletion events for security compliance. |
| Integrations | View | Recommended to understand which integrations use API keys for data collection. |
| Credentials | View | Recommended to view credentials that may be associated with API-based integrations. |
Threat Intelligence permission - API configuration
Controls access to the configuration page for external threat intelligence API keys (Virus Total) on Settings → Configurations → Integrations → Threat Intelligence. This configuration enables the enrichment of indicators within the tenant using Virus Total.
| Permission | Description | Role Example |
|---|---|---|
| None | The user cannot access or view the Threat Intelligence configuration page. | SOC Tier-1 Analyst: Uses TI data but doesn't configure. |
| View | Users can see if a VirusTotal API key is configured but cannot add, edit, or test the key. | SOC Tier-2 and 3 Analysts: May need to review TI configurations. |
| View/Edit | Full access to add, edit, test, and save VirusTotal API key configurations. | <ul><li>Threat Hunter: Configure and use TI feeds</li><li>Security Engineer: Configure TI feed integrations.</li></ul> |
Required and recommended permissions
Managing threat intelligence effectively requires access to the modules that consume this data. Consider adding the following permissions:
| Permission | Permission Level | Reason |
|---|---|---|
| Threat Intelligence | View/Edit | Strongly recommended to access the Threat Intel module to manage indicators and IOCs that consume TI data. |
| Detection Rules | View/Edit | Strongly recommended to manage IOC and BIOC detection rules that leverage threat intelligence feeds. |
| Integrations | View | Recommended to view integration instances that ingest threat intelligence data. |
| Credentials | View | Recommended to view credentials used by TI feed integrations. |
| Query Center | View | Recommended to query threat intelligence data via XQL for hunting and analysis. |
Long-running HTTP Integrations configuration
Governs the backend service that hosts and serves dynamic content to external security devices, such as Palo Alto Networks firewalls. It allows administrators to enable or disable the EDL service and manage its global settings. Access this through Settings → Configurations → Integrations → External Dynamic List Integration.
This permission is used by administrators to set up and maintain the EDL service infrastructure.
EDL (under Investigation & Response permissions): Used by analysts to add or remove specific IP addresses and domains to lists during active investigations.
| Permission | Description | Role Example |
|---|---|---|
| None | The External Dynamic List Integration page is hidden. | <ul><li>SOC Tier-1 and 2 Analysts: No configuration needed.</li></ul> |
| View | Users can view existing EDL configurations and service status, but cannot make changes. | <ul><li>SOC Tier-3 Analyst: Understand EDL configurations.</li></ul> |
| View/Edit | Full control over the EDL service, including enabling/disabling the service and modifying global settings. | <ul><li>Threat Hunter: Understand data flows.</li><li>Security Engineer: Develop and manage API integrations.</li></ul> |
Required and recommended permissions
As the EDL service is used for response actions, consider these dependencies:
| Permission | Permission Level | Reason |
|---|---|---|
| EDL | View or View/Edit | Strongly recommended to use EDL as a response action. Add IPs/domains to EDL from Action Center, Causality View, Issue View, XQL queries, and playbook. |
| Threat Intelligence (under Threat Management) | View | Strongly recommended to view threat indicators that populate EDL content. |
| Playbooks | Enabled plus Edit Public Playbooks and Create Playbooks | Recommended to view/manage playbooks that trigger EDL actions. |
| Integrations | View | Recommended to view integration instances that consume EDL data. |
| Broker Service | View | Recommended if EDL is served through a Broker VM. |
Credentials permissions
Controls access to stored credential sets (reusable authentication objects that integrations and systems reference for connecting to external services). Credential sets centralize sensitive authentication data (such as, usernames, passwords, certificates, and API tokens) so they can be managed in one place rather than being embedded in each integration configuration.
Users can access Credentials on the Credentials page by going to Settings → Configurations → Integrations → Credentials.
To view the Credentials page, users require the following View permissions:
- Integrations
- Data Sources
- External Issue Mapping
Without these permissions, users can't view the Credentials page.
For more information, see Manage credentials.
| Permission | Description | Role Example |
|---|---|---|
| None | Completely revokes access to stored secrets. The Credentials page is hidden from the UI, all related Public API endpoints are blocked, and users cannot view or reference stored credentials in integrations, scripts, or playbooks. | CLI Role, CLI Read Only Role |
| View | <p>Enables backend API read access to credential sets (e.g., for automation or API-based workflows).</p><p>If users have access to the Credentials page, they can view a list of stored credential sets and their names. Users can't create, modify, or delete credential sets.</p> | <ul><li>SOC Tier-1, 2, and 3 Analysts: May need to verify credential status/credential configurations.</li><li>Threat Hunter: Verify integration authentication.</li></ul> |
| View/Edit | If users have access to the Credentials page, they can manage credential sets, including creating, deleting, and editing credentials. | Security Engineer: Manage integration credentials. |
Required and recommended permissions
Credentials often serve as dependencies for other automation and integration tasks. Consider adding these permissions:
| Permission | Permission Level | Reason |
|---|---|---|
| Integrations | View or View/Edit | <ul><li>View: Core permission to access the Credentials page. Required.</li><li>View/Edit: Highly Recommended. Users who manage credentials typically also need to configure integration instances that reference those credentials.</li></ul> |
| Data Sources | View | View: Core permission to access the Credentials page. Required. |
| External Issue Mapping | View | View: Core permission to access the Credentials page. Required. |
| Playbooks | Enabled | Strongly recommended to view integrations that use the stored credentials. |
| Scripts | Enabled | Strongly recommended to view scripts that may use credentials for external API calls. |
| Marketplace | View | Recommended. Allows browsing and installing integration content packs from the Marketplace, which may include integrations that use credential sets. |
| Audit | View | Recommended to track credential creation, modification, and usage for security compliance. |
Network Scanners permissions
Located under Settings → Configurations → Network Scanning, this permission allows administrators to set up scan definitions, manage credentials for authenticated scans, configure targets, and view results.
Requires either the ASM and the Exposure Management add-ons, or a Cortex XSIAM Premium license with the Exposure Management add-on.
For more information, see Cortex Network Scanner.
While configured under Integrations, Network Scanners serve as the active discovery engine for the broader vulnerability lifecycle. Data generated here directly populates the Vulnerability Management and Exposure Management modules.
| Permission | Description | Role Example |
|---|---|---|
| None | Users cannot access the Network Scanners page. | SOC Tier-1 and 2 Analysts: No scanning responsibilities. |
| View | Users can view existing scanner configurations and scan results, but cannot create, run, or modify scans. | <ul><li>SOC Tier-3 Analyst: Review scan configurations.</li><li>Threat Hunter: Review scan data.</li></ul> |
| View/Edit | Full control to create, configure, run, and delete network scan configurations | Security Engineer: Configure vulnerability scanning. |
Required and recommended permissions
Vulnerability scanning is deeply integrated with asset discovery and infrastructure. Consider adding the following permissions:
| Permission | Permission Level | Reason |
|---|---|---|
| Vulnerability Testing (under Attack Surface) | View or View/Edit | Core permission to access Network Scanners pages. Required. |
| Credentials | View/Edit | Strongly recommended to manage scan authentication credentials used for authenticated vulnerability scanning. |
| Broker Service | View/Edit | Required if using Broker VM as the scanning infrastructure. |
| Cases & Issues | View | Recommended to view vulnerability-related cases and issues generated from scan results. |
| Query Center | View | Recommended to query scan results and vulnerability data via XQL. |
Apps - Instance permissions
Controls the ability to install, configure, and delete Jupyter Notebooks and Observability instances (Settings → Configurations → Integrations → Apps).
To use and access the apps, users need the Apps permission. For more information, see Jupyter and Observability apps permissions.
| Permission | Description | Role Example |
|---|---|---|
| None | Users cannot see the Apps page. | SOC Tier-1, 2, and 3 Analysts, and Threat Hunter: Should not manage application instances. |
| View | Users can view the list of available and installed apps, but cannot install, configure, or delete them. | |
| View/Edit | Full control over the Apps page, including installing, configuring, and deleting app instances | Security Engineer: Deploy and manage applications. |
Required and recommended permissions
As Apps like Jupyter and Observability interact with datasets and infrastructure, consider adding these dependencies:
| Permissions | Permission Level | Reason |
|---|---|---|
| Apps (Jupyter) | View or View/Edit | Required to access Jupyter notebook instances after they are created. |
| Apps (Observability) | View or View/Edit | Required to access Observability app instances after they are created. |
| Query Center | View | Strongly recommended for XQL queries within Jupyter notebooks |
| Credentials | View | Recommended to access datasets from within Jupyter for analysis. |
Cortex SDK permission requirements for Jupyter Notebooks
When using Jupyter Notebooks with the Cortex SDK (Python SDK for Cortex XSIAM), the effective permissions are determined by the API Key configured for the Jupyter instance. The Cortex SDK authenticates with XSIAM APIs using this API key, and the key's associated RBAC role determines which data and actions are accessible within notebooks.
API key configuration
When configuring a Jupyter instance, an API key must be selected. This API key determines:
| Aspect | Description |
|---|---|
| Authentication | SDK uses the API key for all XSIAM API calls. |
| RBAC role | The API key's assigned role determines permissions. |
| Dataset access | Only datasets permitted by the role are queryable. |
| Action capabilities | Response actions limited to role permissions |
| Scope | Optional scope restrictions further limit access. |
API keys can have different security levels that affect SDK authentication:
| Security level | Description | Use case |
|---|---|---|
| Standard | Basic authentication | Development, testing |
| Advanced | Enhanced authentication with nonce and timestamp | Production environments |
Best practices for Jupyter and Cortex SDK
-
Principle of least privilege
Create a dedicated API key for Jupyter with minimal required permissions. Avoid using admin-level API keys for notebook operations, and regularly audit API key usage and permissions.
-
Dataset access control
Limit dataset access to only those needed for analysis. Consider creating a dedicated RBAC role for Jupyter SDK operations and using scope restrictions to limit data visibility.
-
Action permissions
Only enable response action permissions if notebooks will execute remediation. Consider separate API keys for read-only analysis vs. active response, and log and monitor all SDK-initiated actions.
-
API key management
Set appropriate expiration times for API keys. Rotate API keys periodically, and use descriptive comments to identify Jupyter-associated keys.
Key permissions for Cortex SDK operations
| Permission | Permission Level | Reason |
|---|---|---|
| Query Center | View or View/Edit | <ul><li>View: Required to run XQL queries through the SDK</li><li>View/Edit: Strongly recommended to create/save queries.</li></ul> |
| Query library | Enabled | <ul><li>Enabled: Strongly recommended to access saved queries</li><li>Enabled with checkboxes selected: Recommended to save queries to the Query library.</li></ul> |
| Dataset permissions | N/a | <p>Configured per-role when creating a role. Select</p><ul><li>Raw dataset: Required, Access to raw log data</li><li>Correlation dataset: Strongly recommended to access the correlation data.</li><li>User/audit datasets: Recommended to access user-related data and audit logs.</li></ul> |
| Cases & Issues | View or View/Edit | <ul><li>View: Strongly recommended to query case/issue data.</li><li>View/Edit: Recommended for automated workflows.</li></ul> |
| Action Center | View/Edit | <p>If the role includes action permissions, the SDK can execute response actions. Recommend adding:</p><ul><li>Isolate: Isolate endpoints</li><li>Terminate process: Terminate processes via SDK</li><li>File retrieval: Retrieve files</li><li>Quarantine files</li></ul> |
| Threat Intel | View | Strongly recommended to enrich data with threat intelligence. When creating/editing a role, select Threat Management. See Threat Management permissions. |
| Scripts/playbooks | Enabled with checkboxes selected | Recommended for engineering workflows. |
Object Setup permissions
The Object Setup section governs the structural and visual components of how security data is organized and displayed within the tenant.
This section includes:
Case Properties permissions
Controls access to the following tabs from Cases (Settings → Configurations → Object Setup → Cases):
- Domains: These represent the primary classifications for cases, such as Malware, Phishing, or Network Intrusion. Each domain has a name, color, description, associated statuses, and resolution statuses.
- Properties: Manages custom case statuses and resolution statuses. For example, New, Under Investigation, Pending, Resolved.
Caution
System-default statuses cannot be deleted, and domain names cannot be changed after creation.
| Permission | Description | Roles Example |
|---|---|---|
| None | No access to the Domains or Properties tabs. The tabs are hidden from the Cases Object Setup navigation. The user cannot view or modify custom statuses, resolution statuses, or case domains. | SOC Tier-1 Analyst: Tier-1 analysts work within existing case structures; they do not need to see or modify case property definitions (statuses, domains). |
| View | Read-only access. Users can browse the domains table and see existing custom and resolution statuses. | <ul><li>SOC Tier-2 and 3 Analysts: Need visibility into case structures (what statuses exist, what domains are configured) for investigation context and proper case categorization.</li><li>Threat Hunter: Needs context on case structures (statuses, domains) for hunting workflows and case creation.</li></ul> |
| View/Edit | Full read/write access. Users can create up to 20 custom statuses, reorder them, and manage domain status assignments. |
Required and recommended permissions
Consider adding the following permissions:
| Permission | Permission Level | Reasons |
|---|---|---|
| Cases & Issues | View or View/Edit | <ul><li>View: Required to view cases that use these statuses and domains.</li><li>View/Edit: Strongly recommended to change the case status/domain on actual cases.</li></ul> |
| Fields and Type | View | View the Fields tab alongside Domains/Properties in Cases Object Setup. Strongly recommended. |
| Layouts | View | View the Layouts and Layout Rules tabs in Cases Object Setup. Recommended. |
| Audit | View | Track changes to statuses and domains. Strongly recommended. |
Exclusion List permissions
Controls access to the indicator exclusion list configuration under Settings → Configurations → Object Setup → Indicators → Exclusion List. This governs the permanent exclusion of indicators such as IP addresses, domains, URLs, file hashes, and email addresses. It is primarily used for:
- Allowing known-good or trusted infrastructure.
- Suppressing false-positive indicators identified during investigations.
- Filtering noisy vendor feeds that generate high volumes of low-value alerts.
Note
When managing Indicators (located under Threat Management → Threat Intelligence → Indicators), users who lack View/Edit permissions for the Exclusion List will find that exclusion-related features (such as the Exclusion reason field and Do not add to exclusion list checkbox) are automatically hidden by the system.
Access to the Indicators page itself requires a Threat Intelligence Management (TIM) add-on or a Cortex XSIAM Premium license.
| Permission | Description | Roles Example |
|---|---|---|
| None | Users cannot view excluded indicators, add new ones, or perform imports/exports. | |
| View | Read-only access to the full table of excluded indicators, including values, types, and comments. Users can search, filter, and export the list. | SOC Tier-1 and 2 Analysts: Should be able to see what is excluded to understand why certain indicators are not flagged, but should not modify the list without approval. |
| View/Edit | Full read/write access. Users can manually add or remove indicators, perform bulk CSV imports/exports, and execute bulk operations. | <ul><li>SOC Tier 3 Analyst: Can manage exclusions based on advanced threat analysis findings; trusted to add/remove indicators from the exclusion list.</li><li>Threat Hunter: Critical for managing false positive indicators and tuning detection; threat hunters frequently need to exclude known-good indicators.</li><li>Security Engineer: Manages exclusion lists as part of TI pipeline tuning and false positive reduction.</li></ul> |
Required and recommended permissions
Consider adding the following permissions:
| Permission | Permission Level | Reasons |
|---|---|---|
| Threat Intel | View or View/Edit | <ul><li>View: Required to view indicators that may need exclusion; required to see the Indicators section.</li><li>View/Edit: Strongly recommended to manage indicators alongside exclusions (delete, edit indicators).</li></ul> |
| Cases & Issues | View | Understand the context of indicators being excluded (which issues they triggered). Strongly recommended. |
| Integrations | View | View TIM feed integrations that generate the indicators being excluded. Recommended. |
| Audit | View | Track who added/removed indicators from the exclusion list. Recommended. |
Fields and Types permissions
Controls access to custom fields and indicator types within Object Setup Settings → Configurations → Object Setup:
- Case fields (Cases → Fields): Custom fields that extend the case data schema, appearing in case views, queries, and layouts.
- Issue fields (Issues → Fields): Custom fields for the issue data schema, often used for automation rules and filtering.
- Indicator fields and types: Definitions for custom indicator fields and new indicator types (e.g., Cloud Resource ID), including extraction regex patterns.
- SLA rules: Service Level Agreement rules that define time-based expectations for issue handling.
| Permission | Description | Roles Example |
|---|---|---|
| None | No access to define fields, types, or SLA rules. Users can still view and use existing fields in case/issue views, but cannot modify their definitions | SOC Tier 1 Analyst: Schema changes are outside Tier-1 scope; they use existing fields but don't need to see field configuration. |
| View | Read-only access to all field definitions, indicator types, and SLA rule configurations. Allows exporting definitions to CSV. | <ul><li>SOC Tier 2 and 3 Analysts: Need to understand field definitions for advanced queries, custom field usage, and investigation workflows.</li><li>Threat Hunter: Needs to understand field definitions for hunting queries (XQL) and custom field usage.</li></ul> |
| View/Edit | Full read/write access. Users can create, modify, or delete custom fields and indicator types, write extraction regex, and set SLA rules. |
Required and recommended permissions
As schema changes impact how data is displayed and analyzed, consider the following dependencies:
| Permission | Permission Level | Reasons |
|---|---|---|
| Cases & Issues | View | Required to see how fields are used in actual cases/issues. |
| Layouts | View | Strongly recommended. See how fields are rendered in layouts; needed to design layouts that use custom fields. |
| Case Properties | View | Strongly recommended. Understand incident structure (statuses, domains) alongside field definitions |
| Threat Intel | View | Recommended. Understand indicator types and fields in the context of threat intelligence. |
| Audit | View | Recommended to track field creation/modification history. |
| Marketplace | View | Recommended to install content packs that include field definitions and indicator types. |
Layout permissions
Controls access within Object Setup (Settings → Configurations → Object Setup) to the following:
- Case layouts (Cases → Layouts): Visual layout definitions that determine how case data is presented when viewing a case. Layouts define which fields are shown, their arrangement in sections/tabs:
- Case layout rules (Cases → Layout Rules): Rules that determine which layout is applied to a given case based on conditions (e.g., case type, source, severity).
- Issue layouts (Issues → Layouts): Visual layout definitions that determine how alert data is presented when viewing an issue. Layouts define which fields are shown, their arrangement in sections/tabs, and widget configurations.
- Issue layout rules (Issues → Layout Rules): Rules that determine which layout is applied to a given issue based on conditions (e.g., issue type, source, severity).
| Permission | Description | Roles Example |
|---|---|---|
| None | Users have no access to layout configurations or rules. They can see data rendered in assigned layouts, but cannot modify the definitions | <ul><li>SOC Tier-1 Analyst: Layout configuration is an administrative function.</li><li>Threat Hunter: Layout configuration is outside the threat hunting scope.</li></ul> |
| View | Read-only access to all layout definitions and rules. The user can browse the layouts table (cases and issues) and browse layout rules and conditions. | SOC Tier-2 and 3 Analysts: May need to understand the layout structure for reporting purposes and to know what data is available in different views. |
| View/Edit | Full read/write access to create, edit, copy, and delete custom layouts and layout rules. | Security Engineer: Designs and implements custom layouts for alerts and incidents; builds the visual experience. |
Required and recommended permissions
Consider adding the following permissions:
| Permission | Permission level | Reasons |
|---|---|---|
| Cases & Issues | View | Required to edit layout rules and need to see case/issue data when creating/editing a layout rule. |
| Fields and Types | View | Required to see available fields when building layouts; essential for layout design. |
| Case Properties | View | Strongly recommended to understand the case structure (statuses, domains) for layout design. |
| Marketplace | View/Edit | Recommended to install content packs that include layout definitions. |
| Audit | View | Recommended to track layout changes. |
Sync Profile permissions
Controls access to case mirroring profiles configuration in Settings → Configurations → Object Setup → Issues → Sync Profiles.
Sync Profiles define the parameters for case mirroring with third-party platforms such as Jira and ServiceNow. When a profile is active, updates to cases in the tenant are automatically reflected in the external system, and depending on the profile type (inbound or bidirectional), changes in the external system can update XSIAM cases.
For more information, see Create a sync profile.
| Permission | Description | Roles Example |
|---|---|---|
| None | No access to Sync Profiles. Users cannot view, create, or select profiles for use in automation. | <ul><li>SOC Tier 1 and 2 Analyst: Mirroring configuration is typically handled by engineers.</li><li>Threat Hunter: Layout configuration is outside the threat hunting scope.</li></ul> |
| View | Read-only access. Users can view the Sync Profiles table and open profile details in read-only mode. | SOC Tier-3 Analyst: Should understand mirroring configurations for escalation workflows and cross-system case tracking. |
| View/Edit | Full read/write access to view, create, edit, and delete sync profiles. | Security Engineer: Configures and manages mirroring with external ticketing systems (Jira, ServiceNow). |
Required and recommended permissions
Consider adding the following permissions:
| Permission | Permission Level | Reason |
|---|---|---|
| Integrations | View or View/Edit | <ul><li>View: Required to view the connector integrations (Jira, ServiceNow) used by sync profiles.</li><li>View/Edit: Strongly recommended to configure the connector instances needed for mirroring</li></ul> |
| Cases & Issues | View | Required to view cases that use sync profiles for mirroring. |
| Fields and Types | View | Strongly recommended to understand field mappings in sync profiles (which XSIAM fields map to external fields). |
| Case Properties | View | Strongly recommended to understand the custom statuses that are mapped in sync profiles. |
| Credentials | View | Strongly recommended to view credentials used by connector integrations. |
| Playbooks | Enabled | Recommended to configure mirroring playbooks that use sync profiles. |
| Audit | View | Recommended to track sync profile changes. |
Marketplace permissions
Configure access to manage content packs in Marketplace.
Marketplace is the central hub for discovering, installing, and managing content packs in Cortex XSIAM. Content packs include integrations, playbooks, scripts, dashboards, and other automation content that extend capabilities. Installing a content pack is typically the first step; further configuration of the included integrations or credentials must be completed in the Configurations section.
Caution
Granting View/Edit access to the Marketplace allows users to install new content packs. As content packs often contain Python scripts and automated playbooks, this permission effectively allows users to introduce new executable code into the tenant. This should be restricted to Security Engineers and Administrators.
| Permissions | Description | Roles Example |
|---|---|---|
| None | No access to the Marketplace, and users cannot view content packs. | |
| View | Read-only access to browse, search, and view pack details and version history. | SOC Tier 1, 2, and 3 Analysts, and Threat Hunters: Browse available content and reference content packs during investigations. |
| View/Edit | Full access to install, uninstall, upload, and upgrade content packs. Users can also contribute content from other pages (e.g., scripts/playbooks). | Security Engineer: Full content management, including custom contributions. |
Required and recommended permissions
Consider adding the following permissions:
| Permission | Permission Level | Reason |
|---|---|---|
| Integrations | View | Strongly recommended to view and configure installed integration instances. |
| Playbooks | Enabled | Recommended to view installed playbooks. |
| Scripts | Enabled | Recommended to view installed scripts. |
| Credentials | View | Strongly recommended to configure integration credentials. |
Help permissions
Support
Allows users to create, view, and manage technical support cases by going to Help → In-App Help Center.
For more information, see In-product support case creation.
Caution
The tenant must have an active support contract, and the user must have CSP portal access.
| Permission | Description | Roles Example |
|---|---|---|
| None | The user can't submit support cases. | |
| View/Edit | <p>Enables users to submit support tickets directly from within Cortex XSIAM. This includes:</p><ul><li>Creating new support cases with Palo Alto Networks support.</li><li>Attaching files and recordings to support tickets.</li><li>Generating Technical Support Files (TSF) from endpoints.</li><li>Recording browser sessions for troubleshooting.</li></ul> | All roles should be able to submit support cases. |
Required and recommended permissions
Consider adding the following permissions:
| Permission | Permission Level | Reason |
|---|---|---|
| Retrieve Endpoint Data | Checked | Enables TSF (Technical Support File) generation from endpoints directly within the support case wizard. Without this, users cannot attach endpoint diagnostic data to tickets, significantly reducing support effectiveness for endpoint-related issues. Strongly recommended. |
| Agent Administrations | View/Edit | Strongly recommended to view and select endpoints in the support case form. Without this, the endpoint selection dropdown is disabled. Users cannot pick a specific endpoint to associate with their ticket. |
| Agents (Cortex Agentic Assistant) | View/Edit | Enables agent-related permissions within the support case form. When present, it allows the user to include the agent context in support tickets. Recommended. |
| Cases & Issues | View | Recommended to enable users to reference and attach issue/case context when submitting support cases about detection issues. |
SOC Operations, Investigation & Response permissions
This section includes all the daily operational tools primarily used by Tier-1 through Tier-3 analysts and Threat Hunters for triage, investigation, and case response.
Dashboards and Reports permissions
Controls the ability to monitor security posture through visual data and documented summaries.
Manage access separately for dashboards, reports, Command Center, ingestion monitoring, email, and Cloud Security Command Center. Enable only the capabilities and data access required for each role.
Dashboards permissions
Controls the ability to monitor security posture through visual data and documented summaries.
This is a master permission. To view any specific dashboard (e.g., Command Center), this primary permission must first be set to Enabled.
- Functionality: When enabled, users can manage the Dashboard Manager, use the widget library, and view accessible dashboards.
- Scope-Based Access Control (SBAC): Access to a dashboard does not grant access to the underlying data. If a user lacks the necessary SBAC data scope, widgets may appear empty or show errors
- Privacy: New dashboards are private by default. Administrators can configure sharing permissions under Settings → Configurations → Access Management → Objects.
- Predefined system dashboards and Marketplace dashboards cannot be deleted or have their privacy changed.
For more information on dashboards, see Overview of dashboards and reports.
| Permissions | Description | Roles Example |
|---|---|---|
| Enabled | <p>Users can manage dashboards in the Dashboard Manager, manage the widget library, view all dashboards they have access to, and perform actions based on the following additional permissions:</p><ul><li>Create Dashboards: Enables users to create custom dashboards. The creator becomes the owner with full control to edit, delete, and manage sharing for that dashboard.</li><li><p>Edit Public Dashboards: Enables users to modify custom dashboards that an owner has made public. By default, only the owner can edit a public dashboard.</p><div data-gb-custom-block data-tag="hint" data-style="info" class="hint hint-info"><p>Note</p><p>By default, all new dashboards are restricted (private) and visible only to the creator (the owner). An administrator (or role with equivalent access) can configure how dashboards are shared across the tenant under Settings → Configurations → Access Management → Objects. These settings control whether dashboard owners are allowed to share their restricted dashboards directly with other users. For more information, see Manage access to objects.</p></div></li></ul> | Most roles should have Dashboards enabled and for users to create and edit dashboards. |
| Disabled | Users cannot access the Dashboard Manager or view any dashboards. |
Required and recommended permissions
Dashboards rely on data from across the platform. For widgets to populate correctly, consider these dependencies:
| Permission | Permission Level | Reason |
|---|---|---|
| Cases & Issues | View | Dashboard widgets displaying case/issue data will show empty without this permission. Required. |
| Query Center | View | Query-based dashboard widgets require XQL query execution capability. Required. |
| Agent Administrations | View | Enables search functionality from within dashboards. Strongly recommended. |
| Asset Inventory | View | Asset widgets require this to display asset data. Recommended. |
| Forensics | View | Forensics widgets require this to display forensic data. Recommended. |
| Host Insights | View | Host insights widgets require this to display host analytics. Recommended. |
Command Center Dashboard permissions
Controls access to XSIAM Command Center and Cortex Command Center.
For more information about these dashboards, see Command Center reference.
| Permission | Description | Roles Example |
|---|---|---|
| None | No access to the XSIAM Command Center and Cortex Command Center Dashboards. | |
| View | View access to XSIAM Command Center and Cortex Center Dashboards. | Most roles should have view permission. |
Required and recommended permissions
As the Command Center is an aggregate view, it requires several other permissions to function correctly:
| Permission | Permission Level | Reason |
|---|---|---|
| Dashboards | Enabled | Command Center requires Dashboards View as a prerequisite. Required |
| Cases & Issues | View | Case KPIs and click-through to cases require this permission. Strongly recommended. |
| Agent Administrations | View | Endpoint KPIs and click-through to endpoints require this permission. Strongly recommended. |
| Playbooks | Enabled | Playbook status widgets in the Command Center require this permission. Recommended. |
| Ingestion Monitoring | View | Data ingestion KPIs in Command Center require this permission. Recommended. |
Ingestion Monitoring dashboard permissions
Access to the Data Ingestion Dashboard, which provides an overview of data ingestion by product and vendor:
- Daily quota consumption: Tracking used data limits against the organization's allowance.
- Data ingestion rates: Visualizing the velocity of incoming data.
- Source Health: Ensuring that various data sources and products are communicating correctly with Cortex XSIAM.
| Permission | Description | Roles Example |
|---|---|---|
| None | No access to the Data Ingestion Dashboard. | |
| View | Read-only access to the Data Ingestion Dashboard. | Most roles should have view permission. |
Required and recommended permissions
To effectively utilize the ingestion monitoring tools, consider these dependencies:
| Permission | Permission Level | Reason |
|---|---|---|
| Dashboards | Enabled | Required to access the dashboard. |
| Query Center | View | Recommended for deeper analysis of ingestion data through XQL queries. |
Reports permissions
Controls access to the generation and management of documented security summaries, ranging from shift handoffs to compliance evidence
Cortex XSIAM enforces least-privileged per-object access by allowing you to manage access for custom (user-defined) report templates. For more information, see Manage access to objects.
| Permission | Description | Roles Example |
|---|---|---|
| Enabled | <p>Access permissions change depending on the per-object access and sub-permissions granted as explained below. For example, when Reports are enabled users can view existing reports, but access to the Widget Library is dependent on Editor permissions.</p><p>Other access permissions include create, manage, and delete report templates, and generate new reports.</p><p>When set to Enabled, you can grant the following additional permissions:</p><ul><li>Create Report Templates: Enables the New Template button, allowing the user to create new custom report templates. The user who creates the report template is designated as the Owner.</li><li>Edit Public Report Templates: Allows the user to modify custom report templates set to Public, even if they are not the Owner.</li></ul> | Most roles should be able to view and edit reports. |
| Disabled | Users cannot access reports or report templates. |
Required and recommended permissions
Reports rely on populating data from various functional modules. For reports to be complete, consider the following dependencies:
| Permission | Permission Level | Reason |
|---|---|---|
| Cases & Issues | View | Required. Reports containing cases/issue statistics require this permission to populate data. |
| Agent Administrations | View | Strongly Recommended. Reports containing endpoint metrics require this permission. |
| Asset Inventory | View | Recommended: Reports containing asset information require this permission. |
| Compliance | View | Recommended. Compliance reports require this permission to include compliance metrics. |
Email Command Center permissions
Controls access to the Email Command Center, which enables you to view high-level metrics on inbound email threats, phishing trends, and top targeted users.
For more information, see Email Command Center.
Notice
Requires the Cortex Advanced Email Security add-on.
| Permission | Description | Roles Example |
|---|---|---|
| None | No access to the Email Command Center. | |
| View | View access to the Email Command Center. | Most roles should have view access. |
Required and recommended permissions
Consider adding the following permissions:
| Permission | Permission Level | Reason |
|---|---|---|
| Dashboards | Enabled | Required for the dashboard. |
| Command Center Dashboards | View | Email Command Center is part of the Command Center framework. Required. |
| Cases & Issues | View | Email-related cases and issues require this for click-through and context. Strongly recommended. |
| Query Center | View | Recommended for drilling down into raw email logs via XQL when a widget identifies a suspicious trend. |
| Threat Intelligence | View | Recommended for the context of the malicious indicators (URLs, Attachments) displayed within the email dashboard. |
Cloud Security Command Center permissions
Controls the ability to view and edit the Cortex Cloud Command Center, which is the central command center for cloud security, and includes capabilities like Cloud Security Posture Management (CSPM), Application Security Posture Management (ASPM), and Data Security Posture Management (DSPM).
Notice
Requires a Cloud Runtime Security, Cloud Posture Security, or Cortex XSIAM Premium license.
For more information, see Cortex Cloud Command Center.
| Permission | Description | Roles Example |
|---|---|---|
| None | No access to the Cloud Security Command Center. | Most roles, unless they need Cloud Security. |
| View | Read-only access to the Cloud Security Command Center. | Cloud viewer roles, such as Data Security Viewer, Developer, and AppSec Admin. |
| View/Edit | <p>Enables access and filtering, but it does not allow for editing the structure or widgets of the dashboard itself, as these are predefined.</p><div data-gb-custom-block data-tag="hint" data-style="info" class="hint hint-info"><p>Note</p><p>You also need Dashboards Enabled to view/edit these dashboards.</p></div> | Cloud admin roles, such as AI Security Administrator and Data Security Administrator. |
Required and recommended permissions
As this dashboard aggregates data from complex cloud inventories, it will not populate correctly unless the following permissions are also granted:
| Permission | Permission Level | Reason |
|---|---|---|
| Dashboards | Enabled | Required for the dashboard. |
| Command Center Dashboards | View | Cloud security cases and issues require this for click-through and context. Strongly recommended: |
| Asset Inventory | View | Cloud asset data requires this permission for full visibility. View: Strongly recommended: |
| Graph Search | View | Cloud asset relationship visualization enhances cloud security context. Recommended. |
Cases and Issues permissions
The Cases & Issues section is the heartbeat of SOC operations. It is the primary workspace where alerts are aggregated into issues, and issues are escalated into cases for full-scale investigation.
Limits permissions to the Cases, Issues, and Case Configuration pages. It controls how analysts interact with security events, from the initial triage of a single issue to the coordinated response to a multi-stage attack.
Caution
- To set Cases & Issues to View or View/Edit, you must first set the Scripts and Playbooks permissions to Enabled.
- When SBAC is set to Restrictive mode, users who don't have all the required tags shouldn't be able to read or edit the parent case (fields or context). For more information on setting restrictive mode, see Configure server settings.
- If users are assigned all tags on a child issue and have View/Edit permissions on Cases and Issues and Run Playbooks, they can trigger a playbook that could potentially change the parent case (even though users should not be able to do so according to SBAC). In this case, you can grant Add Trigger Playbook permissions, so users can bypass SBAC on the parent case fields and context data. For more information about updating fields in a playbook, see Update case fields.
- Users with View access to Cases and Issues can also view and edit Lists (under Settings → Configurations → Object Setup → Lists), provided they also have Script permissions.
| Permission | Description | Roles Example |
|---|---|---|
| None | Users cannot access Cases, Issues, and Case Configuration pages. | |
| View | Users can view cases and issues, see details, review investigation data, and view the Case Configuration page. Users cannot modify or take actions. | |
| View/Edit | <p>Full access to cases, issues, and case configuration. Users can view, modify, investigate, and take actions. Additional sub-permissions become available:</p><ul><li>Run Playbooks: Allows users to attach and trigger playbooks on issues for automated response</li><li>Create Case: Allows users to manually create new cases from issues or other sources.</li><li>Restrict Case Access: Allows users to change access to the case from the default scope to the assigned team only.</li></ul> | Most analyst roles should include View/Edit permissions to enable deeper investigation and case management. Run Playbooks and Restrict Case Access are not selected by default for most roles. |
Required and recommended permissions
For a Power User, the following permissions are essential for a complete investigation:
Note
Some roles require specific permissions. For example, a Security Engineer may require View/Edit for Playbooks, but a SOC Tier-1 Analyst does not.
| Permission | Permission Level | Reason |
|---|---|---|
| Query Center | View/Edit | XQL query results embedded in cases show errors without this. All roles need to view the query output for the case context. Required. |
| Query Library | Enabled | Strongly recommended/recommended. Allows saving and organizing personal XQL queries for reuse across investigations and rule development. |
| Playbooks | Enabled or Enabled with checkboxes selected | <ul><li>Enabled: Required. All roles need to be able to see the automated response history and playbook outputs.</li><li>Enabled with checkboxes selected: Required/strongly recommended. Create/modify playbooks for automated investigation and response workflows. Core for SOC Tier-3 Analysts and Security Engineers.</li></ul> |
| Scripts | Enabled or Enabled with checkboxes selected | <ul><li>Enabled: Required for most roles. Script output sections in cases are hidden without this. Needed to review automated enrichment and remediation results.</li><li>Enabled with checkboxes selected: Required for Security Engineers/Strongly recommended for SOC Tier-3, Threat Hunters, and Security Admins. Create/edit scripts for custom automation logic and specialized investigation tasks.</li></ul> |
| Asset Inventory | View or View/Edit | <ul><li>View: Required for most roles. The assets section in the case details is hidden without this. Need to see which hosts/users are involved in a case.</li><li>View/Edit: Strongly recommended/recommended for SOC Tier-3 Analysts, Threat Hunters, and Security Admins. Allows tagging and annotating assets during investigations.</li></ul> |
| Threat Intelligence | View or View/Edit | <ul><li>View: Required/Strongly recommended/recommended for all roles. Indicator enrichment data in cases is hidden without this. Needed for IOC context (reputation, WHOIS) during triage.</li><li>View/Edit: Strongly recommended/recommended for SOC Tier-3 Analysts, Threat Hunters, Security Admins, and Engineers. Create/edit IOCs. Hunters need to add custom indicators discovered during hunting.</li></ul> |
| Actions Center | View or View/Edit | <ul><li>View: Required/Strongly recommended for most roles. Response action history is not visible without this. Needed to see containment actions taken and their status.</li><li>View/Edit: Required for SOC Tier-3 Analysts, Threat Hunters, and Security Admins. Execute response actions (isolate, quarantine, block) during active case response.</li></ul> |
| Forensics | View or View/Edit | <ul><li>View: Recommended for SOC Tier-2 Analyst. Access host vulnerability and configuration data to assess the attack surface during investigations.</li><li>View/Edit: Required for SOC Tier 3 Analysts and Threat Hunters. Strongly recommended for Security Admins. Initiate host scans and file searches from host insights during investigations.</li></ul> |
| Host Insights | View or View/Edit | <ul><li>View: Required for SOC Tier-3 Analyst and Threat Hunter. Strongly recommended for Security Admin. Access host vulnerability and configuration data to assess the attack surface during investigations.</li><li>View/Edit: Strongly recommended for SOC Tier-3 Analysts, Threat Hunters, and Security Admins. Initiating host scans and file searches from host insights during investigations.</li></ul> |
| Graph Search | View or View/Edit | <ul><li>View: Visual investigation of entity relationships. Hunters use graph search to discover lateral movement and attack paths.</li><li>View/Edit: Save and share graph search queries for team collaboration.</li></ul><p>Strongly recommended for SOC Tier-3 Analysts and Threat Hunters. Recommended for Security Admins.</p> |
| Dashboards | Enabled or Enabled with checkboxes selected | <ul><li>Enabled: Used for queue prioritization and security posture assessment. Recommended for all roles.</li><li>Enabled with checkboxes selected: Create custom dashboards for hunting campaigns, rule monitoring, and investigation tracking. Recommended/Strongly recommended for SOC Tier-3 Analysts, Threat Hunters, Security Engineers, and Security Admins.</li></ul> |
| Reports | Enabled or Enabled with checkboxes selected | <ul><li>Enabled: View pre-built reports for shift handoff, trend analysis, and compliance evidence. Recommended for all roles.</li><li>Enabled with checkboxes selected: Create custom reports for hunting findings, rule performance, and executive briefings. Recommended/Strongly recommended for SOC Tier-3 Analysts, Threat Hunters, Security Engineers, and Security Admins.</li></ul> |
| Integrations | View | Integration data in cases is hidden without this. Useful for seeing third-party enrichment results (VirusTotal, MISP). Recommended for all roles. |
| Detection Rules | View or View/Edit | <ul><li>View: View detection rules to understand issue generation logic. Recommended/Strongly recommended for SOC Tier-3 Analysts, Threat Hunters, and Security Admins.</li><li>View/Edit: Create and modify BIOC, IOC, and correlation rules. Core for Security Engineers and strongly recommended for Security Admins.</li></ul> |
Investigation and Response permissions
Investigation and Response permissions are split as follows:
- Search permissions: Query Library permissions, Query Center permissions, Forensics permissions, Host Insights permissions, and Graph Search permissions.
- Response permissions: Action Center permissions, EDL permissions, Agent Scripts Library permissions, and Live Terminal permissions.
- Automation permissions: Playbook permissions, Script permissions, Jobs permissions, Playground permissions, and Automation Exclusion Center permissions.
Search permissions
Configure access to threat hunting, querying, and forensic data collection tools, including the Query Library, Query Center, Forensics, Host Insights, and Graph Search.
- query-library-permissions
- query-center-permissions
- forensics-permissions
- host-insights-permissions
- Dataset Access (SBAC) Requirement: Even with full Query Center access, queries will return empty results or errors if the user lacks the specific dataset permissions (configured per dataset).
- Query Library/Center: If you want users to execute and schedule queries from the Query Library, they must have View/Edit permission in the Query Center. To save queries directly from the Query Center to the Library, they need View/Edit in the Query Library.
Query Library permissions
Controls access to the Query Library, which is a repository of saved XQL queries within Cortex XSIAM. It allows users to save, organize, share, and reuse XQL queries across the team. Key capabilities include:
- Browse, search, and filter saved queries by name, labels, and type
- Save new queries from XQL Search results
- Share queries with specific users or make them public
Users can primarily access Query Library from Investigation & Response → Search → XQL Search, and select the Query Library tab.
Note
Users must have at least View permission in Query Center to access the Query Library from Query Center.
If you want to execute and schedule queries from the Query Library, you also need View/Edit permission in the Query Center.
Cortex XSIAM enforces least-privileged per-object access by allowing you to manage access for individual instances of Saved Queries. For more information, see Manage access to objects.
| Permission | Description | Roles Example |
|---|---|---|
| Enabled | <p>Users can browse, search, filter, and view saved queries. Users can also save, edit, delete, and share their own queries. Users can also be granted:</p><ul><li>Create Queries: Users can edit, delete, and share queries.</li><li>Edit Public Queries: Adds the ability to edit and delete public/shared queries created by other users.</li></ul> | Most roles require creating/editing public queries. |
| Disabled | No access to the Query Library. |
Required and recommended permissions
| Permission | Permission Level | Reason |
|---|---|---|
| Query Center | View or View/Edit | <ul><li>View: The XQL Search page (where the Query Library lives) requires this permission. Without it, users cannot access the page. Required.</li><li>View/Edit. Required if users want to run and schedule queries.</li></ul> |
| Dataset Access | N/a | Required. Queries reference specific datasets. Without dataset access, queries will return errors or empty results. |
| Dashboards | Enabled | Strongly recommended for users to take a query from the Library and instantly turn it into a Dashboard widget for persistent monitoring. |
| Reports | Enabled | Recommended for users who need to link a Library query to a scheduled report (e.g., a weekly "Top 10 Blocked IPs" report). |
Query Center permissions
Controls access to the Query Center (under Investigation & Response → Search), which is the primary interface for writing, executing, and managing XQL queries in Cortex XSIAM. It is the core investigation tool that enables security analysts to search across all ingested data using a powerful query language. Key capabilities:
- Write and execute XQL queries against any ingested dataset.
- View query execution history and results.
- Schedule recurring queries
- Export query results
Caution
Access to the Query Center is strictly governed by Scope-Based Access Control (SBAC). Even if users have View/Edit permissions, they will only see data returned from the endpoint groups or log sources defined in their specific role scope.
For more information, see Overview of the Query Center.
| Permission | Description | Roles Example |
|---|---|---|
| None | The entire Investigation section is hidden: Query Center, Query Builder, and Scheduled Queries are all inaccessible. | |
| View | Read-only access to the Query Center. Users can view query history, view scheduled queries, view active queries, and view individual execution results, but cannot run new queries. | Most viewer-type roles. |
| View/Edit | Full read and write access, including scheduling, canceling, running queries, deleting execution data, and deleting executions. | Most roles require query execution, scheduling, and management. |
Required and recommended permissions
To make the most of the Query Center capabilities, consider adding the following permissions:
| Permission | Permission Level | Reason |
|---|---|---|
| Dashboards | Enabled | Strongly recommended for the analyst to take an XQL query and Save to Dashboard to create a visual monitoring widget. |
| Reports | View/Edit | Recommended if the analyst needs to turn a search result into a scheduled PDF report for management. |
| Query Library | Enabled with checkboxes selected | Recommended to view saved queries. |
| Dataset Access | N/a | Ensure the role's Data Scope includes the necessary pro-datasets (e.g., Cloud, Network, Endpoint) or the user will receive "No Results Found" even with a perfect query. |
Forensics permissions
Controls access to Forensics (Investigation & Response → Forensics). Forensic investigations streamline your case response, data collection, threat hunting, and analysis of your endpoints.
Notice
You need the Forensics add-on to view Forensic investigations.
For more information, see Forensic investigations.
| Permission | Description | Roles Example |
|---|---|---|
| None | Users cannot see forensic artifacts or trigger new collections. | |
| View | Read-only access to forensics investigations | <ul><li>SOC Tier-1 Analyst: View forensics data for context, but cannot initiate collections.</li><li>SOC Tier-2 Analyst: View forensics data and escalate to Tier-3 for collections.</li><li>Security Engineer: View forensics for understanding data as not the primary function.</li></ul> |
| View/Edit | Full read and write access, including create, edit, and delete investigations, start, pause, and delete threat hunts. | <ul><li>SOC Tier-3 Analyst: Full forensics capabilities, including triage and hunt.</li><li>Threat Hunter: Full forensics for deep-dive investigations.</li></ul> |
Required and recommended Permissions
Consider adding the following permissions:
| Permission | Permission Level | Reason |
|---|---|---|
| Agent Administrations | View | Forensics displays endpoint data extensively. Without this, endpoint information within forensics investigations will fail to load or show errors. Required. |
| Query Center | View | Strongly recommended to run queries on the host data. |
| Cases & Issues | View | Strongly recommended to view issues associated with forensic investigations. |
Host Insights permissions
Limits access to Host Insights/Inventory (Inventory → Endpoints → Host Insights)), which enables you to gain visibility and inventory into the business and IT operational data on all your endpoints. For more information, see Host Inventory.
Unlike Forensics, which is a point-in-time snapshot, Host Insights is designed for broad fleet visibility and hygiene. It covers:
- Host Inventory: Operating system details, installed software, local user accounts, and listening ports.
- Searchability: The ability to hunt for "at-risk" systems across the environment (e.g., finding every server running an outdated version of Java).
Note
It is important to distinguish between Host Insights and Asset Inventory permissions. Host Insights is a deep insight into endpoints that have a Cortex XDR agent installed. Asset Inventory is a broad list of everything on your network (unmanaged devices, cloud buckets, etc.). For more information, see Asset Inventory permissions.
Accessing the Host Inventory menu (from Host Insights) provides different capabilities based on your license. If you have Cortex XSIAM Enterprise or Cortex XSIAM NG-SIEM with a Host Insights license, you have access to Vulnerability Assessment. For Cortex XSIAM Premium or Cloud Security (Posture/Runtime) licenses, you have access to Vulnerability Management. See Vulnerability Management permissions.
| Permissions | Description | Roles Example |
|---|---|---|
| None | Limits access to the Host Inventory menu. | |
| View | Users can search the inventory, view host details, and browse software lists. They can open the Asset View but cannot trigger management actions. | <ul><li>SOC Tier-1 Analyst: View host inventory and vulnerability data for triage.</li><li>Security Engineer: View host data for detection development.</li></ul> |
| View/Edit | Full access to the inventory, including the ability to manage scan settings or trigger manual inventory refreshes. | <ul><li>SOC Tier-2 Analyst: View host data and escalate for file search/destroy.</li><li>SOC Tier-3 Analyst: Full host insights, including file search and destroy.</li><li>Threat Hunter: Full host insights for endpoint hunting.</li></ul> |
Required and recommended Permissions
Consider adding the following permissions:
| Permission | Permission Level | Reason |
|---|---|---|
| Agent Administrations | View | Host Insights displays endpoint/agent data. Without this, the host data will fail to load properly. Required. |
| Query Center | View | Strongly recommended to run queries on the host data. |
| Asset Inventory | View | Strongly recommended for the user to view Host Insights data directly within the broader Asset View for a seamless experience. |
| File Search | Checked | Dependency for file search action. Only needed if View/Edit permission is granted for Host Insights and the user needs to search for files across endpoints. |
| Destroy Files | Checked | Dependency for the destroy files action. Only needed if View/Edit permission is granted and the user needs to delete files from endpoints. This is an irreversible action; grant with caution. |
Graph Search permissions
Limits access to Graph Search Investigation & Response → Search → Query Builder → Graph Search), which enables visual exploration of cloud asset relationships, configurations, and security findings through an interactive graph interface, such as discovering cloud asset relationships, investigating security findings, and analyzing effective permissions.
Notice
Graph Search requires a Cloud Posture Security, Cloud Runtime Security, or Cortex XSIAM Premium license.
For more information, see Graph Search.
| Permission | Description | Roles Example |
|---|---|---|
| Graph Search | Cannot view the Graph Search page, execute graph queries, or view saved queries. | |
| View | Execute graph queries, export, and support all view capabilities, such as viewing recent queries, graph definitions, and runtime events. | |
| View/Edit | Full access to use the graph and save specific graph views or templates for others to use. | <ul><li>SOC Tier-1, 2, and 3 Analysts: Save graph queries for reuse in investigations.</li><li>Threat Hunter: Full graph search for cloud threat hunting.</li><li>Security Engineer: Full graph search for cloud security engineering/IT Admin.</li></ul> |
Required and recommended Permissions
Consider adding the following permissions:
| Permission | Permission Level | Reason |
|---|---|---|
| Query Center | View | Graph Search translates XQL logic into visual nodes. Without search permissions, the graph cannot query the data lake. Required. |
| Query Library | Enabled with checkboxes selected | Strongly recommended to view and save graph queries in the library tab. Without this, the library tab in the Graph Search side panel may not function correctly. |
| Agent Administrations | View | Recommended to populate host-specific metadata (like OS version or isolation status) within the graph nodes. |
| Asset Inventory | View | Graph Search visualizes cloud asset data. Required to view asset data in the graph search. Required. |
| Cases & Issues | View | Strongly recommended to view cases and issues in graph search. |
| Action Center | View/Edit | Recommended so an analyst can right-click a node (process or file) in the graph and take immediate action, such as Terminate Process. |
Response permissions
Configure access to endpoint and network response actions. This module controls access to the Action Center, External Dynamic Lists (EDL) indicator management, the Agent Script Library, and Live Terminal interactive shells.
Action Center permissions
Action Center permissions
In the Action Center, you can initiate and monitor actions on your endpoints. You can limit access to the Action Center (Investigation & Response → Response → Action Center) and response actions (outside the Action Center). When you select View/Edit, you can set additional permissions.
For more information, see Overview of the Action Center.
| Permission | Description | Roles Example |
|---|---|---|
| None | No access to the Action Center, and response action buttons are hidden. | SOC Tier-1 Analysts: View action history, isolation status, and quarantine lists, but cannot execute any actions. |
| View | Read-only access. You can see the action history and results, but cannot initiate any actions. All action buttons are hidden. | IT Admin: Response actions (isolate, terminate process, quarantine, file retrieval, file search, destroy files) are security response functions. Granting IT Admins access to these actions creates significant risk — they could isolate endpoints or destroy files. |
| View/Edit | <p>Full control to initiate, retry, or cancel actions. This is a high-privilege permission that enables the Response in Endpoint Detection and Response (EDR). Unchecked actions remain view only.</p><p>When Action Center is set to View/Edit, the following action checkboxes become available. Each checkbox controls whether the user can execute that specific action type.</p> | SOC Tier 2 and 3 Analysts, Threat Hunters, and Security Engineers have full access with granular controls. |
Warning
- High-risk/destructive actions: The Destroy Files and Delete Quarantine Files actions are irreversible and permanently delete data from endpoints. Disable Response Actions temporarily pauses endpoint protection, leaving the system vulnerable. Live Terminal allows arbitrary command execution and file manipulation. These features should be strictly restricted to Security Engineers and Admins.
- Checkbox dependencies: Certain actions rely on others to function. To grant File Retrieval or Destroy Files, you must also enable the File Search checkbox. To grant Delete Quarantine Files, you must also enable the Quarantine checkbox.
- Master switch: Setting the primary Action Center permission to View/Edit acts as a master switch that reveals granular execution checkboxes (such as Isolate or Run Standard Scripts). Leaving these checkboxes unchecked allows the user to view the action history without the ability to execute the action.
Action Center sub-permissions
| Sub-permission | Description | Roles Example |
|---|---|---|
| Isolate | <p>Isolates an endpoint from the network while maintaining communication with the Cortex XSIAM tenant.</p><ul><li>Checked: Full access to Isolate in all menus, such as Isolate when defining an action in the Action Center and isolating endpoints on the Vulnerability Assessment page. Initiate, cancel, and edit isolation with comments.</li><li>Unchecked: Users can view isolation history and status in the Action Center, but cannot initiate or cancel isolation.</li></ul> | All Responders/Admins. The SOC Tier-1 Analyst should escalate isolation decisions to Tier 2, but can monitor isolation status. |
| Terminate Process | <p>Terminates running processes on endpoints. Can terminate individual processes by process ID or entire causality chains (all processes from a malicious parent). This stops active malicious activity without requiring full endpoint isolation.</p><p>The Causality view is available from the Cases or Issues pages, or from the Query Results (Investigation & Response) → Query Builder → Build an XQL Query)after running a query on the related data. From both of these places, you can pivot (right-click) to the causality chain view.</p><ul><li>Checked: Full access to the Terminate Process option in the Causality View. Users can initiate termination from remediation suggestions.</li><li>Unchecked: Users can view process termination history in Action Center, but can't initiate termination.</li></ul><div data-gb-custom-block data-tag="hint" data-style="info" class="hint hint-info"><p>Tip</p><p>Consider adding the Remedation permission. Terminate Process appears in the Remediation Suggestions panel. Enabling both provides a complete response workflow.</p></div> | All Responders/Admins. The SOC Tier-1 Analyst should escalate process termination to Tier 2, but can view termination history. |
| Quarantine | <p>Moves malicious or suspicious files to a secure quarantine folder on the endpoint, preventing execution while preserving the file for analysis. Quarantined files can be restored if determined to be false positives.</p><ul><li>Checked: Full access to quarantine files in the Action Center and in the Causality View. Users can restore quarantined files, can add a hash to the allow list during restore, and can view quarantine details per endpoint.</li><li>Unchecked: User can view the File Quarantine tab in the Action Center and view quarantine files in the Causality View, but can't quarantine or restore files.</li></ul> | All Responders/Admins. SOC Tier-1 Analysts and Threat Hunters need to hand off to SOC Tier 2 and 3 Analysts for containment. |
| File Retrieval | <p>Retrieves files from endpoints for forensic analysis. Files are uploaded to Cortex XSIAM where they can be downloaded for examination, malware analysis, or evidence preservation.</p><ul><li>Checked: Users can retrieve files from an endpoint in Action Center, from file search results, and view/download files from Action Center and from Cases.</li><li>Unchecked: Users can view retrieval history in Action Center, but can't download retrieved files.</li></ul><div data-gb-custom-block data-tag="hint" data-style="info" class="hint hint-info"><p>Tip</p><p>Consider adding the following permissions:</p><p>File Search. File Retrieval is typically initiated from File Search results. Without File Search, retrieval options are limited.</p></div> | All Responders/Admins. SOC Tier-1 and 2 Analysts and Threat Hunters need to hand off to SOC Tier 3 Analysts or the Forensics Team for containment. |
| File Search | <p>Searches for files across all managed endpoints by hash (SHA256, MD5), file path, or file name patterns. Used to determine file prevalence, locate IOCs, and identify affected endpoints.</p><div data-gb-custom-block data-tag="hint" data-style="info" class="hint hint-info"><p>Notice</p><p>Requires the Host Insights add-on, which is included in Cortex XSIAM Enterprise and Premium licenses.</p></div><ul><li>Checked: Full access to File Search when defining an action in the Action Center. Users can search files by hash, path, or pattern.</li><li>Unchecked: Users can view search history in Action Center, but can't rerun file searches.</li></ul><div data-gb-custom-block data-tag="hint" data-style="info" class="hint hint-info"><p>Tip</p><p>Consider adding File Retrieval. After finding files, users often need to retrieve them for analysis.</p></div> | All Responders/Admins. The SOC Tier-1 Analyst should escalate to the SOC Tier 2 Analyst. |
| Destroy Files | <p>High risk. Permanently and irreversibly deletes files from endpoints. This is a destructive action that cannot be undone. Used to remove persistent malware or malicious files that cannot be quarantined.</p><ul><li>Checked: Full access to take action to destroy files in the Action Center. Users can destroy files from file search results and permanently delete files from endpoints.</li><li>Unchecked: Users can view the destroyed file history in the Action Center, but can't permanently delete files.</li></ul> | SOC Tier-3 Analysts and Security Admins. This is a high-risk action that permanently deletes files and cannot be reversed. |
| Allow List/Block List | <p>Exempt or block files matching specified hashes across the environment.</p><ul><li>Checked: Full access to take action on the Allow List or Block List, such as adding hashes to the allow/block list when defining an action in the Action Center, editing list entries, and moving hashes between lists.</li><li>Unchecked: Users can view the Allow List and Block List tabs in Action Center, see hash entries and status, but can't add, edit, or delete allow/block lists.</li></ul> | SOC Tier-3 Analysts, Threat Hunters, Security Engineers, and Security Admins who manage hash-based prevention policies. |
| Disable Response Actions | <p>High risk. Temporarily disables or pauses endpoint protection and response capabilities. This weakens endpoint security and should be used only for troubleshooting or specific operational requirements.</p><p>You can view disabled response actions by going to Inventory → Endpoints → All Endpoints. If you have View/Edit permissions, pivot (right-click) an endpoint that isn't an iOS endpoint, and select Endpoint Control → Disable Capabilities.</p><ul><li>Checked: Users can disable specific response actions on endpoints, pause endpoint protection temporarily, and can re-enable disabled actions.</li><li>Unchecked: Users can view current response action status, see which actions are disabled, but can't modify response action settings or pause endpoint protection.</li></ul> | Security Admins only. Disabling response actions reduces security posture and should require proper change management approval. |
| Remediation | <p>Execute automated actions to reverse malicious system changes (registry, files, processes).</p><ul><li>Checked: Full access to Remediation Suggestions from Case View. Users can initiate remediation from Causality View and can execute file restore, registry restore, and process termination.</li><li>Unchecked: Users can view remediation history in Action Center, see remediation results and status, but can't initiate remediation actions.</li></ul> | All Responders/Admins. The SOC Tier 1 Analyst should escalate to Tier 2 Analysts. |
| Delete Quarantine Files | <p>High risk. Permanently deletes files from the quarantine folder on endpoints. Unlike restoring quarantined files, this action removes the files entirely and cannot be undone.</p><ul><li><p>Checked: Full access to delete files from the File Quarantine page, enabling a user to permanently remove quarantined files from endpoints.</p><p>The delete option only appears in the Aggregated by SHA256 tab in File Quarantine.</p></li><li>Unchecked: Users can view the quarantined files list in the Action Center, including file details and status, but can't permanently delete quarantined files.</li></ul><div data-gb-custom-block data-tag="hint" data-style="info" class="hint hint-info"><p>Tip</p><p>Consider adding Quarantine. Delete Quarantine Files operates on the quarantine list. Without the Quarantine checkbox, users can still see the list, but the Delete option requires the quarantine view to be meaningful.</p></div> | <ul><li>SOC Tier-3 Analyst: May need to permanently remove confirmed malware after thorough analysis. Has experience for informed deletion decisions.</li><li>Security Engineer: Manages quarantine storage, cleans up confirmed malware, and maintains endpoint health. Understands implications of permanent deletion.</li></ul> |
Agent Scripts Library permissions
The Agents Script Library in the Action Center (Investigation & Response → Response → Action Center → Agent Script Library) enables security teams to create, manage, and execute Python scripts on endpoints for response actions, forensic collection, and custom automation.
| Permission | Description | Roles Example |
|---|---|---|
| None | No access to the Agent Script Library. Users cannot run scripts on endpoints, access script execution history, create, edit, or delete scripts. | |
| View | Users can access the Agent Script Library and view the script list, details, and code. Download the script code and definitions file and view the script history and results. | SOC Analyst Tier-1: Should have visibility into scripts and execution history, but no execution capabilities. |
| View/Edit | <p>When set to View/Edit, the following action checkboxes become available:</p><ul><li>Run Standard Script</li><li>Run High Risk Script</li><li>Script Configurations</li></ul> | SOC Tier 2 and 3 Analysts, Threat Hunters, and Security Engineers should have full access with granular controls. |
Agent Script Sub-permissions
| Sub-permission | Description | Roles Example |
|---|---|---|
| Run Standard Scripts | <p>Enables execution of standard scripts, which are lower-risk operations that don't make significant system changes, such as data collection, log retrieval, or read-only queries.</p><ul><li>Checked: Full access to run standard scripts in the Action Center (where the Outcome column is set to Standard), when defining an action (select Run Endpoint Script), Agent Management, and can rerun standard script executions and use interactive script mode for standard scripts.</li><li>Unchecked: Can view standard scripts in the Agent Script Library, but cannot execute standard scripts.</li></ul> | SOC Tier 2 and 3 Analysts, Security Engineers, Threat Hunters. |
| Run High-Risk Scripts | <p>Enables execution of scripts marked as High-Risk, which can make significant system changes, including file modifications, process termination, registry changes, or system configuration alterations. These scripts require elevated permissions due to their potential impact.</p><ul><li>Checked: Full access to run high-risk scripts in the Action Center (where the Outcome column is set to High-Risk), when defining an action (select Run Endpoint Script), Agent Management, and can rerun High-Risk script executions and use interactive script mode for standard scripts.</li><li>Unchecked: Can view high-risk scripts in the Agent Script Library, but cannot execute standard scripts.</li></ul><div data-gb-custom-block data-tag="hint" data-style="info" class="hint hint-info"><p>Tip</p><p>Consider adding Run Standard Scripts. High-risk scripts permission is typically granted alongside standard scripts.</p></div> | SOC Tier-3 Analysts, Security Engineers, and Threat Hunters. |
| Script Configurations | <p>Controls the ability to create, edit, clone, and delete scripts in the Agents Script Library. This is separate from the ability to run scripts.</p><ul><li><p>Checked: Full script management capabilities, including creating, editing, deleting, and saving a script</p><div data-gb-custom-block data-tag="hint" data-style="info" class="hint hint-info"><p>Note</p><p>Only local scripts (created in the tenant) can be edited or deleted. Scripts from content packs can only be viewed or copied.</p></div></li><li>Unchecked: Can only view and download scripts.</li></ul> | Security Engineer |
Required and recommended permissions
Consider adding the following permissions:
| Permission | Permission Level | Reason |
|---|---|---|
| Action Center | View | Without Action Center access, users cannot reach the Script Library page. Required. |
| Cases & Issues | View | Strongly recommended as the script execution results link to cases. |
| Agent Administrations | View | Required for endpoint selection for script execution. |
| Live Terminal | View | Often used together. Run scripts for data collection and then use Live Terminal for hands-on investigation. Recommended. |
EDL permissions
EDL (External Dynamic List) enables security teams to:
- Add IP Addresses and Domains to Dynamic Lists - Create lists of malicious or suspicious IPs/domains
- Integrate with Palo Alto Networks Firewalls - EDL lists are automatically synced and enforceable on PANW firewalls.
- Block Malicious Traffic - Firewalls can use EDL to block traffic to/from listed entities
- Centralized Threat Response - Manage blocklists from a single location across your security infrastructure
Note
This permission is for analysts to use as a response action during case investigation. The Long Running HTTP Integrations configuration (under Configurations) is for administrators to set up and manage the EDL service infrastructure. For more information, see Forward Requests to Long-Running Integrations.
| Permission | Description | Roles Example |
|---|---|---|
| None | Nothing related to EDL, such as viewing EDL lists, adding entities to EDL, and accessing the EDL configuration. | |
| View/Edit | Add new IPs and domains to EDL entries in Action Center, Causality View, Issue View, XQL Queries, Threat Intel, and playbooks. Also removing entries from EDL. | All SOC Analysts, Threat Hunters, and Security Engineers |
Required and recommended permissions
Consider adding the following permissions:
| Permission | Permission Level | Reason |
|---|---|---|
| Action Center | View | EDL is accessed through the Action Center. Required. |
| Cases & Issues | View | Add to EDL/Remove from EDL appears in Case View and Causality View. Required. |
| Query Center | View | Add to the EDL context menu appears in the XQL Investigation results. Strongly recommended. |
| Threat Intel | View | Add to EDL appears in the IOC Rules context menu. Threat Intel view permission is needed to access the IOC Rules page. Strongly recommended. |
Agent Scripts Library permissions
The Agents Script Library in the Action Center (Investigation & Response → Response → Action Center → Agent Script Library) enables security teams to create, manage, and execute Python scripts on endpoints for response actions, forensic collection, and custom automation.
| Permission | Description | Roles Example |
|---|---|---|
| None | No access to the Agent Script Library. Users cannot run scripts on endpoints, access script execution history, create, edit, or delete scripts. | |
| View | Users can access the Agent Script Library and view the script list, details, and code. Download the script code and definitions file and view the script history and results. | SOC Analyst Tier-1: Should have visibility into scripts and execution history, but no execution capabilities. |
| View/Edit | <p>When set to View/Edit, the following action checkboxes become available:</p><ul><li>Run Standard Script</li><li>Run High Risk Script</li><li>Script Configurations</li></ul> | SOC Tier 2 and 3 Analysts, Threat Hunters, and Security Engineers should have full access with granular controls. |
Agent Script Sub-permissions
| Sub-permission | Description | Roles Example |
|---|---|---|
| Run Standard Scripts | <p>Enables execution of standard scripts, which are lower-risk operations that don't make significant system changes, such as data collection, log retrieval, or read-only queries.</p><ul><li>Checked: Full access to run standard scripts in the Action Center (where the Outcome column is set to Standard), when defining an action (select Run Endpoint Script), Agent Management, and can rerun standard script executions and use interactive script mode for standard scripts.</li><li>Unchecked: Can view standard scripts in the Agent Script Library, but cannot execute standard scripts.</li></ul> | SOC Tier 2 and 3 Analysts, Security Engineers, Threat Hunters. |
| Run High-Risk Scripts | <p>Enables execution of scripts marked as High-Risk, which can make significant system changes, including file modifications, process termination, registry changes, or system configuration alterations. These scripts require elevated permissions due to their potential impact.</p><ul><li>Checked: Full access to run high-risk scripts in the Action Center (where the Outcome column is set to High-Risk), when defining an action (select Run Endpoint Script), Agent Management, and can rerun High-Risk script executions and use interactive script mode for standard scripts.</li><li>Unchecked: Can view high-risk scripts in the Agent Script Library, but cannot execute standard scripts.</li></ul><div data-gb-custom-block data-tag="hint" data-style="info" class="hint hint-info"><p>Tip</p><p>Consider adding Run Standard Scripts. High-risk scripts permission is typically granted alongside standard scripts.</p></div> | SOC Tier-3 Analysts, Security Engineers, and Threat Hunters. |
| Script Configurations | <p>Controls the ability to create, edit, clone, and delete scripts in the Agents Script Library. This is separate from the ability to run scripts.</p><ul><li><p>Checked: Full script management capabilities, including creating, editing, deleting, and saving a script</p><div data-gb-custom-block data-tag="hint" data-style="info" class="hint hint-info"><p>Note</p><p>Only local scripts (created in the tenant) can be edited or deleted. Scripts from content packs can only be viewed or copied.</p></div></li><li>Unchecked: Can only view and download scripts.</li></ul> | Security Engineer |
Required and recommended permissions
Consider adding the following permissions:
| Permission | Permission Level | Reason |
|---|---|---|
| Action Center | View | Without Action Center access, users cannot reach the Script Library page. Required. |
| Cases & Issues | View | Strongly recommended as the script execution results link to cases. |
| Agent Administrations | View | Required for endpoint selection for script execution. |
| Live Terminal | View | Often used together. Run scripts for data collection and then use Live Terminal for hands-on investigation. Recommended. |
Live Terminal permissions
Live Terminal enables security teams to establish real-time interactive shell sessions with endpoints for investigation, forensic analysis, and remediation activities.
| Permission | Description | Roles Example |
|---|---|---|
| None | No access to Live Terminal | <p>SOC Tier-1 Analyst: Initial triage role - should not have direct endpoint shell access. Risk of accidental damage or evidence tampering. Requires advanced skills they may not have</p><p>.</p> |
| View/Edit | <p>Full access to the Live Terminal Investigation & Response → Response → Live Terminal, and to start a Live Terminal in all menus such as Casuality View, Asset View, Case View, and Broker VM. Users can do the following:</p><ul><li>Initiate terminal sessions</li><li>File Explorer (browse, upload, download, delete files)</li><li>Task Manager (view, terminate processes)</li><li>Command Line (CMD, PowerShell, Python)</li><li>All terminal capabilities</li></ul> | <ul><li>SOC Tier 2 and 3 Analysts: Perform deeper investigation needing direct endpoint access for evidence collection, process analysis, and targeted remediation.</li><li>Threat Hunter: Needs direct endpoint access to investigate suspicious activity, collect artifacts, analyze processes, and validate threat hypotheses. Core hunting tool.</li><li>Security Engineer: Troubleshoots agent issues, tests endpoint configurations, validates security controls, and supports complex case response.</li></ul> |
Required and recommended permissions
Response actions require deep integration with the core platform to locate endpoints, track containment history, and link actions back to the active case. Consider adding the following permissions:
| Permission | Permission Level | Reason |
|---|---|---|
| Agent Management | View | Live Terminal is initiated from the Agent Management context menu. Without this, users have no way to browse and select endpoints. Required. |
| Live Terminal (Action Center) | View | Live Terminal actions are logged in the Action Center. Users need visibility into their session history and results. Recommended |
| Cases & Issues | View | Actions link directly to cases. Access is required to initiate response actions directly from the Causality View or Issue View context menus. Recommended. |
| Scripts | Enabled with checkboxes selected | Enabled with Scripts and Create Scripts selected. Required for the Action Center's Scripts tab to be visible, and required to execute items from the Agent Script Library. |
| Query Center | View | Recommended to view File Search results, investigate script executions, or add indicators to blocklists directly from XQL results. |
| Forensics | View | Complementary investigation tool. Forensic Timeline and Event Log Search provides context for Live Terminal activities. Recommended |
| Host Insights | View | Recommended to access the IOC Rules page to block indicators or evaluate hash exceptions. |
Automation permissions
This section covers permissions for playbooks, scripts, playground, and the Automated Exclusion Center.
- playbook-permissions
- script-permissions
- jobs-permissions
- playground-permissions
- automation-exclusion-center-permissions
Caution
Cortex XSIAM enforces a strict permission dependency chain for automation and case management. You must grant at least View access to Scripts before you can grant access to Playbooks. Consequently, you must grant at least View access to Playbooks before you can enable Cases & Issues.
Playbook permissions
Playbooks are automated response workflows. By default, the Playbooks permission is set to Disabled. To set it to Enabled, you must first set Scripts to Enabled. When you enable Playbooks, you can then set Cases and Issues to View or View/Edit.
Important
Playbooks are a prerequisite for the entire Investigation & Response workspace. You cannot set Cases and Issues to View/Edit unless Playbooks is Enabled.
Cortex XSIAM enforces least-privileged per-object access by allowing you to manage access for custom (user-defined) playbooks. For more information, see Manage access to objects.
| Permission | Description | Roles Example |
|---|---|---|
| Enabled | <p>Users can browse the playbook library and are granted access depending on their per-object access and sub-permissions explained below. Some of the additional options can include:</p><ul><li>Create, edit, and delete playbooks</li><li>Enable/disable playbooks</li><li>Import and duplicate playbooks</li><li>Select a playbook on Issues</li><li>View the visual task-flow of a playbook</li><li>See the "Work Plan" within a case, when they have access to Cases and Issues (under Cases & Issues)</li></ul><p>When set to Enabled, you can grant the following additional permissions:</p><ul><li>Create Playbooks: Enables all methods for adding playbooks to Cortex XSIAM. This includes the Build New Playbook button, as well as the ability to Duplicate, Attach, or Detach playbooks. The user who performs these actions is automatically designated as the Owner.</li><li>Edit Public Playbooks: Allows the user to modify custom playbooks set to Public, even if they are not the Owner.</li><li>Unlock: Enables unlocking playbooks locked by other users during concurrent editing and overrides the lock when another user is editing.</li></ul><div data-gb-custom-block data-tag="hint" data-style="info" class="hint hint-info"><p>Note</p><p>Playbooks can only be Enabled when Scripts are Enabled first.</p></div> | <ul><li>SOC Tier-1 and 2 Analysts and Threat Hunters: Need visibility into playbooks but should not modify them.</li><li>SOC Tier 3 Analysts: Run playbooks on issues.</li><li>Security Engineer: Security Engineers need full playbook capabilities for advanced development.</li></ul> |
| Disabled | <p>Cannot access the Playbooks page, view any playbook configurations, see the playbook execution status (unless they access to the issue), and access the Workplan in cases/issues.</p><div data-gb-custom-block data-tag="hint" data-style="info" class="hint hint-info"><p>Note</p><p>Playbooks can only be Disabled after Cases and Issues (under Cases & Issues) are set to None first.</p></div> |
Required and recommended permissions
To build a functional playbook, an engineer typically needs the following permissions:
| Permission | Permission Level | Reason |
|---|---|---|
| Scripts | Enabled with checkboxes selected | Enabled with Scripts and Create Scripts selected. Most playbook tasks are actually scripts. You cannot configure the inputs/outputs of a task effectively without script visibility. |
| Integrations | View | Strongly Recommended. Required to see which external tools (e.g., VirusTotal, Slack, Active Directory) are available to be used as tasks. |
| Cases and Issues | View/Edit | Required to set playbook on issues (trigger playbooks). Otherwise set to view (minimum). Playbooks run on issues; Workplan needs all three permissions. |
| Action Center | View/Edit | Recommended. Since many playbooks execute remediation (e.g., Isolate), the Action Center is where those specific tasks are tracked and audited. |
| Playground | View/Edit | Recommended to test commands. |
| Dashboards | Enabled | Recommended. Dashboard events trigger playbook views. |
Script permissions
The Scripts permission is a foundational administrative and operational tool. In Cortex XSIAM, scripts (primarily Python-based) are the engine behind automated enrichment, complex data manipulation, and custom remediation actions.. For more information, see Scripts.
Caution
Scripts are a prerequisite for Playbooks. You cannot set Playbooks to Enabled unless Scripts is Enabled.
By enabling the Scripts component and selecting Create scripts that will run with super user, users gain unrestricted access to sensitive system resources. Because these scripts bypass standard security controls, this permission must be strictly limited to Security Engineers and Administrators.
Cortex XSIAM enforces least-privileged per-object access by allowing you to manage access for custom (user-defined) scripts. For more information, see Manage access to objects.
| Component | Description | Roles Example |
|---|---|---|
| Enabled | <p>Can access the Scripts page, view script code and configurations, script execution results, and export script definitions.</p><p>Users can create, modify, and delete scripts depending on their per-object access and sub-permissions explained below. This can include the ability to import scripts from the Marketplace or upload custom Python code. This also allows a user to manually run a script from the CLI (War Room) or within a case.</p><p>When set to Enabled, you can grant the following additional permissions:</p><ul><li>Create Scripts: Enables all methods for adding scripts to Cortex XSIAM. This includes the New Script button, as well as the ability to Attach, Duplicate, or Detach scripts. The user who performs these actions is automatically designated as the Owner.</li><li>Edit Public Scripts: Allows the user to modify custom scripts set to Public, even if they are not the Owner.</li><li>Create scripts that will run with super user: Create scripts that will run with super user, which enables users to create scripts with elevated privileges, and users can mark scripts as high risk. Scripts that run with superuser can access all system resources. If unchecked, users can only create standard scripts.</li></ul><div data-gb-custom-block data-tag="hint" data-style="info" class="hint hint-info"><p>Note</p><p>Users can also view and edit Lists (under Settings → Configurations → Object Setup → Lists) provided they have Cases & Issues permissions.</p></div> | <ul><li>SOC Tier 1, 2, and 3 Analysts and Threat Hunters: Should not do script editing, but need visibility into automation workflows.</li><li>Security Engineer: Security Engineers need full script capabilities for advanced development.</li></ul> |
| Disabled | <p>Cannot access the Scripts page, view any script configurations, see script execution results, or access any automation scripts in any context.</p><div data-gb-custom-block data-tag="hint" data-style="info" class="hint hint-info"><p>Note</p><p>Scripts can only be Disabled after first setting Playbooks to Disabled and Playground to None.</p></div> |
Required and recommended permissions
Consider adding the following permissions:
| Permission | Permission Level | Reason |
|---|---|---|
| Playbooks | Enabled | Strongly recommended, as scripts are almost always the building blocks inside a playbook. To build an automated workflow, you need both. |
| Cases and Issues | View | Strongly recommended, as script execution results are tied to cases. |
| Action Center | View or View/Edit | <ul><li>View: Strongly recommended to view script execution history in the Action Center.</li><li>View/Edit: Strongly recommended, as many scripts trigger response actions (like Isolate); the Action Center tracks these executions.</li></ul> |
| Playground | View/Edit | View/Edit: Recommended to test scripts before deploying (especially Super User scripts). |
| Credentials | View | View: Recommended for scripts that require API keys or tokens to talk to external 3rd-party integrations (e.g., VirusTotal, ServiceNow). |
| Query Center | View | Recommended for scripts designed to pull and parse XQL data for custom reporting. |
Jobs permissions
Configure access to automation jobs. Jobs are scheduled playbook tasks that run at predefined intervals or in response to feed changes.
By default, the Jobs permission is set to None. While you can enable the Jobs permission itself, you will not be able to select playbooks to run within the job unless you have at least Viewer access to those playbooks. Additionally, viewing the results of a job within a case requires access to the Cases & Issues component.
| Permission | Description | Roles Example |
|---|---|---|
| View/Edit | Users can create, edit, enable/disable, and delete jobs. They can also manually trigger a job to Run now. | SOC Manager / Security Engineer: Needs full control over scheduling and operational tasks. |
| View | Users can view the list of all scheduled jobs, their status (Running, Error, etc.), and their next scheduled run time. | Compliance Auditor: Needs to verify that automated cleanup or reporting tasks are scheduled. |
| None | Cannot access the Jobs page or view any job configurations. | Standard User: Does not require access to backend automation scheduling. |
Required and recommended permissions
To work with jobs, an administrator must configure your user role with specific RBAC permissions.
| Component | Permission Level | Reason |
|---|---|---|
| Scripts (under Investigation & Response > Automations) | Enabled | Required to view and manage the underlying scripts used in automation workflows. |
| Playbooks (under Investigation & Response > Automations) | Enabled | Required to select and view the playbook logic that a job will execute. |
| Jobs (under Investigation & Response > Automations) | View or View/Edit | Enables access to the Jobs page to monitor or manage scheduled tasks. |
| Cases and Issues (under Cases & Issues) | View or View/Edit | Required to view the results (War Room/Work Plan) of jobs executed within an investigation container. |
Important considerations
- Visibility: For all users with View or Edit permissions, all Jobs are listed regardless of the user's object-level access to the specific Playbooks used in those jobs.
- System execution: Playbooks triggered by jobs run as "system". They are governed by the permissions of the involved integrations rather than the access context of the user who created the job.
- Execution results: To view the War Room or Work Plan for an investigation opened by a job, the user must have the Cases & Issues permission set to View or View/Edit (which in turn requires Playbooks and Scripts to be enabled).
Playground permissions
Controls Playground Investigation & Response → Automation → Playground, which is a testing environment for commands and scripts that is not connected to a live (active) investigation.
| Permission | Description | Roles Example |
|---|---|---|
| None | Users cannot access the Playground page and cannot test commands, scripts, and integrations. | SOC Tier-1 analysts: Do not need Playground access for basic triage. |
| View/Edit | Users can access the Playground page and can test commands, scripts, and integrations. | SOC Tier 2 and 3 Analysts, Security Engineers, and Security Admins: Benefit from playground access for testing and learning. |
Required and recommended permissions
Consider adding the following permissions:
| Permission | Permission Level | Reason |
|---|---|---|
| Scripts | Enabled | Strongly recommended to see the scripts being tested. |
| Playbooks | Enabled | Strongly recommended to test playbook commands in context. |
| Cases & Issues | View | Recommended, as commands reference case data. |
| Query Center | View | Recommended for XQL query testing. |
Automation Exclusion Center permissions
Controls access to the Automation Exclusion Center (Settings → Configurations → Automation → Automation Exclusion Center), which prevents a command or script from a remediation action. For more information, see Automation Exclusion Center.
| Permission | Description | Roles Example |
|---|---|---|
| None | Cannot access the Automation Exclusion Center, view any exclusion policies, or view excluded assets. | SOC Tier 1: Do not need to view exclusion policies or excluded assets. |
| View | Can access the Automation Exclusion Center (read-only), view exclusion policies, excluded assets and counts, and view policy compliance status. | SOC Tier 2 and 3 Analysts and Threat Hunters: Need View access to help understand automation behavior. |
| View/Edit | All View capabilities, plus create new exclusion policies, edit existing policies, delete policies, manage asset exclusions, and update policy rules. | Security Engineers: Need to configure automation behavior and permissions. |
Required and recommended permissions
Consider adding the following permissions:
| Permission | Permission Level | Reason |
|---|---|---|
| Playbooks | Enabled | Strongly recommended to understand which playbooks are impacted by exclusions. |
| Scripts | Enabled | Strongly recommended for Playbooks; exclusions may reference scripts. |
| Cases & Issues | View or View/Edit | Exclusions applied to cases (need context). View/Edit Recommended to trigger playbooks. Helps manage exclusions effectively. Strongly recommended. |
Jupyter and Observability apps permissions
The following permissions enable users to use Jupyter and Observability applications.
Caution
Usage and management: The permissions allow users to use and access existing application instances. If a user needs to manage, install, configure, or delete application instances, they must be granted the separate Apps permission under the Configurations menu. For more information, see Apps - Instance permissions.
Jupyter Notebook permissions
An interactive notebook environment for creating and running Python-based analyses and automations. Jupyter Notebooks let you explore security data, build custom analytics, and prototype detections.
Caution
Jupyter Data Access (SBAC): Granting access to Jupyter does not bypass dataset restrictions. Users must have the appropriate Scope-Based Access Control (SBAC) dataset permissions to query specific data via the Cortex SDK within their notebooks.
For more information, see Notebooks.
| Component | Description | Roles Example |
|---|---|---|
| None | No access to Jupyter Notebooks. | <ul><li>SOC Analyst Tier-1: Focus on issue triage.</li><li>SOC Analyst Tier-2: Standard investigation tools are sufficient. Consider View/Edit if the team performs advanced analysis.</li></ul> |
| View/Edit | Full access to Jupyter Notebooks, including installing, creating, editing, saving, and exporting notebooks. You can also execute Python code and access datasets. | <ul><li>SOC Analyst Tier-3: Advanced investigations often require custom analysis, data exploration, and ad-hoc queries.</li><li>Threat Hunter: Critical - Notebooks are essential for hypothesis-driven hunting, custom analytics, and data exploration.</li><li>Security Engineer: Develops custom detection logic, automation scripts, and analysis tools.</li></ul> |
Jupyter Notebook - required and recommended permissions
Consider adding the following permissions:
| Permission | Permission Level | Reason |
|---|---|---|
| Query Center | View or View/Edit | <ul><li>View: Required to run XQL queries from notebooks via Cortex SDK.</li><li>View/Edit: Strongly recommended to save and manage queries created in notebooks.</li></ul> |
| Dataset Permissions | N/a | Various. Control which datasets are queryable from notebooks. |
| Query Library | Enabled | Strongly recommended to access and save queries. |
| Cases & Issues | View or View/Edit | <ul><li>View: Strongly recommended to view cases and issues data for correlation in notebooks.</li><li>View/Edit: Recommended to create/update cases from notebook analysis.</li></ul> |
| Threat Intel | View | Strongly recommended to enrich data with threat intelligence in notebooks. |
| Playbooks | Enabled with checkboxes selected | Enabled with Playbooks and Create Playbooks selected. Recommended to reference and develop playbooks from notebooks. |
| Scripts | Enabled with checkboxes selected | Enabled with Scripts and Create Scripts selected. Recommended to reference and develop scripts alongside notebooks. |
| Detection Rules | View/Edit | Recommended to view and create detection rules for analysis. |
| Forensics | View/Edit | Recommended to access the forensics data for analysis and initiate forensic action. |
| Action Center | View/Edit | Recommended to view and execute response actions. |
Observability
Observability provides infrastructure and application monitoring capabilities within Cortex XSIAM, leveraging Prometheus-based metrics collection, alerting, and visualization through Grafana integration.
Note
Observability is a Beta feature and is still subject to changes. To enable the feature in your tenant, contact your Customer Support Team.
| Component | Description | Roles Example |
|---|---|---|
| None | No access to Observability. | SOC Analyst Tier-1, 2, and 3, and Threat Hunters who do not need tool development. |
| View/Edit | Full access to Observability, including access to the Observability interface, View Prometheus UI, and Alert Manager. | Security Engineers: Require full access for tool development and configuration. |
Observability - required and recommended permissions
Consider adding the following permissions:
| Permission | Permission Level | Reason |
|---|---|---|
| Broker VM | View or View/Edit | Strongly recommended to view Broker VMs hosting Observability collectors and configure Observability collectors on Broker VMs. |
| Alert Notifications | View/Edit | Recommended to configure alert notifications from Observability alerts. |
| Data Sources | View/Edit | Recommended to manage data sources that feed into Observability. |
| Cases & Issues | View/Edit | Recommended to correlate Observability alerts with security cases and create cases from Observability findings. |
| Audit | View | Recommended to review audit logs for Observability configuration changes. |
Threat Management permissions
Threat Management encompasses Detection rules and threat intelligence capabilities, providing security teams with tools to detect, investigate, and respond to threats.
Caution
Threat Intelligence and Detection Rules are interconnected. To allow users to automatically create IOC detection rules from intelligence feeds, you must grant them View/Edit in Detection Rules. When users are reviewing IOC rules, they must have View access to Threat Intelligence to see the actual indicators the rule is matching against
For detailed access guidance, see:
Detection Rules permissions
Detection Rules permissions
You can limit permissions for Detection rules (Threat Management → Detection Rules), which include the following:
- IOC Rules: Indicator of Compromise rules that detect known malicious artifacts such as file hashes, IP addresses, domains, and URLs based on threat intelligence feeds.
- BIOC rules: Behavioral Indicator of Compromise rules that detect suspicious activity patterns using XQL queries to identify threats based on behavior rather than static indicators.
- Analytic rules: Machine learning and statistical analysis rules that detect anomalies and threats using the Analytics Engine for advanced behavioral detection.
- Correlations: Correlation rules that combine multiple events or conditions to detect complex attack patterns spanning multiple data sources or time periods.
- Indicator rules: Rules that automatically create IOC detection or prevention rules based on threat intelligence indicators matching specific criteria.
Caution
Users must have View/Edit access to the Query Center if they are expected to create or edit BIOC and Correlation rules.
| Component | Description | Roles Example |
|---|---|---|
| None | No access to Detection Rules. | |
| View | Read-only access to Indicator rules, IOC, BIOC, Correlations, and Exceptions pages. | SOC Tier-1 analysts: Understand what rules are triggering issues. |
| View/Edit | <p>Full access to Detection rules, including creating, editing, deleting, and enabling rules.</p><p>When Rules is set to View/Edit, you can grant the following additional permissions:</p><ul><li>Prevention Rules: Blocks or stops suspicious or malicious processes on an endpoint.</li><li>Request WildFire Verdict Change: Report a file’s WildFire verdict as incorrect and suggest a corrected classification.</li></ul> | <ul><li>SOC Tier 2 Analyst: Investigate cases and may need to create or modify detection rules based on findings. Should not manage prevention rules or request WildFire Verdict Change.</li><li>SOC Tier-3 Analyst: Handles complex incidents and has the authority to manage prevention rules and request WildFire Verdict Change.</li><li>Threat Hunter: Proactive threat detection specialists who search for hidden threats and create detection rules based on hunting findings. Should not manage prevention rules, but can Request WildFire Verdict Change.</li><li>Security Engineer: Full access to build and optimize detection/prevention capabilities, including WildFire verdict change requests.</li></ul> |
Required and recommended permissions
Consider adding the following permissions:
| Permission | Permission Level | Reason |
|---|---|---|
| Query Center | View/Edit | Required to edit BIOC and Correlation Rules. |
| Cases & Issues | View | Strongly recommended. Detection rules generate issues that appear in Cases & Issues. Without case access, analysts cannot see the issues triggered by the rules they are viewing, losing critical context for rule effectiveness assessment. |
| Threat Intelligence | View | <p>Strongly recommended for Threat Intelligence (TIM). IOC rules are based on threat intelligence indicators. Without Threat Intelligence view, users cannot see the indicators that IOC rules are matching against, making rule review incomplete. Required for Extended Threat Intelligence (XTI). Indicator rules are based on XTI indicators. Without Threat Intelligence view, users cannot use the indicators that indicator rules are matching against.</p> |
| Policies | View | Recommended. Prevention rules are assigned to policies. Viewing policies helps understand which rules are actively enforced on endpoints and their scope. |
| Global Exceptions | View | Recommended. Global Exceptions View provides visibility into exception rules that may suppress detection rule issues. |
Threat Intelligence permissions
Located under Threat Management → Threat Intelligence, these permissions govern how your organization interacts with indicators (IPs, URLs, Domains, Hashes) and intelligence feeds. It allows you to transform raw data from sources like Unit 42 or AlienVault into actionable security logic.
Notice
The Extended Threat Intelligence feature requires the Cortex XSIAM Premium license or another XSIAM license with the Extended Threat Intelligence (XTI) add-on.
The Threat Intelligence Management (TIM) requires the Threat Intelligence Management (TIM) license.
For more information, see Extended Threat Intelligence if you are using XTI, or Threat Intel Management if you are using TIM.
| Component | Description | Roles Example |
|---|---|---|
| None | <p>In TIM, no access to the Indicators page.</p><p>In XTI, no access to the Indicators, Threat Intel Library, or Threat Intel Dashboard pages.</p> | |
| View | <p>In TIM, users can search the indicator database and view reputation scores.</p><p>In XTI, users can search the Threat Intel Library, the Indicator database, and Threat Intel Dashboard.</p> | SOC Tier-1 analysts: View threat intelligence context for investigations. |
| View/Edit | <p>In TIM, full control to manage indicator rules, manually override reputation scores, and configure intelligence feeds. In XTI, full control to manage indicators and indicator rules.</p> |
<ul><li>SOC Tier-2 and 3 Analysts: Enables creating and editing indicators discovered during investigations, adding context to IOCs, and enriching case artifacts with threat intelligence data.</li><li>Threat Hunter: Enables researching threat actors and campaigns, creating indicators from hunting discoveries, enriching IOCs with contextual data, and documenting threat intelligence findings.</li><li>Security Engineer: Enables integrating threat intel into detection rules, testing indicator-based detections, managing IOC feeds for rule development, and validating threat intel data quality.</li></ul> |
Required and recommended permissions
Consider adding the following permissions:
| Permission | Permission level | Reason |
|---|---|---|
| Cases & Issues | View | Strongly recommended. Indicator enrichment data appears in case artifacts, and editing indicators from case context requires case access. |
| Detection Rules | View/Edit | Strongly Recommended. Enables creating indicator or IOC rules directly from indicators. |
| Allow/Block List | Checked | Strongly recommended. Add to Block List is a primary action on indicators. |
| EDL | View | Strongly recommended. Add to EDL is a primary action on IP/domain indicators. |
| Query Center | View/Edit | Enables investigating indicator matches via XQL queries. Essential for validating indicator impact before creating rules or blocking. |
| Threat Intel (under Integration Permissions) | View/Edit | Recommended for configuring VirusTotal API keys for indicator enrichment. |
| Exclusion List | View/Edit | Recommended to manage indicator exclusions. Useful for managing false positive indicators. |
| Integrations | View | Recommended. TIM feed integrations are configured under Integrations. Viewing integrations helps understand which threat intel feeds are active and contributing indicators. |
Exceptions Configuration permissions
Exceptions Configuration permission controls how security teams manage alert/issue suppression and exception workflows. It provides mechanisms to:
- Suppress false-positive issues by creating exclusion rules that automatically prevent matching issues from being generated.
- Manage exception rules that define conditions under which issues are treated as exceptions (requiring approval workflows).
- Configure approval workflows for exception management, including designating approvers and toggling approval requirements.
For detailed access guidance, see:
Issue Exclusions permissions
Issue Exclusions controls access to the All Issue Exclusions and Exceptions page under Settings → Issue Exception & Exclusion, which includes the following:
- Exclusion Rules: Defines conditions (based on issue attributes, such as severity, source, category, etc.) that automatically suppress the creation or surfacing of matching issues. This is the primary mechanism for tuning out false positives and reducing issue noise.
- Exception Rules: Defines conditions under which issues are flagged as exceptions that may require approval before being acted upon, rather than being silently suppressed.
This permission controls access to the All Issue Exclusions and Exceptions page. If users require access to Exception Rules, they also need Exception Approver Admin View or View/Edit permission.
| Permission | Description | Roles Example |
|---|---|---|
| None | No access to the All Issue Exception & Exclusion Rules page. | SOC Tier-1 Analyst: Should escalate false positives rather than create exclusions. |
| View | Read-only access to the All Issue Exception & Exclusion Rules page. Users can browse both Exclusion Rules and Exception Rules tabs, view rule details (name, description, indicator conditions, BIOC indicators, status, modification time), search and filter rules, and export data, but cannot create new rules, edit existing rules, delete rules, or enable/disable rules on either tab. | SOC Tier-2 Analyst and Threat Hunter: Should reference existing exclusions during investigations or understand filtered activity. |
| View/Edit | Read and write access to theAll Issue Exception & Exclusion Rules page, including creating, editing, deleting, enabling, importing, and duplicating Exclusion Rules and Exception Rules. | <ul><li>SOC Tier-3 Analyst: Create exclusions for validated false positives.</li><li>Security Engineer: Manage exclusion rules as part of tuning.</li></ul> |
Required and recommended permissions
Consider adding the following permissions:
| Permission | Permission Level | Reason |
|---|---|---|
| Cases & Issues | View or View/Edit | <ul><li>View: Exclusion rules are based on issue attributes. Without issue visibility, users cannot understand the context of what is being excluded.</li><li>View/Edit: Users manage issues and create exclusions directly from issue context menus. Analysts typically create issue exclusions directly when investigating an issue. To right-click and exclude an issue, the user must have View/Edit permissions. Strongly recommended.</li></ul> |
| Exception Management Admin | View/Edit | Users who manage exclusion rules typically also need to manage exception rules to complete the exception management workflow. Strongly recommended. |
| Detection Rules | View | Recommended to view related IOC/BIOC detection rules to understand what triggers the issues being excluded. |
| Agent Profiles | View | Recommended to view endpoint profiles for scoping exclusions to specific endpoint groups. |
| Global Exceptions | View | Strongly recommended to view global exception policies to understand the full exclusion landscape and avoid conflicts. |
| Query Center | View | Recommended to run XQL queries to validate exclusion impact and verify suppressed issues. |
Exception Management Admin permissions
Exception Management Admin controls access to the Exception Rules tab on the Issue Exclusions and Exceptions page under Settings → Issue Exception & Exclusion. Exception rules differ from exclusion rules in that they define conditions under which issues are flagged as exceptions that may require approval before being acted upon, rather than being silently suppressed.
Requires Issue Exclusions permission (at least View) to access the page. Without Issue Exclusions, the entire page is hidden.
| Permission | Description | Roles Example |
|---|---|---|
| None | No access to the Exceptions Rules tab on the All Issue Exception & Exclusion Rules page. | SOC Tier-1 Analyst: Should escalate false positives rather than create an exception. |
| View | Read-only access to the Exception Rules tab on theAll Issue Exception & Exclusion Rules page. Users can browse Exception Rules, view rule details including BIOC indicator definitions, and filter/search the exception rules grid, but cannot create, edit, or delete exception rules. | SOC Tier-2 Analyst and Threat Hunter: Should reference existing exceptions during investigations or understand filtered activity. |
| View/Edit | Read and write access to the Exception Rules tab on theAll Issue Exception & Exclusion Rules page, including creating, editing, and deleting Exception Rules. | <ul><li>SOC Tier-3 Analyst: Create exception rules for validated false positives.</li><li>Security Engineer: Manage exception rules as part of tuning.</li></ul> |
Required and recommended permissions
Consider adding the following permissions:
| Permission | Permission Level | Reason |
|---|---|---|
| Cases & Issues | View | Exception rules are based on issue attributes. Without alert visibility, users cannot understand the context of what is being excepted. Required. |
| Issue Exclusions | View or View/Edit | <ul><li>View: Issue Exclusions is a prerequisite. Controls access to the All Issue Exclusions and Exceptions page. Without it, the page is hidden, and the Exception Rules tab cannot be reached. Required.</li><li>View/Edit: Users who manage exception rules typically also need to manage exclusion rules. Having both at View/Edit provides a complete exception management workflow.</li></ul> |
Exception Approver Admin permissions
Controls access to the Exception Management section on the Server Settings page, located at Settings → Configurations → General → Server Settings.
This permission governs who can configure the exception approval workflow, specifically, whether exceptions require approval, and managing the list of designated approvers.
Caution
Users also need General Configuration View permission to view or View/Edit Exception Management in Server Settings.
| Permission | Description | Roles Example |
|---|---|---|
| None | No access to the Exception Management section on the Server Settings page. Users cannot view or modify the approval workflow configuration and the list of approvers. | SOC Tier 1 and Tier Analysts: No need for visibility into approval workflow configuration. |
| View | The Exception Management section is visible on the Server Settings page. Users can view the approval configuration workflow and the list of approvers (names and emails). | SOC Tier 3 Analyst and Threat Hunter: Can view the approval workflow to understand the exception approval process and whether the exceptions they encounter have been approved. |
| View/Edit | Read and write access to the Exception Management section on the Server Settings page. Users can configure the exception approval workflow and manage approvers. | Security Engineer: Full access to toggle approval requirements and manage the approvers list. |
Required and recommended permissions
Consider adding the following permissions:
| Permissions | Permission Level | Reason |
|---|---|---|
| General Configuration | View or View/Edit | <ul><li>View: The Exception Management section is on the Server Settings page. Without this permission, users cannot view the section. Required.</li><li>View/Edit: Users who configure exception approval workflows may also need to manage other server settings (email contacts, Google Maps key, etc.).</li></ul> |
| Issue Exclusion | View | Approver administrators should understand the exclusion/exception rules they are configuring for approval workflows. Without this, they are configuring approval settings without visibility into the rules being approved. Strongly recommended. |
| Exception Management Admin | View | Understanding the exception rules that will go through the approval workflow helps configure appropriate approvers and approval requirements. Strongly recommended. |
Managed Services permissions
Requires a Managed Threat Hunting or Managed Detection and Response license. The tenant must be paired as a managed service tenant.
Threads
Threads are a collaborative communication record between a managed service provider (Unit 42 Managed Threat Hunting or Managed Detection & Response) and your tenant. Each thread represents an operational report delivered by the provider to you, along with all associated collaboration artifacts.
The Threads permission controls whether a user can access the Managed Services page, where all threads are listed, and whether they can perform actions on those threads (update status, assign users, add/edit/delete comments, attach files).
| Permission | Description | Roles Example |
|---|---|---|
| None | No access to the Managed Services page. | None specified as a default, but applicable for roles that do not interact with managed service findings |
| View | Grants read-only access to the Managed Services page, including viewing threat reports, comments, report status, and assigned users. | <ul><li>SOC Tier-1 Analyst: Needs visibility into managed service threat reports to understand the threat landscape and triage related issues, but should not modify the thread status or assignments.</li><li>Security Engineer: Needs awareness of managed service findings for tuning detections and policies, but typically does not need to collaborate directly on threads.</li></ul> |
| View/Edit | Grants the ability to perform write operations: update thread status, assign/reassign users to threads, add/edit/delete comments, and attach files to comments. | <ul><li>SOC Tier-2 and 3 Analysts: Actively work on cases related to managed service reports. Needs to update thread status, add comments to collaborate with Unit 42/MDR analysts, and assign threads.</li><li>Threat Hunters: Primary consumer and collaborator on managed service threat reports. Must be able to update status, comment, and assign threads as part of the hunting workflow.</li></ul> |
Required and recommended permissions
Managed service reports frequently reference complex threat indicators, forensic artifacts, and underlying endpoint data. To effectively investigate and respond to a Thread, analysts require deep visibility into these corresponding platform modules. Consider adding the following permissions:
| Permission | Permission Level | Reason |
|---|---|---|
| Cases & Issues | View or View/Edit | <ul><li>View: Required to view cases linked to threads.</li><li>View/Edit: Strongly recommended to view and act on cases associated with threads for deeper analysis.</li></ul> |
| Query Search | View or View/Edit | <ul><li>View: Required. Threads often reference data that requires investigation queries to analyze. Without query access, users cannot investigate the indicators, artifacts, or events referenced in the managed service reports.</li><li>View/Edit: Strongly recommended. Allows users to create and execute XQL queries to investigate threat indicators and artifacts referenced in managed service reports. Without this, the investigation is limited to pre-built views.</li></ul> |
| Forensics & Host Insights | View or View/Edit | <ul><li>View: Strongly recommended: Managed service reports frequently reference forensic artifacts (file hashes, registry keys, network connections). Forensics view access allows users to examine endpoint timeline data and forensic evidence related to thread findings.</li><li>View/Edit: Recommended. Allows users to initiate forensic data collection (endpoint timeline, event log search) to gather additional evidence related to managed service findings. Useful for users who actively investigate threats reported in threads.</li></ul> |
| Dashboard | Enabled | Managed service reports frequently reference forensic artifacts (file hashes, registry keys, network connections). Forensics view access allows users to examine endpoint timeline data and forensic evidence related to thread findings. |
| Detection Rules | View | Recommended for detection engineering and recommended for policy management and managing exceptions. |
| Threat Intel & Exclusion List | View or View/Edit | <ul><li>View: Recommended. Allows users to look up indicators of compromise (IOCs) referenced in managed service reports against the threat intelligence database. Useful for correlating thread findings with known threats.</li><li>View/Edit: Recommended. Enables users to add IOCs from managed service reports to the threat intelligence feed for automated detection and blocking.</li></ul> |
Cortex Agentic Assistant permissions
The Cortex Agentic Assistant is an AI-powered assistant that provides autonomous-agent capabilities, natural-language querying, insights, and automated-investigation support within the XSIAM tenant.
This permission is split into the following:
- AI Prompts: Reusable instruction templates
- Cortex Agentic Assistant Agents: Interactive AI assistants and their underlying actions.
AI Prompts
Controls access to the AI Prompts Library (Investigation & Response → Automation → AI Prompts), where users create and manage reusable prompt templates (including system instructions and few-shot examples) used to guide the LLM's behavior.
Caution
To effectively embed AI Prompts directly into playbook workflows, users must be granted the Manage prompts in playbook editor checkbox, and they must also hold View/Edit permissions for the Playbooks module.
For more information, see AI prompts role-based access control.
| Permission | Description | Roles Example |
|---|---|---|
| None | No access to the AI Prompts page and can't see prompts in the Playbook editor. | SOC Tier-1 Analyst: No need to access AI prompts. They consume agent capabilities through the Agentic Assistant chat interface, not through prompt management. |
| View | Read-only access to the AI Prompts page and can view prompts in the Playbook editor. | SOC Tier-2, Tier-3 Analysts and Threat Hunters: Need visibility to understand the capabilities and logic of the AI assistants they use |
| View/Edit | <p>Users can do everything in View. When set to View/Edit, the following action checkboxes become available:</p><ul><li>Manage prompts library</li><li>Manage prompts in playbook editor</li></ul> | Security Engineer: Full View/Edit with both checkboxes enabled. They are the primary builders of AI prompts and playbook AI tasks. They create, test, and maintain the prompt library and embed AI tasks into playbook workflows. |
AI Prompt Sub-permissions
| Sub-permission | Description |
|---|---|
| Manage prompts library | <p>Controls whether users can create, view, edit, duplicate, and delete prompts on the AI Prompts page.</p><ul><li>Checked: The user has full edit access to the AI Prompts page, such as create, edit, delete, edit, and save prompts. All management buttons and menu options are visible and functional.</li><li>Unchecked: The user has read-only access to the AI Prompts page (equivalent to View level).</li></ul> |
| Manage prompts in playbook editor | <p>Controls the ability to use and manage AI prompts directly within the playbook editor, enabling inline AI task configuration in playbook workflows.</p><ul><li>Checked: The user has full edit access to AI prompt tasks in the Playbook editor, such as adding AI tasks to playbooks, configuring AI task arguments, outputs, and timeout settings.</li><li>Unchecked: The user has read-only access to prompts in the Playbook editor. The user can't create, edit, save, or delete AI prompt tasks.</li></ul><div data-gb-custom-block data-tag="hint" data-style="info" class="hint hint-info"><p>Note</p><p>You need to add Playbooks View/Edit permission to edit playbooks.</p></div> |
Required and recommended permissions
Consider adding the following permissions:
| Permission | Permission Level | Reason |
|---|---|---|
| Scripts | Enabled or Enabled with checkboxes selected | <ul><li>Enabled: Required for Playbook editor checkbox. The AI prompt tasks in playbooks depend on the script infrastructure.</li><li>Enabled with checkboxes selected: Strongly recommended to create pre/post scripts for AI prompts.</li></ul> |
| Playbooks | Enabled or Enabled with checkboxes selected | <ul><li>Enabled: Required for Playbook editor checkbox. Must be able to view playbooks to see AI tasks.</li><li>Enabled with checkboxes selected: Required for Playbook editor checkbox. Must be able to edit playbooks to add/modify AI tasks.</li></ul> |
| Marketplace | View/Edit | Recommended to install content packs that include AI prompt templates. |
| Query Center | View | Recommended. Some AI prompts generate or reference XQL queries. |
Cortex Agentic Assistant Agents
Cortex Agentic Assistant Agents
Controls whether a user can access and interact with the Cortex Agentic Assistant, including managing actions and agents. This is the base permission required for any assistant interaction.
| Permission | Description | Roles Example |
|---|---|---|
| None | The assistant panel is disabled. Users cannot use natural language queries or access the Agentic Assistant Hub. | |
| View/Edit | <p>Users can open the Cortex Agentic Assistant panel, access the Agentic Assistant Hub, view chat history, and view agent details and action details in the Hub. In addition, you can select the following:</p><ul><li>Interact with Agents</li><li>Manage Actions</li><li>Manage Agents</li><li>Agents Admin</li></ul> | <ul><li>SOC Tier-1 Analyst: Needs to use the assistant for quick lookups, IP/hash enrichment, and guided investigation. No need to manage agents or actions.</li><li>SOC Tier-2 and 3 Analysts: full assistant interaction for complex investigations. No need to manage agents or actions.</li><li>Threat Hunter: Full assistant interaction for threat hunting. Can view agents and actions, but does not need to modify them</li><li>Security Engineer: Builds custom agents and actions for the organization. Does not need Agents Admin as they manage their own agents.</li></ul> |
Cortex Agentic Assistant Agents sub-permissions
| Sub-permissions | Description | Roles Example |
|---|---|---|
| Interact with Agents | <p>Interact with Agents: Users can trigger Agents in the Cortex Agentic Assistant. Users can access their own agents, public agents, and system agents. For more information, see Agentic Assistant chat.</p><ul><li>Checked: The user can take actions, such as sending messages and queries to the assistant, starting new conversations with agents, and executing insight actions (Add as IOC, etc).</li><li>Unchecked: The user can view the assistant panel, home screen, Agentic Assistant Hub (read-only, based on the parent View/Edit level), chat history, and previous conversations. The user can also view insights cards for IPs, hashes, and domains.</li></ul> | All roles should require full assistant interaction. |
| Manage Actions | <p>Controls the ability to manage agent actions - the discrete operations that agents can perform. Actions are the building blocks that agents use to execute tasks. For more information, see Manage actions.</p><ul><li>Checked: Users can manage actions, register scripts as agent actions, and configure action parameters and descriptions.</li><li>Unchecked: The user can view the Actions tab in the Agentic Assistant Hub (read-only, browse available actions and their configurations. They can also view action details, parameters, and descriptions.</li></ul> | Security Engineer |
| Manage Agents | <p>Controls the ability to create and manage AI agents. Users with this permission can create custom agents, edit their own agents, and configure agent properties. For more information, see Manage agents.</p><ul><li>Checked: Users can manage agents, configure agent instructions, and assign/remove actions from agents.</li><li>Unchecked: Users can view the Agents tab in the Agentic Assistant Hub, browse available agents, and their configurations. They can also view agent details, descriptions, and assigned actions.</li></ul> | Security Engineer |
| Agents Admin | <p>The highest-level agent management permission. When checked, it overrides the ownership restrictions of the Manage Agents checkbox, allowing the user to edit and manage ALL agents in the organization, including system agents and agents created by other users. For more information, see Agentic Assistant Hub.</p><ul><li>Checked: Users can edit/delete any agent, including system agents, configure custom instructions for system agents, and manage organization-wide agent settings. The user can override all agent ownership restrictions.</li><li>Unchecked: The user cannot edit system agents, cannot edit agents created by other users, and cannot manage organization-wide agent configurations.</li></ul><div data-gb-custom-block data-tag="hint" data-style="info" class="hint hint-info"><p>Note</p><p>If Manage Agents is checked, the user can only edit their own agents.</p></div> |
Required and recommended permissions
Consider adding the following permissions:
| Permission | Permission Level | Reason |
|---|---|---|
| Cases & Issues | View or View/Edit | <ul><li>View: Required. Agent conversations reference cases and issues.</li><li>View/Edit: Strongly recommended. Agents can modify case status and assign analysts.</li></ul> |
| Threat Intelligence (under Threat Management) | View or View/Edit | <ul><li>View: Required. Agents perform Indicator lookups and enrichment.</li><li>View/Edit: Strongly recommended for Indicator actions. Agents can create/modify Indicators.</li></ul> |
| Query Center | View or View/Edit | <ul><li>View: Required. Agents generate and execute XQL queries.</li><li>View/Edit: Strongly recommended. Agents execute queries on behalf of users.</li></ul> |
| Scripts & Playbooks | View or View/Edit | <ul><li>View: Required. Register scripts as agent actions. Agents can suggest and reference playbooks.</li><li>View/Edit: Strongly recommended. Create scripts to register as actions; needed for full action builder workflow</li></ul> |
| Dashboards | Enabled | Strongly recommended to view the Command Center dashboard with agent integration. |
| Forensics | View | Recommended. Agents can reference forensic data in investigations. |
| Host Insights | View | Recommended. Agents can reference host/endpoint data. |
| Marketplace | View/Edit | Recommended to install content packs with agent definitions and actions. |
| Integrations | View/Edit | Recommended to configure integrations that agents use as data sources. |
Agents and endpoint protection
This section includes all features that rely on the deployment and health of the XDR Agent infrastructure:
- Agent permissions (Agent Administrations, Host Firewall, Device Control, Prevention Policies)
- Endpoint DLP Permissions (Data-in-Motion Rules, Endpoint Applications)
Inventory - Agent permissions
This section controls access to endpoint agent management, security policies, host firewalls, device controls, and agent lifecycles.
- agent-administrations
- agent-groups
- agent-prevention-policies
- global-exceptions
- agent-profiles
- agent-extension-policies
- agent-installations
- host-firewall
- device-control
Caution
- The Master switch: Setting Agent Administrations to View/Edit acts as a master switch that unlocks highly granular execution checkboxes (such as Agent Management, Pause Protection, and Agent Scan). Leaving these unchecked allows the user to view the administration without the ability to execute the actions.
- High-Risk Operations:
- Pause Protection temporarily disables malware and exploit prevention, leaving endpoints actively vulnerable to threats.
- Token Revocation permanently disconnects agents until they are manually re-enrolled.
- Global Exceptions bypass prevention policies and can create severe security blind spots; implement strict change management workflows
Agent Administrations
Agent Administration provides comprehensive endpoint and agent management capabilities, such as viewing all managed endpoints and their status, monitoring agent health, version, and connectivity, and performing agent operations (upgrade, uninstall, restart).
| Permissions | Description | Roles Example |
|---|---|---|
| None | No access to the Endpoints menu (Inventory → Endpoints, including access to the All Endpoints page. Limited access to endpoint data in cases and in widgets. | |
| View | Read-only access to the Endpoints menu, including the All Endpoints page, which enables users to view, for example, endpoint lists, details, upgrade, and uninstall. | <ul><li>SOC Tier-1 Analyst: Should focus on triage and escalation, not endpoint management. Accidental changes could impact protection.</li><li>Threat Hunter: Focus on detection, not endpoint management. Should request actions through proper channels.</li></ul> |
| View/Edit | All view capabilities. When selecting View/Edit, you can select separate permissions, such as Agent Management, Retrieve Agent Data, and Agent Scan. | <ul><li>SOC Tier-2 and 3 Analysts: May need specific sub-options (like Isolate) for incident response, but full edit access is not required.</li><li>Security Engineer: Responsible for agent lifecycle management, upgrades, and configuration.</li></ul> |
Agent Administrations sub-permissions
| Sub-permission | Description | Roles Example |
|---|---|---|
| Agent Management | <p>High risk. Controls core agent lifecycle and the following configuration operations by right-clicking an endpoint from the All Endpoints page (Inventory → Endpoints → All Endpoints → Endpoint Control):</p><ul><li><p>Open in Interactive Mode</p><div data-gb-custom-block data-tag="hint" data-style="info" class="hint hint-info"><p>Note</p><p>Opens an interactive terminal session on the selected endpoint where you can run scripts in real-time. You need to add View/Edit permission for Agent Script and Scripts under Investigation and Response permissions.</p></div></li><li>Perform Heartbeat</li><li>Change Endpoint Alias</li><li>Upgrade Agent version</li><li>Set/Disable Agent Proxy</li><li>Uninstall Agent</li><li>Delete Endpoint</li><li>Disable Capabilities</li><li>Force Check-in</li><li>Restart Agent</li><li>Clear Agent Database</li><li>Exclude/Include endpoints from auto upgrade</li><li>Assign/Remove Endpoint Tags</li></ul><div data-gb-custom-block data-tag="hint" data-style="info" class="hint hint-info"><p>Note</p><p>To access advanced endpoint actions like Force Check-in, Restart, and Clear Agent Database, users must hold Alt/Option while right-clicking the endpoint to open the advanced Endpoint Control menu.</p></div> | <ul><li>Security Engineer: Primary responsibility for agent deployment, upgrades, and maintenance.</li></ul> |
| Retrieve Agent Data | <p>Enables retrieval of detailed agent diagnostic information, logs, and operational data by right-clicking an endpoint and selecting Endpoint Control → Retrieve from Support File from the ALL Endpoints page.</p><p>Users can also select Retrieve Support File Password from the Key icon on the All Endpoints page (top right-hand corner).</p> | SOC 2 and 3 Analysts, and Security Engineer: Agent troubleshooting and support. |
| Agent Scan | Initiate on-demand malware scans on endpoints by right-clicking an endpoint,Security Operations → Initiate Malware Scan. | All roles. SOC Tier-1 Analysts may need View permission with approval workflow. Initiating scans can impact endpoint performance. Should escalate to Tier-2. |
| Change Managing Server | Reassign agents to different Cortex XSIAM management servers by right-clicking an endpoint and selecting Endpoint Control → Change managing server. Useful for disaster recovery, load balancing across management infrastructure, and migrating endpoints between environments (development/production). For more information, seeMove agents between managing servers. | Security Engineer: May be needed for infrastructure changes or disaster recovery (with change management approval). |
| Pause Protection | <p>High risk. Temporarily disable agent protection modules on endpoints by right-clicking an endpoint and selecting Endpoint Control → Pause Endpoint Protection.</p><div data-gb-custom-block data-tag="hint" data-style="warning" class="hint hint-warning"><p>Caution</p><p>Pausing protection leaves endpoints vulnerable to threats. This should only be used for troubleshooting or software installation that conflicts with protection.</p></div> | |
| Agent Token Management | <p>High risk. Manage agent authentication tokens and credentials by right-clicking an endpoint and selecting Endpoint Control → View Token, or Set Temporary Token. Tokens can also be managed on the All Endpoints page when clicking the Key button (top right-hand side of the page).</p><div data-gb-custom-block data-tag="hint" data-style="warning" class="hint hint-warning"><p>Caution</p><p>Token regeneration will temporarily disconnect agents until they receive the new token. Token revocation will permanently disconnect agents until they are manually re-enrolled.</p></div> |
Required and recommended permissions
Consider adding the following permissions:
| Permission | Permission Level | Reason |
|---|---|---|
| Cases & Issues | View or View/Edit | <ul><li>View: Strongly recommended. Without case access, users cannot follow endpoint-to-case investigation links. Also, Agent Scans are often triggered during case response. Case context helps correlate scan results with active investigations.</li><li>View: Recommended for Retrieve Agent Data and Pause Protection. Retrieval is often triggered during case investigation. Case context helps document why data was retrieved. Pausing protection should only be done in the context of an active investigation or documented change. Case access provides the justification context.</li></ul> |
| Host Insights | View | Strongly recommended. Provides detailed endpoint security data, including vulnerability assessment and compliance status. Enhances endpoint context. |
| Action Center | View | <p>Strongly recommended for response actions on endpoints. In particular:</p><ul><li>Agent Scan: Strongly recommended. Scan status and results are tracked in Action Center. Without it, users cannot monitor scan progress or view results.</li><li>Retrieve Agent Data: Strongly recommended. Retrieval results appear in the Action Center. Without it, users cannot track retrieval status or download completed files.</li><li>Pause Protection: Strongly recommended. Track when protection was paused and resumed. Essential for audit trail and ensuring protection is re-enabled.</li></ul><p>Recommended for the following:</p><ul><li>Agent Management: Track the status and history of agent management operations (upgrades, uninstalls).</li><li>Agent Token Management: Recommended. Track token generation and usage history for audit purposes.</li></ul> |
| Agent Groups | View | <p>Required. Endpoints are organized into groups. Without group visibility, users cannot understand policy targeting and endpoint organization. In particular:</p><ul><li>Agent Management: Agent upgrades, uninstalls, and proxy changes are often performed by group. Without group visibility, bulk operations lack context.</li><li>Change Management Server: Server migration affects group membership and policy assignment. Understanding the current group structure is essential before migration.</li></ul> |
| Agent Prevention Policies | View | <p>Strongly recommended. Before modifying endpoints, administrators need to understand what security policies are applied to avoid disrupting protection. In particular:</p><ul><li>Agent Management: Before uninstalling or downgrading agents, understanding applied policies prevents leaving endpoints unprotected.</li><li>Change Management Server: Policies may differ between servers. Understanding current policy assignment prevents protection gaps after migration.</li><li>Pause Protection: View (minimum). Strongly recommended. Understanding what protection modules are active helps assess the risk of pausing protection.</li></ul><p>Recommended for Agent Scan. Understanding prevention policy settings helps interpret scan results and determine if additional scanning is needed.</p> |
| Agent Installations | View | <p>Recommended when upgrading agents, visibility into available installation packages helps select the correct version.</p><p>Strongly recommended for Agent Management. Agent upgrade requires knowing available versions. Installation packages determine what versions can be deployed.</p> |
| Agent Profiles | View | Strongly recommended for Change Management Server. Profiles may differ between servers. Understanding the current profile assignment prevents configuration changes after migration. |
| Retrieve Agent Data | Checked | Strongly recommended for Agent Token Management. Both are often needed together. |
Agent Groups
Create and manage logical groups of endpoints. These groups are used to assign specific security policies and target actions to specific subsets of devices.
| Permissions | Description | Roles Example |
|---|---|---|
| None | No access to the Groups page (Inventory → Endpoints → Groups. | |
| View | Read-only access to the Endpoint Groups page, including read-only access to agent group configurations, group details, members, and criteria. | <ul><li>SOC Tier 1 Analyst: Understanding which group an endpoint belongs to helps contextualize issues.</li><li>SOC Tier 2 Analyst: Group membership is important for understanding applied policies.</li><li>SOC Tier 3 Analyst: Full visibility helps understand policy application and identify misconfigurations.</li><li>Threat Hunter: Understanding endpoint grouping helps target hunting activities</li></ul> |
| View/Edit | All view capabilities plus management actions, such as creating, editing, and deleting groups. | Security Engineer: Responsible for organizing endpoints into appropriate groups |
Required and recommended permissions
Consider adding the following permissions:
| Permission | Permission Level | Reason |
|---|---|---|
| Agent Administrations | View | Required. Groups organize endpoints. Without endpoint visibility, group membership cannot be understood or validated. |
| Agent Prevention Policies | View | Required. Policies are assigned to groups. Understanding which policies target which groups is essential for group context. |
| Agent Profiles | View | Strongly recommended. Profiles are assigned to groups. Understanding profile assignments prevents configuration conflicts when reorganizing groups. |
| Agent Extension Policies | View | Strongly recommended. Extension policies target groups. Understanding extension assignments prevents disrupting Device Control, Host Firewall, or Disk Encryption when modifying groups. |
| Agent Installations | View | Recommended. Installation packages may be targeted by group. Visibility helps coordinate deployment with group structure. |
Agent Prevention Policies
Agent Prevention Policies define the security posture for endpoints.
| Permissions | Description | Roles Example |
|---|---|---|
| None | Cannot view the Policy Rules page (Inventory → Endpoints → Policy Management → Prevention → Policy Rules), which includes endpoint details, or view policy effectiveness. | |
| View | View the Prevention Policies menu, including viewing the policies list, details, protection settings, and viewing assigned groups. | <ul><li>SOC Tier-1 Analyst: Understanding policies helps explain why actions were blocked or allowed.</li><li>SOC Tier-2 Analyst: Policy visibility is essential for understanding protection posture</li><li>Threat Hunter: Understanding prevention policies helps identify detection gaps.</li></ul> |
| View/Edit | All view capabilities plus creating, editing, deleting, and copying policies, assigning, and setting policy priority. | <ul><li>SOC Tier 3 Analyst: May provide input on policy improvements, but changes should go through change management.</li><li>Security Engineer: Primary responsibility for policy development and implementation.</li></ul> |
Required and recommended permissions
Consider adding the following permissions:
| Permission | Permission Level | Reason |
|---|---|---|
| Agent Groups | View | Required for policy assignment. |
| Agent Administrations | View | Strongly recommended. View endpoints to validate policy deployment and verify protection status after changes. |
| Global Exceptions | View | Strongly recommended. Exceptions modify policy behavior. Understanding active exceptions is essential for accurate policy assessment. View/Edit. Required. Policy changes often require corresponding exception updates. Without exception access, policy tuning is incomplete. |
| Host Insights | View | Recommended for viewing policy effectiveness. |
| Agent Profiles | View | Strongly recommended. Prevention profiles define the detailed security settings within policies. Understanding profiles is essential for effective policy design. |
| Cases & Issues | View | Recommended. Review security events to inform policy tuning decisions. Understanding what threats are being detected helps optimize policies. |
Global Exceptions
Global Exceptions allow security teams to exclude specific items from detection, such as creating hash-based exceptions (SHA256, MD5) and defining path-based exceptions for files and folders.
Note
Global Exceptions are part of the Prevention section and apply to prevention policies/profiles.
Caution
Global Exceptions can significantly impact security coverage. Implement approval workflows and regular exception reviews. Consider requiring dual approval for exception creation.
| Permissions | Description | Roles Example |
|---|---|---|
| None | Cannot view the Global Exceptions menu (Inventory → Endpoints → Policy Management → Prevention → Global Exceptions, and cannot create an exception from an issue or case. | |
| View | Read-only access for the Global Exceptions menu, and cannot create an exception from an issue or case. | <ul><li>SOC Tier-1 Analyst: Understanding exceptions helps explain why certain files weren't blocked.</li><li>SOC Tier-2 Analyst: Exception visibility is critical for understanding why threats may have bypassed protection.</li><li>Threat Hunter: Exceptions represent potential blind spots. Hunters need visibility.</li></ul> |
| View/Edit | All view permissions plus managing exceptions, adding an exception from an issue or case, setting exception expiration, and defining execution scope. | <ul><li>SOC Tier 3 Analyst: May need temporary exceptions for remediation, requires approval.</li><li>Security Engineer: Responsible for exception management with proper documentation.</li></ul> |
Required and recommended permissions
Consider adding the following permissions:
| Permission | Permission Level | Reason |
|---|---|---|
| Agent Prevention Policies | View | Required to view policies where exceptions apply. |
| Cases & Issues | View | Recommended. Exceptions are often created in response to false positives from cases/issues. Case context helps understand exception justification. View/Edit is required, as the Add Exception action appears in the Case and Issue context menu. |
| Agent Administrations | View | Strongly recommended to view endpoints to assess the scope of exceptions. Helps determine if an exception should be global or targeted. |
| Agent Groups | View | Required. Exceptions can be scoped to specific groups. Group visibility is needed to target exceptions appropriately. |
| Agent Profiles | View | Recommended. Understanding profile settings helps determine if an exception is needed or if a profile adjustment would be more appropriate. |
Agent Profiles
Defines agent behavior and configuration settings, including agent communication settings and proxy configurations.
| Permissions | Description | Roles Example |
|---|---|---|
| None | Cannot view the Prevention Profiles page (Inventory → Endpoints → Policy Management → Prevention → Profiles and is limited to the profile name when viewing the profile in endpoint details. | SOC Tier-1 Analyst: Profile details are typically not needed for basic triage. Although it may be useful for understanding why certain agent features are enabled/disabled on specific endpoints |
| View | View the Agent Profiles menu and read-only access for the Profiles list, details, settings, and view assigned groups. | <ul><li>SOC Tier-2 Analyst: Understanding agent profiles helps explain agent behavior and capabilities during investigations. Profiles determine what data the agent collects and reports</li><li>SOC Tier-3 Analyst: Full profile visibility needed for advanced analysis and understanding agent configuration. Critical for determining if an agent was properly configured during a case.</li><li>Threat Hunter: Profile visibility helps understand agent capabilities and potential detection gaps. Hunters need to know what telemetry is available from each endpoint.</li></ul> |
| View/Edit | All view capabilities, plus managing profiles, assigning to groups, and configuring all settings. | Security Engineer: Responsible for profile configuration and optimization. Creates and maintains profiles for different endpoint types. |
Required and recommended permissions
Consider adding the following permissions:
| Permission | Permission Level | Reason |
|---|---|---|
| Agent Groups | View | Required. Profiles are assigned to groups. Without group visibility, users cannot understand which endpoints use which profiles. |
| Agent Administrations | View | Required. Must see endpoints to validate profile deployment and verify agent configuration after changes. |
| Agent Prevention Policies | View | Strongly recommended. Profiles define settings within policies. Understanding policy context prevents conflicting configurations. |
| Network Configuration | View | Strongly recommended. Profiles include proxy and network settings. Network configuration visibility ensures profile settings align with network infrastructure. |
| Agent Installations | View | Recommended. Profile settings may depend on the agent version. Installation visibility helps ensure profile compatibility. |
Agent Extension Policies
Manage profiles for additional endpoint capabilities, such as configuring third-party integrations, managing agent extension modules, and defining extension deployment policies.
Note
Agent Extension Policies enable access to configure extension policies, profiles, and exceptions. Device Control rules perform device control actions within the extension policies.
| Permissions | Description | Roles Example |
|---|---|---|
| None | Cannot view the Agent Extensions menu (Inventory → Endpoints → Policy Management → Extensions, which includes Policy Rules, Profiles, Device Permanent Extensions, and Device Temporary Extensions. | SOC Tier-1 Analyst: Extension policies are typically not needed for basic triage. Although it may provide context for understanding additional agent capabilities |
| View | View the Agent Extensions menu and read-only access for the Policy Rules, Profiles, Device Permanent Extensions, and Device Temporary Extensions. | <ul><li>SOC Tier-2 Analyst: Understanding extension policies helps explain additional agent capabilities during investigations. Extensions like Device Control or Host Firewall affect endpoint behavior.</li><li>SOC Tier-3 Analyst: Full visibility needed for advanced analysis of agent extensions and their impact on endpoint protection and telemetry.</li><li>Threat Hunter: Extension visibility helps understand the full agent capability set for hunting. Hunters need to know what protections are active.</li></ul> |
| View/Edit | All view capabilities, plus managing Policy Rules, Profiles, Device Permanent Extensions, and Device Temporary Extensions. | Security Engineer: Responsible for extension configuration and deployment. Manages which extensions are enabled for different endpoint groups. |
Required and recommended permissions
Consider adding the following permissions:
| Permission | Permission Level | Reason |
|---|---|---|
| Agent Groups | View | Required for policy targeting. |
| Device Control | View | Strongly Recommended. Extension profiles include Device Control settings. The Device Control view provides violation data that complements the extension policy context. For View/Edit, required, as Extension profiles contain Device Control settings. Device Control edit access is needed to manage violations and add exceptions from the violations view. |
| Agent Administrations | View | Strongly Recommended. View endpoints to validate extension deployment and verify feature enablement after changes. |
| Host Firewall | View | Strongly Recommended. Extension profiles include Host Firewall settings. Firewall view provides event data that complements the extension policy context. |
| Agent Profiles | View | Strongly Recommended. Extension profiles work alongside agent profiles. Understanding both prevents configuration conflicts. |
| Cases & Issues | View | Recommended. Review security events related to Device Control and Host Firewall to inform extension policy decisions. |
Agent Installations
Agent Installations
Manages the deployment of XDR agents, such as downloading agent installation packages, viewing installation status and history, and tracking deployment progress.
For more information, see Create an agent installation package.
Caution
Installation tokens provide access to deploy agents. Protect tokens carefully and implement token rotation policies. Consider limiting View/Edit access to dedicated deployment personnel.
| Permissions | Description | Roles Example |
|---|---|---|
| None | Cannot view the Agent Installations page (Inventory → Endpoints → Installations). | <ul><li>SOC Tier-1 Analyst: Installation packages are not relevant for alert triage. Tier-1 analysts don't need to see deployment packages.</li><li>Threat Hunter: Installation packages are not relevant for hunting activities. Hunters focus on detection, not deployment.</li></ul> |
| View | View the Agent Installations page for installation packages, status, and tokens. | <ul><li>SOC Tier-2 Analyst: May be useful for understanding agent deployment during investigations. Can help identify if an endpoint has an outdated installer.</li><li>SOC Tier-3 Analyst: Rarely needed for investigations, but may provide context about agent deployment history and available versions.</li></ul> |
| View/Edit | All view capabilities, plus actions such as generating a custom package, configuring installation parameters, and managing agent versions. | Security Engineer: Essential for managing agent deployment and distribution. Must see available packages to plan deployments. |
Required and recommended permissions
Consider adding the following permissions:
| Permissions | Permission Level | Reason |
|---|---|---|
| Agent Administrations | View | Required. Installation packages deploy agents to endpoints. Without endpoint visibility, users cannot assess deployment coverage or identify unmanaged endpoints. View/Edit: Agent upgrades (Agent Management sub-option) require knowing available installation packages. Installation and endpoint management are tightly coupled. |
| Agent Prevention Policies | View | Recommended. Understanding which policies will apply to newly deployed agents helps ensure proper protection from deployment. |
| Agent Groups | View | Strongly recommended. Deployment targeting uses groups. Understanding group structure is essential for planning phased rollouts. |
| Agent Profiles | View | Strongly recommended. Installation packages may include profile configurations. Understanding profiles ensures correct agent configuration during deployment. |
Host Firewall
Provides endpoint-level network protection, such as defining inbound and outbound firewall rules and creating application-based rules in the Host Firewall page (Inventory → Endpoints → Host Firewall). Users can also Collect Detailed Host Firewall Logs from Inventory → Endpoints → Endpoint Control.
Caution
Misconfigured firewall rules can block legitimate traffic or allow malicious connections. Implement change management processes and test rules before deployment.
| Permissions | Description | Roles Example |
|---|---|---|
| None | Cannot view the Host Firewall page, which includes firewall pages, firewall rules, and events, or Collect Detailed Host Firewall Logs. | |
| View | View the Host Firewall menu, which includes read-only access for Rule Groups and Host Firewall Events. | <ul><li>SOC Tier-1 Analyst: Firewall rules may provide context for network-related alerts. Helpful when triaging blocked connection issues.</li><li>SOC Tier-2 Analyst: Understanding firewall rules is important for investigating network-based threats. Critical for lateral movement investigations</li><li>Threat Hunter: Firewall rules help understand network protection posture for hunting. Hunters need to know what network traffic is allowed/blocked.</li></ul> |
| View/Edit | All view capabilities, plus creating, editing, deleting, and enabling Host Firewall Rules Groups, and managing Host Firewall Events. Also can Collect Detailed Host Firewall Logs. | <ul><li>SOC Tier-3 Analyst: May need for emergency containment (blocking malicious IPs), but should require approval and documentation.</li><li>Security Engineer: Responsible for firewall rule development and maintenance. Creates and optimizes firewall policies.</li></ul> |
Required and recommended permissions
Consider adding the following permissions:
| Permission | Permission Level | Reason |
|---|---|---|
| Agent Groups | View | Required. Must understand group structure to target firewall rules correctly. Incorrect targeting can block legitimate traffic or allow malicious connections. |
| Agent Extension Policies | View | Required. Host Firewall profiles are managed through extension policies. Without extension policy visibility, firewall rule changes may conflict with profile settings. |
| Agent Administrations | View | Strongly Recommended. View endpoints to understand firewall rule deployment and correlate firewall events with endpoint data. |
| Network Configuration | View | Strongly Recommended. Network topology context is essential for designing effective firewall rules. Understanding network zones prevents blocking legitimate traffic. |
| Cases & Issues | View | Strongly Recommended. Review security events to inform firewall rule decisions. Understanding attack patterns helps create effective rules. |
Device Control
Manage policies for external devices connected to endpoints. Controls access permissions for USB drives, Bluetooth devices, and other peripherals.
Caution
Device Control is critical for data loss prevention. Overly restrictive policies may impact productivity, while permissive policies may enable data exfiltration. Balance security requirements with operational needs.
| Permissions | Description | Roles Example |
|---|---|---|
| None | <p>Cannot view the following pages under Inventory → Endpoints:</p><ul><li>Device Control Violations</li><li>Disk Encryption Visibility</li><li><p>Under Policy Management:</p><ul><li>Device Permanent/Temporary Exceptions</li><li>Settings: Device Management</li><li>Extensions: Policy Rules</li><li>Extensions: Profiles</li></ul></li></ul> | SOC Tier-1 Analyst: Not part of daily triage. |
| View | Read-only access for the pages listed above. | <ul><li>SOC- Tier 2 Analyst: Understanding device control helps investigate data exfiltration or unauthorized device usage. Critical for insider threat investigations</li><li>SOC Tier-3 Analyst: View, but may need view/edit for emergency containment of data exfiltration (blocking all USB devices), but should require approval</li><li>Threat Hunter: Device control visibility helps understand potential data exfiltration vectors. Hunters need to know what devices are allowed.</li></ul> |
| View/Edit | All view capabilities, plus managing policies and exceptions. Additional action permissions with View/Edit permissions, such as Device Control Rules and Device Control Exceptions. | Security Engineer: Responsible for device control rule development and maintenance. Creates and optimizes device policies. |
Device Control sub-permissions
| Sub-permission | Description | Roles Example |
|---|---|---|
| Device Control Rules | <p>Enables users to permit/prevent device connection, prevent data writing, and allow connection but log all activity.</p><ul><li>Checked: Users can create, edit, delete, and enable/disable device control rules (Inventory → Endpoints → Policy Management → Extensions → Policy Rules).</li><li>Unchecked: Rule actions are disabled within profiles.</li></ul><p>To manage device control rules, users also need the Agent Extension Policies permission to access the profiles where rules are configured.</p> | Security Engineer: Responsible for device control rule development and maintenance. Creates rules for different device types, vendors, and use cases. |
| Device Control Exceptions | <p>Create exceptions to device control rules for specific devices or users.</p><p>Users can create, edit, and delete permanent or temporary exceptions that override device control rules (Inventory → Endpoints → Policy Management → Extensions → Device Permanent Exceptions, or Device Temporary Execptions).</p><div data-gb-custom-block data-tag="hint" data-style="info" class="hint hint-info"><p>Note</p><p>Exceptions bypass device control rules and can create security gaps. Implement approval workflows and regular exception reviews. Consider requiring business justification for all exceptions.</p></div><ul><li>Checked: Users can add device exceptions.</li><li>Unchecked: The Add Exception action is disabled.</li></ul><div data-gb-custom-block data-tag="hint" data-style="info" class="hint hint-info"><p>Tip</p><p>Consider adding Device Control Rules. Understanding existing rules is essential before creating exceptions. Exceptions should be targeted to specific rules to minimize security impact.</p></div> | Security Engineer: Responsible for exception management with proper documentation. Creates exceptions based on approved business requests with appropriate scope and expiration. |
Required and recommended permissions
Consider adding the following permissions:
| Permission | Permission Level | Reasons |
|---|---|---|
| Agent Groups | View | Required. Must understand group structure to target device control rules and policies correctly. Incorrect targeting can block legitimate devices or allow unauthorized ones. |
| Agent Extension Policies | View | Strongly Recommended. Device Control rules and profiles are managed through extension policies. An extension policy context is needed to understand the full device control configuration. |
| Agent Administrations | View | Strongly Recommended. View endpoints to correlate device violations with endpoint data and understand which endpoints are generating events. |
| Cases & Issues | View | Strongly Recommended. Review device-related security events to inform policy decisions. Understanding data exfiltration attempts helps create effective rules and policies. |
| Host Insights | View | Recommended. View detailed endpoint device information, including connected devices, USB history, and compliance status. |
Data Security - Endpoint DLP permissions
Endpoint Data Loss Prevention (DLP) permission (under Data Security) controls the policies and configurations that govern how sensitive data is handled when it moves across endpoints.
Endpoint DLP includes Data-in-motion rules, Endpoint Applications, Endpoint Application Groups, and Endpoint DLP settings.
License
Requires the Data Loss Prevention (DLP) add-on plus Enterprise Runtime Security (XDR), Cortex XSIAM Enterprise, or Cortex XSIAM Premium license.
Data-in-Motion Rules
Data-in-motion Rules define the DLP policies that govern how sensitive data is handled when it moves across endpoints. These rules specify what data patterns to detect, which applications and destinations to monitor, and what actions to take (allow, block, notify) when sensitive data movement is detected. Rules can be created, edited, cloned, enabled/disabled, deleted, and prioritized.
Users access Data In Motion Rules by going to Modules → Data Security → Endpoint Data-in-Motion Rules.
| Permission | Description | Recommended Roles |
|---|---|---|
| None | Users cannot access the Data-in-motion Rules page. | <ul><li>SOC Tier-1 Analyst: DLP rule management is outside triage responsibilities.</li><li>IT Admin: DLP rule management is outside the IT infrastructure administration scope.</li></ul> |
| View | Users can navigate to the Data-in-motion Rules page and see all configured DLP rules in the grid view. They can view rule names, priorities, statuses (enabled/disabled), target applications, conditions, actions, and inspect rule details. | <ul><li>SOC Tier 2 and 3 Analysts: May need to review DLP rules when investigating cases/issues,</li><li>Threat Hunter: May need to understand DLP rules to correlate with threat hunting findings</li></ul> |
| View/Edit | Users have full control over Data-in-motion rules. They can create, edit, duplicate, delete, and enable/disable rules. They can also change rule priorities. All context menu actions are fully accessible. | <ul><li>Security Engineer: Primary responsibility for creating and maintaining DLP rules.</li><li>Security Admin: Full administrative access to all DLP configurations.</li></ul> |
Required and recommended permissions
Data-in-Motion rules act as the enforcement arm of your DLP strategy. To build effective rules, administrators must have visibility into the sensitive data profiles they are detecting and the applications they are monitoring.
| Permission | Permission Level | Reason |
|---|---|---|
| Endpoint DLP Settings | View | Strongly recommended. Global DLP settings (such as the default action, domain names, and browser extensions) directly affect rule behavior and enforcement. |
| Endpoint Applications and Groups | View | Strongly recommended. DLP rules directly reference specific endpoint applications and application groups to define their scope. Viewing these catalogs is essential to understand and configure rule targeting. |
| Agent Administrations | View | Strongly recommended. Understand which endpoints have the XDR agent deployed. |
| Data Classification | View | Strongly Recommended. DLP rules directly reference the data profiles configured within the Data Classification module. Understanding these profiles is required to know what the rule considers sensitive data. |
Endpoint Applications
Endpoint Applications is a catalog of applications that can be referenced in Data-in-motion Rules. It includes predefined applications (web applications, local file-sharing applications, cloud storage applications, USB devices) and allows creation of custom local and web applications. Each application entry defines process names, URLs/domains, and application type that the DLP engine uses to identify data movement channels.
Users access Endpoint Applications by going to Modules → Data Security → Endpoint Data-in-Motion Rules → Endpoint Applications.
Caution
Predefined (system) applications cannot be edited or deleted regardless of permissions.
| Permission | Description | Recommended Roles |
|---|---|---|
| None | Users cannot access the Endpoint Applications page. Users cannot see the application catalog, custom applications, or any application definitions. Any attempt to directly access the URL will result in an access denied error. | <ul><li>SOC Tier-1 Analyst: Application catalog management is outside the Tier-1 scope.</li><li>IT Admin: Application catalog management is outside the IT infrastructure administration scope.</li></ul> |
| View | Users can navigate to the Endpoint Applications page and see all applications in the grid view. They can view application names, types (Web Application, Local Application), process names, URLs/domains, and whether they are predefined or custom. | <ul><li>SOC Tier-2 and 3 Analysts: May need to review application definitions when investigating DLP issues.</li><li>Threat Hunter: May need to understand monitored applications for threat hunting context.</li></ul> |
| View/Edit | Users have full control over Endpoint Applications. They can create new local applications and web applications, edit custom application definitions, and delete custom applications. | <ul><li>Security Engineer: Responsible for defining custom applications for DLP rule targeting.</li><li>Security Admin: Full administrative access to all DLP configurations.</li></ul> |
Required and recommended permissions
Endpoint Applications act as the building blocks for your DLP rules. To effectively manage the application catalog, administrators must understand how these applications are grouped and enforced.
| Permission | Permission Level | Reason |
|---|---|---|
| Endpoint Application Groups | View | Strongly recommended. Groups contain applications; viewing the application catalog helps when managing groups. |
| Data-in-Motion Rules | View | Strongly Recommended. DLP rules directly reference the applications defined in this catalog. Viewing these rules provides essential context on where and how specific applications are actively being monitored or blocked. |
Endpoint Applications Groups
Endpoint Applications Groups allow organizing endpoint applications into logical groups for use in Data-in-motion Rules. Instead of selecting individual applications in a rule, administrators can reference an application group, making rule management more scalable. Groups can contain custom application groups (user-defined collections of applications) and catalog web application groups (predefined web application categories).
Users access Endpoint Applications by going to Modules → Data Security → Endpoint Data-in-Motion Rules → Endpoint Applications Groups.
| Permission | Description | Recommended Roles |
|---|---|---|
| None | Users cannot access the Endpoint Applications Groups page. These users cannot see any application groups, their members, or their usage in rules. | <ul><li>SOC Tier-1 Analyst: Application group management is outside Tier-1 scope.</li><li>Application group management is outside the IT infrastructure administration scope.</li></ul> |
| View | Users can navigate to the Endpoint Applications Groups page and see all application groups in the grid view. They can view group names, types (Custom Application Group, Catalog Web Applications Group), member applications, and group descriptions. They cannot create groups, edit existing ones, or delete groups. | <ul><li>SOC Tier-2 and 3 Analysts: May need to review group definitions when investigating DLP issues/advanced analysis.</li><li>Threat Hunter: May need to understand application groupings for threat hunting context.</li></ul> |
| View/Edit | Users have full control over Endpoint Applications Groups. They can create new custom application groups and catalog web application groups, edit group membership and properties, and delete groups. All context menu actions are fully accessible. | <ul><li>Security Engineer: Responsible for organizing applications into groups for DLP rule management.</li><li>Security Admin: Full administrative access to all DLP configurations.</li></ul> |
Required and recommended permissions
Consider adding the following permissions:
| Permission | Permission Level | Reason |
|---|---|---|
| Endpoint Applications | View | Strongly recommended. Applications are organized into groups; viewing groups is essential to understanding how applications are categorized and used in rules. |
Endpoint DLP Settings
Endpoint DLP Settings provide global options that dictate the overarching behavior of the Data Loss Prevention (DLP) engine across all endpoints.
Users access Endpoint DLP Settings by going to Modules → Data Security → Endpoint Data-in-Motion Rules → Endpoint DLP Settings.
Caution
Modifications made on this page, such as changing the default action (allow/block file movement), adjusting rule suppression thresholds, or altering browser extension installation modes, will globally affect all Data-in-Motion Rules and overall DLP enforcement. Proceed with caution when adjusting thresholds.
| Permission | Description | Recommended Roles |
|---|---|---|
| None | Users cannot access the Endpoint DLP Settings page. These users cannot see any DLP settings, browser extension configurations, or default action settings. | <ul><li>SOC Tier-1 Analyst: DLP settings are outside Tier-1 scope.</li><li>DLP engine settings management is outside the IT infrastructure administration scope.</li></ul> |
| View | Read-only access to view current settings. Users can view the default action configuration, corporate account domain names, browser extension installation modes, rule suppression thresholds, and user interaction notification settings. | <ul><li>SOC Tier-2 and 3 Analysts: May need to review DLP settings when troubleshooting DLP-related cases/advanced analysis.</li><li>Threat Hunter: DLP settings are not typically relevant to threat hunting activities.</li></ul> |
| View/Edit | Full control over the DLP engine settings. Users can modify the default action, add/remove corporate domains, change browser extension modes, adjust rule suppression thresholds, and configure user notifications. | <ul><li>Security Engineer: Responsible for configuring and tuning DLP settings.</li><li>Security Admin: Full administrative access to all DLP configurations.</li></ul> |
Required and recommended permissions
Endpoint DLP Settings act as the global baseline for the DLP engine. To safely modify these settings, administrators need visibility into the specific rules that enforce the data security posture and the agents that deploy them.
| Permission | Permission Level | Reason |
|---|---|---|
| Data-in-Motion Rules | View | Strongly recommended. Global DLP settings (like default actions and browser extensions) directly dictate how Data-in-Motion rules operate. Understanding the currently active rules provides critical context before making global changes. |
| Agent Administrations | View | Strongly recommended. Recommended. DLP settings and browser extensions are deployed via the endpoint agent. Viewing agent statuses helps administrators verify that global DLP configurations are being successfully deployed. |
| Data Classification | View | Recommended. Endpoint DLP Settings are closely related to the tenant's broader Data Classification configurations, which define what the DLP engine considers sensitive data. |
Inventory - Assets permissions
Inventory manages all assets in your environment, ensuring complete visibility, control, and protection for Assets, which includes Network Configuration, Compliance, Asset Inventory, Asset Roles Configuration, and Asset Groups. For Agent Management, see Inventory - Agent permissions.
Network Configuration permissions
Network Configuration (Inventory → Assets → Network Configuration) enables administrators to define and manage the organization's network topology, such as internal and external IP address ranges, internal domain suffixes, and trusted networks.
Notice
External IP address ranges: Requires an ASM or Cortex XSIAM Premium license.
Trusted Networks: Requires a Cloud Posture Security or Cortex XSIAM Premium license.
Network topology configuration is frequently shared between the Security and IT Infrastructure teams. Ensure proper coordination before altering IP ranges or trusted network definitions.
For more information, see Network configurations.
The Network Configuration permission controls the ability to view, create, and edit network topologies, IP ranges, and trusted domains.
| Permissions | Description | Roles Example |
|---|---|---|
| None | No access to the Network Configuration menu, IP ranges, internal domains, or trusted networks. | SOC Tier-1 Analyst: Does not need access to network configuration. |
| View | Read-only access to view defined IP ranges, internal domains, and trusted networks. | SOC Tier-2 and 3 Analysts, and Threat Hunters: Do not need access to network configuration. |
| View/Edit | Full access to add, edit, and delete IP address ranges, internal domains, and trusted network configurations. | Security Engineer: Responsible for maintaining network configuration. |
Required and recommended permissions
Consider adding the following permissions:
| Category | Permissions | Reason |
|---|---|---|
| Asset Inventory | View | Strongly recommended to view assets associated with IP ranges. View/Edit for Asset Management. |
| Agent Administrations | View | Recommended for endpoint details linked to network ranges. |
| Query Center | View | Recommended to run XQL queries on network data. |
Compliance (Legacy) permissions
Cloud Compliance (Legacy) under Inventory → Endpoints → Cloud Compliance provides a read-only view of CIS benchmark compliance violations for cloud assets.
Notice
Requires a Cortex XSIAM Enterprise Plus license. If you have a Cloud Posture Security, Cloud Runtime Security, or Cortex XSIAM Premium license, see Compliance - Cloud permissions.
| Permissions | Description | Roles Example |
|---|---|---|
| None | Cannot view the Compliance menu or any related pages. | SOC Tier-1 Analyst and Threat Hunter: Compliance monitoring is not part of daily triage/relevant to threat hunting. |
| View | Read-only permission to view CIS compliance violations for Cloud assets. | <ul><li>SOC Tier-2 and 3 Analysts: May reference compliance status/data during investigations/advanced analysis.</li><li>Security Engineer: Monitor compliance posture.</li></ul> |
Required and recommended permissions
Consider adding the following permissions:
| Permission | Permission Level | Reason |
|---|---|---|
| Asset Inventory | View | Highly recommended to view assets associated with compliance violations. |
| Host Insights | View | Highly recommended to view endpoint details for the compliance context. |
| Dashboards | Enabled | Enabled: Recommended to view endpoint details for compliance context. |
| Query Center | View | Recommended to run XQL queries on network data. |
Asset Inventory permissions
Asset Inventory provides comprehensive visibility into organizational assets, such as a unified view of all assets (endpoints, cloud instances, domains, certificates), asset categorization and tagging, asset relationship mapping, and attack surface visibility.
Users access these features by going to Inventory → Assets → All Assets, where they can view assets such as all Cloud assets, AI assets, API Endpoints, Code assets, Compute assets, and data assets.
For more information, see All assets.
The Asset Inventory permissions control the ability to view the unified asset landscape and manage overarching asset categorizations and tags.
| Permissions | Description | Roles Example |
|---|---|---|
| None | Cannot view the Asset Inventory menu from Inventory → Assets → All Assets. Viewing asset data in cases is limited. | |
| View | Read-only access to the Asset Inventory Menu and categories, such as cloud assets, AI assets, API Endpoints, Code assets, Compute assets, and data assets. Users can browse assets but cannot modify tags or assignments. | <ul><li>SOC Tier 1 Analyst: Reference asset context during issue triage.</li><li>SOC Tier-2 Analyst: Investigate asset relationships.</li><li>SOC Tier-3 Analyst: Deep asset analysis for investigations.</li><li>Threat Hunters: Asset context for threat hunting.</li></ul> |
| View/Edit | <p>Full access. Includes all View capabilities plus read and write access to all categories. Users can manage asset tags, annotations, custom properties, and business unit assignments across all asset categories.</p><div data-gb-custom-block data-tag="hint" data-style="info" class="hint hint-info"><p>Note</p><p>The asset inventory is primarily populated dynamically through agents and integrations. The View/Edit permission governs the management of asset metadata (such as assigning tags, setting business units, and modifying annotations) rather than the manual creation of the assets themselves.</p></div> | Security Engineer: Maintain asset inventory and tags. |
Required and recommended permissions
Consider adding the following permissions:
| Permission | Permission Level | Reason |
|---|---|---|
| Network Configuration | View | Strongly recommended to view IP ranges associated with assets. |
| Host Insights | View | Strongly recommended to view detailed endpoint information. |
| Agent Administrations | View | Strongly recommended to view endpoint agent details. |
| Query Center | View | Strongly recommended to run XQL queries on asset data. |
| Asset Groups | View | Strongly recommended to view asset group memberships. |
Asset Roles configuration permissions
Asset Roles Configuration allows organizations to define and manage specific functional roles for assets across their environment (such as Admin, User, or Server). By associating specific users and endpoints with these roles, security teams can enrich security events with role context and support role-based analytics and alerting. Users access these features by going to Inventory → Assets → Asset Roles Configuration.
Notice
Requires the Identity Threat Detection and Response add-on.
For more information, see Asset Roles.
The Asset Roles configuration permissions control the ability to view, create, edit, and assign endpoints to functional asset roles.
| Permissions | Description | Roles Example |
|---|---|---|
| None | No access to the Assets Roles Configuration page. | SOC Tier-1 Analyst: The role configuration is not part of daily operations |
| View | Read-only access to the Assets Role Configuration page, including viewing the roles list, details, members, and searching/filtering roles. | <ul><li>SOC Tier-2 Analyst: Reference role context during investigations.</li><li>SOC Tier-3 Analyst: Understand role assignments for analysis,</li><li>Threat Hunter: Reference role context for hunting.</li></ul> |
| View/Edit | All view capabilities, plus all view/edit actions, such as add, edit, delete, and add endpoints to a role, as well as manually assign endpoints to specific roles. | Security Engineer: Configure and maintain asset roles. |
Required and recommended permissions
To effectively assign roles and investigate threats targeting specific functional users or servers, administrators and analysts require visibility into the underlying identity analytics and the overarching asset inventory. Consider adding the following permissions:
| Permission | Permission Level | Reason |
|---|---|---|
| Asset Inventory | View | Required to view assets associated with roles. |
| Identity Security | View | Strongly recommended to view identity analytics data. |
| Host Insights | View | Recommended to view endpoint details for the role context. |
| Query Center | View | Recommended to run XQL queries on role data. |
Asset Groups permissions
Asset Groups enable organizations to manage asset groups, such as creating logical groupings of assets, applying policies and rules to asset groups, scoping user access to specific asset groups (SBAC), and supporting automation exclusions by asset group.
SBAC: Asset Groups form the foundation of Scope-Based Access Control (SBAC). Granting a user View/Edit access to Asset Groups allows them to modify the groups that dictate data access boundaries for other users in the tenant.
The following features are affected:
- Asset Groups: Inventory → Assets → Groups. For more information, see Asset groups.
- User Groups: When defining or editing a user group, you can scope an asset by defining the access group. For more information, see Scope user access to applications (Application SBAC).
- Automations Exclusion Center: When selecting Edit Policy, you can add an Asset Group to exclude the relevant asset class. For more information, see Manage automation exclusion policies.
| Permissions | Description | Roles Example |
|---|---|---|
| None | No access to the Asset Group Menu, and limited ability to view groups in SBAC and Select groups in Automation Exclusion. | SOC Tier 1 Analyst: Asset group management is not part of the daily operations. |
| View | Read-only access to the View Assets Group list, details, members, search and filter groups, and only view groups in SBAC. | <ul><li>SOC Tier 2 Analyst: Reference asset groups during investigations</li><li>SOC Tier 3 Analyst: Understand asset groupings for analysis.</li><li>Threat Hunter: Reference asset groups for scoped hunting.</li></ul> |
| View/Edit | All View capabilities, plus create, edit, delete, add assets to a group in SBAC, and select groups in automation exclusion | Security Engineer: Configure and maintain asset groups |
Recommended permissions
Consider adding the following permissions:
| Permission | Permission Level | Reason |
|---|---|---|
| Asset Inventory | View or View/Edit | <ul><li>View: Required to view assets to add to groups.</li><li>View/Edit: Recommended to manage asset tags and properties.</li></ul> |
| Host Insights | View | Recommended to view endpoint details for group context |
| Query Center | View | Recommended to run XQL queries on asset group data. |
Exposure and Vulnerability Management permissions
These sections relate to the full lifecycle of a vulnerability, from external discovery to internal tracking and risk prioritization.
To configure the active scanning tools used for vulnerability discovery, see Network Scanners permissions.
For detailed access guidance, see:
Attack Surface permissions
Attack Surface Management (ASM) identifies exposed assets, misconfigurations, and vulnerabilities on your organization's external-facing attack surface. This permission covers the following:
- Attack Surface Rules: Detection rules that generate issues when specific external exposures are found (e.g., exposed RDP, insecure SSH).
- Vulnerability Testing: An active scanning module that performs non-intrusive and intrusive tests against discovered services to validate CVEs and exposures, generating CVSS/EPSS scores.
Attack Surface Rules
Attack Surface Rules permission controls access to:
- Modules → Attack Surface → Policies → Attack Surface Rules.
- Modules → Attack Surface → Global Lookup
- Posture Management → Rules & Policies → Policies → Attack Surface Rules
Note
Requires an ASM, Exposure Management, or Cortex XSIAM Premium license.
If your organization does not have a Cortex XSIAM Premium license, users can only access Attack Surface features through the Modules menu. The Posture Management menu paths are not available.
| Permission | Description | Roles Example |
|---|---|---|
| None | No access to the Attack Surface Rules and Global Lookup pages. | |
| View | <p>Read-only access to view all attack surface rules, their status, priority, and details.</p><p>The Global Lookup page is read-only.</p> | <ul><li>SOC Tier 1 and 2 Analysts: Needs visibility into exposures and vulnerabilities for initial triage; should not modify rules or policies.</li><li>Threat Hunter: Needs read access for threat research and correlation; typically does not modify rules or policies.</li></ul> |
| View/Edit | Full edit access to all view permissions, including enable/disable rules, update priority, and bulk-update policies. | <ul><li>SOC Tier 3 Analyst: Senior analysts who can tune attack surface rules.</li><li>Security Engineer: Configures and tunes attack surface rules.</li></ul> |
Vulnerability Testing
Vulnerability Testing permission controls access to:
- Modules → Attack Surface → Policies → Attack Surface Tests
- Settings → Configurations → Attack Surface → Attack Surface Testing → Attack Surface Testing Configuration.
Note
Requires the Attack Surface Management or Cortex XSIAM Premium license.
| Permission | Description | Roles Example |
|---|---|---|
| None | No access to the Attack Surface Tests and Attack Surface Testing Configuration pages. | |
| View | <p>The test results table is visible and read-only. Can view CVE details, CVSS scores, EPSS scores, and affected software.</p><p>Can see the Attack Surface Testing Configuration page from Settings → Configurations → Attack Surface → Attack Surface Testing.</p> | <ul><li>SOC Tier 1 and 2 Analysts: Needs visibility into exposures and vulnerabilities for initial triage; should not modify rules or policies.</li><li>Threat Hunter: Needs read access for threat research and correlation; typically does not modify rules or policies.</li></ul> |
| View/Edit | <p>Full access to the Attack Surface Tests page, including enable/disable tests, trigger manual scans.</p><p>Users have full access to the Attack Surface Testing Configuration page.</p> | <ul><li>SOC Tier 3 Analyst: Senior analysts who can tune attack surface testing.</li><li>Security Engineer: Configures and tunes attack surface testing.</li></ul> |
Required and recommended permissions
To effectively configure attack surface rules and active tests, administrators and analysts require deep visibility into the underlying asset inventory and the resulting security issues. Consider adding the following permissions:
| Permission | Permission Level | Reason |
|---|---|---|
| Asset Management | View | Required for Attack Surface Rules and Vulnerability Management to access the asset inventory where tested services and rules reside. |
| Cases & Issues | View or View/Edit | <ul><li>View: Strongly recommended for Attack Surface Rules and Vulnerability Testing to view cases/issues generated from attack surface rules and vulnerability test findings.</li><li>View/Edit: Recommended for Attack Surface Rules and Vulnerability Testing if required to triage/respond to issues from attack surface rules/vulnerability test findings.</li></ul> |
| Attack Surface Rules | View | Strongly recommended for Vulnerability Testing. Provides visibility into the attack surface rules that define what is being tested. Helps users understand the context of vulnerability test results. |
| Vulnerability Testing | View | Strongly recommended for Attack Surface Rules. Provides visibility into vulnerability test results that are related to attack surface findings. Useful for understanding the full context of an exposure. |
| Vulnerability Management | View | Recommended for Vulnerability Management. Provides access to the broader vulnerability management dashboards where test findings are aggregated into vulnerability issues. Useful for understanding the full lifecycle of a finding. |
Vulnerability Management permissions
Controls access to Vulnerability Management, which provides a centralized view of vulnerabilities across your organization to track, prioritize, and remediate discovered CVEs and exposures.
Note
Requires a Cloud Posture Security, Cloud Runtime Security, Attack Surface Management (ASM), Exposure Management, or Cortex XSIAM Premium license. How users access and utilize these features depends on your license.
- Cloud Posture Security, Cloud Runtime Security, or Cortex XSIAM Premium licenses: Go to Posture Management → Vulnerability Management. Grants access to Vulnerability Issues, Vulnerable Assets, Vulnerabilities by CVE, Vulnerability Intelligence, and Emerging Vulnerabilities.
- Exposure Management license: Go to Exposure Management → Vulnerability Management. Contact Customer Support to enable this feature.
- ASM license (without other licenses): Go to Modules → Attak Surface.. Grants access only to Vulnerability Policies.
For more information, see Vulnerability Management.
| Permission | Description | Roles Example |
|---|---|---|
| None | No access to Vulnerability Management pages, such as Vulnerability Issues, Findings, CVEs, and Vulnerability Policies. | |
| View | Read-only access to Vulnerability Management pages, such as Vulnerability Issues, Findings, CVEs, and Vulnerability Policies. | <ul><li>SOC Tier 1 and 2 Analysts: Needs visibility into vulnerabilities for initial triage; should not modify rules or policies.</li><li>Threat Hunter: Needs read access for threat research and correlation; typically does not modify rules or policies.</li></ul> |
| View/Edit | Full access to manage vulnerability issues (change status, assign, change severity), create/edit vulnerability policies (where relevant). | <ul><li>SOC Tier 3 Analyst: Senior analysts who can manage vulnerability issue lifecycle.</li><li>Security Engineer: Configures vulnerability remediation workflows.</li></ul> |
Required and recommended permissions
To effectively prioritize and respond to vulnerabilities, administrators and analysts require visibility into the underlying attack surface rules, active tests, and resulting security issues. Consider adding the following permissions.
| Permission | Permission Level | Reason |
|---|---|---|
| Cases & Issues | View or View/Edit | <ul><li>View: Strongly recommended to view cases/issues linked to vulnerability issues.</li><li>View/Edit: Recommended to actively triage and respond to issues linked to exposure findings.</li></ul> |
| Attack Surface Rules | View | Strongly recommended to view the attack surface rules referenced in the vulnerability context. |
| Vulnerability Testing | View | Recommended to view vulnerability testing evidence in vulnerability issue details. |
| Exposure Management | View | Strongly Recommended for Security Controls view and broader Exposure Management navigation. Without this, users cannot see compensating controls or effectiveness data linked to vulnerability issues. View/Edit: Recommended for editing the Security Controls effectiveness rules. Only needed if the user should manage security controls, not just view vulnerability data. |
| Asset Inventory | View | Recommended. Provides necessary context regarding which specific assets are affected by the security control gaps. |
Exposure Management permissions
Exposure Management permissions provide a risk-based approach to prioritizing and remediating security exposures across your organization. Exposure Management ties together vulnerability data, attack-surface context, and security-control posture to provide actionable risk prioritization.
Notice
Requires the Exposure Management license. To enable Exposure Management, contact Customer Support.
The permissions control access to Security Controls (tracking the effectiveness of compensating controls against vulnerabilities) and Effectiveness Rules (configurable rules defining how control effectiveness is measured)
For more information, see Exposure Management.
| Permission | Description | Roles Example |
|---|---|---|
| None | No access to Exposure Management features; Security Controls hidden. | |
| View | Read-only access to Exposure Management, such as Security Controls, effectiveness data, and exposure dashboards. | <ul><li>SOC Tier 1, 2, and 3 Analysts: Needs visibility into exposures and vulnerabilities for initial triage; should not modify rules or policies.</li><li>Threat Hunter: Needs read access for threat research and correlation; typically does not modify rules or policies.</li></ul> |
| View/Edit | Full access to manage Exposure Management, including Security Controls. | Security Engineer: Configures exposure remediation workflows. |
Required and recommended permissions
To effectively prioritize risk and assess control effectiveness, administrators and analysts require deep visibility into the underlying cases, vulnerabilities, and asset inventories. Consider adding the following permissions:
| Permission | Permission Level | Reason |
|---|---|---|
| Cases & Issues | View or View/Edit | <ul><li>View: Strongly recommended to view issues linked to exposure findings. Without this, users can see security controls, but cannot see the issues that triggered them.</li><li>View/Edit: Recommended to actively triage and respond to issues linked to exposure findings.</li></ul> |
| Vulnerability Management | View or View/Edit | <ul><li>View: Required for the Effectiveness Rules view and vulnerability issue integration.</li><li>View/Edit: Strongly recommended for control effectiveness overrides.</li></ul> |
| Attack Surface Rules | View | Recommended. Provides context on attack surface rules that feed into exposure data. Useful for understanding the source of exposure findings. |
| Asset Inventory | View | Recommended to access the broader asset inventory. Provides context on the assets affected by security control gaps. |
Cloud Security and Posture Management permissions
This section includes permissions for Cloud Security and Posture Management, such as CLI Tools, Cloud Workload, and Compliance.
For detailed access guidance, see:
CLI Tool permissions
CLI Tools (Cortex CLI) provides a unified command interface to efficiently scan Cloud Workload Protection (CWP), API Security, and Application Security environments with a single installation, enabling integration of security checks into development processes. It controls access to view the CLI Tools setup within the Data Sources & Integrations page (Settings → Data Sources & Integrations), download the CLI, and generate the required API keys.
Caution
- Licence Requirement: Accessing the CLI Tool requires a Cloud Posture Security, Cloud Runtime Security, or Cortex XSIAM Premium license.
- This permission only governs the deployment and configuration of the CLI tool itself. To view the actual security findings and vulnerabilities discovered by the CLI scans, users must be granted separate access to the Application Security, Cloud Workload Policies, or Vulnerability Management modules.
| Component | Description | Roles Example |
|---|---|---|
| None | No access to CLI Tools configuration or API key generation. | SOC Tier-1 Analyst: No need for CI/CD integration. |
| View | Read-only access to CLI Tools configuration and download capabilities. | <ul><li>SOC Tier-2 and 3 Analysts: May need to view scan results but not configure.</li><li>Threat Hunter: May review scan results for threat intelligence.</li></ul> |
| View/Edit | Full access to configure CLI Tools and generate API keys for deployment. | Security Engineer: Configures CI/CD security integrations and needs to generate API keys. |
Required and recommended permissions
To effectively configure the CLI and review its subsequent scan results, administrators and analysts require visibility into the underlying data sources and security policies. Consider adding the following permissions:
| Permission | Permission Level | Reason |
|---|---|---|
| Public API | View/Edit | Required for setup. Users must generate an API key to configure the CLI tool successfully. As the backend endpoint is shared, View/Edit access to the Public API is mandatory. |
| Data Sources | View or View/Edit | <ul><li>View: Required. Access the Data Sources & Integrations page where CLI Tools is located.</li><li>View/Edit: Strongly recommended to modify data source configurations.</li></ul> |
| CloudSec Policies | View/Edit | Required to access and modify the Cloud Workload Protection policies that the CLI evaluates against. |
| Application Security | View/Edit | Strongly recommended to view and manage the CI/CD, PR, and periodic scan findings generated by the CLI tool. |
| Vulnerability Management | View | Recommended to view broader vulnerability scan results identified by the CLI tool across the environment. |
Application Security permissions
Application Security provides code-to-cloud security for software development lifecycles.
For detailed access guidance, see:
- application-security-generic-collector-permissions
- application-security-issues-permissions
- application-security-scans-permissions
- application-security-policy-management-permissions
- application-security-3rd-party-tools-permissions
- configurations-application-security-permissions
License
Requires Cloud Posture Security, Cloud Runtime Security, or Cortex XSIAM Premium license. Specific capabilities, such as Scans and Configurations, also require the Application Security add-on.
Application Security - Generic Collector permissions
The Generic Collector is a data source integration type within the Application Security module that allows ingestion of code scan data from external third-party security tools into Cortex XSIAM. Access the 3rd party AppSec Collector data source by going to Settings → Data Sources & Integrations
Unlike built-in VCS integrations (GitHub, GitLab, etc.) and CI/CD integrations (Jenkins, CircleCI, etc.), the Generic Collector provides a flexible API endpoint for receiving scan results in supported formats (e.g., SARIF). Each collector instance is assigned a unique API URL and API key for external tool authentication.
Notice
Scan results ingested by the collector flow into Cortex XSIAM require a Cloud Posture Security, Cloud Runtime Security, or Cortex XSIAM Premium license plus the Application Security add-on.
| Permission | Description | Roles Example |
|---|---|---|
| None | No access to the 3rd Party AppSec Collector on the Data Sources page. | SOC Tier-1, 2, and 3 Analysts, and Threat Hunters: They do not need to create/modify collectors. None is appropriate. |
| View/Edit | <p>Full access to create, configure, view, enable/disable, and delete the 3rd Party AppSec Collector instances, provided users also have Data Sources View/Edit permission.</p><div data-gb-custom-block data-tag="hint" data-style="info" class="hint hint-info"><p>Note</p><p>If users have View permission for Data Sources, they can view the 3rd Party AppSec Collector, but cannot create or edit.</p></div> | Security Engineers: Responsible for configuring and maintaining the security tooling pipeline. They need to create new collectors, configure detection methods, manage API keys, and troubleshoot ingestion issues. |
Required and recommended permissions
The following permissions are needed alongside the Generic Collector permission for effective use. These apply generally regardless of role.
| Permission | Permission Level | Reason |
|---|---|---|
| Data Sources | View or View/Edit | <ul><li>View: The Data Sources page is the only path to access collector management. Without this permission, the user cannot reach the collector management interface, even if they have Generic Collector View/Edit. Required.</li><li>View/Edit: Creating, editing, enabling/disabling, and deleting collectors requires the Data Sources action permission. Without it, the user can only view collectors in read-only mode. Required.</li></ul> |
| Asset Inventory | View or View/Edit | <ul><li>View: To view the AppSec issues generated from collector-ingested data. Without this, the user can manage collectors but cannot see the resulting security findings. Strongly recommended.</li><li>View/Edit: To manage and remediate issues that originate from collector-ingested data (e.g., change issue status, assign issues, create exclusions). Strongly recommended.</li></ul> |
| Integrations | View/Edit | <ul><li>View: View integration status and health for connected tools on the Data Sources & Integrations page. Recommended.</li><li>View/Edit: The Data Sources & Integrations page is shared between data sources and integrations. Having integration permissions provides a complete view of all connected tools. Strongly recommended</li></ul> |
| Query Center | View & View/Edit | <ul><li>View: Run XQL queries on data ingested through collectors for investigation purposes. Recommended.</li><li>View/Edit: Execute advanced queries on collector-ingested scan data. Recommended.</li></ul> |
| Cases & Issues | View/Edit | Correlate collector-sourced AppSec issues with cases and issues. Recommended. |
Application Security - Issues permissions
Issues display security findings discovered across your code repositories, container images, and CI/CD pipelines. To view Issues, go to Modules → Application Security → Issues, and select one of the issues, such as IaC Misconfigurations, vulnerabilities, and Secrets.
| Permission | Description | Roles Example |
|---|---|---|
| None | No access to Application Security Issues. | SOC Tier-1 Analyst: Focus on issue triage and initial case response. Application Security findings are not part of their primary workflow. |
| View | Read-only access to all issue categories. Users can browse, filter, search, and export issues. They can view issue details and findings. They cannot change issue status, assign issues, create exclusions, or trigger remediation. | <ul><li>SOC Tier-2 and 3 Analysts: SOC Tier-2 analysts may need to investigate code-related cases or correlate AppSec findings with security issues.</li><li>Threat Hunter: Needs to correlate code-level findings with threat intelligence and attack patterns.</li></ul> |
| View/Edit | Full access to manage and remediate issues. Includes all View capabilities plus: change issue status, assign issues, create exclusions, trigger remediation, perform bulk operations, and add comments. | Security Engineer: Responsible for triaging, assigning, and remediating AppSec issues. |
Required and recommended permissions
Consider adding the following permissions:
| Permission | Permission Level | Reason |
|---|---|---|
| Query Center | View or View/Edit | <ul><li>View: Recommended. Run XQL queries on issue data for advanced investigation.</li><li>View/Edit: Recommended. Execute custom queries against AppSec issue datasets.</li></ul> |
| Cases & Issues | View or View/Edit | <ul><li>View: Recommended. Link AppSec issues to incident cases for correlation.</li><li>View/Edit: Recommended. Create incident cases directly from AppSec issues.</li></ul> |
| Dashboards | Enabled | View AppSec issue summary widgets on dashboards. |
Application Security - Scans permissions
Configure the following permission for Application Security Scans:
Requires the Application Security add-on, in addition to a foundational Cloud Posture Security, Cloud Runtime Security, or Cortex XSIAM Premium license.
Periodic scans
Branch Periodic Scans are scheduled, automated scans of repository branches. They run on a configurable schedule to continuously monitor the security posture of your codebase. Results show findings per branch, including IaC misconfigurations, vulnerabilities, secrets, and other issue types. To access Branch Periodic scans, go to Modules → Application Security → Scans → Branch Periodic Scans.
| Permission | Description | Roles Example |
|---|---|---|
| None | No access to Periodic Scans. | SOC Tier-1 and 2 Analysts: Scan results are not typically needed for case investigation at this tier. |
| View | Read-only access to periodic scan results. Users can view scan history, filter results, and view scan details. They cannot configure scan schedules, trigger manual scans, or modify scan configurations. | <ul><li>SOC Tier-3 Analyst: May need to verify scan coverage and results during advanced investigations.</li><li>Threat Hunter: Reviews scan coverage to identify gaps in security monitoring.</li></ul> |
| View/Edit | Full access to configure and manage periodic scans. Includes all View capabilities plus: configure scan schedules, trigger manual scans, modify scan configurations, enable/disable scans, and configure scan scope. | Security Engineer: Configures scan schedules, triggers manual scans, and manages scan scope. |
PR scans
Pull Request Scans are event-driven scans triggered on PR creation or update. They provide inline security feedback to developers during the code review process, enabling shift-left security. Results are tied to specific pull requests and show new findings introduced by the PR. To access PR scans, go to Modules → Application Security → Scans → Pull Request Scans.
| Permission | Description | Roles Example |
|---|---|---|
| None | No access to PR scans. | SOC Tier-1 and 2 Analysts: PR-level scan data is rarely needed for case investigation |
| View | Read-only access to PR scan results. Users can view PR scan history, filter results, and view scan details. They cannot configure PR scan settings or modify scan behavior. | <ul><li>SOC Tier-3 Analyst: May need to trace a security issue back to a specific PR during forensic analysis.</li><li>Threat Hunter: May review PR scan data to understand how vulnerabilities were introduced.</li></ul> |
| View/Edit | Full access to configure and manage PR scans. Includes all View capabilities plus: configure PR scan triggers, modify scan settings, and manage PR scan behavior. | Security Engineer: Configures PR scan triggers and manages shift-left security enforcement. |
CI/CD scans
CI/CD Scans are scans integrated into CI/CD pipelines that run during pipeline execution. They provide security gates within the build and deployment process, enabling automated security checks before code reaches production. Results are tied to specific pipeline runs. To access CI/CD scans, go to Modules → Application Security → Scans → CI Scans.
| Permission | Description | Roles Example |
|---|---|---|
| None | No access to CI/CD Scans. | SOC Tier-1 and 2 Analysts: CI/CD scan data is rarely needed for case investigation at this tier |
| View | Read-only access to CI/CD scan results. Users can view CI/CD scan history, filter results, and view scan details. They cannot configure CI/CD scan settings or modify pipeline integrations. | <ul><li>SOC Tier-3 Analyst: May need to review pipeline scan results during supply chain attack investigations.</li><li>Threat Hunter: Reviews CI/CD scan data to identify supply chain risks and pipeline vulnerabilities.</li></ul> |
| View/Edit | Full access to configure and manage CI/CD scans. Includes all View capabilities plus: configure CI/CD scan settings, modify pipeline integrations, and manage scan behavior. | Security Engineer: Configures CI/CD scan settings and manages pipeline security integrations. |
Required and recommended permissions
Consider adding the following permissions:
| Permission | Permission Level | Reason |
|---|---|---|
| Data Sources | View or View/Edit | <ul><li>CI/CD View: Strongly recommended for all scans. View connected repositories, CI/CD systems, and pipeline configurations.</li><li>View/Edit: Strongly recommended. Configure CI/CD pipeline connections.</li></ul> |
| Integrations | View | Strongly recommended for CI/CD system integration status, and for PR Scans to view VCS webhook and PR integration status. Recommended for Periodic scans to view VCS integration status for scan connectivity. |
Application Security - Policy Management permissions
This section describes how to configure Application Security Policy Management (rules and policies) permissions.
AppSec Rules
AppSec Rules are individual security detection rules that define what security issues to detect in code, IaC templates, packages, and CI/CD configurations. Each rule has a severity, category, and detection logic. Rules are the building blocks of AppSec Policies. To access AppSec Rules, go to Modules → Application Security → Policy Management → AppSec Rules.
| Permission | Description | Roles Example |
|---|---|---|
| None | No access to AppSec Rules. | SOC Tier-1 and 2 Analysts: Rule configuration is outside the scope of case investigation. |
| View | Read-only access to AppSec Rules. Users can browse, filter, and view rule details, including detection logic and severity. They cannot create, edit, enable/disable, or delete rules. | <ul><li>SOC Tier-3 Analyst: May need to review detection rules to understand why specific findings were generated.</li><li>Threat Hunter: Reviews detection rules to understand coverage and identify detection gaps.</li></ul> |
| View/Edit | Full access to manage AppSec Rules. Includes all View capabilities plus: create new rules via the Rules Wizard, edit existing rules, enable/disable rules, delete rules, and clone rules. Also grants access to the Rules Wizard steps (Code/Logic and Details). | Security Engineer: Creates custom detection rules, tunes built-in rules, and manages rule severity. |
AppSec Policies
AppSec policies are collections of rules with configurable actions (detect or prevent). Policies define the enforcement behavior, whether findings should be reported only (detect) or should block PRs/CI-CD pipelines (prevent). Policies can be scoped to specific assets/repositories and configured with triggers and actions. They are the primary mechanism for enforcing security guardrails in the development lifecycle. To access AppSec Policies, go to Modules → Application Security → Policy Management → AppSec Policies.
| Permission | Description | Roles Example |
|---|---|---|
| None | No access to AppSec Policies. | SOC Tier-1 and 2 Analysts: Rule configuration is outside the scope of case investigation. |
| View | Read-only access to AppSec Policies. Users can browse, filter, and view policy details, including conditions, scope, and actions. They cannot create, edit, enable/disable, or delete policies. | <ul><li>SOC Tier-3 Analyst: May need to review policies to understand enforcement behavior during investigations.</li><li>Threat Hunter: Reviews policies to understand what is being enforced and identify policy gaps</li></ul> |
| View/Edit | Full access to manage AppSec Policies. Includes all View capabilities plus: create new policies via the Policies Wizard, edit existing policies, enable/disable policies, delete policies, and clone policies. Also grants access to all Policies Wizard steps (General, Conditions, Scope, Triggers & Actions, Summary). | Security Engineer: Creates and manages security policies, configures detection/prevention actions, and guardrails. |
Required and recommended permissions
To effectively configure Application Security policies, administrators need visibility into the broader cloud environment to understand how policies map to cloud workloads and external integrations.
| Permission | Permission Level | Reason |
|---|---|---|
| Policies | View or View/Edit | <ul><li>View: Recommended for AppSec Rules and Policies to view related cloud workload policies for policy and rule context.</li><li>View/Edit: Recommended for AppSec Rules and Policies to edit cloud workload policies alongside AppSec rules and policies.</li></ul> |
| Integrations | View | Recommended for AppSec Policies to view the integration context for policy scoping. |
Application Security - 3rd Party tools permissions
Provides visibility into supply chain security, including external tools integrated with your development pipeline and a catalog of known supply chain components.
Supply Chain Tools
External security tools integrated with your development pipeline (e.g., SonarQube, Snyk, Semgrep, Veracode, 3rd Party AppSec Collector). Shows tool status, risk factors, permissions, and version information. To access Supply Chain Tools, go to Modules → Application Security → 3rd Party Tools → Supply Chain Tools
| Permission | Description | Roles Example |
|---|---|---|
| None | No access to Supply Chain Tools. | SOC Tier-1 and Tier-2 Analysts: Supply chain data is rarely needed for incident investigation at these tiers. |
| View | Read-only access to supply chain tools data. Users can browse, filter, and view tool details. They cannot add, configure, or remove tools. | <ul><li>SOC Tier-3 Analyst: May need to review supply chain tools during software supply chain attack investigations.</li><li>Threat Hunter: Reviews supply chain tools to identify potential supply chain attack vectors</li></ul> |
| View/Edit | Full access to manage supply chain tools. Includes all View capabilities plus: add new tools, configure tool settings, remove tools, and manage tool integrations. | Security Engineer: Manages supply chain tool integrations. |
Supply Chain Catalog
A catalog of known supply chain components and their security status, including pipeline tools discovered across CI/CD configurations. To access the Supply Chain Catalog, go to Modules → Application Security → 3rd Party Tools → Supply Chain Catalog.
| Permission | Description | Roles Example |
|---|---|---|
| None | No access to Supply Chain Catalog. | SOC Tier-1 and 2 Analysts: Supply chain data is rarely needed for incident investigation at this tier. |
| View | Read-only access to the supply chain catalog. Users can browse, filter, and view catalog entries. They cannot update or manage catalog entries. | <ul><li>SOC Tier-3 Analyst: May need to review the supply chain catalog during software supply chain attack investigations.</li><li>Threat Hunter: Reviews the supply chain catalog to identify potential supply chain attack vectors</li></ul> |
| View/Edit | Full access to manage the supply chain catalog. Includes all View capabilities plus: update catalog entries and manage catalog data. | Security Engineer: Reviews the catalog for risk assessment |
Required and recommended permissions
To effectively configure Application Security pipelines and investigate the resulting code vulnerabilities, administrators and analysts require visibility into the underlying VCS integrations, data sources, and issue queues. Consider adding the following permissions:
| Permission | Permission Level | Reason |
|---|---|---|
| Integrations | View or View/Edit | <ul><li>View: Recommended for Supply Chain Catalog to view integration context for catalog entries. Strongly recommended for Supply Chain Tools to view the tool integration status and connectivity</li><li>View/Edit: Strongly recommended for Supply Chain Tools to configure 3rd party tool integrations (Snyk, SonarQube, Semgrep, Veracode, etc.).</li></ul> |
| Data Sources | View | Recommended. View connected data sources for the catalog context and view connected data sources for the supply chain tool context. |
| Graph Search | View | Recommended for Supply Chain Catalog. Understand asset relationships for catalog components. |
| Threat Intel | View | Recommended for Supply Chain Tools. Correlate supply chain tool findings with threat intelligence. |
Configurations - Application Security permissions
Application Security Configurations controls access to the Application Security settings under Settings → Configurations → Application Security, which includes the following:
- Application Configuration: Controls SLA target settings (Critical, High, Medium, Low severity target days and approaching SLA threshold), and the auto-refresh toggle for related application assets.
- AppSec Issues Configuration: Controls whether SBOM (Software Bill of Materials) findings are treated as new vulnerabilities. When enabled, all detected SBOM findings are treated as new vulnerabilities. When disabled, the baseline for identifying new SBOM vulnerabilities starts with the next scan, excluding previously identified findings.
License
Requires the Application Security add-on in addition to Cloud Posture Security, Cloud Runtime Security, or Cortex XSIAM Premium license.
| Permission | Description | Roles Example |
|---|---|---|
| None | No access to Application Security configuration pages. | <ul><li>SOC Tier-1, 2, and 3 Analysts: AppSec configuration is not part of the primary SOC workflow.</li><li>Threat Hunter: AppSec configuration is outside the scope of threat hunting.</li></ul> |
| View/Edit | Full access to view and modify Application Security configuration settings. | Security Engineer: May need to configure SLA targets and SBOM behavior as part of AppSec posture management. |
Required and recommended permissions
To understand the impact of modifying SLA targets and SBOM baselines, administrators should have visibility into the actual AppSec issues queues and the related application assets these settings affect.
| Permission | Permission Level | Reason |
|---|---|---|
| Application Security Issues | View | Strongly Recommended. Configurations made on this page directly dictate how SBOM findings appear and how SLA deadlines are calculated. Access to the Issues queue allows administrators to verify that their configuration changes produce the desired tracking behavior. |
| Asset Inventory | View | Recommended. The configurations include an auto-refresh toggle for related application assets. Asset Inventory visibility helps administrators understand which assets are being affected by this setting. |
Policies - Cloud Workload permissions
Policy permissions control access to Cloud Workload rules and policies (Compute Policies). This module maintains security compliance, prevents misconfigurations, and reduces risks across your cloud environments. Users manage Cloud Workload Policies and Rules by going to Posture Management → Rules & Policies and then selecting Cloud Workload under Policies or Rules.
Requires Cloud Posture Security, Cloud Runtime Security, or Cortex XSIAM Premium license.
Cloud Workload Policies Controls
Controls the ability to view, create, edit, duplicate, and delete cloud workload policies and rules.
| Permission | Description | Roles Example |
|---|---|---|
| None | No access to Cloud Workload Policies and Rules. Users can't access Cloud Workload Policies even from within associated issues. | SOC Tier-1 Analyst: Focus on issue triage, not policy management. |
| View | Read-only access. Users can browse the policies table, open policy side panels to view details, view linked rules, search and filter policies, and export policy data. They cannot modify or take action on policies. | <ul><li>SOC Tier 2 and 3 Analysts: Reference policy configurations during investigations/deep analysis of policy effectiveness.</li><li>Threat Hunter: Understand policy coverage for threat hunting.</li></ul> |
| View/Edit | Full edit access. Users can create, edit, delete, and duplicate Cloud Workload Policies and Rules. | <ul><li>Security Engineer: Create and maintain compute security policies.</li><li>Cloud Security Architect: Full administrative access to policy management.</li></ul> |
Required and recommended permissions
To effectively configure Cloud Workload policies and respond to the issues they generate, administrators and analysts require visibility into cloud assets, compliance standards, and issue queues.
| Permission | Permission Level | Reason |
|---|---|---|
| Cases & Issues | View or View/Edit | Strongly recommended to view and triage issues generated by compute and cloud security policies. |
| Asset Groups | View/Edit | Strongly recommended to configure policy scope using asset groups |
| Cloud Security | View | Strongly recommended. CSPM Policies reference Cloud Security Rules. |
| Data Sources | View or View/Edit | View and View/Edit. Recommended to view and configure cloud data sources. |
| Asset Inventory | View | View: Recommended to view cloud compute instances and assets targeted by policies. |
| Compliance | View | View: Recommended to view the compliance status of cloud workloads. |
| Cloud Security Command Center | View | View: Recommended. View Cloud Security dashboards (Command Center and Cloud Security Command Center). |
Cloud Security permissions
You can edit Cloud Security policies and rules permissions by selecting CLOUDSEC when creating or editing a role.
Users manage Cloud Security Policies and Rules by going to Posture Management → Rules & Policies and then selecting Cloud Security either under Policies or Rules.
Requires Cloud Posture Security, Cloud Runtime Security, or Cortex XSIAM Premium license.
Rules
Control Cloud Security Rules, which are individual security detection rules that Cloud Security Policies reference. They define specific configuration checks and compliance requirements, such as checking specific cloud resource settings, mapping specific compliance requirements, and pre-defined security best practice rules.
| Permission | Description | Roles Example |
|---|---|---|
| None | No access to Cloud Security Rules. | SOC Tier-1 Analyst: Focus on issue triage, not policy management. |
| View | Read-only access to Cloud Security Rules, but can't take any action. | <ul><li>SOC Tier 2 and 3 Analysts: Reference policy configurations during investigations/deep analysis of policy effectiveness.</li><li>Threat Hunter: Understand policy coverage for threat hunting.</li></ul> |
| View/Edit | Full edit access, including creating, editing, and deleting, copying, and enabling or disabling Cloud Security Rules. | Security Engineer: Create and maintain cloud security rules. |
Policies
Cloud Security Policies allow administrators to define and manage configuration and compliance policies for cloud infrastructure, such as checking cloud resource configurations, mapping compliance frameworks, and identifying security misconfigurations.
| Permission | Description | Roles Example |
|---|---|---|
| None | No access to Cloud Security Policies. | SOC Tier-1 Analyst: Focus on issue triage, not policy management. |
| View | Users can access Cloud Security Policies, but can't take any action. | <ul><li>SOC Tier 2 and 3 Analysts: Reference policy configurations during investigations/deep analysis of policy effectiveness.</li><li>Threat Hunter: Understand policy coverage for threat hunting.</li></ul> |
| View/Edit | Full edit access, including creating, editing, and deleting Cloud Security Policies. | Security Engineer: Create and maintain cloud security rules. |
Required and recommended permissions
Consider adding the following permissions:
| Permissions | Permission Level | Reason |
|---|---|---|
| Cloud Security Command Center | View or View/Edit | <ul><li>View: Strongly recommended. Provides access to the CloudSec Command Center dashboard, which gives a high-level overview of cloud security posture, including asset class views, ingestion data, and value metrics.</li><li>View/Edit: Recommended. Allows editing CloudSec dashboards. Recommended for Security Engineers and Security Admins who need to customize posture dashboards.</li></ul> |
| Cloud Security Operations | View or View/Edit | <ul><li>View: Strongly recommended. Provides access to the CloudSec SecOps dashboard, which shows operational metrics like open action plans, burndown charts, MTTR, top impacted assets/accounts, and action plan breakdowns by category and age. Essential for understanding the operational state of cloud security posture.</li><li>View/Edit: Recommended. Allows editing CloudSec SecOps dashboards. Recommended for Security Engineers and Security Admins who need to customize operational dashboards.</li></ul> |
| Asset Inventory | View | Strongly recommended. Provides access to the Unified Asset Inventory, which is the foundation for viewing cloud assets that rules and policies evaluate. Without this, users cannot see the cloud assets that are in scope for policies. |
| Compliance | View or View/Edit | <ul><li>View: Recommended. Provides access to Cloud Workload Protection policies. Recommended for users who need a holistic view of both CSPM and CWP posture configurations.</li><li>View/Edit: Recommended. Allows editing Cloud Workload Protection policies. Recommended for Security Engineers and Admins managing both CSPM and CWP.</li></ul> |
| Compliance | View | <ul><li>Catalog & Assessment Profiles: View. Recommended for access to the Compliance module (standards, controls, assessment profiles), as CloudSec rules map to compliance standards, and users benefit from seeing the compliance context.</li><li>Reports: View. Recommended to access for compliance assessment results and reports. Recommended for understanding how rule findings impact compliance posture.</li></ul> |
| Query Center | View | Recommended. Provides access to XQL query capabilities. Recommended for SOC analysts and threat hunters who need to query cloud security data for investigation. |
Compliance - Cloud permissions
Configure access to Cloud compliance, which allows organizations to track adherence against regulatory frameworks (e.g., CIS, NIST, PCI DSS), monitor cloud compliance violations, and manage compliance assessment schedules
Requires Cloud Posture Security, Cloud Runtime Security, or Cortex XSIAM Premium license.
System-provided (OOTB) standards and controls are immutable. They cannot be edited or deleted by any user, regardless of whether they hold View/Edit permissions
Compliance permissions include Catalog and assessment Profiles, and Reports. Users access Assessment/Reports by going to Posture Management → Compliance.
Catalog and Assessment Profiles
Controls access to the building blocks of Compliance (Posture Management → Compliance):
- Standards Catalog: A library of compliance frameworks (for example, CIS Benchmarks, NIST 800-53, PCI DSS, SOC 2). Standards can be pre-built (OOTB/system) or custom-created.
- Controls Catalog: The individual security checks and requirements that make up a standard.
- Assessment profiles: Configurations that define how compliance is assessed.
| Permission | Description | Roles Example |
|---|---|---|
| None | No access to the Standards, Controls, or Assessment Profiles pages. | |
| View | The user can navigate to the Standards Catalog, Controls Catalog, and Assessment Profiles pages. They can view the list of standards, browse controls and their details (severity, category, linked rules), and see assessment profile configurations (name, standard, schedule, targets). | <ul><li>SOC Tier 1, 2, and 3 Analysts: Should not modify compliance configurations. May need visibility into compliance posture.</li><li>Threat Hunter: Needs read-only access to compliance data to correlate compliance gaps with threat activity. Should not modify compliance configurations.</li></ul> |
| View/Edit | The user has full access. In addition to all View capabilities, they can create, edit, and delete custom standards, custom controls, and custom profiles. | Security Engineer: Responsible for defining and maintaining compliance standards, controls, and assessment profiles. Needs full access to configure the compliance framework. |
Reports
Reports provide the results and outputs of compliance assessments.
- Assessment: The live compliance posture view shows the latest evaluation results for each assessment profile, including scores, control status breakdowns, failed controls by severity, and drill-downs into rules, controls, and assets.
- Reports: Historical compliance reports that have been generated and stored. These can be viewed, exported (PDF/CSV), or deleted.
| Permission | Description | Roles Example |
|---|---|---|
| None | The user cannot access the Assessment or Reports pages. Navigation menu items for these sections are hidden. | |
| View | The user can navigate to the Assessment and Reports pages. They can view the compliance posture dashboard with scores, control status breakdowns, and failed control severity widgets. They can drill down into profile results to see controls, rules, and asset results. They can view historical reports and export reports to PDF or CSV. They cannot delete reports. | <ul><li>SOC Tier 1, 2, and 3 Analysts: Need to view/analyze compliance reports and export them for escalation or documentation during triage.</li><li>Threat Hunter: Needs read-only access to compliance reports to identify compliance gaps that may indicate attack surfaces or ongoing threats.</li><li>Security Engineer: Needs to review compliance reports to validate that configured standards and controls are producing expected results. Does not typically need to delete reports.</li></ul> |
| View/Edit | The user has full access. In addition to all View capabilities, they can delete reports. |
Required and recommended permissions
To effectively prioritize compliance violations and validate that custom standards are working, administrators and analysts require visibility into active security issues and broader vulnerability data.
| Permission | Permission Level | Reason |
|---|---|---|
| Cases & Issues | View | Recommended for reports. Compliance findings surfaced in reports may generate issues or be linked to cases. Granting this permission allows users to correlate compliance violations shown in reports with active security cases, providing a more complete picture of the organization's security posture. |
| Vulnerability Management | View | Recommended. Compliance report results often overlap with vulnerability findings (for example, CIS benchmarks checking for unpatched software). Granting this permission enables users to cross-reference compliance report results with vulnerability data, helping prioritize remediation efforts based on both compliance requirements and actual vulnerability exposure. |
| Reports | View | Strongly recommended for the Catalog and Assessment Profile. Users who manage the compliance catalog (standards, controls, profiles) need to verify that their configurations produce correct assessment results. |
Data Security permissions
The Data Security permission includes the following permissions:
- Endpoint DLP: Includes permissions such as Data-in-motion rules and Endpoint Applications.
- Data Security: Data Security Posture Management (DSPM)
This section controls access to the DSPM features, which provide deep visibility into cloud data assets (such as storage buckets, databases, and backups) and their underlying data objects (files, columns, and tables). It also controls access to the Data Pattern Inventory, Data Security Detection Rules, and the Data Security Issues queue.
Users access DSPM from Modules → Data Security.
Requires Cloud Posture Security, Cloud Runtime Security, or Cortex XSIAM Premium license.
| Permission | Description | Roles Example |
|---|---|---|
| None | Users cannot access the DSPM pages (All Assets, Disks, Storage Buckets, Databases, Backups), data objects (Files, Columns, Tables), Data Pattern Inventory, Data Security Issues (posture and threats), and Detection Rules. | SOC Tier-1 Analyst: Data security posture management is outside the triage scope. |
| View | Read-only access to all DSPM pages. Users can view the Overview dashboard, browse all discovered data assets and their classifications, and view the Data Pattern Inventory, Data Security Issues (posture and threats), and Detection Rules | <ul><li>SOC Tier-2 and 3 Analysts: May need to review data asset context when investigating data-related cases.</li><li>Threat Hunter: May need to understand the data asset landscape for comprehensive threat hunting.</li></ul> |
| View/Edit | Full control over DSPM features. Users can trigger manual data scans, manage data asset configurations, interact with data security issues (acknowledge and remediate), and manage the overview dashboard. All action buttons and management forms are accessible. | Security Engineer: Responsible for configuring data security scanning and managing data classifications. |
Required and recommended permissions
To effectively secure cloud data and investigate complex data-centric threats, administrators and analysts require deep visibility into the underlying cloud configurations and standard investigation tools. Consider adding the following permissions:
| Permission | Permission Level | Reason |
|---|---|---|
| Cases & Issues | View | Strongly recommended to view Cloud Data Security issues. |
| Data Sources | View | Recommended. Allows checking the data source status. View/Edit: Recommended. Configure cloud data source integrations. |
| Asset Inventory | View | Recommended to view the asset context related to data security findings. |
AI Security permissions
Cloud AI Security provides a comprehensive overview of the AI assets within an organization. It is designed to ensure AI security by offering tools to review and prioritize AI risks effectively. Users access these features by going to Modules → AI Security). This module covers the following:
- AI Security Dashboard: An overview of AI security posture with asset summaries, risk breakdowns, and vulnerability widgets.
- AI Inventory: A comprehensive inventory of all AI assets, such as Models, Model Endpoints, and Software Packages.
- AI Security Issues: Security findings and posture violations related to AI assets.
- AI Security Detection Rules: Rules that detect security issues in AI deployments.
Requires Cloud Posture Security, Cloud Runtime Security, or Cortex XSIAM Premium license.
| Permission | Description | Roles Example |
|---|---|---|
| None | No access to AI Security; AI Security functions are hidden. | |
| View | Read-only access to AI Security, such as the AI Security Dashboard, AI Inventory, and AI Security Issues. Users cannot modify configurations or detection rules. | <ul><li>SOC Tier-1 Analyst: Needs visibility into AI Security issues and threats for initial triage. Can view the AI Security dashboard and inventory to understand the AI asset landscape and identify potential security incidents. Should not modify configurations or detection rules.</li><li>SOC Tier-2 Analyst: Requires deeper investigation capabilities for AI security incidents. Can review AI asset details, ecosystem relationships, and posture findings. May need to correlate AI security issues with broader incident context. Should not modify configurations.</li><li>Threat Hunter: Needs read-only access to AI Security inventory and issues for proactive threat hunting across AI assets. Can investigate AI ecosystem relationships, review model endpoints, and analyze AI-specific threats like model poisoning and prompt injection. Does not need edit access.</li></ul> |
| View/Edit | Full access to AI Security, such as modifying AI Security configurations, AI detection rules, and managing AI asset classifications. | <ul><li>SOC Tier-3 Analyst: Advanced analysts who may need to tune AI detection rules, manage AI security posture configurations, and take response actions on complex AI security incidents. Requires edit access for rule tuning and case response.</li><li>Security Engineer: Responsible for configuring and maintaining AI Security detection rules, posture policies, and integration with cloud environments. Needs full edit access to manage the AI security infrastructure.</li></ul> |
Required and recommended permissions
To effectively secure AI workloads and investigate complex AI-specific threats, analysts and engineers require deep visibility into the underlying cloud configurations, assets, and standard investigation tools:
| Permission | Permission Level | Reason |
|---|---|---|
| Cases & Issues/Action Center | View or View/Edit | <ul><li>View access: Strongly recommended to view the AI threats that feed into the issues queue and the response actions taken on them.</li><li>View/Edit: Recommended to actively triage these issues and initiate response actions</li></ul> |
| Dashboards & Reports | Enabled | <ul><li>Enabled: Required to view the AI Security dashboard and widgets.</li><li>Enabled with checkboxes selected: Recommended to customize the AI Security dashboard and to generate and customize AI security reports.</li></ul> |
| Asset Inventory/Groups | View or View/Edit | <ul><li>View: Strongly recommended to view assets associated with the AI inventory and how they are organized into asset groups.</li><li>View/Edit: Recommended to manage AI-related assets.</li></ul> |
| Cloud Security & Compute Policies | View or View/Edit | <ul><li>View: Strongly recommended. Provides critical context regarding the broader cloud security posture, compliance status, and cloud workload protection policies applied to the infrastructure hosting the AI assets</li><li>View/Edit: Recommended to modify AI Security rules, polices, and dashboards.</li></ul> |
| Query Center/Query Library | View or View/Edit | <ul><li>View/Enabled: Strongly recommended for the Query Center to run XQL queries on AI security data for investigation. Recommended for Personal Query to save queries for AI security investigation</li><li>View/Edit/Enabled with checkboxes selected: Recommended. Create, run, and edit custom XQL queries for AI security analysis.</li></ul> |
| Playbooks & Scripts | Enabled | Required to view and understand the automated scripts and playbooks used in AI security response workflows |
| Credentials | View | Recommended to view credentials used for AI data source connections. |
Data Classification permissions
Data Classification governs how sensitive data is identified, categorized, and labeled across the platform. It serves as the foundational engine that powers both Data Security Posture Management (DSPM) cloud scanning and Endpoint Data Loss Prevention (DLP) detection capabilities.
Users can access Data Classification from both Settings → Configurations → Data Classification and Modules → Data Security → Data Classification. Data Classification includes the following:
- Data Patterns: Definitions used to identify specific types of sensitive data.
- Data Profiles: Logical groupings of data patterns used to assign severity and classification labels.
- Global Settings: Overarching configurations for Optical Character Recognition (OCR), data masking, and preview samples.
Data Classification requires Cloud Posture Security, Cloud Runtime Security, or Cortex XSIAM Premium license.
System-provided (predefined) patterns cannot be edited or deleted regardless of permissions.
| Permissions | Description | Roles Example |
|---|---|---|
| None | No access to Data Classification configuration. | SOC Tier-1 Analyst: Data classification configuration is outside Tier-1 triage responsibilities. |
| View | Read-only access to all Data Classification configuration pages. The user can navigate to Data Patterns, Data Profiles, and Global Settings pages and see all existing configurations, but all actions are hidden or disabled. | <ul><li>SOC Tier-2 and 3 Analysts: May need to review data patterns and profile definitions when investigating data-related cases (e.g., DLP alerts, DSPM findings) to understand what type of sensitive data was detected and how it was classified.</li><li>Threat Hunter: May need to understand data classification definitions to correlate threat-hunting findings with the data-sensitivity context.</li></ul> |
| View/Edit | Full access to all Data Classification configuration pages. The user can view all configurations and has complete control to create new custom data patterns and profiles, edit existing custom items, duplicate patterns and profiles, delete custom items, enable/disable patterns and profiles, and modify Global Settings (OCR, masking, preview samples). | Security Engineer: Primary responsibility for defining and maintaining data classification rules. |
Required and recommended permissions
Data Classification is the engine that drives both cloud data security and endpoint DLP. To validate that classification rules are working correctly, administrators and analysts require visibility into the security issues and policies that utilize these definitions.
| Permission | Permission Level | Reason |
|---|---|---|
| Data Security | View | Strongly Recommended. Data patterns and profiles configured in Data Classification are used to classify cloud data assets. Viewing Data Security results helps validate that classification rules are working correctly. |
| Data-In-Motion Rules | View | Strongly Recommended. DLP rules directly reference data profiles configured in Data Classification. Understanding which DLP rules use which profiles is essential for effective classification management. Changes to profiles can affect DLP rule behavior. |
| Endpoint DLP Settings | View or View/Edit | <ul><li>View: Recommended</li><li>View/Edit: Recommended for Security Engineers and Admins.</li></ul><p>Controls overarching DLP engine behavior (such as default actions and browser extensions) and operates closely with Data Classification to enforce endpoint data security.</p> |
| Dashboards | Enabled | Recommended. The Data Security Overview dashboard visualizes classification results and data pattern distribution. Dashboard access helps users understand the overall impact of their classification configurations. |
| Cases & Issues | View | Recommended. DLP and Data Security issues reference data patterns and profiles. Viewing issues helps validate that classification rules are triggering correctly and provides feedback for tuning. |
Identity Security permissions
Identity Security provides centralized visibility and governance over both human and non-human identities across cloud, SaaS, and on-premises environments. Users access these features by going to Modules → Identity Security.
Identity Security permissions controls the following permissions :
- Cloud Identity Security (Posture Management): Focuses on identity posture, detecting misconfigured IAM policies, over-privileged accounts, inactive identities, and excessive permissions.
-
Identity Threat Detection and Response (ITDR): Focuses on real-time threat detection, identifying active attacks such as compromised credentials, privilege escalation, lateral movement, and suspicious authentication patterns.
.
Cloud Identity Security requires Cloud Posture Security, Cloud Runtime Security, or Cortex XSIAM Premium license.
ITDR requires a separate ITDR add-on.
| Permission | Description | Roles Example |
|---|---|---|
| None | The user has zero visibility into the Identity Security. All related dashboard widgets are hidden. | |
| View | Read-only access to all Identity Security features (subject to addon/license availability). Users can observe, investigate, and analyze identity data, but cannot make any changes. | <ul><li>SOC Tier-1 Analyst: View identity posture issues and ITDR issues during triage.</li><li>SOC Tier-2 Analyst & Threat Hunter: Deep investigation access to identity issues and threats, but rule/policy changes should be escalated.</li></ul> |
| View/Edit | Complete control. Includes the ability to create, modify, and delete identity security configurations, detection rules, and conditional access policies. | <ul><li>SOC Tier-3 Analyst: May require access to manage conditional access policies and settings during advanced response</li><li>Security Engineer: Build and tune identity detection rules and access policies.</li></ul> |
Required and recommended permissions
To effectively secure identities and investigate complex identity-based threats, analysts and engineers require deep visibility into the underlying cloud configurations, automation responses, and compliance standards. Consider adding the following permissions:
| Permission | Permission Level | Reason |
|---|---|---|
| Cases & Issues | View | Required. Needed to see the cases and issues generated by Identity Detection Rules. |
| Action Center | View/Edit | Strongly Recommended. Required to track and execute active response actions against compromised identities (e.g., disabling accounts or forcing MFA). |
| Query Center & Query Library | View or View/Edit | Strongly Recommended. Required to run and save XQL investigations on complex identity data. |
| Asset Inventory & Asset Groups | View | Strongly Recommended. Provides essential broader context for the affected identities and how they map to organizational assets. |
| Cloud Security & Compute Policies | View | Strongly Recommended. Dictates the overarching cloud posture and CWP policies governing the identities. |
| Credentials | View | Strongly Recommended. Needed to view the integrations and connections linking Cortex XSIAM to cloud and identity providers (such as AWS, Okta, or Microsoft Entra ID). |
| Playbooks & Scripts | View | Strongly Recommended. Heavily utilized for automated identity remediation, such as auto-disabling compromised accounts or alerting identity owners. |
| Reports & Compliance | View | Recommended. General Reports, Compliance Reports, and Catalog & Assessment Profiles often include identity posture data and frameworks requiring identity security controls. |
API documentation
Using the Cortex XSIAM APIs, you can integrate Cortex XSIAM with third-party apps or services to ingest alerts and to leverage alert stitching and investigation capabilities. The APIs allow you to manage incidents in a ticketing or automation system of your choice by reviewing and editing the incident's details, status, and assignee. Using the APIs, you can also retrieve information on the endpoints, create an installation package, perform response actions directly on the endpoint, and more.
To view the latest Cortex XSIAM API: Cortex XSIAM API Documentation
Reference
Cloud service provider permissions
When you set up Cortex XSIAM to collect data from your cloud environments, the onboarding wizard will ensure that the correct permissions are granted for Cortex XSIAM. The following tables list the permissions required for each of the options available in the onboarding wizards.
Review the permissions required for each cloud service provider:
About automation permission scopes for unified Cortex platform cloud content packs
The unified Cortex platform cloud content packs (AWS, Azure, and GCP) require a defined set of automation permissions to enable full integration with your cloud environment. Review the following before configuring access:
- Forward compatibility: The permission set declared by each pack covers both currently available commands and commands planned for future releases. This eliminates the need to re-authorize permissions with each pack update.
- Granular review: To see the permissions required for a specific command, refer to the Command Details section in the pack documentation.
-
Custom scoping: If your security policy requires permissions more restrictive than the recommended defaults, use a custom deployment template to define your access levels manually.
Caution
Reducing permissions below the recommended level may cause specific commands to fail or limit functionality in future pack updates.
Microsoft Windows security auditing setup
In Traps 6.1.3 and later releases, to enable Cortex XDR to collect Windows event logs, configure the following settings.
Enable security auditing event IDs
You can enable security auditing events using GPO or set them up on a local server. Active Directory Certificate Services (ADCS) events require additional setup.
Note
We recommend you configure security auditing using Group Policy Object (GPO). Using GPO simplifies audit management and ensures that auditing settings are uniformly applied across your network, reducing the risk of misconfigurations on individual machines.
Enable security auditing event IDs with GPO
Use the Group Policy Management Editor to configure security auditing policies across domain controllers or other target machines.
Note
We recommend that you configure the Group Policy Object (GPO) to apply to all endpoints and not just Domain Controllers. This ensures comprehensive auditing across your entire network.
- Log in to a Domain Controller (DC) as a domain admin.
- Open the Group Policy Management Editor using one of the following methods:
- Navigate to Server Manager → Tools → Group Policy Management.
- On your keyboard, press Win + R, type GPMC.exe, and press Enter.
-
Create or select a GPO using one of the following methods:
- Create a new GPO and link it to an Organizational Unit (OU) containing the computers where you want to apply the changes.
- Use an existing GPO. For example, to apply changes to domain controllers, expand the Domain Controllers OU, right-click Default Domain Controllers Policy, and select Edit.
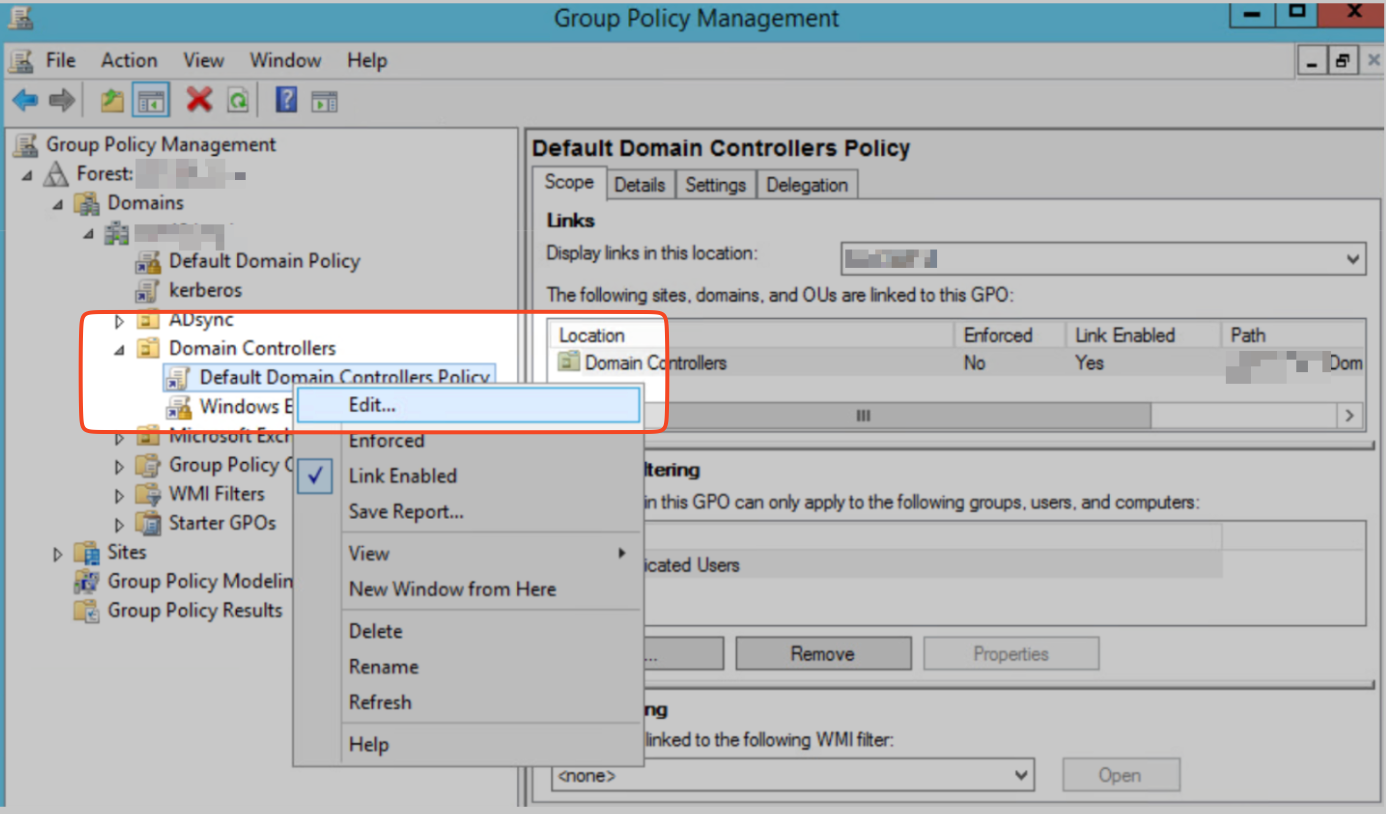
-
In the Group Policy Management Editor, navigate to Computer Configuration → Policies → Windows Settings → Security Settings → Advanced Audit Policy Configuration → Audit Policies.
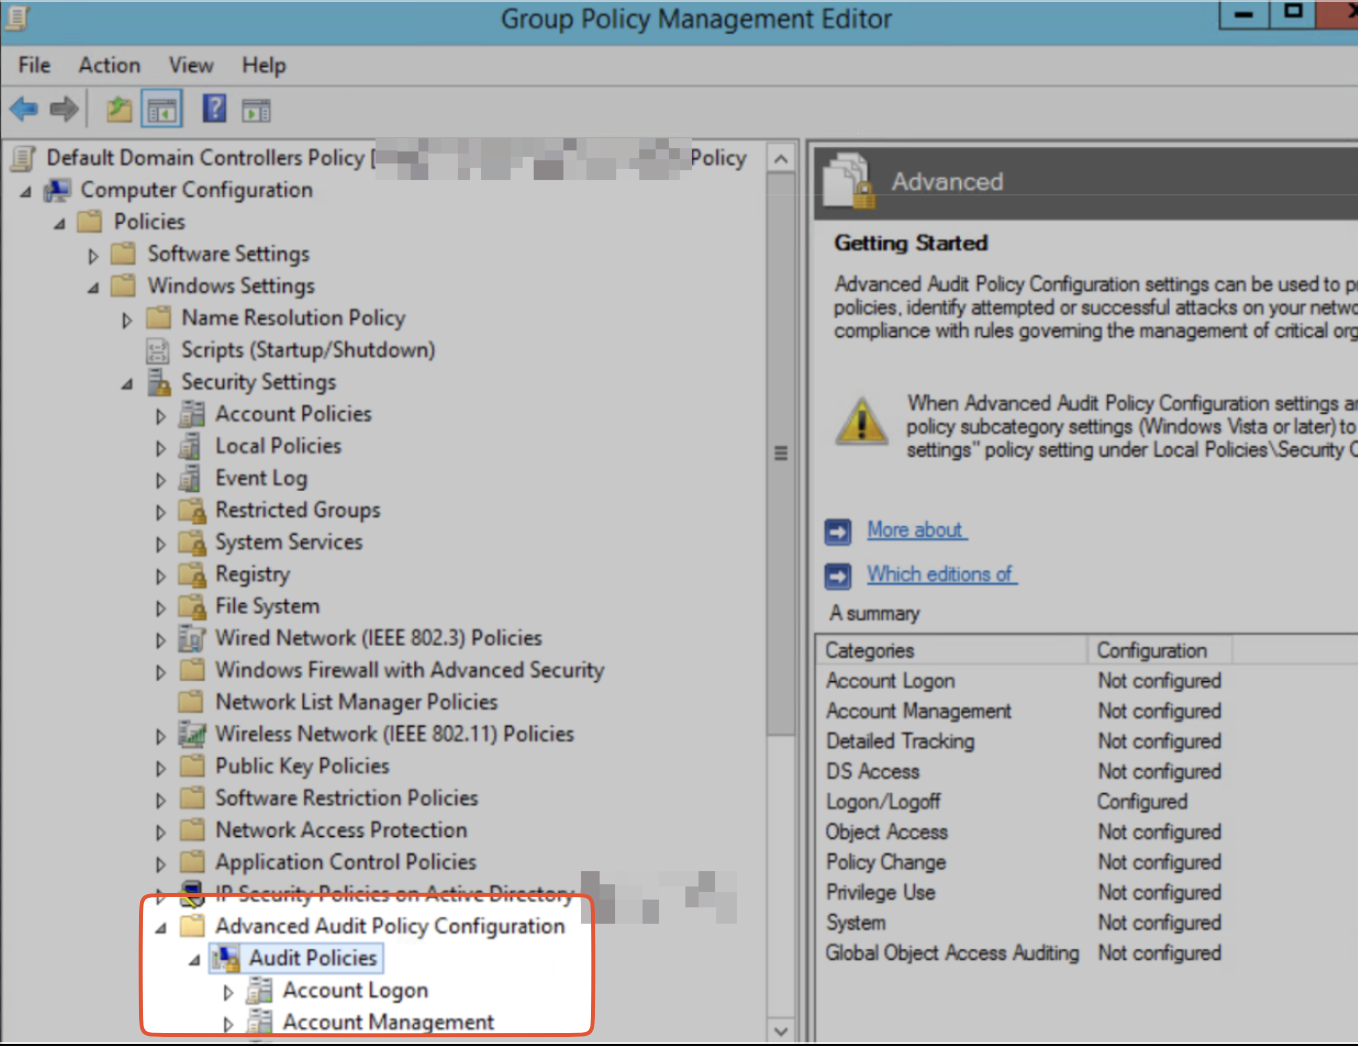
-
In the Audit Policies settings, enable logging for both successful and failed attempts for the following events.
Event IDs Audit Policy Subcategory Additional configuration needed 4776, 4822, 4823 Account Logon Audit Credential Validation 4768, 4771, 4824 Account Logon Audit Kerberos Authentication Service DCs only 4769, 4770, 4821 Account Logon Audit Kerberos Service Ticket Operations DCs only 4741, 4742, 4743 Account Management Audit Computer Account Management DCs only 4727, 4728, 4729, 4731, 4732, 4733, 4735, 4737, 4754, 4755, 4756, 4757, 4764, 4799 Account Management Audit Security Group Management 4720, 4722, 4723, 4724, 4725, 4726, 4738, 4740, 4765, 4766, 4767, 4780, 4781 Account Management Audit User Account Management 4662 DS Access Audit Directory Service Access <p>Additional setup for Active Directory Certificate Services (ADCS) events</p><p>DCs only</p> 4634, 4647 Logon/Logoff Audit Logoff 4624, 4625, 4648 Logon/Logoff Audit Logon 4649, 4778, 4800, 4801, 4802, 4803 Logon/Logoff Audit Other Logon/Logoff Events 4672 Logon/Logoff Audit Special Logon 4880, 4881, 4885, 4886, 4887, 4888, 4896, 4898, 4899, 4900 Object Access Audit Certification Services Additional setup for Active Directory Certificate Services (ADCS) events 5140 Object Access Audit File Share 4698, 4702 Object Access Audit Other Object Access Events 4713 Policy Change Audit Authentication Policy Change 4616 System Audit Security State Change 1102 System Other System Events Enabled by default
Set up local machine security auditing without GPO
To enable collection of event logs on a local machine without GPO, use the following command in an administrator command prompt:
auditpol /set /subcategory:[subcategory] /success:enable /failure:enable
Replace [subcategory] with the subcategories in the following table.
| Event IDs | Audit Policy | Subcategory | Additional configuration needed |
|---|---|---|---|
| 4776, 4822, 4823 | Account Logon | Audit Credential Validation | |
| 4768, 4771, 4824 | Account Logon | Audit Kerberos Authentication Service | DCs only |
| 4769, 4770, 4821 | Account Logon | Audit Kerberos Service Ticket Operations | DCs only |
| 4741, 4742, 4743 | Account Management | Audit Computer Account Management | DCs only |
| 4727, 4728, 4729, 4731, 4732, 4733, 4735, 4737, 4754, 4755, 4756, 4757, 4764, 4799 | Account Management | Audit Security Group Management | |
| 4720, 4722, 4723, 4724, 4725, 4726, 4738, 4740, 4765, 4766, 4767, 4780, 4781 | Account Management | Audit User Account Management | |
| 4662 | DS Access | Audit Directory Service Access | <p>Additional setup for Active Directory Certificate Services (ADCS) events</p><p>DCs only</p> |
| 4634, 4647 | Logon/Logoff | Audit Logoff | |
| 4624, 4625, 4648 | Logon/Logoff | Audit Logon | |
| 4649, 4778, 4800, 4801, 4802, 4803 | Logon/Logoff | Audit Other Logon/Logoff Events | |
| 4672 | Logon/Logoff | Audit Special Logon | |
| 4880, 4881, 4885, 4886, 4887, 4888, 4896, 4898, 4899, 4900 | Object Access | Audit Certification Services | Additional setup for Active Directory Certificate Services (ADCS) events |
| 5140 | Object Access | Audit File Share | |
| 4698, 4702 | Object Access | Audit Other Object Access Events | |
| 4713 | Policy Change | Audit Authentication Policy Change | |
| 4616 | System | Audit Security State Change | |
| 1102 | System | Other System Events | Enabled by default |
Additional setup for Active Directory Certificate Services (ADCS) events
ADCS events with IDs 4880, 4881, 4886, 4887, 4896, 4898, 4899, 4900 require additional setup.
Note
Enabling auditing for Active Directory Certificate Services (ADCS) restarts (events 4880 and 4881) can significantly slow down the service if you have a large database. To prevent delays:
- Clean up the database: Remove any unnecessary entries to reduce its size.
- Skip this audit: If restart speed is critical, consider not enabling auditing for ADCS starts and stops (event IDs 4880 and 4881).
Enable auditing access to AD domain objects - 4662
- Log in to a Domain Controller as a domain admin.
- In the Start menu, under Administrative Tools, open Active Directory Users and Computers.
- In the left pane, locate the domain you want to audit. This will typically be the name of your network.
-
To see more details, in the View menu, select Advanced Features.
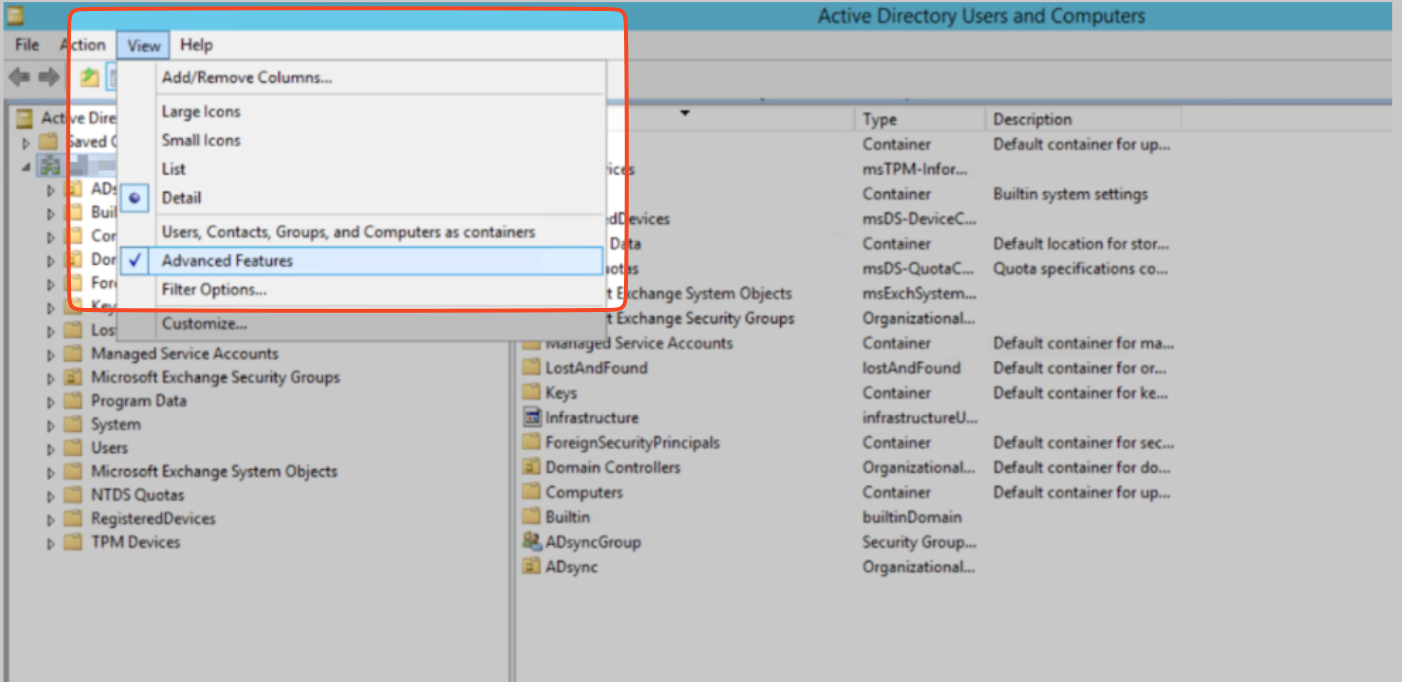 {width=70%}
 -
To view detailed information about your domain, right-click its name and select Properties.
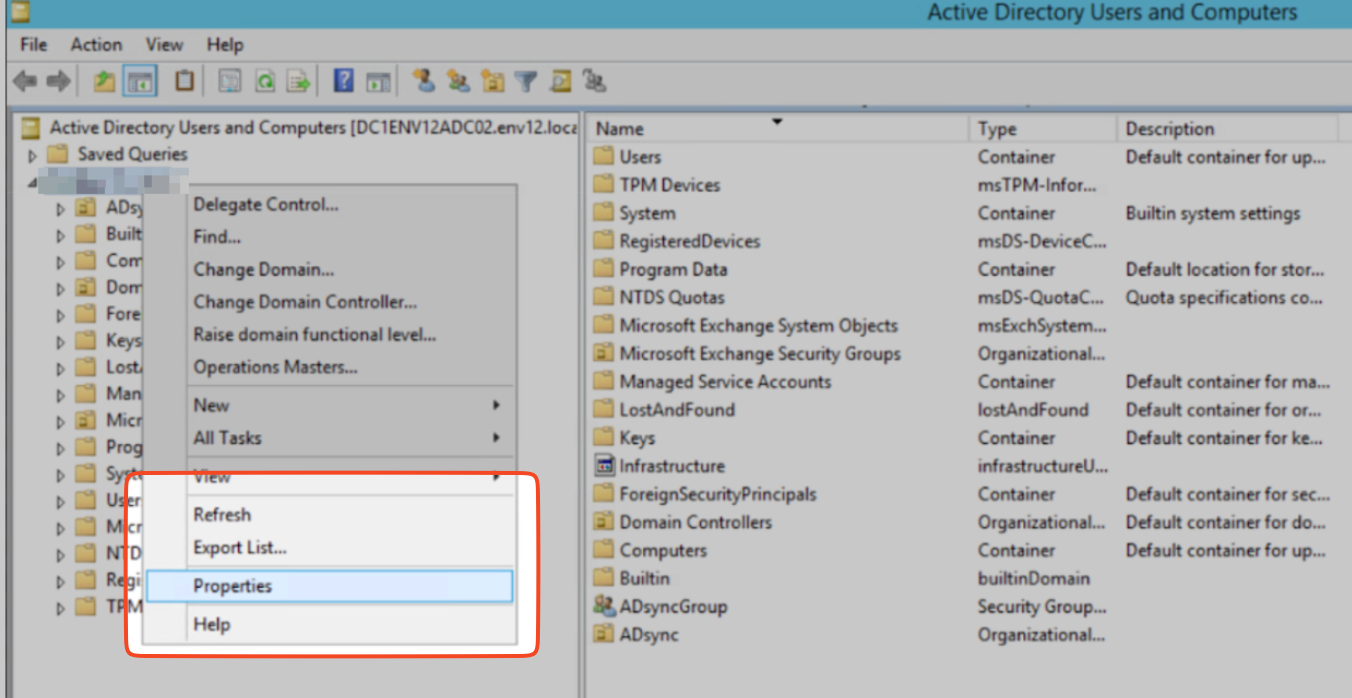 {width=70%}
 - Click the Security tab, usually located near the top of the Properties window.
-
Click Advanced which is located within the Security tab or near the bottom of the window.
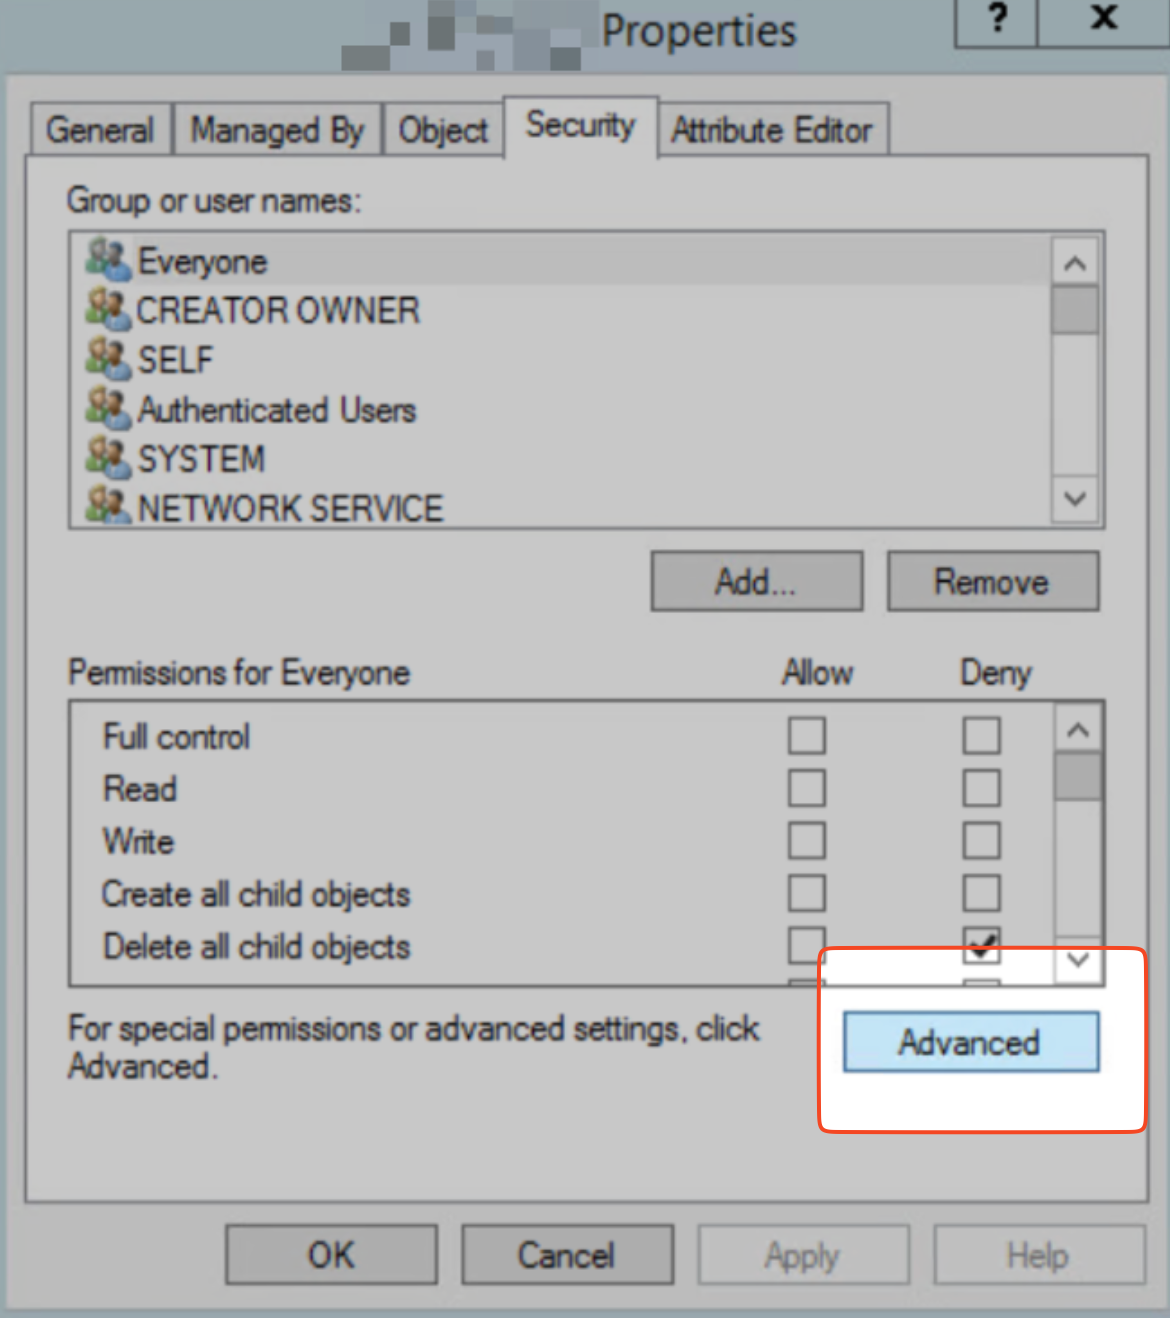 {width=70%}
 -
In the Advanced Security Settings window that opens, select the Auditing tab and click Add.
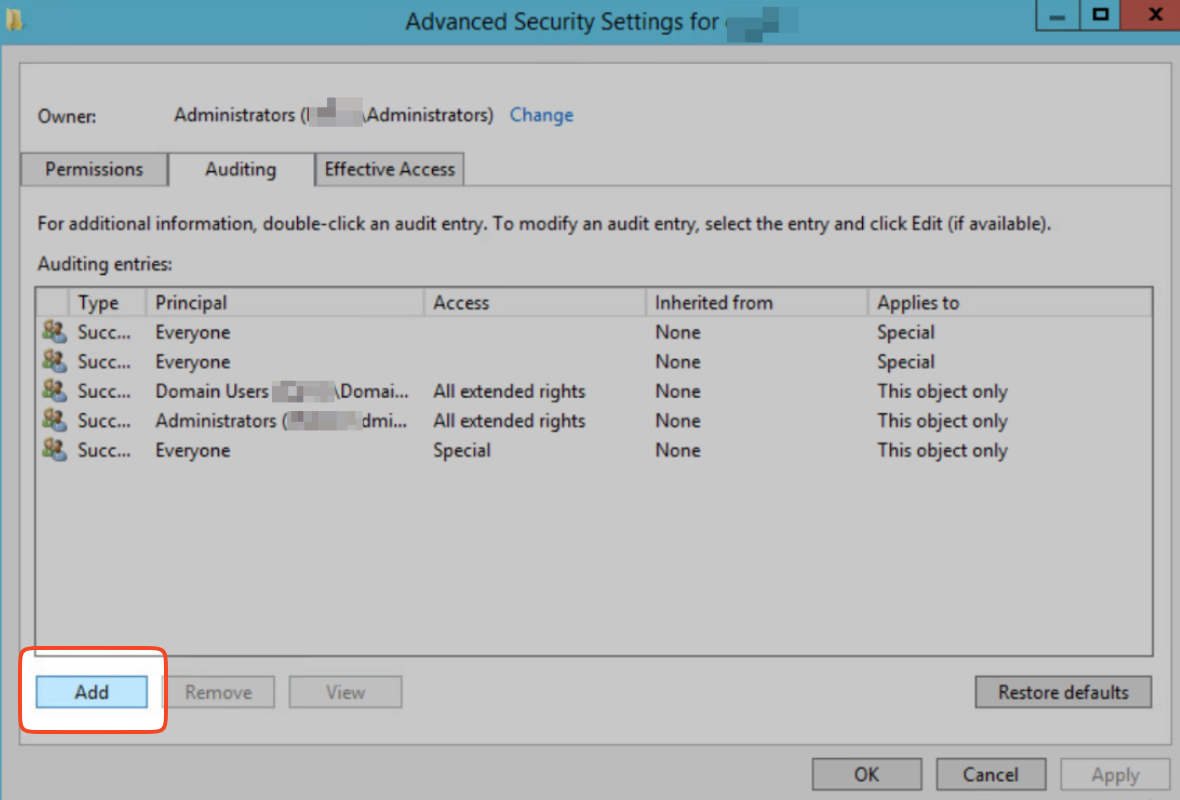 {width=70%}
 -
Click Select a principal.
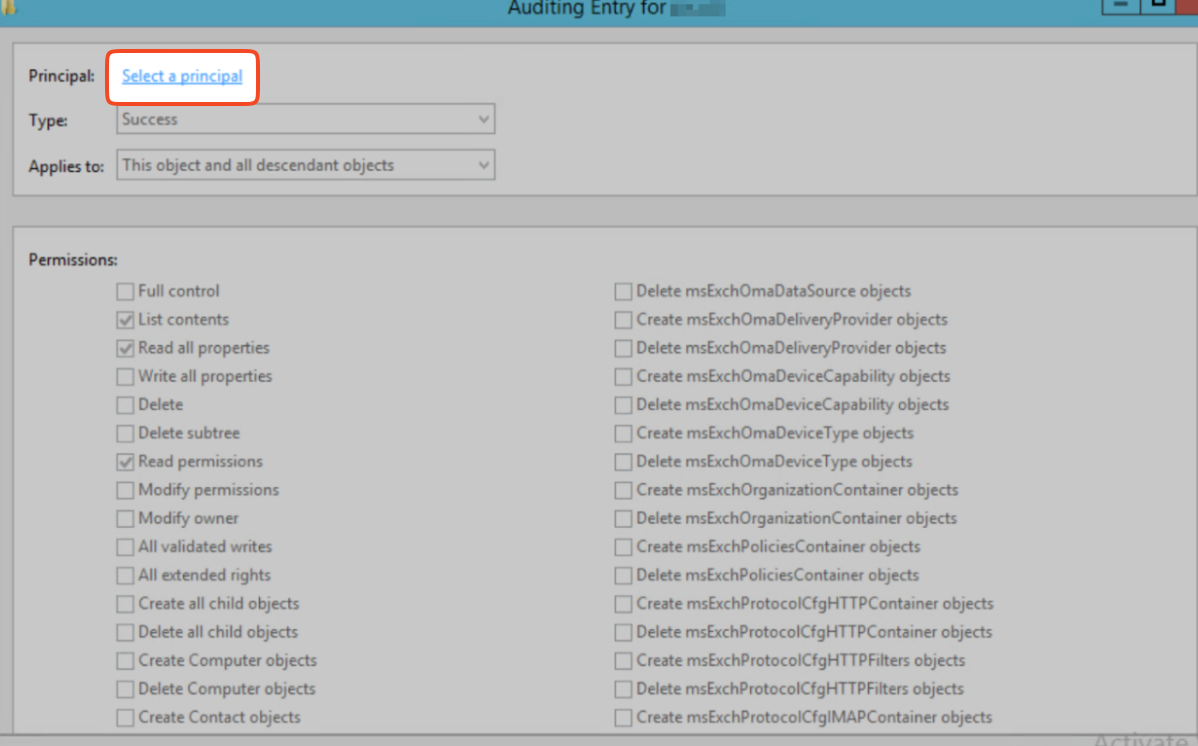 {width=70%}
 -
In the window that opens, under Enter the object name to select, type Everyone, click Check Names, and then OK.
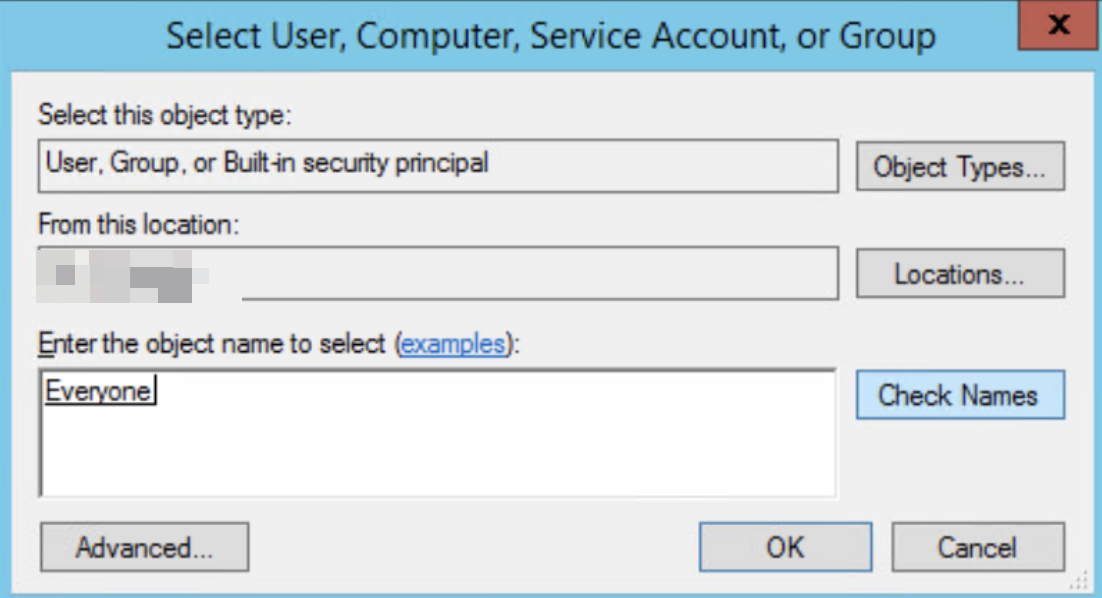 {width=70%}
 - In the Auditing Entry window, do the following:
- Type: To track only successful attempts, select Success.
-
Applies to: To monitor actions by users within this group and any subgroups, select Descendant User objects.
 {width=70%}
 -
Permissions: To remove any existing permissions from this audit entry, click Clear all.
 {width=70%}
 - Scroll up to Permissions to see view the list of permissions. Click the checkbox next to Full Control which automatically selects all the individual permissions below it.
-
Uncheck the boxes next to the following:
- List contents
- Read all properties
- Read permissions
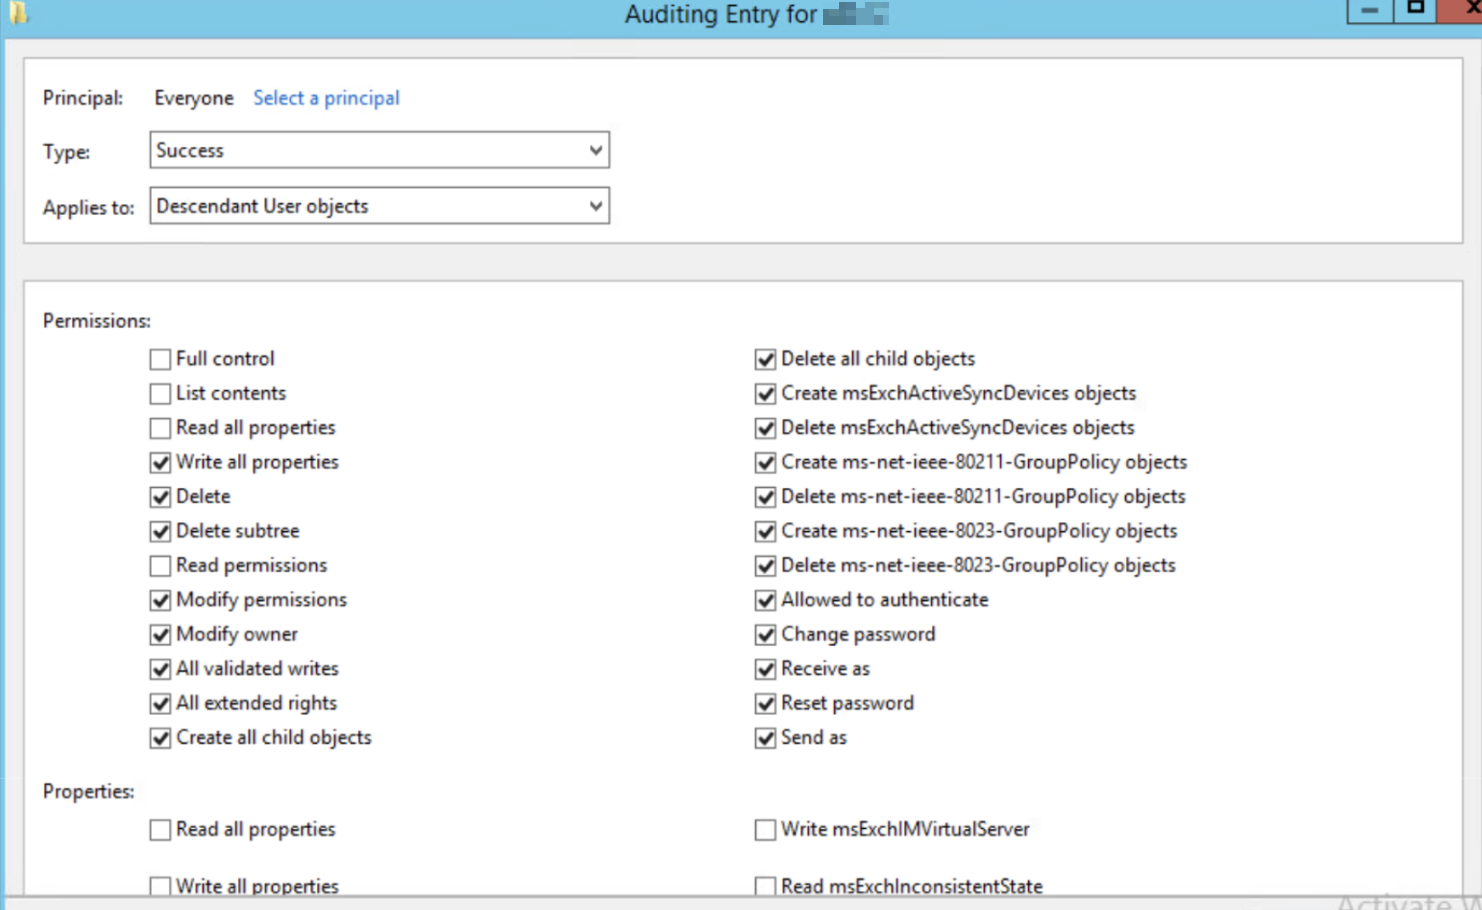 {width=70%}
 - Click OK to save the changes.
- Repeat step 11, with the following values in Applies to:
- Descendant Group Objects
- Descendant Computer Objects
- Descendant msDS-GroupManagedServiceAccount Objects
- Descendant msDS-ManagedServiceAccount Objects
-
Descendant msDS-DelegatedManagedServiceAccount Objects
Note
The Descendant msDS-DelegatedManagedServiceAccount Objects configuration is relevant only for Windows Server 2025.
Enable additional event logs using Event Viewer
For the following event IDs, the auditing setup is configured using the Windows Event Viewer. Access the Event Viewer through the search box in the Start menu.
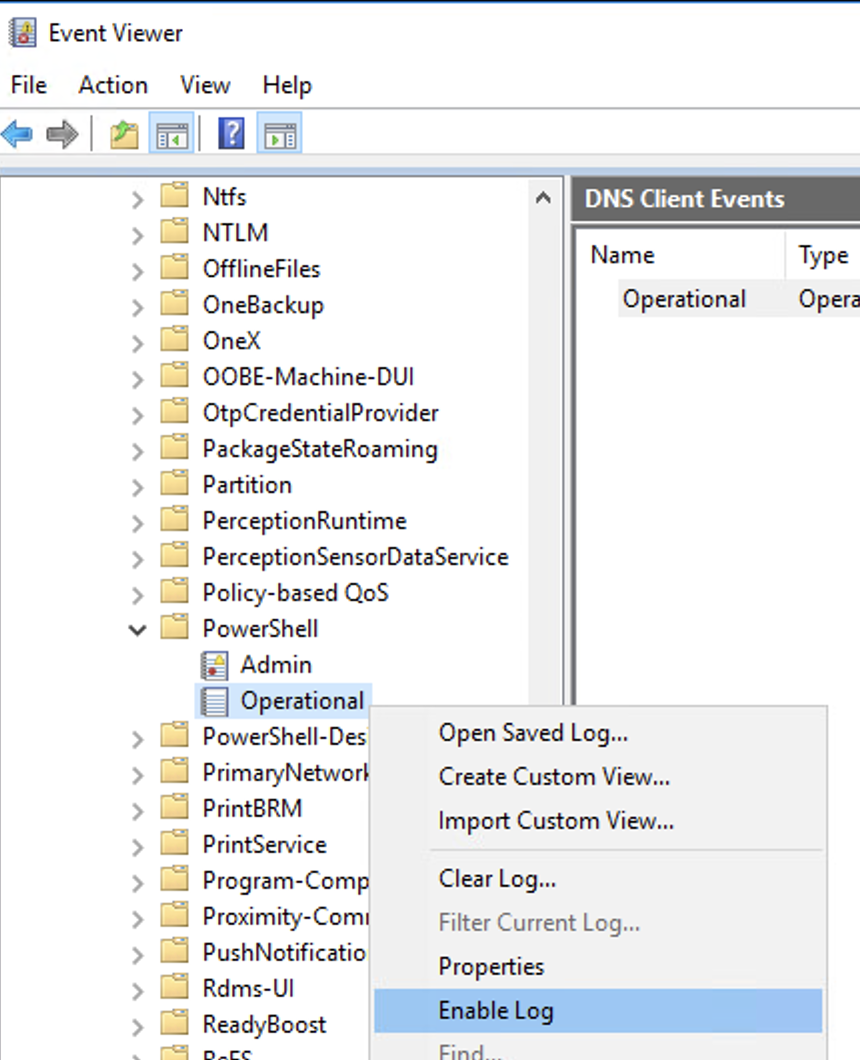
Event IDs 1511, 1518
In Event Viewer → Expand Applications and Services Logs → Microsoft → Windows → User Profile Service, right click Operational and select Enable Log.
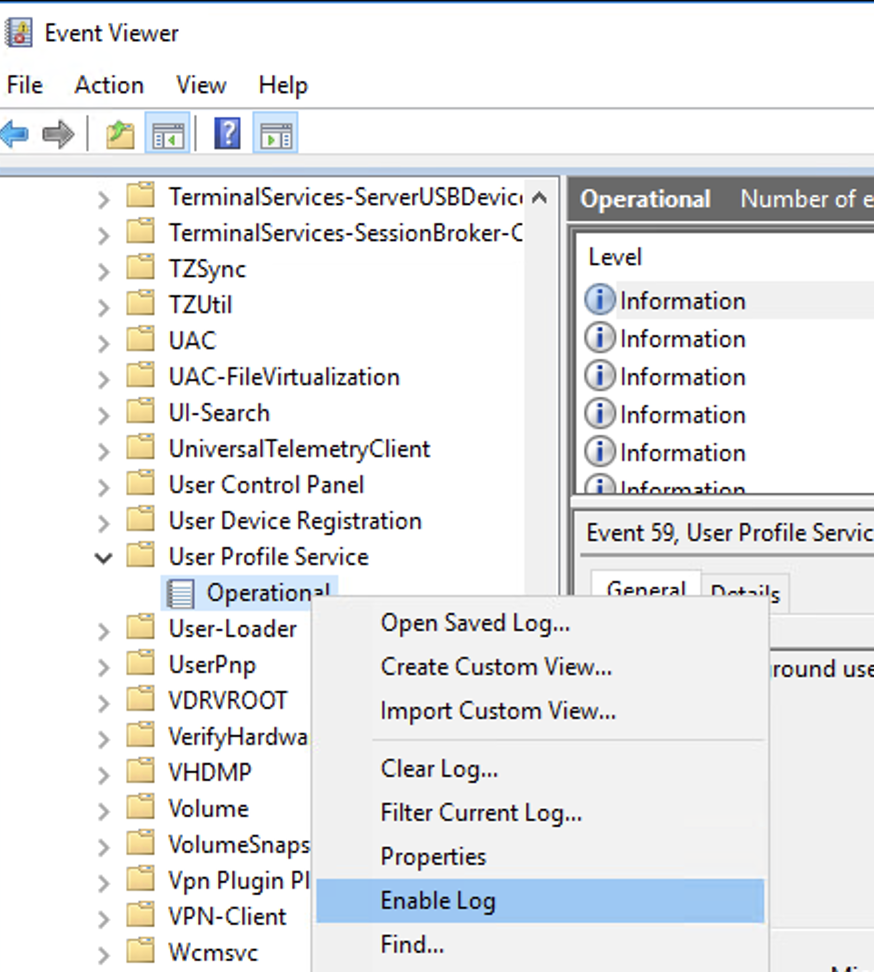
Event IDs 11, 70, 90
In Event Viewer → Expand Applications and Services Logs → Microsoft → Windows → CAPI2, right click Operational and select Enable Log.
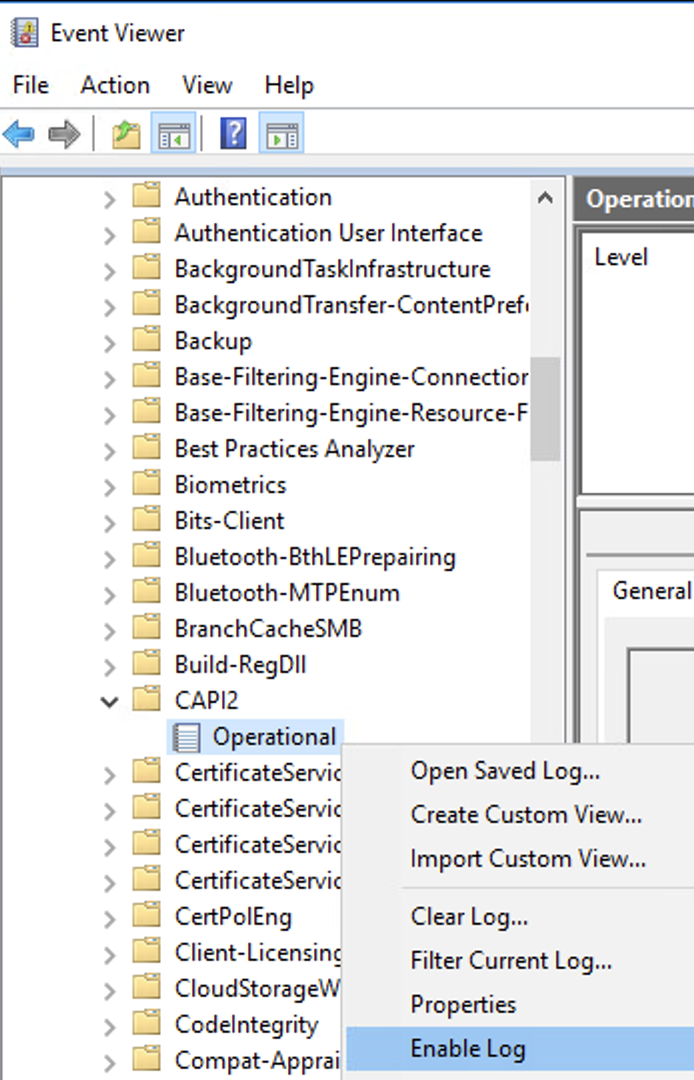
Event ID 3008
In Event Viewer → Expand Applications and Services Logs → Microsoft → Windows → DNS Client Events, right click Operational and select Enable Log.
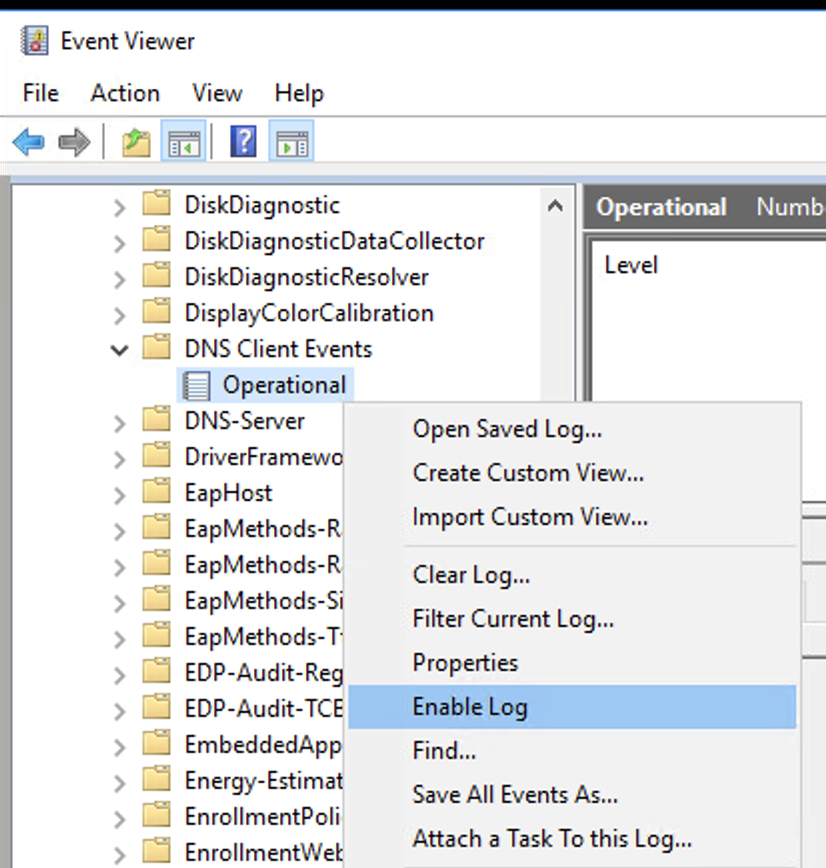
Event ID 2004
In Event Viewer → Expand Applications and Services Logs → Microsoft → Windows → DriverFrameworks-UserMode, right click Operational and select Enable Log.
Event IDs 4103, 4104, 4105, 4106
In Event Viewer → Expand Applications and Services Logs → Microsoft → Windows → PowerShell, right click Operational and select Enable Log.
Event IDs 1006, 1009, 1116-1119
In Event Viewer → Expand Applications and Services Logs → Microsoft → Windows → Windows Defender, right click Operational and select Enable Log.
Event ID 1024
In Event viewer → Application and Services Logs → Microsoft → Windows → TerminalServices-ClientActiveXCore → Microsoft-Windows-TerminalServices-RDPClient, right click Operational and select Enable Log.
Event IDs 2005, 2006, 2009, 2033
In Event Viewer → Expand Applications and Services Logs → Microsoft → Windows → Windows Firewall With Advanced Security → Firewall, right click Operational and select Enable Log.
Enable LDAP server events logging (1644)
You can enable LDAP server event logging using RegEdit or GPO.
Enable LDAP server events logging using RegEdit
Make the following changes on all LDAP servers in the domain for which you want to configure auditing.
- Log in as an administrator to a computer in the domain that you want to configure.
- In the Start menu, type regedit to open the Registry Editor.
-
Add the following values on the Domain controller registry.
[HKEY_LOCAL_MACHINE\SYSTEM\CurrentControlSet\Services\NTDS\Diagnostics] "15 Field Engineering"=dword:00000005 [HKEY_LOCAL_MACHINE\SYSTEM\CurrentControlSet\Services\NTDS\Parameters] "Expensive Search Results Threshold"=dword:00000001 "Inefficient Search Results Threshold"=dword:00000001 "Search Time Threshold (msecs)"=dword:00000001
Enable LDAP server events logging using GPO
- On a domain controller or a system with Remote Server Administration Tools (RSAT) installed, open the Group Policy Management Console (GPMC).
- Create a new Group Policy Object (GPO): Right-click on the domain or organizational unit (OU) where your domain controllers reside, then select Create a GPO in this domain, and Link it here.... Give it a descriptive name, e.g. Domain Controller Registry Settings.
- Edit the GPO.
-
Right-click on the newly created GPO and select Edit.
-
In the Group Policy Management Editor, navigate to Computer Configuration → Preferences → Windows Settings → Registry.
-
Add Registry Items: Right-click on Registry and select New → Registry Item.
-
Configure Registry Keys: For each of the registry keys you want to set, create a new Registry Item.
-
[HKEY_LOCAL_MACHINE\SYSTEM\CurrentControlSet\Services\NTDS\Diagnostics]
Create the following Registry item:
15 Field Engineering
- Action: Update
- Hive: HKEY_LOCAL_MACHINE
- Key Path: SYSTEM\CurrentControlSet\Services\NTDS\Diagnostics
- Value name: 15 Field Engineering
- Value type: REG_DWORD
- Value data: 5
| |
| ----------------------------------------------------------------------------------------------------------------------------------------------------------------------------------------------------------------------------------------------------------------------------------------------------------------------------------------------------- |
[HKEY_LOCAL_MACHINE\SYSTEM\CurrentControlSet\Services\NTDS\Parameters]
Create the following Registry items:
Expensive Search Results Threshold
- Action: Update
- Hive: HKEY_LOCAL_MACHINE
- Key Path: SYSTEM\CurrentControlSet\Services\NTDS\Parameters
- Value name: Expensive Search Results Threshold
- Value type: REG_DWORD
- Value data: 1
| |
| ----------------------------------------------------------------------------------------------------------------------------------------------------------------------------------------------------------------------------------------------------------------------------------------------------------------------------------------------------- |
Inefficient Search Results Threshold
- Action: Update
- Hive: HKEY_LOCAL_MACHINE
- Key Path: SYSTEM\CurrentControlSet\Services\NTDS\Parameters
- Value name: Inefficient Search Results Threshold
- Value type: REG_DWORD
- Value data: 1
| |
| ---------------------------------------------------------------------------------------------------------------------------------------------------------------------------------------------------------------------------------------------------------------------------------------------------------------------------------------------------- |
Search Time Threshold (msecs)
- Action: Update
- Hive: HKEY_LOCAL_MACHINE
- Key Path: SYSTEM\CurrentControlSet\Services\NTDS\Parameters
- Value name: Search Time Threshold (msecs)
- Value type: REG_DWORD
- Value data: 1
| |
| ----------------------------------------------------------------------------------------------------------------------------------------------------------------------------------------------------------------------------------------------------------------------------------------------------------------------------------------------------- |
- Close the Group Policy Management Editor.
- To link the GPO to the OU where your domain controllers reside, in Group Policy Management, right-click the OU, select Link an Existing GPO, then select the GPO you just created.\
- Force Group Policy Update: Force a Group Policy update using the
gpupdate /forcecommand on each domain controller or by restarting them.
Validate log collection for LDAP Server events
View the LDAP Server Events logs.
- From the Start menu, open Event Viewer.
- Go to Application and Services Logs → Directory Service.
- Filter for Event ID 1644.\
\
XDM fields for mapping authentication events
This section provides a comprehensive guide to mapping authentication events from various customer log sources to the XDM (Cortex Data Model) schema. Each relevant XDM field is detailed, including whether the field is mandatory or optional, the corresponding Authentication Story field , data type, and purpose, ensuring consistent data normalization essential for robust security analysis and threat detection.
The fields that are mandatory to map are listed below with an asterisk (*) beside them as these fields must be mapped to automatically create authentication stories for XDM identity data.
Note
For more information on the entire Cortex Data model (XDM) schema, see Cortex XSIAM Data Model Schema.
Mandatory fields
1. xdm.source.port*
Authentication Story Field: action_local_port
Type: integer
Requirement: Mandatory
Data Model Rule example:
xdm.source.port=to_integer(0)
2. xdm.target.ipv4*
Authentication Story Field: action_remote_ip
Type: string
Requirement: Mandatory
Note: Map a field that isn't a String or list. If there is no relevant field to map to the target IP, populate this field with an empty string ("").
Data Model Rule example:
xdm.target.ipv4 = ""
3. xdm.target.port*
Authentication Story Field: action_remote_port
Type: integer
Requirement: Mandatory
Data Model Rule example:
xdm.target.port=to_integer(0)
4. xdm.network.ip_protocol*
Authentication Story Field: action_network_protocol
Type: integer
Requirement: Mandatory
See full list of options for this enum in the XDM IP Protocol documentation.
Data Model Rule example:
xdm.network.ip_protocol=XDM_CONST.IP_PROTOCOL_TCP
5. xdm.event.type*
Authentication Story Field: dfe_labels
Type: string
Requirement: Mandatory
Description: Represents events related to authentication activity, such as login attempts, SSO sessions, and MFA challenges.
Required Value: Must contain "authentication"
Data Model Rule example:
xdm.event.type = if(eventType in ("user.authentication.sso", "user.session.start", "user.mfa.okta_verify.deny_push", "user.mfa.factor.update", "user.authentication.auth_via_mfa", "user.authentication.auth_via_AD_agent", "user.authentication.verify", "user.authentication.auth_via_radius", "user.authentication.auth_via_richclient", "system.push.send_factor_verify_push"), "authentication", "")
6. xdm.event.tags*
Authentication Story Field: dfe_labels
Type: array<string>
Requirement: Mandatory
Description: Represents events related to authentication activity, such as login attempts, SSO sessions, and MFA challenges.
Required Value: Must contain XDM_CONST.EVENT_TAG_AUTHENTICATION
Data Model Rule example:
xdm.event.tags = arraycreate(XDM_CONST.EVENT_TAG_AUTHENTICATION)
7. xdm.source.ipv4*
Authentication Story Field: action_local_ip
Type: string
Requirement: Mandatory
Description: Represents the external IPv4 address from which the user authenticated. This is the IP address observed by the identity provider or SaaS system when the authentication request was processed. It typically reflects the user’s public-facing network location, such as their home IP, office gateway, or VPN egress point.
Note
Do not map a static string, list, or empty string. You must map this field from the raw log field that best represents the actual source IP used in the authentication attempt. In cases where multiple IP fields are available, such as client_ip, source_ip, and original_client_ip, choose the field that captures the IP address from which the user initially triggered the authentication request - before any processing by proxies or intermediate systems.
8. xdm.event.operation*
Authentication Story Field: event_sub_type
Type: string
Requirement: Mandatory
Description: This field describes the type of authentication flow, such as a regular login or a multi-factor authentication (MFA) event. It helps standardize different event types from various sources into two clear categories - making detection logic easier to build, understand, and reuse across systems.
Supported values:
XDM_CONST.OPERATION_TYPE_AUTH_LOGIN: Login using only a passwordXDM_CONST.OPERATION_TYPE_AUTH_MFA: Login that involves multi-factor authenticationXDM_CONST.OPERATION_TYPE_AUDIT: Authorization, accounting, or policy evaluation.
Data Model Rule example: The following pseudocode is an example only, which must be modified to implement the logic in the correct syntax by the mapped data source to different event types.
xdm.event.operation =
if eventType IN ("authentication", "oauth2", "mfa", "mfa_challenge", "mfa_verify")
then XDM_CONST.OPERATION_TYPE_AUTH_MFA
else if eventType IN ("session", "access_request", "iwa", "ldap")
then XDM_CONST.OPERATION_TYPE_AUTH_LOGIN
else if is_null(eventType)
then null else to_string(eventType)
Note
There is no neutral member. Never blind-default to login; if the kind is genuinely unclear, leave the field unmapped. For logouts, leave this field unset to ensure logout events do not incorrectly inflate login metrics.
9. xdm.event.original_event_type*
Authentication Story Field: sso_event_type
Type: string
Requirement: Mandatory
Description: This field captures the original name or label of the event as it appears in the raw log source. It serves as a direct reflection of the source-specific event type and is essential for maintaining source context.
Example values:
user.authentication.sso(Okta – SSO authentication event)user.mfa.okta_verify.push.deny(Okta – MFA denied)user.session.start(Okta – Session initiated)microsoft.login.success(Azure AD – Successful login)microsoft.mfa.challenge.fail(Azure AD – MFA failure)google.sign_in.challenge(Google Workspace – Sign-in challenged)user.lockout(Generic – Account locked due to failed attempts)
10. xdm.auth.service*
Authentication Story Field: auth_service
Type: string
Requirement: Mandatory
Description: This field defines the role the system played in the authentication flow for this specific record.
Supported values:
- IDP: Use when the system validates the credential (such as Okta, Entra ID, Domain Controller).
- SP: Use when the system initiates the request and relies on another to validate (such as a relying-party app consuming SSO).
- Universal: Use when the source is NOT a known IdP provider (such as local accounts, TACACS+, RADIUS, device SSH).
Data Model Rule example for Okta:
if(eventType = "user.authentication.auth_via_AD_agent", "IDP", eventType = "user.authentication.auth_via_radius", "IDP", ..., eventType = "user.authentication.sso", "SP", null)
Note
Mapping should be done per event type. The same system could be an IDP in one event and an SP in another. NEVER use a service or protocol name like "Kerberos", "SSH", or "Login" in this field.
11. xdm.event.outcome*
Authentication Story Field: auth_outcome
Type: string (ENUM)
Requirement: Mandatory
Description: Specifies the final result of the authentication attempt. Use values such as OUTCOME_SUCCESS or OUTCOME_FAILURE only for events that definitively represent the conclusion of the authentication process, such as when access is explicitly granted or denied. Avoid assigning these values to intermediate steps that don’t reflect the outcome.
Supported values:
XDM_CONST.OUTCOME_SUCCESSXDM_CONST.OUTCOME_FAILED
Note
For more information on the event outcome constants in the Cortex Data Model, see XDM_CONST.OUTCOME.
Data Model Rule example logic:
if(res ~= "[Ss]uccess" OR res = "sent", XDM_CONST.OUTCOME_SUCCESS, res ~= "fail", XDM_CONST.OUTCOME_FAILED)
Note
Outcome is based on a conclusive event type reflecting the true end state of the authentication flow.Critical for the effectiveness of detection rules. Incorrect derivation can lead to missed detections or false positives.
12. xdm.source.user.upn*
Authentication Story Field: auth_identity
Type: string
Requirement: Mandatory
Description: Represents the user identity associated with the authentication or access event. This field must be populated using the User Principal Name (UPN) format. It cannot be left empty.
Using UPN as a normalized identity format ensures consistency across diverse identity providers, such as Azure AD, Okta, and on-prem AD, and authentication flows. It plays a central role in correlating activity across logs, enriching detections, and building an accurate authentication story across systems.
Example value: jane.doe@company.com
Data Model Rule implementation: If the raw identity is a bare username, synthesize the UPN format: if(tmp_username contains "@", tmp_username, tmp_username != null, concat(tmp_username, "@localhost")).
Optional fields
Outcome details
13. xdm.event.outcome_reason
Authentication Story Field: auth_outcome_reason_category
Type: string
Requirement: Optional
Description: Specifies a standardized and descriptive reason for the outcome of an authentication or access-related event. This field offers detailed context beyond a simple success or failure result and is essential for accurate risk assessment, efficient triage, and effective incident response.
Supported values:
user_does_not_existbad_credentialsaccount_expired_or_disabledaccount_lockedfailed_loginauth_policy_access_violationmfa_failuremfa_expireduser_rejectuser_cancelledOTHERNOT_SPECIFIED
Required action: Explicit mapping logic is required between the raw event fields that contain outcome/error messages, such as get_reason and debug_data_error_code, and this canonical field. Mapping must normalize provider-specific strings or error codes into one of the supported values.
Data Model Rule example: The following pseudocode is an example only, which must be modified to implement the logic in the correct syntax.
xdm.event.outcome_reason = if( get_reason ~= "UNKNOWN_USER", "user_does_not_exist",
get_reason ~= "Login denied. No matching user", "user_does_not_exist",
get_reason ~= "INVALID_CREDENTIALS", "bad_credentials", debugdata_errorcode ~= "1326", "bad_credentials",
get_reason ~= "account is expired", "account_expired_or_disabled",
get_reason ~= "USER_ACCOUNT_EXPIRE", "account_expired_or_disabled", debugdata_errorcode IN ("1331", "1793"), "account_expired_or_disabled",
get_reason ~= "account is locked", "account_locked",
get_reason ~= "LOCKED_OUT", "account_locked",
get_reason ~= "Login failed", "failed_login",
get_reason ~= "PASSWORD_BASED_LOGIN_DISALLOWED", "auth_policy_access_violation",
get_reason ~= "login denied", "auth_policy_access_violation",
get_reason ~= "VERIFICATION_ERROR", "mfa_failure",
get_reason ~= "DEL_AUTH_TIMEOUT", "mfa_expired",
get_reason ~= "User rejected Okta push verify", "user_reject",
get_reason ~= "Login aborted", "user_cancelled",
get_reason ~= "NOT_SPECIFIED", "OTHER")
Authentication identity and context
14. xdm.event.description
Authentication Story Field: sso_display_message
Type: string
Requirement: Optional
Description: Provides a human-readable summary describing the nature of the authentication event. This value is typically derived from the source system's descriptive message and is intended to offer clear context for analysts during monitoring and investigations.
Example values:
“A push was sent to a user for verification”"User single sign on to app”“Authentication of user via MFA”
Device and authentication method
15. xdm.source.host.device.id
Authentication Story Field: agent_id
Type: string
Requirement: Optional
Description: This field represents the unique identifier of the device that initiated or is associated with the current authentication event.
The value should remain consistent per device over time and be mapped from the most reliable source-specific field, such as device ID, machine ID, or equivalent. If there isn't a sufficient device ID field, the alternative will be to map the IP address that initiated the authentication (same as xdm.source.ipv4).
16. xdm.source.host.hostname
Authentication Story Field: auth_device_name
Type: string
Requirement: Optional
Description: Represents the host/device name associated with the authentication event that initiated or is responsible for authentication events.
17. xdm.logon.type
Authentication Story Field: auth_is_interactive
Type: string
Requirement: Optional
Description: Represents the type of logon associated with the authentication event, with a focus on distinguishing between interactive (user-driven) and non-interactive (system or service-based) activity. This distinction is important for behavioral analysis, risk scoring, and threat detection.
Common values:
XDM_CONST.LOGON_TYPE_INTERACTIVE: Indicates a user is interactively using the machine, such as logging in through a terminal session, remote shell, or console.XDM_CONST.LOGON_TYPE_SERVICE: Indicates a service-type logon, such as Windows service, automations, and application tokens, where the account must have the service logon privilege.
Note
These are the most common values, but other logon types also exist. For a complete list, see XDM_CONST.LOGON_TYPE.
18. xdm.event.operation.sub_type
Authentication Story Field: auth_method
Type: string
Requirement: Optional
Description: Specifies a standardized and descriptive reason for the outcome of an authentication or access-related event. This field offers detailed context beyond a simple success or failure result and is essential for accurate risk assessment, efficient triage, and effective incident response.
Required action: You must define explicit mapping logic between the raw field in the source log that contains the authentication method information, such as authMethod, authenticationFlow.type, and factorUsed, and this XDM field.
This mapping should translate raw values into one of the allowed sub-category listed below.
Data Model Rule example: The following pseudocode is an example only, which must be modified to implement the logic in the correct syntax.
if(lowercase_auth_method = "password", "password", lowercase_auth_method = "otp_sms", "sms", lowercase_auth_method = "push", "application", lowercase_auth_method = "yubikey", "hardware_token", lowercase_auth_method = "trusted_device", "trusted_login", lowercase_auth_method = "sso", "Generic SSO", lowercase_auth_method = "email", "email", lowercase_auth_method = "voice", "voice", lowercase_auth_method = null, null, to_string(lowercase_auth_method))
Supported values (per applicable event type):
hardware_token: Physical device-based authentication, such as RSA token or YubiKey.password: Standard password-based login.application: Action approved via an authenticator app, such as push notification.email: Verification through email link or one-time code.sms: SMS-based one-time password (OTP) or verification.voice: Verification via voice call.trusted_login: Login from a known or previously trusted device.Generic SSO: Federated authentication using a standard single sign-on provider.null: No sub-type specified or not applicable.
User identity attributes
19. xdm.source.user.identifier
Authentication Story Field: auth_identity_id
Type: string
Requirement: Optional
Description: This field should contain a unique and consistent identifier for the user associated with the event.
Example values:
a1b2c3d4-e5f6-7890-ab12-3456789cdef0: Directory object GUID, such as Azure AD object ID.S-1-5-21-3623811015-3361044348-30300820-1013: Windows Security Identifier (SID).
Best Practice: Populate with the most persistent and canonical user identifier available from the identity source.
20. xdm.source.user.username
Authentication Story Field: auth_identity_display_name
Type: string
Requirement: Optional
Description: User Display Name Field. This field should contain the user's name in a human-readable format, typically including the first and last name, such as John Smith.
21. xdm.source.user.user.type
Authentication Story Field: auth_normalized_user.identity_type
Type: string
Requirement: Optional
Description: Indicates the type of identity associated with the authentication event.
Supported values (Constants):
XDM_CONST.USER_TYPE_REGULAR ("USER")XDM_CONST.USER_TYPE_SERVICE_ACCOUNT ("SERVICE ACCOUNT")- XDM_CONST.USER_TYPE_MACHINE_ACCOUNT ("MACHINE ACCOUNT")
Example mapping logic: The following pseudocode is an example only, which must be modified to implement the logic in the correct syntax.
if(actor_type in("User"), XDM_CONST.USER_TYPE_REGULAR, actor_type
in("SystemPrincipal"),
XDM_CONST.USER_TYPE_SERVICE_ACCOUNT,actor_type in("IP address"),
XDM_CONST.USER_TYPE_MACHINE_ACCOUNT, to_string(actor_type))
Note
For more information, see XDM_CONST.USER_TYPE.
22. xdm.auth.privilege.level
Authentication Story Field: auth_normalized_user.privilege_level
Type: string
Requirement: Optional
Description: Represents the privilege level or role of the user during the authentication event, such as admin, user, or guest. Used to assess risk and impact. Should reflect a canonical privilege level.
Supported values (Constants):
XDM_CONST.PRIVILEGE_LEVEL_GUESTXDM_CONST.PRIVILEGE_LEVEL_USERXDM_CONST.PRIVILEGE_LEVEL_ADMINXDM_CONST.PRIVILEGE_LEVEL_SYSTEM
Example mapping logic: The following pseudocode is an example only, which must be modified to implement the logic in the correct syntax.
if(lowercase_user_type = "user", XDM_CONST.PRIVILEGE_LEVEL_USER, lowercase_user_type = "guest", XDM_CONST.PRIVILEGE_LEVEL_GUEST, lowercase_user_type = "admin", XDM_CONST.PRIVILEGE_LEVEL_ADMIN, lowercase_user_type = "system", XDM_CONST.PRIVILEGE_LEVEL_SYSTEM, lowercase_user_type = null, null, to_string(lowercase_user_type))
Note
For more information, see XDM_CONST.PRIVILEGE_LEVEL.
Target and session context
23. xdm.target.resource.id
Authentication Story Field: auth_target_id
Type: string
Requirement: Optional
Description: Represents the unique identifier of the accessed resource or application during the authentication event, such as application ID or internal resource ID.
24. xdm.target.resource.name
Authentication Story Field: auth_target
Type: string
Requirement: Optional
Description: Provides the readable name of the resource or application accessed during the event. This should reflect the logical service or platform the user interacted with.
Example values: ״Exchange", ״SharePoint״, ״ServiceNow״, ״HR Portal״, ״Okta Admin Portal״
25. xdm.source.user.agent
Authentication Story Field: action_user_agent
Type: string
Requirement: Optional
Description: Captures the full user-agent string from the client initiating the authentication request. Typically includes information about the browser, operating system, device type, and version details.
Example values: “Mozilla/5.0 (Windows NT 10.0; Win64; x64) AppleWebKit/537.36 (KHTML, like Gecko) Chrome/123.0.6312.86 Safari/537.36”
26. xdm.network.session_id
Authentication Story Field: sso_debug_data.session_id
Type: string
Requirement: Optional
Description: Represents the session identifier associated with the user interaction. This value is typically issued by the application or identity platform and is used to group multiple related actions or requests made by the same user or device within a defined time window, commonly referred to as a session.
These can include login, token refresh, or other events that occur as part of a continuous authenticated interaction.
Example use cases:
- Tracking session duration
- Linking session start and end events
- Grouping multiple MFA prompts within a single login session
Source location
27. xdm.source.location.city
Authentication Story Field: action_location.city
Type: string
Requirement: Optional
Description: Represents the city associated with the source IP address.
28. xdm.source.location.country
Authentication Story Field: action_location.country
Type: string
Requirement: Optional
Description: Identifies the country where the authentication request originated, based on the source IP address.
Example values: “US,“ “IL“, “DE“, “FRANCE”
29. xdm.source.location.region
Authentication Story Field: action_location.region
Type: string
Requirement: Optional
Description: Captures the region, province, or state associated with the source IP address.
Example values: “California“, “Bavaria“, “Tel Aviv“
30. xdm.source.location.latitude
Authentication Story Field: action_location.latitude
Type: float
Requirement: Optional
Description: Represents the latitude coordinate of the source IP address's estimated physical location.
Example values: “40.7128”, “48.8566”
31. xdm.source.location.longitude
Authentication Story Field: action_location.longitude
Type: float
Requirement: Optional
Description: Represents the longitude coordinate of the source IP address's estimated physical location.
32. xdm.source.location.continent
Authentication Story Field: action_location.continent
Type: string
Requirement: Optional
Description: Indicates the continent associated with the source IP's location, such as Europe, Asia, or North America.
33. xdm.source.location.timezone
Authentication Story Field: action_location.timezone
Type: string
Requirement: Optional
Description: This enables time-based correlation between user activity and local context.
Example values: "Asia/Jerusalem", "America/New_York", "UTC"
Client device and operating system
34. xdm.source.host.device.category
Authentication Story Field: auth_client_type
Type: string
Requirement: Optional
Description: Represents the operating system family of the device or client that initiated the event.
Supported values:
“Computer”: A desktop or laptop device.“Mobile”: A mobile phone or smartphone.“IOT”: An Internet of Things device, such as smart TV or smart speaker.“Tablet”: A tablet computing device.
35. xdm.source.application.name
Authentication Story Field: agent_extra_data.browser
Type: string
Requirement: Optional
Description: Represents browser vendor used during the authentication event.
Example values: “Chrome“, “Firefox“, “Safari“, “Edge“
36. xdm.source.application.version
Authentication Story Field: agent_extra_data.browser_version
Type: string
Requirement: Optional
Description: Represents the version of the browser used during the authentication event.
Example values: “Chrome 113“, “Firefox 102“, “Safari 16.3“
37. xdm.source.host.os.family
Authentication Story Field: agent_os_type
Type: string
Requirement: Optional
Description: Provides a normalized, high-level abstraction of the operating system associated with the source host. This field enables consistent behavior across different data sources.
Required action: You must explicitly define a mapping logic between the raw field in the original data source that contains the OS information, such as device.os_name, and normalize into the XDM field.
Common values (Constants):
XDM_CONST.OS_FAMILY_WINDOWSXDM_CONST.OS_FAMILY_MACOSXDM_CONST.OS_FAMILY_LINUXXDM_CONST.OS_FAMILY_ANDROIDXDM_CONST.OS_FAMILY_IOS
Note
For more information, see XDM_CONST.OS_FAMILY.
Example mapping logic: The following pseudocode is an example only, which must be modified to implement the logic in the correct syntax.
if raw_event.host_os contains "windows" → XDM_CONST.OS_FAMILY_WINDOWS if raw_event.host_os contains "mac" → XDM_CONST.OS_FAMILY_MACOS if raw_event.host_os contains "linux" → XDM_CONST.OS_FAMILY_LINUX if raw_event.host_os contains "android" → XDM_CONST.OS_FAMILY_ANDROID if raw_event.host_os contains "ios" → XDM_CONST.OS_FAMILY_IOS
Data Model Rule example logic:
if(os contains "windows", XDM_CONST.OS_FAMILY_WINDOWS, os contains "mac", XDM_CONST.OS_FAMILY_MACOS, ...)
38. xdm.source.host.os
Authentication Story Field: agent_os_sub_type
Type: string
Requirement: Optional
Description: This field captures the raw operating system information reported by the source host's telemetry.
Example values: “Microsoft Windows NT 10.0“, “Microsoft Windows NT 6.1 (Windows 7“), “Darwin Kernel Version 20.6.0“
Time and request correlation
39. xdm.session.context.id
Authentication Story Field: auth_correlation_id
Type: string
Requirement: Optional
Description: Represents a correlation ID tied to a single authentication or access-related request. This ID is generated by the identity provider, such as Azure AD or Okta, and used to link events belonging to a single logical transaction, such as an SSO login flow or token issuance.
Example values: ”25423545-6364-5423-3232-42343760”
Note
While xdm.network.session_id aggregates multiple user actions within a broader session window. xdm.session.context.id is used to correlate events that belong to a single authentication request or transaction.
40. xdm.time
Authentication Story Field: generatedTime
Type: timestamp
Description: Represents the timestamp of when the event occurred. This field is essential for event sequencing and correlation. This field is automatically mapped.
Example values:
- ”2025-05-26T14:45:32Z” (UTC format ISO 8601) - “2025-05-26T14:45:32.123Z “ (UTC with millisecond precision), -“2025-05-26 14:45:32” (Standard datetime format non-ISO)
Cortex Network Scanner OSS
The following sections display Open Source Software (OSS) licenses used by the Cortex Network Scanner.
Tools and software
Golang Packages
Fair Usage policy for Cortex XSIAM
To ensure the reliability, efficiency, and availability of Cortex XSIAM for all the users, we expect our customers to use it fairly, reasonably, and in a manner that does not adversely impact the product’s overall system performance. Cortex XSIAM offers various features for connecting external resources to Cortex XSIAM, including without limitation, frequency and/or volume of data ingestion, number of connected data sources, and API usages. Overuse or misuse of these features may adversely affect the reliability, efficiency, and/or availability of Cortex XSIAM.
You are therefore required to utilize a reasonable volume of data ingestion, number of connected data sources, and API usage, based on your number of cloud assets protected by Cortex XSIAM (“Fair Usage Policy”). If, in our sole and reasonable discretion, we determine that your usage of Cortex XSIAM violates this Fair Usage Policy, we reserve the right to take appropriate action regarding such use, including without limitation, limiting the frequency and/or volume of data ingestions, limiting the number of connected data sources, and/or limiting the API usage, to bring your usage of Cortex XSIAM in alignment with this Fair Usage policy.
Migrating to a new Broker VM image
Learn more about migrating to the latest broker VM image
Following is the recommended process for migrating to the latest Broker VM image installed with Debian 13. This process ensures that you can upgrade to the latest supported Broker VM versions and continue to benefit from new features.
These procedures are recommended for all brokers that were deployed with a Broker VM image, downloaded prior to February 22, 2026 (installed with Ubuntu 20.04 or earlier).
Standalone Broker VM
You can migrate a standalone Broker VM in your environment to the latest broker VM image.
How To
- Install and configure a new Broker VM using the new image from your tenant. For detailed instructions, see Set up and configure Broker VM.
- Import the Broker VM configuration from an old broker to the new broker with the new image. For more information, see Import Broker VM Configuration.
-
During the import, use the option to shutdown the old broker (selected by default).
Note
The shutdown process can take up to 10 minutes while the broker offloads its data cache.
-
- Update settings to keep receiving logs from external sources (Syslog, Netflow, and WEC) using the new broker. Use one of the following options:
- (Recommended) Option 1: Change the IP address of the new broker to the IP address of the old broker.
- Select Settings → Configurations → Data Broker → Broker VMs.
- In the Broker VMs table, right-click the new broker VM, and select Configure.
- In the Network Interfaces section, edit the IP address by selecting the pencil icon.
- Click Save.
- Option 2: Update your network sources to send messages to the IP address of the new broker.
- Update your network devices to send Syslog messages to the IP address of the new broker.
- Update your network devices to send Netflow messages to the IP address of the new broker.
- Update the DNS record of the old broker FQDN to point to the IP address of the new broker.
- (Recommended) Option 1: Change the IP address of the new broker to the IP address of the old broker.
- (Optional) Remove the old broker from your tenant.
- (Optional) Delete the old Broker VM from your hypervisor infrastructure.
Broker VM high availability cluster node
You can migrate a broker node in a High Availability (HA) cluster to the latest broker VM image.
How To
-
Install and configure a new Broker VM using the new image from your tenant. For detailed instructions, see Set up and configure Broker VM.
Remember to perform the following if applicable:
- Add SSL Server Certificates to the new broker.
- Add Trusted CA Certificate to the new broker.
- Configure your NTP servers for the new broker.
- Add the new broker to the cluster. For instructions, see Add Broker VM to cluster.
- Update your Load Balancer configuration to send logs to the new cluster node.
- Shutdown the old cluster node that you are replacing.
- (Optional) Update your Load Balancer configuration to stop sending logs to the old cluster node.
- (Optional) Remove the old Broker VM from your tenant.
- (Optional) Delete the old Broker VM from your hypervisor infrastructure.