Threat Intel Dashboard ↗
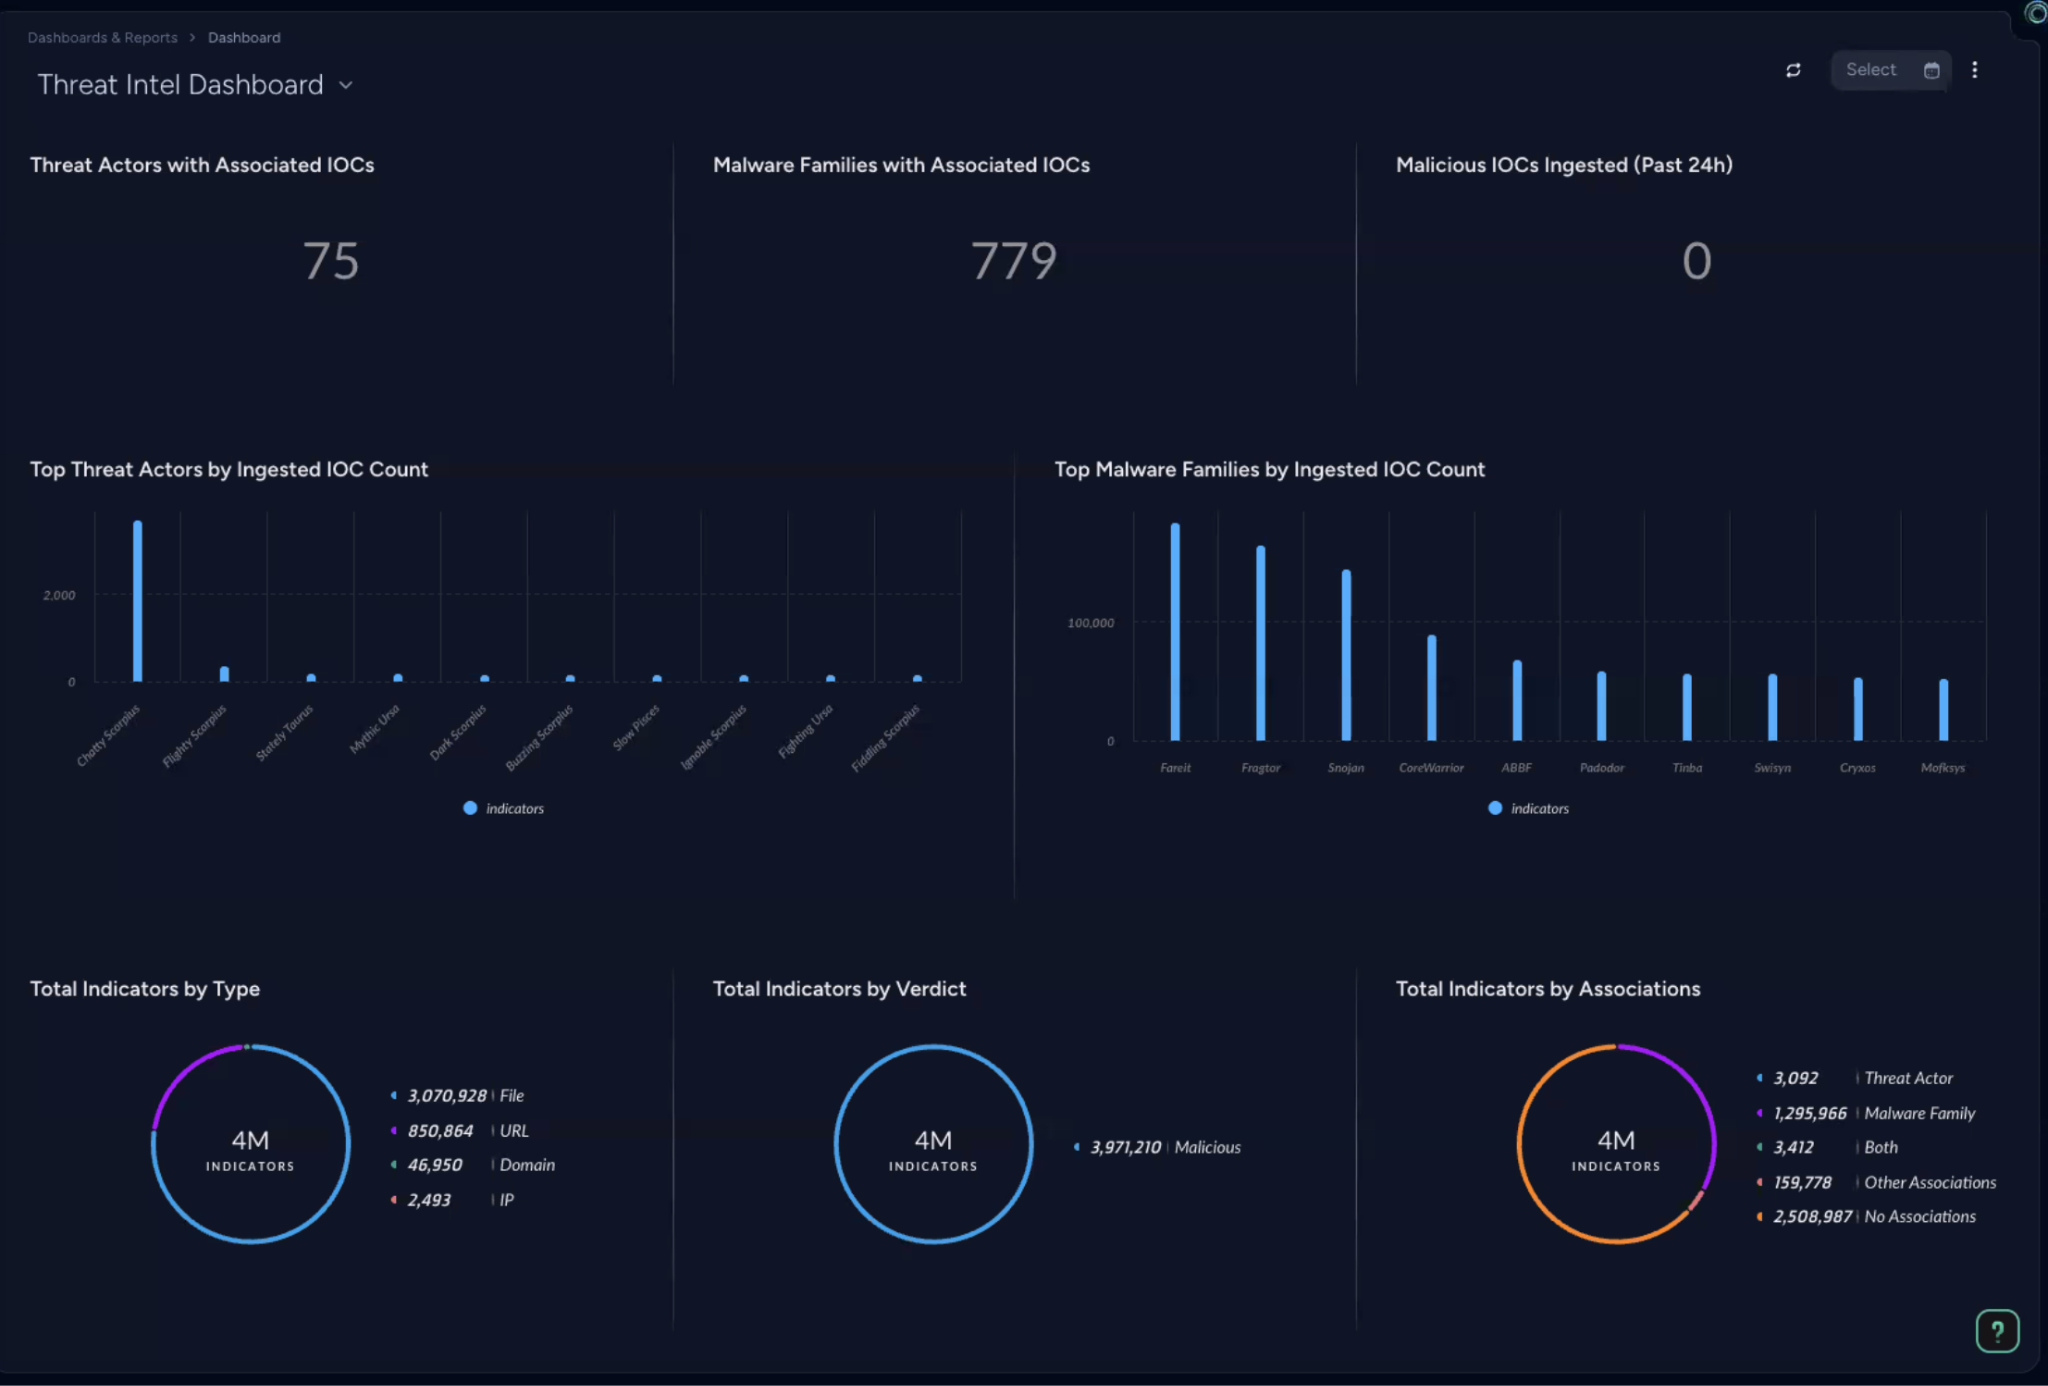
The Threat Intel Dashboard visualizes threat intelligence data, such as threat objects and indicators, within your environment to help you understand data distribution and identify trends.
You can use the dashboard as provided or clone and modify it to suit your needs.
Accessing the dashboard
To access the dashboard, go to Threat Management → Threat Intelligence → Dashboard.
Alternatively, you can access it from Dashboards & Reports → Dashboard. From the dashboard header, a menu lists all available predefined and custom dashboards. Find the Threat Intel Dashboard dashboard on that list and select it.
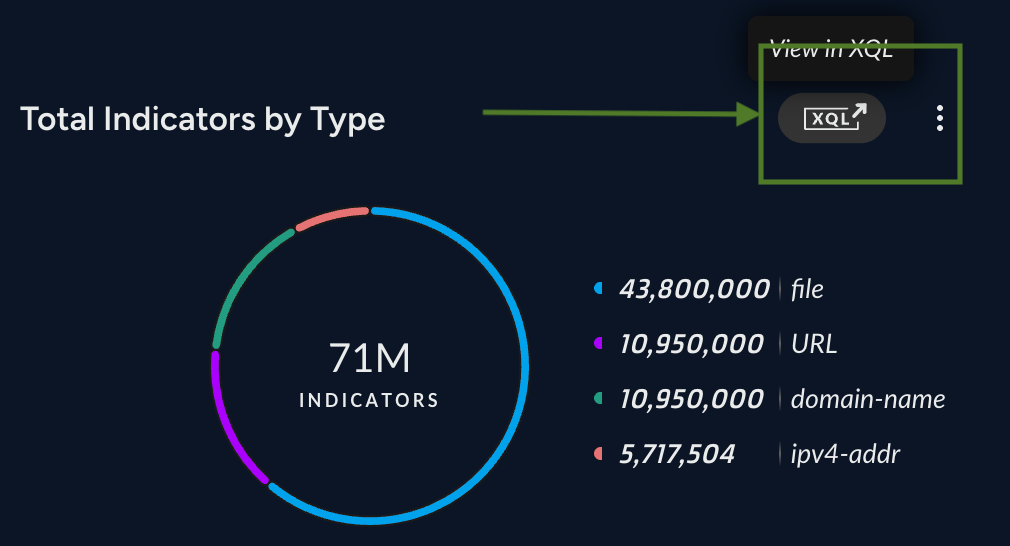
If you position the cursor over a specific dashboard widget, you can access the related XQL query by selecting the XQL link in the top-right corner of the widget:
Dashboard content
The Threat Intelligence Dashboard serves as a comprehensive overview of Unit 42 threat intelligence data, helping you understand data distribution and identify trends.
The dashboard starts with a high-level overview of ingestion health and data distribution to ensure all streams from Unit 42 remain active.
As you move down, the data becomes increasingly granular. The second row breaks down top threat actors and malware families by specific IOC counts, while the third row expands the scope to provide a holistic view of indicators across the entire environment.
These categories are separated because file-based data typically arrives in much larger volumes than network traffic data, and each represents a distinct technical domain—one focused on file processes and the other on network communication.
Related links
For general information about dashboards, see Monitor dashboards and reports.