Create a dashboard ↗
Use the following high-level workflow to create and distribute a dashboard, guiding you from initial setup through layout design and distribution.
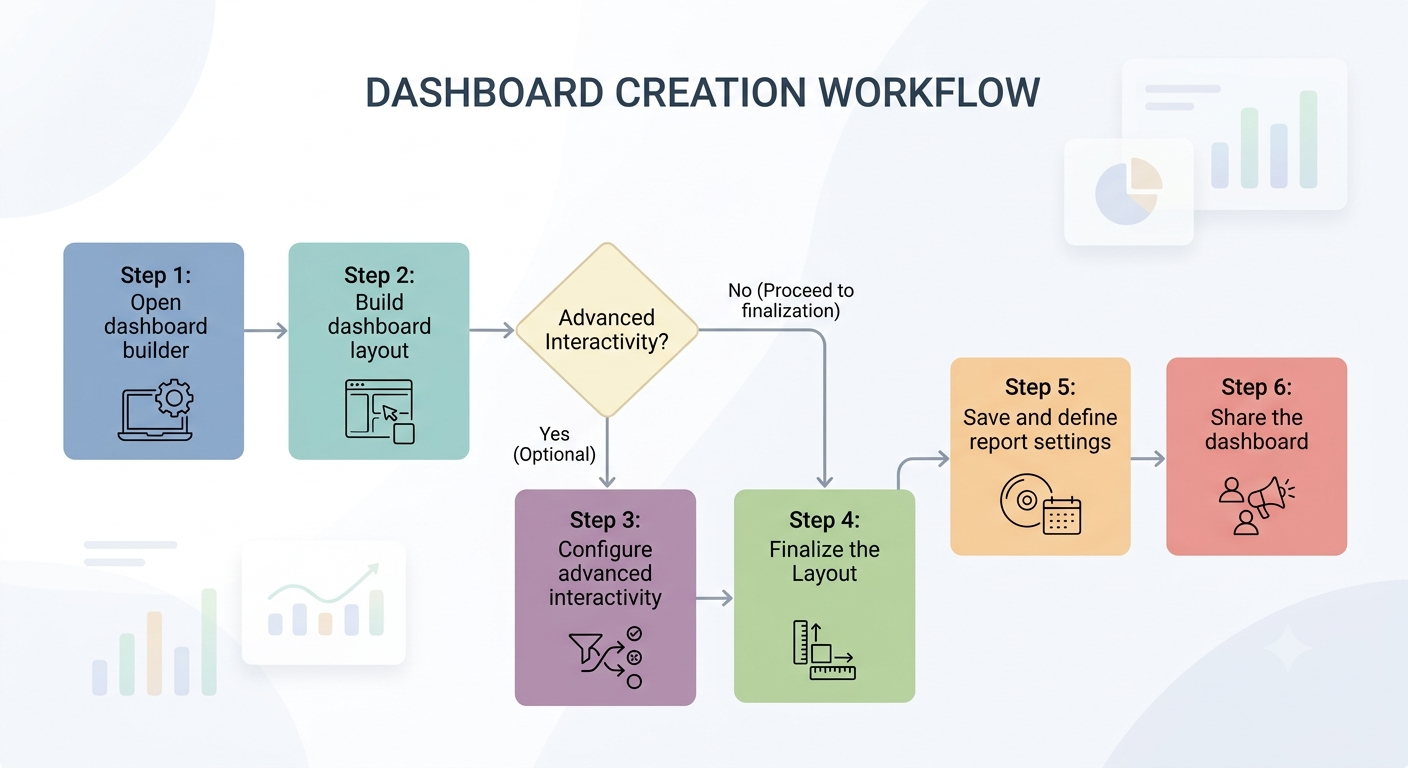
Open the dashboard builder
Depending on your starting point, open the dashboard builder as follows:
- Build a dashboard from scratch: Go to Dashboards & reports > Dashboard Manager and click Create dashboard.
- Use a template: Go to Dashboards & reports > Dashboard Manager and click Create dashboard. In the dashboard builder, click Browse templates to see the available options.
- Duplicate an existing dashboard: In the Dashboard Manager, right-click a dashboard and click Duplicate. Then locate the newly duplicated dashboard and Edit it to make changes. For more information about which dashboards can be duplicated, see Access and sharing cheat sheet.
Build your dashboard layout
- Add or remove widgets from your canvas: Drag widgets directly onto the canvas from the Widget Library:
-
Predefined Widgets: Search the Widget library (filter by Owner, Category, Chart type, or data source) and drag your selected widgets onto the canvas. Click on a widget to see a graphical preview and configuration details.
Tip: To find widgets that can be modified, select the Editable widget only option. These widgets can be duplicated and edited to suit your specific needs without starting from scratch.
-
Custom Widgets: If the library does not contain the widgets you require, you can create custom widgets using XQL queries, scripts, or generate them using AI. For more information, see Create custom widgets.
-
- (Optional) Refine widget data: For certain widgets you can refine the displayed data as follows:
- For agent-related widgets: You can apply an endpoint scope to refine the displayed data to only show results from specific endpoint groups. Select the menu on the top right corner of the widget, select Groups, and select one or more endpoint groups.
- For case-related widgets: You can refine the displayed data to only show results from cases that match a case starring configuration. A purple star indicates that the widget is displaying only starred cases. For more information, see <Case starring>.
Configure advanced interactivity
If your dashboard contains custom XQL widgets with defined parameters, you can add interactive elements to enhance your dashboard:
- To add dashboard filters: Follow the steps in Configure Global Filters.
- To add drilldown actions: Follow the steps in Configure Drilldowns.
Finalize the layout
- Name your dashboard: Enter a unique, descriptive name in the title field.
- (Optional) Add static text: Click Static Elements to add headers, titles, or free text blocks.
- Arrange the layout:
- Use the default Fit to screen layout, or select a specific screen or monitor size.
- In the Settings menu, arrange the widgets manually using the grid or select Auto arrange layout.
The carousel viewing format is no longer supported.
Save and optionally define report settings
- Open save settings: Click the Save button in the dashboard builder header.
- Add a description: Provide a detailed description explaining the purpose of the dashboard to help other users identify its use case.
- (Optional) Save as a report template: Click Save as report to create a report template based on the dashboard. You can also configure automated distribution settings, including email recipients, Slack notifications, delivery scheduling, and CSV data attachments.
- Configure timeframe: Select the timeframe for the widget data.
-
Configure automated distribution and scheduling settings: including email recipients, Slack notifications, delivery, and scheduling.
Note: To send reports to Slack, Slack must be configured as an external application. For more information, see Integrate Slack for outbound notifications
-
Configure CSV data attachments: Select Attach CSV to include raw data from XQL widgets.
From the menu, select one or more of your custom widgets to attach to the report. The CSV files of the widgets are attached to the report along with the report PDF. Depending on how you selected to send the report, the CSV file is attached as follows:
- Email: Sent as separate attachments for each widget. The total size of the attachment in the email cannot exceed 20 MB.
- Slack: Sent within a ZIP file that includes the PDF file.
- Save the dashboard: Click Save to commit all changes.
Share the dashboard
By default, all new custom dashboards are Restricted and visible only to you (the Owner). Once created, you can share the dashboard with specific users or groups, or make it Public to all authorized users.
Note: Sharing of custom dashboards must be enabled by your administrator. For more information, see Manage access to objects.
How to share a dashboard
- Open share settings: In the Dashboard Manager find the dashboard name and select Share from the right-click menu.
- Update your visibility settings:
- To share globally: Under General access, change the setting to Public so all authorized users in your organization can view it.
- To share selectively: Keep the status as Restricted, add specific users or groups, and assign them a role (Viewer or Editor).
- Save your changes: Click Share to apply your settings.